Embed Size (px)
Citation preview
RAJASTHAN AGRICULTURAL
COMPETITIVENESS PROJECT
Detailed Project Report on
Pickles and Chutney Processing
Prepared by:
AGRI BUSINESS PROMOTION FACILITY
Rajasthan Agricultural Competitiveness Project 1
Table of Contents
List of Figures 2
List of Table 3
Chapter 1-Introduction of Pickles and Chutney 4
Chapter 2- Overview of the Pickle & chutney Industry 11
Chapter 3-Technical Process Flow 14
Chapter 4- Technology Options Available 20
Rajasthan Agricultural Competitiveness Project 2
Figure 1: Pickle ............................................................................................................................... 4 Figure 2: Chutney............................................................................................................................ 5 Figure 3 Flow Chart of Pickling Process from Fruits & Vegetables ............................................... 15 Figure 4 Flow Chart of Chutneys Process from Fruits & Vegetables ............................................ 16 Figure 5 Raw Mango and lemon Cutting Machine ........................................................................ 16 Figure 6 Vegetable Cutter and chilly cutter ................................................................................... 17 Figure 7 Pickle Mixing Machine and capping machine.................................................................. 17 Figure 8 Crusher and pulper ......................................................................................................... 17 Figure 9 jacketed Kettle and Vacuum filling machine .................................................................... 17 Figure 10 Crown Corking Machine ................................................................................................ 18
List of Figures
Rajasthan Agricultural Competitiveness Project 3
Table 1: Details of vegetable production ......................................................................................... 7 Table 2: Vegetable Area, production, yield in past 3 years ............................................................ 7 Table 3: Key fruits of Rajasthan ...................................................................................................... 8 Table 4: Fruits, area, production and yield in past 3 years .............................................................. 8 Table 5 Production profile of Bansur cluster ................................................................................... 9 Table 6 Production profile of Bonli cluster ....................................................................................... 9 Table 7 Production profile of Gudha cluster .................................................................................. 10 Table 8: Assumptions for Captive Model ....................................................................................... 20 Table 9: Project Cost Summary .................................................................................................... 20 Table 10: Means of Finance Summary ......................................................................................... 21 Table 11: Civil Cost Summary ....................................................................................................... 21 Table 12: Utilities and other project components .......................................................................... 21 Table 13: Plant and Machinery ..................................................................................................... 22 Table 14 Assumptions ................................................................................................................... 23 Table 15: Income Statement ......................................................................................................... 24 Table 16: Balance Sheet ............................................................................................................... 25
List of Table

Rajasthan Agricultural Competitiveness Project 4
Pickle is a food that is made by the process of pickling. Pickling is the process
of preserving (expanding the lifespan) of fruit or vegetable by anaerobic
fermentation in brine or immersion in vinegar. Although the pickling process
expands the lifespan of the food, it affects the texture and taste of the food.
Foods that can be pickled can include fruits, vegetable and even meat.
Pickles typically include raw and whole vegetables/fruits. They may also contain
sugar, honey, herbs and spices such as ginger and cloves. There are some
types of pickles such as sweet pickles that do not include whole fruits or
vegetables. However, these also contain larger pieces of vegetables.
Figure 1: Pickle
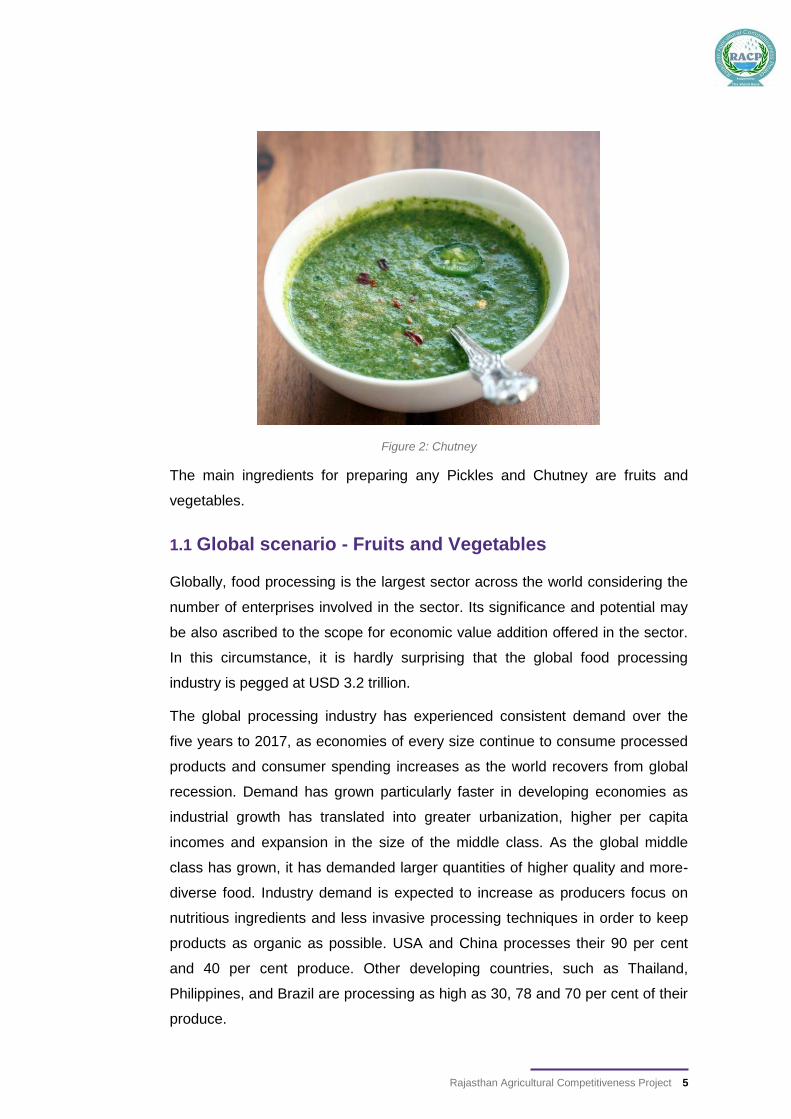
Chutney is a spicy condiment of Indian origin, made of fruits or vegetables with
vinegar, spices, and sugar. In India, you can get chutneys with almost every
meal. Their taste can range from sweet to sour to spicy or a combination of any
of these. Meanwhile, their texture may be chunky or thin. Chutneys may include
a wide range of ingredients including fruits, vegetables and spices. The
ingredients (i.e., fruits and vegetable) in a chutney are typically cut into small
pieces, and the mixture is cooked for a long time.
Chapter 1-Introduction of
Pickles and Chutney
Rajasthan Agricultural Competitiveness Project 5
Figure 2: Chutney
The main ingredients for preparing any Pickles and Chutney are fruits and
vegetables.
1.1 Global scenario - Fruits and Vegetables
Globally, food processing is the largest sector across the world considering the
number of enterprises involved in the sector. Its significance and potential may
be also ascribed to the scope for economic value addition offered in the sector.
In this circumstance, it is hardly surprising that the global food processing
industry is pegged at USD 3.2 trillion.
The global processing industry has experienced consistent demand over the
five years to 2017, as economies of every size continue to consume processed
products and consumer spending increases as the world recovers from global
recession. Demand has grown particularly faster in developing economies as
industrial growth has translated into greater urbanization, higher per capita
incomes and expansion in the size of the middle class. As the global middle
class has grown, it has demanded larger quantities of higher quality and more-
diverse food. Industry demand is expected to increase as producers focus on
nutritious ingredients and less invasive processing techniques in order to keep
products as organic as possible. USA and China processes their 90 per cent
and 40 per cent produce. Other developing countries, such as Thailand,
Philippines, and Brazil are processing as high as 30, 78 and 70 per cent of their
produce.
Rajasthan Agricultural Competitiveness Project 6
1.2 Indian Scenario - Fruits and Vegetables
1India's diverse climate ensures availability of all varieties of fresh fruits &
vegetables. It ranks second in fruits and vegetables production in the world,
after China. As per National Horticulture Database published by National
Horticulture Board, during 2015-16, India produced 90.2 million metric tonnes of
fruits and 169.1 million metric tonnes of vegetables. The area under cultivation
of fruits stood at 6.3 million hectares while vegetables were cultivated at 10.1
million hectares.
Though India's share in the global market is still nearly 1% only, there is
increasing acceptance of horticulture produce from the country. This has
occurred due to concurrent developments in the areas of state-of-the-art cold
chain infrastructure and quality assurance measures. Apart from large
investment pumped in by the private sector, public sector has also taken
initiatives and with APEDA's assistance, several centres for Perishable produce
and integrated post-harvest handling facilities have been set up in the country.
Capacity building initiatives at the farmers, processors and exporters' levels has
also contributed towards this effort.
1.3 Rajasthan Scenario – Fruits and Vegetables
Rajasthan harbours a variety of fruits and vegetables and this section details
the diversity in the production profile of Rajasthan elaborating on the districts
and their production.
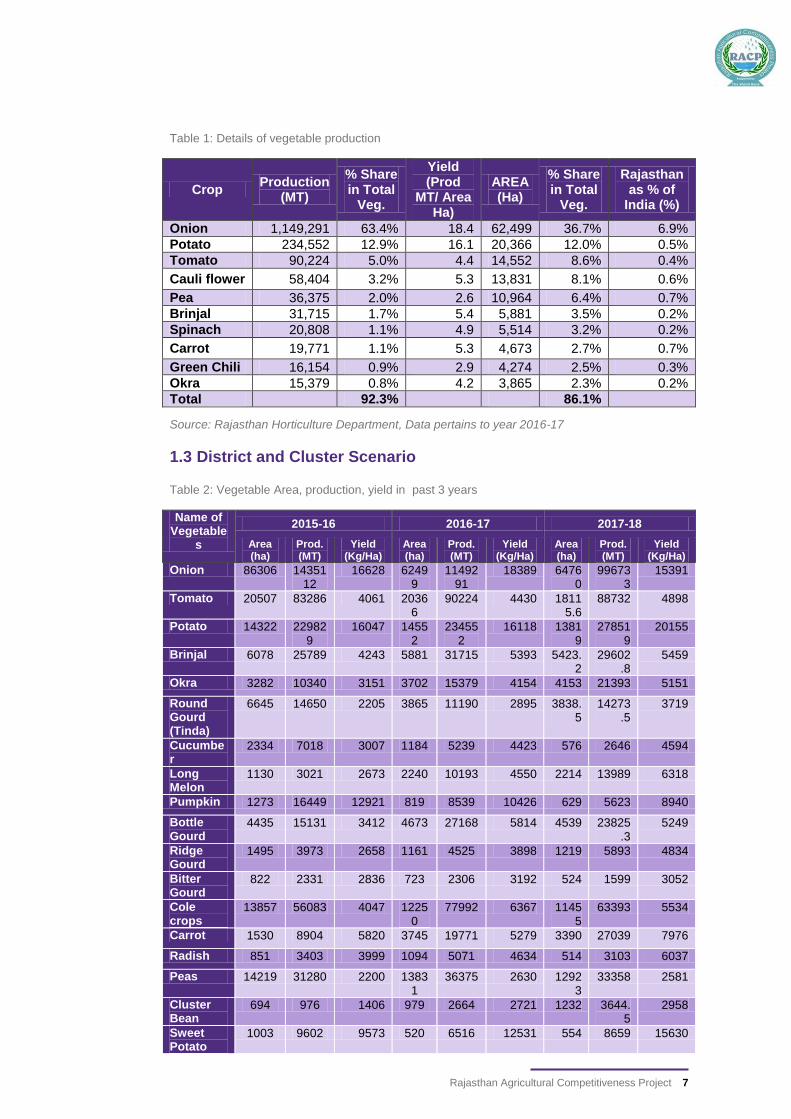
The table below captures the analysis for key crops of Rajasthan and highlights
that Onion followed by Potato and Tomato hold maximum potential for creating
a market as they account for 63.4%, 12.9% and 5% of the total vegetable
production of the state.
1 http://apeda.gov.in
Rajasthan Agricultural Competitiveness Project 7
Table 1: Details of vegetable production
Crop Production
(MT)
% Share in Total
Veg.
Yield (Prod
MT/ Area Ha)
AREA (Ha)
% Share in Total
Veg.
Rajasthan as % of
India (%)
Onion 1,149,291 63.4% 18.4 62,499 36.7% 6.9%
Potato 234,552 12.9% 16.1 20,366 12.0% 0.5%
Tomato 90,224 5.0% 4.4 14,552 8.6% 0.4%
Cauli flower 58,404 3.2% 5.3 13,831 8.1% 0.6%
Pea 36,375 2.0% 2.6 10,964 6.4% 0.7%
Brinjal 31,715 1.7% 5.4 5,881 3.5% 0.2%
Spinach 20,808 1.1% 4.9 5,514 3.2% 0.2%
Carrot 19,771 1.1% 5.3 4,673 2.7% 0.7%
Green Chili 16,154 0.9% 2.9 4,274 2.5% 0.3%
Okra 15,379 0.8% 4.2 3,865 2.3% 0.2%
Total
92.3%
86.1%
Source: Rajasthan Horticulture Department, Data pertains to year 2016-17
1.3 District and Cluster Scenario
Table 2: Vegetable Area, production, yield in past 3 years
Name of Vegetable
s
2015-16 2016-17 2017-18
Area (ha)
Prod. (MT)
Yield (Kg/Ha)
Area (ha)
Prod. (MT)
Yield (Kg/Ha)
Area (ha)
Prod. (MT)
Yield (Kg/Ha)
Onion 86306 1435112
16628 62499
1149291
18389 64760
996733
15391
Tomato 20507 83286 4061 20366
90224 4430 18115.6
88732 4898
Potato 14322 229829
16047 14552
234552
16118 13819
278519
20155
Brinjal 6078 25789 4243 5881 31715 5393 5423.2
29602.8
5459
Okra 3282 10340 3151 3702 15379 4154 4153 21393 5151
Round Gourd (Tinda)
6645 14650 2205 3865 11190 2895 3838.5
14273.5
3719
Cucumber
2334 7018 3007 1184 5239 4423 576 2646 4594
Long Melon
1130 3021 2673 2240 10193 4550 2214 13989 6318
Pumpkin 1273 16449 12921 819 8539 10426 629 5623 8940
Bottle Gourd
4435 15131 3412 4673 27168 5814 4539 23825.3
5249
Ridge Gourd
1495 3973 2658 1161 4525 3898 1219 5893 4834
Bitter Gourd
822 2331 2836 723 2306 3192 524 1599 3052
Cole crops
13857 56083 4047 12250
77992 6367 11455
63393 5534
Carrot 1530 8904 5820 3745 19771 5279 3390 27039 7976
Radish 851 3403 3999 1094 5071 4634 514 3103 6037
Peas 14219 31280 2200 13831
36375 2630 12923
33358 2581
Cluster Bean
694 976 1406 979 2664 2721 1232 3644.5
2958
Sweet Potato
1003 9602 9573 520 6516 12531 554 8659 15630
Rajasthan Agricultural Competitiveness Project 8
Name of Vegetable
s
2015-16 2016-17 2017-18
Area (ha)
Prod. (MT)
Yield (Kg/Ha)
Area (ha)
Prod. (MT)
Yield (Kg/Ha)
Area (ha)
Prod. (MT)
Yield (Kg/Ha)
Spinach 2909 15974 5491 4274 20808 4869 2515.43
15814 6287
Colocasia 378 1346 3561 413 2836 6867 317 2522 7956
Water Melon
2929.94
27564 9408 2518 23607 9374 2013 19504 9689
Musk Melon
981.78
6661.5
6785 1186 5679 4789 1001.1
6095 6088
Others 6663 12234 1836 7657 21208 2770 10509
33624 3200
Total 194645
2020957
10383 170132
1812848
10656 166234
1699584
10224
Source: Rajasthan Horticulture Department, Data pertains to year 2017-18
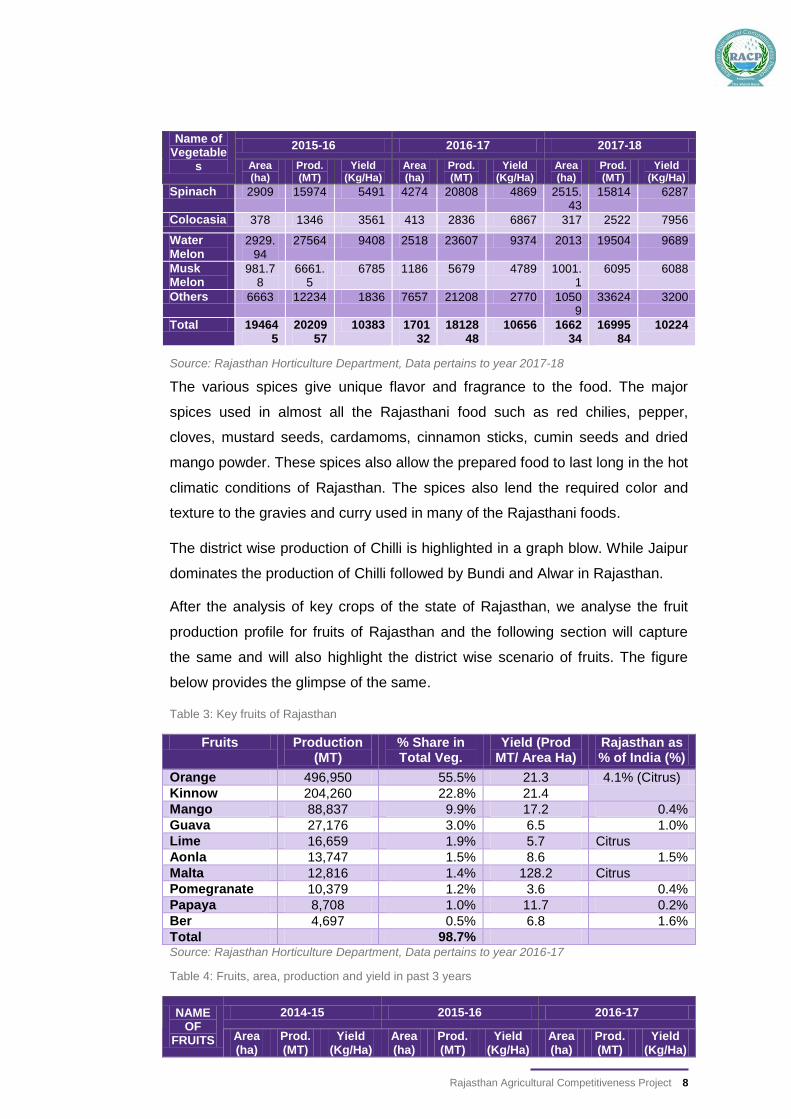
The various spices give unique flavor and fragrance to the food. The major
spices used in almost all the Rajasthani food such as red chilies, pepper,
cloves, mustard seeds, cardamoms, cinnamon sticks, cumin seeds and dried
mango powder. These spices also allow the prepared food to last long in the hot
climatic conditions of Rajasthan. The spices also lend the required color and
texture to the gravies and curry used in many of the Rajasthani foods.
The district wise production of Chilli is highlighted in a graph blow. While Jaipur
dominates the production of Chilli followed by Bundi and Alwar in Rajasthan.
After the analysis of key crops of the state of Rajasthan, we analyse the fruit
production profile for fruits of Rajasthan and the following section will capture
the same and will also highlight the district wise scenario of fruits. The figure
below provides the glimpse of the same.
Table 3: Key fruits of Rajasthan
Fruits Production (MT)
% Share in Total Veg.
Yield (Prod MT/ Area Ha)
Rajasthan as % of India (%)
Orange 496,950 55.5% 21.3 4.1% (Citrus)
Kinnow 204,260 22.8% 21.4
Mango 88,837 9.9% 17.2 0.4%
Guava 27,176 3.0% 6.5 1.0%
Lime 16,659 1.9% 5.7 Citrus
Aonla 13,747 1.5% 8.6 1.5%
Malta 12,816 1.4% 128.2 Citrus
Pomegranate 10,379 1.2% 3.6 0.4%
Papaya 8,708 1.0% 11.7 0.2%
Ber 4,697 0.5% 6.8 1.6%
Total 98.7% Source: Rajasthan Horticulture Department, Data pertains to year 2016-17
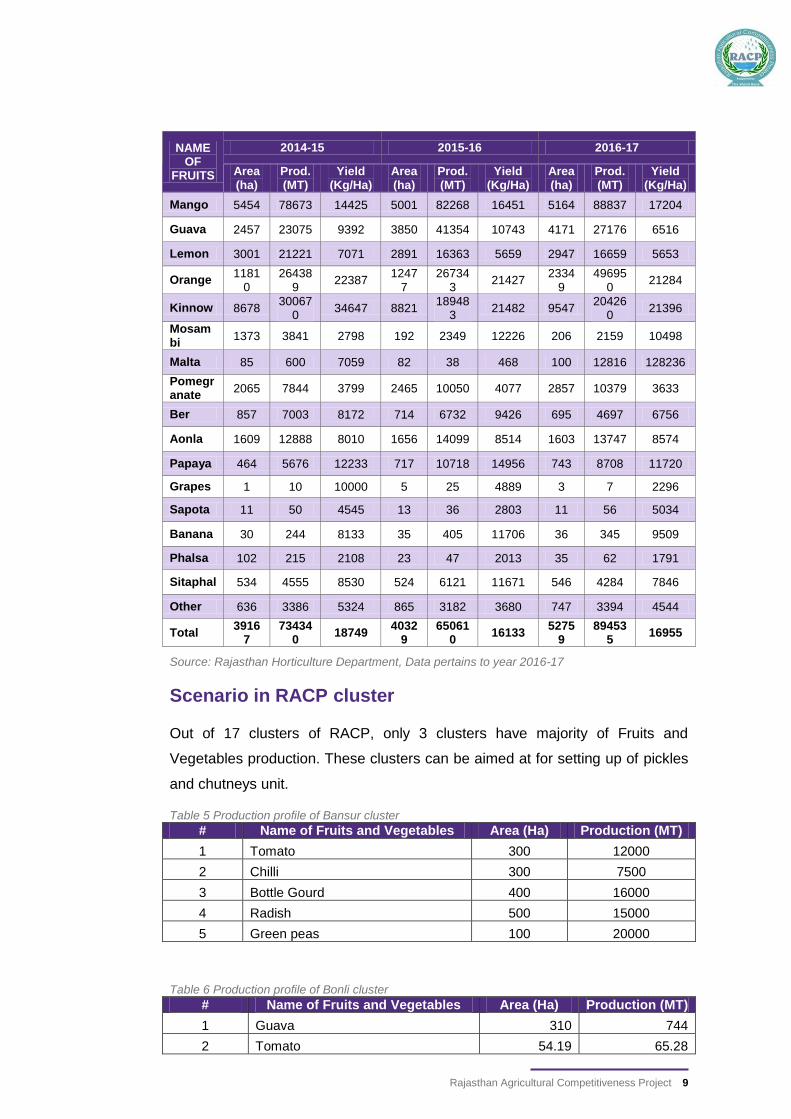
Table 4: Fruits, area, production and yield in past 3 years
NAME OF
FRUITS
2014-15 2015-16 2016-17
Area (ha)
Prod. (MT)
Yield (Kg/Ha)
Area (ha)
Prod. (MT)
Yield (Kg/Ha)
Area (ha)
Prod. (MT)
Yield (Kg/Ha)
Rajasthan Agricultural Competitiveness Project 9
NAME OF
FRUITS
2014-15 2015-16 2016-17
Area (ha)
Prod. (MT)
Yield (Kg/Ha)
Area (ha)
Prod. (MT)
Yield (Kg/Ha)
Area (ha)
Prod. (MT)
Yield (Kg/Ha)
Mango 5454 78673 14425 5001 82268 16451 5164 88837 17204
Guava 2457 23075 9392 3850 41354 10743 4171 27176 6516
Lemon 3001 21221 7071 2891 16363 5659 2947 16659 5653
Orange 1181
0 26438
9 22387
12477
267343
21427 2334
9 49695
0 21284
Kinnow 8678 30067
0 34647 8821
189483
21482 9547 20426
0 21396
Mosambi
1373 3841 2798 192 2349 12226 206 2159 10498
Malta 85 600 7059 82 38 468 100 12816 128236
Pomegranate
2065 7844 3799 2465 10050 4077 2857 10379 3633
Ber 857 7003 8172 714 6732 9426 695 4697 6756
Aonla 1609 12888 8010 1656 14099 8514 1603 13747 8574
Papaya 464 5676 12233 717 10718 14956 743 8708 11720
Grapes 1 10 10000 5 25 4889 3 7 2296
Sapota 11 50 4545 13 36 2803 11 56 5034
Banana 30 244 8133 35 405 11706 36 345 9509
Phalsa 102 215 2108 23 47 2013 35 62 1791
Sitaphal 534 4555 8530 524 6121 11671 546 4284 7846
Other 636 3386 5324 865 3182 3680 747 3394 4544
Total 3916
7 73434
0 18749
40329
650610
16133 5275
9 89453
5 16955
Source: Rajasthan Horticulture Department, Data pertains to year 2016-17
Scenario in RACP cluster
Out of 17 clusters of RACP, only 3 clusters have majority of Fruits and
Vegetables production. These clusters can be aimed at for setting up of pickles
and chutneys unit.
Table 5 Production profile of Bansur cluster
# Name of Fruits and Vegetables Area (Ha) Production (MT)
1 Tomato 300 12000
2 Chilli 300 7500
3 Bottle Gourd 400 16000
4 Radish 500 15000
5 Green peas 100 20000
Table 6 Production profile of Bonli cluster
# Name of Fruits and Vegetables Area (Ha) Production (MT)
1 Guava 310 744
2 Tomato 54.19 65.28
Rajasthan Agricultural Competitiveness Project 10
# Name of Fruits and Vegetables Area (Ha) Production (MT)
3 Onion 54.19 75.26
4 Okra 27.08 14.54
5 Pea 23.69 28.42
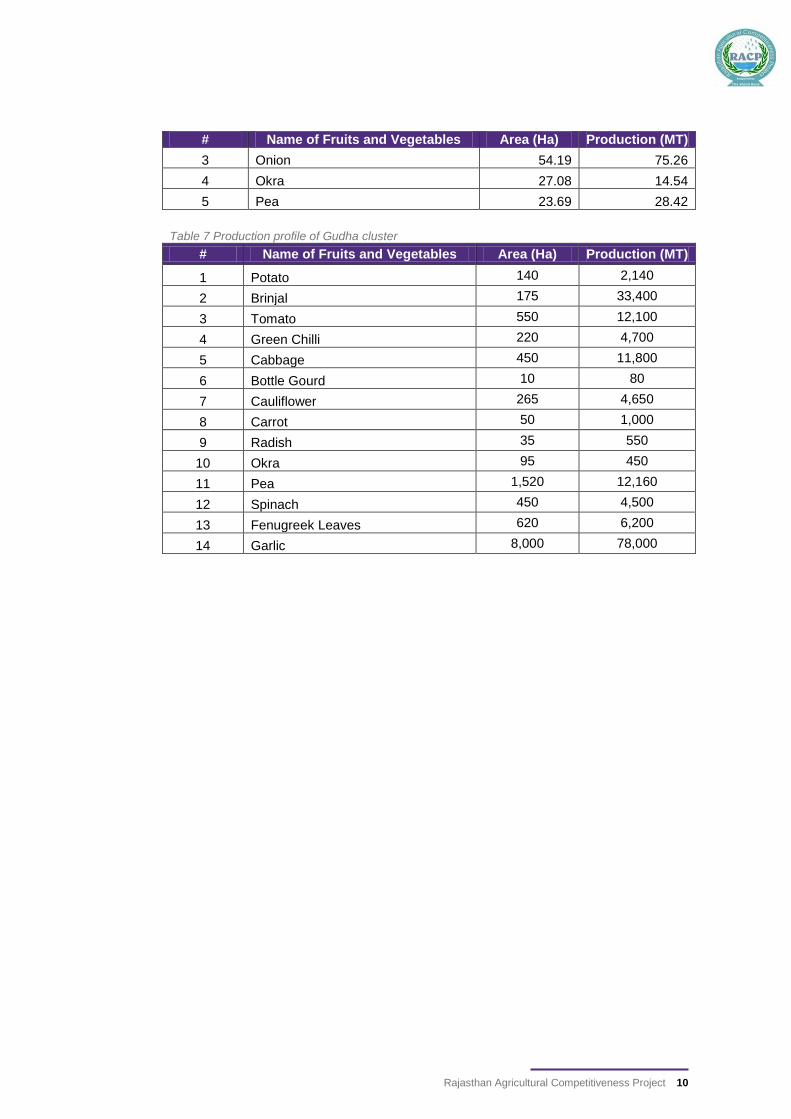
Table 7 Production profile of Gudha cluster
# Name of Fruits and Vegetables Area (Ha) Production (MT)
1 Potato 140 2,140
2 Brinjal 175 33,400
3 Tomato 550 12,100
4 Green Chilli 220 4,700
5 Cabbage 450 11,800
6 Bottle Gourd 10 80
7 Cauliflower 265 4,650
8 Carrot 50 1,000
9 Radish 35 550
10 Okra 95 450
11 Pea 1,520 12,160
12 Spinach 450 4,500
13 Fenugreek Leaves 620 6,200
14 Garlic 8,000 78,000

Rajasthan Agricultural Competitiveness Project 11
2.1 Global scenario
The global pickles market reached a value of US$ 10.3 Billion in 2018. Pickles
are a rich source of essential nutrients like vitamins, iron, calcium and
potassium and possess anti-oxidant properties. They are prepared to preserve
or extend the lifespan of a fruit, vegetable or a mix of both, by either anaerobic
fermentation in brine or immersion in vinegar. They are known for a wide range
of health benefits, such as improving digestion, supplying essential minerals
and vitamins and reducing ulcers. In recent years, the aggressive promotional
activities by the manufacturers have increased the popularity of cross-cultural
cuisine which, in turn, has helped in driving the demand for pickles worldwide.
Market Drivers:
In recent years, non-GMO and organic pickles have gained traction among
health-conscious consumers. These products are made without preservatives
and other synthetic chemicals which can have a negative impact on health.
Moreover, the manufacturers are introducing new flavors as per the local tastes
and preferences of consumers. The leading companies are also offering
convenient and cost-effective packaging options for pickles to facilitate ease of
use and on-the-go consumption. These packaging variants range from glass
jars, PET jars and single-serve packs to stand-up and multi-layered coextruded
pouches to polypropylene injection moulded containers with flexible heat-
sealable and peelable lids. According to IMARC Group, the market is projected
to cross US$ 12.3 Billion by 2024, at a CAGR of 3% during 2019-2024.
Major players of the global pickle market include ADF Foods (India), Del Monte
Foods (U.S.), Mt. Olive Pickle Company (U.S.), Kraft Foods Inc. (U.S.), Reitzel
International (Switzerland), Pinnacle Foods, Inc. (U.S) and Mitoku Company,
Ltd. (Japan) among others.
2.2 Indian Scenario
Pickles & chutney is the traditional specialties product of India and has
gained an important position in the Indian cuisine.
They are eaten along with main course and provide tempting tastes.
Chapter 2- Overview of the Pickle & chutney Industry
Rajasthan Agricultural Competitiveness Project 12
Pickles are prepared from Fruits and Vegetables and they supplement
the food with vitamins and minerals.
There are many types of pickles available in India like Chilly Pickles,
Green Pickles, Lemon Chutney, Mango chutney, Gherkins, Mango
Pickles, Onion Prpd/Prsvd and Tomato chutney etc.
India’s Export of Pickles & chutney was Rs. 250.62 Crores in 2007-08.
The major market for Indian Pickles & chutney are Russia, U.S.A,
Belgium, Netherlands and France
Top 5 Pickle Manufacturing Companies in India
Priya Foods
Mothers Recipe
Rajasthan Agricultural Competitiveness Project 13
MTR FOODS
Cavinkare
Bedekar
Rajasthan Agricultural Competitiveness Project 14
3.1 Processing of Pickles
The preservation of food in common salt is known as pickling. It is one of the most ancient
methods of preserving vegetables. Pickles are good appetizers and add to the palatability of
a meal. Mixed Vegetable pickle ranks first followed by cauliflower, onion, turnip and lime
pickles. The growth of a majority of spoilage organisms is inhibited by brine containing 10-
12 per cent salt. Pickling is the result of fermentation by lactic acid-forming bacteria" which
are generally present in large numbers on the surface of fresh vegetables and fruits. Class I
preservatives improves the taste and flavour and hardness of the tissue of vegetables and
controls fermentation.
3.2 Processing of Chutneys
Good quality chutney should be palatable and appetizing. Mix Vegetables chutney is an
important food product exported from India to many countries. Apple and apricot chutneys
are also very popular in the country. The method of preparation of chutney is similar to that
for jam except that spices, vinegar and salt are added. The fruits/vegetables are peeled,
sliced or grated, or cut into small pieces and cooked in water until they become sufficiently
soft. The quality of chutney depends to a large extent on its cooking which should be done
for a long time at a temperature below the boiling point. To ensure proper thickening,
cooking is done without a lid even though this results in some loss of volatile oils from the
spices. Chopped onion and garlic are added at the start to mellow their strong flavours.
Spices are coarsely powdered before adding. Vinegar extract of spices may be used
instead of whole spices. Spice and vinegar are added just before the final stage of cooking,
because prolonged boiling cause loss of some of the essential oils of spices and of vinegar
by volatilization.
Chapter 3-Technical Process Flow

Rajasthan Agricultural Competitiveness Project 15
Figure 3 Flow Chart of Pickling Process from Fruits & Vegetables
Selection of Fruits & Vegetable
Washing
Size reducation
Brine (10-12 % + glacial acetic + 100 PPM KMS)
Desalting/Freshing
Pickling ( Salt /Vinegar/oil /combination)
Add Preservative (sulphurdioxide 100 PPM)
Packing
Store at ambint Temperature

Rajasthan Agricultural Competitiveness Project 16
Figure 4 Flow Chart of Chutneys Process from Fruits & Vegetables
Figure 5 Raw Mango and lemon Cutting Machine
Selection of Vegetable
Washing
Peeling / Deseeding
Grating /Slicing
Cooking with littel water for making highly soft
Mixing with Spices & salt and Leaving for one hr
Addition of vinegar
Cooking for 2-5 Min
Hot filling in to dry and sterilized bottle
Sealing (air tight )
Storage at ambient temperature
Rajasthan Agricultural Competitiveness Project 17
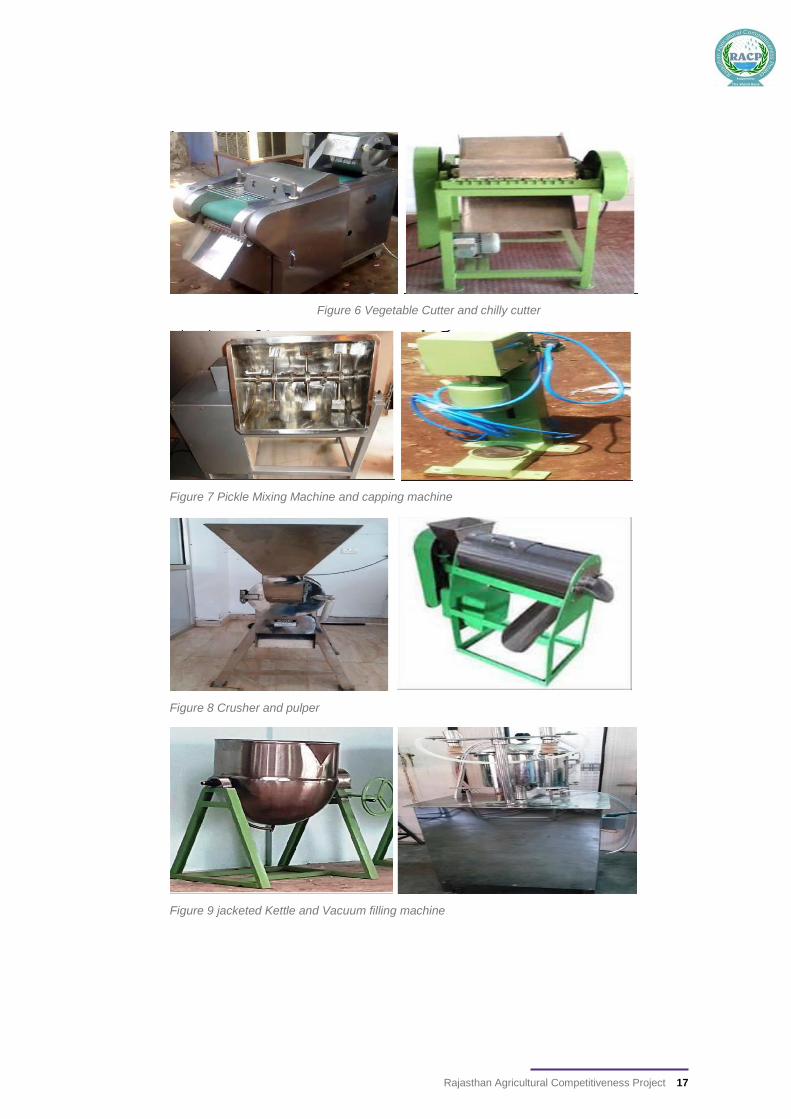
Figure 6 Vegetable Cutter and chilly cutter
Figure 7 Pickle Mixing Machine and capping machine
Figure 8 Crusher and pulper
Figure 9 jacketed Kettle and Vacuum filling machine

Rajasthan Agricultural Competitiveness Project 18
Figure 10 Crown Corking Machine
3.3 Quality Control
Taste samples are made from each batch throughout the manufacturing
process, usually at a rate of once per hour. The tasters check the chips for salt,
seasoning, moisture, colour, and overall flavour. Colour is compared to charts
that show acceptable chip colours.
3.4 Quality Standards
Following specifications under Bureau of Indian Standard related to processing
of such products may be referred:
IS: 4626-1978
IS: 2860-1964
IS: 7254-1974 6.2.
FSSAI License: FSSAI License is issued by the Food Safety and Standards
Authority of India (FSSAI), Ministry of Family Health & Welfare, Government of
India. Application to commence a food business must be made to the FSSAI in
the prescribed format. Based on the application and supporting documents,
FSSAI will accord approval. The Food Safety and Standards (Licensing and
Registration of Food Businesses) Regulations 2011introduced to improve the
hygiene and quality of food has brought about tremendous changes in the food
industry. As per the Act, no person shall commence or carry on any food
business except under a FSSAI license or FSSAI registration. Therefore, any
food manufacturing or processing or packaging or distributing entity is now
required to obtain a FSSAI License or Registration.
Pollution Control: There is no major pollution problem associated with this
project in terms of air and sound pollution except for disposal of waste water
Rajasthan Agricultural Competitiveness Project 19
which would be managed appropriately through recycling facility. However,
entrepreneur should obtain NOC from concerned State Pollution Control Board.
Effluent Disposal: Disposal of any effluent out of the project unit should be
treated with recycling facility or dumped in such a way that these does not
cause hazard in the vicinity of the site.
Energy Conservation: Proper care should be taken in order to use appropriate
amount of fuel and electricity.
Rajasthan Agricultural Competitiveness Project 20
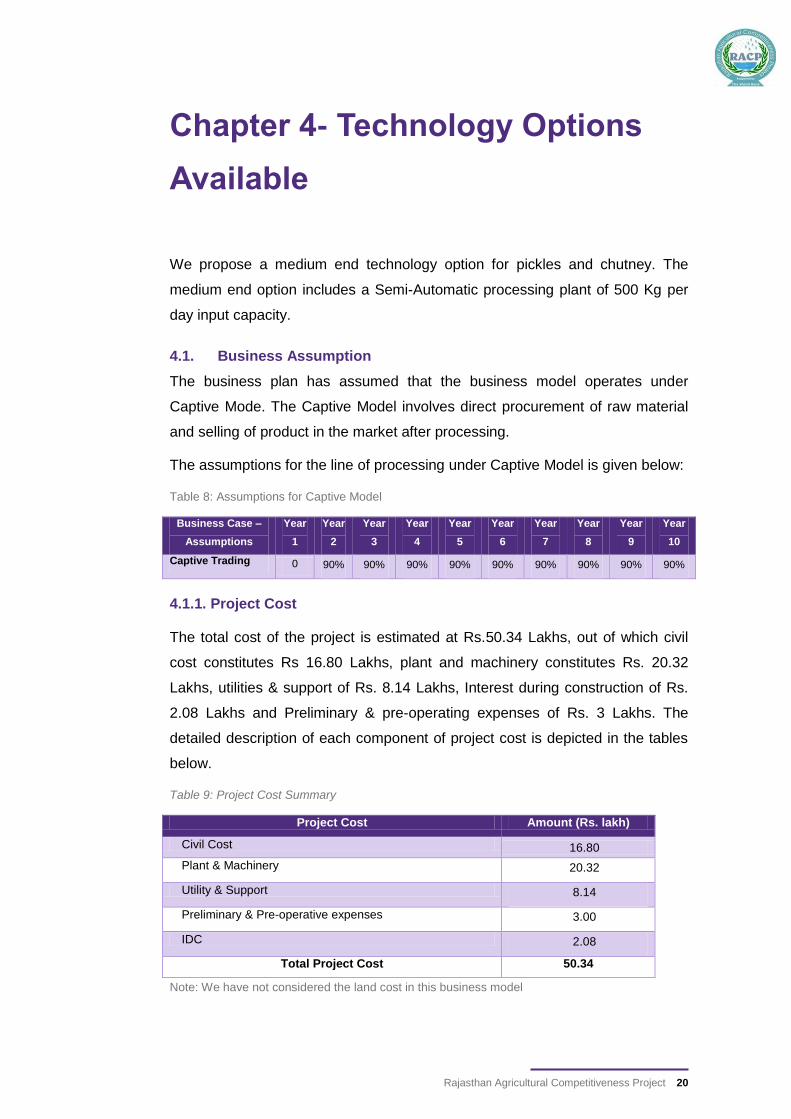
We propose a medium end technology option for pickles and chutney. The
medium end option includes a Semi-Automatic processing plant of 500 Kg per
day input capacity.
4.1. Business Assumption
The business plan has assumed that the business model operates under
Captive Mode. The Captive Model involves direct procurement of raw material
and selling of product in the market after processing.
The assumptions for the line of processing under Captive Model is given below:
Table 8: Assumptions for Captive Model
Business Case –
Assumptions
Year
1
Year
2
Year
3
Year
4
Year
5
Year
6
Year
7
Year
8
Year
9
Year
10
Captive Trading 0 90% 90% 90% 90% 90% 90% 90% 90% 90%
4.1.1. Project Cost
The total cost of the project is estimated at Rs.50.34 Lakhs, out of which civil
cost constitutes Rs 16.80 Lakhs, plant and machinery constitutes Rs. 20.32
Lakhs, utilities & support of Rs. 8.14 Lakhs, Interest during construction of Rs.
2.08 Lakhs and Preliminary & pre-operating expenses of Rs. 3 Lakhs. The
detailed description of each component of project cost is depicted in the tables
below.
Table 9: Project Cost Summary
Project Cost Amount (Rs. lakh)
Civil Cost 16.80
Plant & Machinery 20.32
Utility & Support 8.14
Preliminary & Pre-operative expenses 3.00
IDC 2.08
Total Project Cost 50.34
Note: We have not considered the land cost in this business model
Chapter 4- Technology Options
Available
Rajasthan Agricultural Competitiveness Project 21
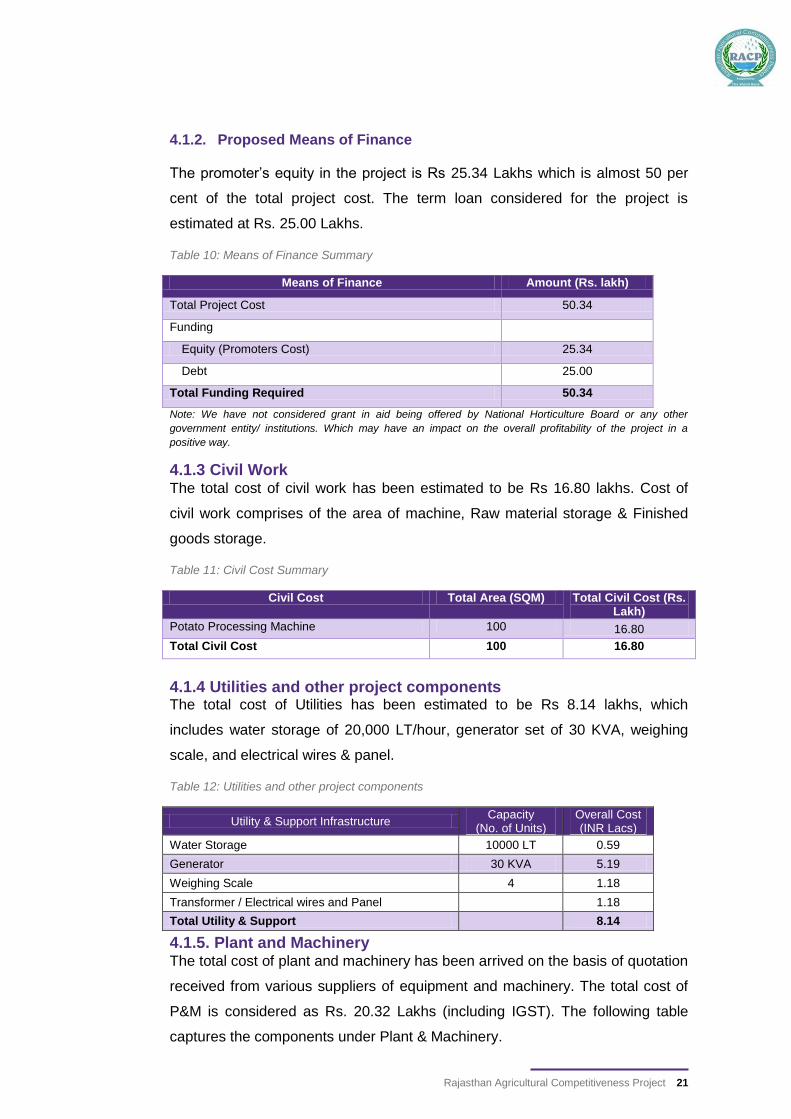
4.1.2. Proposed Means of Finance
The promoter’s equity in the project is Rs 25.34 Lakhs which is almost 50 per
cent of the total project cost. The term loan considered for the project is
estimated at Rs. 25.00 Lakhs.
Table 10: Means of Finance Summary
Means of Finance Amount (Rs. lakh)
Total Project Cost 50.34
Funding
Equity (Promoters Cost) 25.34
Debt 25.00
Total Funding Required 50.34
Note: We have not considered grant in aid being offered by National Horticulture Board or any other
government entity/ institutions. Which may have an impact on the overall profitability of the project in a
positive way.
4.1.3 Civil Work The total cost of civil work has been estimated to be Rs 16.80 lakhs. Cost of
civil work comprises of the area of machine, Raw material storage & Finished
goods storage.
Table 11: Civil Cost Summary
Civil Cost Total Area (SQM) Total Civil Cost (Rs. Lakh)
Potato Processing Machine 100 16.80
Total Civil Cost 100 16.80
4.1.4 Utilities and other project components The total cost of Utilities has been estimated to be Rs 8.14 lakhs, which
includes water storage of 20,000 LT/hour, generator set of 30 KVA, weighing
scale, and electrical wires & panel.
Table 12: Utilities and other project components
Utility & Support Infrastructure Capacity
(No. of Units) Overall Cost (INR Lacs)
Water Storage 10000 LT 0.59
Generator 30 KVA 5.19
Weighing Scale 4 1.18
Transformer / Electrical wires and Panel 1.18
Total Utility & Support
8.14
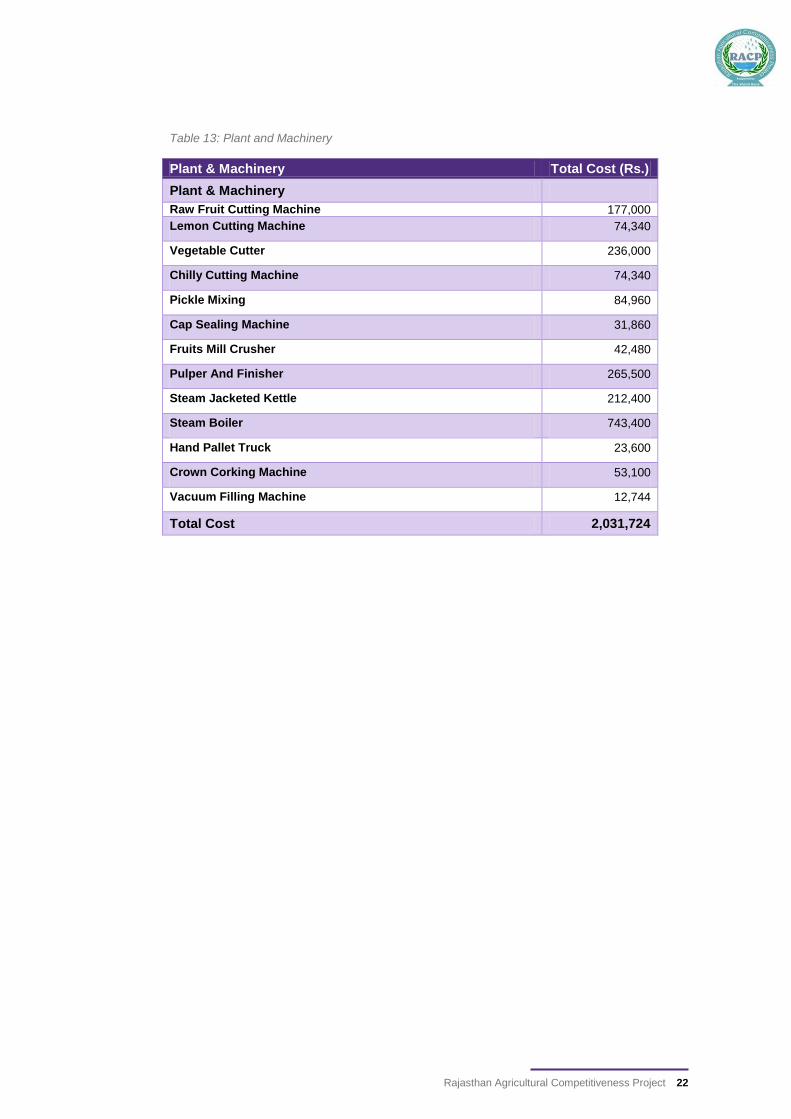
4.1.5. Plant and Machinery The total cost of plant and machinery has been arrived on the basis of quotation
received from various suppliers of equipment and machinery. The total cost of
P&M is considered as Rs. 20.32 Lakhs (including IGST). The following table
captures the components under Plant & Machinery.
Rajasthan Agricultural Competitiveness Project 22
Table 13: Plant and Machinery
Plant & Machinery Total Cost (Rs.)
Plant & Machinery
Raw Fruit Cutting Machine 177,000
Lemon Cutting Machine 74,340
Vegetable Cutter 236,000
Chilly Cutting Machine 74,340
Pickle Mixing 84,960
Cap Sealing Machine 31,860
Fruits Mill Crusher 42,480
Pulper And Finisher 265,500
Steam Jacketed Kettle 212,400
Steam Boiler 743,400
Hand Pallet Truck 23,600
Crown Corking Machine 53,100
Vacuum Filling Machine 12,744
Total Cost 2,031,724
Rajasthan Agricultural Competitiveness Project 23
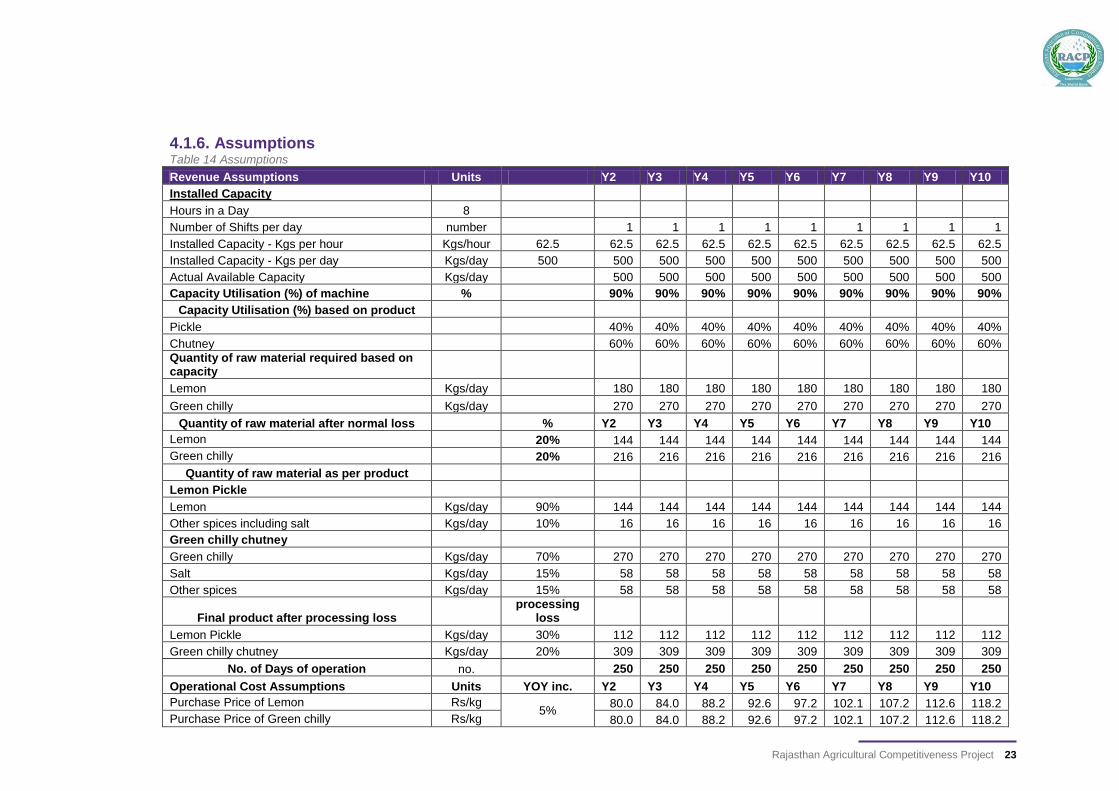
4.1.6. Assumptions Table 14 Assumptions
Revenue Assumptions Units Y2 Y3 Y4 Y5 Y6 Y7 Y8 Y9 Y10
Installed Capacity
Hours in a Day 8
Number of Shifts per day number 1 1 1 1 1 1 1 1 1
Installed Capacity - Kgs per hour Kgs/hour 62.5 62.5 62.5 62.5 62.5 62.5 62.5 62.5 62.5 62.5
Installed Capacity - Kgs per day Kgs/day 500 500 500 500 500 500 500 500 500 500
Actual Available Capacity Kgs/day 500 500 500 500 500 500 500 500 500
Capacity Utilisation (%) of machine % 90% 90% 90% 90% 90% 90% 90% 90% 90%
Capacity Utilisation (%) based on product
Pickle 40% 40% 40% 40% 40% 40% 40% 40% 40%
Chutney 60% 60% 60% 60% 60% 60% 60% 60% 60%
Quantity of raw material required based on capacity
Lemon Kgs/day 180 180 180 180 180 180 180 180 180
Green chilly Kgs/day 270 270 270 270 270 270 270 270 270
Quantity of raw material after normal loss % Y2 Y3 Y4 Y5 Y6 Y7 Y8 Y9 Y10
Lemon 20% 144 144 144 144 144 144 144 144 144
Green chilly 20% 216 216 216 216 216 216 216 216 216
Quantity of raw material as per product
Lemon Pickle
Lemon Kgs/day 90% 144 144 144 144 144 144 144 144 144
Other spices including salt Kgs/day 10% 16 16 16 16 16 16 16 16 16
Green chilly chutney
Green chilly Kgs/day 70% 270 270 270 270 270 270 270 270 270
Salt Kgs/day 15% 58 58 58 58 58 58 58 58 58
Other spices Kgs/day 15% 58 58 58 58 58 58 58 58 58
Final product after processing loss
processing loss
Lemon Pickle Kgs/day 30% 112 112 112 112 112 112 112 112 112
Green chilly chutney Kgs/day 20% 309 309 309 309 309 309 309 309 309
No. of Days of operation no. 250 250 250 250 250 250 250 250 250
Operational Cost Assumptions Units YOY inc. Y2 Y3 Y4 Y5 Y6 Y7 Y8 Y9 Y10
Purchase Price of Lemon Rs/kg 5%
80.0 84.0 88.2 92.6 97.2 102.1 107.2 112.6 118.2
Purchase Price of Green chilly Rs/kg 80.0 84.0 88.2 92.6 97.2 102.1 107.2 112.6 118.2

Rajasthan Agricultural Competitiveness Project 24
Revenue Assumptions Units Y2 Y3 Y4 Y5 Y6 Y7 Y8 Y9 Y10
Purchase Price of Salt Rs/kg 10.0 10.5 11.0 11.6 12.2 12.8 13.4 14.1 14.8
Purchase Price of other spices Rs/kg 100.0 105.0 110.3 115.8 121.6 127.6 134.0 140.7 147.7
Selling Price Assumptions Units YOY inc. Y2 Y3 Y4 Y5 Y6 Y7 Y8 Y9 Y10
Pickle (Lemon) Rs/kg 5%
150.00
157.50
165.38
173.64
182.33
191.44
201.01
211.07
221.62
Chutney (Green chilly) Rs/kg 200.0
0 210.0
0 220.5
0 231.5
3 243.1
0 255.2
6 268.0
2 281.4
2 295.4
9
4.1.7 Income Statement The below mentioned is the income statement for low end processing line:
Table 15: Income Statement
Particulars (Amount Rs. Lakh) Year 2 Year 3 Year 4 Year 5 Year 6 Year 7 Year 8 Year 9 Year 10
Lemon Pickle 42.00 44.10 46.31 48.62 51.05 53.60 56.28 59.10 62.05
Green chilly chutney 154.29 162.00 170.10 178.61 187.54 196.91 206.76 217.10 227.95
Total Income 196.29 206.10 216.41 227.23 238.59 250.52 263.04 276.19 290.00
Raw Material
Lemon 28.80 30.24 31.75 33.34 35.01 36.76 38.59 40.52 42.55
Green chilly 54.00 56.70 59.54 62.51 65.64 68.92 72.37 75.98 79.78
Salt 1.45 1.52 1.59 1.67 1.76 1.85 1.94 2.04 2.14
Other spices 18.46 19.39 20.36 21.37 22.44 23.57 24.74 25.98 27.28
Power 4.78 5.02 5.27 5.54 5.81 6.11 6.41 6.73 7.07
Packing Cost 10.51 11.04 11.59 12.17 12.78 13.42 14.09 14.79 15.53
Water 0.14 0.15 0.15 0.16 0.17 0.18 0.19 0.20 0.21
Total Direct Expenses 118.15 124.06 130.26 136.77 143.61 150.79 158.33 166.25 174.56
Gross Profit 78.14 82.04 86.15 90.45 94.98 99.72 104.71 109.95 115.44
Manpower 10.32 10.84 11.38 11.95 12.54 13.17 13.83 14.52 15.25
Repairs & Maintenance 2.26 2.38 2.49 2.62 2.75 2.89 3.03 3.18 3.34
Insurance 0.56 0.58 0.61 0.64 0.68 0.71 0.75 0.78 0.82
Admin Expenses 6.00 6.30 6.62 6.95 7.29 7.66 8.04 8.44 8.86

Rajasthan Agricultural Competitiveness Project 25
Particulars (Amount Rs. Lakh) Year 2 Year 3 Year 4 Year 5 Year 6 Year 7 Year 8 Year 9 Year 10
Transportation Expenses 0.93 0.78 0.82 0.86 0.91 0.95 1.00 1.05 1.10
Selling & Distribution Expenses 9.81 10.82 11.36 12.53 13.15 14.50 15.23 16.79 17.63
Total In-Direct Expenses 29.88 31.70 33.29 35.55 37.32 39.88 41.87 44.77 47.01
EBITDA 48.26 50.34 52.86 54.91 57.65 59.84 62.84 65.18 68.44
Depreciation for Civil Works 1.20 1.56 1.40 1.26 1.14 1.02 0.92 0.83 0.75
Depreciation on P&M 2.18 2.72 2.31 1.97 1.67 1.42 1.21 1.03 0.87
Depreciation on Others Components 0.58 0.90 0.79 0.70 0.62 0.54 0.48 0.42 0.25
Others (Amortization - IDC, Pre-ops, Contingency) 1.02 1.02 1.02 1.02 1.02 - - - -
Sub-Total 4.97 6.20 5.53 4.94 4.44 2.99 2.61 2.28 1.87
EBIT 43.28 44.15 47.33 49.96 53.21 56.86 60.23 62.90 66.57
Interest on Term Loan 2.26 1.94 1.59 1.20 0.78 0.31
Interest on Working Capital - Normal 3.17 4.71 4.16 4.37 4.58 4.81 5.05 5.31 5.57
PBT 37.85 37.49 41.59 44.39 47.85 51.73 55.18 57.60 61.00
Tax 1.77 6.12 10.60 11.44 12.48 13.64 14.68 15.40 16.42
PAT 36.09 31.37 30.99 32.95 35.37 38.09 40.50 42.19 44.57
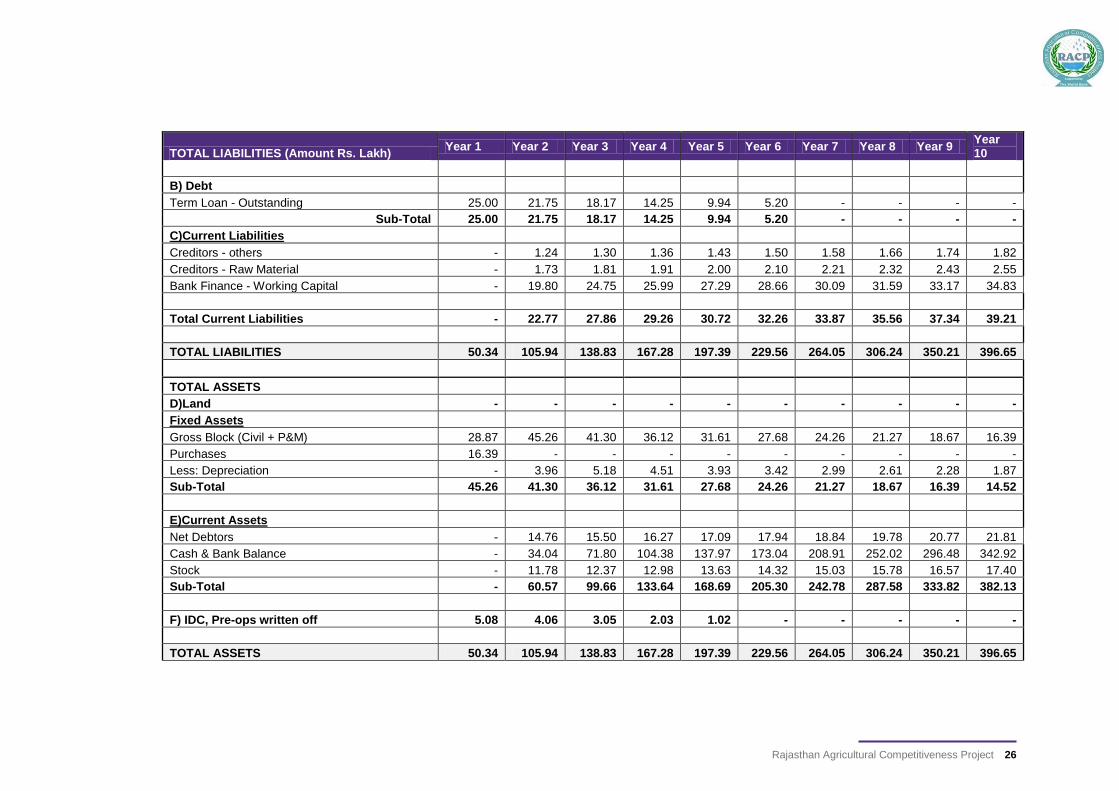
4.1.8. Balance Sheet The below mentioned is the balance sheet statement for low end processing line of potatoes:
Table 16: Balance Sheet
TOTAL LIABILITIES (Amount Rs. Lakh) Year 1 Year 2 Year 3 Year 4 Year 5 Year 6 Year 7 Year 8 Year 9
Year 10
A) Promoters Funds
Capital Contribution 25.34 25.34 25.34 25.34 25.34 25.34 25.34 25.34 25.34 25.34
PAT - 36.09 31.37 30.99 32.95 35.37 38.09 40.50 42.19 44.57
PAT after appropriations - 36.09 67.45 98.44 131.39 166.76 204.85 245.34 287.54 332.11
Sub-Total 25.34 61.42 92.79 123.78 156.73 192.10 230.18 270.68 312.87 357.45
Rajasthan Agricultural Competitiveness Project 26
TOTAL LIABILITIES (Amount Rs. Lakh) Year 1 Year 2 Year 3 Year 4 Year 5 Year 6 Year 7 Year 8 Year 9
Year 10
B) Debt Term Loan - Outstanding 25.00 21.75 18.17 14.25 9.94 5.20 - - - -
Sub-Total 25.00 21.75 18.17 14.25 9.94 5.20 - - - -
C)Current Liabilities
Creditors - others - 1.24 1.30 1.36 1.43 1.50 1.58 1.66 1.74 1.82
Creditors - Raw Material - 1.73 1.81 1.91 2.00 2.10 2.21 2.32 2.43 2.55
Bank Finance - Working Capital - 19.80 24.75 25.99 27.29 28.66 30.09 31.59 33.17 34.83
Total Current Liabilities - 22.77 27.86 29.26 30.72 32.26 33.87 35.56 37.34 39.21
TOTAL LIABILITIES 50.34 105.94 138.83 167.28 197.39 229.56 264.05 306.24 350.21 396.65
TOTAL ASSETS D)Land - - - - - - - - - -
Fixed Assets
Gross Block (Civil + P&M) 28.87 45.26 41.30 36.12 31.61 27.68 24.26 21.27 18.67 16.39
Purchases 16.39 - - - - - - - - -
Less: Depreciation - 3.96 5.18 4.51 3.93 3.42 2.99 2.61 2.28 1.87
Sub-Total 45.26 41.30 36.12 31.61 27.68 24.26 21.27 18.67 16.39 14.52
E)Current Assets
Net Debtors - 14.76 15.50 16.27 17.09 17.94 18.84 19.78 20.77 21.81
Cash & Bank Balance - 34.04 71.80 104.38 137.97 173.04 208.91 252.02 296.48 342.92
Stock - 11.78 12.37 12.98 13.63 14.32 15.03 15.78 16.57 17.40
Sub-Total - 60.57 99.66 133.64 168.69 205.30 242.78 287.58 333.82 382.13
F) IDC, Pre-ops written off 5.08 4.06 3.05 2.03 1.02 - - - - -
TOTAL ASSETS 50.34 105.94 138.83 167.28 197.39 229.56 264.05 306.24 350.21 396.65

© 2019 Grant Thornton India LLP. All rights reserved.
“Grant Thornton in India” means Grant Thornton India LLP, a member firm within Grant Thornton International Ltd, and those legal entities which are its related parties as defined by the Companies Act, 2013.
Grant Thornton India LLP is registered with limited liability with identity number AAA-7677 and has its registered office at L-41 Connaught Circus, New Delhi, 110001.
References to Grant Thornton are to Grant Thornton International Ltd (Grant Thornton International) or its member firms. Grant Thornton International and the member firms are not a worldwide partnership. Services are delivered independently by the member firms.
www.grantthornton.in