Embed Size (px)
Citation preview
ulster.ac.uk
Cost of Division
A benchmark of performance and expenditure
Detailed Paper
January 2016
ContentsPage No.
Summary and conclusions 4
Introduction and methodology 11
Public Services:
• Policing, prisons and other justice 17
• Education 27
• Health 37
• Community relations 46
• Housing & physical environment 51
• Transport & infrastructure 58
• Leisure 65
• Agriculture 71
• Governance 73
Private Sector – the lost economic opportunity 78
Additional funding to NI 83
2
ulster.ac.uk
Summary and Conclusions
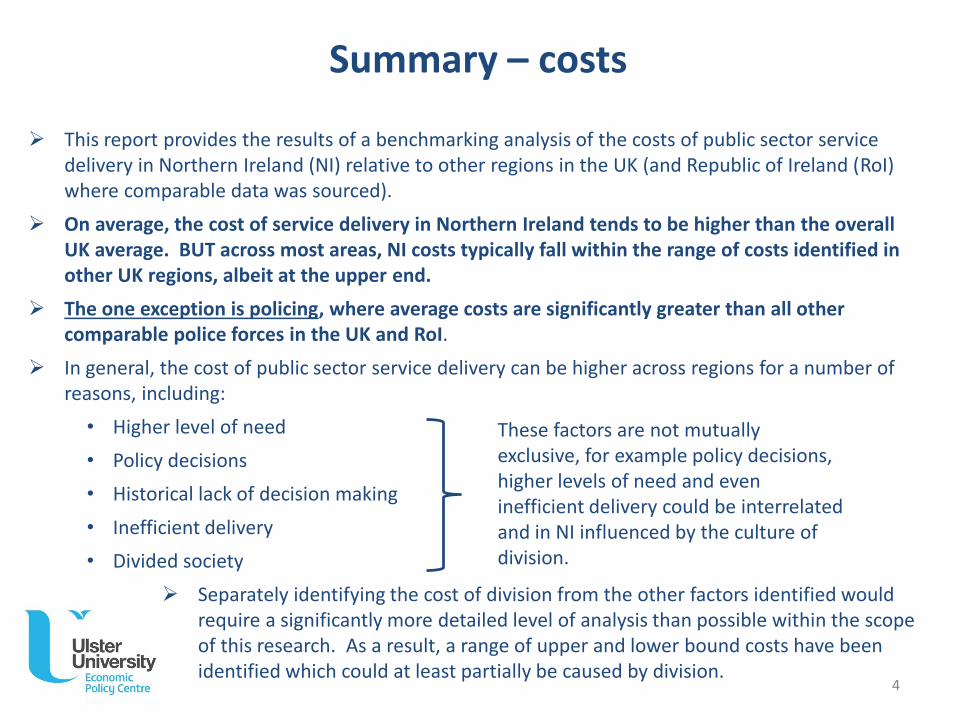
This report provides the results of a benchmarking analysis of the costs of public sector service delivery in Northern Ireland (NI) relative to other regions in the UK (and Republic of Ireland (RoI) where comparable data was sourced).
On average, the cost of service delivery in Northern Ireland tends to be higher than the overall UK average. BUT across most areas, NI costs typically fall within the range of costs identified in other UK regions, albeit at the upper end.
The one exception is policing, where average costs are significantly greater than all other comparable police forces in the UK and RoI.
In general, the cost of public sector service delivery can be higher across regions for a number of reasons, including:
• Higher level of need
• Policy decisions
• Historical lack of decision making
• Inefficient delivery
• Divided society
Separately identifying the cost of division from the other factors identified would require a significantly more detailed level of analysis than possible within the scope of this research. As a result, a range of upper and lower bound costs have been identified which could at least partially be caused by division.
Summary – costs
These factors are not mutually exclusive, for example policy decisions, higher levels of need and even inefficient delivery could be interrelated and in NI influenced by the culture of division.
4
Summary – costs
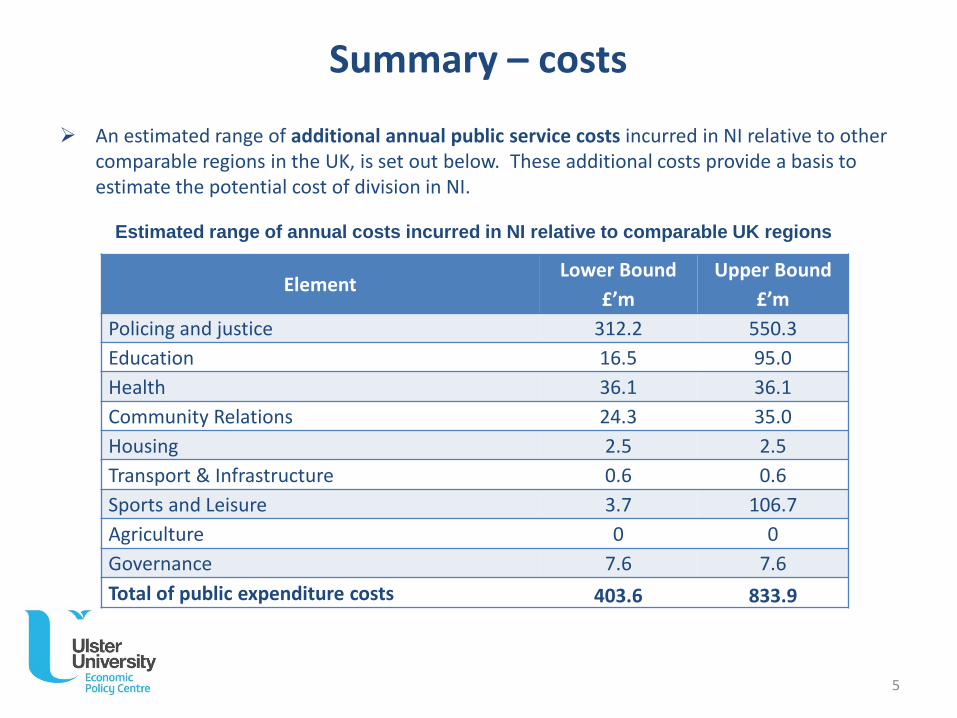
An estimated range of additional annual public service costs incurred in NI relative to other comparable regions in the UK, is set out below. These additional costs provide a basis to estimate the potential cost of division in NI.
ElementLower Bound
£’m
Upper Bound
£’m
Policing and justice 312.2 550.3
Education 16.5 95.0
Health 36.1 36.1
Community Relations 24.3 35.0
Housing 2.5 2.5
Transport & Infrastructure 0.6 0.6
Sports and Leisure 3.7 106.7
Agriculture 0 0
Governance 7.6 7.6
Total of public expenditure costs 403.6 833.9
Estimated range of annual costs incurred in NI relative to comparable UK regions
5
Summary – lost economic opportunity
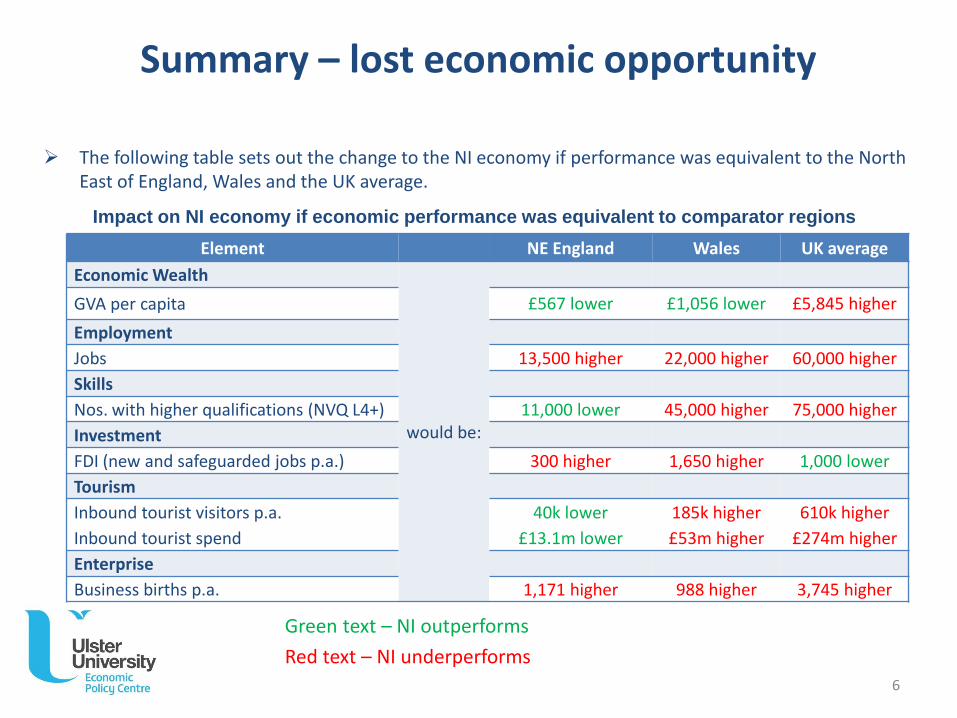
The following table sets out the change to the NI economy if performance was equivalent to the North East of England, Wales and the UK average.
Element NE England Wales UK average
Economic Wealth
would be:
GVA per capita £567 lower £1,056 lower £5,845 higher
Employment
Jobs 13,500 higher 22,000 higher 60,000 higher
Skills
Nos. with higher qualifications (NVQ L4+) 11,000 lower 45,000 higher 75,000 higher
Investment
FDI (new and safeguarded jobs p.a.) 300 higher 1,650 higher 1,000 lower
Tourism
Inbound tourist visitors p.a.
Inbound tourist spend
40k lower
£13.1m lower
185k higher
£53m higher
610k higher
£274m higher
Enterprise
Business births p.a. 1,171 higher 988 higher 3,745 higher
Impact on NI economy if economic performance was equivalent to comparator regions
Green text – NI outperforms
Red text – NI underperforms
6
NI economic performance has been consistently below the UK average for several decades, but performance against the North East of England and Wales across a range of economic indicators is broadly similar. Therefore a number of other factors must also impact economic performance, and these include:
• challenges faced in transitioning to a post-industrialised economy;
• structural factors – such as relative sizes of industrial sectors (agriculture vs professional services), historic infrastructure investment and level of skills attainment;
• run down of ‘traditional’ industry (e.g. mining in Wales and ship building in NI and the North East of England).
The scale of impact of these other factors may differ across regions. For example, lower levels of productivity in Wales could primarily be due to the run down of the mining industry, but in NI the impact of division may be the dominant factor. Only a detailed economic regional comparative analysis could provide more clarity and disentangling the effects with precision may not be possible.
NI also currently performs well in some areas, such as Foreign Direct Investment (FDI). There may have been a significant lost FDI opportunity in the period prior to 1998 and this could still be impacting the private sector in NI, but identifying this historic lost opportunity would be very subjective, given the lack of available data.
Summary – lost economic opportunity
7
This benchmarking analysis identifies a cost range of approximately £400 million to £830 million per annum, which at least in part is potentially caused by the need to provide services in a divided society.
• The most significant cost area is linked to policing and justice, accounting for over half the estimated additional cost.
• This benchmarking analysis identifies areas where division is potentially contributing to a higher cost of service delivery, BUT it is only one of many factors.
• It should NOT be concluded from this research that the additional costs identified represent potential savings which could be achieved. In some instances that may be the case, but in others instances the costs are unavoidable or would require significant investment to ameliorate.
The lost economic opportunity associated with division is also difficult to identify and may be caused by a range of factors. In general, NI is one of the weakest performing regions in the UK but similar to Wales and the North East of England. Therefore from an economic development perspective, the level of need is similar across a number of regions.
Conclusions
8
The UUEPC undertook a review of the 2007 Deloitte research. In addition to a detailed analysis of individual Government Department spend, the report also estimated an upper range cost of £1.5bn associated with division. This was based on comparing NI Government spend as a % of GVA with Welsh Government spend as a % of GVA.
This approach of calculating a % of GVA comparison may not accurately reflect the cost of division for a number of reasons:
• The calculation reflects the size of private sector GVA as much as it reflects the level of Government spending;
• The level of additional spend in NI, compared to other regions, varies significantly from one year to the next. It is unlikely that the cost of division would be so volatile.
Other macro-measures such as a comparison of Government Spend per head was also considered, but the differential between regions can also vary significantly from one year to the next.
Conclusions – 2007 research
9
ulster.ac.uk
Introduction and Methodology
Introduction and Methodology
Terms of Reference
• Review Deloitte approach
• Identify direct costs and duplication of public service provision
• Estimate the lost economic opportunity
Methodology
• Adopt (and amend where appropriate) the Deloitte approach – this included engaging with Government Departments and agencies to source updated cost information. However, this analysis is based on existing research only, primary research was not undertaken as part of this project.
• Duplication of services – identify a potential range of costs associated with the provision of services to both communities by benchmarking expenditure with other UK regions and the Republic of Ireland (RoI).
• Direct costs – identify relevant direct costs incurred as a result of societal division.
• Lost economic opportunity – benchmarking Northern Ireland (NI) economic performance with other UK regions and RoI.
11
Introduction and Methodology
Other methodological considerations:
• Upper and lower bound costs identified – a range of factors may exist which result in higher costs being incurred in NI (of which division is only one). Therefore an approximate range of costs have been identified in which the cost of division could be a contributory factor.
• Cost of ‘Cultural Tradition’ – a number of costs have been identified related to a cultural tradition (e.g. cost of bonfires) rather than a divided society specifically. These could be reasonably excluded but are small in overall terms.
• Cost of ‘Diversity’ – Western society makes provision for a wide range of ethnic and religious groups in the provision of public services (e.g. the existence of faith schools in Great Britain (GB)). It is reasonable to expect that NI would continue to support diversity (rather than fund division) as is the case in the rest of the UK and RoI.
• Revenue associated with the divided society – e.g. PEACE Funding, IFI, Atlantic Philanthropies. NI has received significant funding to help address the legacy of a divided society. The current levels of funding received are identified.
12
Introduction and Methodology
Excluded from this research (as per the agreed methodology):
• Detailed audit of public sector service provision – a macro-level analysis has been undertaken, benchmarking NI expenditure with other UK regions and RoI:
− Individual needs assessments across regions could provide further information to estimate costs associated with division in NI. However, these can be significantly resource intensive to undertake.
• Sunk costs – historic costs no longer being incurred are excluded such as the cost of completed inquiries.
• Social costs – division has created significant social issues and associated costs but these have not been identified or quantified.
• Costs met by wider society – the analysis is focused on the cost to the public purse, the costs incurred by wider society are not identified.
• Cost of correction – correcting the legacy of division is likely to require significant investment and this has not been estimated in this research.
13

ulster.ac.uk
Public services
Public services
Policing, prisons and other justice
Education
Health
Community Relations
Housing & Physical Environment
Transport & Infrastructure
Leisure
Agriculture
Governance
15
ulster.ac.uk
Policing and justice
0
10
20
30
40
50
60
70
80
90
100
Met
rop
olit
an P
olic
e
Gre
ate
r M
anch
este
r
Cle
vela
nd
Hu
mb
ersi
de
Mer
seys
ide
Sou
th W
ales
Sou
th Y
ork
shir
e
Wes
t Yo
rksh
ire
No
rth
amp
ton
shir
e
No
ttin
gham
shir
e
Wes
t M
idla
nd
s
Ken
t
Gw
en
t
Lan
cash
ire
Bed
ford
shir
e
Avo
n a
nd
So
me
rset
Leic
est
ersh
ire
Ham
psh
ire
Cam
bri
dge
shir
e
PSN
I
Esse
x
Suss
ex
Staf
ford
shir
e
Du
rham
Tham
es V
alle
y
No
rth
Wal
es
Suff
olk
Ch
esh
ire
No
rfo
lk
Der
bys
hir
e
Her
tfo
rdsh
ire
No
rth
um
bri
a
Do
rse
t
Cu
mb
ria
Lin
coln
shir
e
Ro
I
Glo
uce
ster
shir
e
Sco
tlan
d
Wilt
shir
e
Dev
on
an
d C
orn
wal
l
Surr
ey
No
rth
Yo
rksh
ire
Dyf
ed
-Po
wys
War
wic
ksh
ire
& W
est
Me
rcia
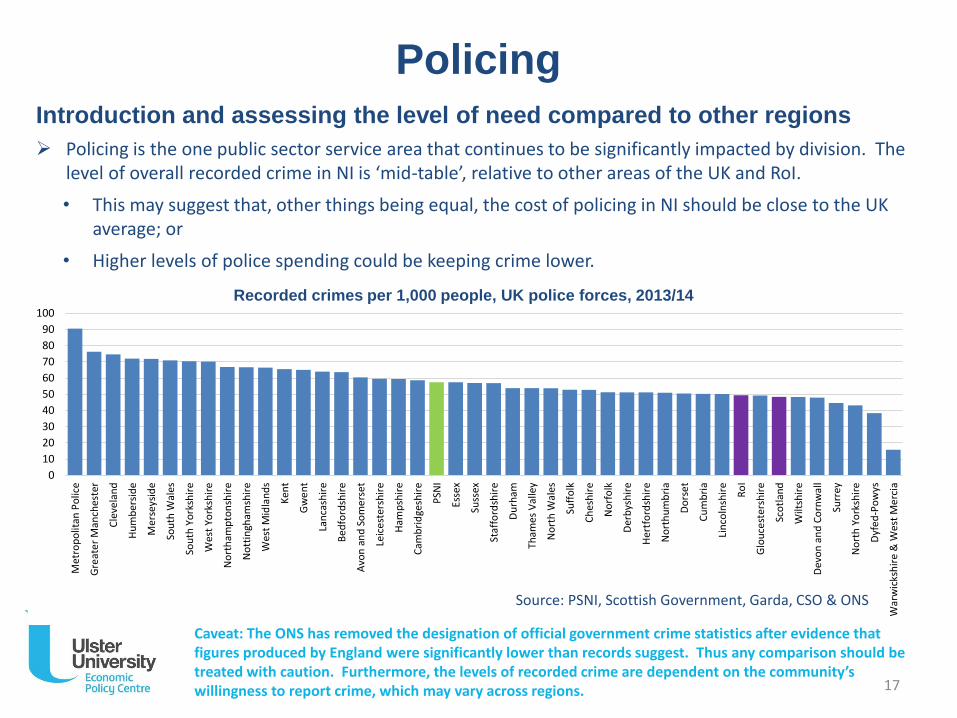
Introduction and assessing the level of need compared to other regions
Policing is the one public sector service area that continues to be significantly impacted by division. The level of overall recorded crime in NI is ‘mid-table’, relative to other areas of the UK and RoI.
• This may suggest that, other things being equal, the cost of policing in NI should be close to the UK average; or
• Higher levels of police spending could be keeping crime lower.
Policing
Recorded crimes per 1,000 people, UK police forces, 2013/14
Source: PSNI, Scottish Government, Garda, CSO & ONS
Caveat: The ONS has removed the designation of official government crime statistics after evidence that figures produced by England were significantly lower than records suggest. Thus any comparison should be treated with caution. Furthermore, the levels of recorded crime are dependent on the community’s willingness to report crime, which may vary across regions. 17
£0
£100
£200
£300
£400
£500
£600
£700
PSN
I
Met
rop
olit
an P
olic
e
Mer
seys
ide
Gw
en
t
No
rth
Wal
es
Sou
th W
ales
No
rth
um
bri
a
Cle
vela
nd
Hu
mb
ersi
de
Du
rham
Dyf
ed
-Po
wys
Surr
ey
Sou
th Y
ork
shir
e
Lan
cash
ire
RO
I
Avo
n a
nd
So
me
rset
Wes
t M
idla
nd
s
Sco
tlan
d
No
ttin
gham
shir
e
Cu
mb
ria
Tham
es V
alle
y
Wilt
shir
e
Glo
uce
ster
shir
e
No
rth
Yo
rksh
ire
Leic
est
ersh
ire
Suss
ex
No
rfo
lk
Her
tfo
rdsh
ire
Bed
ford
shir
e
No
rth
amp
ton
shir
e
Suff
olk
Ken
t
Cam
bri
dge
shir
e
Der
bys
hir
e
Dev
on
an
d C
orn
wal
l
Lin
coln
shir
e
Staf
ford
shir
e
Ch
esh
ire
Ham
psh
ire
Do
rse
t
Wes
t Yo
rksh
ire
Esse
x
War
wic
ksh
ire
& W
est…
Policing
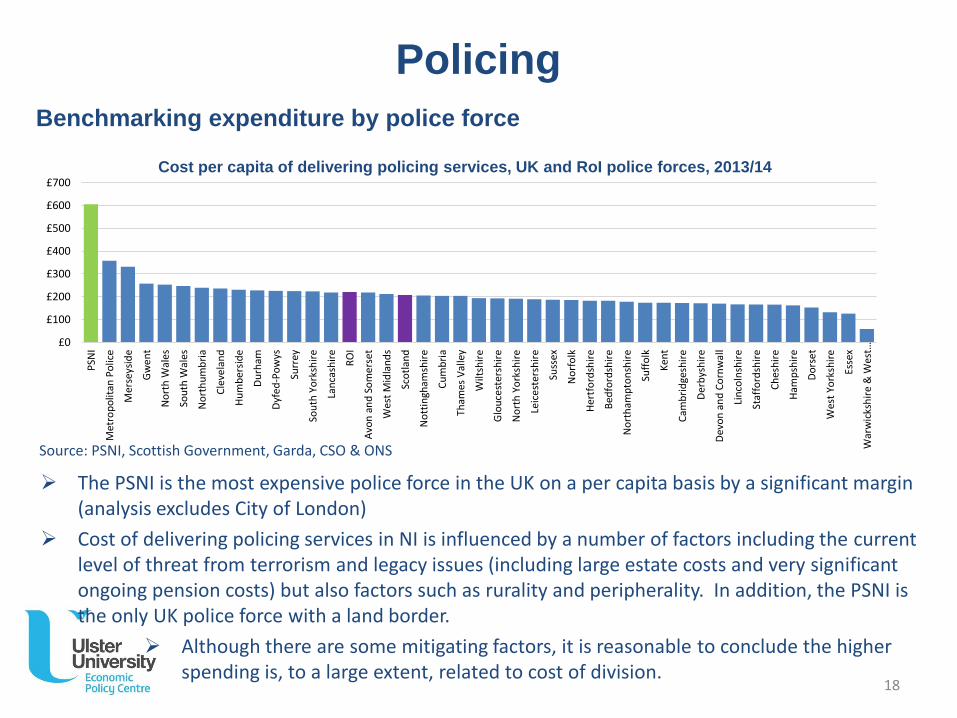
The PSNI is the most expensive police force in the UK on a per capita basis by a significant margin (analysis excludes City of London)
Cost of delivering policing services in NI is influenced by a number of factors including the current level of threat from terrorism and legacy issues (including large estate costs and very significant ongoing pension costs) but also factors such as rurality and peripherality. In addition, the PSNI is the only UK police force with a land border.
Although there are some mitigating factors, it is reasonable to conclude the higher spending is, to a large extent, related to cost of division.
Benchmarking expenditure by police force
Cost per capita of delivering policing services, UK and RoI police forces, 2013/14
Source: PSNI, Scottish Government, Garda, CSO & ONS
18
Policing
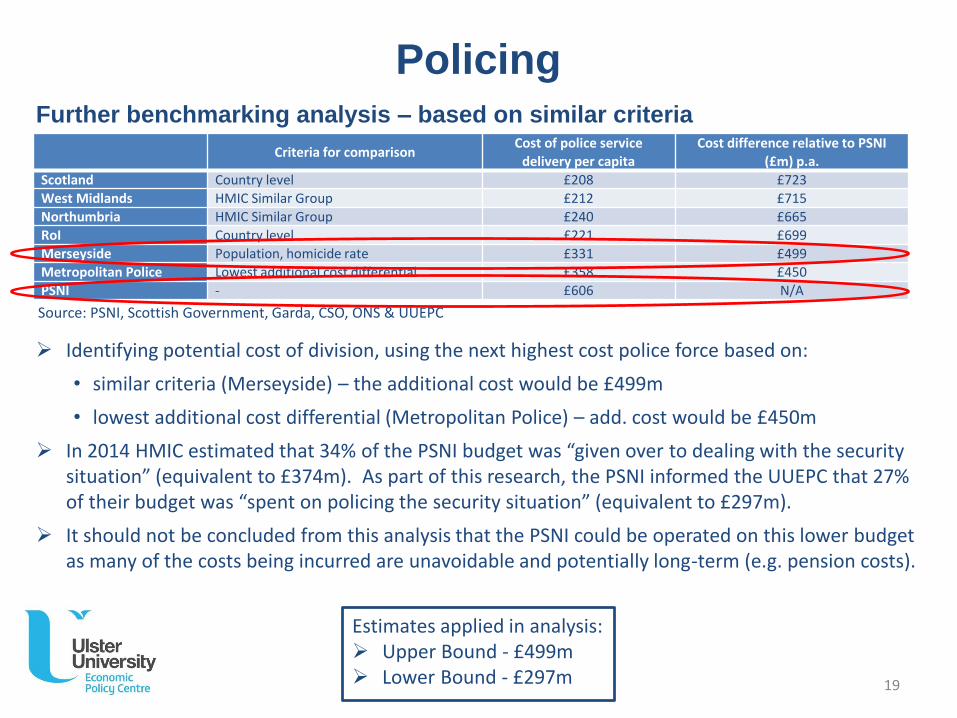
Identifying potential cost of division, using the next highest cost police force based on:
• similar criteria (Merseyside) – the additional cost would be £499m
• lowest additional cost differential (Metropolitan Police) – add. cost would be £450m
In 2014 HMIC estimated that 34% of the PSNI budget was “given over to dealing with the security situation” (equivalent to £374m). As part of this research, the PSNI informed the UUEPC that 27% of their budget was “spent on policing the security situation” (equivalent to £297m).
It should not be concluded from this analysis that the PSNI could be operated on this lower budget as many of the costs being incurred are unavoidable and potentially long-term (e.g. pension costs).
Criteria for comparisonCost of police service
delivery per capitaCost difference relative to PSNI
(£m) p.a.
Scotland Country level £208 £723
West Midlands HMIC Similar Group £212 £715
Northumbria HMIC Similar Group £240 £665
RoI Country level £221 £699
Merseyside Population, homicide rate £331 £499
Metropolitan Police Lowest additional cost differential £358 £450
PSNI - £606 N/A
Further benchmarking analysis – based on similar criteria
Estimates applied in analysis: Upper Bound - £499m Lower Bound - £297m
Source: PSNI, Scottish Government, Garda, CSO, ONS & UUEPC
19
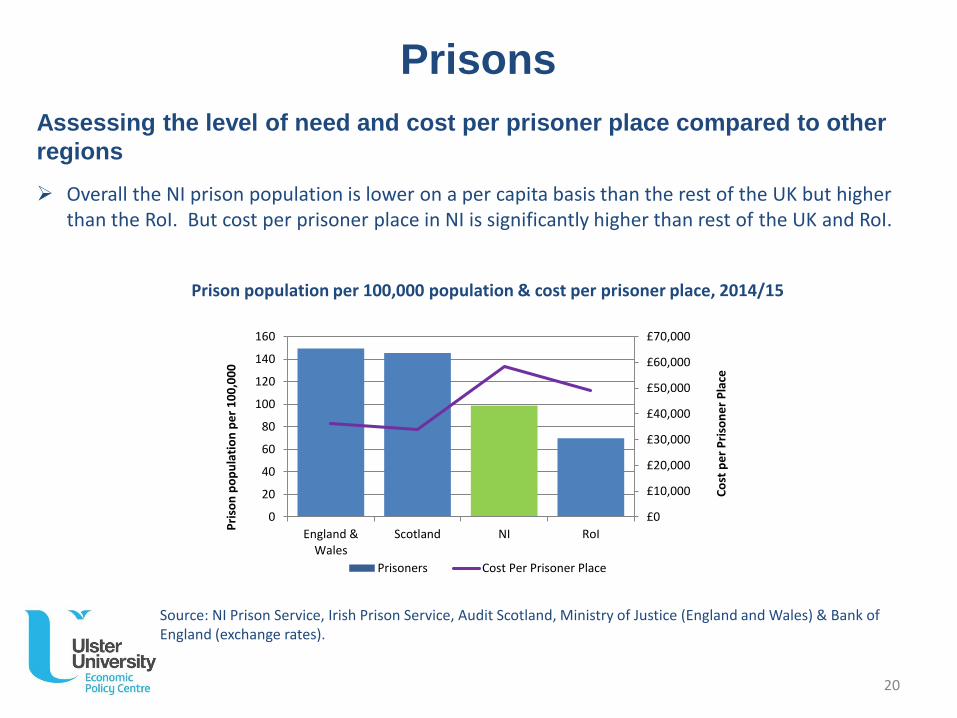
Assessing the level of need and cost per prisoner place compared to other
regions
Overall the NI prison population is lower on a per capita basis than the rest of the UK but higher than the RoI. But cost per prisoner place in NI is significantly higher than rest of the UK and RoI.
Prisons
Prison population per 100,000 population & cost per prisoner place, 2014/15
Source: NI Prison Service, Irish Prison Service, Audit Scotland, Ministry of Justice (England and Wales) & Bank of England (exchange rates).
£0
£10,000
£20,000
£30,000
£40,000
£50,000
£60,000
£70,000
0
20
40
60
80
100
120
140
160
England &Wales
Scotland NI RoI
Co
st p
er
Pri
son
er
Pla
ce
Pri
son
po
pu
lati
on
pe
r 1
00
,00
0
Prisoners Cost Per Prisoner Place
20
Prisons
Benchmarking analysis – other considerations
The higher cost in NI is linked to a number of division related factors such as housing current paramilitary prisoners and a prison infrastructure developed for the period of civil unrest. However, other potential reasons for higher costs in NI include:
• Less scope for economies of scale – given the lower number of prisoners, NI’s main prison, Maghaberry, must accommodate prisoners across all categories and also segregate prisoners when appropriate. This is operationally more complex than in the UK, where prisoners would be accommodated in different prisons; and
• Different service delivery approaches – the private sector provide prison services in GB but not in NI.
Direct Costs
The costs associated with current “conflict related” prison population is estimated at £4.1m.
• 70 paramilitary prisoners at an average cost per prisoner place of c. £58k = £4.1m. This is a prudent estimate as there is a higher cost associated with paramilitary prisoners but NI Prison Service have not quantified the additional cost.
[Source: NI Prison Service June 2015]
21
Prisons
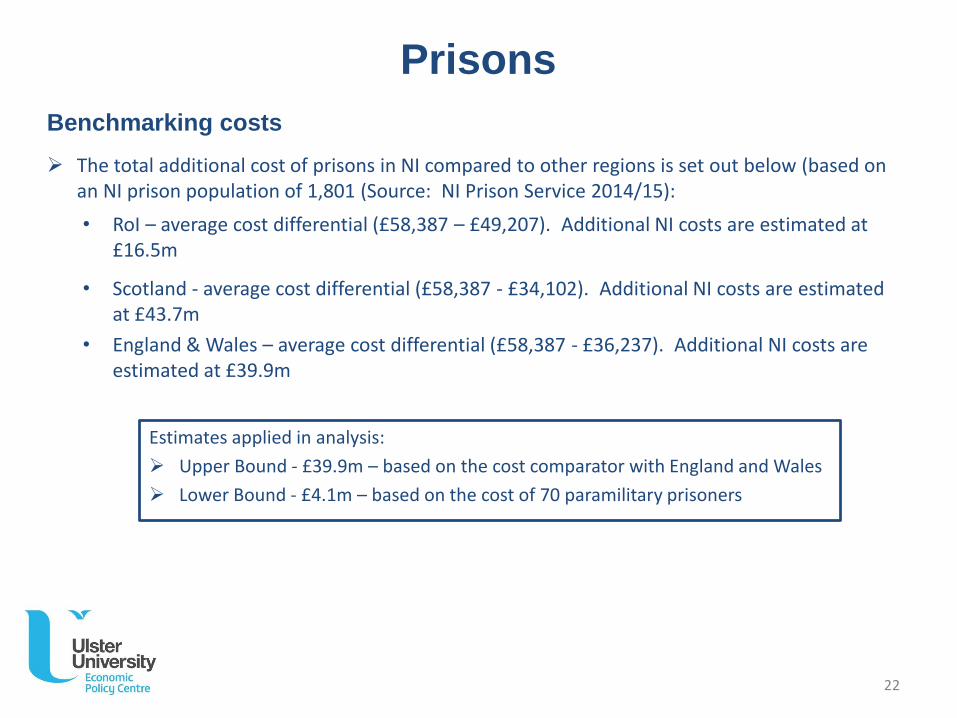
Benchmarking costs
The total additional cost of prisons in NI compared to other regions is set out below (based on an NI prison population of 1,801 (Source: NI Prison Service 2014/15):
• RoI – average cost differential (£58,387 – £49,207). Additional NI costs are estimated at £16.5m
• Scotland - average cost differential (£58,387 - £34,102). Additional NI costs are estimated at £43.7m
• England & Wales – average cost differential (£58,387 - £36,237). Additional NI costs are estimated at £39.9m
Estimates applied in analysis:
Upper Bound - £39.9m – based on the cost comparator with England and Wales
Lower Bound - £4.1m – based on the cost of 70 paramilitary prisoners
22
Other Justice
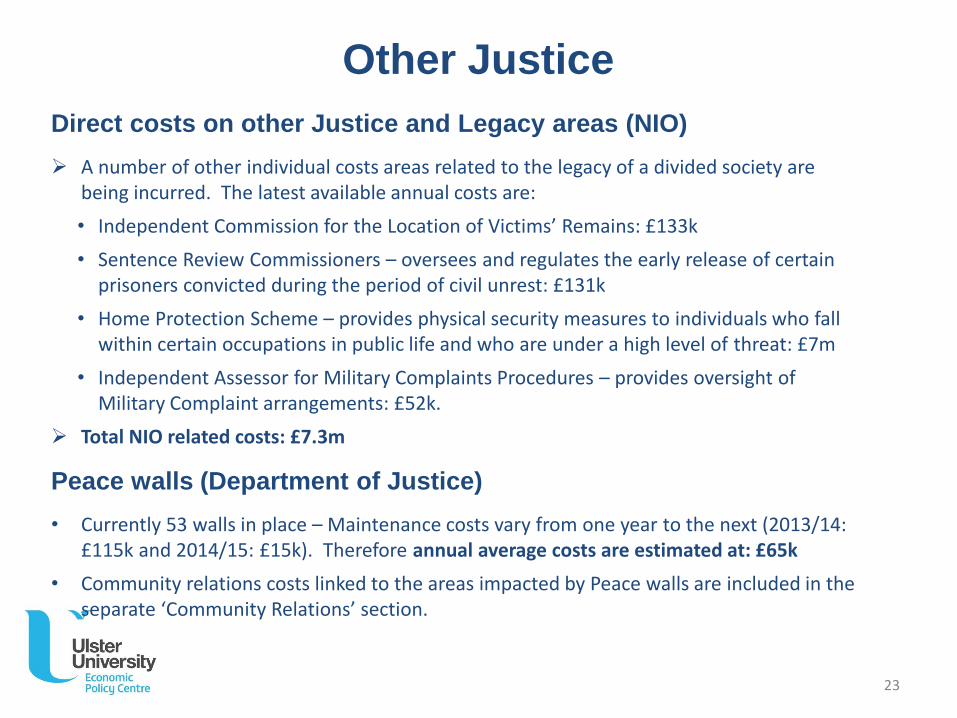
Direct costs on other Justice and Legacy areas (NIO)
A number of other individual costs areas related to the legacy of a divided society are being incurred. The latest available annual costs are:
• Independent Commission for the Location of Victims’ Remains: £133k
• Sentence Review Commissioners – oversees and regulates the early release of certain prisoners convicted during the period of civil unrest: £131k
• Home Protection Scheme – provides physical security measures to individuals who fall within certain occupations in public life and who are under a high level of threat: £7m
• Independent Assessor for Military Complaints Procedures – provides oversight of Military Complaint arrangements: £52k.
Total NIO related costs: £7.3m
Peace walls (Department of Justice)
• Currently 53 walls in place – Maintenance costs vary from one year to the next (2013/14: £115k and 2014/15: £15k). Therefore annual average costs are estimated at: £65k
• Community relations costs linked to the areas impacted by Peace walls are included in the separate ‘Community Relations’ section.
23
Other Justice
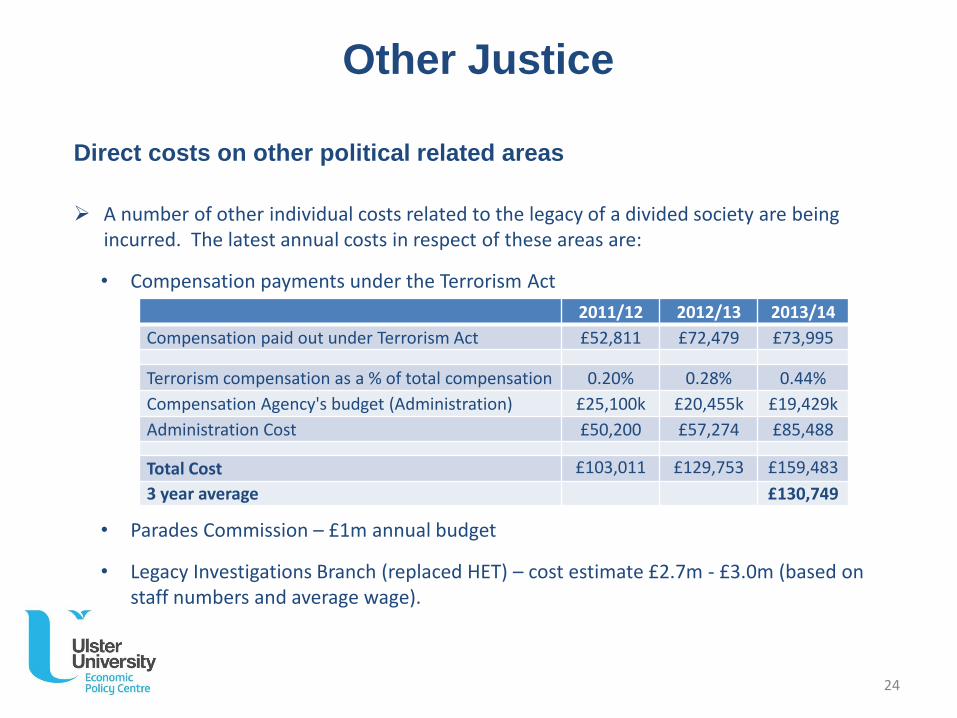
Direct costs on other political related areas
A number of other individual costs related to the legacy of a divided society are being incurred. The latest annual costs in respect of these areas are:
• Compensation payments under the Terrorism Act
• Parades Commission – £1m annual budget
• Legacy Investigations Branch (replaced HET) – cost estimate £2.7m - £3.0m (based on staff numbers and average wage).
2011/12 2012/13 2013/14
Compensation paid out under Terrorism Act £52,811 £72,479 £73,995
Terrorism compensation as a % of total compensation 0.20% 0.28% 0.44%
Compensation Agency's budget (Administration) £25,100k £20,455k £19,429k
Administration Cost £50,200 £57,274 £85,488
Total Cost £103,011 £129,753 £159,483
3 year average £130,749
24
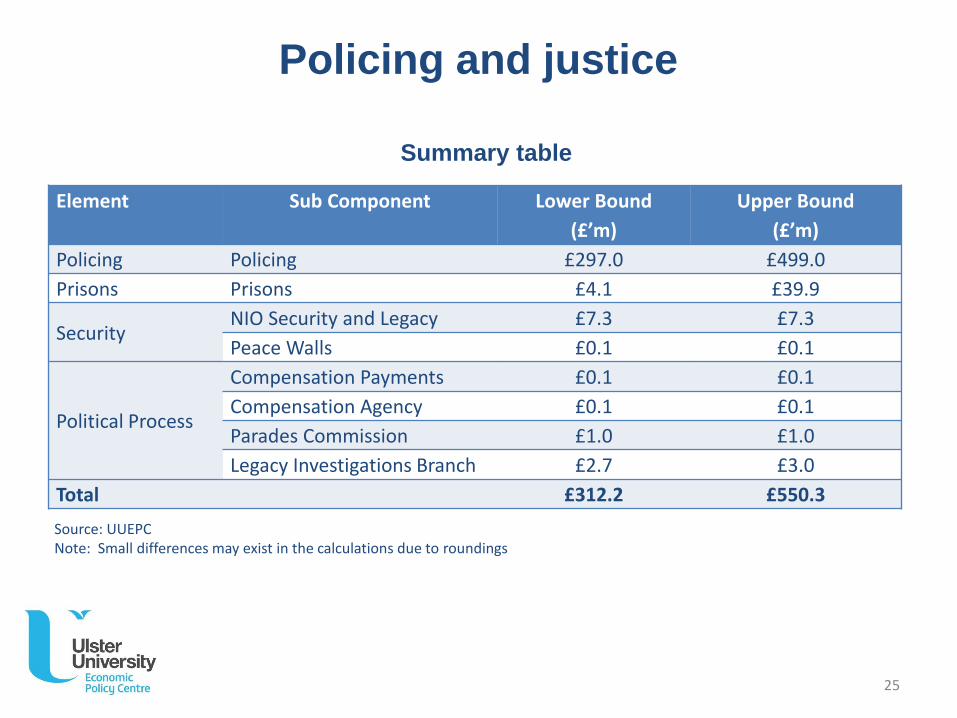
Policing and justice
Summary table
Element Sub Component Lower Bound
(£’m)
Upper Bound
(£’m)
Policing Policing £297.0 £499.0
Prisons Prisons £4.1 £39.9
SecurityNIO Security and Legacy £7.3 £7.3
Peace Walls £0.1 £0.1
Political Process
Compensation Payments £0.1 £0.1
Compensation Agency £0.1 £0.1
Parades Commission £1.0 £1.0
Legacy Investigations Branch £2.7 £3.0
Total £312.2 £550.3
Source: UUEPCNote: Small differences may exist in the calculations due to roundings
25

ulster.ac.uk
Education
Education
Introduction
Primary and secondary education is still largely segregated in NI, therefore the scope for duplication of services and associated inefficiencies may be higher than elsewhere in the UK.
However, other parts of the UK also have a range of delivery structures including faith based schools, local authority provision and independent academies. Private sector provision is also more significant in other parts of the UK than in NI. Therefore, choice and diversity of provision in education is a common feature across many geographies, not just NI.
Assessing Cost of Division
A benchmarking analysis of the cost per pupil in NI against other regions was undertaken. This suggested costs in NI were lower than all other regions in the UK. The information was shared with DENI to verify expenditure and they stated that “the different funding regimes and accounting arrangements mean that regional comparisons are very difficult”. It was therefore concluded that the cost analysis should not be included in this report.
Pupil : teacher ratios and average class sizes are assessed.
The number of surplus school places in NI compared to other regions could highlight the level of duplication. Furthermore, societal division could be impacting the ability of the education sector as a whole to manage overprovision.
27
Education
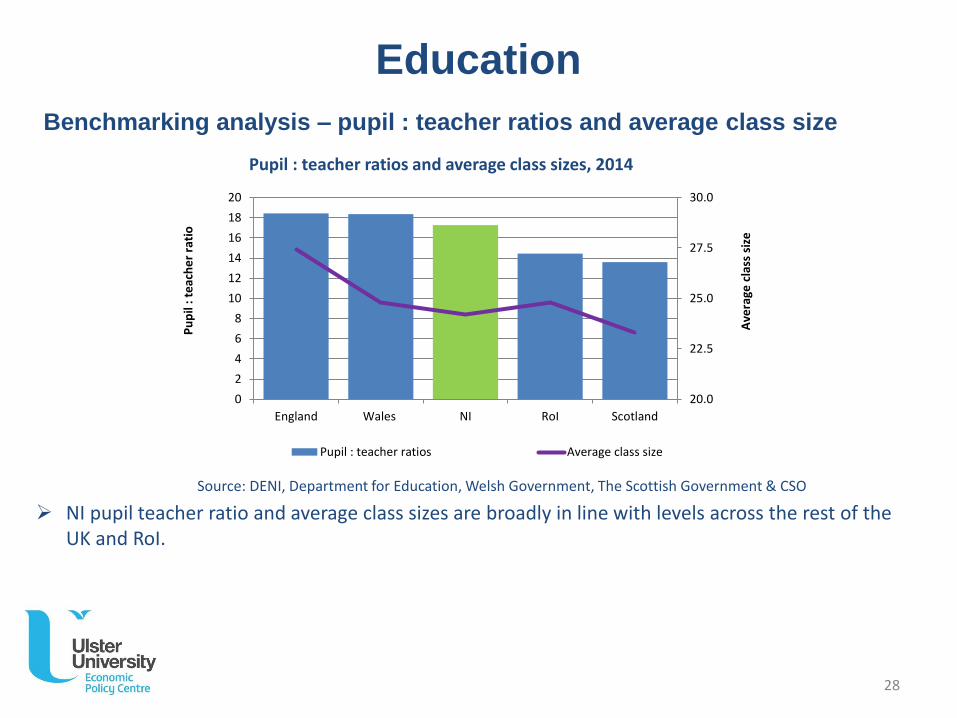
Benchmarking analysis – pupil : teacher ratios and average class size
Pupil : teacher ratios and average class sizes, 2014
NI pupil teacher ratio and average class sizes are broadly in line with levels across the rest of the UK and RoI.
Source: DENI, Department for Education, Welsh Government, The Scottish Government & CSO
20.0
22.5
25.0
27.5
30.0
0
2
4
6
8
10
12
14
16
18
20
England Wales NI RoI Scotland
Ave
rage
cla
ss s
ize
Pu
pil
: te
ach
er
rati
o
Pupil : teacher ratios Average class size
28
Education
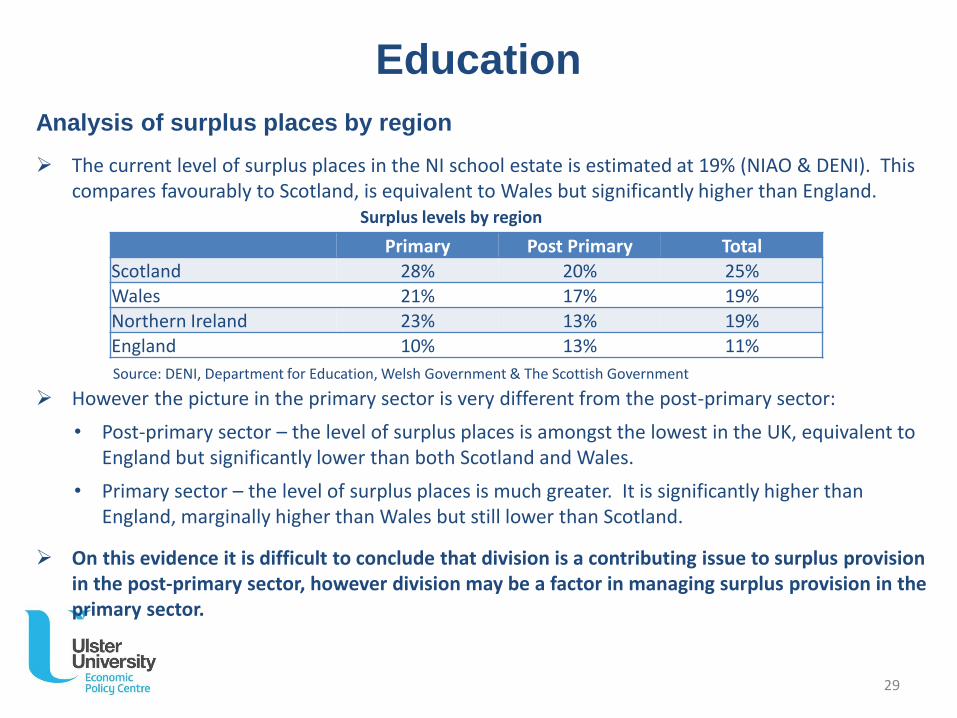
Analysis of surplus places by region
The current level of surplus places in the NI school estate is estimated at 19% (NIAO & DENI). This compares favourably to Scotland, is equivalent to Wales but significantly higher than England.
However the picture in the primary sector is very different from the post-primary sector:
• Post-primary sector – the level of surplus places is amongst the lowest in the UK, equivalent to England but significantly lower than both Scotland and Wales.
• Primary sector – the level of surplus places is much greater. It is significantly higher than England, marginally higher than Wales but still lower than Scotland.
On this evidence it is difficult to conclude that division is a contributing issue to surplus provision in the post-primary sector, however division may be a factor in managing surplus provision in the primary sector.
Surplus levels by region
Primary Post Primary TotalScotland 28% 20% 25%Wales 21% 17% 19%
Northern Ireland 23% 13% 19%England 10% 13% 11%
Source: DENI, Department for Education, Welsh Government & The Scottish Government
29

Education
Analysis of surplus places by region
Post-primary sector
Although division is unlikely to be a contributing factor to surplus provision in the post-primary sector, given the Bain Review suggested that 10% is an acceptable surplus, further efficiencies are possible.
• Upper and lower bound – zero
Primary sector
The higher level of surplus provision in the primary sector in NI could be due to a range of factors, including: a falling demographic; rurality; policy decisions; and in NI the impact of division. Furthermore, the extent to which these factors impact each region could vary significantly. For example surplus places in Scotland could be predominantly a rurality issue but in NI it could be as a result of division. But without detailed analysis it is not possible to determine.
• Lower bound – the NI surplus compares favourably to Scotland but is marginally higher than Wales, therefore whilst division is likely to have at least some impact in terms of managing surplus places, the difference between NI and Wales could represent the lower bound of the cost of division.
• Upper bound – given the very high levels of surplus compared to England (and NI’s parity of performance with England at post-primary level in terms of surplus), the difference between NI and England could represent the upper bound of the cost of division.
30
Education
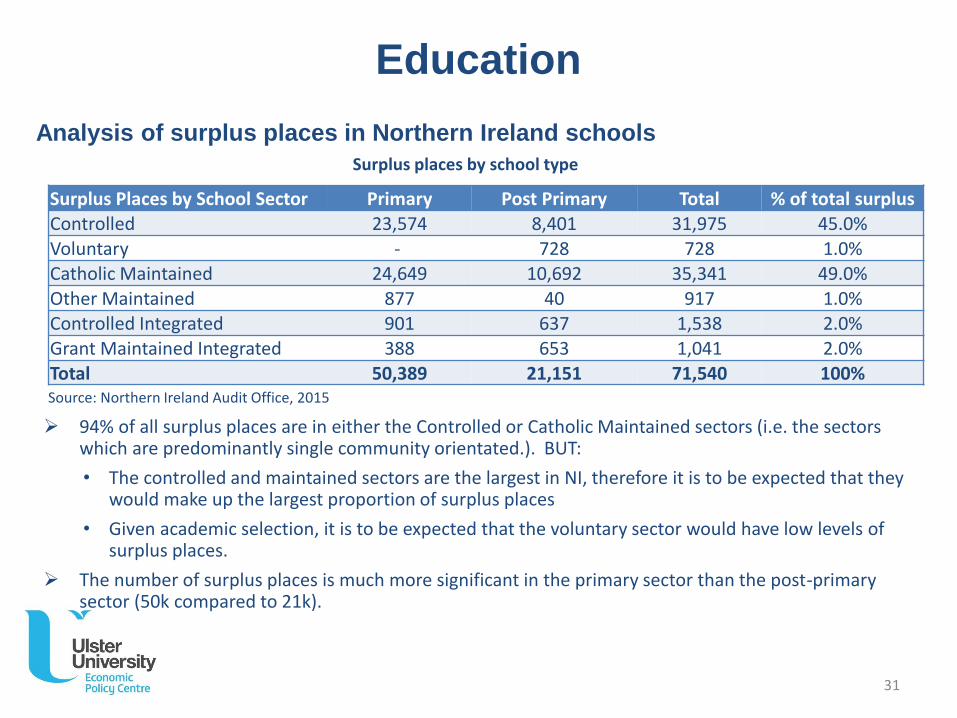
Analysis of surplus places in Northern Ireland schools
Surplus places by school type
Surplus Places by School Sector Primary Post Primary Total % of total surplusControlled 23,574 8,401 31,975 45.0%
Voluntary - 728 728 1.0%Catholic Maintained 24,649 10,692 35,341 49.0%
Other Maintained 877 40 917 1.0%Controlled Integrated 901 637 1,538 2.0%Grant Maintained Integrated 388 653 1,041 2.0%Total 50,389 21,151 71,540 100%
94% of all surplus places are in either the Controlled or Catholic Maintained sectors (i.e. the sectors which are predominantly single community orientated.). BUT:
• The controlled and maintained sectors are the largest in NI, therefore it is to be expected that they would make up the largest proportion of surplus places
• Given academic selection, it is to be expected that the voluntary sector would have low levels of surplus places.
The number of surplus places is much more significant in the primary sector than the post-primary sector (50k compared to 21k).
Source: Northern Ireland Audit Office, 2015
31
Education
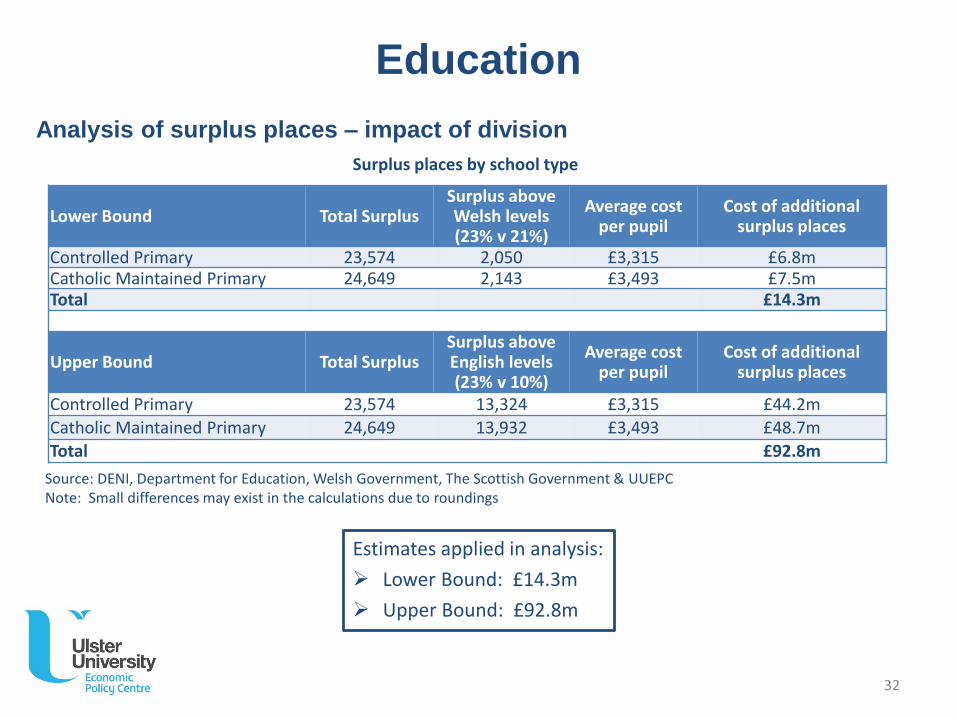
Analysis of surplus places – impact of division
Estimates applied in analysis:
Lower Bound: £14.3m
Upper Bound: £92.8m
Surplus places by school type
Lower Bound Total SurplusSurplus above Welsh levels(23% v 21%)
Average cost per pupil
Cost of additional surplus places
Controlled Primary 23,574 2,050 £3,315 £6.8mCatholic Maintained Primary 24,649 2,143 £3,493 £7.5mTotal £14.3m
Upper Bound Total SurplusSurplus above English levels(23% v 10%)
Average cost per pupil
Cost of additional surplus places
Controlled Primary 23,574 13,324 £3,315 £44.2m
Catholic Maintained Primary 24,649 13,932 £3,493 £48.7mTotal £92.8m
Source: DENI, Department for Education, Welsh Government, The Scottish Government & UUEPCNote: Small differences may exist in the calculations due to roundings
32
Education – teacher training
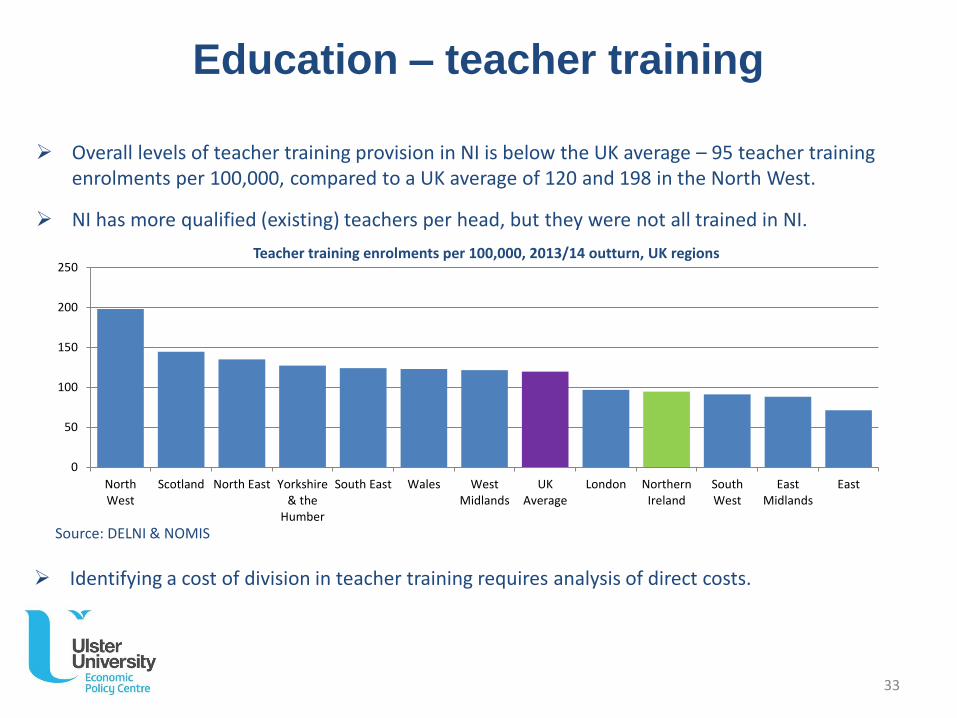
Identifying a cost of division in teacher training requires analysis of direct costs.
Teacher training enrolments per 100,000, 2013/14 outturn, UK regions
Overall levels of teacher training provision in NI is below the UK average – 95 teacher training enrolments per 100,000, compared to a UK average of 120 and 198 in the North West.
NI has more qualified (existing) teachers per head, but they were not all trained in NI.
0
50
100
150
200
250
NorthWest
Scotland North East Yorkshire& the
Humber
South East Wales WestMidlands
UKAverage
London NorthernIreland
SouthWest
EastMidlands
East
Source: DELNI & NOMIS
33
Education – teacher training
Direct Cost
As identified in the International Review Panel Report (1), NI “has five relatively small teacher education providers, three of them in close geographical proximity … failing to minimise the significant duplication of activity that occurs.”
St. Mary’s University College and Stranmillis University College (two of the five teacher training colleges in NI) receive additional premia funding to stay viable. This totals £2.2m p.a. and could potentially represent a cost of division.
1. Aspiring to Excellence, Final Report of the International panel on the Structure of Initial Teacher Education in Northern Ireland, June 2014.
34
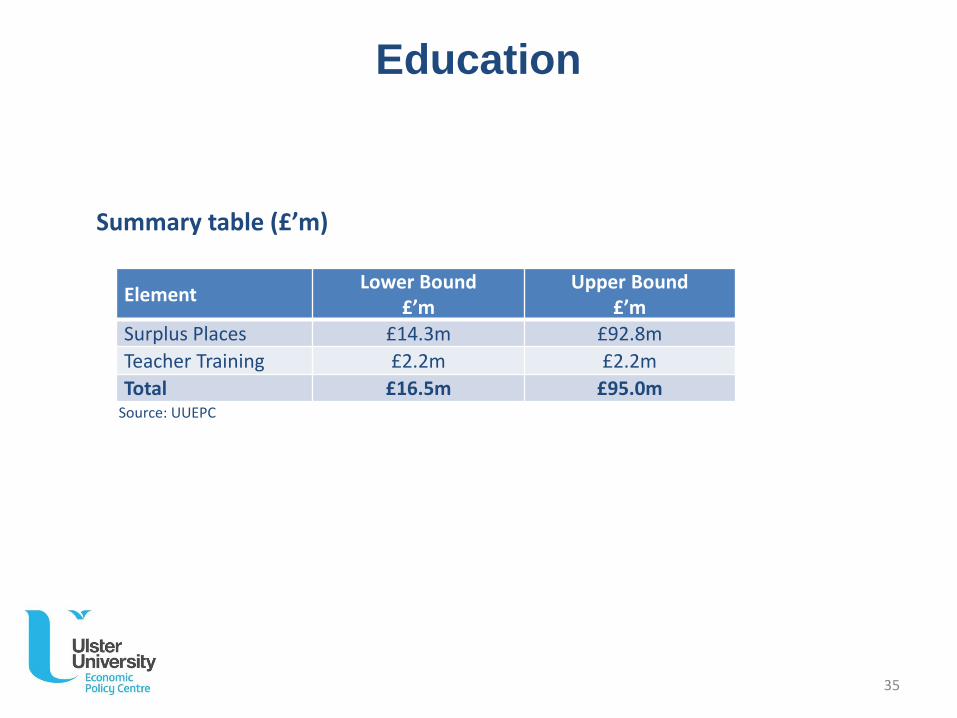
Education
Summary table (£’m)
ElementLower Bound
£’mUpper Bound
£’mSurplus Places £14.3m £92.8m
Teacher Training £2.2m £2.2m
Total £16.5m £95.0mSource: UUEPC
35

ulster.ac.uk
Health
Health
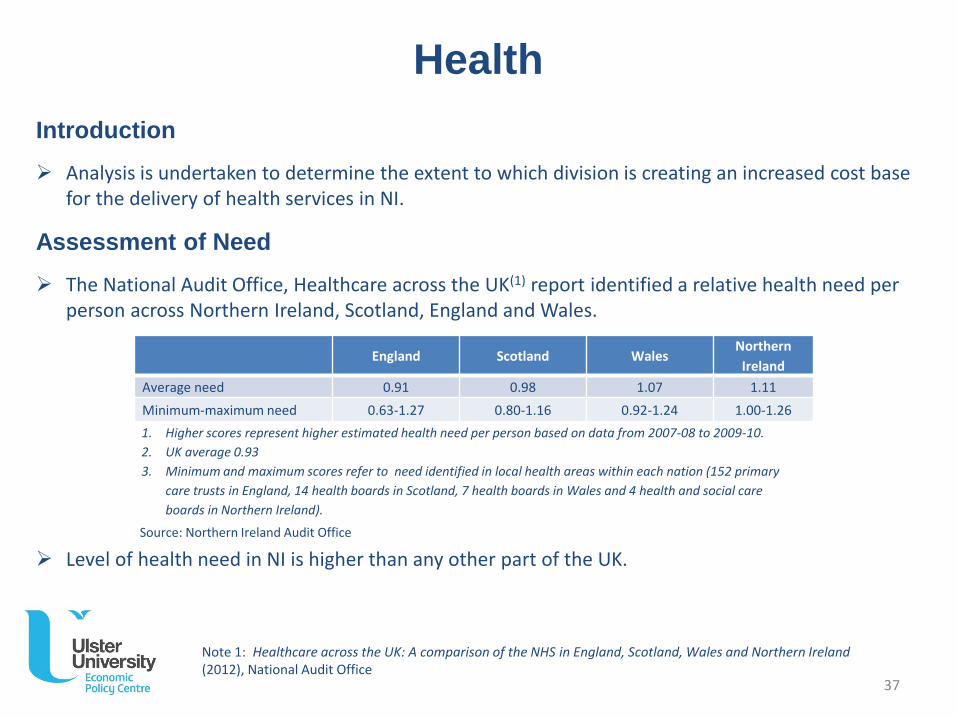
Introduction
Analysis is undertaken to determine the extent to which division is creating an increased cost base for the delivery of health services in NI.
Assessment of Need
The National Audit Office, Healthcare across the UK(1) report identified a relative health need per person across Northern Ireland, Scotland, England and Wales.
Level of health need in NI is higher than any other part of the UK.
England Scotland WalesNorthern
Ireland
Average need 0.91 0.98 1.07 1.11
Minimum-maximum need 0.63-1.27 0.80-1.16 0.92-1.24 1.00-1.26
Note 1: Healthcare across the UK: A comparison of the NHS in England, Scotland, Wales and Northern Ireland (2012), National Audit Office
1. Higher scores represent higher estimated health need per person based on data from 2007-08 to 2009-10.
2. UK average 0.93
3. Minimum and maximum scores refer to need identified in local health areas within each nation (152 primary
care trusts in England, 14 health boards in Scotland, 7 health boards in Wales and 4 health and social care
boards in Northern Ireland).
Source: Northern Ireland Audit Office
37
Health
Assessing Cost of Division
This section includes a benchmarking analysis of:
• health expenditure per capita; and
• hospital beds per 100,000 population.
In addition, this section also considers the additional cost of mental health in NI. The legacy of civil unrest has resulted in higher levels of mental health problems in NI which is resulting in higher costs to the health sector.
38
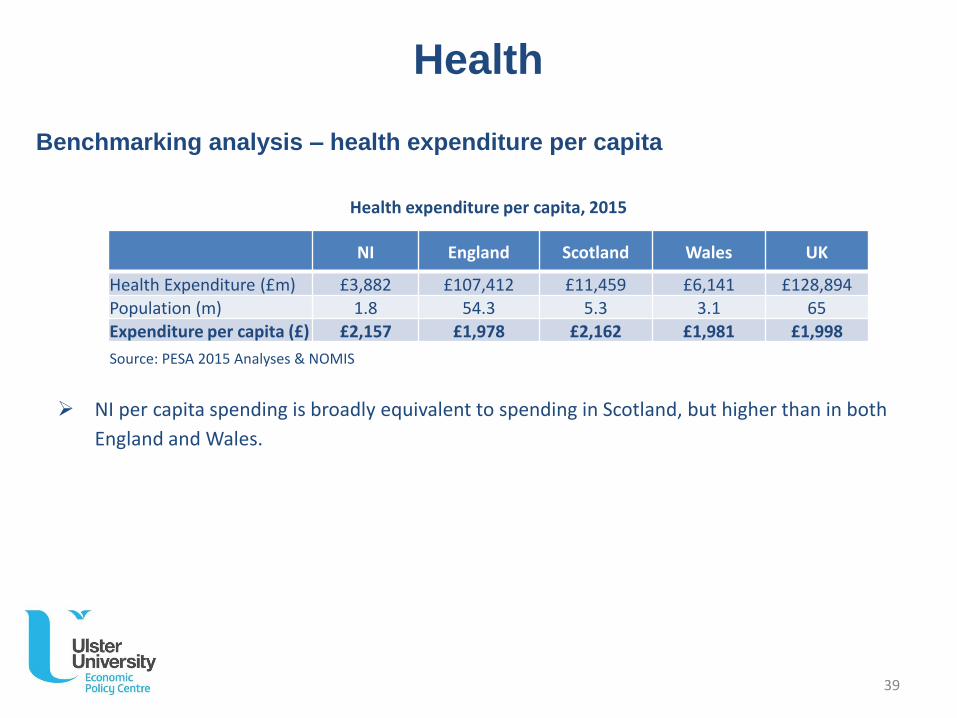
Health
Health expenditure per capita, 2015
NI per capita spending is broadly equivalent to spending in Scotland, but higher than in both
England and Wales.
Benchmarking analysis – health expenditure per capita
NI England Scotland Wales UK
Health Expenditure (£m) £3,882 £107,412 £11,459 £6,141 £128,894Population (m) 1.8 54.3 5.3 3.1 65
Expenditure per capita (£) £2,157 £1,978 £2,162 £1,981 £1,998
Source: PESA 2015 Analyses & NOMIS
39
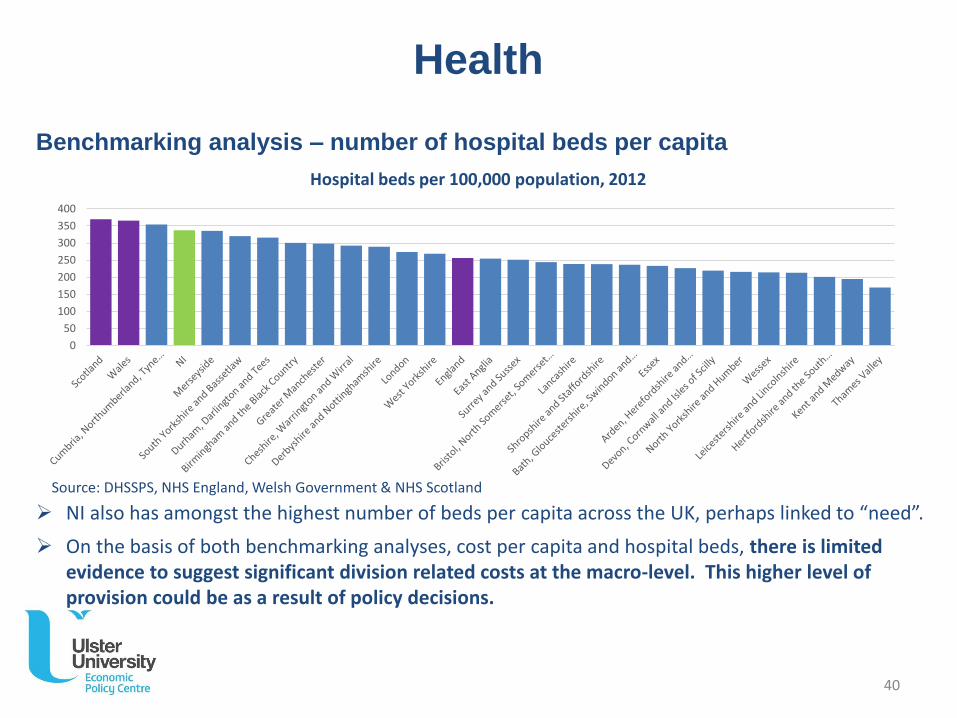
Health
Hospital beds per 100,000 population, 2012
NI also has amongst the highest number of beds per capita across the UK, perhaps linked to “need”.
On the basis of both benchmarking analyses, cost per capita and hospital beds, there is limited evidence to suggest significant division related costs at the macro-level. This higher level of provision could be as a result of policy decisions.
Benchmarking analysis – number of hospital beds per capita
0
50
100
150
200
250
300
350
400
Source: DHSSPS, NHS England, Welsh Government & NHS Scotland
40
Health
Analysis of Mental Health – Direct Cost
Mental health is one area of public health spending often linked to the legacy of division. Two specific costs have been identified, firstly in relation to the cost of Post Traumatic Stress Disorders (PTSD) and secondly in terms of the higher costs of mental health admissions:
1. Cost of treatment
Research undertaken by Ulster University(1) estimates that approximately 27% of individuals (approx. 18,000 people) with PTSD is “linked to a conflict-related traumatic event”.
The latest update to the research completed in 2015(2) (using 2013 prices) estimated that the direct costs (including both medication and service visits (e.g. visits to hospital, psychiatrist, social workers etc.)) of PTSD is £38.3m p.a.. On the basis that 27% are conflict related, this suggests a division related cost of £10.3m.
1. Ulster University, “The Economic Impact of Post Traumatic Stress Disorder in Northern Ireland”, 20142. Ulster University, “The Economic Burden of PTSD in Northern Ireland”, 2015 41
Health
Analysis of Mental Health – Direct Cost (contd.)
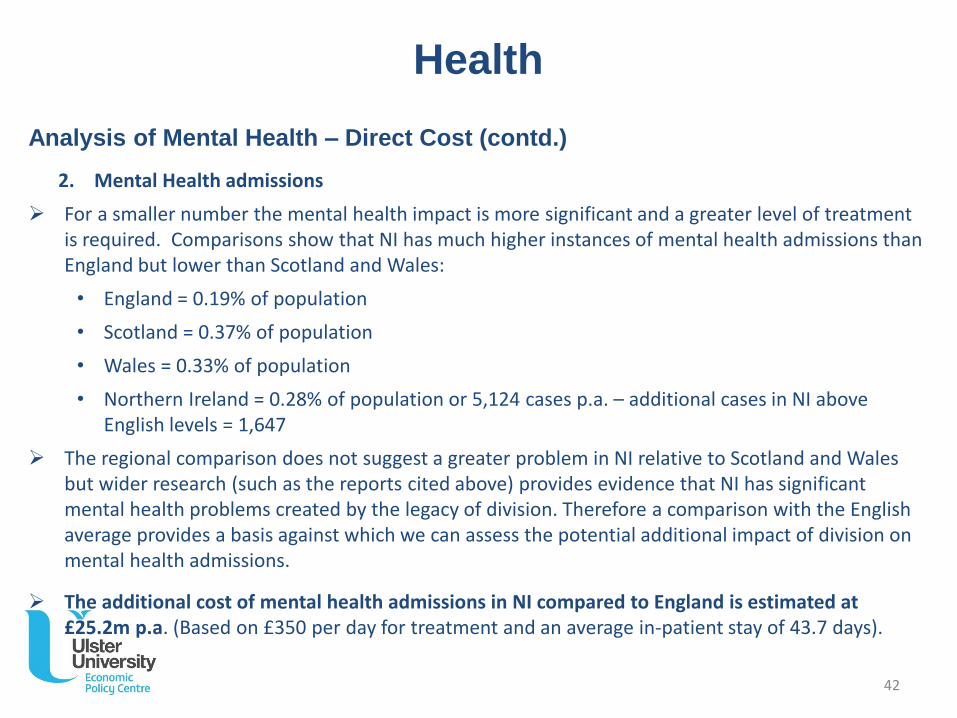
2. Mental Health admissions
For a smaller number the mental health impact is more significant and a greater level of treatment is required. Comparisons show that NI has much higher instances of mental health admissions than England but lower than Scotland and Wales:
• England = 0.19% of population
• Scotland = 0.37% of population
• Wales = 0.33% of population
• Northern Ireland = 0.28% of population or 5,124 cases p.a. – additional cases in NI above English levels = 1,647
The regional comparison does not suggest a greater problem in NI relative to Scotland and Wales but wider research (such as the reports cited above) provides evidence that NI has significant mental health problems created by the legacy of division. Therefore a comparison with the English average provides a basis against which we can assess the potential additional impact of division on mental health admissions.
The additional cost of mental health admissions in NI compared to England is estimated at £25.2m p.a. (Based on £350 per day for treatment and an average in-patient stay of 43.7 days).
42
Health
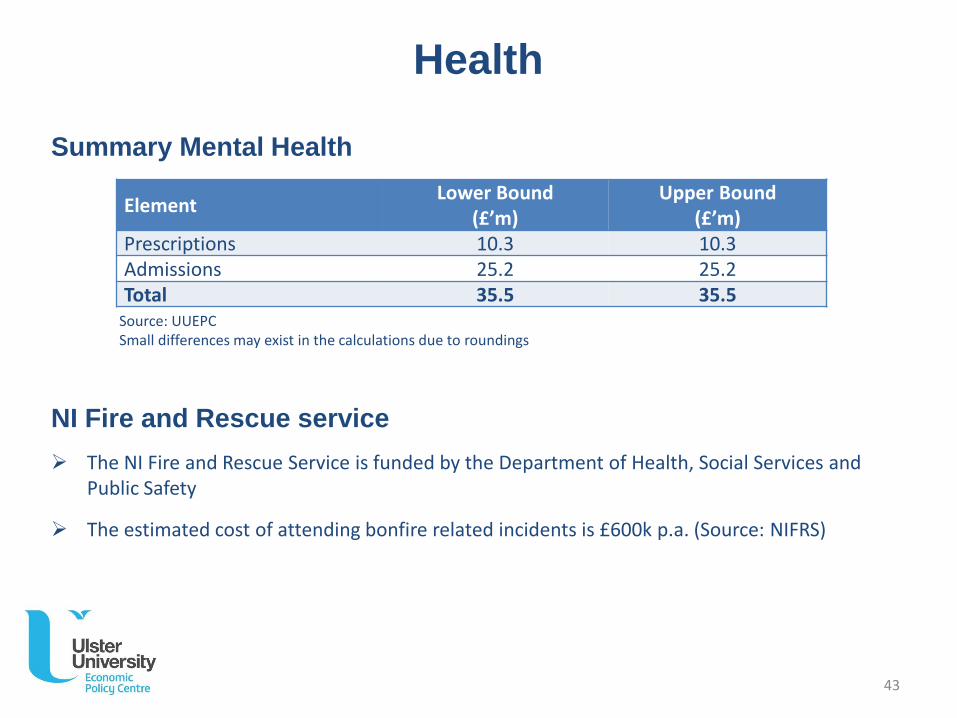
Summary Mental Health
NI Fire and Rescue service
The NI Fire and Rescue Service is funded by the Department of Health, Social Services and Public Safety
The estimated cost of attending bonfire related incidents is £600k p.a. (Source: NIFRS)
ElementLower Bound
(£’m)Upper Bound
(£’m)Prescriptions 10.3 10.3Admissions 25.2 25.2Total 35.5 35.5
Source: UUEPCSmall differences may exist in the calculations due to roundings
43
Health
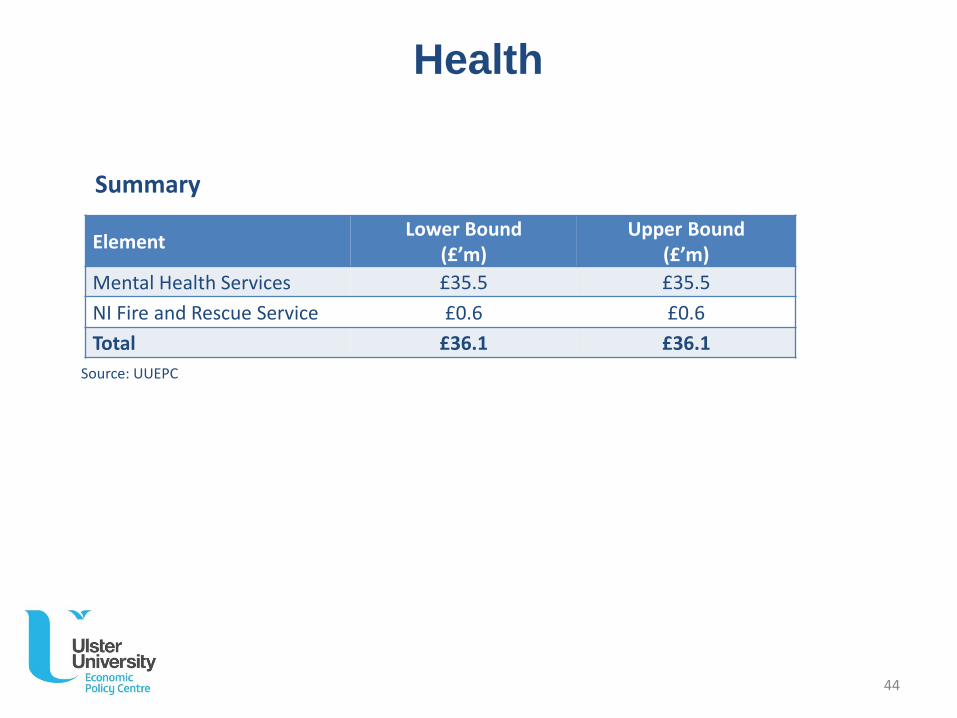
Summary
ElementLower Bound
(£’m)Upper Bound
(£’m)
Mental Health Services £35.5 £35.5
NI Fire and Rescue Service £0.6 £0.6
Total £36.1 £36.1
Source: UUEPC
44
ulster.ac.uk
Community relations
Community relations
Introduction
There are a wide range of community relations programmes in operation across NI, with the overarching aim of bringing both communities together and enhancing mutual understanding and respect.
These programmes exist in response to the divisions in our society and are therefore included in the analysis.
Assessing Cost of Division
Benchmarking analysis with other UK regions – using PESA data, per capita spending on ‘Religious and other community services’ was compared.
The Direct costs associated with community relations programmes was also identified.
46
PESA DefinitionActivities of ‘Religious and Other CommunityServices’: Administration of religious and other community
affairs; Provision of facilities for religious and other
community services, including support for theiroperation, maintenance and repair;
Payment of clergy or other officers of religiousinstitutions; and
Support for the holding of religious services;grants, loans or subsidies to support fraternal,civic, youth and social organisations or labourunions and political parties.
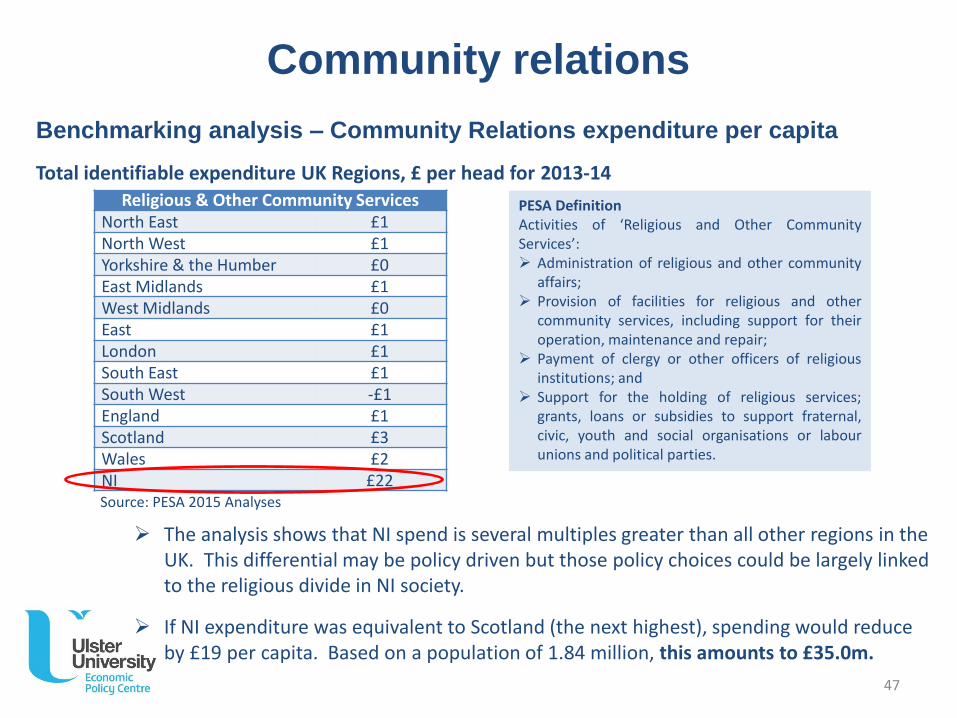
The analysis shows that NI spend is several multiples greater than all other regions in the UK. This differential may be policy driven but those policy choices could be largely linked to the religious divide in NI society.
If NI expenditure was equivalent to Scotland (the next highest), spending would reduce by £19 per capita. Based on a population of 1.84 million, this amounts to £35.0m.
Religious & Other Community ServicesNorth East £1North West £1Yorkshire & the Humber £0East Midlands £1West Midlands £0East £1London £1South East £1South West -£1England £1Scotland £3Wales £2NI £22
Benchmarking analysis – Community Relations expenditure per capita
Total identifiable expenditure UK Regions, £ per head for 2013-14
Source: PESA 2015 Analyses
Community relations
47
Community relations
Direct Costs analysis
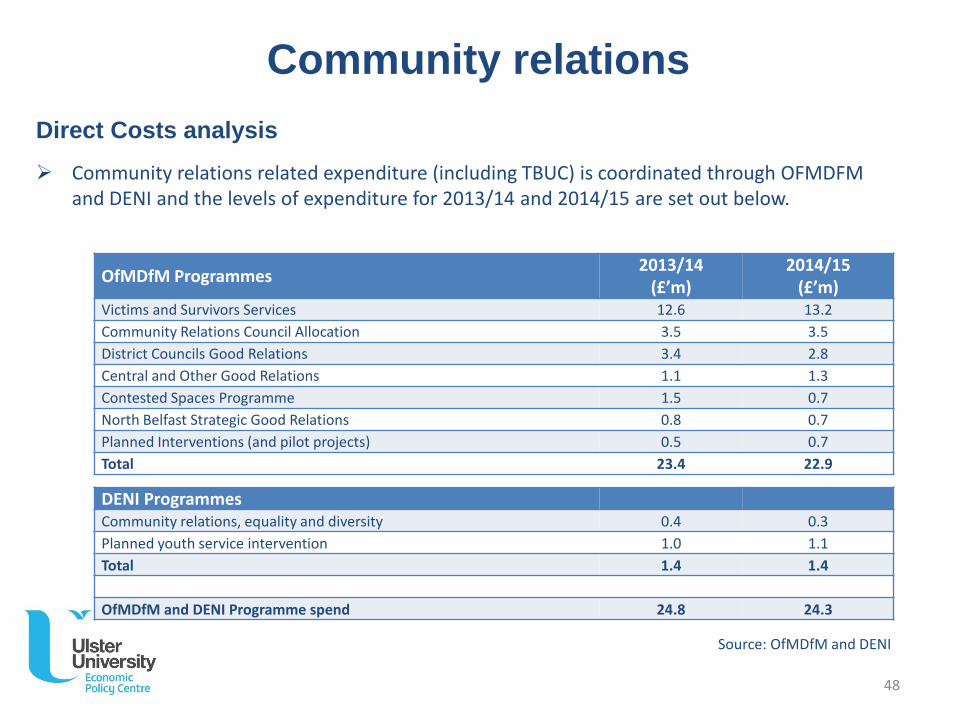
Community relations related expenditure (including TBUC) is coordinated through OFMDFM and DENI and the levels of expenditure for 2013/14 and 2014/15 are set out below.
OfMDfM Programmes2013/14
(£’m)2014/15
(£’m)Victims and Survivors Services 12.6 13.2
Community Relations Council Allocation 3.5 3.5
District Councils Good Relations 3.4 2.8
Central and Other Good Relations 1.1 1.3
Contested Spaces Programme 1.5 0.7
North Belfast Strategic Good Relations 0.8 0.7
Planned Interventions (and pilot projects) 0.5 0.7
Total 23.4 22.9
DENI ProgrammesCommunity relations, equality and diversity 0.4 0.3
Planned youth service intervention 1.0 1.1
Total 1.4 1.4
OfMDfM and DENI Programme spend 24.8 24.3
Source: OfMDfM and DENI
48
Community relations
Summary
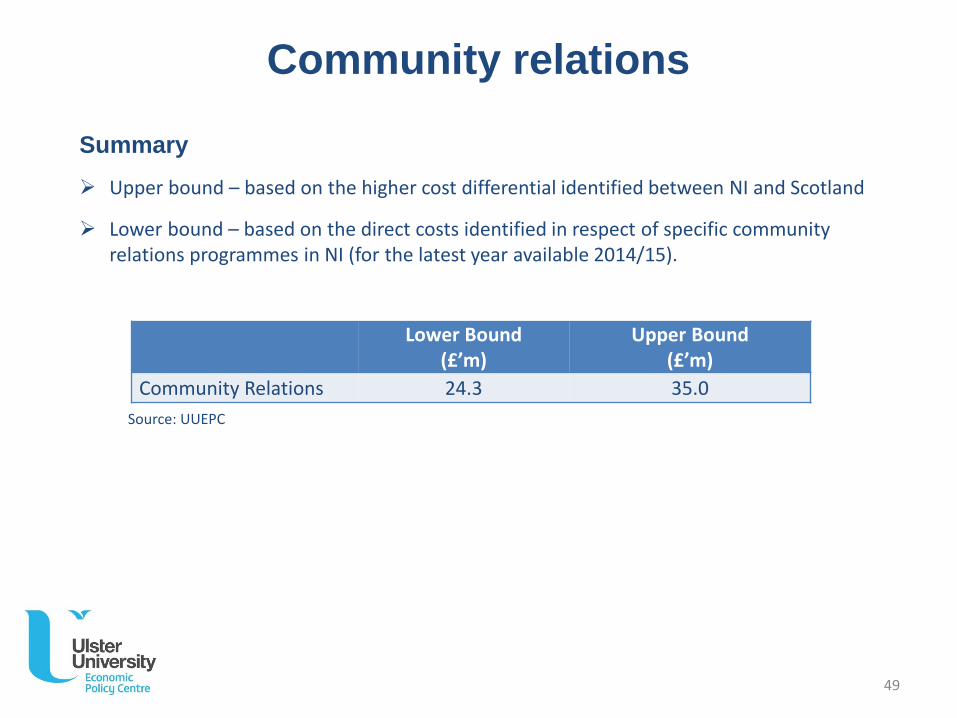
Upper bound – based on the higher cost differential identified between NI and Scotland
Lower bound – based on the direct costs identified in respect of specific community relations programmes in NI (for the latest year available 2014/15).
Lower Bound(£’m)
Upper Bound(£’m)
Community Relations 24.3 35.0
Source: UUEPC
49

ulster.ac.uk
Housing
Housing
Introduction
The public cost of housing in a divided society is a complex issue and gave rise to the creation of the NI Housing Executive assuming control of public housing from local authorities.
Assessing Cost of Division
Given the significantly greater prevalence of housing associations in the provision of social housing in other parts of the UK, a regional benchmarking analysis would not provide a like for like comparison. However the following specific programmes relate to costs which are more closely linked with societal division in housing:
• SPED (Special Purchase of Evacuated Dwellings) Programme
• Homelessness due to civil unrest
• Void properties
• Interface normalisation costs
51
Housing
SPED (Special Purchase of Evacuated Dwellings) Programme
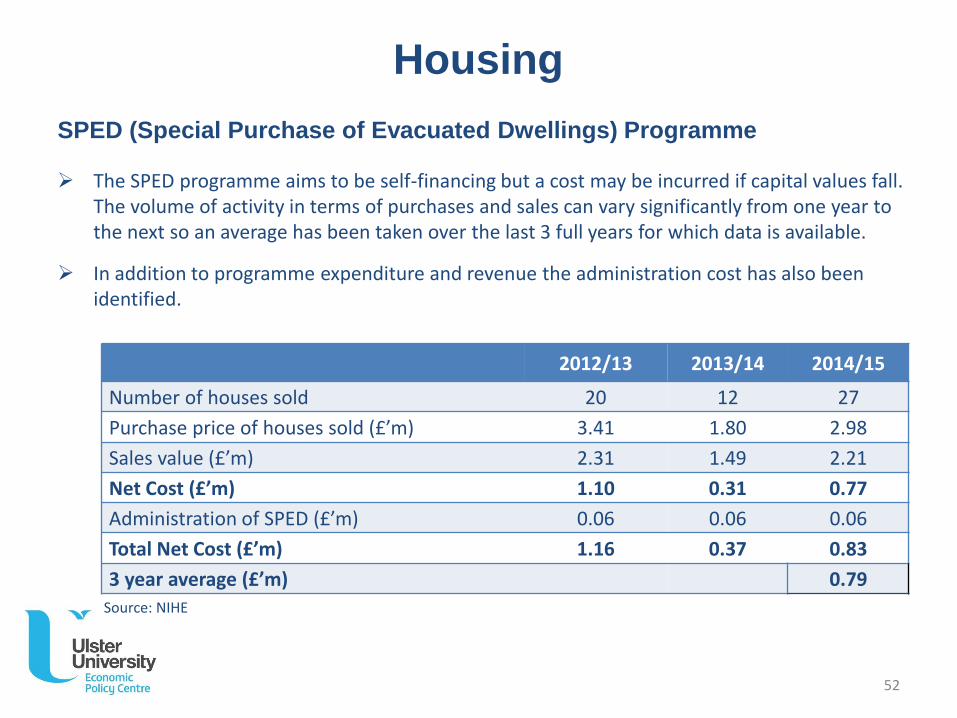
The SPED programme aims to be self-financing but a cost may be incurred if capital values fall. The volume of activity in terms of purchases and sales can vary significantly from one year to the next so an average has been taken over the last 3 full years for which data is available.
In addition to programme expenditure and revenue the administration cost has also been identified.
2012/13 2013/14 2014/15
Number of houses sold 20 12 27
Purchase price of houses sold (£’m) 3.41 1.80 2.98
Sales value (£’m) 2.31 1.49 2.21
Net Cost (£’m) 1.10 0.31 0.77
Administration of SPED (£’m) 0.06 0.06 0.06
Total Net Cost (£’m) 1.16 0.37 0.83
3 year average (£’m) 0.79
Source: NIHE
52
Housing
Void properties
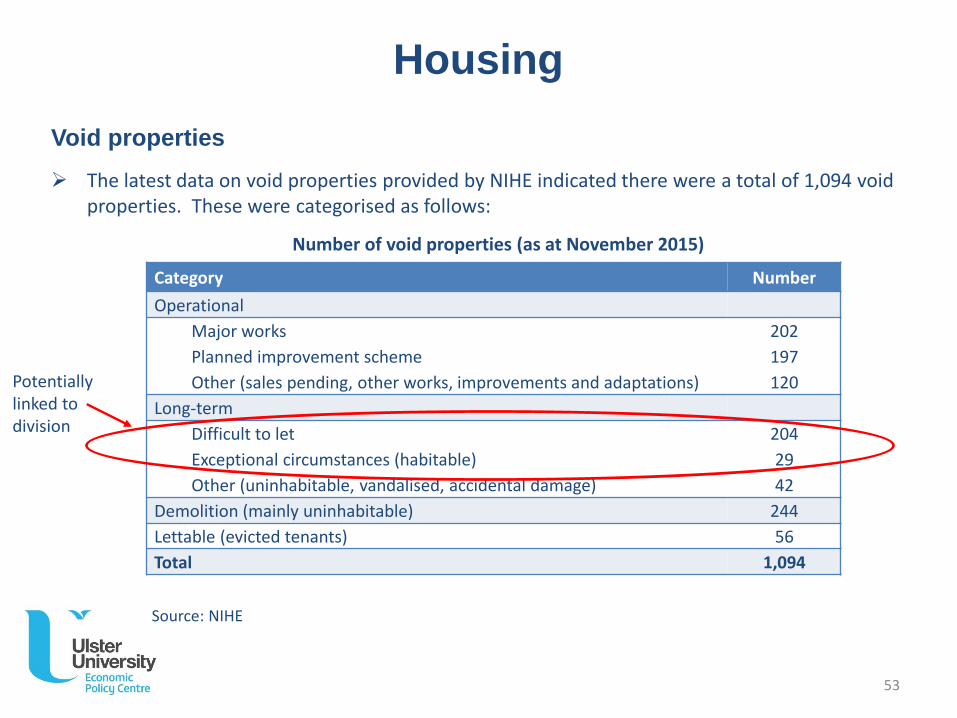
The latest data on void properties provided by NIHE indicated there were a total of 1,094 void properties. These were categorised as follows:
Category Number
Operational
Major works
Planned improvement scheme
Other (sales pending, other works, improvements and adaptations)
202
197
120
Long-term
Difficult to let
Exceptional circumstances (habitable)
Other (uninhabitable, vandalised, accidental damage)
204
29
42
Demolition (mainly uninhabitable) 244
Lettable (evicted tenants) 56
Total 1,094
Source: NIHE
Number of void properties (as at November 2015)
Potentially linked to division
53
Housing
Void properties (contd.)
The majority of these properties are void for reasons other than division. However, on the basis that supply and demand for public housing could be more easily managed if NI was not a divided society, a sub-set of the long-term voids could potentially be linked to division. In particular, this could refer to those which are categorised as difficult to let and are habitable but void for exceptional circumstances (totals 233 properties).
The opportunity cost of the rental income lost in respect of those 233 properties is calculated on the average monthly rent of £553. On this basis, the rental income lost is approx £1.5m p.a. and this is the estimated upper bound cost.
Source: Ulster University “Northern Ireland Quarterly House Price Index, Q3 2015”54
Housing
Homelessness
Base 2 – a crisis intervention project which provides support and mediation services to individuals/ families at risk of violence or exclusion from their communities. Base 2 homelessness funding totalled £101k in 2014/15.
Interface normalisation costs
The NI Housing Executive spent £102k in 2014/15 on ‘normalising’ interface areas.
55
Housing
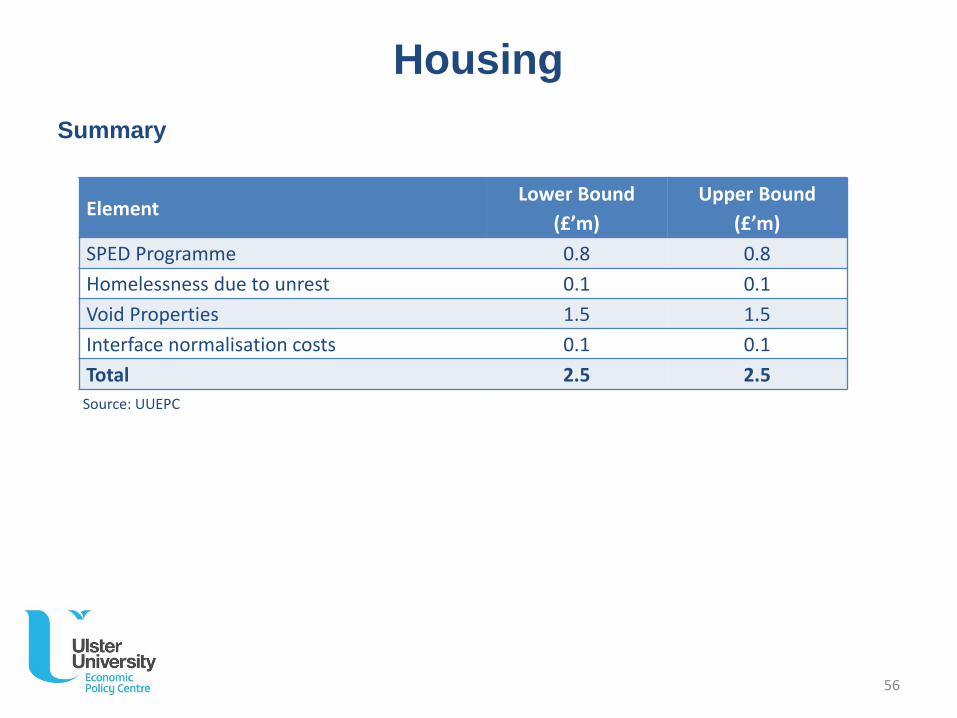
Summary
ElementLower Bound
(£’m)
Upper Bound
(£’m)
SPED Programme 0.8 0.8
Homelessness due to unrest 0.1 0.1
Void Properties 1.5 1.5
Interface normalisation costs 0.1 0.1
Total 2.5 2.5
Source: UUEPC
56

ulster.ac.uk
Transport
Transport
Introduction
The additional cost of delivering public transport services in a divided society is considered in this section. Consideration is given to both a benchmarking of costs across the UK regions as well as identifying a number of specific costs closely associated with division.
Benchmarking analysis – not appropriate for NI
A benchmarking of costs was considered but it was concluded that a comparison on a like-for-like basis would be difficult for a number of reasons:
• Public transport policy differs significantly across the UK, with the private sector responsible for the operation of significant elements of both rail and bus services in GB.
• As identified by the NIAO(1), public transport in NI remains relatively underfunded compared to GB. This reflects the greater allocation of funding on the maintenance needs of the NI road network, “NI has twice as many road kilometres per head than the rest of the UK”, and a less extensive rail network.
1. “DRD: the effectiveness of public transport in Northern Ireland”, NIAO, April 201558
Transport
Assessing Cost of Division – Direct Costs
The following specific costs are deemed to be closely linked with societal division:
• Additional security on buses – including CCTV, cab screens and “anti-bandit glass”
• Bus substitution costs – bus substitution services provided during security alerts on the railway network
• Buses destroyed during civil disturbances
• Damage to roads/ traffic lights etc. as a result of bonfires
• Cost of delays due to security alerts on the rail network
59
Transport
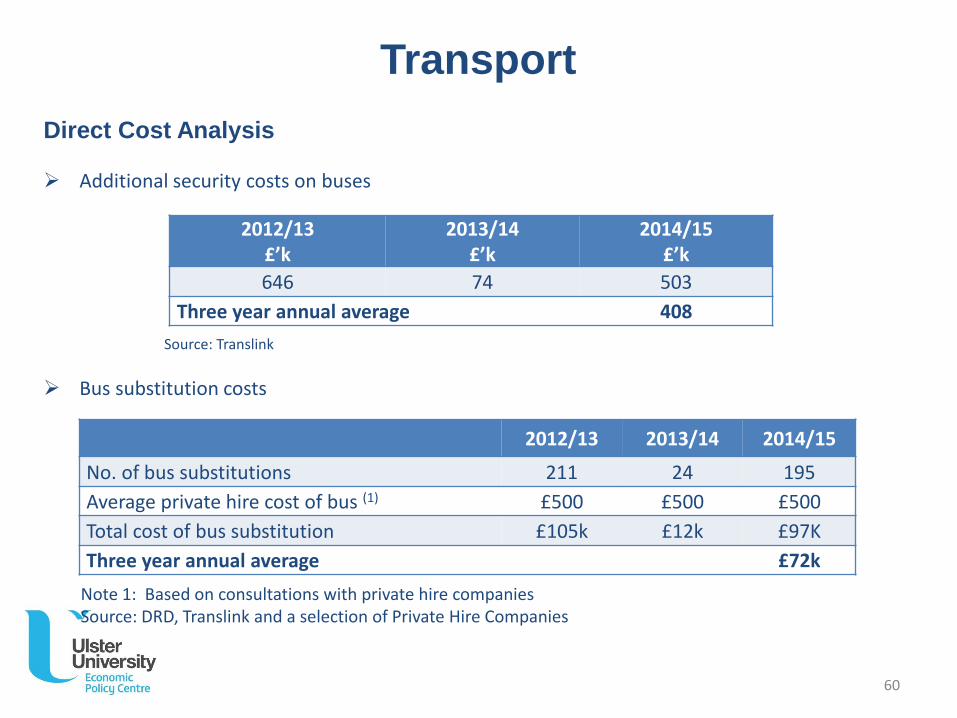
Direct Cost Analysis
Additional security costs on buses
Bus substitution costs
Note 1: Based on consultations with private hire companiesSource: DRD, Translink and a selection of Private Hire Companies
2012/13£’k
2013/14£’k
2014/15£’k
646 74 503
Three year annual average 408
2012/13 2013/14 2014/15
No. of bus substitutions 211 24 195
Average private hire cost of bus (1) £500 £500 £500
Total cost of bus substitution £105k £12k £97K
Three year annual average £72k
Source: Translink
60
Transport
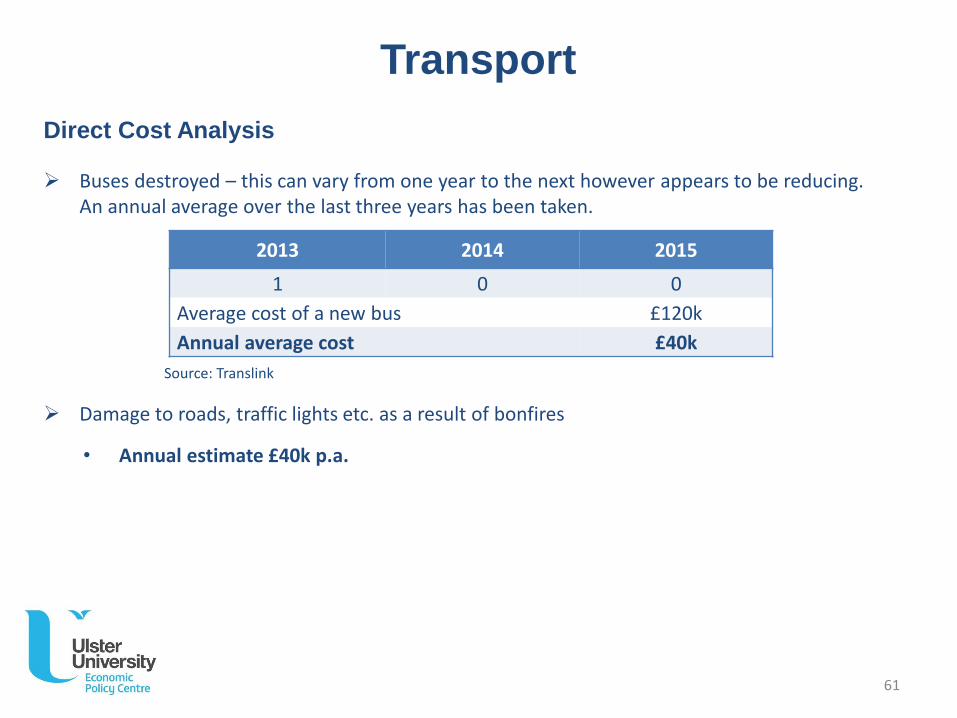
Direct Cost Analysis
Buses destroyed – this can vary from one year to the next however appears to be reducing. An annual average over the last three years has been taken.
Damage to roads, traffic lights etc. as a result of bonfires
• Annual estimate £40k p.a.
2013 2014 2015
1 0 0
Average cost of a new bus £120k
Annual average cost £40k
Source: Translink
61
Transport
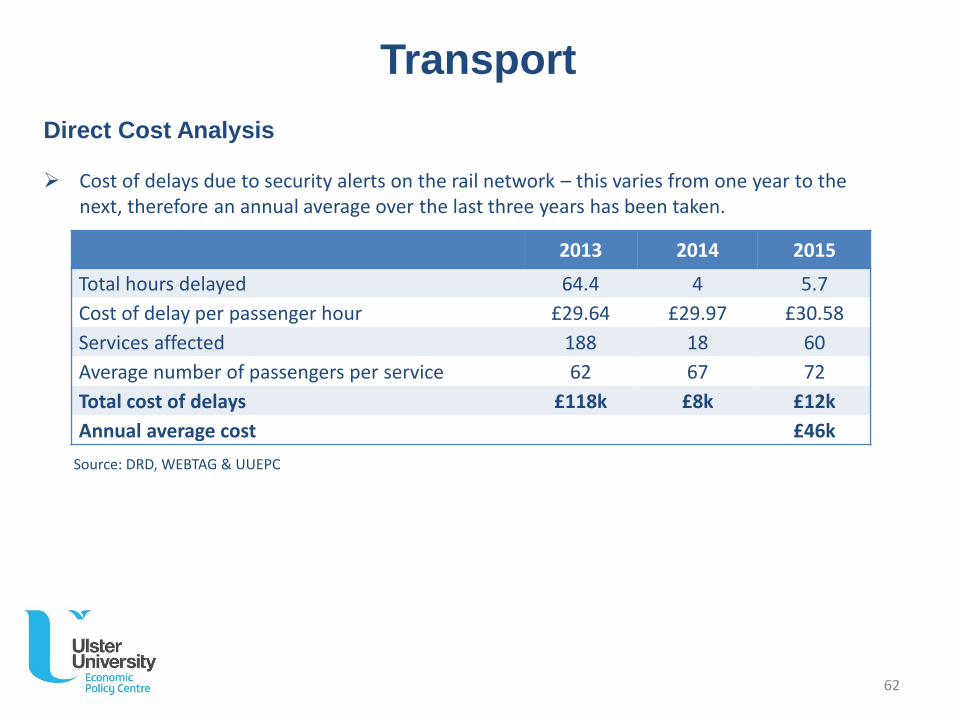
Direct Cost Analysis
Cost of delays due to security alerts on the rail network – this varies from one year to the next, therefore an annual average over the last three years has been taken.
2013 2014 2015
Total hours delayed 64.4 4 5.7
Cost of delay per passenger hour £29.64 £29.97 £30.58
Services affected 188 18 60
Average number of passengers per service 62 67 72
Total cost of delays £118k £8k £12k
Annual average cost £46k
Source: DRD, WEBTAG & UUEPC
62
Transport
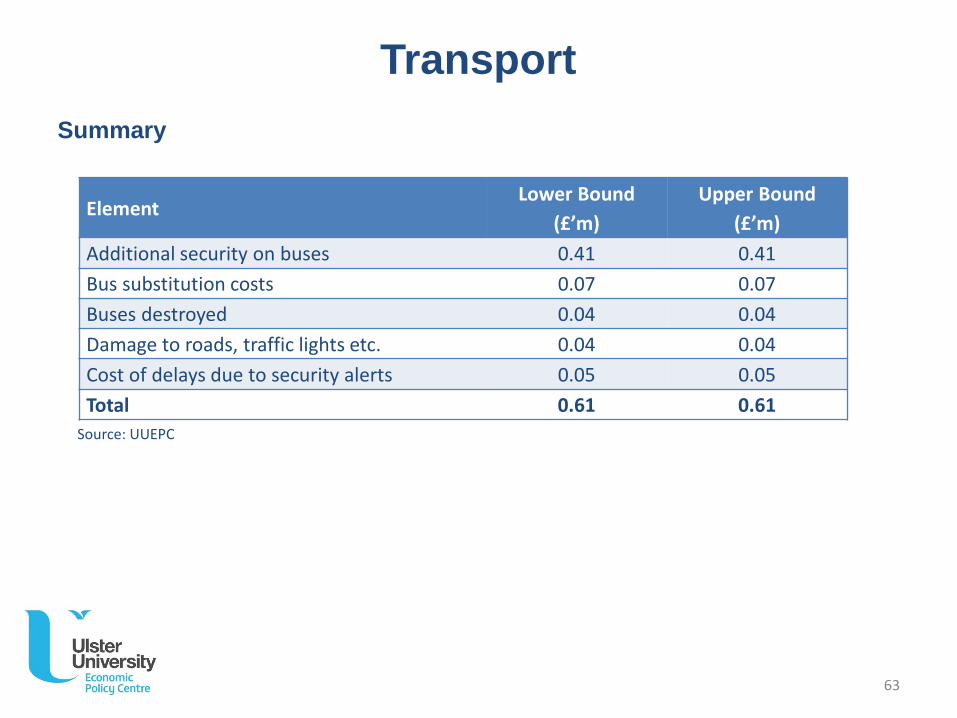
Summary
ElementLower Bound
(£’m)
Upper Bound
(£’m)
Additional security on buses 0.41 0.41
Bus substitution costs 0.07 0.07
Buses destroyed 0.04 0.04
Damage to roads, traffic lights etc. 0.04 0.04
Cost of delays due to security alerts 0.05 0.05
Total 0.61 0.61
Source: UUEPC
63
ulster.ac.uk
Sports and Leisure Provision
Sports and Leisure Provision
Introduction
Analysis is undertaken to determine the extent to which division is creating an increased cost base for the delivery of public sports and leisure services in NI.
Assessing Cost of Division
There is at least a perception of duplication of public leisure provision in NI caused by division, therefore this section includes a benchmarking analysis of both the level of provision of leisure centres and also per capita expenditure on Recreation and Sporting Services across the 12 UK regions. The analysis shows that:
• NI has a similar level of provision as Scotland and Wales (as determined by the per capita number of leisure centres) and this is greater than across the rest of the UK;
• NI and Scotland spend similar amounts on recreation and sport (on a per capita basis) but this is significantly higher than the rest of the UK, including Wales.
65
Sports and Leisure Provision
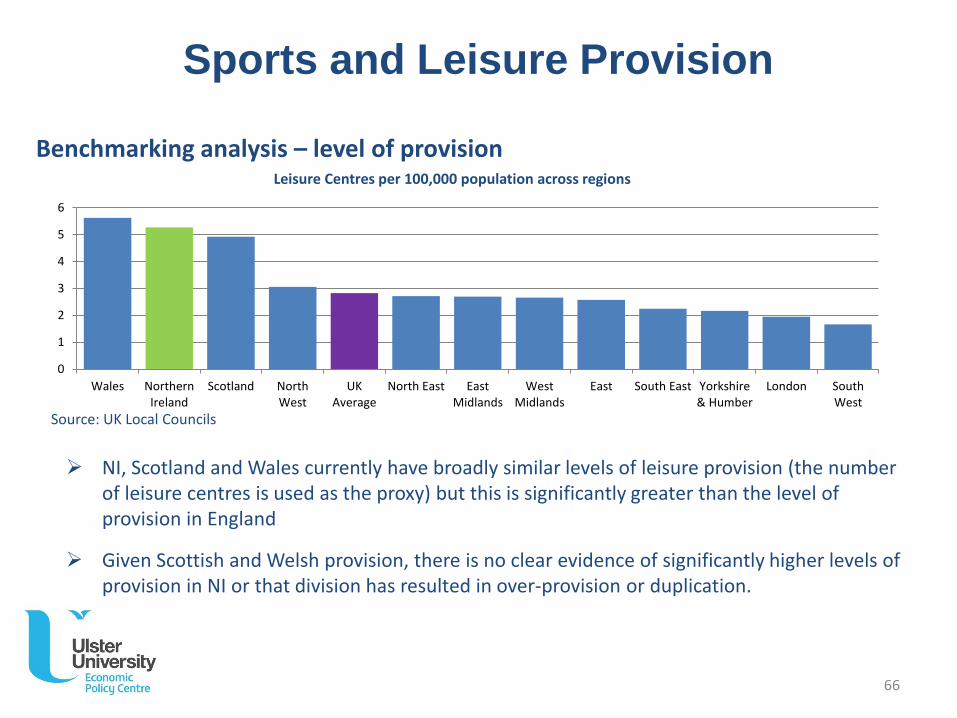
NI, Scotland and Wales currently have broadly similar levels of leisure provision (the number of leisure centres is used as the proxy) but this is significantly greater than the level of provision in England
Given Scottish and Welsh provision, there is no clear evidence of significantly higher levels of provision in NI or that division has resulted in over-provision or duplication.
Benchmarking analysis – level of provisionLeisure Centres per 100,000 population across regions
Source: UK Local Councils
0
1
2
3
4
5
6
Wales NorthernIreland
Scotland NorthWest
UKAverage
North East EastMidlands
WestMidlands
East South East Yorkshire& Humber
London SouthWest
66
Sports and Leisure Provision
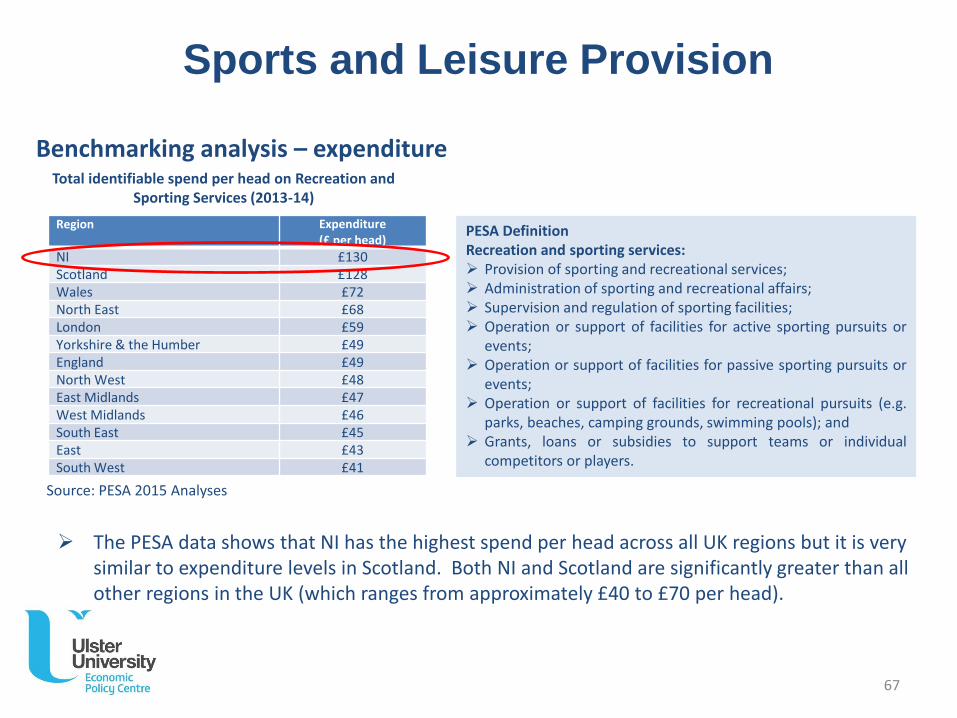
The PESA data shows that NI has the highest spend per head across all UK regions but it is very similar to expenditure levels in Scotland. Both NI and Scotland are significantly greater than all other regions in the UK (which ranges from approximately £40 to £70 per head).
Benchmarking analysis – expenditureTotal identifiable spend per head on Recreation and
Sporting Services (2013-14)
Region Expenditure(£ per head)
NI £130Scotland £128Wales £72North East £68London £59Yorkshire & the Humber £49England £49North West £48East Midlands £47West Midlands £46South East £45East £43South West £41
Source: PESA 2015 Analyses
PESA DefinitionRecreation and sporting services: Provision of sporting and recreational services; Administration of sporting and recreational affairs; Supervision and regulation of sporting facilities; Operation or support of facilities for active sporting pursuits or
events; Operation or support of facilities for passive sporting pursuits or
events; Operation or support of facilities for recreational pursuits (e.g.
parks, beaches, camping grounds, swimming pools); and Grants, loans or subsidies to support teams or individual
competitors or players.
67
Sports and Leisure Provision
Identifying cost of division
The following factors are considered in terms of identifying a potential cost of division:
• Policy choices in Scotland and Wales have resulted in similar levels of provision as in NI and whilst spending on sporting provision in NI is the highest in the UK, it is similar to spending in Scotland.
• Quantity versus quality – this analysis focuses solely on quantity rather than quality of provision
• Rurality – an important driver for the level of leisure centre provision across NI, Scotland and Wales could be the issue of rurality. Given the higher population density in England, the catchment area for individual leisure centres would be higher than in NI, Scotland and Wales.
The level of spending and provision in NI is high by UK standards and whilst it is not conclusive that this is as a result of division, there is significant potential that overprovision may exist and that policy decisions were influenced by division.
• Lower bound – cost differential between NI and Scotland
• Upper bound – cost differential between NI and Wales
68
Sports and Leisure Provision
Identifying cost of division
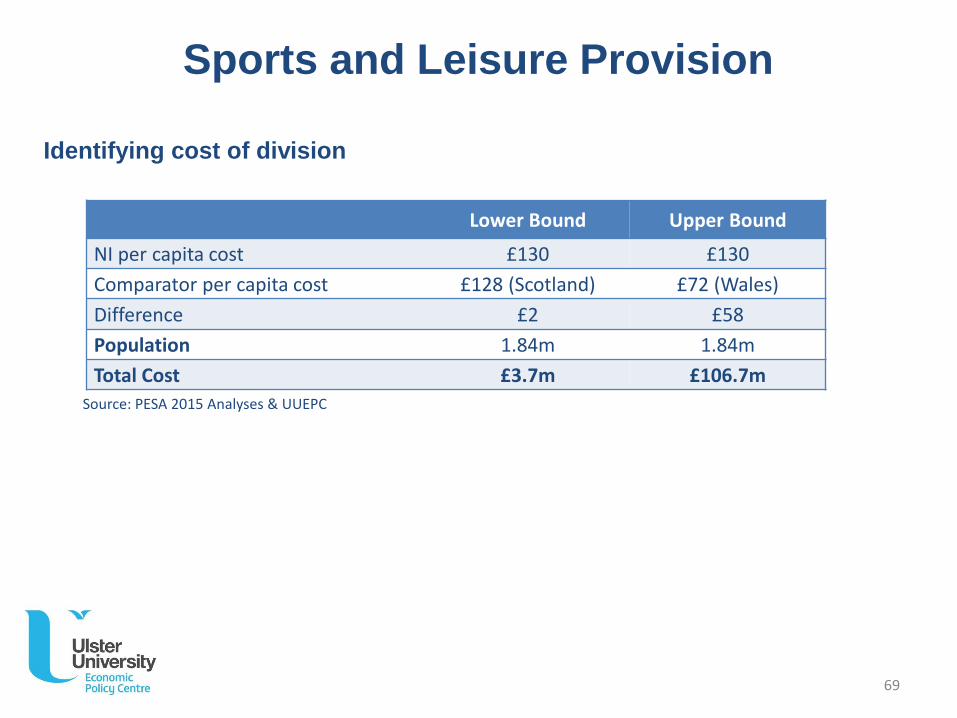
Lower Bound Upper Bound
NI per capita cost £130 £130
Comparator per capita cost £128 (Scotland) £72 (Wales)
Difference £2 £58
Population 1.84m 1.84m
Total Cost £3.7m £106.7m
Source: PESA 2015 Analyses & UUEPC
69
ulster.ac.uk
Agriculture
Agriculture
During the course of this research, anecdotal evidence has suggested that division is having a number of negative consequences, particularly in border areas. Reluctance to sell has prevented the development of a more efficient agriculture sector.
Deloitte included Agriculture in their research and concluded that there was no quantifiable evidence of the cost of division in this area.
The UUEPC acknowledge the anecdotal evidence but quantifiable data to support the “reluctance to sell” argument has not been identified. As a result, the UUEPC concurs with the Deloitte findings.
71

ulster.ac.uk
Governance
Governance
Introduction
Analysis is undertaken to determine the extent to which division is creating an increased cost of governance at the political level in NI.
Assessing Cost of Division
This section includes a benchmarking analysis of the number of politicians at local authority, assembly and parliamentary level.
Where over-provision is identified a typical cost is estimated.
Analysis is also undertaken to consider the impact of division on the number of Central Government Departments in NI.
73
Governance
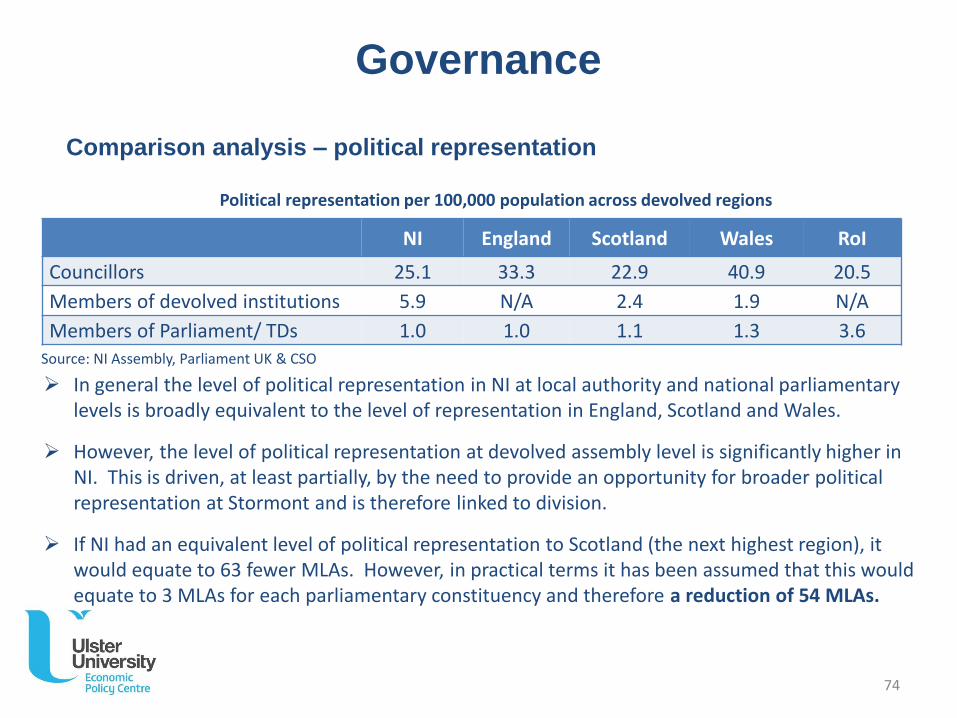
Comparison analysis – political representation
NI England Scotland Wales RoI
Councillors 25.1 33.3 22.9 40.9 20.5
Members of devolved institutions 5.9 N/A 2.4 1.9 N/A
Members of Parliament/ TDs 1.0 1.0 1.1 1.3 3.6
Political representation per 100,000 population across devolved regions
In general the level of political representation in NI at local authority and national parliamentary levels is broadly equivalent to the level of representation in England, Scotland and Wales.
However, the level of political representation at devolved assembly level is significantly higher in NI. This is driven, at least partially, by the need to provide an opportunity for broader political representation at Stormont and is therefore linked to division.
If NI had an equivalent level of political representation to Scotland (the next highest region), it would equate to 63 fewer MLAs. However, in practical terms it has been assumed that this would equate to 3 MLAs for each parliamentary constituency and therefore a reduction of 54 MLAs.
Source: NI Assembly, Parliament UK & CSO
74
Governance
Benchmarking analysis – additional Government Departments
Under Direct Rule, Central Government was organised into 6 Departments, which then increased to 12 following the establishment of the NI Assembly. This change in structure was at least partly driven by political considerations and the need for broader political representation at the NI Executive level.
There is no evidence to suggest that 6 Departments represents the optimum, but the proposed reduction to 9 Departments reflects a move towards the “normalisation” of political structures. It is therefore proposed that the cost associated with 3 additional departments are division related.
Whilst the functions of the 3 “additional” departments will be transferred rather than abolished only a small proportion of division related costs are identified. These relate specifically to the cost of the private offices which are no longer required.
No assumptions have been made on the potential level of operational efficiencies which could be achieved from a reduction in Government Departments.
75
Governance
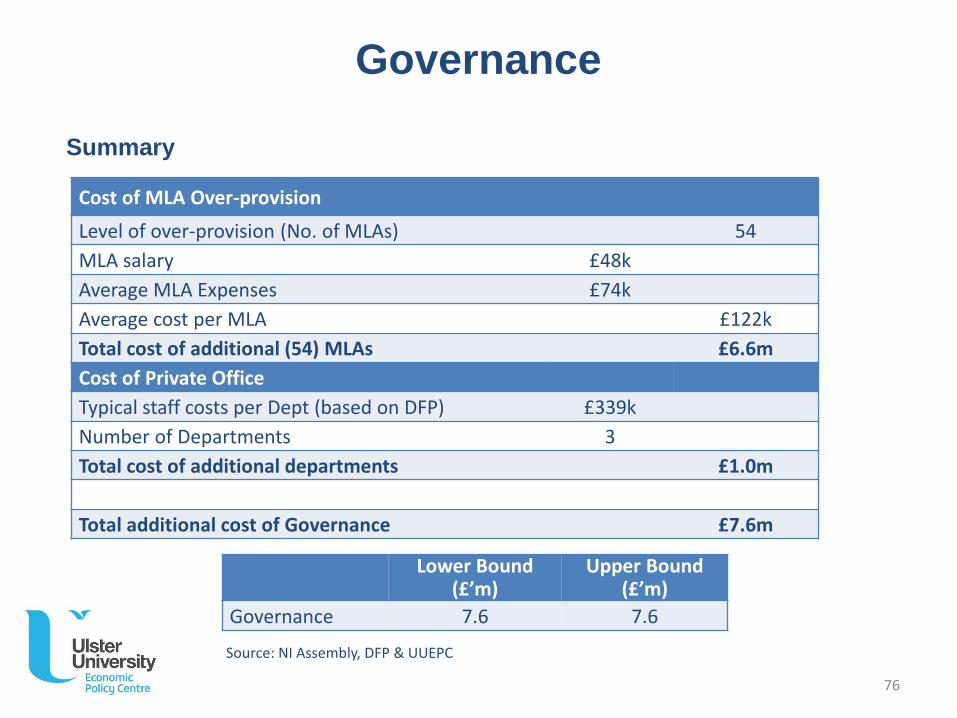
Summary
Cost of MLA Over-provision
Level of over-provision (No. of MLAs) 54
MLA salary £48k
Average MLA Expenses £74k
Average cost per MLA £122k
Total cost of additional (54) MLAs £6.6m
Cost of Private Office
Typical staff costs per Dept (based on DFP) £339k
Number of Departments 3
Total cost of additional departments £1.0m
Total additional cost of Governance £7.6m
Lower Bound(£’m)
Upper Bound(£’m)
Governance 7.6 7.6
Source: NI Assembly, DFP & UUEPC
76

ulster.ac.uk
Lost economic opportunity
Lost economic opportunity
Benchmarking NI economic performance across other UK regions and RoI shows relatively poor economic performance:
• Lower employment rates, lower productivity and higher numbers with low/ no skills;
• But when compared against other similar post-industrialised regions (in particular Wales and the North East of England) economic performance is broadly similar.
A comparative analysis of the NI economy with Wales, the North East of England and the RoIis summarised across the areas of: GVA; Employment; Skills; Investment; Tourism; and Innovation and enterprise.
The approach to identifying the lost economic opportunity is based on estimating the improvement required in the NI economy in order to achieve a similar economic performance to the following comparator regions:
• North East of England
• Wales
• UK average
• Republic of Ireland
Introduction
78
Lost economic opportunity
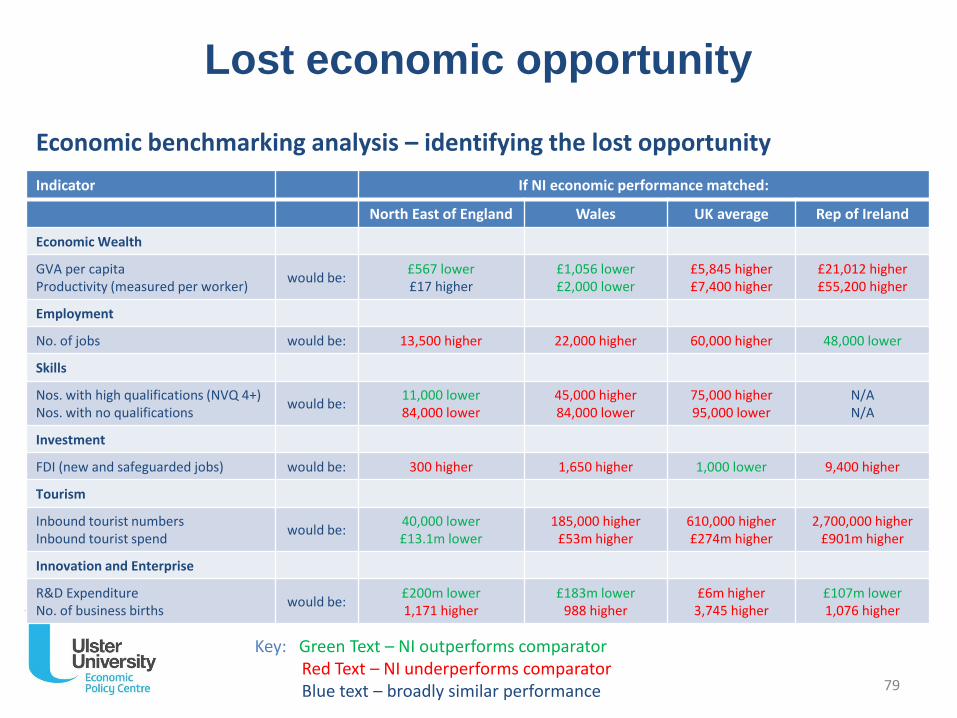
Economic benchmarking analysis – identifying the lost opportunity
Indicator If NI economic performance matched:
North East of England Wales UK average Rep of Ireland
Economic Wealth
GVA per capitaProductivity (measured per worker)
would be:£567 lower£17 higher
£1,056 lower£2,000 lower
£5,845 higher£7,400 higher
£21,012 higher£55,200 higher
Employment
No. of jobs would be: 13,500 higher 22,000 higher 60,000 higher 48,000 lower
Skills
Nos. with high qualifications (NVQ 4+)Nos. with no qualifications
would be:11,000 lower84,000 lower
45,000 higher84,000 lower
75,000 higher 95,000 lower
N/AN/A
Investment
FDI (new and safeguarded jobs) would be: 300 higher 1,650 higher 1,000 lower 9,400 higher
Tourism
Inbound tourist numbersInbound tourist spend
would be:40,000 lower£13.1m lower
185,000 higher£53m higher
610,000 higher£274m higher
2,700,000 higher£901m higher
Innovation and Enterprise
R&D ExpenditureNo. of business births
would be:£200m lower1,171 higher
£183m lower988 higher
£6m higher3,745 higher
£107m lower1,076 higher
Key: Green Text – NI outperforms comparatorRed Text – NI underperforms comparatorBlue text – broadly similar performance 79
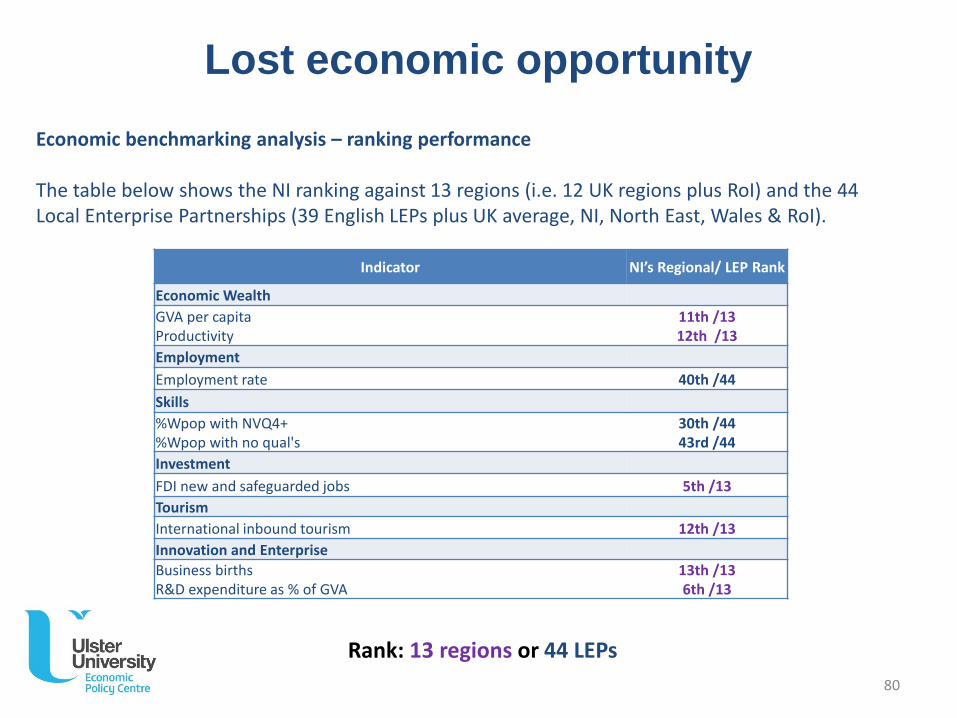
Indicator NI’s Regional/ LEP Rank
Economic Wealth
GVA per capitaProductivity
11th /1312th /13
Employment
Employment rate 40th /44
Skills
%Wpop with NVQ4+%Wpop with no qual's
30th /44 43rd /44
Investment
FDI new and safeguarded jobs 5th /13
Tourism
International inbound tourism 12th /13
Innovation and Enterprise
Business birthsR&D expenditure as % of GVA
13th /136th /13
Rank: 13 regions or 44 LEPs
Lost economic opportunity
Economic benchmarking analysis – ranking performance
The table below shows the NI ranking against 13 regions (i.e. 12 UK regions plus RoI) and the 44 Local Enterprise Partnerships (39 English LEPs plus UK average, NI, North East, Wales & RoI).
80
Lost economic opportunity
Economic benchmarking analysis – comments on the lost opportunity
NI economic performance tends to be in the bottom quartile of the UK regions along with the North East of England and Wales. However, performance is relatively strong in some areas (such as higher level qualifications, FDI and R&D expenditure).
Importantly, economic performance in NI does not significantly lag behind all other regions. Therefore a number of other factors must also impact economic performance, and these include:
• challenges faced in transitioning to a post-industrialised economy;
• large rural/ agricultural economies (which provide lower value added employment); and
• the run down of ‘traditional’ industry (e.g. mining in Wales and ship building in NI and North East of England.)
It is recognised that the scale of impact of these other factors may differ across regions. For example, the reason for lower levels of productivity in Wales could primarily be due to the run down of the mining industry, but in NI the impact of division may be the dominant factor. Only a detailed economic regional comparative analysis could provide more clarity on this issue.
81
Lost economic opportunity
Economic benchmarking analysis – comments on the lost opportunity
The research also highlighted a number of potential lost economic opportunities but which have not been quantified due to a lack of available data. These include:
• The lost FDI opportunity in the period prior to 1998 – this research analyses the current level of FDI attracted to NI, however lower levels of FDI in the period prior to 1998, linked to civil disturbance, is likely to be a contributory factor to NI’s relatively small private sector. This legacy impact may be continuing albeit diminishing over time, but estimating that impact with reasonable robustness in the absence of detailed research (which is outside the scope of this project) is not possible;
• Lost tourism opportunity – this research highlights the potential impact on NI tourism if the sector was to achieve the level of performance witnessed in other UK regions and RoI. However, the extent to which NI still retains a negative external image and this is resulting in lower levels of tourism traffic, is very difficult to ascertain. Survey data can provide insight as to the reasons why visitors came to NI but it is much harder to understand the reasons why those who did not visit NI made that decision.
82
Additional funding to NI
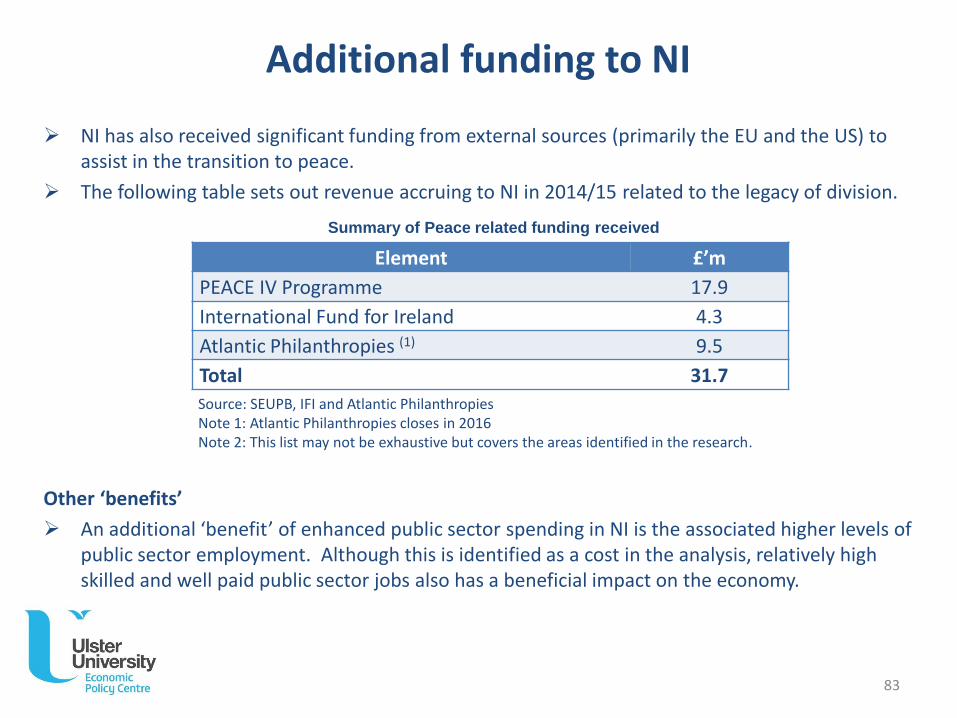
NI has also received significant funding from external sources (primarily the EU and the US) to assist in the transition to peace.
The following table sets out revenue accruing to NI in 2014/15 related to the legacy of division.
Other ‘benefits’
An additional ‘benefit’ of enhanced public sector spending in NI is the associated higher levels of public sector employment. Although this is identified as a cost in the analysis, relatively high skilled and well paid public sector jobs also has a beneficial impact on the economy.
Element £’m
PEACE IV Programme 17.9
International Fund for Ireland 4.3
Atlantic Philanthropies (1) 9.5
Total 31.7
Source: SEUPB, IFI and Atlantic PhilanthropiesNote 1: Atlantic Philanthropies closes in 2016Note 2: This list may not be exhaustive but covers the areas identified in the research.
Summary of Peace related funding received
83
ulster.ac.uk
Annex
Lost economic opportunity analyses

ulster.ac.uk
FDI
FDI New and Safeguarded Jobs
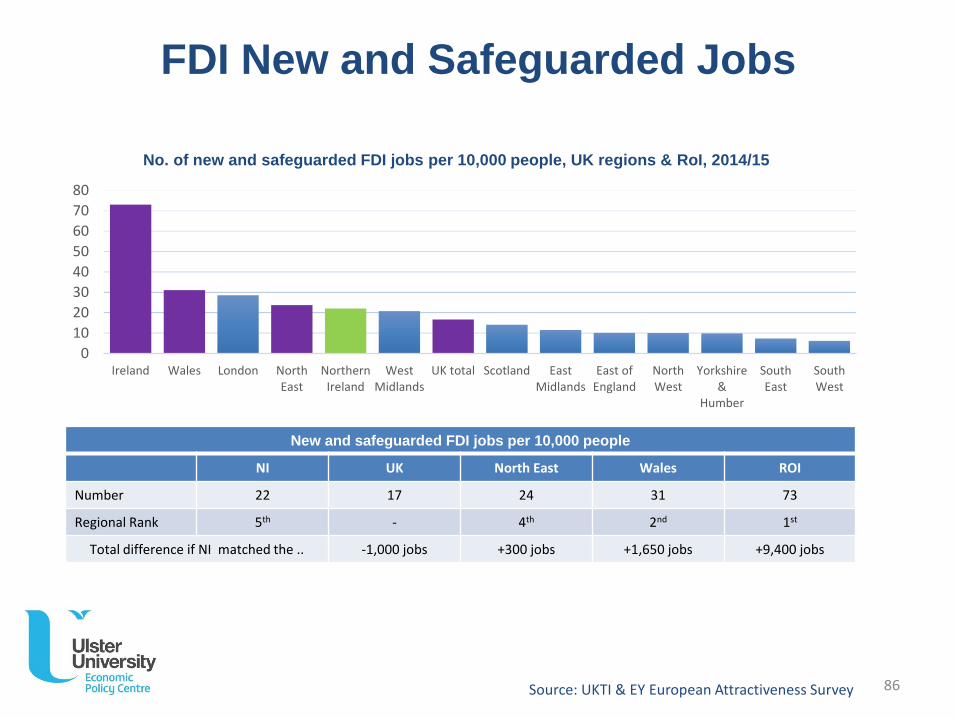
No. of new and safeguarded FDI jobs per 10,000 people, UK regions & RoI, 2014/15
New and safeguarded FDI jobs per 10,000 people
NI UK North East Wales ROI
Number 22 17 24 31 73
Regional Rank 5th - 4th 2nd 1st
Total difference if NI matched the .. -1,000 jobs +300 jobs +1,650 jobs +9,400 jobs
0
10
20
30
40
50
60
70
80
Ireland Wales London NorthEast
NorthernIreland
WestMidlands
UK total Scotland EastMidlands
East ofEngland
NorthWest
Yorkshire&
Humber
SouthEast
SouthWest
Source: UKTI & EY European Attractiveness Survey 86

ulster.ac.uk
Education
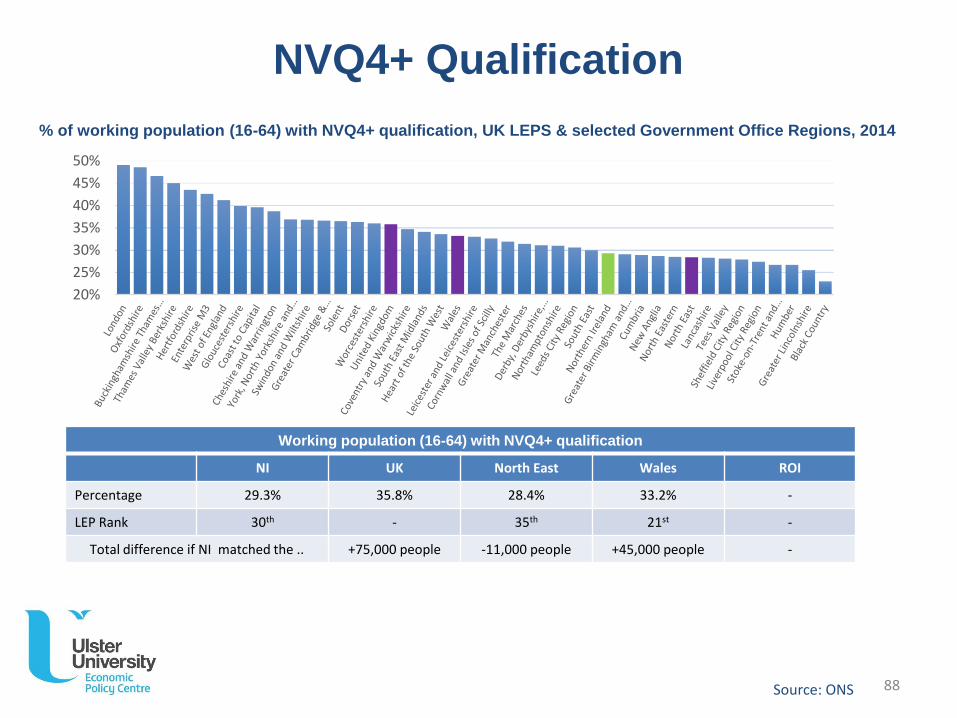
NVQ4+ Qualification
% of working population (16-64) with NVQ4+ qualification, UK LEPS & selected Government Office Regions, 2014
Working population (16-64) with NVQ4+ qualification
NI UK North East Wales ROI
Percentage 29.3% 35.8% 28.4% 33.2% -
LEP Rank 30th - 35th 21st -
Total difference if NI matched the .. +75,000 people -11,000 people +45,000 people -
20%
25%
30%
35%
40%
45%
50%
Source: ONS 88
4%
6%
8%
10%
12%
14%
16%
18%
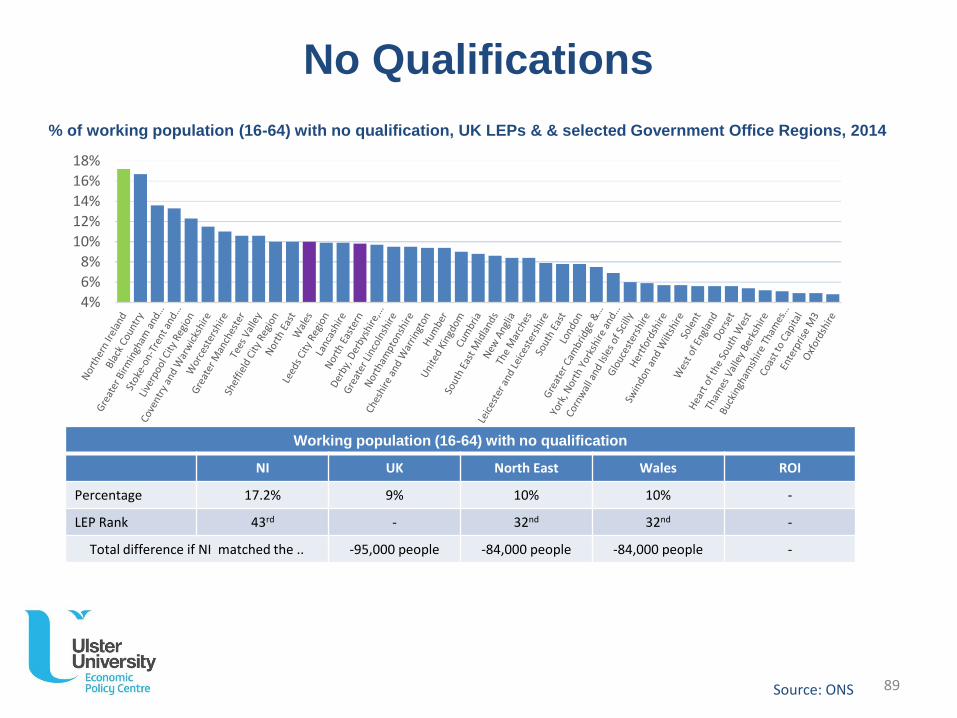
% of working population (16-64) with no qualification, UK LEPs & & selected Government Office Regions, 2014
No Qualifications
Working population (16-64) with no qualification
NI UK North East Wales ROI
Percentage 17.2% 9% 10% 10% -
LEP Rank 43rd - 32nd 32nd -
Total difference if NI matched the .. -95,000 people -84,000 people -84,000 people -
Source: ONS 89

ulster.ac.uk
Labour Market
60%62%64%66%68%70%72%74%76%78%80%
Source: ONS
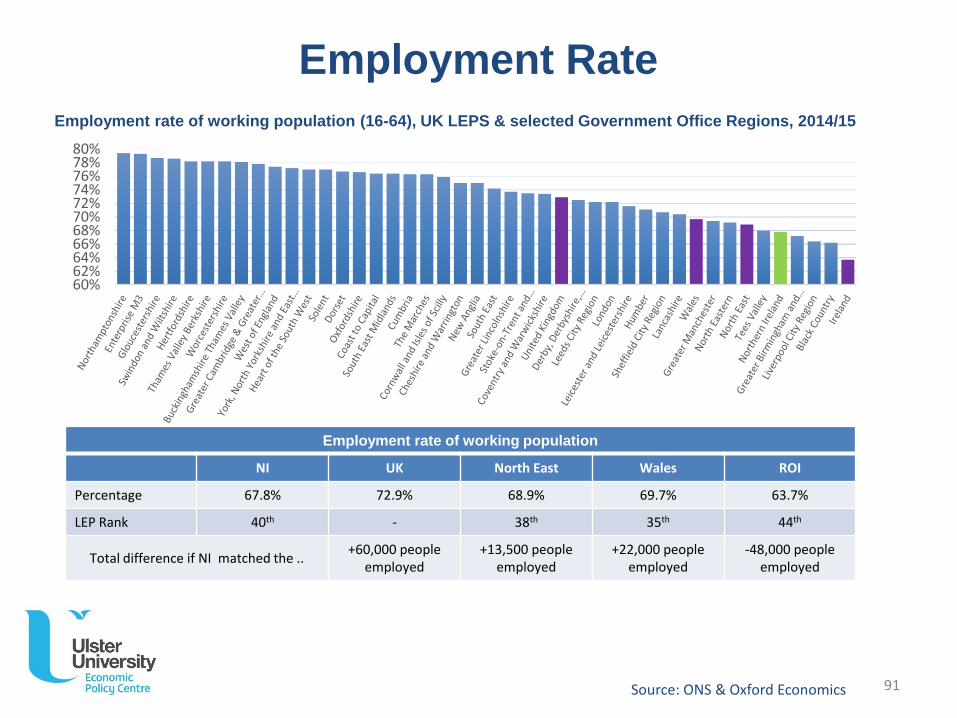
Employment rate of working population (16-64), UK LEPS & selected Government Office Regions, 2014/15
Employment Rate
Employment rate of working population
NI UK North East Wales ROI
Percentage 67.8% 72.9% 68.9% 69.7% 63.7%
LEP Rank 40th - 38th 35th 44th
Total difference if NI matched the ..+60,000 people
employed+13,500 people
employed+22,000 people
employed-48,000 people
employed
Source: ONS & Oxford Economics 91
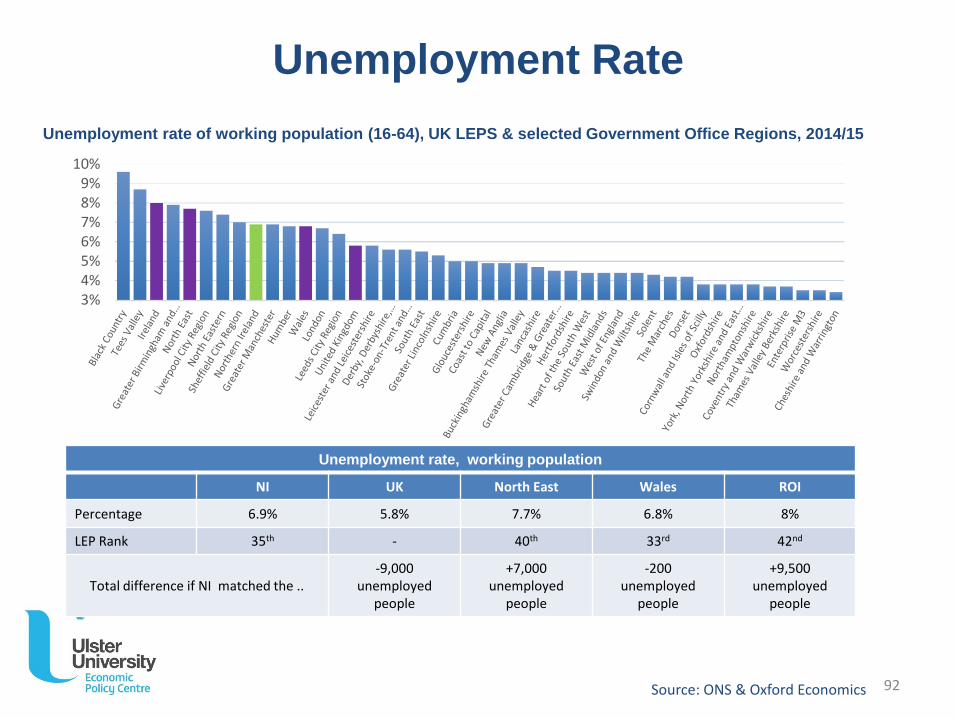
3%4%5%6%7%8%9%
10%
Unemployment rate of working population (16-64), UK LEPS & selected Government Office Regions, 2014/15
Unemployment rate, working population
NI UK North East Wales ROI
Percentage 6.9% 5.8% 7.7% 6.8% 8%
LEP Rank 35th - 40th 33rd 42nd
Total difference if NI matched the ..-9,000
unemployed people
+7,000 unemployed
people
-200 unemployed
people
+9,500unemployed
people
Unemployment Rate
Source: ONS & Oxford Economics 92
0.0%1.0%2.0%3.0%4.0%5.0%6.0%7.0%8.0%9.0%
10.0%
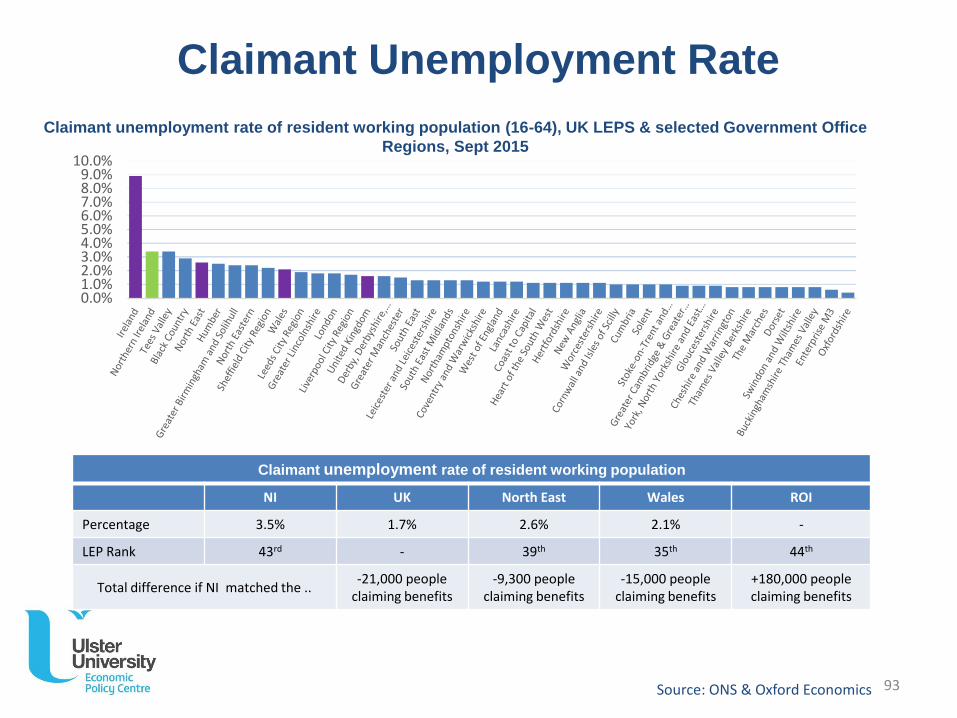
Claimant unemployment rate of resident working population (16-64), UK LEPS & selected Government Office
Regions, Sept 2015
Claimant Unemployment Rate
Claimant unemployment rate of resident working population
NI UK North East Wales ROI
Percentage 3.5% 1.7% 2.6% 2.1% -
LEP Rank 43rd - 39th 35th 44th
Total difference if NI matched the ..-21,000 people
claiming benefits-9,300 people
claiming benefits-15,000 people
claiming benefits+180,000 people claiming benefits
Source: ONS & Oxford Economics 93
£20,000
£30,000
£40,000
£50,000
£60,000
£70,000
£80,000
£90,000
£100,000
Ireland London SouthEast
UnitedKingdom
East Scotland SouthWest
NorthWest
WestMidlands
EastMidlands
Yorkshireand TheHumber
NorthEast
NorthernIreland
Wales
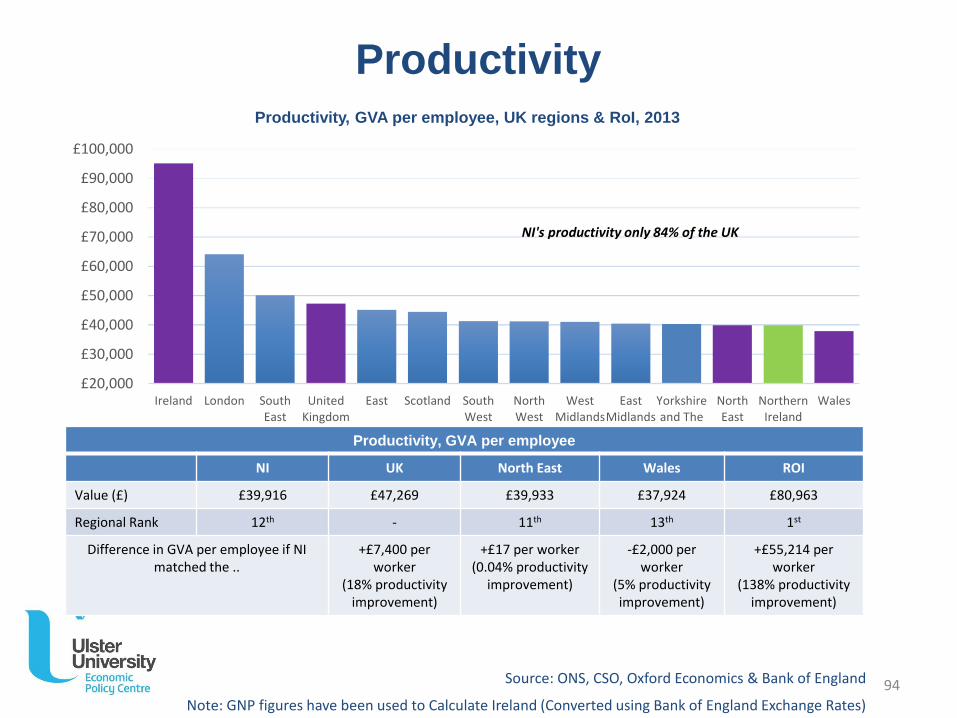
NI's productivity only 84% of the UK
Productivity, GVA per employee, UK regions & RoI, 2013
Productivity
Productivity, GVA per employee
NI UK North East Wales ROI
Value (£) £39,916 £47,269 £39,933 £37,924 £80,963
Regional Rank 12th - 11th 13th 1st
Difference in GVA per employee if NI matched the ..
+£7,400 per worker
(18% productivity improvement)
+£17 per worker(0.04% productivity
improvement)
-£2,000 per worker
(5% productivity improvement)
+£55,214 per worker
(138% productivity improvement)
Source: ONS, CSO, Oxford Economics & Bank of England
Note: GNP figures have been used to Calculate Ireland (Converted using Bank of England Exchange Rates)
94
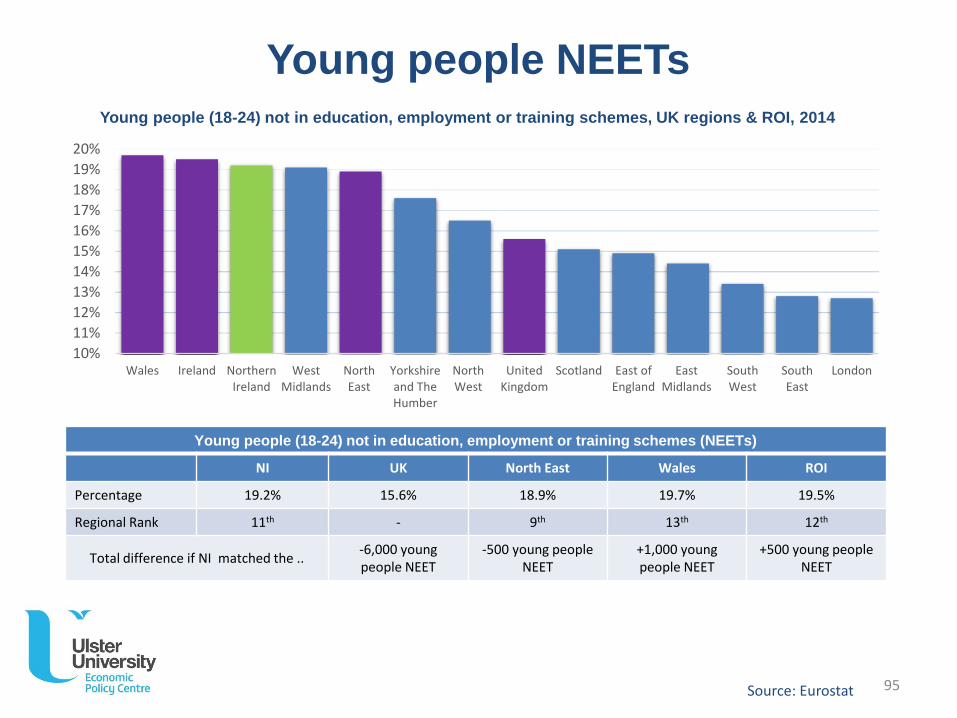
Young people NEETs
Young people (18-24) not in education, employment or training schemes (NEETs)
NI UK North East Wales ROI
Percentage 19.2% 15.6% 18.9% 19.7% 19.5%
Regional Rank 11th - 9th 13th 12th
Total difference if NI matched the ..-6,000 young people NEET
-500 young people NEET
+1,000 youngpeople NEET
+500 young people NEET
Young people (18-24) not in education, employment or training schemes, UK regions & ROI, 2014
10%
11%
12%
13%
14%
15%
16%
17%
18%
19%
20%
Wales Ireland NorthernIreland
WestMidlands
NorthEast
Yorkshireand TheHumber
NorthWest
UnitedKingdom
Scotland East ofEngland
EastMidlands
SouthWest
SouthEast
London
Source: Eurostat 95
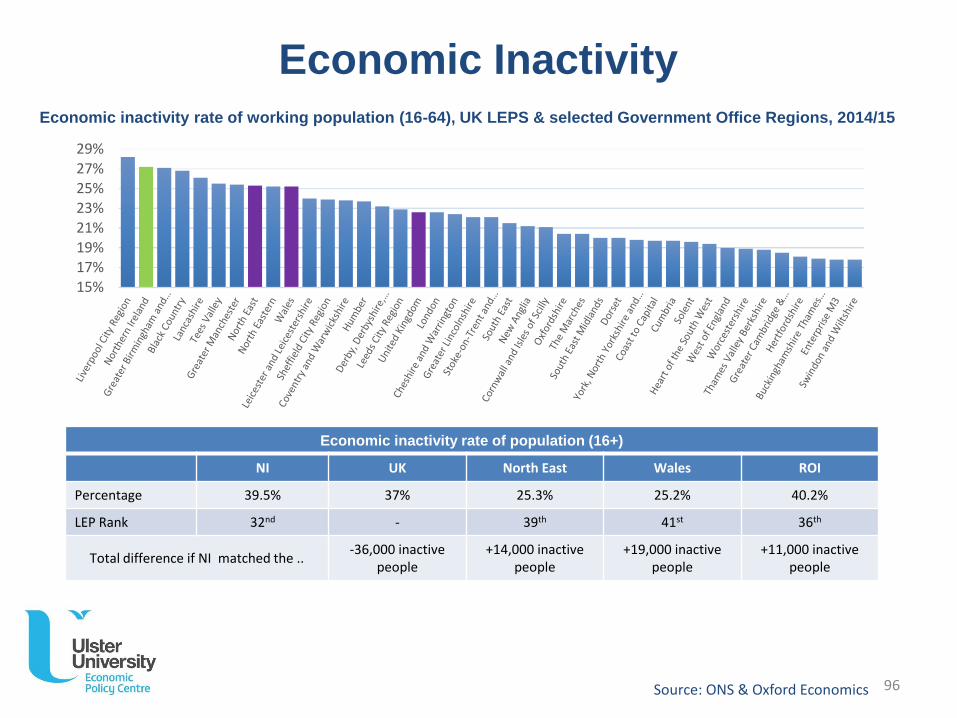
Economic Inactivity
Economic inactivity rate of population (16+)
NI UK North East Wales ROI
Percentage 39.5% 37% 25.3% 25.2% 40.2%
LEP Rank 32nd - 39th 41st 36th
Total difference if NI matched the ..-36,000 inactive
people+14,000 inactive
people+19,000 inactive
people+11,000 inactive
people
Economic inactivity rate of working population (16-64), UK LEPS & selected Government Office Regions, 2014/15
15%17%19%21%23%25%27%29%
Source: ONS & Oxford Economics 96

ulster.ac.uk
Business Environment
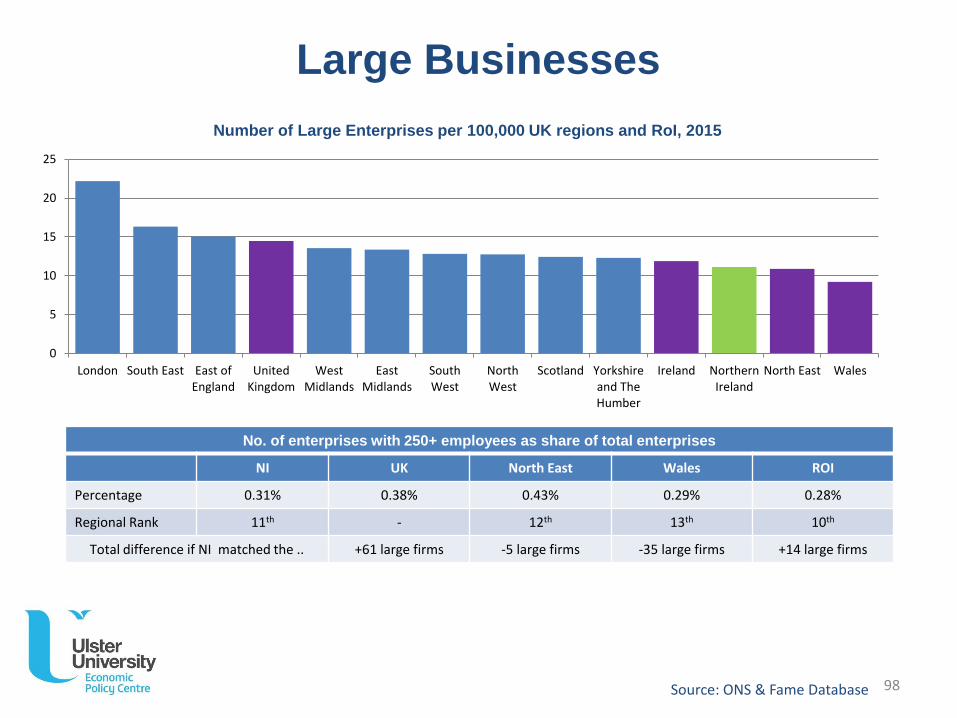
Number of Large Enterprises per 100,000 UK regions and RoI, 2015
Large Businesses
No. of enterprises with 250+ employees as share of total enterprises
NI UK North East Wales ROI
Percentage 0.31% 0.38% 0.43% 0.29% 0.28%
Regional Rank 11th - 12th 13th 10th
Total difference if NI matched the .. +61 large firms -5 large firms -35 large firms +14 large firms
0
5
10
15
20
25
London South East East ofEngland
UnitedKingdom
WestMidlands
EastMidlands
SouthWest
NorthWest
Scotland Yorkshireand TheHumber
Ireland NorthernIreland
North East Wales
Source: ONS & Fame Database 98
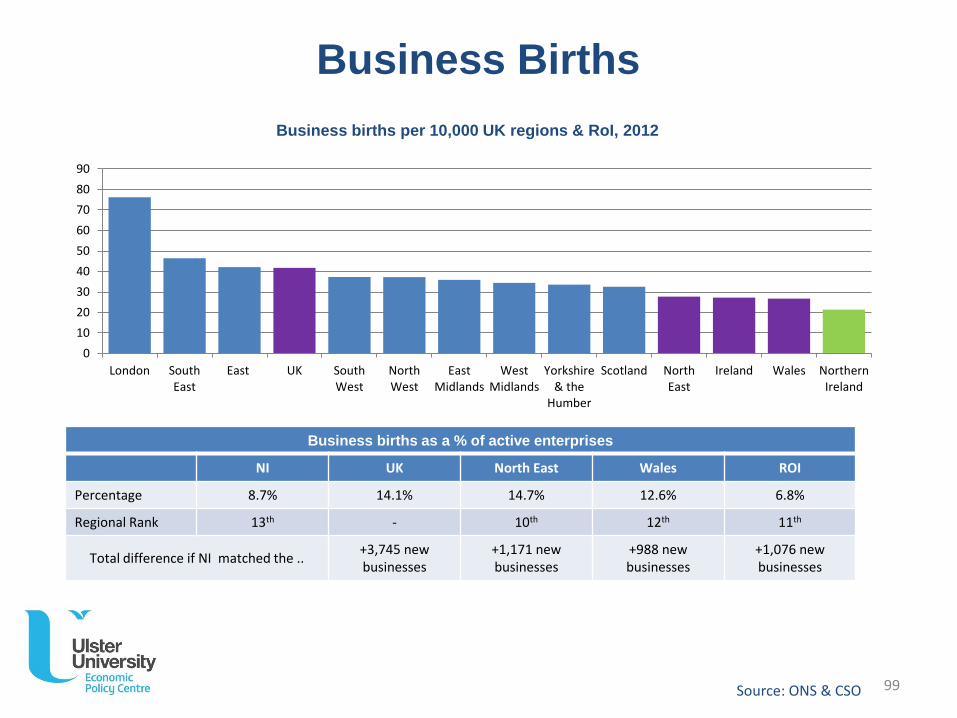
Business births per 10,000 UK regions & RoI, 2012
Business Births
Business births as a % of active enterprises
NI UK North East Wales ROI
Percentage 8.7% 14.1% 14.7% 12.6% 6.8%
Regional Rank 13th - 10th 12th 11th
Total difference if NI matched the ..+3,745 new businesses
+1,171 new businesses
+988 new businesses
+1,076 new businesses
0
10
20
30
40
50
60
70
80
90
London SouthEast
East UK SouthWest
NorthWest
EastMidlands
WestMidlands
Yorkshire& the
Humber
Scotland NorthEast
Ireland Wales NorthernIreland
Source: ONS & CSO 99
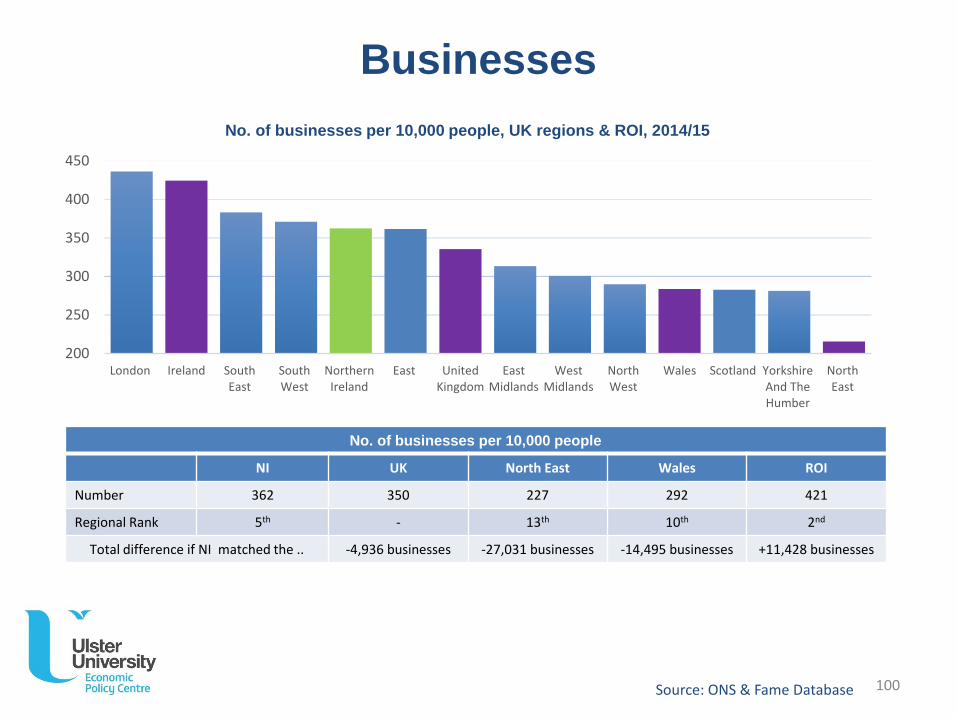
No. of businesses per 10,000 people, UK regions & ROI, 2014/15
No. of businesses per 10,000 people
NI UK North East Wales ROI
Number 362 350 227 292 421
Regional Rank 5th - 13th 10th 2nd
Total difference if NI matched the .. -4,936 businesses -27,031 businesses -14,495 businesses +11,428 businesses
Businesses
200
250
300
350
400
450
London Ireland SouthEast
SouthWest
NorthernIreland
East UnitedKingdom
EastMidlands
WestMidlands
NorthWest
Wales Scotland YorkshireAnd TheHumber
NorthEast
Source: ONS & Fame Database 100
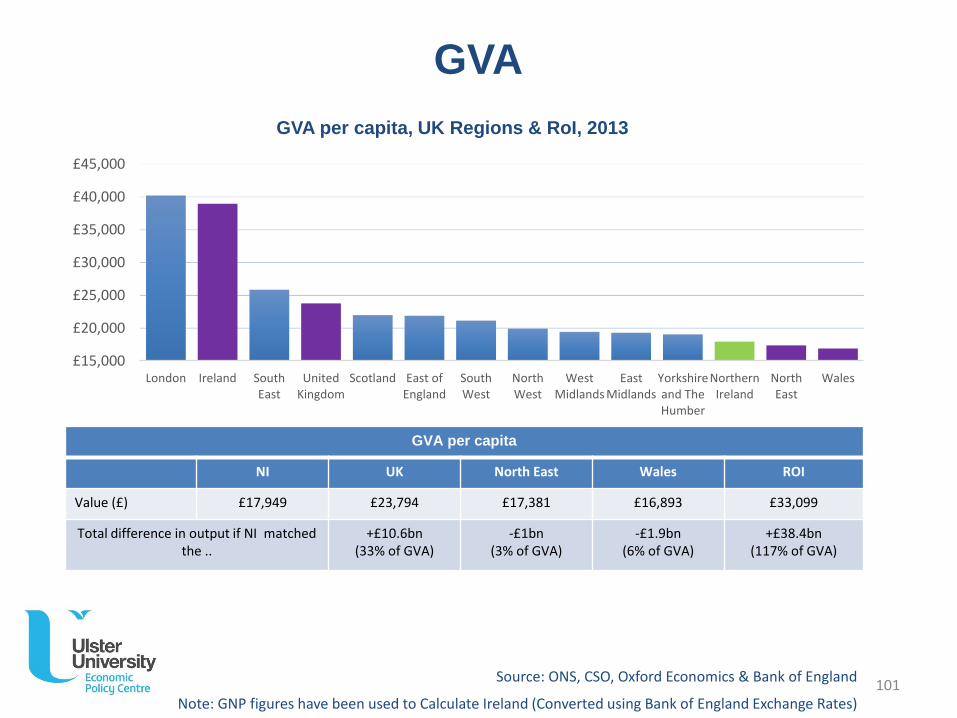
GVA
GVA per capita, UK Regions & RoI, 2013
GVA per capita
NI UK North East Wales ROI
Value (£) £17,949 £23,794 £17,381 £16,893 £33,099
Total difference in output if NI matched the ..
+£10.6bn (33% of GVA)
-£1bn(3% of GVA)
-£1.9bn(6% of GVA)
+£38.4bn(117% of GVA)
£15,000
£20,000
£25,000
£30,000
£35,000
£40,000
£45,000
London Ireland SouthEast
UnitedKingdom
Scotland East ofEngland
SouthWest
NorthWest
WestMidlands
EastMidlands
Yorkshireand TheHumber
NorthernIreland
NorthEast
Wales
Source: ONS, CSO, Oxford Economics & Bank of England
Note: GNP figures have been used to Calculate Ireland (Converted using Bank of England Exchange Rates)101
0
2
4
6
8
10
12
14
16
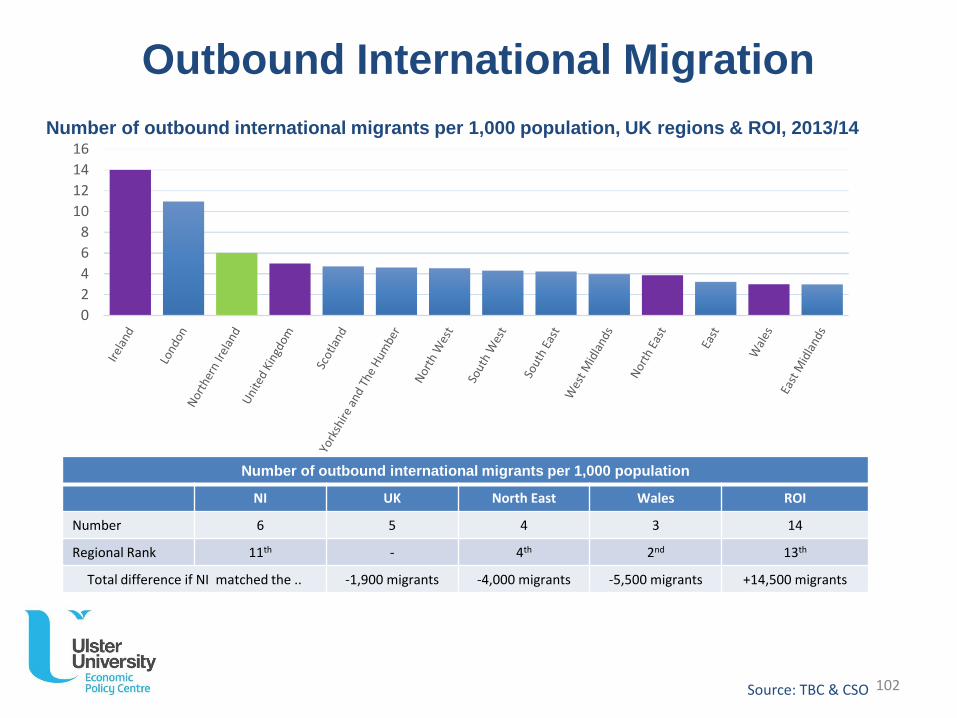
Outbound International Migration
Number of outbound international migrants per 1,000 population
NI UK North East Wales ROI
Number 6 5 4 3 14
Regional Rank 11th - 4th 2nd 13th
Total difference if NI matched the .. -1,900 migrants -4,000 migrants -5,500 migrants +14,500 migrants
Number of outbound international migrants per 1,000 population, UK regions & ROI, 2013/14
Source: TBC & CSO 102
0.0%
0.5%
1.0%
1.5%
2.0%
2.5%
3.0%
3.5%
4.0%
4.5%
East ofEngland
SouthEast
EastMidlands
SouthWest
UnitedKingdom
WestMidlands
NorthernIreland
NorthWest
Scotland Ireland Wales NorthEast
Yorkshireand TheHumber
London
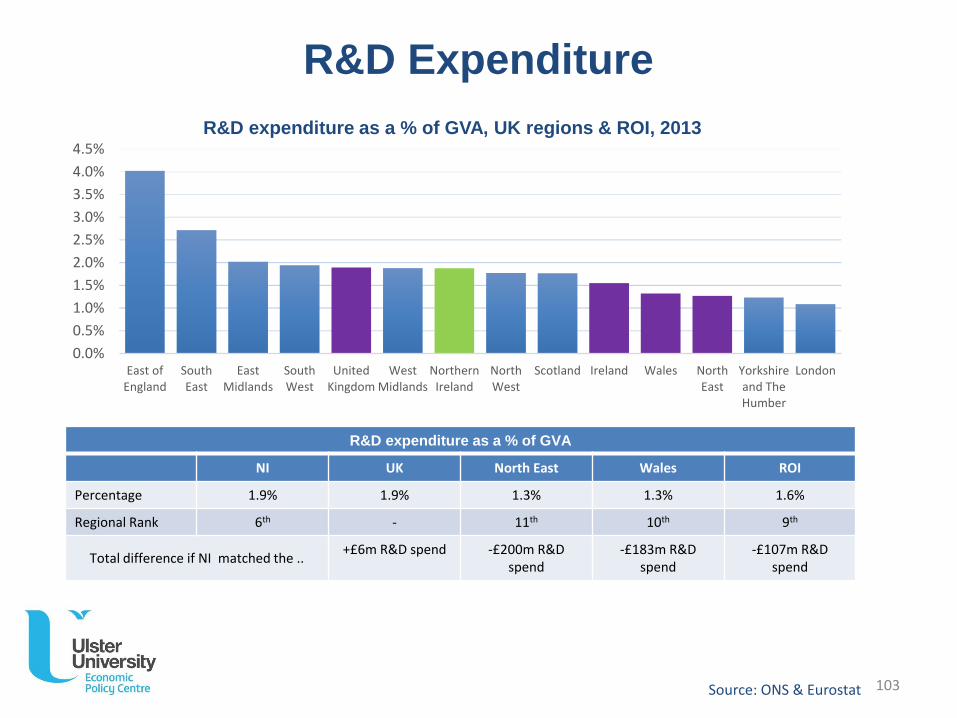
R&D Expenditure
R&D expenditure as a % of GVA
NI UK North East Wales ROI
Percentage 1.9% 1.9% 1.3% 1.3% 1.6%
Regional Rank 6th - 11th 10th 9th
Total difference if NI matched the ..+£6m R&D spend -£200m R&D
spend-£183m R&D
spend-£107m R&D
spend
R&D expenditure as a % of GVA, UK regions & ROI, 2013
Source: ONS & Eurostat 103

ulster.ac.uk
Tourism
0
500
1,000
1,500
2,000
2,500
London Ireland UK total SouthEast
Scotland SouthWest
NorthWest
East ofEngland
WestMidlands
UKaverage
exclLondon
Wales Yorkshire&
Humber
EastMidlands
NorthernIreland
NorthEast
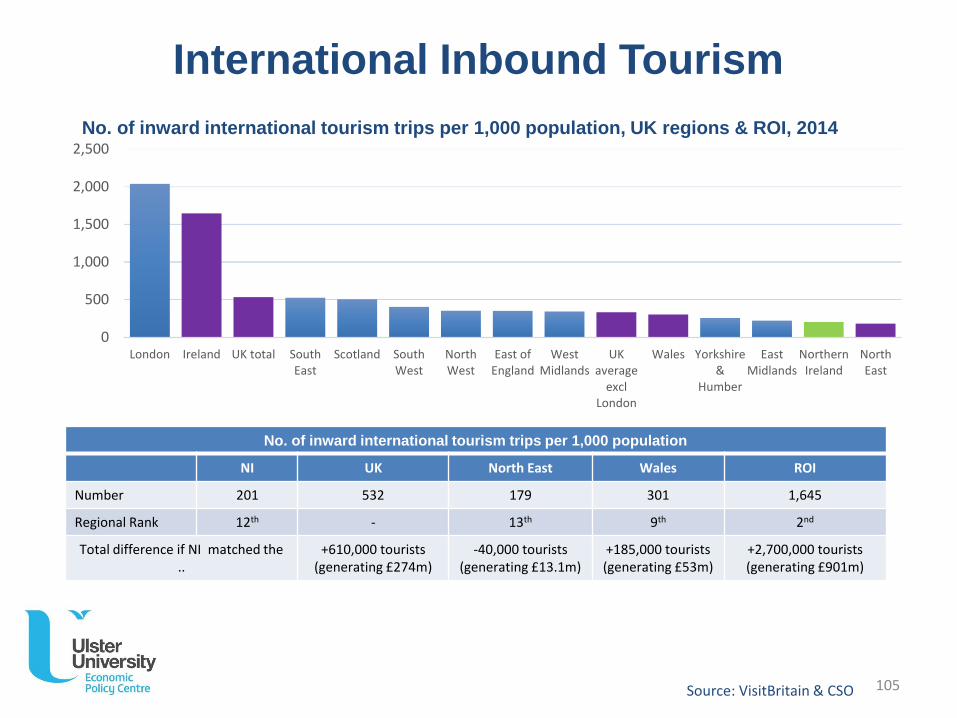
International Inbound Tourism
No. of inward international tourism trips per 1,000 population
NI UK North East Wales ROI
Number 201 532 179 301 1,645
Regional Rank 12th - 13th 9th 2nd
Total difference if NI matched the ..
+610,000 tourists(generating £274m)
-40,000 tourists(generating £13.1m)
+185,000 tourists(generating £53m)
+2,700,000 tourists(generating £901m)
No. of inward international tourism trips per 1,000 population, UK regions & ROI, 2014
Source: VisitBritain & CSO 105

ulster.ac.uk
END