Embed Size (px)
Citation preview
Atmos. Chem. Phys., 16, 2747–2764, 2016
www.atmos-chem-phys.net/16/2747/2016/
doi:10.5194/acp-16-2747-2016
© Author(s) 2016. CC Attribution 3.0 License.
Detailed budget analysis of HONO in central London reveals a
missing daytime source
J. D. Lee1,2, L. K. Whalley3,4, D. E. Heard3,4, D. Stone4, R. E. Dunmore2, J. F. Hamilton2, D. E. Young5,a, J. D. Allan5,6,
S. Laufs7, and J. Kleffmann7
1National Centre for Atmospheric Science, University of York, York, UK2Department of Chemistry, University of York, York, UK3National Centre for Atmospheric Science, University of Leeds, Leeds, UK4School of Chemistry, University of Leeds, Leeds, UK5School of Earth, Atmospheric and Environmental Sciences, University of Manchester, Oxford Road,
Manchester, M13 9PL, UK6National Centre for Atmospheric Science, University of Manchester, Oxford Road, Manchester, M13 9PL, UK7Physikalische und Theoretische Chemie/Fakultät Mathematik und Naturwissenschaften,
Bergische Universität Wuppertal (BUW), Gaußstr. 20, 42119 Wuppertal, Germanyanow at: Department of Environmental Toxicology, University of California, Davis, CA 95616, USA
Correspondence to: J. D. Lee ([email protected])
Received: 18 June 2015 – Published in Atmos. Chem. Phys. Discuss.: 18 August 2015
Revised: 14 January 2016 – Accepted: 23 February 2016 – Published: 4 March 2016
Abstract. Measurements of HONO were carried out at an ur-
ban background site near central London as part of the Clean
air for London (ClearfLo) project in summer 2012. Data were
collected from 22 July to 18 August 2014, with peak values
of up to 1.8 ppbV at night and non-zero values of between
0.2 and 0.6 ppbV seen during the day. A wide range of other
gas phase, aerosol, radiation, and meteorological measure-
ments were made concurrently at the same site, allowing a
detailed analysis of the chemistry to be carried out. The peak
HONO /NOx ratio of 0.04 is seen at ∼ 02:00 UTC, with the
presence of a second, daytime, peak in HONO /NOx of simi-
lar magnitude to the night-time peak, suggesting a significant
secondary daytime HONO source. A photostationary state
calculation of HONO involving formation from the reaction
of OH and NO and loss from photolysis, reaction with OH,
and dry deposition shows a significant underestimation dur-
ing the day, with calculated values being close to 0, compared
to the measurement average of 0.4 ppbV at midday. The addi-
tion of further HONO sources from the literature, including
dark conversion of NO2 on surfaces, direct emission, pho-
tolysis of ortho-substituted nitrophenols, the postulated for-
mation from the reaction of HO2×H2O with NO2, photoly-
sis of adsorbed HNO3 on ground and aerosols, and HONO
produced by photosensitized conversion of NO2 on the sur-
face increases the daytime modelled HONO to 0.1 ppbV, still
leaving a significant missing daytime source. The missing
HONO is plotted against a series of parameters including
NO2 and OH reactivity (used as a proxy for organic mate-
rial), with little correlation seen. Much better correlation is
observed with the product of these species with j (NO2), in
particular NO2 and the product of NO2 with OH reactivity.
This suggests the missing HONO source is in some way re-
lated to NO2 and also requires sunlight. Increasing the photo-
sensitized surface conversion rate of NO2 by a factor of 10 to
a mean daytime first-order loss of ∼ 6×10⁻⁵ s−1 (but which
varies as a function of j (NO2)) closes the daytime HONO
budget at all times (apart from the late afternoon), suggesting
that urban surfaces may enhance this photosensitized source.
The effect of the missing HONO to OH radical production is
also investigated and it is shown that the model needs to be
constrained to measured HONO in order to accurately repro-
duce the OH radical measurements.
Published by Copernicus Publications on behalf of the European Geosciences Union.
2748 J. D. Lee et al.: Detailed budget analysis of HONO in central London
1 Introduction
The hydroxyl radical (OH) is the main daytime oxidant in the
troposphere, playing a key role in the chemical transforma-
tions of trace species (Levy, 1971). A major source of OH,
especially in polluted environments, is the photolysis of ni-
trous acid (HONO) in the near UV region (Reaction R2). It
has been shown in numerous studies that HONO can actu-
ally be the dominant early morning source of OH (Ren et al.,
2003, 2006; Dusanter et al., 2009; Michoud et al., 2012) and
has often been shown to also be significant during the rest of
the day (Elshorbany et al., 2009; Hofzumahaus et al., 2009;
Villena et al., 2011; Michoud et al., 2014). This is mainly due
to unexpectedly high levels of HONO measured during day-
light hours when fast photolysis would have been expected to
keep concentrations low and hence insignificant for a source
of OH. As a result of these studies, it has become clear that
HONO has the ability to initiate and accelerate daytime pho-
tochemistry and hence knowledge of its formation and loss
are crucial to understanding tropospheric oxidation chem-
istry.
Typically, HONO in the troposphere would be expected
to be governed by formation by the reaction between nitric
oxide (NO) and OH (Reaction R2) and losses by photolysis
(Reaction R1) and oxidation by OH (Reaction R3).
HONO+hν→ OH+NO (λ<400 nm) (R1)
OH+NO+M→ HONO+M (R2)
HONO+OH→ H2O+NO2 (R3)
These reactions can be used, along with measurements of
concentrations of the relevant species and HONO photolysis
rates, to calculate a photochemical steady state concentra-
tion of HONO. Such calculations from field studies typically
show a peak of HONO at night (when there is no photoly-
sis), with levels in the low pptv range during the day. How-
ever, measurements usually show that daytime HONO lev-
els can reach substantially higher concentrations than this,
with mixing ratios up to a few hundred pptv frequently ob-
served (Zhou et al., 2002; Kleffmann et al., 2005; Acker et
al., 2006). It is clear from these analyses that there is an ex-
tra source of HONO present, which can have a significant
impact on the atmospheric oxidising capacity due to its po-
tential to form OH. A range of reactions have been postulated
during the various studies to account for the missing source
of HONO, with these likely to be heterogeneous either on
aerosols or the ground itself. Major ground surfaces were
recently confirmed by direct flux measurements of HONO
(Ren et al., 2011; Zhou et al., 2011; Zhang et al., 2012).
Tower measurements (Harrison and Kitto, 1994; Kleffmann
et al., 2003; Oswald et al., 2015; Sörgel et al., 2011a, 2015;
Stutz et al., 2002; Vandenboer et al., 2013; Villena et al.,
2011; Vogel et al., 2003; Wong et al., 2012; Young et al.,
2012) and aircraft observations (Li et al., 2014; Zhang et al.,
2009) have also demonstrated that major HONO sources ex-
ist at canopy or ground surfaces through the measurement
of vertical gradients. It is postulated that such processes in-
volve the conversion of nitrogen dioxide (NO2) or nitric acid
(HNO3) to HONO on ground surfaces and are enhanced by
sunlight, thus providing a daytime-only source of HONO
(Zhou et al., 2003; George et al., 2005). In addition, bacte-
rial production of nitrite in soil surfaces were also proposed
as additional HONO source (Su et al., 2011, Oswald et al.,
2013). It has also been shown that HONO is emitted directly
from petrol and diesel vehicle exhausts (Kurtenbach et al.,
2001; Li et al., 2008). At most sites, this is a relatively small
contributor to HONO due to its relatively short atmospheric
lifetime in the daytime (10–20 min); however close to ma-
jor roads and especially in tunnels it can contribute greatly
to the HONO present. A recent publication by Michoud et
al. (2014) gives a good summary of the possible daytime
HONO sources under similar conditions to this study (in
Paris) and a review by Kleffmann (2007) also discusses day-
time HONO sources in depth.
Almost all previous field studies still show a significant
missing daytime HONO source, thus showing the require-
ment for more studies. In this work we report what are, to
our knowledge, the first measurements of HONO made in
London, UK, one of the largest cities in Europe. The mea-
surements were made as part of the summer intensive oper-
ation period (IOP) of the Clean Air for London (ClearfLo)
project and, as a result, were made concurrently with a wide
range of other atmospheric gas and aerosol phase species
(including OH, HO2, NO, NO2, and photolysis rates). This
has enabled us to undertake a detailed modelling study of
HONO using the Master Chemical Mechanism (MCMv3.2),
in which we have included a series of known sources of
HONO found in the literature. We then investigate the differ-
ence between daytime measured and modelled HONO, with
a simple correlation analysis against other measured param-
eters. The model was also used to assess the radical forming
potential of the missing HONO, which can ultimately lead to
increased production of secondary pollutants such as ozone
(O3) and secondary organic aerosol (SOA).
2 Experimental
The ClearfLo project had the aim of providing an integrated
measurement and modelling program in order to help better
understand the atmospheric processes that affect air quality
(Bohnenstengel et al., 2014). As part of ClearfLo, a sum-
mer IOP took place in July and August 2012 that involved
the measurement of a wide range of gas and aerosol phase
species (including meteorology), which enabled a detailed
study of the atmospheric chemistry of London’s air to be car-
ried out.
Atmos. Chem. Phys., 16, 2747–2764, 2016 www.atmos-chem-phys.net/16/2747/2016/
J. D. Lee et al.: Detailed budget analysis of HONO in central London 2749
2.1 Site description
The main site for the IOP was an urban background site
at the Sion Manning School in North Kensington, London
(51◦31′16′′ N, 0◦12′48′′W), which is situated in a residen-
tial area approximately 7 km west of central London (defined
here as Oxford Street). Measurements of NO, NO2 and to-
tal reactive nitrogen (NOy), sulphur dioxide (SO2), O3, car-
bon monoxide (CO), PM10, and total particle number con-
centration have been routinely made at the site since Jan-
uary 1996 as part of the Automatic Urban and Rural Network
(AURN) and the London Air Quality Network (LAQN) (Bigi
and Harrison, 2010). For the ClearfLo IOP, other instruments
were installed in various shipping container laboratories in
the grounds of the school, all within 20 m of the long-term
measurements. A full description of the campaign, includ-
ing the instruments present can be found in Bohnenstengel et
al. (2014), and details of the measurements pertinent to this
work are given below. All measurements were carried out at a
height of around 5 m above ground level, within a horizontal
area of 10 m from each other.
2.2 HONO measurements
HONO was measured using a long-path absorption photome-
ter (LOPAP) instrument from the University of Wuppertal,
Germany, which is explained in detail elsewhere (Heland et
al., 2001). Briefly, gaseous HONO is sampled in a stripping
coil containing a mixture of sulfanilamide in a 1M HCl solu-
tion and is derivatized into an azo dye. The light absorption
by the azo dye is measured in a long-path absorption tube
by a spectrometer at 550 nm using an optical path length
of 2.4 m. The stripping coil was placed directly in the at-
mosphere being sampled; this means that the length of the
glass inlet was only 2 cm, minimizing sampling artefacts.
The LOPAP has two stripping coils connected in series to
correct interferences. In the first coil (channel 1), HONO is
trapped quantitatively together with a small amount of the in-
terfering substances. Assuming that these interfering species
are trapped in a similar amount in the second coil (channel 2),
the difference between the signals of the two channels pro-
vides an interference-free HONO signal. Zero measurements
were performed every 7 h. Calibrations of the spectrometer
using a known concentration of the derivatized azo dye were
carried out three times during the campaign. The instrument
was previously successfully validated against the spectro-
scopic differential optical absorption spectroscopy (DOAS)
technique under urban conditions and in a smog chamber
(Kleffmann et al., 2006). During the campaign a detection
limit of 1 pptV (for a time resolution of 5 min), a precision of
1 % and an accuracy of 10 % were obtained.
2.3 Radical measurements
OH, HO2, and RO2 radical concentrations were measured us-
ing the FAGE (fluorescence assay by gas expansion) tech-
nique (Heard and Pilling, 2003). In the case of HO2 and
RO2, the radicals were first titrated with NO to OH be-
fore FAGE detection. The current mode of operation is de-
scribed in detail elsewhere (Whalley et al., 2015). The HO2
observations used as a constraint in the modelling stud-
ies reported in Sect. 3.3 were made using a low flow of
NO (7.5 sccm), which laboratory tests have shown mini-
mized interferences from alkene and aromatic-derived RO2
species (Whalley et al., 2013). Under this regime, the in-
terference from RO2 radicals present is estimated to con-
tribute < 3 % to the HO2 concentration. The limit of de-
tection at a signal-to-noise ratio of 3 for one data acqui-
sition cycle was ∼ 1.3×10⁶ molecule cm−3 for OH and ∼
6.3× 10⁶ molecule cm−3 for HO2. The measurements were
recorded with 1 s time resolution, and the accuracy of the
measurements was ∼ 15 %.
2.4 Other supporting measurements
The NO and NO2 data used in this work were taken using an
Air Quality Design Inc. custom-built high-sensitivity chemi-
luminescence analyser with LED based blue light NO2 con-
verter. The instrument consists of two channels measuring
NO by reaction with excess O3 to form excited state NO2 fol-
lowed by the detection of the resultant chemiluminescence
(Drummond et al., 1985; Lee et al., 2009). The air flow in
one of the channels first passes through a photolytic con-
verter where light at 395 nm from an array of LEDs photoly-
ses NO2 to NO. The 395 nm wavelength has a specific affin-
ity for NO2 photolytic conversion to NO, giving high analyte
selectivity within the channel, and there is a low probability
of other species (such as HONO) being photolysed (Pollack
et al., 2010). This makes this measurement a significant im-
provement over the high-temperature catalytic NO2 conver-
sion used for the long-term measurement at the North Kens-
ington site (Steinbacher et al., 2007; Villena et al., 2012).
Calibration of the instrument was carried out every 2 days
using 5 ppm NO in nitrogen (BOC – certified to the UK Na-
tional Physical Laboratory (NPL) scale) – diluted to∼ 20 ppb
using high-purity zero air (BOC BTCA 178). The NO2 con-
version efficiency (ca. 40 %) was calibrated using gas phase
titration of the NO standard by O3. NOy data were taken us-
ing a TEI 42i TL NO analyser with Molybdenum converter.
Volatile organic compound (VOC) measurements were ob-
tained using two gas chromatography (GC) instruments. The
volatile fraction of VOCs (C2-C7 hydrocarbons, with a small
selection of oxygenated VOCs, or OVOCs) was measured us-
ing a dual channel GC-FID (flame ionization detector) (Hop-
kins et al., 2003), while a comprehensive two dimensional
GC (GC×GC-FID) measured the less volatile fraction (C6-
C13, with a large group of OVOCs) (Lidster et al., 2014).
www.atmos-chem-phys.net/16/2747/2016/ Atmos. Chem. Phys., 16, 2747–2764, 2016
2750 J. D. Lee et al.: Detailed budget analysis of HONO in central London
Measurements of HCHO were made using an Aero-
laser 4021 analyser (Salmon et al., 2008). Briefly, gaseous
formaldehyde is scrubbed into the liquid phase via a strip-
ping coil containing dilute sulphuric acid. This is fol-
lowed by reaction with Hantzsch reagent, a dilute solu-
tion made with acetyl acetone, acetic acid, and ammo-
nium acetate. Aqueous phase formaldehyde reacts with this
reagent via the “Hantzsch reaction” to produce 3,5-diacetyl-
1,4-dihydrolutidine (DDL). Once excited by an appropriate
wavelength (400 nm in this case) DDL fluoresces, thus al-
lowing quantitative assay by monitoring the emitted light.
Non-refractory PM1.0 nitrate, sulphate, organic matter,
chloride, and ammonium were quantified using a com-
pact time-of-flight aerosol mass spectrometer (cToF-AMS –
Aerodyne Inc.), which gave data with a time resolution of
5 min (Young et al., 2015). Ammonium is reflective of the
overall ammonium nitrate because ammonium nitrate is both
non-refractory and tends to be in the submicron fraction.
While there is supermicron nitrate, it is overwhelmingly in
the form of sodium nitrate, which is refractory and not mea-
sured by the AMS. It is specifically the nitrate measurement
that is of interest here because it pertains to the working hy-
pothesis.
Total aerosol surface area (SA) was calculated using data
from an aerodynamic particle sizer instrument (TSI Inc,
model 3321). The mean diameter of particles in each size
bin (assume spherical) multiplied number of particles in that
bin. In total there were 53 size bins ranging from 0.53 to
21.29 µm. Actinic fluxes of solar radiation were measured
using a spectral radiometer, which consisted of an Ocean
Optics high-resolution spectrometer (QE65000) coupled via
fibre optic to a 2π quartz collection dome. These measure-
ments were then used to calculate the photolysis frequen-
cies of a number of > 50 trace gases, including NO2, HONO,
and O3 (j (O1D)) (Kraus and Hofzumahaus, 1998; Edwards
and Monks, 2003). Wind speed and direction, temperature,
and relatively humidity were measured using a Davis Van-
tage Vue met station. Mixing height estimation was based
on the vertical profiles of the hourly vertical velocity vari-
ance (Barlow et al., 2011). The vertical velocity variance
was measured with a Doppler lidar (Halo-Photonics scan-
ning Doppler lidar) located at the North Kensington site with
a gate resolution of 18 m; the un-sampled portion of the ver-
tical velocity variance is calculated with the spectral correc-
tion technique described in Barlow et al. (2015). The mixing
height is defined as the height up to which the vertical veloc-
ity variance is higher than 0.1 m2 s−2. This threshold value
was perturbed by 20 % (i.e. between 0.08 and 0.121 m2 s−2)
and the median of the estimated values was taken as the
hourly mixing height.
3 Results
3.1 Overview of data
Data were collected from 22 July to 18 August 2012 and time
series of local wind speed, wind direction, NO, NO2, O3,
HONO, and the photolysis rate of HONO (j (HONO)) are
shown in Fig. 1. The majority of the measurement period was
characterized by south-westerly winds, with the wind speed
showing a diurnal cycle of less than 1 m s−1 at night (the
minimum measurable by the anemometer) to 4–6 m s−1 in
late afternoon. These periods show NO and NO2 with peaks
of 15 and 10 ppbV respectively, typically at ∼ 07:30 UTC,
the peak of the morning rush hour. O3 shows a diurnal cy-
cle with a typical maximum of 40–45 ppbV at ∼ 16:00 UTC
and minima of < 20 ppbV at night. The exceptions to this are
two periods from 24 to 27 July and 8 to 10 August, during
which the site was subjected to generally easterly flow, with
lower wind speed. Due to central London being to the east
of the site, these periods are characterized by higher levels
of NOx (up to 60 ppbV of NO and 50 ppbV of NO2), which
has its source mainly from traffic exhaust. O3 is also higher
during these periods due to a combination of the higher pri-
mary pollution levels (NOx and VOCs) and low wind speeds
causing a build-up of this secondary pollutant during the 3- to
4-day period. Peak daytime levels of O3 of 60–100 ppbV are
observed during these more polluted periods. HONO con-
centrations show peak values at night throughout the cam-
paign (up to 1.8 ppbV during the easterly periods and up to
0.7 ppbV during the rest of the campaign), with non-zero val-
ues seen during the day (0.3–0.6 ppbV).
This behaviour is better visualized using the average di-
urnal cycle, which is shown for HONO and NOx in Fig. 2a
and j (HONO) and the HONO /NOx ratio in Fig. 2b. In addi-
tion to the total campaign average, diurnal cycles are shown
for the easterly and westerly time periods described above.
NOx follows an expected profile, with a peak of 29 ppbV
on average during the morning rush hour at ∼ 05:30 UTC
(06:30 local time), followed by a decrease during the day,
due largely to increasing boundary layer (BL) depth and
hence dilution. After ∼ 16:00 UTC, the NOx levels begin to
rise from a minimum of 8.5 ppbV due to a combination of
increased emissions during the evening rush hour and the
reduction of the BL depth into the night. Concentrations
reach ∼ 18 ppbV by midnight and remain reasonably con-
stant throughout the rest of the night. Diurnal averages in the
easterly and westerly conditions follow the same pattern as
for the total data series, with significantly higher NOx dur-
ing the easterly period. During the morning peak, NOx is a
factor of 3 higher during easterly flow compared to westerly
and 15–20 % higher during the daytime. HONO appears to
follow a similar diurnal profile to NOx , which is not unex-
pected since the main known HONO sources involve nitro-
gen oxides. However, the morning peak of HONO is around
1 h earlier compared to NOx (at around 04:30 UTC) due to
Atmos. Chem. Phys., 16, 2747–2764, 2016 www.atmos-chem-phys.net/16/2747/2016/
J. D. Lee et al.: Detailed budget analysis of HONO in central London 2751
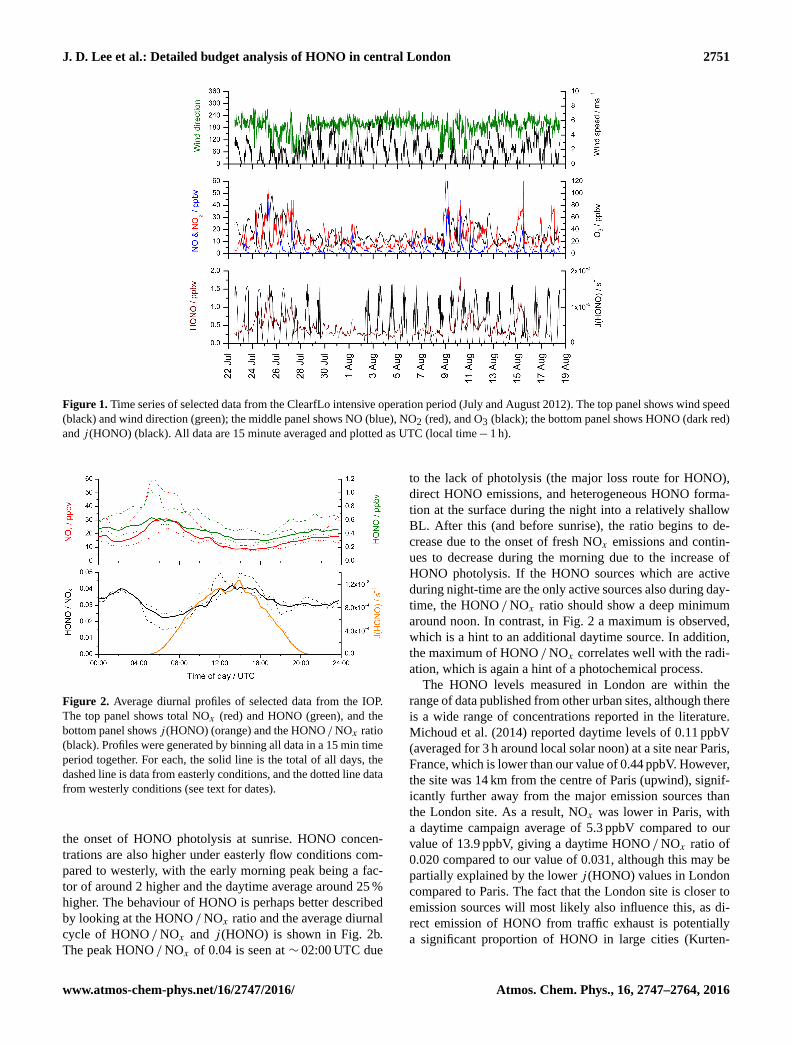
Figure 1. Time series of selected data from the ClearfLo intensive operation period (July and August 2012). The top panel shows wind speed
(black) and wind direction (green); the middle panel shows NO (blue), NO2 (red), and O3 (black); the bottom panel shows HONO (dark red)
and j (HONO) (black). All data are 15 minute averaged and plotted as UTC (local time− 1 h).
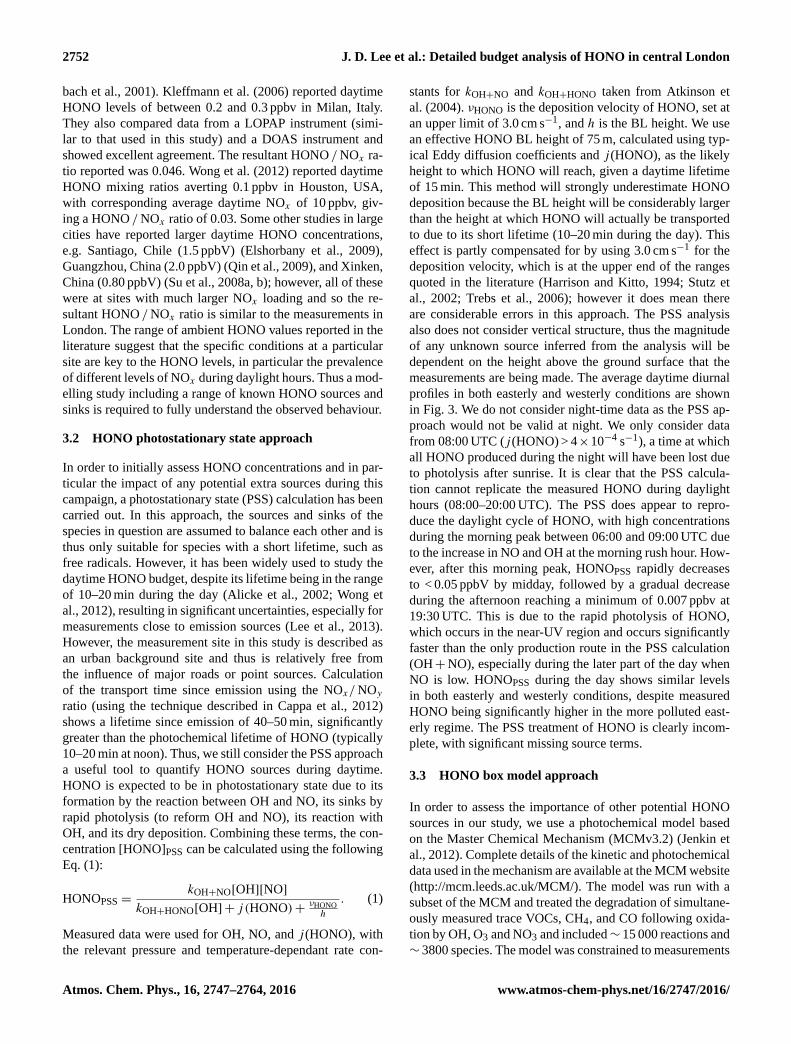
Figure 2. Average diurnal profiles of selected data from the IOP.
The top panel shows total NOx (red) and HONO (green), and the
bottom panel shows j (HONO) (orange) and the HONO /NOx ratio
(black). Profiles were generated by binning all data in a 15 min time
period together. For each, the solid line is the total of all days, the
dashed line is data from easterly conditions, and the dotted line data
from westerly conditions (see text for dates).
the onset of HONO photolysis at sunrise. HONO concen-
trations are also higher under easterly flow conditions com-
pared to westerly, with the early morning peak being a fac-
tor of around 2 higher and the daytime average around 25 %
higher. The behaviour of HONO is perhaps better described
by looking at the HONO /NOx ratio and the average diurnal
cycle of HONO /NOx and j (HONO) is shown in Fig. 2b.
The peak HONO /NOx of 0.04 is seen at ∼ 02:00 UTC due
to the lack of photolysis (the major loss route for HONO),
direct HONO emissions, and heterogeneous HONO forma-
tion at the surface during the night into a relatively shallow
BL. After this (and before sunrise), the ratio begins to de-
crease due to the onset of fresh NOx emissions and contin-
ues to decrease during the morning due to the increase of
HONO photolysis. If the HONO sources which are active
during night-time are the only active sources also during day-
time, the HONO /NOx ratio should show a deep minimum
around noon. In contrast, in Fig. 2 a maximum is observed,
which is a hint to an additional daytime source. In addition,
the maximum of HONO /NOx correlates well with the radi-
ation, which is again a hint of a photochemical process.
The HONO levels measured in London are within the
range of data published from other urban sites, although there
is a wide range of concentrations reported in the literature.
Michoud et al. (2014) reported daytime levels of 0.11 ppbV
(averaged for 3 h around local solar noon) at a site near Paris,
France, which is lower than our value of 0.44 ppbV. However,
the site was 14 km from the centre of Paris (upwind), signif-
icantly further away from the major emission sources than
the London site. As a result, NOx was lower in Paris, with
a daytime campaign average of 5.3 ppbV compared to our
value of 13.9 ppbV, giving a daytime HONO /NOx ratio of
0.020 compared to our value of 0.031, although this may be
partially explained by the lower j (HONO) values in London
compared to Paris. The fact that the London site is closer to
emission sources will most likely also influence this, as di-
rect emission of HONO from traffic exhaust is potentially
a significant proportion of HONO in large cities (Kurten-
www.atmos-chem-phys.net/16/2747/2016/ Atmos. Chem. Phys., 16, 2747–2764, 2016
2752 J. D. Lee et al.: Detailed budget analysis of HONO in central London
bach et al., 2001). Kleffmann et al. (2006) reported daytime
HONO levels of between 0.2 and 0.3 ppbv in Milan, Italy.
They also compared data from a LOPAP instrument (simi-
lar to that used in this study) and a DOAS instrument and
showed excellent agreement. The resultant HONO /NOx ra-
tio reported was 0.046. Wong et al. (2012) reported daytime
HONO mixing ratios averting 0.1 ppbv in Houston, USA,
with corresponding average daytime NOx of 10 ppbv, giv-
ing a HONO /NOx ratio of 0.03. Some other studies in large
cities have reported larger daytime HONO concentrations,
e.g. Santiago, Chile (1.5 ppbV) (Elshorbany et al., 2009),
Guangzhou, China (2.0 ppbV) (Qin et al., 2009), and Xinken,
China (0.80 ppbV) (Su et al., 2008a, b); however, all of these
were at sites with much larger NOx loading and so the re-
sultant HONO /NOx ratio is similar to the measurements in
London. The range of ambient HONO values reported in the
literature suggest that the specific conditions at a particular
site are key to the HONO levels, in particular the prevalence
of different levels of NOx during daylight hours. Thus a mod-
elling study including a range of known HONO sources and
sinks is required to fully understand the observed behaviour.
3.2 HONO photostationary state approach
In order to initially assess HONO concentrations and in par-
ticular the impact of any potential extra sources during this
campaign, a photostationary state (PSS) calculation has been
carried out. In this approach, the sources and sinks of the
species in question are assumed to balance each other and is
thus only suitable for species with a short lifetime, such as
free radicals. However, it has been widely used to study the
daytime HONO budget, despite its lifetime being in the range
of 10–20 min during the day (Alicke et al., 2002; Wong et
al., 2012), resulting in significant uncertainties, especially for
measurements close to emission sources (Lee et al., 2013).
However, the measurement site in this study is described as
an urban background site and thus is relatively free from
the influence of major roads or point sources. Calculation
of the transport time since emission using the NOx/NOyratio (using the technique described in Cappa et al., 2012)
shows a lifetime since emission of 40–50 min, significantly
greater than the photochemical lifetime of HONO (typically
10–20 min at noon). Thus, we still consider the PSS approach
a useful tool to quantify HONO sources during daytime.
HONO is expected to be in photostationary state due to its
formation by the reaction between OH and NO, its sinks by
rapid photolysis (to reform OH and NO), its reaction with
OH, and its dry deposition. Combining these terms, the con-
centration [HONO]PSS can be calculated using the following
Eq. (1):
HONOPSS =kOH+NO[OH][NO]
kOH+HONO[OH] + j (HONO)+νHONO
h
. (1)
Measured data were used for OH, NO, and j (HONO), with
the relevant pressure and temperature-dependant rate con-
stants for kOH+NO and kOH+HONO taken from Atkinson et
al. (2004). νHONO is the deposition velocity of HONO, set at
an upper limit of 3.0 cm s−1, and h is the BL height. We use
an effective HONO BL height of 75 m, calculated using typ-
ical Eddy diffusion coefficients and j (HONO), as the likely
height to which HONO will reach, given a daytime lifetime
of 15 min. This method will strongly underestimate HONO
deposition because the BL height will be considerably larger
than the height at which HONO will actually be transported
to due to its short lifetime (10–20 min during the day). This
effect is partly compensated for by using 3.0 cm s−1 for the
deposition velocity, which is at the upper end of the ranges
quoted in the literature (Harrison and Kitto, 1994; Stutz et
al., 2002; Trebs et al., 2006); however it does mean there
are considerable errors in this approach. The PSS analysis
also does not consider vertical structure, thus the magnitude
of any unknown source inferred from the analysis will be
dependent on the height above the ground surface that the
measurements are being made. The average daytime diurnal
profiles in both easterly and westerly conditions are shown
in Fig. 3. We do not consider night-time data as the PSS ap-
proach would not be valid at night. We only consider data
from 08:00 UTC (j (HONO) > 4×10⁻⁴ s−1), a time at which
all HONO produced during the night will have been lost due
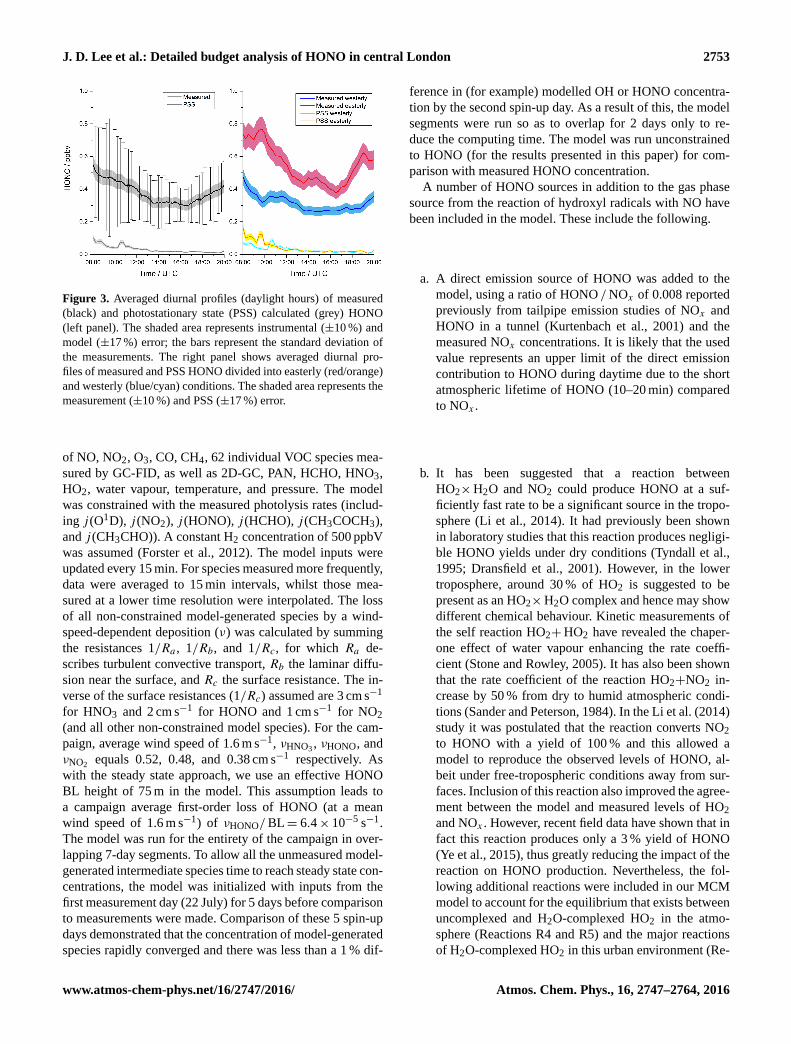
to photolysis after sunrise. It is clear that the PSS calcula-
tion cannot replicate the measured HONO during daylight
hours (08:00–20:00 UTC). The PSS does appear to repro-
duce the daylight cycle of HONO, with high concentrations
during the morning peak between 06:00 and 09:00 UTC due
to the increase in NO and OH at the morning rush hour. How-
ever, after this morning peak, HONOPSS rapidly decreases
to < 0.05 ppbV by midday, followed by a gradual decrease
during the afternoon reaching a minimum of 0.007 ppbv at
19:30 UTC. This is due to the rapid photolysis of HONO,
which occurs in the near-UV region and occurs significantly
faster than the only production route in the PSS calculation
(OH+NO), especially during the later part of the day when
NO is low. HONOPSS during the day shows similar levels
in both easterly and westerly conditions, despite measured
HONO being significantly higher in the more polluted east-
erly regime. The PSS treatment of HONO is clearly incom-
plete, with significant missing source terms.
3.3 HONO box model approach
In order to assess the importance of other potential HONO
sources in our study, we use a photochemical model based
on the Master Chemical Mechanism (MCMv3.2) (Jenkin et
al., 2012). Complete details of the kinetic and photochemical
data used in the mechanism are available at the MCM website
(http://mcm.leeds.ac.uk/MCM/). The model was run with a
subset of the MCM and treated the degradation of simultane-
ously measured trace VOCs, CH4, and CO following oxida-
tion by OH, O3 and NO3 and included∼ 15 000 reactions and
∼ 3800 species. The model was constrained to measurements
Atmos. Chem. Phys., 16, 2747–2764, 2016 www.atmos-chem-phys.net/16/2747/2016/
J. D. Lee et al.: Detailed budget analysis of HONO in central London 2753
Figure 3. Averaged diurnal profiles (daylight hours) of measured
(black) and photostationary state (PSS) calculated (grey) HONO
(left panel). The shaded area represents instrumental (±10 %) and
model (±17 %) error; the bars represent the standard deviation of
the measurements. The right panel shows averaged diurnal pro-
files of measured and PSS HONO divided into easterly (red/orange)
and westerly (blue/cyan) conditions. The shaded area represents the
measurement (±10 %) and PSS (±17 %) error.
of NO, NO2, O3, CO, CH4, 62 individual VOC species mea-
sured by GC-FID, as well as 2D-GC, PAN, HCHO, HNO3,
HO2, water vapour, temperature, and pressure. The model
was constrained with the measured photolysis rates (includ-
ing j (O1D), j (NO2), j (HONO), j (HCHO), j (CH3COCH3),
and j (CH3CHO)). A constant H2 concentration of 500 ppbV
was assumed (Forster et al., 2012). The model inputs were
updated every 15 min. For species measured more frequently,
data were averaged to 15 min intervals, whilst those mea-
sured at a lower time resolution were interpolated. The loss
of all non-constrained model-generated species by a wind-
speed-dependent deposition (ν) was calculated by summing
the resistances 1/Ra , 1/Rb, and 1/Rc, for which Ra de-
scribes turbulent convective transport, Rb the laminar diffu-
sion near the surface, and Rc the surface resistance. The in-
verse of the surface resistances (1/Rc) assumed are 3 cm s−1
for HNO3 and 2 cm s−1 for HONO and 1 cm s−1 for NO2
(and all other non-constrained model species). For the cam-
paign, average wind speed of 1.6 m s−1, νHNO3, νHONO, and
νNO2equals 0.52, 0.48, and 0.38 cm s−1 respectively. As
with the steady state approach, we use an effective HONO
BL height of 75 m in the model. This assumption leads to
a campaign average first-order loss of HONO (at a mean
wind speed of 1.6 m s−1) of νHONO/BL= 6.4× 10⁻⁵ s−1.
The model was run for the entirety of the campaign in over-
lapping 7-day segments. To allow all the unmeasured model-
generated intermediate species time to reach steady state con-
centrations, the model was initialized with inputs from the
first measurement day (22 July) for 5 days before comparison
to measurements were made. Comparison of these 5 spin-up
days demonstrated that the concentration of model-generated
species rapidly converged and there was less than a 1 % dif-
ference in (for example) modelled OH or HONO concentra-
tion by the second spin-up day. As a result of this, the model
segments were run so as to overlap for 2 days only to re-
duce the computing time. The model was run unconstrained
to HONO (for the results presented in this paper) for com-
parison with measured HONO concentration.
A number of HONO sources in addition to the gas phase
source from the reaction of hydroxyl radicals with NO have
been included in the model. These include the following.
a. A direct emission source of HONO was added to the
model, using a ratio of HONO /NOx of 0.008 reported
previously from tailpipe emission studies of NOx and
HONO in a tunnel (Kurtenbach et al., 2001) and the
measured NOx concentrations. It is likely that the used
value represents an upper limit of the direct emission
contribution to HONO during daytime due to the short
atmospheric lifetime of HONO (10–20 min) compared
to NOx .
b. It has been suggested that a reaction between
HO2×H2O and NO2 could produce HONO at a suf-
ficiently fast rate to be a significant source in the tropo-
sphere (Li et al., 2014). It had previously been shown
in laboratory studies that this reaction produces negligi-
ble HONO yields under dry conditions (Tyndall et al.,
1995; Dransfield et al., 2001). However, in the lower
troposphere, around 30 % of HO2 is suggested to be
present as an HO2×H2O complex and hence may show
different chemical behaviour. Kinetic measurements of
the self reaction HO2+HO2 have revealed the chaper-
one effect of water vapour enhancing the rate coeffi-
cient (Stone and Rowley, 2005). It has also been shown
that the rate coefficient of the reaction HO2+NO2 in-
crease by 50 % from dry to humid atmospheric condi-
tions (Sander and Peterson, 1984). In the Li et al. (2014)
study it was postulated that the reaction converts NO2
to HONO with a yield of 100 % and this allowed a
model to reproduce the observed levels of HONO, al-
beit under free-tropospheric conditions away from sur-
faces. Inclusion of this reaction also improved the agree-
ment between the model and measured levels of HO2
and NOx . However, recent field data have shown that in
fact this reaction produces only a 3 % yield of HONO
(Ye et al., 2015), thus greatly reducing the impact of the
reaction on HONO production. Nevertheless, the fol-
lowing additional reactions were included in our MCM
model to account for the equilibrium that exists between
uncomplexed and H2O-complexed HO2 in the atmo-
sphere (Reactions R4 and R5) and the major reactions
of H2O-complexed HO2 in this urban environment (Re-
www.atmos-chem-phys.net/16/2747/2016/ Atmos. Chem. Phys., 16, 2747–2764, 2016
2754 J. D. Lee et al.: Detailed budget analysis of HONO in central London
actions R6 and R7).
HO2+H2O→ HO2×H2O,
k = 1.0× 10⁻¹³ cm−3 s−1 (R4)
HO2×H2O→ HO2+H2O,
k = 1.92× 10⁵ s−1 (R5)
HO2×H2O+NO2→ HONO,
k = 2.1× 10⁻¹² cm−3 s−1 (R6)
HO2×H2O+NO→ OH+NO2,
k = 3.60× 10⁻¹²(e(270/T ))cm−3 s−1 (R7)
c. Light-induced heterogeneous conversion of NO2 to
HONO on aerosol surfaces was also considered assum-
ing an uptake coefficient of 10−6 (Kleffmann et al.,
1999; Arens et al., 2001; Monge et al., 2010).
d. Heterogeneous conversion of NO2 to HONO on ground
surfaces at a rate equal to ∼ 2× 10⁻⁸ s−1 has been in-
cluded in the model, which is consistent with laboratory
studies that put an upper limit on dark surface source of
< 10−7, e.g. Stemmler et al. (2007). This was parameter-
ized in the model by taking the wind-speed-dependent
νNO2and assuming instantaneous mixing of surface-
emitted HONO up to a height of 75 m. This leads to
a first-order loss of NO2 to the ground at a rate of
4× 10⁻⁵ s−1 on average. This rate was scaled down by
a factor of 2000 to represent the dark surface conver-
sion of NO2 to HONO reported in laboratory studies.
However, it has to be stressed that the present calcu-
lation strongly underestimates the contribution of het-
erogeneous HONO formation on ground surfaces, es-
pecially during night-time at the measurement height,
caused by the assumption of an instantaneous mixing
up to a height of 75 m; see Eq. (1).
e. A daytime source from the photolysis of ortho-
nitrophenols which were not measured during the cam-
paign but have been estimated to be present at an upper
limit constant concentration of 1 ppbV and which pho-
tolyse at a rate of ∼ 3× 10⁻⁵ s−1 at midday (Bejan et
al., 2006).
f. Photolysis of adsorbed HNO3 on ground surfaces
has been reported to produce HONO (Zhou et al.,
2003, 2011). We have estimated the concentration of
HNO3 deposited to the ground surface from the gas
phase HNO3 concentration that was measured during
ClearfLo and from the wind-speed-dependent νHNO3
(Zhou et al., 2011). To assess the maximum impact of
this potential HONO source, a noon photolysis rate of
surface HNO3 of 6× 10⁻⁵ s−1, 2 orders of magnitude
faster than j (HNO3)g (j (HNO3)0◦SZA = 6× 10⁻⁷ s−1)
in the gas phase, has been taken (Zhou et al., 2011) and
a 100 % HONO yield was assumed.
g. To assess the maximum impact of this potential HONO
source, a noon photolysis rate of aerosol NO−3 of 6×
10−5 s−1 and a 100 % HONO yield was again assumed.
h. Photosensitized heterogeneous conversion of NO2 to
HONO on ground surfaces has been parameterized and
included in the model by taking a ground surface con-
version, which correlates with NO2 photolysis. A wind-
speed-dependent NO2 deposition velocity calculated
using 1/Rc = 1 cm s−1 (Joyce et al., 2014) in 75 m BL
leads to a first-order loss of NO2 to the ground at a rate
of 4× 10⁻⁵ s−1 on average; this is multiplied by a scal-
ing factor equal to 0.25× j (NO2), which leads to an
overall photosensitized conversion of NO2→HONO
of ∼ 5.6× 10⁻⁶ s−1 during the day on average. This
is consistent with the light-induced conversion of NO2
to HONO observed in laboratory studies on humic acid
surfaces (Stemmler et al., 2007).
We do not include desorption of adsorbed HONO from soil
(Oswald et al., 2013, 2015; VandenBoer et al., 2013) as it is
still largely speculative, depends on many uncertain variables
(soil pH, bacterial activity, soil humidity), and most probably
has a very minor contribution under our highly urban condi-
tions (low soil coverage, different expected diurnal contribu-
tion).
The full time series of the modelled HONO using the
MCM, along with the measured values for the entire mea-
surement campaign, are shown in Fig. 4. Due to the difficul-
ties of predicting night-time chemistry with a photochemi-
cal model (such as the MCM), we only consider the daytime
here (08:00–20:00 UTC). The time series show that predicted
daytime HONO using the full model is higher than from the
simple PSS calculation; however, it can be seen that the pre-
dicted daytime HONO is still lower than the measurement on
all days and falls outside the 10 % error of the LOPAP instru-
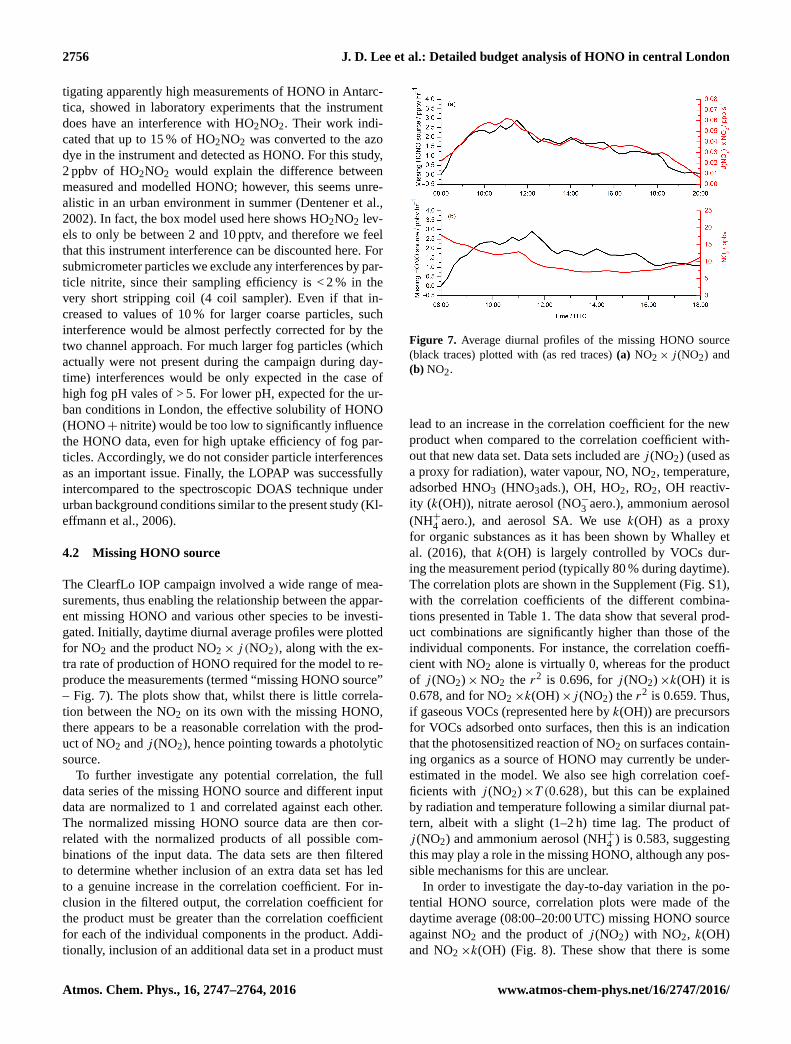
ment. The average daytime diurnal cycle of the measured and
modelled HONO, along with the contribution of the different
sources in the model, is shown in Fig. 5. From just after sun-
rise (08:00 UTC), the contribution to HONO of the reaction
between OH and NO decreases quickly due to the increasing
j (HONO) and decreasing NO levels throughout the morning.
The largest contribution throughout the day comes from the
photolysis of adsorbed HNO3, contributing around 50 % of
the HONO source at midday. There are small contributions
during the day and from heterogeneous conversion of NO2
(on both aerosol and ground surfaces) and the photolysis of
ortho-nitrophenol. Examining the total HONO predicted by
the model compared to the measurement shows a signifi-
cant underestimation of the modelled HONO compared to
the measurement. They do both follow a similar diurnal cy-
cle, with a decrease in HONO until around 16:00 UTC, fol-
lowed by an increase into the evening; however, the modelled
HONO is up to a factor of around 2 lower than the measure-
ment throughout the day. Subtracting the modelled from the
Atmos. Chem. Phys., 16, 2747–2764, 2016 www.atmos-chem-phys.net/16/2747/2016/
J. D. Lee et al.: Detailed budget analysis of HONO in central London 2755
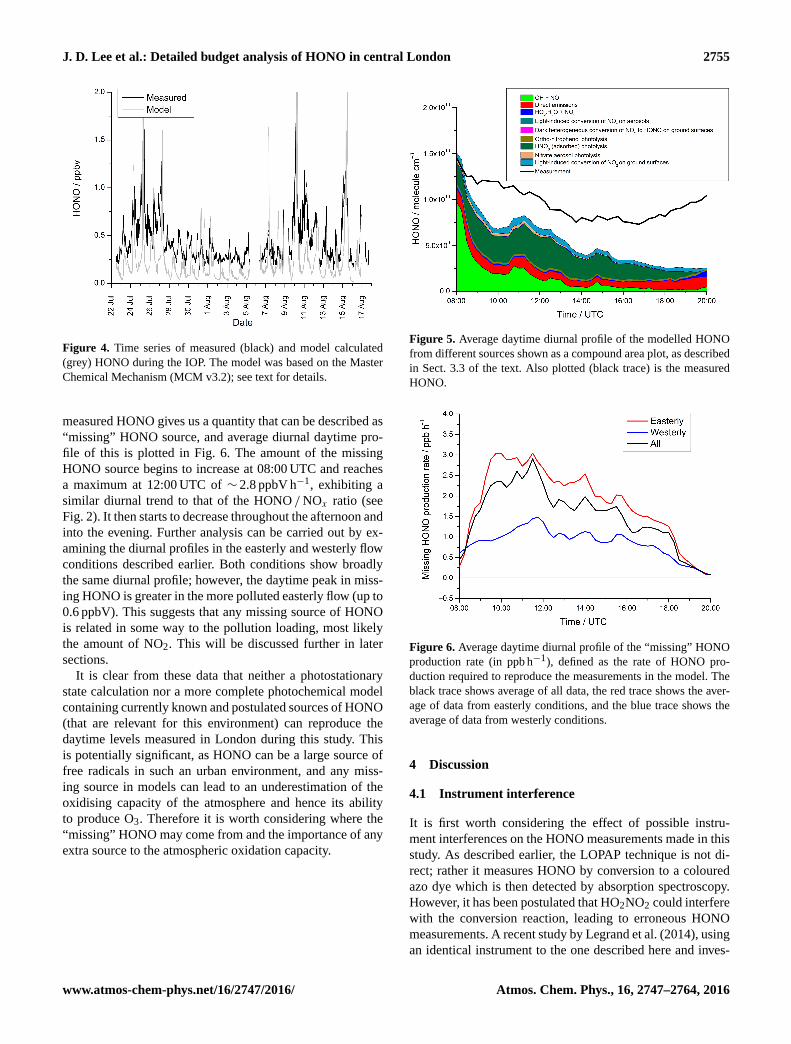
Figure 4. Time series of measured (black) and model calculated
(grey) HONO during the IOP. The model was based on the Master
Chemical Mechanism (MCM v3.2); see text for details.
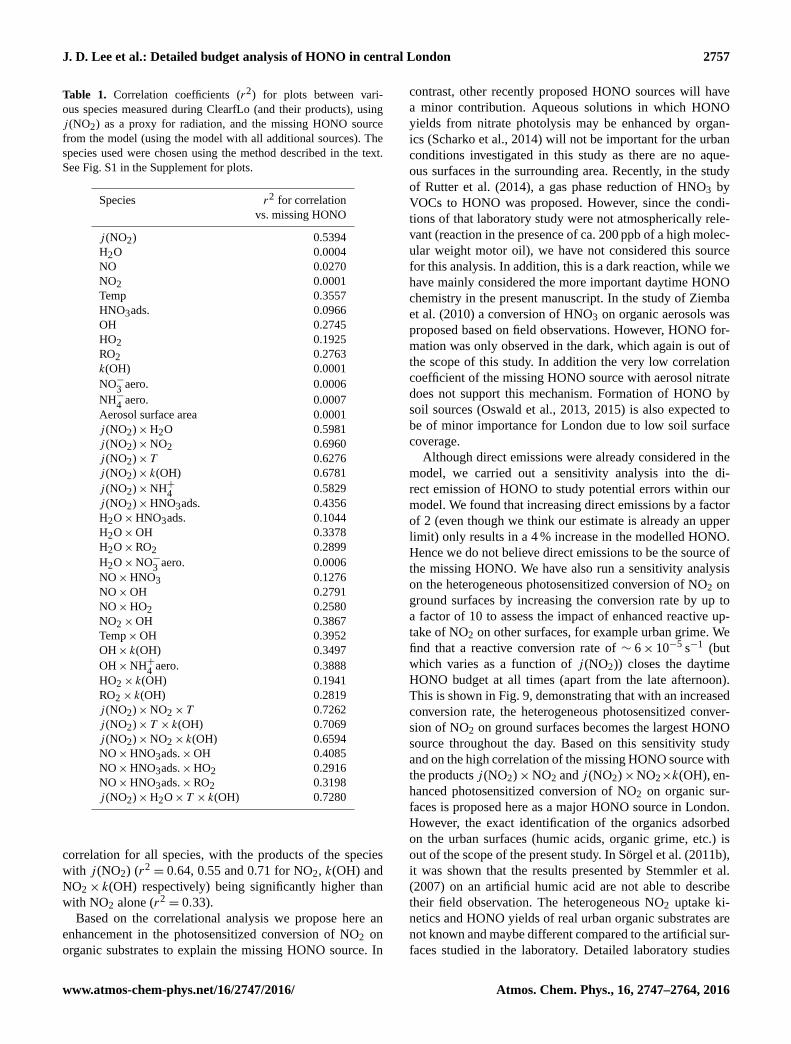
measured HONO gives us a quantity that can be described as
“missing” HONO source, and average diurnal daytime pro-
file of this is plotted in Fig. 6. The amount of the missing
HONO source begins to increase at 08:00 UTC and reaches
a maximum at 12:00 UTC of ∼ 2.8 ppbV h−1, exhibiting a
similar diurnal trend to that of the HONO /NOx ratio (see
Fig. 2). It then starts to decrease throughout the afternoon and
into the evening. Further analysis can be carried out by ex-
amining the diurnal profiles in the easterly and westerly flow
conditions described earlier. Both conditions show broadly
the same diurnal profile; however, the daytime peak in miss-
ing HONO is greater in the more polluted easterly flow (up to
0.6 ppbV). This suggests that any missing source of HONO
is related in some way to the pollution loading, most likely
the amount of NO2. This will be discussed further in later
sections.
It is clear from these data that neither a photostationary
state calculation nor a more complete photochemical model
containing currently known and postulated sources of HONO
(that are relevant for this environment) can reproduce the
daytime levels measured in London during this study. This
is potentially significant, as HONO can be a large source of
free radicals in such an urban environment, and any miss-
ing source in models can lead to an underestimation of the
oxidising capacity of the atmosphere and hence its ability
to produce O3. Therefore it is worth considering where the
“missing” HONO may come from and the importance of any
extra source to the atmospheric oxidation capacity.
Figure 5. Average daytime diurnal profile of the modelled HONO
from different sources shown as a compound area plot, as described
in Sect. 3.3 of the text. Also plotted (black trace) is the measured
HONO.
Figure 6. Average daytime diurnal profile of the “missing” HONO
production rate (in ppb h−1), defined as the rate of HONO pro-
duction required to reproduce the measurements in the model. The
black trace shows average of all data, the red trace shows the aver-
age of data from easterly conditions, and the blue trace shows the
average of data from westerly conditions.
4 Discussion
4.1 Instrument interference
It is first worth considering the effect of possible instru-
ment interferences on the HONO measurements made in this
study. As described earlier, the LOPAP technique is not di-
rect; rather it measures HONO by conversion to a coloured
azo dye which is then detected by absorption spectroscopy.
However, it has been postulated that HO2NO2 could interfere
with the conversion reaction, leading to erroneous HONO
measurements. A recent study by Legrand et al. (2014), using
an identical instrument to the one described here and inves-
www.atmos-chem-phys.net/16/2747/2016/ Atmos. Chem. Phys., 16, 2747–2764, 2016
2756 J. D. Lee et al.: Detailed budget analysis of HONO in central London
tigating apparently high measurements of HONO in Antarc-
tica, showed in laboratory experiments that the instrument
does have an interference with HO2NO2. Their work indi-
cated that up to 15 % of HO2NO2 was converted to the azo
dye in the instrument and detected as HONO. For this study,
2 ppbv of HO2NO2 would explain the difference between
measured and modelled HONO; however, this seems unre-
alistic in an urban environment in summer (Dentener et al.,
2002). In fact, the box model used here shows HO2NO2 lev-
els to only be between 2 and 10 pptv, and therefore we feel
that this instrument interference can be discounted here. For
submicrometer particles we exclude any interferences by par-
ticle nitrite, since their sampling efficiency is < 2 % in the
very short stripping coil (4 coil sampler). Even if that in-
creased to values of 10 % for larger coarse particles, such
interference would be almost perfectly corrected for by the
two channel approach. For much larger fog particles (which
actually were not present during the campaign during day-
time) interferences would be only expected in the case of
high fog pH vales of > 5. For lower pH, expected for the ur-
ban conditions in London, the effective solubility of HONO
(HONO+ nitrite) would be too low to significantly influence
the HONO data, even for high uptake efficiency of fog par-
ticles. Accordingly, we do not consider particle interferences
as an important issue. Finally, the LOPAP was successfully
intercompared to the spectroscopic DOAS technique under
urban background conditions similar to the present study (Kl-
effmann et al., 2006).
4.2 Missing HONO source
The ClearfLo IOP campaign involved a wide range of mea-
surements, thus enabling the relationship between the appar-
ent missing HONO and various other species to be investi-
gated. Initially, daytime diurnal average profiles were plotted
for NO2 and the product NO2× j (NO2), along with the ex-
tra rate of production of HONO required for the model to re-
produce the measurements (termed “missing HONO source”
– Fig. 7). The plots show that, whilst there is little correla-
tion between the NO2 on its own with the missing HONO,
there appears to be a reasonable correlation with the prod-
uct of NO2 and j (NO2), hence pointing towards a photolytic
source.
To further investigate any potential correlation, the full
data series of the missing HONO source and different input
data are normalized to 1 and correlated against each other.
The normalized missing HONO source data are then cor-
related with the normalized products of all possible com-
binations of the input data. The data sets are then filtered
to determine whether inclusion of an extra data set has led
to a genuine increase in the correlation coefficient. For in-
clusion in the filtered output, the correlation coefficient for
the product must be greater than the correlation coefficient
for each of the individual components in the product. Addi-
tionally, inclusion of an additional data set in a product must
Figure 7. Average diurnal profiles of the missing HONO source
(black traces) plotted with (as red traces) (a) NO2× j (NO2) and
(b) NO2.
lead to an increase in the correlation coefficient for the new
product when compared to the correlation coefficient with-
out that new data set. Data sets included are j (NO2) (used as
a proxy for radiation), water vapour, NO, NO2, temperature,
adsorbed HNO3 (HNO3ads.), OH, HO2, RO2, OH reactiv-
ity (k(OH)), nitrate aerosol (NO−3 aero.), ammonium aerosol
(NH+4 aero.), and aerosol SA. We use k(OH) as a proxy
for organic substances as it has been shown by Whalley et
al. (2016), that k(OH) is largely controlled by VOCs dur-
ing the measurement period (typically 80 % during daytime).
The correlation plots are shown in the Supplement (Fig. S1),
with the correlation coefficients of the different combina-
tions presented in Table 1. The data show that several prod-
uct combinations are significantly higher than those of the
individual components. For instance, the correlation coeffi-
cient with NO2 alone is virtually 0, whereas for the product
of j (NO2)×NO2 the r2 is 0.696, for j (NO2)×k(OH) it is
0.678, and for NO2×k(OH)×j (NO2) the r2 is 0.659. Thus,
if gaseous VOCs (represented here by k(OH)) are precursors
for VOCs adsorbed onto surfaces, then this is an indication
that the photosensitized reaction of NO2 on surfaces contain-
ing organics as a source of HONO may currently be under-
estimated in the model. We also see high correlation coef-
ficients with j (NO2)×T (0.628), but this can be explained
by radiation and temperature following a similar diurnal pat-
tern, albeit with a slight (1–2 h) time lag. The product of
j (NO2) and ammonium aerosol (NH+4 ) is 0.583, suggesting
this may play a role in the missing HONO, although any pos-
sible mechanisms for this are unclear.
In order to investigate the day-to-day variation in the po-
tential HONO source, correlation plots were made of the
daytime average (08:00–20:00 UTC) missing HONO source
against NO2 and the product of j (NO2) with NO2, k(OH)
and NO2×k(OH) (Fig. 8). These show that there is some
Atmos. Chem. Phys., 16, 2747–2764, 2016 www.atmos-chem-phys.net/16/2747/2016/
J. D. Lee et al.: Detailed budget analysis of HONO in central London 2757
Table 1. Correlation coefficients (r2) for plots between vari-
ous species measured during ClearfLo (and their products), using
j (NO2) as a proxy for radiation, and the missing HONO source
from the model (using the model with all additional sources). The
species used were chosen using the method described in the text.
See Fig. S1 in the Supplement for plots.
Species r2 for correlation
vs. missing HONO
j (NO2) 0.5394
H2O 0.0004
NO 0.0270
NO2 0.0001
Temp 0.3557
HNO3ads. 0.0966
OH 0.2745
HO2 0.1925
RO2 0.2763
k(OH) 0.0001
NO−3
aero. 0.0006
NH−4
aero. 0.0007
Aerosol surface area 0.0001
j (NO2)×H2O 0.5981
j (NO2)×NO2 0.6960
j (NO2)× T 0.6276
j (NO2)× k(OH) 0.6781
j (NO2)×NH+4
0.5829
j (NO2)×HNO3ads. 0.4356
H2O×HNO3ads. 0.1044
H2O×OH 0.3378
H2O×RO2 0.2899
H2O×NO−3
aero. 0.0006
NO×HNO3 0.1276
NO×OH 0.2791
NO×HO2 0.2580
NO2×OH 0.3867
Temp×OH 0.3952
OH× k(OH) 0.3497
OH×NH+4
aero. 0.3888
HO2× k(OH) 0.1941
RO2× k(OH) 0.2819
j (NO2)×NO2× T 0.7262
j (NO2)× T × k(OH) 0.7069
j (NO2)×NO2× k(OH) 0.6594
NO×HNO3ads.×OH 0.4085
NO×HNO3ads.×HO2 0.2916
NO×HNO3ads.×RO2 0.3198
j (NO2)×H2O× T × k(OH) 0.7280
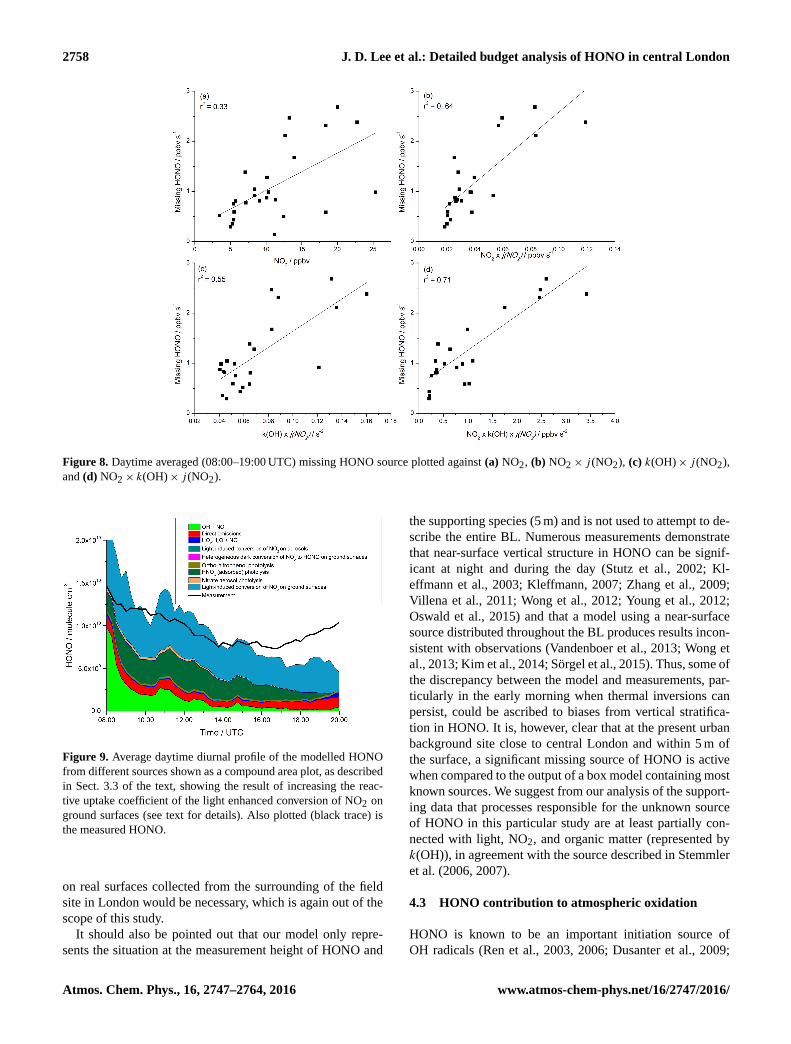
correlation for all species, with the products of the species
with j (NO2) (r2= 0.64, 0.55 and 0.71 for NO2, k(OH) and
NO2× k(OH) respectively) being significantly higher than
with NO2 alone (r2= 0.33).
Based on the correlational analysis we propose here an
enhancement in the photosensitized conversion of NO2 on
organic substrates to explain the missing HONO source. In
contrast, other recently proposed HONO sources will have
a minor contribution. Aqueous solutions in which HONO
yields from nitrate photolysis may be enhanced by organ-
ics (Scharko et al., 2014) will not be important for the urban
conditions investigated in this study as there are no aque-
ous surfaces in the surrounding area. Recently, in the study
of Rutter et al. (2014), a gas phase reduction of HNO3 by
VOCs to HONO was proposed. However, since the condi-
tions of that laboratory study were not atmospherically rele-
vant (reaction in the presence of ca. 200 ppb of a high molec-
ular weight motor oil), we have not considered this source
for this analysis. In addition, this is a dark reaction, while we
have mainly considered the more important daytime HONO
chemistry in the present manuscript. In the study of Ziemba
et al. (2010) a conversion of HNO3 on organic aerosols was
proposed based on field observations. However, HONO for-
mation was only observed in the dark, which again is out of
the scope of this study. In addition the very low correlation
coefficient of the missing HONO source with aerosol nitrate
does not support this mechanism. Formation of HONO by
soil sources (Oswald et al., 2013, 2015) is also expected to
be of minor importance for London due to low soil surface
coverage.
Although direct emissions were already considered in the
model, we carried out a sensitivity analysis into the di-
rect emission of HONO to study potential errors within our
model. We found that increasing direct emissions by a factor
of 2 (even though we think our estimate is already an upper
limit) only results in a 4 % increase in the modelled HONO.
Hence we do not believe direct emissions to be the source of
the missing HONO. We have also run a sensitivity analysis
on the heterogeneous photosensitized conversion of NO2 on
ground surfaces by increasing the conversion rate by up to
a factor of 10 to assess the impact of enhanced reactive up-
take of NO2 on other surfaces, for example urban grime. We
find that a reactive conversion rate of ∼ 6× 10⁻⁵ s−1 (but
which varies as a function of j (NO2)) closes the daytime
HONO budget at all times (apart from the late afternoon).
This is shown in Fig. 9, demonstrating that with an increased
conversion rate, the heterogeneous photosensitized conver-
sion of NO2 on ground surfaces becomes the largest HONO
source throughout the day. Based on this sensitivity study
and on the high correlation of the missing HONO source with
the products j (NO2)×NO2 and j (NO2)×NO2×k(OH), en-
hanced photosensitized conversion of NO2 on organic sur-
faces is proposed here as a major HONO source in London.
However, the exact identification of the organics adsorbed
on the urban surfaces (humic acids, organic grime, etc.) is
out of the scope of the present study. In Sörgel et al. (2011b),
it was shown that the results presented by Stemmler et al.
(2007) on an artificial humic acid are not able to describe
their field observation. The heterogeneous NO2 uptake ki-
netics and HONO yields of real urban organic substrates are
not known and maybe different compared to the artificial sur-
faces studied in the laboratory. Detailed laboratory studies
www.atmos-chem-phys.net/16/2747/2016/ Atmos. Chem. Phys., 16, 2747–2764, 2016
2758 J. D. Lee et al.: Detailed budget analysis of HONO in central London
Figure 8. Daytime averaged (08:00–19:00 UTC) missing HONO source plotted against (a) NO2, (b) NO2× j (NO2), (c) k(OH)× j (NO2),
and (d) NO2× k(OH)× j (NO2).
Figure 9. Average daytime diurnal profile of the modelled HONO
from different sources shown as a compound area plot, as described
in Sect. 3.3 of the text, showing the result of increasing the reac-
tive uptake coefficient of the light enhanced conversion of NO2 on
ground surfaces (see text for details). Also plotted (black trace) is
the measured HONO.
on real surfaces collected from the surrounding of the field
site in London would be necessary, which is again out of the
scope of this study.
It should also be pointed out that our model only repre-
sents the situation at the measurement height of HONO and
the supporting species (5 m) and is not used to attempt to de-
scribe the entire BL. Numerous measurements demonstrate
that near-surface vertical structure in HONO can be signif-
icant at night and during the day (Stutz et al., 2002; Kl-
effmann et al., 2003; Kleffmann, 2007; Zhang et al., 2009;
Villena et al., 2011; Wong et al., 2012; Young et al., 2012;
Oswald et al., 2015) and that a model using a near-surface
source distributed throughout the BL produces results incon-
sistent with observations (Vandenboer et al., 2013; Wong et
al., 2013; Kim et al., 2014; Sörgel et al., 2015). Thus, some of
the discrepancy between the model and measurements, par-
ticularly in the early morning when thermal inversions can
persist, could be ascribed to biases from vertical stratifica-
tion in HONO. It is, however, clear that at the present urban
background site close to central London and within 5 m of
the surface, a significant missing source of HONO is active
when compared to the output of a box model containing most
known sources. We suggest from our analysis of the support-
ing data that processes responsible for the unknown source
of HONO in this particular study are at least partially con-
nected with light, NO2, and organic matter (represented by
k(OH)), in agreement with the source described in Stemmler
et al. (2006, 2007).
4.3 HONO contribution to atmospheric oxidation
HONO is known to be an important initiation source of
OH radicals (Ren et al., 2003, 2006; Dusanter et al., 2009;
Atmos. Chem. Phys., 16, 2747–2764, 2016 www.atmos-chem-phys.net/16/2747/2016/
J. D. Lee et al.: Detailed budget analysis of HONO in central London 2759
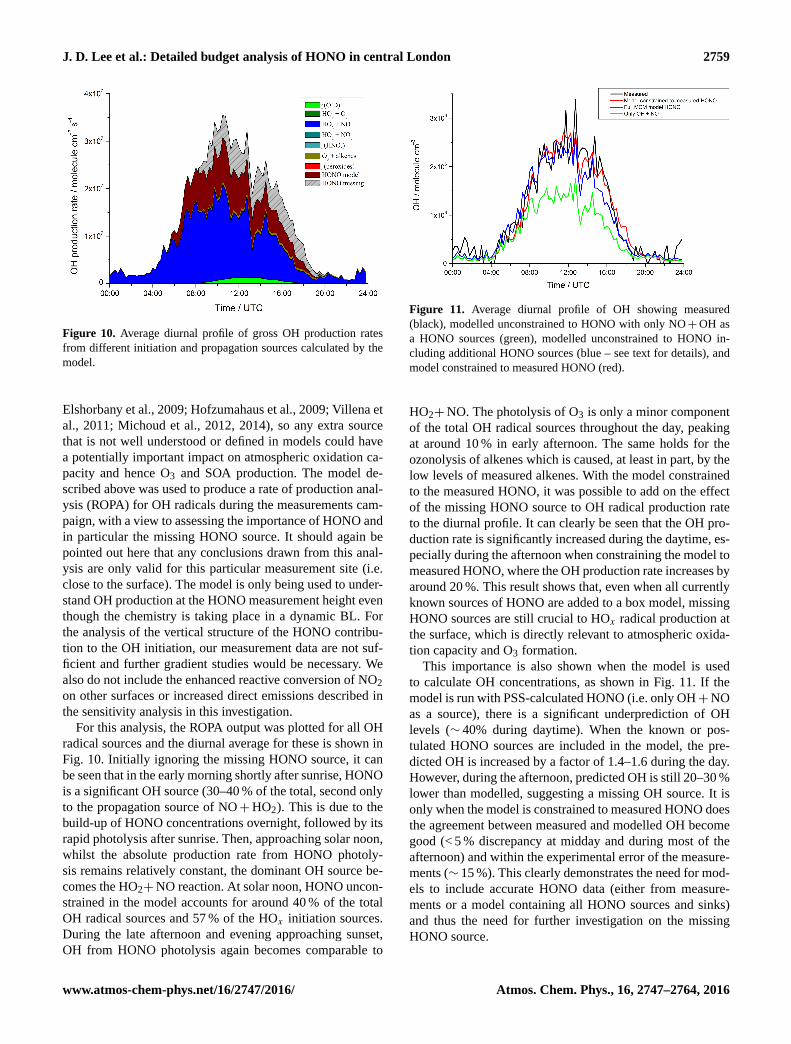
Figure 10. Average diurnal profile of gross OH production rates
from different initiation and propagation sources calculated by the
model.
Elshorbany et al., 2009; Hofzumahaus et al., 2009; Villena et
al., 2011; Michoud et al., 2012, 2014), so any extra source
that is not well understood or defined in models could have
a potentially important impact on atmospheric oxidation ca-
pacity and hence O3 and SOA production. The model de-
scribed above was used to produce a rate of production anal-
ysis (ROPA) for OH radicals during the measurements cam-
paign, with a view to assessing the importance of HONO and
in particular the missing HONO source. It should again be
pointed out here that any conclusions drawn from this anal-
ysis are only valid for this particular measurement site (i.e.
close to the surface). The model is only being used to under-
stand OH production at the HONO measurement height even
though the chemistry is taking place in a dynamic BL. For
the analysis of the vertical structure of the HONO contribu-
tion to the OH initiation, our measurement data are not suf-
ficient and further gradient studies would be necessary. We
also do not include the enhanced reactive conversion of NO2
on other surfaces or increased direct emissions described in
the sensitivity analysis in this investigation.
For this analysis, the ROPA output was plotted for all OH
radical sources and the diurnal average for these is shown in
Fig. 10. Initially ignoring the missing HONO source, it can
be seen that in the early morning shortly after sunrise, HONO
is a significant OH source (30–40 % of the total, second only
to the propagation source of NO+HO2). This is due to the
build-up of HONO concentrations overnight, followed by its
rapid photolysis after sunrise. Then, approaching solar noon,
whilst the absolute production rate from HONO photoly-
sis remains relatively constant, the dominant OH source be-
comes the HO2+NO reaction. At solar noon, HONO uncon-
strained in the model accounts for around 40 % of the total
OH radical sources and 57 % of the HOx initiation sources.
During the late afternoon and evening approaching sunset,
OH from HONO photolysis again becomes comparable to
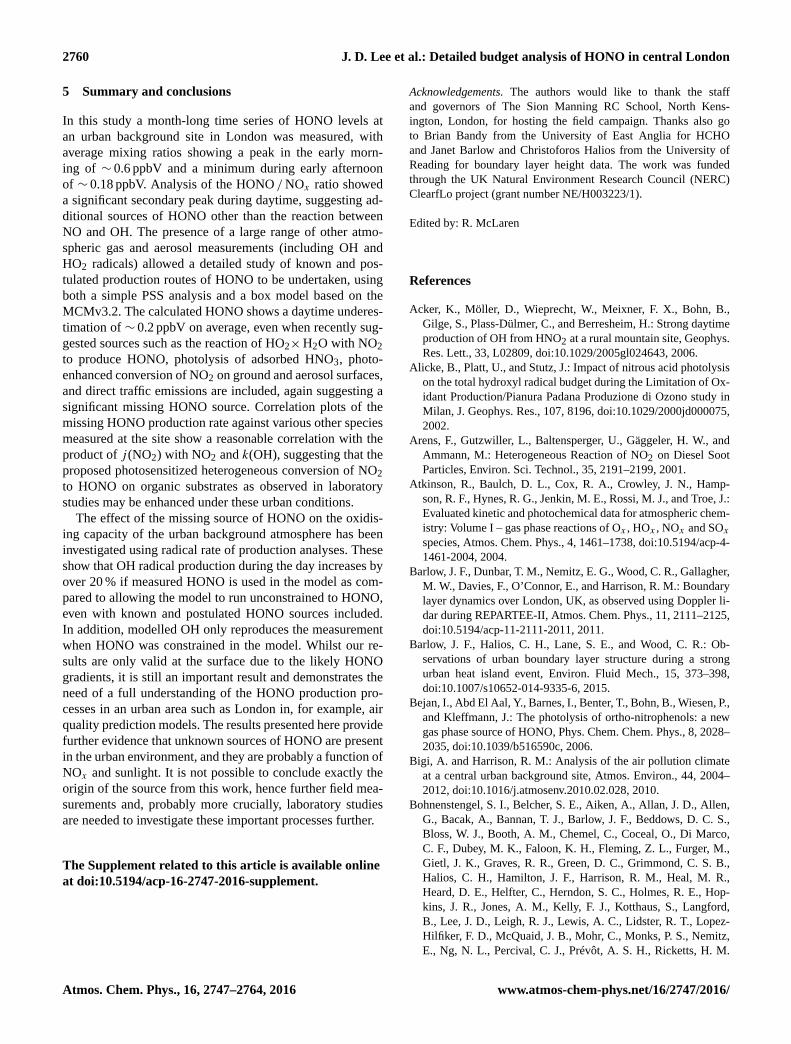
Figure 11. Average diurnal profile of OH showing measured
(black), modelled unconstrained to HONO with only NO+OH as
a HONO sources (green), modelled unconstrained to HONO in-
cluding additional HONO sources (blue – see text for details), and
model constrained to measured HONO (red).
HO2+NO. The photolysis of O3 is only a minor component
of the total OH radical sources throughout the day, peaking
at around 10 % in early afternoon. The same holds for the
ozonolysis of alkenes which is caused, at least in part, by the
low levels of measured alkenes. With the model constrained
to the measured HONO, it was possible to add on the effect
of the missing HONO source to OH radical production rate
to the diurnal profile. It can clearly be seen that the OH pro-
duction rate is significantly increased during the daytime, es-
pecially during the afternoon when constraining the model to
measured HONO, where the OH production rate increases by
around 20 %. This result shows that, even when all currently
known sources of HONO are added to a box model, missing
HONO sources are still crucial to HOx radical production at
the surface, which is directly relevant to atmospheric oxida-
tion capacity and O3 formation.
This importance is also shown when the model is used
to calculate OH concentrations, as shown in Fig. 11. If the
model is run with PSS-calculated HONO (i.e. only OH+NO
as a source), there is a significant underprediction of OH
levels (∼ 40% during daytime). When the known or pos-
tulated HONO sources are included in the model, the pre-
dicted OH is increased by a factor of 1.4–1.6 during the day.
However, during the afternoon, predicted OH is still 20–30 %
lower than modelled, suggesting a missing OH source. It is
only when the model is constrained to measured HONO does
the agreement between measured and modelled OH become
good (< 5 % discrepancy at midday and during most of the
afternoon) and within the experimental error of the measure-
ments (∼ 15 %). This clearly demonstrates the need for mod-
els to include accurate HONO data (either from measure-
ments or a model containing all HONO sources and sinks)
and thus the need for further investigation on the missing
HONO source.
www.atmos-chem-phys.net/16/2747/2016/ Atmos. Chem. Phys., 16, 2747–2764, 2016
2760 J. D. Lee et al.: Detailed budget analysis of HONO in central London
5 Summary and conclusions
In this study a month-long time series of HONO levels at
an urban background site in London was measured, with
average mixing ratios showing a peak in the early morn-
ing of ∼ 0.6 ppbV and a minimum during early afternoon
of ∼ 0.18 ppbV. Analysis of the HONO /NOx ratio showed
a significant secondary peak during daytime, suggesting ad-
ditional sources of HONO other than the reaction between
NO and OH. The presence of a large range of other atmo-
spheric gas and aerosol measurements (including OH and
HO2 radicals) allowed a detailed study of known and pos-
tulated production routes of HONO to be undertaken, using
both a simple PSS analysis and a box model based on the
MCMv3.2. The calculated HONO shows a daytime underes-
timation of ∼ 0.2 ppbV on average, even when recently sug-
gested sources such as the reaction of HO2×H2O with NO2
to produce HONO, photolysis of adsorbed HNO3, photo-
enhanced conversion of NO2 on ground and aerosol surfaces,
and direct traffic emissions are included, again suggesting a
significant missing HONO source. Correlation plots of the
missing HONO production rate against various other species
measured at the site show a reasonable correlation with the
product of j (NO2) with NO2 and k(OH), suggesting that the
proposed photosensitized heterogeneous conversion of NO2
to HONO on organic substrates as observed in laboratory
studies may be enhanced under these urban conditions.
The effect of the missing source of HONO on the oxidis-
ing capacity of the urban background atmosphere has been
investigated using radical rate of production analyses. These
show that OH radical production during the day increases by
over 20 % if measured HONO is used in the model as com-
pared to allowing the model to run unconstrained to HONO,
even with known and postulated HONO sources included.
In addition, modelled OH only reproduces the measurement
when HONO was constrained in the model. Whilst our re-
sults are only valid at the surface due to the likely HONO
gradients, it is still an important result and demonstrates the
need of a full understanding of the HONO production pro-
cesses in an urban area such as London in, for example, air
quality prediction models. The results presented here provide
further evidence that unknown sources of HONO are present
in the urban environment, and they are probably a function of
NOx and sunlight. It is not possible to conclude exactly the
origin of the source from this work, hence further field mea-
surements and, probably more crucially, laboratory studies
are needed to investigate these important processes further.
The Supplement related to this article is available online
at doi:10.5194/acp-16-2747-2016-supplement.
Acknowledgements. The authors would like to thank the staff
and governors of The Sion Manning RC School, North Kens-
ington, London, for hosting the field campaign. Thanks also go
to Brian Bandy from the University of East Anglia for HCHO
and Janet Barlow and Christoforos Halios from the University of
Reading for boundary layer height data. The work was funded
through the UK Natural Environment Research Council (NERC)
ClearfLo project (grant number NE/H003223/1).
Edited by: R. McLaren
References
Acker, K., Möller, D., Wieprecht, W., Meixner, F. X., Bohn, B.,
Gilge, S., Plass-Dülmer, C., and Berresheim, H.: Strong daytime
production of OH from HNO2 at a rural mountain site, Geophys.
Res. Lett., 33, L02809, doi:10.1029/2005gl024643, 2006.
Alicke, B., Platt, U., and Stutz, J.: Impact of nitrous acid photolysis
on the total hydroxyl radical budget during the Limitation of Ox-
idant Production/Pianura Padana Produzione di Ozono study in
Milan, J. Geophys. Res., 107, 8196, doi:10.1029/2000jd000075,
2002.
Arens, F., Gutzwiller, L., Baltensperger, U., Gäggeler, H. W., and
Ammann, M.: Heterogeneous Reaction of NO2 on Diesel Soot
Particles, Environ. Sci. Technol., 35, 2191–2199, 2001.
Atkinson, R., Baulch, D. L., Cox, R. A., Crowley, J. N., Hamp-
son, R. F., Hynes, R. G., Jenkin, M. E., Rossi, M. J., and Troe, J.:
Evaluated kinetic and photochemical data for atmospheric chem-
istry: Volume I – gas phase reactions of Ox , HOx , NOx and SOxspecies, Atmos. Chem. Phys., 4, 1461–1738, doi:10.5194/acp-4-
1461-2004, 2004.
Barlow, J. F., Dunbar, T. M., Nemitz, E. G., Wood, C. R., Gallagher,
M. W., Davies, F., O’Connor, E., and Harrison, R. M.: Boundary
layer dynamics over London, UK, as observed using Doppler li-
dar during REPARTEE-II, Atmos. Chem. Phys., 11, 2111–2125,
doi:10.5194/acp-11-2111-2011, 2011.
Barlow, J. F., Halios, C. H., Lane, S. E., and Wood, C. R.: Ob-
servations of urban boundary layer structure during a strong
urban heat island event, Environ. Fluid Mech., 15, 373–398,
doi:10.1007/s10652-014-9335-6, 2015.
Bejan, I., Abd El Aal, Y., Barnes, I., Benter, T., Bohn, B., Wiesen, P.,
and Kleffmann, J.: The photolysis of ortho-nitrophenols: a new
gas phase source of HONO, Phys. Chem. Chem. Phys., 8, 2028–
2035, doi:10.1039/b516590c, 2006.
Bigi, A. and Harrison, R. M.: Analysis of the air pollution climate
at a central urban background site, Atmos. Environ., 44, 2004–
2012, doi:10.1016/j.atmosenv.2010.02.028, 2010.
Bohnenstengel, S. I., Belcher, S. E., Aiken, A., Allan, J. D., Allen,
G., Bacak, A., Bannan, T. J., Barlow, J. F., Beddows, D. C. S.,
Bloss, W. J., Booth, A. M., Chemel, C., Coceal, O., Di Marco,
C. F., Dubey, M. K., Faloon, K. H., Fleming, Z. L., Furger, M.,
Gietl, J. K., Graves, R. R., Green, D. C., Grimmond, C. S. B.,
Halios, C. H., Hamilton, J. F., Harrison, R. M., Heal, M. R.,
Heard, D. E., Helfter, C., Herndon, S. C., Holmes, R. E., Hop-
kins, J. R., Jones, A. M., Kelly, F. J., Kotthaus, S., Langford,
B., Lee, J. D., Leigh, R. J., Lewis, A. C., Lidster, R. T., Lopez-
Hilfiker, F. D., McQuaid, J. B., Mohr, C., Monks, P. S., Nemitz,
E., Ng, N. L., Percival, C. J., Prévôt, A. S. H., Ricketts, H. M.
Atmos. Chem. Phys., 16, 2747–2764, 2016 www.atmos-chem-phys.net/16/2747/2016/
J. D. Lee et al.: Detailed budget analysis of HONO in central London 2761
A., Sokhi, R., Stone, D., Thornton, J. A., Tremper, A. H., Valach,
A. C., Visser, S., Whalley, L. K., Williams, L. R., Xu, L., Young,
D. E., and Zotter, P.: Meteorology, air quality, and health in Lon-
don: The ClearfLo project, B. Am. Meteorol. Soc., 96, 779–804,
doi:10.1175/BAMS-D-12-00245.1, 2014.
Cappa, C. D., Onasch, T. B., Massoli, P., Worsnop, D. R., Bates,
T. S., Cross, E. S., Davidovits, P., Hakala, J., Hayden, K. L.,
Jobson, B. T., Kolesar, K. R., Lack, D. A., Lerner, B. M., Li,
S.-M., Mellon, D., Nuaaman, I., Olfert, J. S., Petäjä, T., Quinn,
P. K., Song, C., Subramanian, R., Williams, E. J., and Zaveri,
R. A.: Radiative Absorption Enhancements Due to the Mixing
State of Atmospheric Black Carbon, Science, 337, 1078–1081,
doi:10.1126/science.1223447, 2012.
Dentener, F., Williams, J., and Metzger, S.: Aqueous phase reac-
tion of HNO4: The impact on tropospheric chemistry, J. Atmos.
Chem., 41, 109–134, doi:10.1023/a:1014233910126, 2002.
Dransfield, T. J., Donahue, N. M., and Anderson, J. G.: High-
Pressure Flow Reactor Product Study of the Reactions of
HOx +NO2: The Role of Vibrationally Excited Intermediates†,
J. Phys. Chem. A, 105, 1507–1514, doi:10.1021/jp002391+,
2001.
Drummond, J. W., Volz, A., and Ehhalt, D. H.: An Optimized
Chemiluminescence Detector for Tropospheric NO Measure-
ments, J. Atmos. Chem., 2, 287–306, doi:10.1007/bf00051078,
1985.
Dusanter, S., Vimal, D., Stevens, P. S., Volkamer, R., Molina, L.
T., Baker, A., Meinardi, S., Blake, D., Sheehy, P., Merten, A.,
Zhang, R., Zheng, J., Fortner, E. C., Junkermann, W., Dubey,
M., Rahn, T., Eichinger, B., Lewandowski, P., Prueger, J., and
Holder, H.: Measurements of OH and HO2 concentrations dur-
ing the MCMA-2006 field campaign – Part 2: Model compar-
ison and radical budget, Atmos. Chem. Phys., 9, 6655–6675,
doi:10.5194/acp-9-6655-2009, 2009.
Edwards, G. D. and Monks, P. S.: Performance of a single-
monochromator diode array spectroradiometer for the determi-
nation of actinic flux and atmospheric photolysis frequencies, J.
Geophys. Res., 108, 8546, doi:10.1029/2002JD002844, 2003.
Elshorbany, Y. F., Kurtenbach, R., Wiesen, P., Lissi, E., Rubio, M.,
Villena, G., Gramsch, E., Rickard, A. R., Pilling, M. J., and
Kleffmann, J.: Oxidation capacity of the city air of Santiago,
Chile, Atmos. Chem. Phys., 9, 2257–2273, doi:10.5194/acp-9-
2257-2009, 2009.
Forster, G. L., Sturges, W. T., Fleming, Z. L., Bandy, B. J.,
and Emeis, S.: A year of H2 measurements at Weybourne
Atmospheric Observatory, UK, 2012, Tellus B, 64, 17771,
doi:10.3402/tellusb.v64i0.17771, 2012.
George, C., Strekowski, R. S., Kleffmann, J., Stemmler, K., and
Ammann, M.: Photoenhanced uptake of gaseous NO2 on solid
organic compounds: a photochemical source of HONO?, Fara-
day Discuss., 130, 195–210, doi:10.1039/b417888m, 2005.
Harrison, R. M. and Kitto, A.-M. N.: Evidence for a Surface Source
of Atmospheric Nitrous Acid, Atmos. Environ., 28, 1089–1094,
1994.
Heard, D. E. and Pilling, M. J.: Measurement of OH and HO2 in the
troposphere, Chem. Rev., 103, 5163–5198, 2003.
Heland, J., Kleffmann, J., Kurtenbach, R., and Wiesen, P.: A
New Instrument To Measure Gaseous Nitrous Acid (HONO)
in the Atmosphere, Environ. Sci. Technol., 35, 3207–3212,
doi:10.1021/es000303t, 2001.
Hofzumahaus, A., Rohrer, F., Lu, K. D., Bohn, B., Brauers, T.,
Chang, C. C., Fuchs, H., Holland, F., Kita, K., Kondo, Y., Li, X.,
Lou, S., Shao, M., Zeng, L., Wahner, A., and Zhang, Y.: Ampli-
fied Trace Gas Removal in the Troposphere, Science, 324, 1702–
1704, 2009.
Hopkins, J. R., Lewis, A. C., and Read, K. A.: A two-column
method for long-term monitoring of non-methane hydrocar-
bons (NMHCs) and oxygenated volatile organic compounds (o-
VOCs), J. Environ. Monit., 5, 8–13, 2003.
Jenkin, M. E., Wyche, K. P., Evans, C. J., Carr, T., Monks, P.
S., Alfarra, M. R., Barley, M. H., McFiggans, G. B., Young,
J. C., and Rickard, A. R.: Development and chamber evalua-
tion of the MCM v3.2 degradation scheme for β-caryophyllene,
Atmos. Chem. Phys., 12, 5275–5308, doi:10.5194/acp-12-5275-
2012, 2012.
Joyce, P. L., von Glasow, R., and Simpson, W. R.: The fate of NOxemissions due to nocturnal oxidation at high latitudes: 1-D sim-
ulations and sensitivity experiments, Atmos. Chem. Phys., 14,
7601–7616, doi:10.5194/acp-14-7601-2014, 2014.
Kim, S., Vandenboer, T. C., Young, C. J., Riedel, T. P., Thornton, J.
A., Swarthout, B., Sive, B., Lerner, B., Gilman, J. B., Warneke,
C., Roberts, J. M., Guenther, A. B., Wagner, N. L., Dubé, W.
P., Williams, E., and Brown, S. S.: The primary and recycling
sources of OH during the NACHT-2011 campaign: HONO as
an important OH primary source in the wintertime, J. Geophys.
Res., 119, 6886–6896, doi:10.1002/2013JD020225, 2014.
Kleffmann, J.: Daytime sources of nitrous acid (HONO) in the at-
mospheric boundary layer, Chem. Phys. Chem., 8, 1137–1144,
doi:10.1002/cphc.200700016, 2007.
Kleffmann, J., Becker, K. H., Lackhoff, M., and Wiesen, P.: Hetero-
geneous Conversion of NO2 on Carbonaceous Surfaces, Phys.
Chem. Chem. Phys., 1, 5443–5450, 1999.
Kleffmann, J., Kurtenbach, R., Lörzer, J., Wiesen, P., Kalthoff, N.,
Vogel, B., and Vogel, H.: Measured and Simulated Vertical Pro-
files of Nitrous Acid, Part I: Field Measurements, Atmos. Envi-
ron, 37, 2949–2955, 2003.
Kleffmann, J., Gavriloaiei, T., Hofzumahaus, A., Holland, F.,
Koppmann, R., Rupp, L., Schlosser, E., Siese, M., and Wah-
ner, A.: Daytime formation of nitrous acid: A major source
of OH radicals in a forest, Geophys. Res. Lett., 32, L05818,
doi:10.1029/2005gl022524, 2005.
Kleffmann, J., Lörzer, J. C., Wiesen, P., Kern, C., Trick, S.,
Volkamer, R., Rodenas, M., and Wirtz, K.: Intercompari-
son of the DOAS and LOPAP techniques for the detection
of nitrous acid (HONO), Atmos. Environ., 40, 3640–3652,
doi:10.1016/j.atmosenv.2006.03.027, 2006.
Kraus, A. and Hofzumahaus, A.: Field measurements of atmo-
spheric photolysis frequencies for O3, NO2, HCHO, CH3CHO,
H2O2, and HONO by UV spectroradiometry, J. Atmos. Chem.,
31, 161–180, doi:10.1023/a:1005888220949, 1998.
Kurtenbach, R., Becker, K. H., Gomes, J. A. G., Kleffmann, J.,
Lörzer, J. C., Spittler, M., Wiesen, P., Ackermann, R., Geyer, A.,
and Platt, U.: Investigations of emissions and heterogeneous for-
mation of HONO in a road traffic tunnel, Atmos. Environ., 35,
3385–3394, doi:10.1016/s1352-2310(01)00138-8, 2001.
Lee, B. H., Wood, E. C., Herndon, S. C., Lefer, B. L., Luke,
W. T., Brune, W. H., Nelson, D. D., Zahniser, M. S., and
Munger, J. W.: Urban measurements of atmospheric nitrous
acid: A caveat on the interpretation of the HONO photo-
www.atmos-chem-phys.net/16/2747/2016/ Atmos. Chem. Phys., 16, 2747–2764, 2016
2762 J. D. Lee et al.: Detailed budget analysis of HONO in central London
stationary state, J. Geophys. Res.-Atmos., 118, 12274–12281,
doi:10.1002/2013JD020341, 2013.
Lee, J. D., Moller, S. J., Read, K. A., Lewis, A. C., Mendes, L., and
Carpenter, L. J.: Year-round measurements of nitrogen oxides
and ozone in the tropical North Atlantic marine boundary layer, J.
Geophys. Res., 114, D21302, doi:10.1029/2009jd011878, 2009.
Legrand, M., Preunkert, S., Frey, M., Bartels-Rausch, Th., Kukui,
A., King, M. D., Savarino, J., Kerbrat, M., and Jourdain, B.:
Large mixing ratios of atmospheric nitrous acid (HONO) at
Concordia (East Antarctic Plateau) in summer: a strong source
from surface snow?, Atmos. Chem. Phys., 14, 9963–9976,
doi:10.5194/acp-14-9963-2014, 2014.
Levy II, H.: Normal Atmosphere: Large Radical and Formaldehyde
Concentrations Predicted, Science, 173, 141–143, 1971.
Li, S., Matthews, J., and Sinha, A.: Atmospheric hydroxyl radical
production from electronically excited NO2 and H2O, Science,
319, 1657–1660, doi:10.1126/science.1151443, 2008.
Li, X., Rohrer, F., Hofzumahaus, A., Brauers, T., Häseler, R., Bohn,
B., Broch, S., Fuchs, H., Gomm, S., Holland, F., Jäger, J., Kaiser,
J., Keutsch, F. N., Lohse, I., Lu, K., Tillmann, R., Wegener, R.,
Wolfe, G. M., Mentel, T. F., Kiendler-Scharr, A., and Wahner,
A.: Missing Gas-Phase Source of HONO Inferred from Zep-
pelin Measurements in the Troposphere, Science, 344, 292–296,
doi:10.1126/science.1248999, 2014.
Lidster, R. T., Hamilton, J. F., Lee, J. D., Lewis, A. C., Hopkins, J.
R., Punjabi, S., Rickard, A. R., and Young, J. C.: The impact of
monoaromatic hydrocarbons on OH reactivity in the coastal UK
boundary layer and free troposphere, Atmos. Chem. Phys., 14,
6677–6693, doi:10.5194/acp-14-6677-2014, 2014.
Michoud, V., Kukui, A., Camredon, M., Colomb, A., Borbon, A.,
Miet, K., Aumont, B., Beekmann, M., Durand-Jolibois, R., Per-
rier, S., Zapf, P., Siour, G., Ait-Helal, W., Locoge, N., Sauvage,
S., Afif, C., Gros, V., Furger, M., Ancellet, G., and Doussin, J. F.:
Radical budget analysis in a suburban European site during the
MEGAPOLI summer field campaign, Atmos. Chem. Phys., 12,
11951–11974, doi:10.5194/acp-12-11951-2012, 2012.
Michoud, V., Colomb, A., Borbon, A., Miet, K., Beekmann, M.,
Camredon, M., Aumont, B., Perrier, S., Zapf, P., Siour, G., Ait-
Helal, W., Afif, C., Kukui, A., Furger, M., Dupont, J. C., Haef-
felin, M., and Doussin, J. F.: Study of the unknown HONO day-
time source at a European suburban site during the MEGAPOLI
summer and winter field campaigns, Atmos. Chem. Phys., 14,
2805–2822, doi:10.5194/acp-14-2805-2014, 2014.
Monge, M. E., D’Anna, B., Mazri, L., Giroir-Fendler, A., Ammann,
M., Donaldson, D. J., and George, C.: Light changes the atmo-
spheric reactivity of soot, P. Natl. Acad. Sci. USA, 107, 6605–
6609, doi:10.1073/pnas.0908341107, 2010.
Oswald R., Behrendt, T., Ermel, M., Wu, D., Su, H., Cheng, Y.,
Breuninger, C., Moravek, A., Mougin, E., Delon, C., Loubet, B.,
Pommerening-Röser, A., Sörgel, M., Pöschl, U., Hoffmann, T.,
Andreae, M. O., Meixner, F. X., and Trebs, I.: HONO Emissions
from Soil Bacteria as a Major Source of Atmospheric Reactive
Nitrogen, Science, 341, 1233–1235, 2013.
Oswald, R., Ermel, M., Hens, K., Novelli, A., Ouwersloot, H. G.,
Paasonen, P., Petäjä, T., Sipilä, M., Keronen, P., Bäck, J., König-
stedt, R., Hosaynali Beygi, Z., Fischer, H., Bohn, B., Kubistin,
D., Harder, H., Martinez, M., Williams, J., Hoffmann, T., Trebs,
I., and Sörgel, M.: A comparison of HONO budgets for two mea-
surement heights at a field station within the boreal forest in
Finland, Atmos. Chem. Phys., 15, 799–813, doi:10.5194/acp-15-
799-2015, 2015.
Pollack, I. B., Lerner, B. M., and Ryerson, T. B.: Evaluation of ultra-
violet light-emitting diodes for detection of atmospheric NO2 by
photolysis – chemiluminescence, J. Atmos. Chem., 65, 111–125,
doi:10.1007/s10874-011-9184-3, 2010.
Qin, M., Xie, P., Su, H., Gu, J., Peng, F., Li, S., Zeng,
L., Liu, J., Liu, W., and Zhang, Y.: An observational
study of the HONO-NO2 coupling at an urban site in
Guangzhou City, South China, Atmos. Environ., 43, 5731–5742,
doi:10.1016/j.atmosenv.2009.08.017, 2009.
Ren, X., Brune, W. H., Oliger, A., Metcalf, A. R., Simpas, J. B.,
Shirley, T., Schwab, J. J., Bai, C. H., Roychowdhury, U., Li,
Y. Q., Cai, C. X., Demerjian, K. L., He, Y., Zhou, X. L., Gao,
H. L., and Hou, J.: OH, HO2, and OH reactivity during the
PMTACS-NY Whiteface Mountain 2002 campaign: Observa-
tions and model comparison, J. Geophys. Res., 111, D10S03,
doi:10.1029/2005JD006126, 2006.
Ren, X., Sanders, J. E., Rajendran, A., Weber, R. J., Goldstein, A.
H., Pusede, S. E., Browne, E. C., Min, K.-E., and Cohen, R.
C.: A relaxed eddy accumulation system for measuring verti-
cal fluxes of nitrous acid, Atmos. Meas. Tech., 4, 2093–2103,
doi:10.5194/amt-4-2093-2011, 2011.
Ren, X. R., Harder, H., Martinez, M., Lesher, R. L., Oliger, A., Sim-
pas, J. B., Brune, W. H., Schwab, J. J., Demerjian, K. L., He, Y.,
Zhou, X., and Gao, H.: OH and HO2 chemistry in the urban at-
mosphere of New York City, Atmos. Environ., 37, 3639–3651,
2003.
Rutter, A. P., Malloy, Q. G. J., Leong, Y. J., Gutierrez, C.
V., Calzada, M., Scheuer, E., Dibb, J. E., and Griffin, R.
J.: The reduction of HNO3 by volatile organic compounds
emitted by motor vehicles, Atmos. Environ., 87, 200–206,
doi:10.1016/j.atmosenv.2014.01.056, 2014.
Salmon, R. A., Bauguitte, S. J. B., Bloss, W., Hutterli, M. A., Jones,
A. E., Read, K., and Wolff, E. W.: Measurement and interpreta-
tion of gas phase formaldehyde concentrations obtained during
the CHABLIS campaign in coastal Antarctica, Atmos. Chem.
Phys., 8, 4085–4093, doi:10.5194/acp-8-4085-2008, 2008.
Sander, S. P. and Peterson, M. E.: Kinetics of the Reaction
HO2+NO2+M=HO2NO2+M, J. Phys. Chem., 88, 1566–
1571, doi:10.1021/j150652a025, 1984.
Scharko, N. K., Berke, A. E., and Raff, J. D.: Release of Nitrous
Acid and Nitrogen Dioxide from Nitrate Photolysis in Acidic
Aqueous Solutions, Environ. Sci. Technol., 48, 11991–12001,
doi:10.1021/es503088x, 2014.
Sörgel, M., Trebs, I., Serafimovich, A., Moravek, A., Held, A., and
Zetzsch, C.: Simultaneous HONO measurements in and above
a forest canopy: influence of turbulent exchange on mixing ratio
differences, Atmos. Chem. Phys., 11, 841–855, doi:10.5194/acp-
11-841-2011, 2011a.
Sörgel, M., Regelin, E., Bozem, H., Diesch, J.-M., Drewnick, F.,
Fischer, H., Harder, H., Held, A., Hosaynali-Beygi, Z., Martinez,
M., and Zetzsch, C.: Quantification of the unknown HONO day-
time source and its relation to NO2, Atmos. Chem. Phys., 11,
10433–10447, doi:10.5194/acp-11-10433-2011, 2011b.
Sörgel, M., Trebs, I., Wu, D., and Held, A.: A comparison of mea-
sured HONO uptake and release with calculated source strengths
in a heterogeneous forest environment, Atmos. Chem. Phys., 15,
9237–9251, doi:10.5194/acp-15-9237-2015, 2015.
Atmos. Chem. Phys., 16, 2747–2764, 2016 www.atmos-chem-phys.net/16/2747/2016/
J. D. Lee et al.: Detailed budget analysis of HONO in central London 2763
Steinbacher, M., Zellweger, C., Schwarzenbach, B., Bugmann, S.,
Buchmann, B., Ordonez, C., Prevot, A. S. H., and Hueglin, C.:
Nitrogen oxide measurements at rural sites in Switzerland: Bias
of conventional measurement techniques, J. Geophys. Res., 112,
D11307, doi:10.1029/2006jd007971, 2007.
Stemmler, K., Ammann, M., Donders, C., Kleffmann, J., and
George, C.: Photosensitized reduction of nitrogen dioxide on
humic acid as a source of nitrous acid, Nature, 440, 195–198,
doi:10.1038/nature04603, 2006.
Stemmler, K., Ndour, M., Elshorbany, Y., Kleffmann, J., D’Anna,
B., George, C., Bohn, B., and Ammann, M.: Light induced
conversion of nitrogen dioxide into nitrous acid on submi-
cron humic acid aerosol, Atmos. Chem. Phys., 7, 4237–4248,
doi:10.5194/acp-7-4237-2007, 2007.
Stone, D. and Rowley, D. M.: Kinetics of the Gas Phase HO2 Self-
Reaction: Effects of Temperature, Pressure, Water and Methanol
Vapours, Phys. Chem. Chem. Phys., 7, 2156–2163, 2005.
Stutz, J., Alicke, B., and Neftel, A.: Nitrous acid formation in
the urban atmosphere: Gradient measurements of NO2 and
HONO over grass in Milan, Italy, J. Geophys. Res., 107, 8192,
doi:10.1029/2001jd000390, 2002.
Su, H., Cheng, Y. F., Cheng, P., Zhang, Y. H., Dong, S., Zeng, L.
M., Wang, X., Slanina, J., Shao, M., and Wiedensohler, A.: Ob-
servation of nighttime nitrous acid (HONO) formation at a non-
urban site during PRIDE-PRD2004 in China, Atmos. Environ.,
42, 6219–6232, doi:10.1016/j.atmosenv.2008.04.006, 2008a.
Su, H., Cheng, Y. F., Shao, M., Gao, D. F., Yu, Z. Y., Zeng, L.
M., Slanina, J., Zhang, Y. H., and Wiedensohler, A.: Nitrous
acid (HONO) and its daytime sources at a rural site during
the 2004 PRIDE-PRD experiment in China, J. Geophys. Res.-
Atmos., 113, D14312, doi:10.1029/2007jd009060, 2008b.
Su, H., Cheng, Y., Oswald, R., Behrendt, T., Trebs, I., Meixner, F.
X., Andreae, M. O., Cheng, P., Zhang, Y., and Pöschl, U.: Soil
Nitrite as a Source of Atmospheric HONO and OH Radicals, Sci-
ence, 333, 1616–1618, doi:10.1126/science.1207687, 2011.
Trebs, I., Lara, L. L., Zeri, L. M. M., Gatti, L. V., Artaxo, P., Dlugi,
R., Slanina, J., Andreae, M. O., and Meixner, F. X.: Dry and wet
deposition of inorganic nitrogen compounds to a tropical pas-
ture site (Rondônia, Brazil), Atmos. Chem. Phys., 6, 447–469,
doi:10.5194/acp-6-447-2006, 2006.
Tyndall, G. S., Orlando, J. J., and Calvert, J. G.: Upper Limit for the
Rate Coefficient for the Reaction HO2+NO2→HONO+O2,
Environ. Sci. Technol., 29, 202–206, doi:10.1021/es00001a026,
1995.
VandenBoer, T. C., Brown, S. S., Murphy, J. G., Keene, W. C.,
Young, C. J., Pszenny, A. A. P., Kim, S., Warneke, C., de Gouw,
J. A., Maben, J. R., Wagner, N. L., Riedel, T. P., Thornton, J. A.,
Wolfe, D. E., Dubé, W. P., Öztürk, F., Brock, C. A., Grossberg,
N., Lefer, B., Lerner, B., Middlebrook, A. M., and Roberts, J. M.:
Understanding the role of the ground surface in HONO vertical
structure: High resolution vertical profiles during NACHTT-11,
J. Geophys. Res., 118, 10155–10171, doi:10.1002/jgrd.50721,
2013.
Villena, G., Kleffmann, J., Kurtenbach, R., Wiesen, P., Lissi, E., Ru-
bio, M. A., Croxatto, G., and Rappenglück, B.: Vertical gradients
of HONO, NOx and O3 in Santiago de Chile, Atmos. Environ.,
45, 3867–3873, doi:10.1016/j.atmosenv.2011.01.073, 2011.
Villena, G., Bejan, I., Kurtenbach, R., Wiesen, P., and Kleffmann, J.:
Interferences of commercial NO2 instruments in the urban atmo-
sphere and in a smog chamber, Atmos. Meas. Tech., 5, 149–159,
doi:10.5194/amt-5-149-2012, 2012.
Vogel, B., Vogel, H., Kleffmann, J., and Kurtenbach, R.: Measured
and simulated vertical profiles of nitrous acid – Part II. Model
simulations and indications for a photolytic source, Atmos.
Environ., 37, 2957–2966, doi:10.1016/S1352-2310(03)00243-7,
2003.
Whalley, L. K., Blitz, M. A., Desservettaz, M., Seakins, P. W., and
Heard, D. E.: Reporting the sensitivity of laser-induced fluores-
cence instruments used for HO2 detection to an interference from
RO2 radicals and introducing a novel approach that enables HO2
and certain RO2 types to be selectively measured, Atmos. Meas.
Tech., 6, 3425–3440, doi:10.5194/amt-6-3425-2013, 2013.
Whalley, L. K., Stone, D., George, I. J., Mertes, S., van Pinx-
teren, D., Tilgner, A., Herrmann, H., Evans, M. J., and Heard,
D. E.: The influence of clouds on radical concentrations: obser-
vations and modelling studies of HOx during the Hill Cap Cloud
Thuringia (HCCT) campaign in 2010, Atmos. Chem. Phys., 15,
3289–3301, doi:10.5194/acp-15-3289-2015, 2015.
Whalley, L. K., Stone, D., Bandy, B., Dunmore, R., Hamilton, J.
F., Hopkins, J., Lee, J. D., Lewis, A. C., and Heard, D. E.: At-
mospheric OH reactivity in central London: observations, model
predictions and estimates of in situ ozone production, Atmos.
Chem. Phys., 16, 2109–2122, doi:10.5194/acp-16-2109-2016,
2016.
Wong, K. W., Tsai, C., Lefer, B., Haman, C., Grossberg, N., Brune,
W. H., Ren, X., Luke, W., and Stutz, J.: Daytime HONO vertical
gradients during SHARP 2009 in Houston, TX, Atmos. Chem.
Phys., 12, 635–652, doi:10.5194/acp-12-635-2012, 2012.
Wong, K. W., Tsai, C., Lefer, B., Grossberg, N., and Stutz, J.: Mod-
eling of daytime HONO vertical gradients during SHARP 2009,
Atmos. Chem. Phys., 13, 3587–3601, doi:10.5194/acp-13-3587-
2013, 2013.
Ye, C., Zhou, X., Pu, D., Stutz, J., Festa, J., Spolaor, M., Cantrell,
C., Mauldin, R. L., Weinheimer, A., and Haggerty, J.: Comment
on “Missing Gas-phase Source of HONO Inferred from Zeppelin
Measurements in the Troposphere”, Science, 348, 1326–1326,
doi:10.1126/science.aaa1992, 2015.
Young, C. J., Washenfelder, R. A., Roberts, J. M., Mielke, L. H.,
Osthoff, H. D., Tsai, C., Pikelnaya, O., Stutz, J., Veres, P. R.,
Cochran, A. K., Vandenboer, T. C., Flynn, J., Grossberg, N.,
Haman, C. L., Lefer, B., Stark, H., Graus, M., De Gouw, J.,
Gilman, J. B., Kuster, W. C., and Brown, S. S.: Vertically re-
solved measurements of nighttime radical reservoirs in Los An-
geles and their contribution to the urban radical budget, Environ.
Sci. Technol., 46, 10965–10973, doi:10.1021/es302206a, 2012.
Young, D. E., Allan, J. D., Williams, P. I., Green, D. C., Harri-
son, R. M., Yin, J., Flynn, M. J., Gallagher, M. W., and Coe,
H.: Investigating a two-component model of solid fuel organic
aerosol in London: processes, PM1 contributions, and season-
ality, Atmos. Chem. Phys., 15, 2429–2443, doi:10.5194/acp-15-
2429-2015, 2015.
Zhang, N., Zhou, X., Shepson, P. B., Gao, H., Alaghmand, M.,
and Stirm, B.: Aircraft measurement of HONO vertical pro-
files over a forested region, Geophys. Res. Lett., 36, L15820,
doi:10.1029/2009GL038999, 2009.
Zhang, N., Zhou, X., Bertman, S., Tang, D., Alaghmand, M.,
Shepson, P. B., and Carroll, M. A.: Measurements of ambient
HONO concentrations and vertical HONO flux above a northern
www.atmos-chem-phys.net/16/2747/2016/ Atmos. Chem. Phys., 16, 2747–2764, 2016

2764 J. D. Lee et al.: Detailed budget analysis of HONO in central London
Michigan forest canopy, Atmos. Chem. Phys., 12, 8285–8296,
doi:10.5194/acp-12-8285-2012, 2012.
Zhou, X., Civerolo, K., Dai, H., Huang, G., Schwab, J., and Demer-
jian, K.: Summertime nitrous acid chemistry in the atmospheric
boundary layer at a rural site in New York State, J. Geophys.
Res., 107, 4590, doi:10.1029/2001jd001539, 2002.
Zhou, X., Gao, H., He, Y., Huang, G., Bertman, S. B., Civerolo,
K., and Schwab, J.: Nitric acid photolysis on surfaces in low-
NOx environments: Significant atmospheric implications, Geo-
phys. Res. Lett., 30, 2217, doi:10.1029/2003gl018620, 2003.
Zhou, X., Zhang, N., TerAvest, M., Tang, D., Hou, J., Bertman,
S., Alaghmand, M., Shepson, P. B., Carroll, M. A., Griffith, S.,
Dusanter, S., and Stevens, P. S.: Nitric acid photolysis on for-
est canopy surface as a source for tropospheric nitrous acid, Nat.
Geosci., 4, 440–443, doi:10.1038/NGEO1164, 2011.
Ziemba, L. D., Dibb, J. E., Griffin, R. J., Anderson, C. H., Whitlow,
S. I., Lefer, B. L., Rappenglück, B., and Flynn, J.: Heterogeneous
conversion of nitric acid to nitrous acid on the surface of primary
organic aerosol in an urban atmosphere, Atmos. Environ., 44,
4081–4089, doi:10.1016/j.atmosenv.2008.12.024, 2010.
Atmos. Chem. Phys., 16, 2747–2764, 2016 www.atmos-chem-phys.net/16/2747/2016/