Embed Size (px)
Citation preview
DET NORSKE VERITAS
ReportCorrib Onshore Pipeline QRA
Shell E&P Ireland Ltd.
Report no/DNV Reg No.: 01/ 12LKQW5-2 Rev 01, 2010-05-18
For
insp
ectio
n pur
pose
s only
.
Conse
nt of
copy
right
owne
r req
uired
for a
ny ot
her u
se.
EPA Export 19-02-2014:23:33:57
DET NORSKE VERITAS
Report for Shell E&P Ireland Ltd. Corrib Onshore Pipeline EIS
MANAGING RISK
DNV Reg. No.: 12LKQW5-2 Revision No.: 0 Date : 2010-05-18 Page i of vi
For
insp
ectio
n pur
pose
s only
.
Conse
nt of
copy
right
owne
r req
uired
for a
ny ot
her u
se.
EPA Export 19-02-2014:23:33:57
DET NORSKE VERITAS
Report for Shell E&P Ireland Ltd. Corrib Onshore Pipeline EIS
MANAGING RISK
DNV Reg. No.: 12LKQW5-2 Revision No.: 0 Date : 2010-05-18 Page ii of vi
Table of Contents
SUMMARY & CONCLUSIONS............................................................................................ 1Summary.............................................................................................................................. 1
Conclusions.......................................................................................................................... 1
1 INTRODUCTION ............................................................................................................. 3
2 OVERVIEW OF QRA METHODOLOGY .................................................................... 42.1 Purpose of this Section............................................................................................... 4
2.2 Risk & Risk Assessment ............................................................................................ 4
2.3 Overview of QRA ...................................................................................................... 4 2.3.1 Define QRA Scope, Objectives and Criteria ....................................................... 5 2.3.2 Hazard & Scenario Identification ........................................................................ 5 2.3.3 Frequency & Probability Determination, and Event Outcome Analysis............. 6 2.3.4 Consequence Modelling and Evaluation ............................................................. 7 2.3.5 Calculate Risk Values.......................................................................................... 8
2.3.5.1 Sensitivity Analysis..................................................................................... 8 2.3.5.2 Presentation of Predicted Risk Values ........................................................ 8 Individual Risk............................................................................................................ 9 Societal Risk ............................................................................................................. 11 Zoning 11
2.3.6 Comparison of QRA Predictions with Risk Criteria ......................................... 11
3 QRA OBJECTIVES, SCOPE AND RISK CRITERIA ............................................... 133.1 Objectives of the QRA ............................................................................................. 13
3.2 QRA Scope............................................................................................................... 13
3.3 Risk Criteria ............................................................................................................. 143.3.1 Individual Risk................................................................................................... 14 3.3.2 Societal Risk ...................................................................................................... 15 3.3.3 Risk Zones ......................................................................................................... 15
4 PIPELINE DESCRIPTION............................................................................................ 16
5 HAZARD, RISK & SCENARIO IDENTIFICATION................................................. 185.1 Hazard & Risk.......................................................................................................... 18
5.2 Event Scenarios ........................................................................................................ 18
6 FREQUENCY ANALYSIS............................................................................................. 196.1 Introduction .............................................................................................................. 19
For
insp
ectio
n pur
pose
s only
.
Conse
nt of
copy
right
owne
r req
uired
for a
ny ot
her u
se.
EPA Export 19-02-2014:23:33:57
DET NORSKE VERITAS
Report for Shell E&P Ireland Ltd. Corrib Onshore Pipeline EIS
MANAGING RISK
DNV Reg. No.: 12LKQW5-2 Revision No.: 0 Date : 2010-05-18 Page iii of vi
6.2 Appropriate Databases for the Corrib Pipeline ........................................................ 20 6.2.1 EGIG [5] ............................................................................................................ 21
6.2.1.1 External Interference................................................................................. 22 6.2.1.2 Corrosion................................................................................................... 23 6.2.1.3 Fabrication and Construction Defect/Material Failure ............................. 23 6.2.1.4 Hot Tap Made in Error.............................................................................. 23 6.2.1.5 Ground Movement .................................................................................... 23 6.2.1.6 Other and Unknown .................................................................................. 23
6.2.2 CONCAWE [6] ................................................................................................. 24 6.2.3 PARLOC [7]...................................................................................................... 24 6.2.4 UKOPA [8]........................................................................................................ 26 6.2.5 Shell Data .......................................................................................................... 26 6.2.6 Appropriate Database for the LVI ..................................................................... 26 6.2.7 Hydrocarbon Release Database [9] ................................................................... 27
6.3 Potential Causes of Loss of Containment from the Pipeline.................................... 27 6.3.1 Qualitative Risk Assessment ............................................................................. 27 6.3.2 Screened Failure Scenarios................................................................................ 30
6.3.2.1 Internal Erosion......................................................................................... 30 6.3.2.2 Low Temperature – Brittle Fracture ......................................................... 31 6.3.2.3 Low Temperature – Hydrates.................................................................... 31 6.3.2.4 High Temperature ..................................................................................... 31 6.3.2.5 Overpressurisation..................................................................................... 32 6.3.2.6 External fire - Peat .................................................................................... 32 6.3.2.7 External fire – Methanol ........................................................................... 32 6.3.2.8 Pipeline Expansion.................................................................................... 32 6.3.2.9 Incident at the terminal.............................................................................. 32 6.3.2.10 Hot Tapping of the Wrong Pipeline .......................................................... 33 6.3.2.11 Future Exploration Well brings in different Properties............................. 33 6.3.2.12 Internal Dynamic Loads............................................................................ 33 6.3.2.13 Fatigue....................................................................................................... 33 6.3.2.14 Impact damage of pipeline beneath public road crossing ......................... 33 6.3.2.15 Fuel tanker explosion at road crossing...................................................... 33 6.3.2.16 Seismic events........................................................................................... 34 6.3.2.17 Plane crash onto pipeline .......................................................................... 34
6.4 Failure Scenarios Specific to the Corrib Pipeline .................................................... 34 6.4.1 Screening Against Pipeline Failure Mode using Specific Technical
Reports............................................................................................................... 35 6.4.2 External Corrosion............................................................................................. 37
6.4.2.1 External Corrosion Failure Frequency ...................................................... 37 6.4.3 Internal Corrosion.............................................................................................. 38
6.4.3.1 Internal Corrosion Failure Frequency ....................................................... 39 6.4.4 Material Manufacture and Construction Defects............................................... 40
6.4.4.1 Material Manufacture & Construction Defects Failure Frequency........... 40
For
insp
ectio
n pur
pose
s only
.
Conse
nt of
copy
right
owne
r req
uired
for a
ny ot
her u
se.
EPA Export 19-02-2014:23:33:57
DET NORSKE VERITAS
Report for Shell E&P Ireland Ltd. Corrib Onshore Pipeline EIS
MANAGING RISK
DNV Reg. No.: 12LKQW5-2 Revision No.: 0 Date : 2010-05-18 Page iv of vi
6.4.5 Ground Movement............................................................................................. 40 6.4.5.1 Ground Movement Failure Frequency ...................................................... 41
6.4.6 Accidental External Interference ....................................................................... 41 6.4.6.1 Accidental External Interference Failure Frequency ................................ 42
6.4.7 Third Party Intentional Damage ........................................................................ 42 6.4.7.1 Third Party Intentional Damage Failure Frequency.................................. 43
6.4.8 Other / Unknown ............................................................................................... 43 6.4.8.1 Failure Frequency due to Other Causes .................................................... 43
6.5 Pipeline Hole Size Distribution................................................................................ 43
6.6 Overall Corrib Pipeline Failure Frequency .............................................................. 44
6.7 Equipment at the LVI - Generic Frequencies and Hole Size Distribution............... 46 6.7.1 Specific Failure Frequencies for the LVI Equipment........................................ 47
6.7.1.1 External Corrosion .................................................................................... 47 6.7.1.2 Internal Corrosion ..................................................................................... 47 6.7.1.3 Erosion ...................................................................................................... 48 6.7.1.4 Manufacturing or Material Defect ............................................................ 48 6.7.1.5 Mechanical Failure due Improper Maintenance or Wear ......................... 48 6.7.1.6 Incorrect Fitting......................................................................................... 48 6.7.1.7 Mechanical Failure due to other causes .................................................... 48 6.7.1.8 Opened in Error......................................................................................... 48 6.7.1.9 Other/unknown.......................................................................................... 49 6.7.1.10 Frequency Derivation................................................................................ 49
6.8 Overall LVI Failure Frequency ................................................................................ 49
6.9 Ignition Probability .................................................................................................. 51
6.10 Presence Factor ........................................................................................................ 52
7 CONSEQUENCE ANALYSIS ....................................................................................... 537.1 Release Rate ............................................................................................................. 53
7.1.1 Release Rate from Holes ................................................................................... 53 7.1.2 Release Rate from Ruptures .............................................................................. 53
7.2 Heat Radiated ........................................................................................................... 55 7.2.1 Immediate ignition............................................................................................. 55 7.2.2 Delayed Ignition ................................................................................................ 56
7.2.2.1 Overpressure Hazard................................................................................. 56 7.2.3 Model Validation............................................................................................... 57 7.2.4 Weather.............................................................................................................. 57
7.3 Physical Effects ........................................................................................................ 58 7.3.1 Effects on People ............................................................................................... 58 7.3.2 Effects on Buildings .......................................................................................... 59
7.4 Sensitivity Studies .................................................................................................... 60
7.5 Risk Estimation Rule Sets ........................................................................................ 62
For
insp
ectio
n pur
pose
s only
.
Conse
nt of
copy
right
owne
r req
uired
for a
ny ot
her u
se.
EPA Export 19-02-2014:23:33:57
DET NORSKE VERITAS
Report for Shell E&P Ireland Ltd. Corrib Onshore Pipeline EIS
MANAGING RISK
DNV Reg. No.: 12LKQW5-2 Revision No.: 0 Date : 2010-05-18 Page v of vi
8 PREDICTIONS................................................................................................................ 638.1 Rule Set based Consequence Distances ................................................................... 64
8.2 Risk Transects .......................................................................................................... 65
8.3 Risk Contours........................................................................................................... 65
8.4 Predicted Individual Risks at houses closest to the Pipeline.................................... 67
8.5 Societal Risk............................................................................................................. 67
8.6 Risk Zones................................................................................................................ 68
8.7 Sensitivity Studies .................................................................................................... 70
9 REFERENCES ................................................................................................................ 71
Table of Figures; Figure 1: QRA Method............................................................................................................... 5 Figure 2: Event Tree Example.................................................................................................... 6 Figure 3: Consequence Modelling for an Event which involves Ignition.................................. 7 Figure 4: Example Individual Risk Contour associated with a Gas Pipeline............................. 9 Figure 5: Example of Pipeline Individual Risk Transect ......................................................... 10 Figure 6: Example F-N Graph.................................................................................................. 11Figure 7: PD 8010-3 FN Criterion Line ................................................................................... 15 Figure 8: Onshore Pipeline Route ............................................................................................ 17 Figure 9: Process for selection of Failure Frequency and Hole Size value.............................. 20 Figure 10: Possible Threats Identified in the Qualitative Risk Assessment for the Onshore Pipeline ...................................................................................................................... 28 Figure 11: Release Rates from Ruptures.................................................................................. 55 Figure 12: Transects of Individual Risk of a Dangerous Dose or more (LVI and Pipeline).... 65 Figure 13: Contour Plot for Individual Risk of Receiving a Dangerous Dose or more ........... 66 Figure 14: Predicted Societal Risk at Glengad......................................................................... 67 Figure 15: Plot of Risk Zones for the Pipeline & LVI ............................................................. 69 Figure 16: Sensitivities for the Pipeline (Individual Risk of a Dangerous Dose) ...................... 2 Figure 17: Sensitivities for the Pipeline (Individual Risk of Fatality) ....................................... 2 Figure 18: Sensitivities for the LVI (Individual Risk of a Dangerous Dose)............................. 3 Figure 19: Sensitivities for the LVI (Individual Risk of Fatality).............................................. 3 Figure 20: Gas Dispersion for Full Bore Release Weather F Stability Wind Speed 2 m/s........ 2 Figure 21: Gas Dispersion for Full Bore Release Weather D Stability Wind Speed 5 m/s ....... 2 Figure 22: Gas Dispersion from a hole in the pipeline directed horizontally in Weather F Stability Wind Speed 2 m/s ........................................................................................................ 3 Figure 23: Gas Dispersion from a hole in the pipeline directed horizontally in Weather D Stability Wind Speed 5 m/s ........................................................................................................ 3
Table of Tables; Table 1: Ways of Presenting Numerical Values of Individual Risk ........................................ 10 Table 2: Summary of Pipeline Failure Causes (European Gas Pipeline Incident Data Group (EGIG) 7th Report 1970-2007. ...................................................................................... 22 Table 3: Summary of Pipeline Failure Causes (CONCAWE) ................................................. 25
For
insp
ectio
n pur
pose
s only
.
Conse
nt of
copy
right
owne
r req
uired
for a
ny ot
her u
se.
EPA Export 19-02-2014:23:33:57
DET NORSKE VERITAS
Report for Shell E&P Ireland Ltd. Corrib Onshore Pipeline EIS
MANAGING RISK
DNV Reg. No.: 12LKQW5-2 Revision No.: 0 Date : 2010-05-18 Page vi of vi
Table 4: Causes included in ‘Other’ Category (UKOPA Database) ........................................ 26 Table 5: Possible Threats Identified in the Qualitative Risk Assessment for the Onshore Pipeline..................................................................................................................................... 29 Table 6: Failure Causes Screened Out of the QRA.................................................................. 30 Table 7: Corrib Pipeline Specific Failure Scenarios ................................................................ 35 Table 8: Relevant Technical reports......................................................................................... 36 Table 9: Base Failure Frequencies for the Pipeline.................................................................. 45 Table 10: Generic Failure Frequencies for Equipment at the LVI........................................... 47 Table 11: Base Failure Frequencies for the LVI ...................................................................... 50 Table 12: Ignition Probabilities of Release from Gas Pipelines .............................................. 51 Table 13: Rule sets for the Effect of Thermal Radiation Dose on People ............................... 58 Table 14: Sensitivity Studies.................................................................................................... 61 Table 15: Thermal Flux and Dose Rule -sets Used for Risk Calculations............................... 62 Table 16: Rule Set Consequence, and Risk Predictions........................................................... 63 Table 17: Consequence Distances............................................................................................ 64 Table 18: Predicted Individual Risks at the Houses nearest to the Pipeline ............................ 67 Table 19: Sensitivity Studies.................................................................................................... 70 Table 20: Sensitivity Predictions (Individual Risk of Fatality).................................................. 4
Attachment A PIE Report Attachment B Sensitivity Predictions Attachment C Gas Dispersion Predictions
For
insp
ectio
n pur
pose
s only
.
Conse
nt of
copy
right
owne
r req
uired
for a
ny ot
her u
se.
EPA Export 19-02-2014:23:33:57
DET NORSKE VERITAS
Report for Shell E&P Ireland Ltd. Corrib Onshore Pipeline EIS
MANAGING RISK
DNV Reg. No.: 12LKQW5-2 Revision No.: 0 Date : 2010-05-18 Page 1
SUMMARY & CONCLUSIONS
SummaryIn order to comply with relevant pipeline design Codes and meet the requirements of An Bord Pleanála’s letters dated 2nd November 2009 and 29th January 2010 Det Norske Veritas (DNV) has carried out a Quantified Risk Assessment (QRA) of the Corrib onshore and nearshore pipeline and Landfall Valve Installation (LVI).
This report explains the QRA process, how the QRA has been carried out, and the measures of risk presented. It describes the analysis of likelihood and consequences associated with potential pipeline failure, the data and assumptions used in the analysis, and presents the QRA predictions. These predictions provide a numerical estimate of the residual public safety risks during the operational phase associated with hydrocarbon gas releases from the pipeline and LVI in terms of:
Individual risk.
Societal risk.
Distances to the boundaries of the inner, middle and outer zones.
The QRA uses the latest information concerning the facilities and their surroundings, has been carried out in accordance with the methodology in PD 8010 Part 1 [3] and PD 8010 Part 3 [1], uses similar methodology to that used by the UK Health and Safety Executive (HSE) and applies the risk criteria adopted by An Bord Pleanála as described in their letters dated 2nd November 2009 and 29th January 2010.
ConclusionsThe overall conclusion is that the predicted levels of risk associated with the proposed pipeline and LVI pose an extremely low risk to the occupants of dwellings along the route of the pipeline.
In support of this conclusion key predictions of the QRA are summarised below:
Pipeline:
The predicted level of individual risk of receiving a dangerous dose or more at the nearest dwelling to the pipeline is 1.8x10⁻¹¹ per year (i.e. 1.8 chances in every 100,000,000,000 years). This is almost five orders of magnitude, or 100,000 times, below An Bord Pleanála’s adopted level of risk below which the risk is classified as ‘broadly acceptable’ (1x10⁻⁶ per year i.e. one chance in 1,000,000 years)
The predicted level of individual risk of receiving a dangerous dose or more standing at the pipeline is 2.9x 10⁻⁹ per year (i.e. 2.9 chances in every 1,000,000,000 years); this isalso well below the 1x10⁻⁶ per year level. Furthermore it is also below the level adopted by An Bord Pleanála for the outer boundary of the outer zone of 0.3x 10⁻⁶ per year. It is therefore not possible to plot the individual risk contours or the inner, middle and outer zone boundaries for the pipeline as requested in An Bord Pleanála’s letters of 2nd
November 2009 and 29th January 2010.
For
insp
ectio
n pur
pose
s only
.
Conse
nt of
copy
right
owne
r req
uired
for a
ny ot
her u
se.
EPA Export 19-02-2014:23:33:57

DET NORSKE VERITAS
Report for Shell E&P Ireland Ltd. Corrib Onshore Pipeline EIS
MANAGING RISK
DNV Reg. No.: 12LKQW5-2 Revision No.: 0 Date : 2010-05-18 Page 2
The societal risk associated with the pipeline is also very low, being almost six orders of magnitude, or 1,000,000 times, below the criterion line for ‘broadly acceptable’ in PD 8010 Part 3 [1].
The above conclusions are drawn based on the predictions from the ‘base case’ assumptions applied within the QRA. This base case is regarded by DNV as the most appropriate application of data, assumptions and rule-sets specific to the Corrib pipeline. However, a number of sensitivities using more onerous frequencies and assumptions have been carried out to test the QRA predictions, examples are:
o Inclusion of a frequency for ground movement (not considered as a credible cause of failure in the base case) increases the predicted individual risk of receiving a dangerous dose or more from 1.8x10⁻¹¹ to 7.3x10⁻¹⁰ per year at the nearest dwelling and at the pipeline from 2.9x10⁻⁹ per year to 1.7x10⁻⁸ per year. Thus the individual risk at the pipeline remains almost two orders of magnitude below the ‘broadly acceptable’ region boundary.
o Application of a slower speed of movement to safety of 1m/s (2.5m/s is used in the base case) within the rule-set adopted for consequence modelling to determine the individual risk of receiving a dangerous dose or more at the nearest occupied dwelling shows only a marginal increase from 1.8x10⁻¹¹ per year to 2.5x10⁻¹¹ per year.
LVI:
The predicted levels of individual risk of receiving a dangerous dose or more from the LVI are such that the 1x10⁻⁶ per year contour is 63m from the facility. The nearest dwelling is 280m from the LVI.
The predicted distances from the LVI to the middle and outer zone outer boundaries are 63m and 91m respectively. The predicted risk level at the LVI is just below 1x10⁻⁵ per year, which is the outer boundary of the inner zone.
Applying a sensitivity to the valve failure frequency in the base case gives predicted distances from the LVI to the the outer boundaries of the inner, middle and outer zones of 111m, 124m and 132m respectively.
For
insp
ectio
n pur
pose
s only
.
Conse
nt of
copy
right
owne
r req
uired
for a
ny ot
her u
se.
EPA Export 19-02-2014:23:33:57

DET NORSKE VERITAS
Report for Shell E&P Ireland Ltd. Corrib Onshore Pipeline EIS
MANAGING RISK
DNV Reg. No.: 12LKQW5-2 Revision No.: 0 Date : 2010-05-18 Page 3
1 INTRODUCTIONThis section of Appendix Q presents the quantified risk assessment (QRA) of the proposed Corrib pipeline (onshore and nearshore), and the Landfall Valve Installation (LVI) and addresses the specific points in An Bord Pleanála’s letters dated 2nd November 2009 and 29th January 2010. It covers the routing of the pipeline beneath Sruwaddacon Bay and Maximum Allowable Operating Pressure (MAOP) now applied and follows on from previous pipeline QRAs carried out by Advantica (2006) [28], and DNV (2009) [16].
This report provides a general introduction to the QRA process and goes on to explain how QRA has been carried out for the Corrib pipeline. It describes the data and assumptions used in the assessment, and presents the Corrib pipeline QRA predictions.
For
insp
ectio
n pur
pose
s only
.
Conse
nt of
copy
right
owne
r req
uired
for a
ny ot
her u
se.
EPA Export 19-02-2014:23:33:57
DET NORSKE VERITAS
Report for Shell E&P Ireland Ltd. Corrib Onshore Pipeline EIS
MANAGING RISK
DNV Reg. No.: 12LKQW5-2 Revision No.: 0 Date : 2010-05-18 Page 4
2 OVERVIEW OF QRA METHODOLOGY
2.1 Purpose of this Section This section describes the method and study structure applied for the Corrib pipeline as a lead-into the full technical analysis and assessment in the sections that follow.
2.2 Risk & Risk Assessment In the context of a QRA risk may be considered as the likelihood or chance of somebody being harmed by a hazard (where hazard is defined as anything that can cause harm e.g. chemicals, electricity, driving a car). The level of risk is based on a combination of the likelihood of the event happening and the consequence of the event. Likelihood is expressed within a QRA as a frequency or probability.
Risk can however be assessed either qualitatively or quantitatively.
Qualitative risk assessment incorporates a judgment of likelihood and consequence or severity (and therefore risk) which does not involve numbers but instead uses categories such as ‘high’, ‘medium’ and ‘low’.
Quantitative (or Quantified) risk assessment (QRA) involves assigning, for each discrete event, numerical values to the likelihood (frequency) and severity (or consequences) of the outcomes. All the discrete events are then combined to give a (total) numerical risk level. These calculated numerical risks are then assessed by comparing with risk acceptance/tolerability criteria (risk criteria).
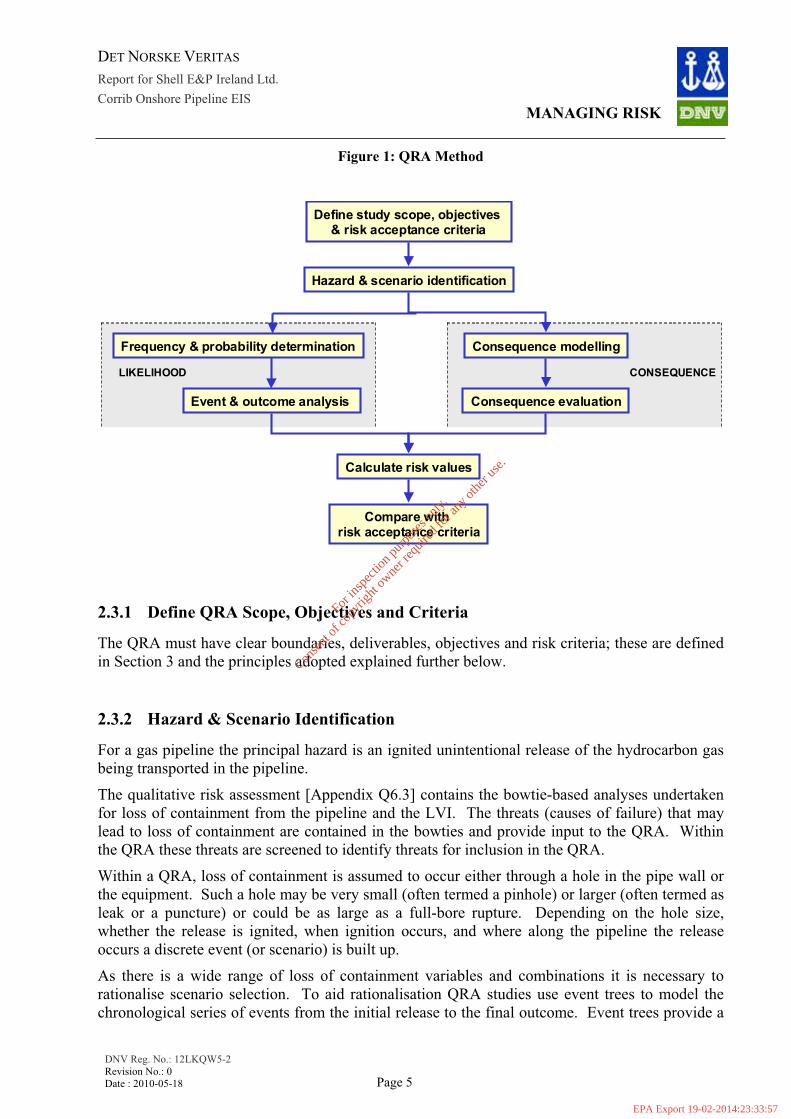
2.3 Overview of QRA Typically, a QRA will consist of the steps shown in Figure 1 that illustrate the principal elements and broad structure of a QRA. The methodology used for the Corrib pipeline QRA is consistent with this approach and the applicable pipeline codes PD 8010-3 [1] and IGEM/TD/2 [2].
For
insp
ectio
n pur
pose
s only
.
Conse
nt of
copy
right
owne
r req
uired
for a
ny ot
her u
se.
EPA Export 19-02-2014:23:33:57
DET NORSKE VERITAS
Report for Shell E&P Ireland Ltd. Corrib Onshore Pipeline EIS
MANAGING RISK
DNV Reg. No.: 12LKQW5-2 Revision No.: 0 Date : 2010-05-18 Page 5
Figure 1: QRA Method
2.3.1 Define QRA Scope, Objectives and Criteria
The QRA must have clear boundaries, deliverables, objectives and risk criteria; these are defined in Section 3 and the principles adopted explained further below.
2.3.2 Hazard & Scenario Identification
For a gas pipeline the principal hazard is an ignited unintentional release of the hydrocarbon gas being transported in the pipeline.
The qualitative risk assessment [Appendix Q6.3] contains the bowtie-based analyses undertaken for loss of containment from the pipeline and the LVI. The threats (causes of failure) that may lead to loss of containment are contained in the bowties and provide input to the QRA. Within the QRA these threats are screened to identify threats for inclusion in the QRA.
Within a QRA, loss of containment is assumed to occur either through a hole in the pipe wall or the equipment. Such a hole may be very small (often termed a pinhole) or larger (often termed as leak or a puncture) or could be as large as a full-bore rupture. Depending on the hole size, whether the release is ignited, when ignition occurs, and where along the pipeline the release occurs a discrete event (or scenario) is built up.
As there is a wide range of loss of containment variables and combinations it is necessary to rationalise scenario selection. To aid rationalisation QRA studies use event trees to model the chronological series of events from the initial release to the final outcome. Event trees provide a
Define study scope, objectives & risk acceptance criteria
Hazard & scenario identification
Frequency & probability determination
Event & outcome analysis
Consequence modelling
Consequence evaluation
Calculate risk values
Compare with risk acceptance criteria
LIKELIHOOD CONSEQUENCE
For
insp
ectio
n pur
pose
s only
.
Conse
nt of
copy
right
owne
r req
uired
for a
ny ot
her u
se.
EPA Export 19-02-2014:23:33:57
DET NORSKE VERITAS
Report for Shell E&P Ireland Ltd. Corrib Onshore Pipeline EIS
MANAGING RISK
DNV Reg. No.: 12LKQW5-2 Revision No.: 0 Date : 2010-05-18 Page 6
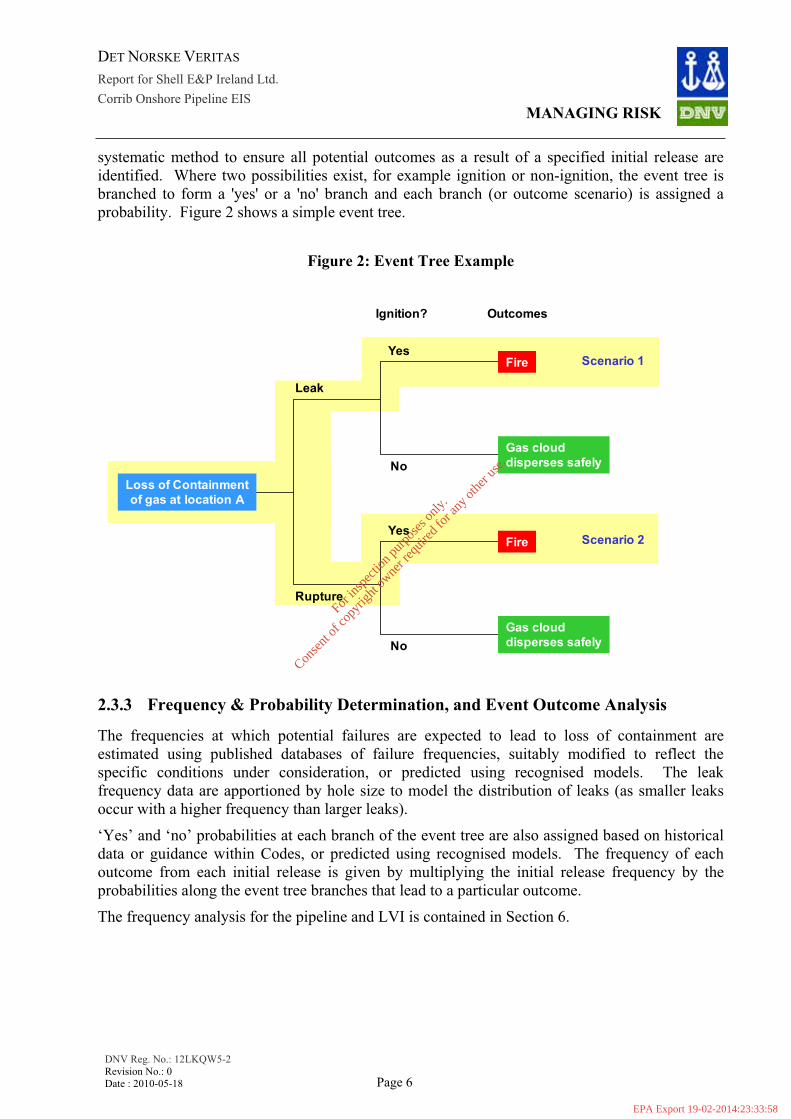
systematic method to ensure all potential outcomes as a result of a specified initial release are identified. Where two possibilities exist, for example ignition or non-ignition, the event tree is branched to form a 'yes' or a 'no' branch and each branch (or outcome scenario) is assigned a probability. Figure 2 shows a simple event tree.
Figure 2: Event Tree Example
2.3.3 Frequency & Probability Determination, and Event Outcome Analysis
The frequencies at which potential failures are expected to lead to loss of containment are estimated using published databases of failure frequencies, suitably modified to reflect the specific conditions under consideration, or predicted using recognised models. The leak frequency data are apportioned by hole size to model the distribution of leaks (as smaller leaks occur with a higher frequency than larger leaks).
‘Yes’ and ‘no’ probabilities at each branch of the event tree are also assigned based on historical data or guidance within Codes, or predicted using recognised models. The frequency of each outcome from each initial release is given by multiplying the initial release frequency by the probabilities along the event tree branches that lead to a particular outcome.
The frequency analysis for the pipeline and LVI is contained in Section 6.
Leak
Rupture
Ignition?
Yes
No
Yes
No
Outcomes
Loss of Containmentof gas at location A
Fire
Gas clouddisperses safely
Fire
Gas clouddisperses safely
Scenario 1
Scenario 2
For
insp
ectio
n pur
pose
s only
.
Conse
nt of
copy
right
owne
r req
uired
for a
ny ot
her u
se.
EPA Export 19-02-2014:23:33:58
DET NORSKE VERITAS
Report for Shell E&P Ireland Ltd. Corrib Onshore Pipeline EIS
MANAGING RISK
DNV Reg. No.: 12LKQW5-2 Revision No.: 0 Date : 2010-05-18 Page 7
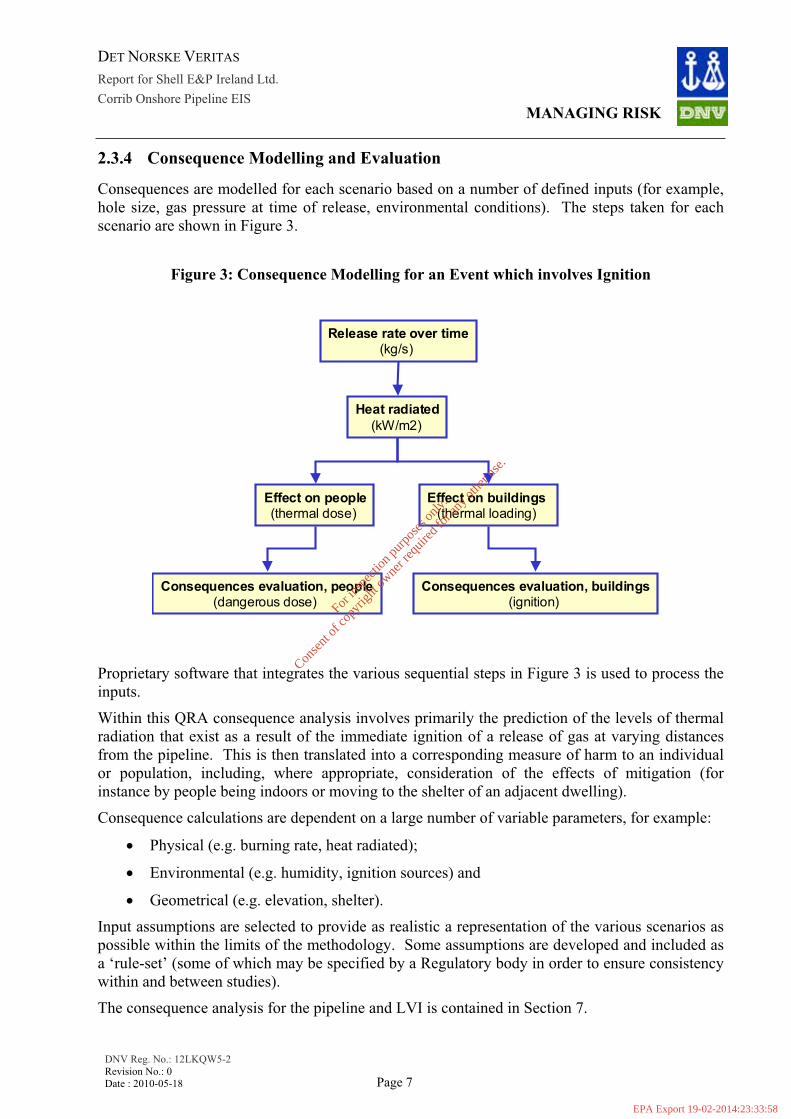
2.3.4 Consequence Modelling and Evaluation
Consequences are modelled for each scenario based on a number of defined inputs (for example, hole size, gas pressure at time of release, environmental conditions). The steps taken for each scenario are shown in Figure 3.
Figure 3: Consequence Modelling for an Event which involves Ignition
Proprietary software that integrates the various sequential steps in Figure 3 is used to process the inputs.
Within this QRA consequence analysis involves primarily the prediction of the levels of thermal radiation that exist as a result of the immediate ignition of a release of gas at varying distances from the pipeline. This is then translated into a corresponding measure of harm to an individual or population, including, where appropriate, consideration of the effects of mitigation (for instance by people being indoors or moving to the shelter of an adjacent dwelling).
Consequence calculations are dependent on a large number of variable parameters, for example:
Physical (e.g. burning rate, heat radiated);
Environmental (e.g. humidity, ignition sources) and
Geometrical (e.g. elevation, shelter).
Input assumptions are selected to provide as realistic a representation of the various scenarios as possible within the limits of the methodology. Some assumptions are developed and included as a ‘rule-set’ (some of which may be specified by a Regulatory body in order to ensure consistency within and between studies).
The consequence analysis for the pipeline and LVI is contained in Section 7.
Release rate over time(kg/s)
Heat radiated(kW/m2)
Effect on people(thermal dose)
Effect on buildings (thermal loading)
Consequences evaluation, people(dangerous dose)
Consequences evaluation, buildings(ignition)
For
insp
ectio
n pur
pose
s only
.
Conse
nt of
copy
right
owne
r req
uired
for a
ny ot
her u
se.
EPA Export 19-02-2014:23:33:58
DET NORSKE VERITAS
Report for Shell E&P Ireland Ltd. Corrib Onshore Pipeline EIS
MANAGING RISK
DNV Reg. No.: 12LKQW5-2 Revision No.: 0 Date : 2010-05-18 Page 8
2.3.5 Calculate Risk Values The corresponding pairs of likelihood or probability and consequence for each scenario included in the analysis are combined to calculate numerical estimates of risk per scenario; these are then totalled to give the cumulative risk from the pipeline and the LVI. Risk calculation software (which is an integral part of the software mentioned above for consequence modelling) is used to total all hazard scenarios and all affected locations.
2.3.5.1 Sensitivity Analysis
The QRA is carried out using a ‘base case’ set of parameters (e.g. frequency of failure, assumptions as to movement of people). Sensitivity studies are carried out to assess the significance and evaluate the influence on the QRA predictions by varying some selected parameters.
2.3.5.2 Presentation of Predicted Risk Values
The predicted risks are presented as:
1. Individual risk.
2. Societal risk.
3. Risk zones.
Individual and societal risk are used to assess the acceptability of a proposed facility or pipeline route with respect to existing buildings and infrastructure. Risk zones are used to assess how a proposal may constrain any future development plans for the land adjacent to the facility or pipeline.
A description of these risk measures and their presentation is given below:
For in
spec
tion p
urpo
ses o
nly.
Conse
nt of
copy
right
owne
r req
uired
for a
ny ot
her u
se.
EPA Export 19-02-2014:23:33:58
DET NORSKE VERITAS
Report for Shell E&P Ireland Ltd. Corrib Onshore Pipeline EIS
MANAGING RISK
DNV Reg. No.: 12LKQW5-2 Revision No.: 0 Date : 2010-05-18 Page 9
Individual Risk
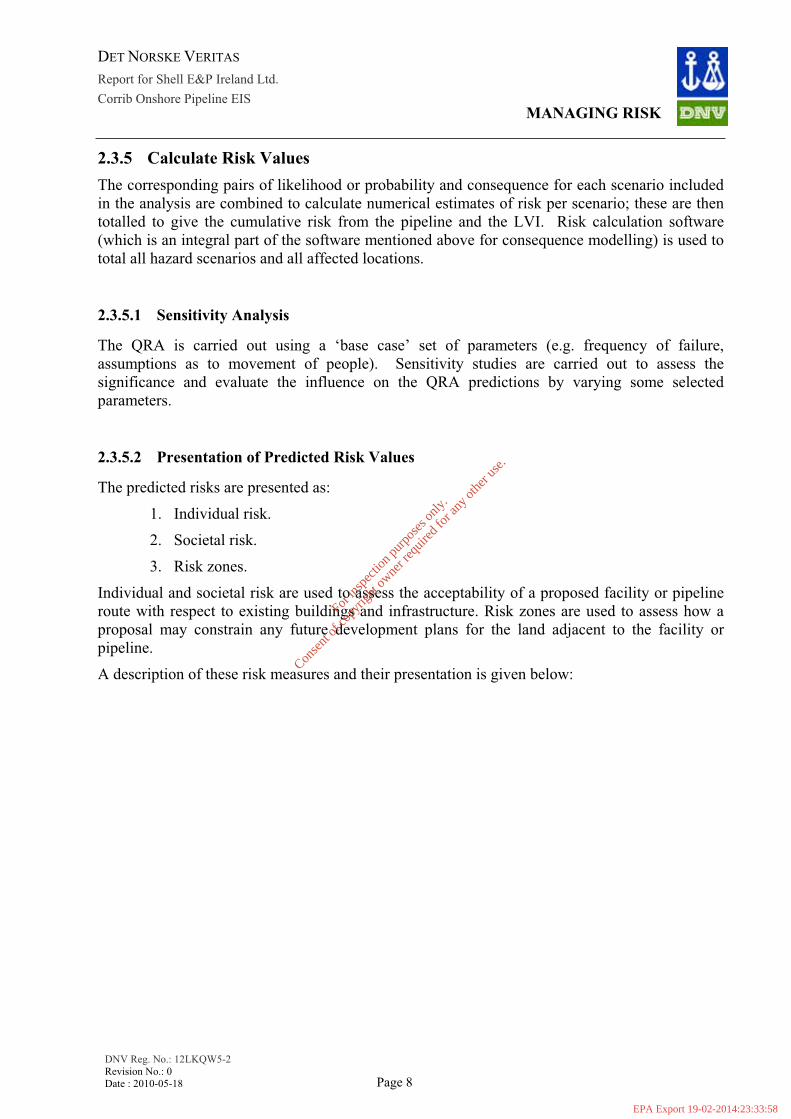
Individual risk is the risk of harm to an individual person, i.e. the frequency with which an individual could be exposed to potentially harmful effects. It can be presented as a single value at a specific location, or in the form of contours showing lines of equal risk as shown in Figure 4 for a pipeline. An individual risk value represents the cumulative risk to that individual as a result of all potential hazardous events affecting that individual.
Figure 4: Example Individual Risk Contour associated with a Gas Pipeline
Individual risk contours are generally ‘location risk contours’, i.e. it is assumed that the hypothetical individual spends 24 hours per day, 365 days per year at each location. This may be true for some house residents, but generally people change location for at least part of each day. It is thus important to recognise that risk contours calculated in this way are more conservative than the actual risk and should not necessarily be interpreted as characterising the risk to any particular individual.
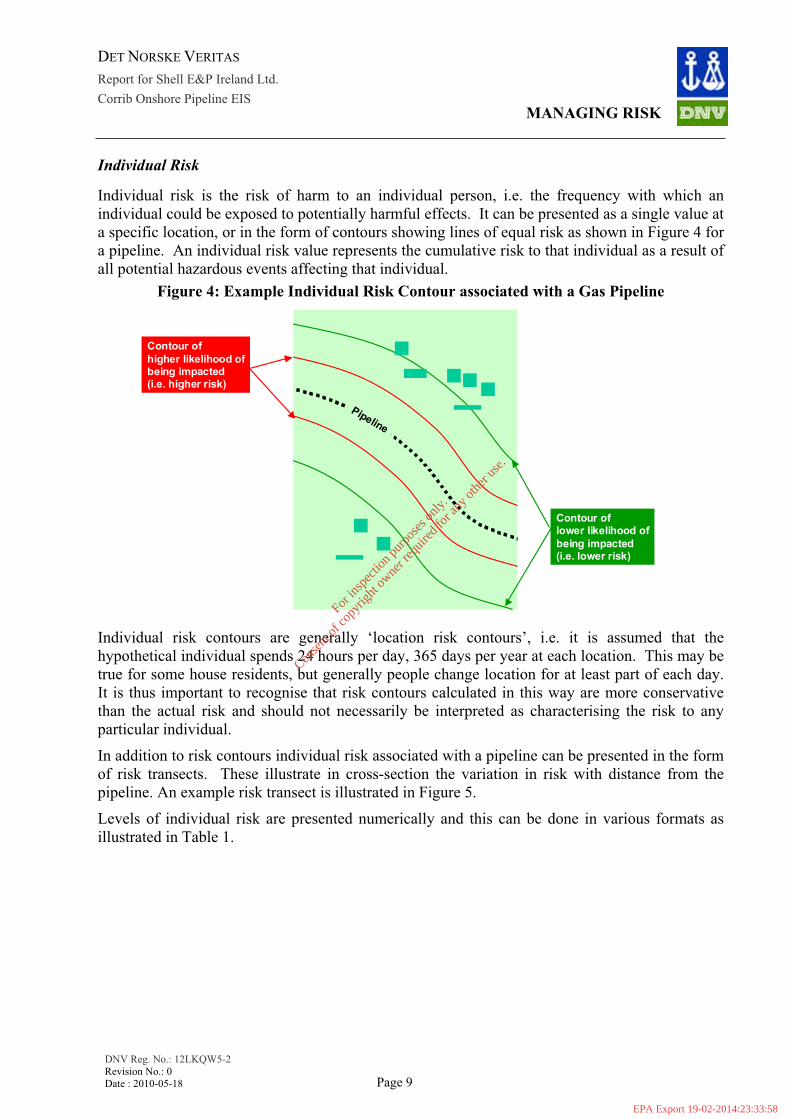
In addition to risk contours individual risk associated with a pipeline can be presented in the form of risk transects. These illustrate in cross-section the variation in risk with distance from the pipeline. An example risk transect is illustrated in Figure 5.
Levels of individual risk are presented numerically and this can be done in various formats as illustrated in Table 1.
Contour oflower likelihood ofbeing impacted(i.e. lower risk)
Contour ofhigher likelihood ofbeing impacted(i.e. higher risk)
Pipeline
For
insp
ectio
n pur
pose
s only
.
Conse
nt of
copy
right
owne
r req
uired
for a
ny ot
her u
se.
EPA Export 19-02-2014:23:33:58
DET NORSKE VERITAS
Report for Shell E&P Ireland Ltd. Corrib Onshore Pipeline EIS
MANAGING RISK
DNV Reg. No.: 12LKQW5-2 Revision No.: 0 Date : 2010-05-18 Page 10
Figure 5: Example of Pipeline Individual Risk Transect
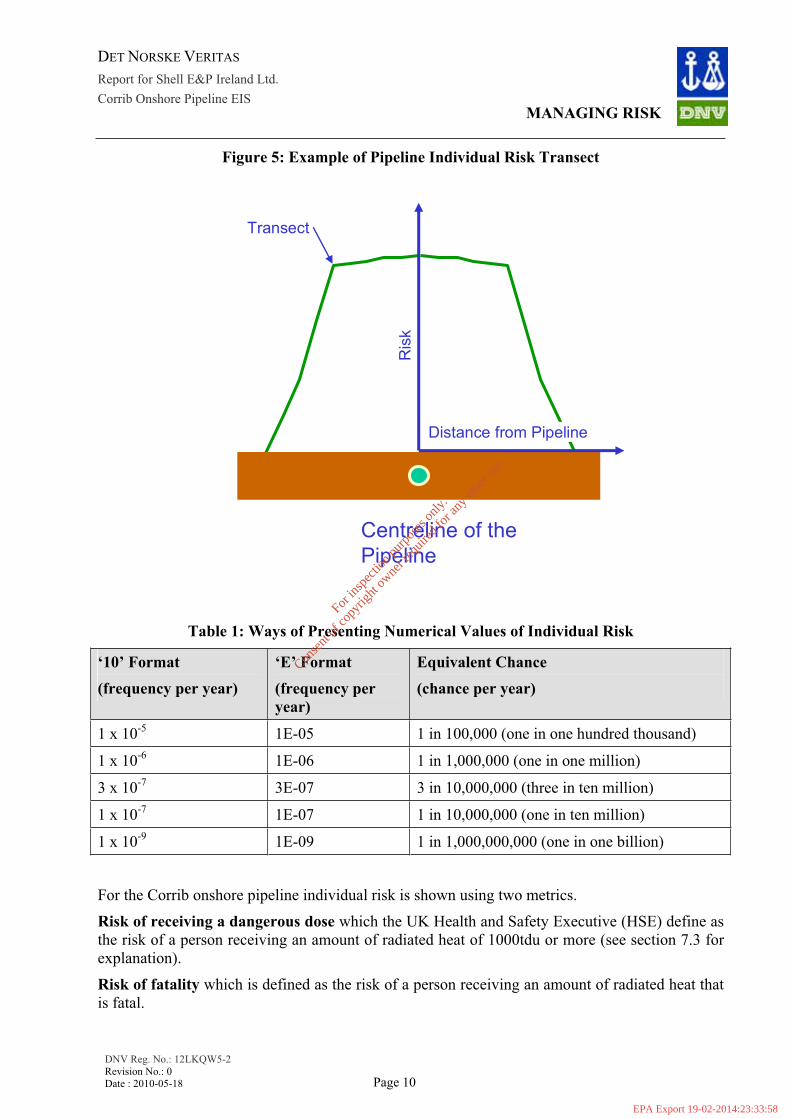
Table 1: Ways of Presenting Numerical Values of Individual Risk
‘10’ Format (frequency per year)
‘E’ Format (frequency per year)
Equivalent Chance(chance per year)
1 x 10⁻⁵ 1E-05 1 in 100,000 (one in one hundred thousand)
1 x 10⁻⁶ 1E-06 1 in 1,000,000 (one in one million)
3 x 10⁻⁷ 3E-07 3 in 10,000,000 (three in ten million)
1 x 10⁻⁷ 1E-07 1 in 10,000,000 (one in ten million)
1 x 10⁻⁹ 1E-09 1 in 1,000,000,000 (one in one billion)
For the Corrib onshore pipeline individual risk is shown using two metrics.
Risk of receiving a dangerous dose which the UK Health and Safety Executive (HSE) define as the risk of a person receiving an amount of radiated heat of 1000tdu or more (see section 7.3 for explanation).
Risk of fatality which is defined as the risk of a person receiving an amount of radiated heat that is fatal.
Centreline of the Pipeline
Ris
k
Distance from Pipeline
Transect
For
insp
ectio
n pur
pose
s only
.
Conse
nt of
copy
right
owne
r req
uired
for a
ny ot
her u
se.
EPA Export 19-02-2014:23:33:58
DET NORSKE VERITAS
Report for Shell E&P Ireland Ltd. Corrib Onshore Pipeline EIS
MANAGING RISK
DNV Reg. No.: 12LKQW5-2 Revision No.: 0 Date : 2010-05-18 Page 11
In measuring these risks a hypothetical individual is assumed to act in a way that is described in ‘rule sets’ (described in Section 7.3).
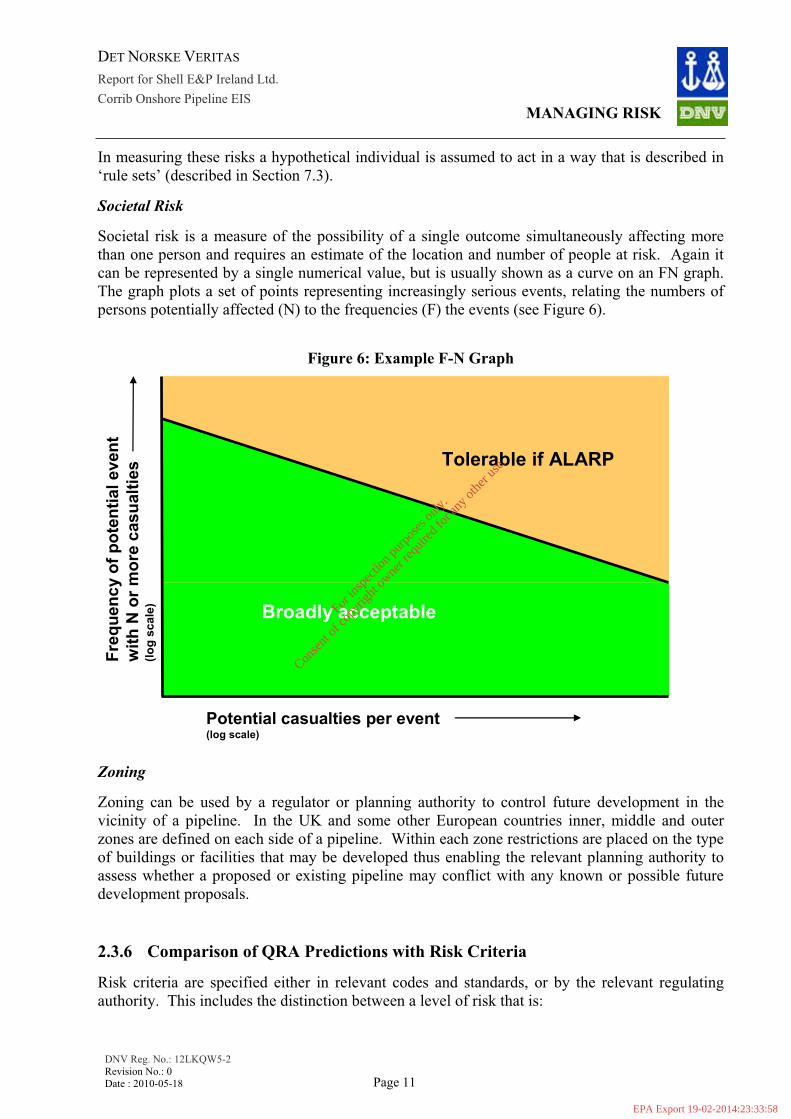
Societal Risk
Societal risk is a measure of the possibility of a single outcome simultaneously affecting more than one person and requires an estimate of the location and number of people at risk. Again it can be represented by a single numerical value, but is usually shown as a curve on an FN graph. The graph plots a set of points representing increasingly serious events, relating the numbers of persons potentially affected (N) to the frequencies (F) the events (see Figure 6).
Figure 6: Example F-N Graph
Freq
uenc
y of
pot
entia
l eve
nt
with
N o
r mor
e ca
sual
ties
(log
scal
e)
Potential casualties per event(log scale)
Tolerable if ALARP
Broadly acceptable
Zoning
Zoning can be used by a regulator or planning authority to control future development in the vicinity of a pipeline. In the UK and some other European countries inner, middle and outer zones are defined on each side of a pipeline. Within each zone restrictions are placed on the type of buildings or facilities that may be developed thus enabling the relevant planning authority to assess whether a proposed or existing pipeline may conflict with any known or possible future development proposals.
2.3.6 Comparison of QRA Predictions with Risk Criteria
Risk criteria are specified either in relevant codes and standards, or by the relevant regulating authority. This includes the distinction between a level of risk that is:
For
insp
ectio
n pur
pose
s only
.
Conse
nt of
copy
right
owne
r req
uired
for a
ny ot
her u
se.
EPA Export 19-02-2014:23:33:58

DET NORSKE VERITAS
Report for Shell E&P Ireland Ltd. Corrib Onshore Pipeline EIS
MANAGING RISK
DNV Reg. No.: 12LKQW5-2 Revision No.: 0 Date : 2010-05-18 Page 12
Tolerable (i.e. negligible and/or broadly acceptable),
Tolerable, but risks must be demonstrated as being As Low As Reasonably Practicable (ALARP), or
Intolerable.
The QRA predictions are compared with criteria in order to assess acceptability or tolerability. As part of this comparison the outcomes of any sensitivity studies and any aspects concerning the achievement of risk levels may be considered.
For
insp
ectio
n pur
pose
s only
.
Conse
nt of
copy
right
owne
r req
uired
for a
ny ot
her u
se.
EPA Export 19-02-2014:23:33:58
DET NORSKE VERITAS
Report for Shell E&P Ireland Ltd. Corrib Onshore Pipeline EIS
MANAGING RISK
DNV Reg. No.: 12LKQW5-2 Revision No.: 0 Date : 2010-05-18 Page 13
3 QRA OBJECTIVES, SCOPE AND RISK CRITERIA
3.1 Objectives of the QRA The main objective of this QRA is to examine in a logical and transparent way whether or not the proposed pipeline and LVI pose an unacceptable risk to the public and to address the issues raised in An Bord Pleanála’s letters.
Application of QRA is described in the pipeline codes (see Section 4.2 of this Appendix) and the approach used in this QRA follows the methodology in pipeline codes PD 8010-1 [3] and PD 8010-3 [1].
Other objectives of a QRA can include:
Identification of the main contributors to the overall risk (so that potential measures to reduce risk can be identified and an assessment of the effectiveness of these measures can be made).
Increasing awareness of hazards, potential hazardous events and mitigation.
Providing an aid to communication to stakeholders of their exposure to risk.
With reference to the first bullet point, the relocation of the pipeline under Swuraddacon Bay has reduced pipeline operational phase risk levels, even though the risk levels were already within the broadly acceptable region as demonstrated in the previous DNV QRA [16]. However, it cannot be claimed that the reduction in risk is a step towards achievement of ALARP as the costs associated with the re-routing of the tunnel and the safety risks associated with the extended construction period and the more hazardous nature of tunnel construction will outweigh the benefit of the reduction in risk associated with the operation of the pipeline.
3.2 QRA Scope The scope of the QRA covers all pipeline and LVI related loss of containment events when the ignition of the released hydrocarbon has the potential to affect the public. This QRA therefore includes:
The section of the pipeline upstream of the LVI where a release may affect persons onshore;
The LVI and onshore pipeline up to the inlet valve at the Bellanaboy Bridge Gas Terminal.
The following facilities are excluded from the scope of this QRA.
The offshore wells and offshore pipeline system (except as noted above).
The Bellanaboy Bridge Gas Terminal which is subject to a separate QRA.
The discrete sections of the pipeline for which specific QRA predictions are appropriate are:
The section upstream of the LVI (50m offshore, the beach crossing and trenched section up to the LVI).
For
insp
ectio
n pur
pose
s only
.
Conse
nt of
copy
right
owne
r req
uired
for a
ny ot
her u
se.
EPA Export 19-02-2014:23:33:58
DET NORSKE VERITAS
Report for Shell E&P Ireland Ltd. Corrib Onshore Pipeline EIS
MANAGING RISK
DNV Reg. No.: 12LKQW5-2 Revision No.: 0 Date : 2010-05-18 Page 14
The LVI itself.
The trenched section downstream of the LVI to the point where the pipeline enters the tunnel.
The pipeline within the tunnel.
The pipeline downstream of the tunnel through the peat area where it is buried in a stone road up to the terminal.
3.3 Risk Criteria The risks presented within this QRA, are as follows:
Individual risk.
Societal risk.
Risk zones.
The risk criteria applicable are either those adopted by An Bord Pleanála (individual risk and risk zones) or those specified in PD 8010-3 [1] (societal risk). These are detailed below.
3.3.1 Individual Risk
An Bord Pleanála’s letter of 2nd November 2009, page 2, item (a) states:
“….that the following standards, when applied to the proposed pipeline, are the appropriate standards against which the proposed development should be assessed and that the Board should, therefore,
(a) adopt the UK HSE risk thresholds for assessment of the individual risk level associated with the Corrib Gas Pipeline,
Individual risk level above 1x10⁻⁵ *– intolerable.
Individual risk level between 1x10⁻⁵ and 1x10⁻⁶ – tolerable if ALARP (as low as reasonably practicable) is demonstrated.
Individual risk level below 1x10⁻⁶ broadly acceptable.
In their letter of 29th January 2010 An Bord Pleanála provided clarification that this risk was the risk of an individual receiving a dangerous dose, (although it is noted that the UK HSE risk thresholds for assessment of tolerability and ALARP are based on risk of fatality, HSE 2001 [26]). Consequently the individual risk of fatality is also presented within this QRA, and as this is the metric used in previous QRAs it enables a comparison of relative risks with previous assessments to be made accordingly.
The ‘broadly acceptable’ category covers individual risk levels that are considered insignificant and adequately controlled. The ‘tolerable if ALARP’ category requires that mitigation measures
* Numerical values of individual risk may be presented in the form 1 x 10 -5 as in the letter from An Bord Pleanála or in ‘E’ format. 1E-05 is the same as 1 x 10 -5. In general the ‘E’ format is used throughout this document. Three different ways of presenting risk numerically are shown in Table 1.
For
insp
ectio
n pur
pose
s only
.
Conse
nt of
copy
right
owne
r req
uired
for a
ny ot
her u
se.
EPA Export 19-02-2014:23:33:58
DET NORSKE VERITAS
Report for Shell E&P Ireland Ltd. Corrib Onshore Pipeline EIS
MANAGING RISK
DNV Reg. No.: 12LKQW5-2 Revision No.: 0 Date : 2010-05-18 Page 15
are employed to reduce the risk levels to such an extent that further risk reduction is impracticable or requires action that is disproportionate to the risk reduction that the measure can give. The ‘intolerable’ category indicates that the risks have to be reduced irrespective of the cost.
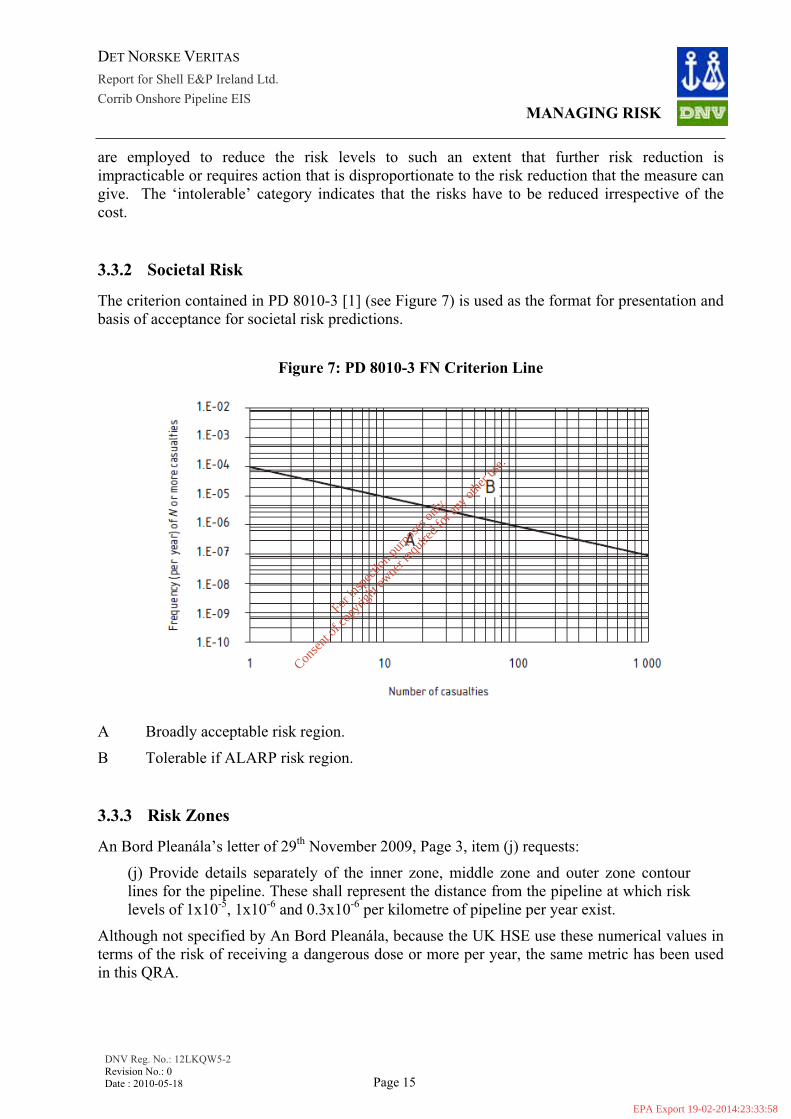
3.3.2 Societal Risk
The criterion contained in PD 8010-3 [1] (see Figure 7) is used as the format for presentation and basis of acceptance for societal risk predictions.
Figure 7: PD 8010-3 FN Criterion Line
A Broadly acceptable risk region.
B Tolerable if ALARP risk region.
3.3.3 Risk Zones
An Bord Pleanála’s letter of 29th November 2009, Page 3, item (j) requests:
(j) Provide details separately of the inner zone, middle zone and outer zone contour lines for the pipeline. These shall represent the distance from the pipeline at which risk levels of 1x10⁻⁵, 1x10⁻⁶ and 0.3x10⁻⁶ per kilometre of pipeline per year exist.
Although not specified by An Bord Pleanála, because the UK HSE use these numerical values in terms of the risk of receiving a dangerous dose or more per year, the same metric has been used in this QRA.
For
insp
ectio
n pur
pose
s only
.
Conse
nt of
copy
right
owne
r req
uired
for a
ny ot
her u
se.
EPA Export 19-02-2014:23:33:58
DET NORSKE VERITAS
Report for Shell E&P Ireland Ltd. Corrib Onshore Pipeline EIS
MANAGING RISK
DNV Reg. No.: 12LKQW5-2 Revision No.: 0 Date : 2010-05-18 Page 16
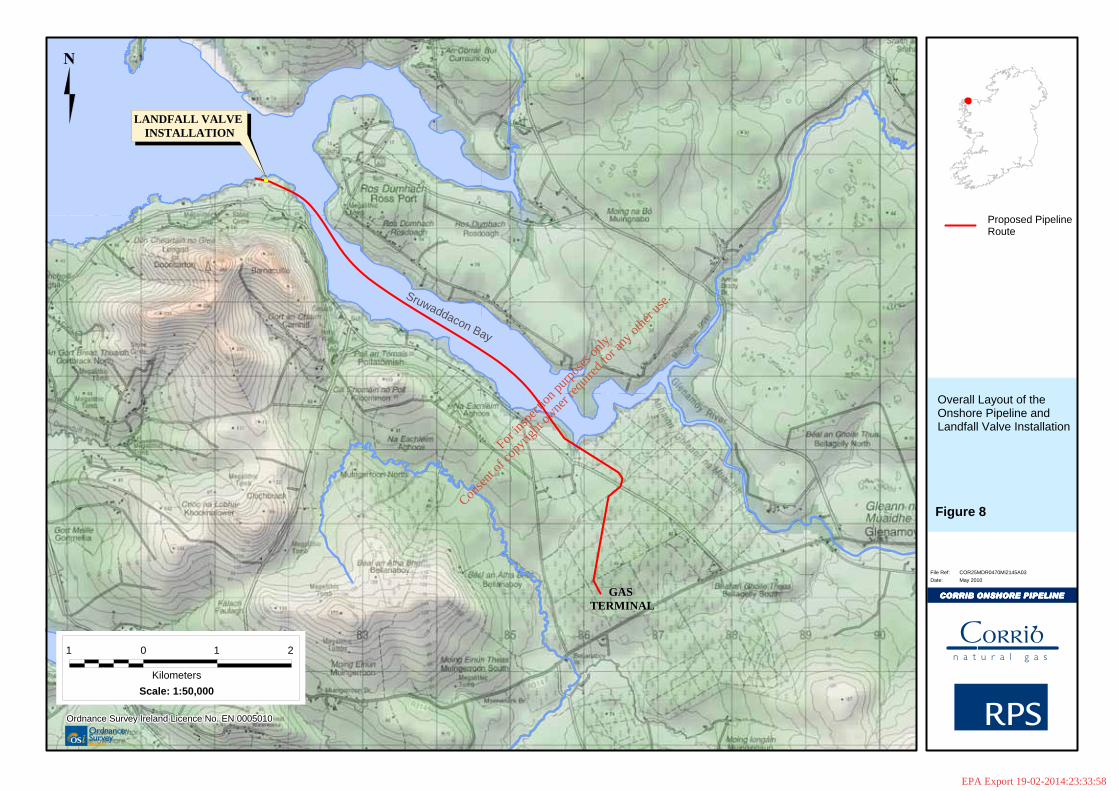
4 PIPELINE DESCRIPTIONA full description of the Corrib pipeline facilities is presented in Appendix Q2, with more detail presented in Appendices Q4 and Q5.
The onshore pipeline route is described in detail in Chapter 4 of the EIS. For ease of reference it is illustrated in Figure 8.
For
insp
ectio
n pur
pose
s only
.
Conse
nt of
copy
right
owne
r req
uired
for a
ny ot
her u
se.
EPA Export 19-02-2014:23:33:58
Overall Layout of theOnshore Pipeline and Landfall Valve Installation
COR25MDR0470Mi2145A03
CORRIB ONSHORE PIPELINECORRIB ONSHORE PIPELINECORRIB ONSHORE PIPELINECORRIB ONSHORE PIPELINE
File Ref:
May 2010Date:
Figure 8
Sruwaddacon Bay
GASTERMINAL
Proposed PipelineRoute
Ordnance Survey Ireland Licence No. EN 0005010Ordnance Survey Ireland Licence No. EN 0005010Ordnance Survey Ireland Licence No. EN 0005010Ordnance Survey Ireland Licence No. EN 0005010Ordnance Survey Ireland Licence No. EN 0005010Ordnance Survey Ireland Licence No. EN 0005010Ordnance Survey Ireland Licence No. EN 0005010Ordnance Survey Ireland Licence No. EN 0005010Ordnance Survey Ireland Licence No. EN 0005010
1 0 1 2
Kilometers
Scale: 1:50,000
LANDFALL VALVE INSTALLATION
For
insp
ectio
n pur
pose
s only
.
Conse
nt of
copy
right
owne
r req
uired
for a
ny ot
her u
se.
EPA Export 19-02-2014:23:33:58
DET NORSKE VERITAS
Report for Shell E&P Ireland Ltd. Corrib Onshore Pipeline EIS
MANAGING RISK
DNV Reg. No.: 12LKQW5-2 Revision No.: 0 Date : 2010-05-18 Page 18
5 HAZARD, RISK & SCENARIO IDENTIFICATION
5.1 Hazard & Risk The qualitative risk assessment (Appendix Q6.3) includes a risk register and identifies a number of major risks. For the QRA, the principal hazard is the unintentional ignition of the hydrocarbon gas being transported in the pipeline and the output from the QRA is therefore the risk of an ignited release of the gas affecting members of the public.
5.2 Event Scenarios The event scenarios associated with loss of containment in the QRA are very unlikely to occur but could occur as releases from the two main pipeline sections:
1. Upstream of the LVI isolation valves, with the LVI closed at the MAOP for the offshore pipeline (150 barg).
2. Upstream or downstream of the LVI, with the LVI open, at the MAOP for the onshore pipeline (100 barg).
The actual scenarios modelled in the QRA are dependent on the hole sizes selected to represent the failures of the pipeline and the failures in the equipment at the LVI. These are detailed in Sections 6.5 and 6.9 respectively.
For
insp
ectio
n pur
pose
s only
.
Conse
nt of
copy
right
owne
r req
uired
for a
ny ot
her u
se.
EPA Export 19-02-2014:23:33:58
DET NORSKE VERITAS
Report for Shell E&P Ireland Ltd. Corrib Onshore Pipeline EIS
MANAGING RISK
DNV Reg. No.: 12LKQW5-2 Revision No.: 0 Date : 2010-05-18 Page 19
6 FREQUENCY ANALYSIS
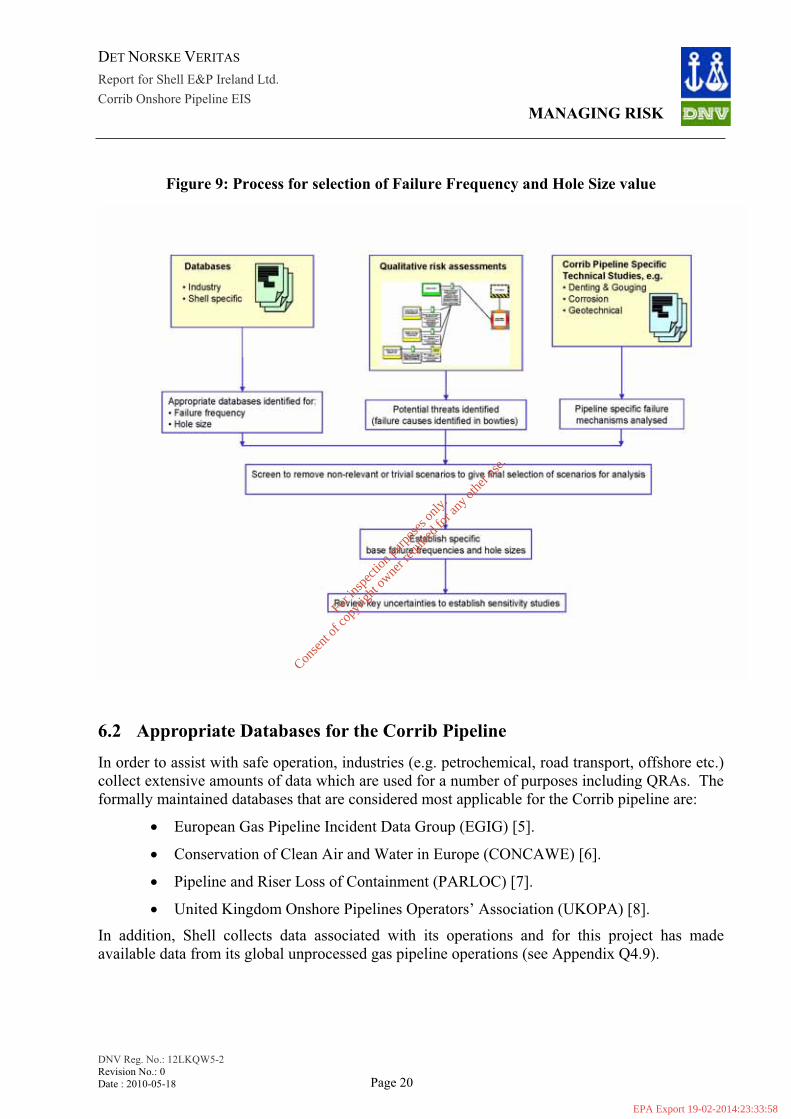
6.1 Introduction This section of the report deals with the determination of the frequency of potential releases from the pipeline and the LVI along with allocation of the representative hole sizes.
It is important that, as far as is reasonably possible, the frequency values used in the QRA reflect the actual design, operating conditions and environment within which the pipeline/equipment will be operating. The standard approach is to take generic data (which has the advantage of being collected over an extensive sample base) and then to customise this to reflect the-Corrib pipeline. It is recognised that this approach carries margins of error and hence sensitivity studies associated with uncertainty are carried out to measure and assess the effects of modifying key parameters.
The starting point for the QRA is data on the causes of failure and the associated hole sizes; these are drawn from industry databases. Various databases have been considered and the most appropriate sources of data have been used. The data are then screened to;
Remove scenarios that are from failure causes that are either not relevant to the Corrib pipeline or LVI (termed non-credible scenarios), or are of such trivial frequencies that they can be discounted without detriment to the accuracy of the QRA.
Incorporate factors that are specific for this pipeline and LVI.
Identify aspects for which sensitivity studies may be appropriate (to test the effects of uncertainties in the base case frequencies).
The data are reviewed against the qualitative analysis (see Appendix Q6.3) to ensure that all credible scenarios have been considered. Technical studies carried out as part of this EIS are also taken into consideration to establish the final base data set specific to the Corrib pipeline and LVI.
This process is shown in Figure 9 and provides the structure for this Section.
For in
spec
tion p
urpo
ses o
nly.
Conse
nt of
copy
right
owne
r req
uired
for a
ny ot
her u
se.
EPA Export 19-02-2014:23:33:58
DET NORSKE VERITAS
Report for Shell E&P Ireland Ltd. Corrib Onshore Pipeline EIS
MANAGING RISK
DNV Reg. No.: 12LKQW5-2 Revision No.: 0 Date : 2010-05-18 Page 20
Figure 9: Process for selection of Failure Frequency and Hole Size value
6.2 Appropriate Databases for the Corrib Pipeline In order to assist with safe operation, industries (e.g. petrochemical, road transport, offshore etc.) collect extensive amounts of data which are used for a number of purposes including QRAs. The formally maintained databases that are considered most applicable for the Corrib pipeline are:
European Gas Pipeline Incident Data Group (EGIG) [5].
Conservation of Clean Air and Water in Europe (CONCAWE) [6].
Pipeline and Riser Loss of Containment (PARLOC) [7].
United Kingdom Onshore Pipelines Operators’ Association (UKOPA) [8].
In addition, Shell collects data associated with its operations and for this project has made available data from its global unprocessed gas pipeline operations (see Appendix Q4.9).
For
insp
ectio
n pur
pose
s only
.
Conse
nt of
copy
right
owne
r req
uired
for a
ny ot
her u
se.
EPA Export 19-02-2014:23:33:58
DET NORSKE VERITAS
Report for Shell E&P Ireland Ltd. Corrib Onshore Pipeline EIS
MANAGING RISK
DNV Reg. No.: 12LKQW5-2 Revision No.: 0 Date : 2010-05-18 Page 21
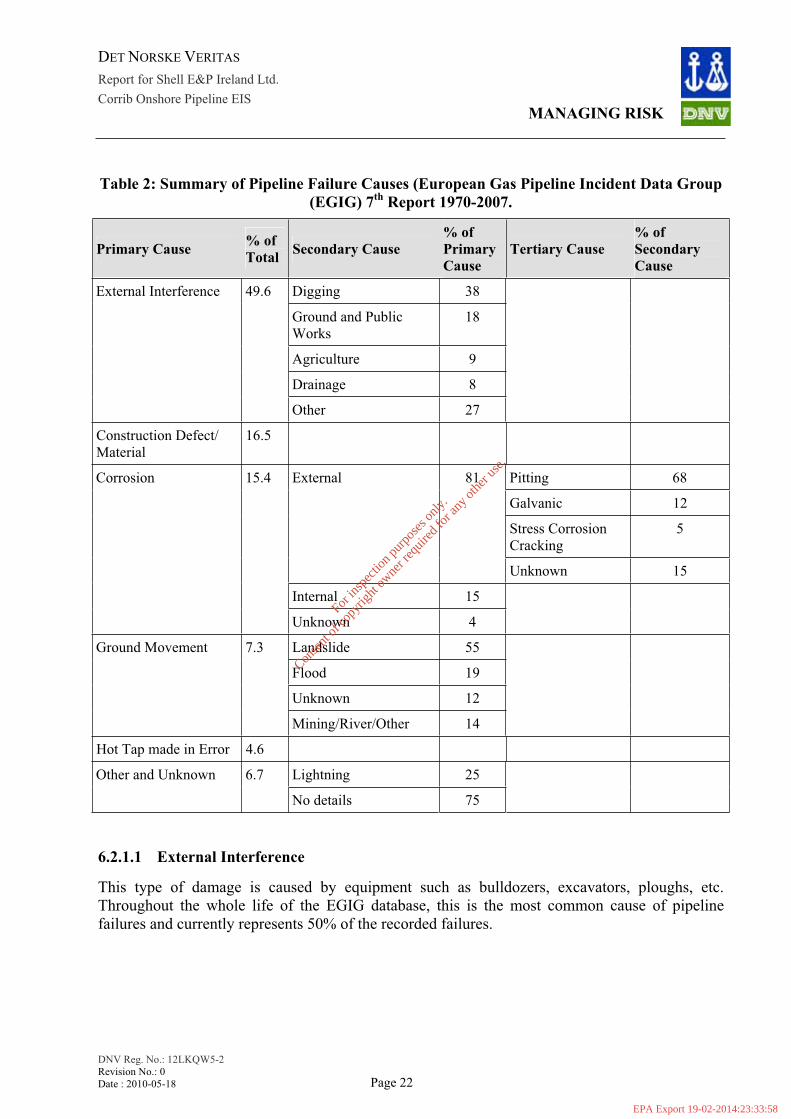
6.2.1 EGIG [5]
The main database for onshore gas pipeline failures in Europe is compiled by the European Gas Pipeline Incident Data Group (EGIG). This QRA has used the 7th Report 1970-2007 [5], which covers experience from 1970-2007 giving a total exposure of 3,250,000 km years. EGIG comprises 15 organisations including Bord Gais Eireann. The pipelines in the EGIG database are almost all now used for the transport of dry treated gas but, apart from the possible effect of internal corrosion, (discussed further in Section 6.5.3) the data are valid for the Corrib pipeline. The failure causes are categorised into six different primary causes which are detailed in Table 2.
Some general observations from the EGIG report are:
The number of loss of containment incidents (releases) is generally decreasing although the pipeline system length monitored is increasing; the primary failure frequency (per km per yr) over the last five years is approximately one third of the average frequency over the lifetime of the EGIG database.
The reduction in failure frequencies is due to technological developments (e.g. welding, inspection, condition monitoring using on line inspection) and improved procedures for damage prevention and detection.
The database also categorises failures into three different hole sizes (pinhole, hole and full bore rupture).
For
insp
ectio
n pur
pose
s only
.
Conse
nt of
copy
right
owne
r req
uired
for a
ny ot
her u
se.
EPA Export 19-02-2014:23:33:58
DET NORSKE VERITAS
Report for Shell E&P Ireland Ltd. Corrib Onshore Pipeline EIS
MANAGING RISK
DNV Reg. No.: 12LKQW5-2 Revision No.: 0 Date : 2010-05-18 Page 22
Table 2: Summary of Pipeline Failure Causes (European Gas Pipeline Incident Data Group (EGIG) 7th Report 1970-2007.
Primary Cause % of Total Secondary Cause
% of Primary Cause
Tertiary Cause % of SecondaryCause
Digging 38
Ground and Public Works
18
Agriculture 9
Drainage 8
External Interference 49.6
Other 27
Construction Defect/ Material
16.5
Pitting 68
Galvanic 12
Stress Corrosion Cracking
5
External 81
Unknown 15
Internal 15
Corrosion 15.4
Unknown 4
Landslide 55
Flood 19
Unknown 12
Ground Movement 7.3
Mining/River/Other 14
Hot Tap made in Error 4.6
Lightning 25 Other and Unknown 6.7
No details 75
6.2.1.1 External Interference
This type of damage is caused by equipment such as bulldozers, excavators, ploughs, etc. Throughout the whole life of the EGIG database, this is the most common cause of pipeline failures and currently represents 50% of the recorded failures.
For
insp
ectio
n pur
pose
s only
.
Conse
nt of
copy
right
owne
r req
uired
for a
ny ot
her u
se.
EPA Export 19-02-2014:23:33:58
DET NORSKE VERITAS
Report for Shell E&P Ireland Ltd. Corrib Onshore Pipeline EIS
MANAGING RISK
DNV Reg. No.: 12LKQW5-2 Revision No.: 0 Date : 2010-05-18 Page 23
6.2.1.2 Corrosion
EGIG records that internal and external corrosion is the third most common cause of pipeline failures (15% of total failures) with the majority of failures due to external corrosion. Corrosion failures recorded predominantly result in pinhole type leaks.
There is only one instance recorded where corrosion caused a full bore failure and this was internal corrosion on a pipeline constructed before 1954 which was used for the transportation of coke oven gas.
6.2.1.3 Fabrication and Construction Defect/Material Failure
This type of failure is strongly dependent on the year of construction, being approximately 10 times less likely for pipelines constructed after 2004 than those constructed before 1954 (thought to be mainly due to technological improvements in quality control). Recorded failures include those due to material defects, e.g. due to laminations or incorrectly specified materials, and defects introduced by the pipeline construction, e.g. weld defects and undue external stresses.
6.2.1.4 Hot Tap Made in Error
This type of failure is due to a hot tap connection (which requires drilling into a pipeline) being made in error i.e. to a pipeline which has been incorrectly identified as another pipeline (usually when a number of pipelines share a pipeline corridor).
6.2.1.5 Ground Movement
This includes failures caused by natural events such as a dike break, subsidence, flooding, landslides, mining or rivers. Historically, landslides are the most common cause of failure in this group (approximately 55%), followed by flooding (19%). Ground movement gives the largest proportion of full bore ruptures of all the primary causes. Incidentally, there is no pipeline failure reported resulting in loss of containment due specifically to peat slides.
6.2.1.6 Other and Unknown
This includes all minor and unknown causes such as design error, erosion, lightning, operational or maintenance error and poor repairs. 25% of these incidents were due to lightning (and out of 20 incidents, 19 gave pinhole leaks), but no details are given of other causes
For
insp
ectio
n pur
pose
s only
.
Conse
nt of
copy
right
owne
r req
uired
for a
ny ot
her u
se.
EPA Export 19-02-2014:23:33:58
DET NORSKE VERITAS
Report for Shell E&P Ireland Ltd. Corrib Onshore Pipeline EIS
MANAGING RISK
DNV Reg. No.: 12LKQW5-2 Revision No.: 0 Date : 2010-05-18 Page 24
6.2.2 CONCAWE [6]
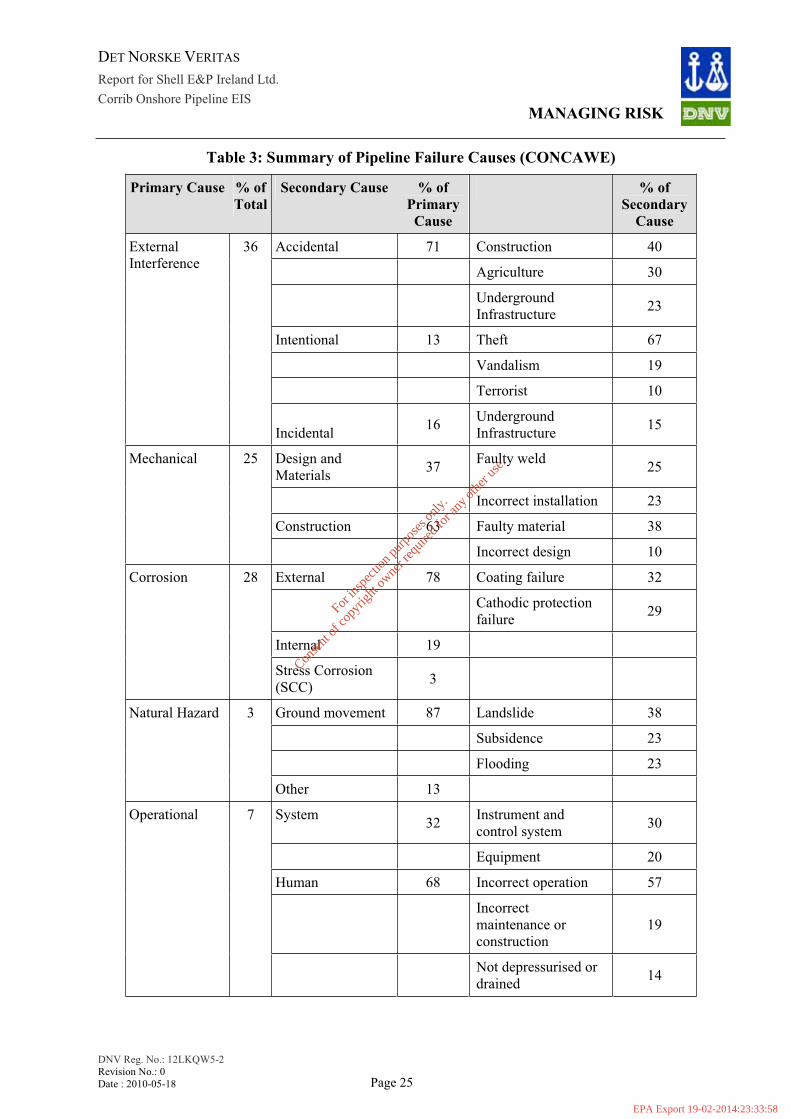
Failures in liquid pipelines in Europe are given in the CONCAWE Report 7/08. Performance of European cross-country oil pipelines. August 2008. Data have been collected since 1971 and the experience comprises some 35,000km and some 850,000 km years. Data are provided by some 70 companies and agencies which operate oil pipelines. Classification of the types of failures is similar to that for EGIG [5] and is shown in Table 3. Spillages of 1m3 and above are recorded. Some general observations from the CONCAWE report are;
Similar to EGIG, the most common causes of failures for cold* pipelines are third party activity (42%) followed by mechanical (28%) and corrosion (19%). Failures due to third parties are reducing but those due to mechanical failure have been increasing over the last 13 years.
The number of spillage incidents has been steadily reducing since the mid 1970’s.
Unlike EGIG, this database includes failures due to intentional or malicious activities by third parties (which are generally as a result of attempts to steal the pipeline product). Of the 170 third party incidents recorded within the CONCAWE database, the majority (120) were as a result of accidental damage, with only 23 (approximately 5% of all pipeline releases) resulting from intentional damage, of which 2 were from terrorist activity, 5 from vandalism and 16 from attempted product theft.
6.2.3 PARLOC [7]
PARLOC 2001: The Update of Loss of Containment Data for Offshore Pipelines, (PARLOC) contains data on all offshore pipelines in the North Sea and captures all actual and potential loss of containment incidents. This database covers some 25,000km of steel and flexible lines and has an operating experience of 330,000 km years (approximately one tenth of the EGIG [5] exposure). It is of relevance to Corrib as many of the pipelines transport unprocessed gas and failures in the near shore are included. Some general observations on the PARLOC report are:
Classification of failure types is similar to that of EGIG [5] and CONCAWE [6] except that the causes of third party incidents differ, reflecting offshore operating conditions.
Some 2% of incidents occurred in the shore zone and these were due to anchors, vibration (vortex shedding) and storm damage; none resulted in a loss of containment.
The most common cause of a loss of containment was corrosion (40%) with internal corrosion contributing the most (22%), primarily local to the well or in the mid line area.†
However, it was concluded that for this QRA PARLOC could not be used to determine failure frequencies as it was not possible to isolate failures for pipelines transporting unprocessed gas, nor failures specifically in the shore zone. Consequently this database was not used further.
* ‘Cold’ pipelines are used for the transport of materials such as crude oil and white products. Black products are transportedthrough heated lines which are referred to as ‘hot’ pipelines.
† Mid line area refers to pipelines that are more than 500m from either the platform or the well but are not in the shore approach.
For
insp
ectio
n pur
pose
s only
.
Conse
nt of
copy
right
owne
r req
uired
for a
ny ot
her u
se.
EPA Export 19-02-2014:23:33:58
DET NORSKE VERITAS
Report for Shell E&P Ireland Ltd. Corrib Onshore Pipeline EIS
MANAGING RISK
DNV Reg. No.: 12LKQW5-2 Revision No.: 0 Date : 2010-05-18 Page 25
Table 3: Summary of Pipeline Failure Causes (CONCAWE)
Primary Cause % of Total
Secondary Cause % of Primary Cause
% of Secondary
Cause
Accidental 71 Construction 40
Agriculture 30
Underground Infrastructure 23
Intentional 13 Theft 67
Vandalism 19
Terrorist 10
ExternalInterference
36
Incidental 16 Underground Infrastructure 15
Design and Materials 37 Faulty weld 25
Incorrect installation 23
Construction 63 Faulty material 38
Mechanical 25
Incorrect design 10
External 78 Coating failure 32
Cathodic protection failure 29
Internal 19
Corrosion 28
Stress Corrosion (SCC) 3
Ground movement 87 Landslide 38
Subsidence 23
Flooding 23
Natural Hazard 3
Other 13
System 32 Instrument and control system 30
Equipment 20
Human 68 Incorrect operation 57
Incorrectmaintenance or construction
19
Operational 7
Not depressurised or drained 14
For
insp
ectio
n pur
pose
s only
.
Conse
nt of
copy
right
owne
r req
uired
for a
ny ot
her u
se.
EPA Export 19-02-2014:23:33:58
DET NORSKE VERITAS
Report for Shell E&P Ireland Ltd. Corrib Onshore Pipeline EIS
MANAGING RISK
DNV Reg. No.: 12LKQW5-2 Revision No.: 0 Date : 2010-05-18 Page 26
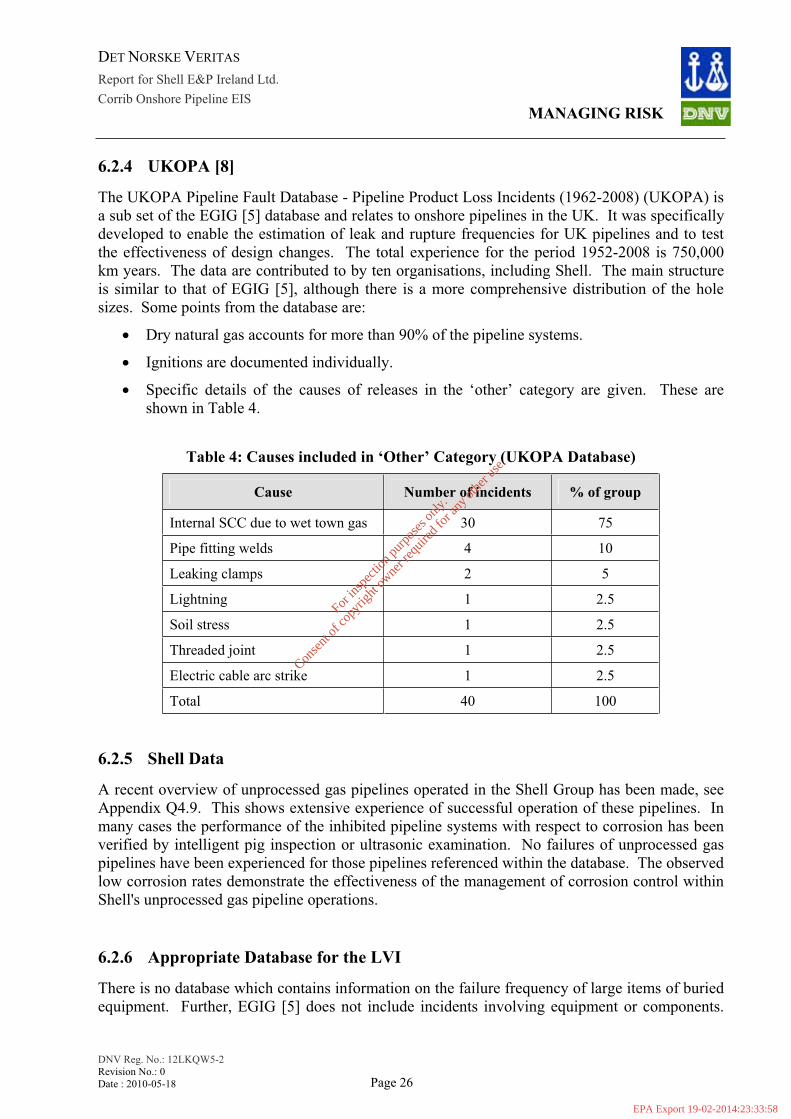
6.2.4 UKOPA [8]
The UKOPA Pipeline Fault Database - Pipeline Product Loss Incidents (1962-2008) (UKOPA) is a sub set of the EGIG [5] database and relates to onshore pipelines in the UK. It was specifically developed to enable the estimation of leak and rupture frequencies for UK pipelines and to test the effectiveness of design changes. The total experience for the period 1952-2008 is 750,000 km years. The data are contributed to by ten organisations, including Shell. The main structure is similar to that of EGIG [5], although there is a more comprehensive distribution of the hole sizes. Some points from the database are:
Dry natural gas accounts for more than 90% of the pipeline systems.
Ignitions are documented individually.
Specific details of the causes of releases in the ‘other’ category are given. These are shown in Table 4.
Table 4: Causes included in ‘Other’ Category (UKOPA Database)
Cause Number of incidents % of group
Internal SCC due to wet town gas 30 75
Pipe fitting welds 4 10
Leaking clamps 2 5
Lightning 1 2.5
Soil stress 1 2.5
Threaded joint 1 2.5
Electric cable arc strike 1 2.5
Total 40 100
6.2.5 Shell Data
A recent overview of unprocessed gas pipelines operated in the Shell Group has been made, see Appendix Q4.9. This shows extensive experience of successful operation of these pipelines. In many cases the performance of the inhibited pipeline systems with respect to corrosion has been verified by intelligent pig inspection or ultrasonic examination. No failures of unprocessed gas pipelines have been experienced for those pipelines referenced within the database. The observed low corrosion rates demonstrate the effectiveness of the management of corrosion control within Shell's unprocessed gas pipeline operations.
6.2.6 Appropriate Database for the LVI
There is no database which contains information on the failure frequency of large items of buried equipment. Further, EGIG [5] does not include incidents involving equipment or components.
For
insp
ectio
n pur
pose
s only
.
Conse
nt of
copy
right
owne
r req
uired
for a
ny ot
her u
se.
EPA Export 19-02-2014:23:33:58
DET NORSKE VERITAS
Report for Shell E&P Ireland Ltd. Corrib Onshore Pipeline EIS
MANAGING RISK
DNV Reg. No.: 12LKQW5-2 Revision No.: 0 Date : 2010-05-18 Page 27
The database that is considered to represent the most appropriate data for use on the LVI equipment is therefore the Hydrocarbon Releases Database [9] which has been used by DNV as the basis for failure frequencies of items of equipment for the last nine years.
6.2.7 Hydrocarbon Release Database [9]
The Hydrocarbon Releases Database was set up following the report of Lord Cullen into the Piper Alpha disaster in 1989, in order to provide data for use in QRAs. It covers hydrocarbon releases from offshore facilities and contains information from October 1992 to March 2008 as reported to the UK HSE Offshore Division (OSD) under the Reporting of Injuries, Diseases and Dangerous Occurrences Regulations 1995 (RIDDOR), and prior offshore legislation. It contains 3644 releases from equipment with a total of more than 25 million operating years in some 120 equipment categories and the data are considered to be of good quality.
Primary causes of failures are classified as equipment, operational, procedural and design causes (66%, 53%, 28% and 15% respectively in the latest available report [28], note that it is possible to have multiple entries), with secondary causes such as corrosion, mechanical failure, erosion, material defect, operator error or other.
6.3 Potential Causes of Loss of Containment from the Pipeline
6.3.1 Qualitative Risk Assessment
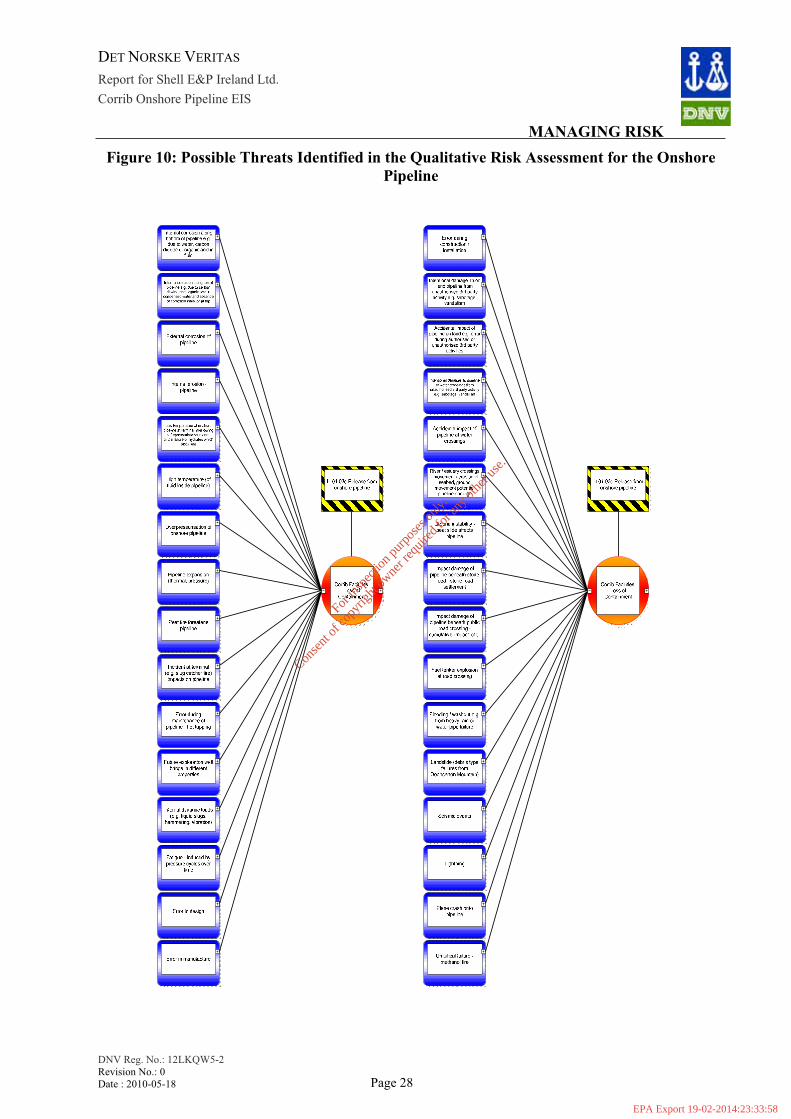
The detailed qualitative consideration of the barriers against potential failure causes (threats) that may lead to loss of containment is facilitated through the use of bowtie analysis as described within the qualitative risk assessment (Appendix Q6.3). The qualitative risk assessment considers different operating conditions and locations along the route as required by the An Bord Pleanála letter of 2nd November. A total of 32 potential failure causes were identified (see Figure 10 and Table 5 for clarity).
The results of the qualitative analyses have been used to perform a screening exercise (as per PD 8010-1 [3]) in order to identify those causes that do not require further consideration in the QRA, either because they are assessed as being non-credible causes for loss of containment (i.e., the cause could not possibly lead to loss of containment) or have such a low frequency of occurrence that their omission will have negligible impact on the risk predictions. These are shown and discussed in Section 6.3.2
Those failure modes not screened out were carried forward to the QRA where further consideration was given to any appropriate modifications to base failure frequencies to account for the specific conditions and the conclusions of detailed engineering studies for certain aspects of the design. Consideration of these failure modes with respect to the specifics of the proposed Corrib pipeline is presented in Section 6.4.
For
insp
ectio
n pur
pose
s only
.
Conse
nt of
copy
right
owne
r req
uired
for a
ny ot
her u
se.
EPA Export 19-02-2014:23:33:58
DET NORSKE VERITAS
Report for Shell E&P Ireland Ltd. Corrib Onshore Pipeline EIS
MANAGING RISK
DNV Reg. No.: 12LKQW5-2 Revision No.: 0 Date : 2010-05-18 Page 28
Figure 10: Possible Threats Identified in the Qualitative Risk Assessment for the Onshore Pipeline
For
insp
ectio
n pur
pose
s only
.
Conse
nt of
copy
right
owne
r req
uired
for a
ny ot
her u
se.
EPA Export 19-02-2014:23:33:58

DET NORSKE VERITAS
Report for Shell E&P Ireland Ltd. Corrib Onshore Pipeline EIS
MANAGING RISK
DNV Reg. No.: 12LKQW5-2 Revision No.: 0 Date : 2010-05-18 Page 29
Table 5: Possible Threats Identified in the Qualitative Risk Assessment for the Onshore Pipeline
Threats Identified in the Qualitative Risk AssessmentInternal corrosion along bottom of pipeline e.g. due to water, carbon dioxide or organic acid in fluid.Internal corrosion along the top of the pipeline e.g. due to carbon dioxide and organic acid in condensed water and absence of corrosion inhibitor at top. External corrosion of the pipeline. Internal erosion of the pipeline. Low temperature at onshore pipeline at terminal inlet during deprepressurisation causes brittle failure or hydrates which block line. High temperature (of fluid inside pipeline). Overpressurisation of onshore pipeline. Pipeline expansion (thermal, pressure). Peat fire threatens pipeline. Incident at terminal (e.g. slug catcher fire) impacts on pipeline. Error during maintenance of pipeline – hot tapping. Future exploration well brings in different properties. Internal dynamic loads (e.g. liquid slugs, hammering, vibration). Fatigue – induced by pressure cycles over time. Error in design. Error in manufacture. Error during construction / installation. Intentional damage to on land pipeline from unauthorized 3rd party activity e.g. sabotage, vandalism. Accidental impact of pipeline on land e.g. error during authorized or unauthorized 3rd party activities.Intentional damage to pipeline at water crossings from unauthorized 3rd party activity e.g. sabotage, vandalism. Accidental impact of pipeline at water crossings. River / estuary crossings – movement / erosion of seabed, ground movement potential pipeline damage. Ground instability – peat slide affects pipeline. Impact damage of pipeline beneath stone road – stone road settlement. Impact damage of pipeline beneath public road crossing Fuel tanker explosion at road crossing. Flooding / washout e.g. from heavy rain or water pipe failure. Landslide (debris type failures from Dooncarton Mountain). Seismic events. Lightning. Plane crash onto pipeline. Umbilical failure – methanol fire.
For
insp
ectio
n pur
pose
s only
.
Conse
nt of
copy
right
owne
r req
uired
for a
ny ot
her u
se.
EPA Export 19-02-2014:23:33:58
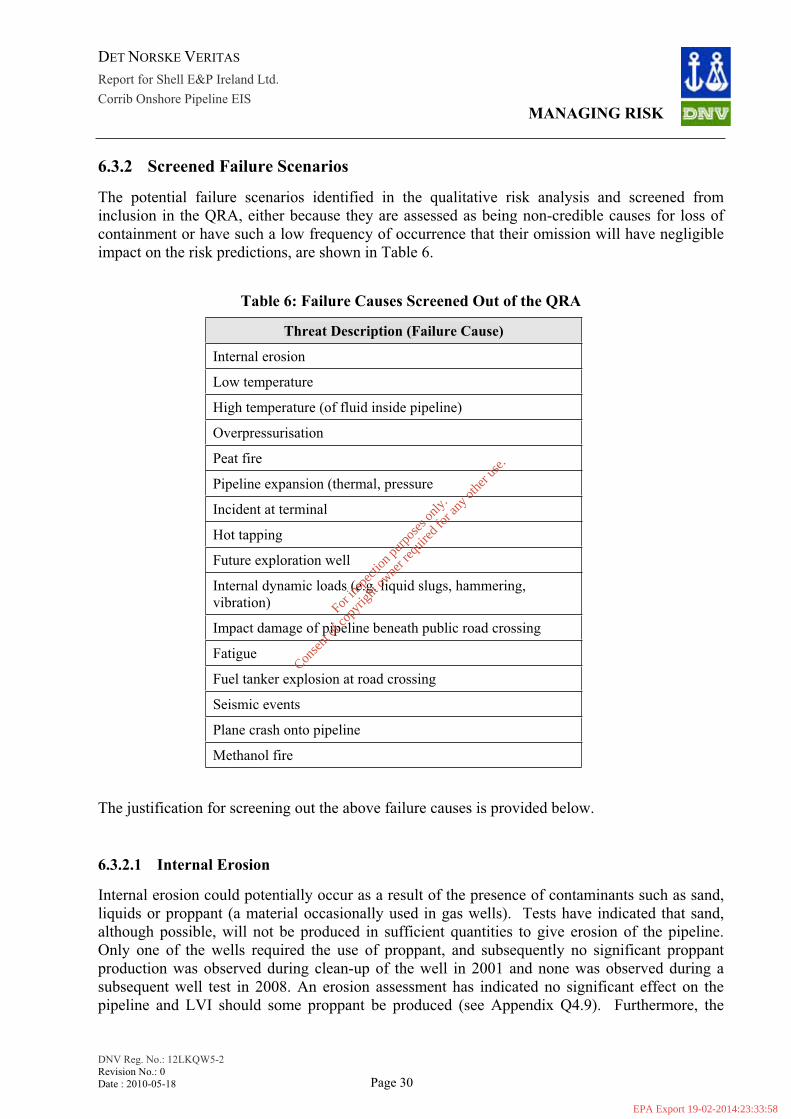
DET NORSKE VERITAS
Report for Shell E&P Ireland Ltd. Corrib Onshore Pipeline EIS
MANAGING RISK
DNV Reg. No.: 12LKQW5-2 Revision No.: 0 Date : 2010-05-18 Page 30
6.3.2 Screened Failure Scenarios
The potential failure scenarios identified in the qualitative risk analysis and screened from inclusion in the QRA, either because they are assessed as being non-credible causes for loss of containment or have such a low frequency of occurrence that their omission will have negligible impact on the risk predictions, are shown in Table 6.
Table 6: Failure Causes Screened Out of the QRA
Threat Description (Failure Cause)
Internal erosion
Low temperature
High temperature (of fluid inside pipeline)
Overpressurisation
Peat fire
Pipeline expansion (thermal, pressure
Incident at terminal
Hot tapping
Future exploration well
Internal dynamic loads (e.g. liquid slugs, hammering, vibration)
Impact damage of pipeline beneath public road crossing
Fatigue
Fuel tanker explosion at road crossing
Seismic events
Plane crash onto pipeline
Methanol fire
The justification for screening out the above failure causes is provided below.
6.3.2.1 Internal Erosion
Internal erosion could potentially occur as a result of the presence of contaminants such as sand, liquids or proppant (a material occasionally used in gas wells). Tests have indicated that sand, although possible, will not be produced in sufficient quantities to give erosion of the pipeline. Only one of the wells required the use of proppant, and subsequently no significant proppant production was observed during clean-up of the well in 2001 and none was observed during a subsequent well test in 2008. An erosion assessment has indicated no significant effect on the pipeline and LVI should some proppant be produced (see Appendix Q4.9). Furthermore, the
For
insp
ectio
n pur
pose
s only
.
Conse
nt of
copy
right
owne
r req
uired
for a
ny ot
her u
se.
EPA Export 19-02-2014:23:33:58
DET NORSKE VERITAS
Report for Shell E&P Ireland Ltd. Corrib Onshore Pipeline EIS
MANAGING RISK
DNV Reg. No.: 12LKQW5-2 Revision No.: 0 Date : 2010-05-18 Page 31
flow velocities in the pipeline are well below those required to cause flow induced erosion-corrosion or liquid droplet induced erosion (typically 20m/s and 38m/s respectively for carbon steel).
6.3.2.2 Low Temperature – Brittle Fracture
Low temperature has the potential to cause pipeline failure by brittle fracture of the line pipe material. All the components of the pipeline system have been designed and fabricated to resist both brittle and ductile fracture at the temperature conditions that will exist in the pipeline (see Appendix Q4.7). Under start-up or blow-down conditions it is possible that sections of the pipeline system will experience low temperatures due to the Joule-Thomson cooling effect. The most likely scenarios that could give low temperature are opening up cold wells to a depressurised pipeline, equalisation of a pressurised offshore pipeline with a depressurised onshore pipeline, or blow-down of the pipeline system. These are all expected to be infrequent events and detailed operating procedures will be put in place to ensure that the pipeline and LVI temperature limits are not exceeded (see Appendix Q4.7). The potential for gas exiting a small hole causing the pipe material to make a transition from a ductile to a brittle regime (thus increasing the risk of crack propagation and ultimately leading to full-bore failure) has been considered (see Appendix Q4.7) and discounted as being non credible.
6.3.2.3 Low Temperature – Hydrates
Since the produced gas is wet hydrate formation can be expected in the pipeline at the normal operating pressure and temperature. Methanol will be injected to prevent hydrate formation and it is only if methanol is not injected in sufficient quantities that a hydrate plug could be formed. Methanol injection rates are automatically monitored and reduction or cessation of methanol injection initiates reduced production or shut down to avoid hydrate formation. Hydrate formation could result in a blockage of the main pipeline. This would cause production to cease and would require the deployment of measure to eliminate the blockage. Specialist procedures would be used to remediate any hydrate blockages but the primary defence is the avoidance of operation in the hydrate formation region. Pressure build up in the pipeline as a result of hydrate blockage is limited to the MAOP of the pipeline by virtue of the safeguarding facilities and therefore does not pose a threat to the integrity of the pipeline. Hydrates are complex gas water crystalline formations and are not like ice and cannot, of themselves, cause a pipeline to fail by expansion causing excessive hoop stress.
6.3.2.4 High Temperature
Given the length of offshore pipeline, the Corrib gas temperature will be at ambient seabed temperature well before it reaches the onshore pipeline and LVI. Downstream of the LVI the pipeline temperature will not exceed ambient soil temperature, which is well below the upper design temperature limit of the pipeline. Temperatures above ambient soil temperature conditions could occur if the onshore pipeline was re-pressurised by back feed gas from the terminal. Facilities are in place to limit the temperature of the back feed gas to below the pipeline
For
insp
ectio
n pur
pose
s only
.
Conse
nt of
copy
right
owne
r req
uired
for a
ny ot
her u
se.
EPA Export 19-02-2014:23:33:58
DET NORSKE VERITAS
Report for Shell E&P Ireland Ltd. Corrib Onshore Pipeline EIS
MANAGING RISK
DNV Reg. No.: 12LKQW5-2 Revision No.: 0 Date : 2010-05-18 Page 32
maximum design temperature. There is no credible pipeline high temperature condition that could lead to loss of containment in the pipeline.
6.3.2.5 Overpressurisation
The pipeline is protected against exceeding the MAOP by pressure sensors, alarms, trips and isolation valves with a high level of reliability (see Appendix Q3.1). The onshore pipeline will be hydrostatically tested to 504barg and has a design pressure of 144 barg. Loss of containment due to over pressurisation is not therefore considered a credible event.
6.3.2.6 External fire - Peat
Where the pipeline passes through peat bog, it is contained within a stone road, which will serve to insulate the pipeline from potential peat fires. Even if the pipeline was directly in the peat, the estimated maximum temperature reached within a peat fire is 600o (see Grishin et al [29]). The strength of the steel at this temperature is well in excess of that required to maintain containment (see Barker [15]).
6.3.2.7 External fire – Methanol
Methanol is transported in the umbilical line, and in the event of umbilical failure would be released. If containment was lost the pressure would be quickly dissipated (as methanol is essentially incompressible) and the rate of release would be low (of the order of 2 kg/s). The pressurised release of methanol is likely to cause the surrounding material to be displaced to create a pathway through the soil through which the methanol could flow. On contact with air methanol is potentially flammable. Should ignition of methanol occur, the flame would stabilise above the methanol liquid (pool) fire (which is predicted to have a steady state pool diameter of approximately 12m) and the temperature of the unburnt liquid would remain at the boiling point (65°C). This would pose no risk to the gas pipeline more than 1m below the surface of the ground.
6.3.2.8 Pipeline Expansion
Under normal production the onshore pipeline will operate within a narrow temperature range dictated by ambient sea bed and soil temperatures. During start-up and depressurisation a wider temperature range is predicted but this is still within the range of design temperatures for the pipeline. Any expansion will be within the pipeline design stress limits as specified in the design code.
6.3.2.9 Incident at the terminal
There is a short (approximately 3-4m) length of the pipeline above ground within the terminal fence, which could be exposed to a jet fire if there was a major release from equipment in the
For
insp
ectio
n pur
pose
s only
.
Conse
nt of
copy
right
owne
r req
uired
for a
ny ot
her u
se.
EPA Export 19-02-2014:23:33:58

DET NORSKE VERITAS
Report for Shell E&P Ireland Ltd. Corrib Onshore Pipeline EIS
MANAGING RISK
DNV Reg. No.: 12LKQW5-2 Revision No.: 0 Date : 2010-05-18 Page 33
vicinity. This section of pipeline is protected by the application of passive fire protection to protect against potential impingement of a jet fire.
6.3.2.10 Hot Tapping of the Wrong Pipeline
Releases due to hot-tapping (the process of making a connection with the pipeline whilst it is still in operation) have been known to occur when there are multiple pipelines within a trench and the wrong pipeline is inadvertently selected for working on. This situation would not arise for the Corrib pipeline as there is no foreseeable need for hot-tap and if hot tapping were to be carried out, the gas pipeline is the only steel pipeline thus this event is not considered further.
6.3.2.11 Future Exploration Well brings in different Properties
Any such development would be subject to a separate regulatory approval process in future and is not considered in this QRA.
6.3.2.12 Internal Dynamic Loads
The pipeline has been designed for multiphase flow. The pipeline will operate in the dispersed or stratified wavy regime with low liquid loading and hence dynamic loads will not cause failure
6.3.2.13 Fatigue
Fatigue is caused by stress cycling (usually due to pressure cycling from line packing, but could result from thermal cycling or external loading). The pipeline will not be operated in this mode and so fatigue is not considered as a potential contributor to failure. Pressure cycles will however be monitored at the Terminal.
6.3.2.14 Impact damage of pipeline beneath public road crossing
The road crossing design and construction will be in accordance with the code (see Appendix Q4.1). and so separate consideration of this potential failure mode is not appropriate.
6.3.2.15 Fuel tanker explosion at road crossing
The majority of tanker traffic in the vicinity of the terminal is expected to be associated with the terminal operation itself, and all these tankers are routed such that they do not cross the buried pipeline. Other traffic, e.g. domestic deliveries, may occasionally cross the pipeline. In the event of a road tanker incident with loss of containment and subsequent ignition of the tanker cargo, burning would be on the surface at ground level and there would be no effect on the integrity of the gas pipeline.
For
insp
ectio
n pur
pose
s only
.
Conse
nt of
copy
right
owne
r req
uired
for a
ny ot
her u
se.
EPA Export 19-02-2014:23:33:59
DET NORSKE VERITAS
Report for Shell E&P Ireland Ltd. Corrib Onshore Pipeline EIS
MANAGING RISK
DNV Reg. No.: 12LKQW5-2 Revision No.: 0 Date : 2010-05-18 Page 34
6.3.2.16 Seismic events
Earthquake risk in Ireland is very low (British Geological Safety [30]) and Erris is categorised as less than "very low". Hence, in accordance with the codes, the pipeline design incorporates no specific provisions for seismic activity.
6.3.2.17 Plane crash onto pipeline
Given the small cross sectional area of the pipeline, its remote location and the absence of any major airports in the vicinity, the likelihood of a plane impact is judged to be sufficiently remote that it can be discounted from further consideration.
6.4 Failure Scenarios Specific to the Corrib Pipeline The threats carried forward from the qualitative risk analysis to the QRA are shown in Table 7, cross-referenced to the applicable database failure mode.
An assessment of each failure scenario noted in Table 5 is made taking account of the specific design and operational intent of the Corrib pipeline and any studies carried out as input to the derivation of a representative failure frequency.. This process involves the identification of the most suitable failure frequency from one of the selected databases and, if appropriate, the application of a modifier to this selected frequency to reflect Corrib specific aspects in order to arrive at the base-case frequency.
For
insp
ectio
n pur
pose
s only
.
Conse
nt of
copy
right
owne
r req
uired
for a
ny ot
her u
se.
EPA Export 19-02-2014:23:33:59
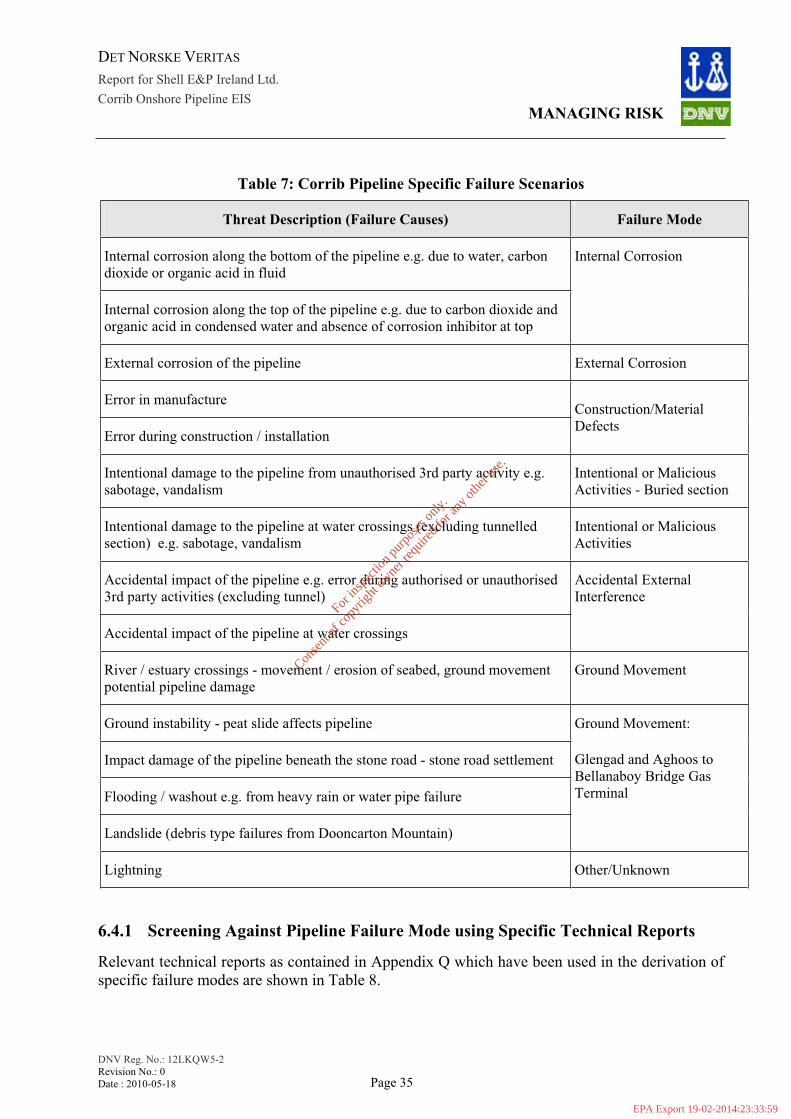
DET NORSKE VERITAS
Report for Shell E&P Ireland Ltd. Corrib Onshore Pipeline EIS
MANAGING RISK
DNV Reg. No.: 12LKQW5-2 Revision No.: 0 Date : 2010-05-18 Page 35
Table 7: Corrib Pipeline Specific Failure Scenarios
Threat Description (Failure Causes) Failure Mode
Internal corrosion along the bottom of the pipeline e.g. due to water, carbon dioxide or organic acid in fluid
Internal corrosion along the top of the pipeline e.g. due to carbon dioxide and organic acid in condensed water and absence of corrosion inhibitor at top
Internal Corrosion
External corrosion of the pipeline External Corrosion
Error in manufacture
Error during construction / installation
Construction/Material Defects
Intentional damage to the pipeline from unauthorised 3rd party activity e.g. sabotage, vandalism
Intentional or Malicious Activities - Buried section
Intentional damage to the pipeline at water crossings (excluding tunnelled section) e.g. sabotage, vandalism
Intentional or Malicious Activities
Accidental impact of the pipeline e.g. error during authorised or unauthorised 3rd party activities (excluding tunnel)
Accidental impact of the pipeline at water crossings
Accidental External Interference
River / estuary crossings - movement / erosion of seabed, ground movement potential pipeline damage
Ground Movement
Ground instability - peat slide affects pipeline
Impact damage of the pipeline beneath the stone road - stone road settlement
Flooding / washout e.g. from heavy rain or water pipe failure
Landslide (debris type failures from Dooncarton Mountain)
Ground Movement:
Glengad and Aghoos to Bellanaboy Bridge Gas Terminal
Lightning Other/Unknown
6.4.1 Screening Against Pipeline Failure Mode using Specific Technical Reports
Relevant technical reports as contained in Appendix Q which have been used in the derivation of specific failure modes are shown in Table 8.
For
insp
ectio
n pur
pose
s only
.
Conse
nt of
copy
right
owne
r req
uired
for a
ny ot
her u
se.
EPA Export 19-02-2014:23:33:59
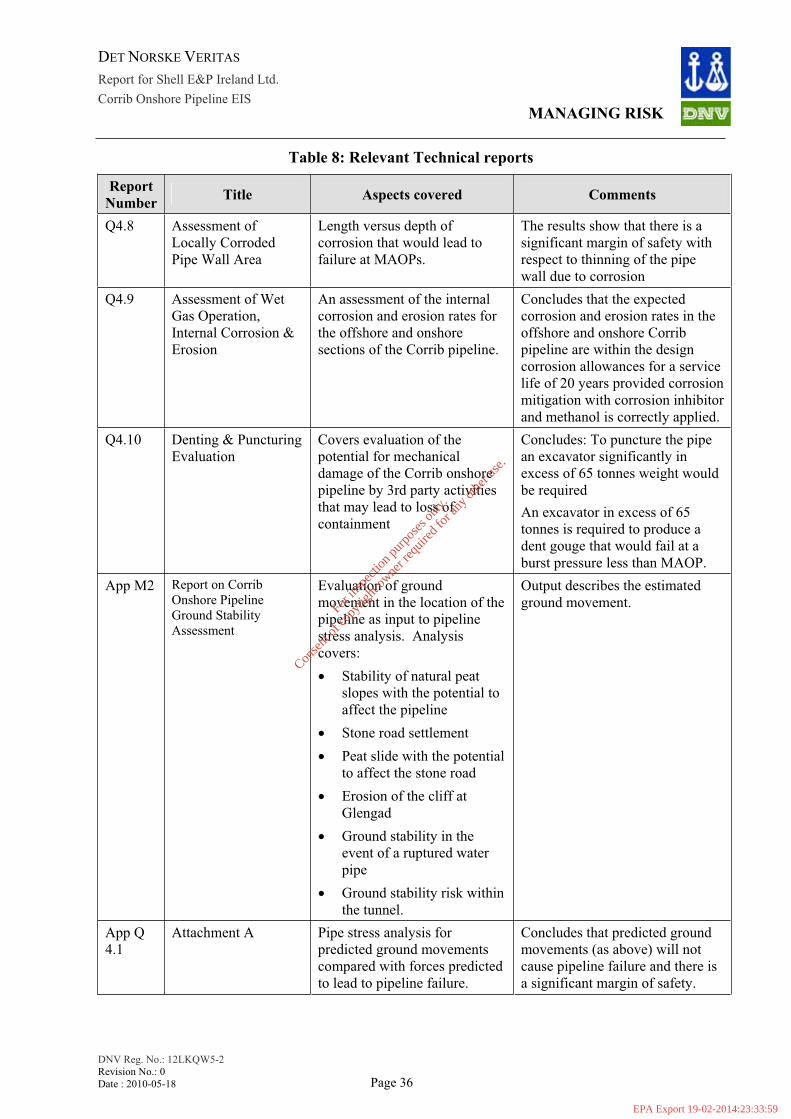
DET NORSKE VERITAS
Report for Shell E&P Ireland Ltd. Corrib Onshore Pipeline EIS
MANAGING RISK
DNV Reg. No.: 12LKQW5-2 Revision No.: 0 Date : 2010-05-18 Page 36
Table 8: Relevant Technical reports
ReportNumber Title Aspects covered Comments
Q4.8 Assessment of Locally Corroded Pipe Wall Area
Length versus depth of corrosion that would lead to failure at MAOPs.
The results show that there is a significant margin of safety with respect to thinning of the pipe wall due to corrosion
Q4.9 Assessment of Wet Gas Operation, Internal Corrosion & Erosion
An assessment of the internal corrosion and erosion rates for the offshore and onshore sections of the Corrib pipeline.
Concludes that the expected corrosion and erosion rates in the offshore and onshore Corrib pipeline are within the design corrosion allowances for a service life of 20 years provided corrosion mitigation with corrosion inhibitor and methanol is correctly applied.
Q4.10 Denting & Puncturing Evaluation
Covers evaluation of the potential for mechanical damage of the Corrib onshore pipeline by 3rd party activities that may lead to loss of containment
Concludes: To puncture the pipe an excavator significantly in excess of 65 tonnes weight would be requiredAn excavator in excess of 65 tonnes is required to produce a dent gouge that would fail at a burst pressure less than MAOP.
App M2 Report on Corrib Onshore Pipeline Ground Stability Assessment
Evaluation of ground movement in the location of the pipeline as input to pipeline stress analysis. Analysis covers:
Stability of natural peat slopes with the potential to affect the pipeline Stone road settlement Peat slide with the potential to affect the stone road Erosion of the cliff at GlengadGround stability in the event of a ruptured water pipeGround stability risk within the tunnel.
Output describes the estimated ground movement.
App Q 4.1
Attachment A Pipe stress analysis for predicted ground movements compared with forces predicted to lead to pipeline failure.
Concludes that predicted ground movements (as above) will not cause pipeline failure and there is a significant margin of safety.
For
insp
ectio
n pur
pose
s only
.
Conse
nt of
copy
right
owne
r req
uired
for a
ny ot
her u
se.
EPA Export 19-02-2014:23:33:59
DET NORSKE VERITAS
Report for Shell E&P Ireland Ltd. Corrib Onshore Pipeline EIS
MANAGING RISK
DNV Reg. No.: 12LKQW5-2 Revision No.: 0 Date : 2010-05-18 Page 37
The Sections below further discuss the key conclusions from these Reports and any consequent modifications proposed to the base case failure frequency.
6.4.2 External Corrosion
As noted 81% of EGIG [5] corrosion failures were external, mainly as a result of pitting and galvanic action. These and other potential mechanisms for external corrosion (stress corrosion cracking, stray current corrosion and hydrogen induced stress cracking) are considered in detail in Appendix Q4.7. To mitigate external corrosion of the pipeline, the primary barrier is a robust 3 layer polypropylene coating. The field joints will use a standard shrink sleeve system. For the onshore pipeline an additional epoxy primer will be used under the shrink sleeve.
As a secondary barrier to external corrosion should the coating be damaged, the pipeline will be protected by a cathodic protection system using sacrificial aluminium anodes for the offshore pipeline and an impressed current system for the LVI and onshore pipeline. The design and installation of the tunnel section of the onshore pipeline will provide a similar level of protection against external corrosion (see Appendix Q4.7).
This combination of external coating and cathodic protection will give the Corrib pipeline the same level of protection against external corrosion as that of similar pipelines designed in accordance with the current codes.
6.4.2.1 External Corrosion Failure Frequency
The factors that influence the selected generic base frequency for loss of containment due to external corrosion are:
The pipeline wall thickness;
The use of in-line inspection;
The coating specification;
The cathodic protection system.
These factors have been addressed by de Stefani et al [10] who analysed the failures in historical pipeline databases and developed an empirical model to estimate numerical modifiers to the generic failure frequencies. This approach has been used to determine a specific frequency for external corrosion.
The base frequency for external corrosion of natural gas pipelines with external polypropylene coating is taken from EGIG [5] and is 1E-05per km per year. The modifying factor for pipeline wall thickness >15mm is 0.003. There is no modification factor for cathodic protection (as most pipelines in the database have this protection). Periodic in line inspection using intelligent pigging will be carried out for the onshore pipeline (Appendix Q.2), but a conservative approach
For
insp
ectio
n pur
pose
s only
.
Conse
nt of
copy
right
owne
r req
uired
for a
ny ot
her u
se.
EPA Export 19-02-2014:23:33:59
DET NORSKE VERITAS
Report for Shell E&P Ireland Ltd. Corrib Onshore Pipeline EIS
MANAGING RISK
DNV Reg. No.: 12LKQW5-2 Revision No.: 0 Date : 2010-05-18 Page 38
was taken and no modification has been applied for in line inspection.* The overall failure frequency due to external corrosion is therefore taken as 3E-08 per km per year.
6.4.3 Internal CorrosionA detailed review of all the relevant corrosion mechanisms has been conducted (see Appendix Q4.7), and the strategy for monitoring and control is given in Appendix Q5.1 The main aspects of corrosion mechanisms and management relevant to the selection of frequencies within this QRA (taken from the above references) are given below.
CO2 and Organic Acid Corrosion Carbon dioxide (CO2) becomes corrosive when it dissolves in water to form carbonic acid, and this will be the primary corrosion threat to the pipeline. The presence of organic acids can increase the corrosivity. If the fluids in the pipeline are uninhibited, the predicted corrosion rates in the onshore pipeline are 0.12mm/yr for condensed water and 0.2mm/yr for formation water. To mitigate such corrosion it is common practice to inject corrosion inhibitor (which forms a barrier against the corrosive fluids) or to inject glycol or methanol which are miscible with the corrosive water and further reduce the corrosivity.For the Corrib pipeline the threat of CO2 and organic acid corrosion will be mitigated primarily by injecting corrosion inhibitor but will also benefit from the presence of methanol. The predicted inhibited corrosion rates in the onshore pipeline are <0.05mm/yr for all production scenarios. The pipeline design includes a 1mm corrosion allowance and in addition the 27.1mm wall thickness of the design provides further contingency. For sections of the pipeline where protection of the carbon steel pipe by the film forming corrosion inhibitor cannot be assured, e.g. due to insufficient length to establish the film or where there is turbulent flow, corrosion resistant materials have been used. This includes the LVI pipework and valves. The section of onshore pipeline and 20” valve within the LVI has also been overlay welded with Alloy 625 because of the potential for turbulent flow and the presence of stagnant conditions during normal operation.
Top of the Line Corrosion CO2 or organic acid corrosion can occur in pipelines where the flow regime is stratified and condensation occurs at the top of the pipeline. The corrosion inhibitor does not generally provide protection here, but mitigation will be provided by the co-condensing methanol. The expected flow regime over the full length of the Corrib pipeline is annular dispersed for the 20 year field life which precludes top of line corrosion as a mechanism.
Preferential Weld Corrosion Pipelines in wet gas service are susceptible to preferential CO2 corrosion at the welds but this will be mitigated by the corrosion inhibitor as described above, and control of the weld chemistry.
* At the time that the QRA was carried out SEPIL was in the process of verifying the accuracy of potential intelligent pig technologies. Subsequently SEPIL has confirmed that the selected technology is capable of measuring the wall thickness to the desired accuracy, and so if the QRA was to be carried out now, an additional modification factor of 0.175 would be used.
For
insp
ectio
n pur
pose
s only
.
Conse
nt of
copy
right
owne
r req
uired
for a
ny ot
her u
se.
EPA Export 19-02-2014:23:33:59
DET NORSKE VERITAS
Report for Shell E&P Ireland Ltd. Corrib Onshore Pipeline EIS
MANAGING RISK
DNV Reg. No.: 12LKQW5-2 Revision No.: 0 Date : 2010-05-18 Page 39
Galvanic Corrosion Galvanic corrosion occurs as a result of differences in electrochemical potential between metals, e.g. between the stainless steel T-piece and the pipeline at the LVI, but has not generally been observed in producing oil and gas systems and will not occur along the pipeline. Mitigation at the interface will be provided by the corrosion allowance, and the absence of this mechanism will be confirmed by wall thickness checks at the LVI.
H2S Corrosion As there is no hydrogen sulphide (H2S) in the Corrib wells, this type of corrosion will not occur (however measurements will be taken at the terminal to monitor for the presence of H2S).
Microbial Induced Corrosion Bacterial related corrosion is unusual in gas/condensate production systems and with no requirement for water injection there is no expectation that this mechanism will occur in the Corrib pipeline during operation.
Corrosion by Hydrotest Water In common with other gas pipelines, there will be a pressure test using water. Standard methods will ensure that all threats of corrosion from this activity are mitigated prior to putting the pipeline into service.
Stress Corrosion Cracking There are no credible internal stress corrosion cracking mechanisms for carbon steel and no chloride stress corrosion cracking of stainless steels is anticipated with the Corrib production conditions.
Stray Current Corrosion Stray current corrosion can occur when an isolation joint fails due to bridging or short circuiting. An isolation joint is provided between the pipeline and the terminal and will be periodically monitored for this corrosion mechanism. There is no isolation joint between the offshore and onshore cathodic protection systems thus eliminating the possibility of stray current corrosion.
6.4.3.1 Internal Corrosion Failure Frequency
There is no database frequency for internal corrosion that directly correlates with, and hence can be directly applied to, the Corrib pipeline. The two most closely appropriate databases are EGIG [5] for treated natural gas and CONCAWE [6] for hydrocarbon liquids. Expert metallurgical review has concluded that the overall corrosion potential associated with the Corrib gas is greater than that for treated natural gas (EGIG) but less than that for crude oil (CONCAWE) (see Appendix Q4.7). Consequently the use of CONCAWE [6] for crude oil pipelines only as a base frequency would be conservative and has thus been adopted. This value is 5.85E-05 per km per year
The same modification factor as discussed above (6.4.3.1) from de Stefani [10] for external corrosion was used for pipeline thickness (0.003) together with an additional modification factor of 0.175 for in-line inspection which gives an overall base case failure frequency of 3.1E-08 per km per year.
For
insp
ectio
n pur
pose
s only
.
Conse
nt of
copy
right
owne
r req
uired
for a
ny ot
her u
se.
EPA Export 19-02-2014:23:33:59
DET NORSKE VERITAS
Report for Shell E&P Ireland Ltd. Corrib Onshore Pipeline EIS
MANAGING RISK
DNV Reg. No.: 12LKQW5-2 Revision No.: 0 Date : 2010-05-18 Page 40
6.4.4 Material Manufacture and Construction Defects
The pipeline has been manufactured to industry standard quality assurance processes, including frequent quality assurance examination and testing. Construction of the pipeline (and LVI) will be performed according to specified procedures by competent personnel, including independent verification. The final pre commissioning check will be a hydrostatic test to 504barg which is over 5 times the MAOP downstream of the LVI.
6.4.4.1 Material Manufacture & Construction Defects Failure Frequency
Given the above, despite the hydrostatic test, there are no grounds for assuming that the Corrib pipeline is less vulnerable to material or construction defects than any other pipeline that is laid to current standards. EGIG [5] indicates that no failure has occurred due to this cause in pipelines laid after 2004. However, in order not to use a statistical frequency, the base frequency for the period 1994-2003 has been used without any modification.
6.4.5 Ground Movement
A series of studies has been carried out to assess the potential for ground movement of various types along the length of the pipeline (see Appendix M2). The aim has been to determine the extent to which the pipeline may be subjected to movement (e.g. as a result of a landslide, or settlement of the stone road) and then assess whether this may lead to failure of the pipeline. To complement these studies and enable safety margins to be demonstrated the degree of movement required that may lead to failure of the pipeline has been assessed.
The geotechnical based studies (see Appendix M2) cover the following:
A peat stability and potential for peat failure assessment for the proposed onshore pipeline route from the landfall at Glengad Headland to the Bellanaboy terminal site. This involved the assessment of the stability of natural peat slopes along the proposed pipeline route.
Assessment of the proposed use of a stone road in areas of peat involving an assessment of ground investigation, an interpretation of ground conditions, and stability analysis of the stone road.
Assessment of the ability of the stone road to resist lateral loading from any potential peat landslide impact.
Assessment of the risk of instability of the stone road during the operation of the pipeline.
Ground stability risk associated with landslides originating on Dooncarton Mountain.
Erosion of the cliff at Glengad with the potential to lead to ground movement affecting the pipeline and the LVI.
Ground stability in the vicinity of the pipeline and umbilical in the event of a ruptured water pipe.
For
insp
ectio
n pur
pose
s only
.
Conse
nt of
copy
right
owne
r req
uired
for a
ny ot
her u
se.
EPA Export 19-02-2014:23:33:59
DET NORSKE VERITAS
Report for Shell E&P Ireland Ltd. Corrib Onshore Pipeline EIS
MANAGING RISK
DNV Reg. No.: 12LKQW5-2 Revision No.: 0 Date : 2010-05-18 Page 41
The conclusion of these studies is that ground movement (settlements, land/peat slides encroaching on the pipeline) in the vicinity of the pipeline and umbilicals is not expected to impact the pipeline (instability is assessed as ‘negligible or unlikely to occur’).
The degree of movement that may lead to pipeline failure has been analysed (see Appendix Q4.1) as follows:
An assessment of the effect of settlement in all pipelines and services (gas pipeline, outfall pipeline, umbilicals and cables) to demonstrate that the design settlement values will not cause failure.
A demonstration of the safety margin inherent in the design by estimating the settlement required to cause rupture/breakage in the gas pipeline.
An assessment of the stresses developed in the Gas Pipeline during operation due to an unsupported length of 40m occurring within the stone road.
These studies demonstrate there is a significant margin of safety with respect to pipeline failure. (e.g. the pipeline could tolerate a settlement 10 times greater than that predicted for the stone road and the pipeline is capable of free spanning 40m, a significantly greater distance than the estimated width of a water pipe rupture washout).
6.4.5.1 Ground Movement Failure Frequency
Based on these studies it is concluded that none of the potential ground movement scenarios poses a credible threat to the pipeline sufficient to lead to a loss of containment and consequently this failure cause has been allocated a zero frequency.
However, given the previous concerns associated with this failure mode, a sensitivity analysis has been carried out based on application of the frequency value provided in PD 8010-3 [1] which is at the upper end of the lowest landslip category (9E-08 per km per year frequency of failure).
6.4.6 Accidental External Interference
The main safeguards against failure due to external interference are:
The pipeline wall thickness (27.1mm). Wall thickness is a major factor in the potential for failure and there are no recorded failures of pipelines in EGIG [5] with a wall thickness in excess of 15mm.
Burial of the pipeline with concrete slabs at road and small water crossings (onshore).
Burial in a fully grouted tunnel beneath Sruwaddacon Bay.
Surface and buried marking of the route, fortnightly surveys and excavation controls.
Appendix Q4.10 reviews the potential for mechanical damage of the Corrib onshore pipeline by 3rd party activities that may lead to loss of containment. It describes the results of an evaluation of the effect of third party mechanical damage on the integrity of the landfall section upstream of the LVI and the section downstream of the LVI to the terminal.
For
insp
ectio
n pur
pose
s only
.
Conse
nt of
copy
right
owne
r req
uired
for a
ny ot
her u
se.
EPA Export 19-02-2014:23:33:59
DET NORSKE VERITAS
Report for Shell E&P Ireland Ltd. Corrib Onshore Pipeline EIS
MANAGING RISK
DNV Reg. No.: 12LKQW5-2 Revision No.: 0 Date : 2010-05-18 Page 42
The potential for damage leading to loss of containment has been correlated with the puncture and denting resistance for the Corrib pipeline. It was concluded that:
In order to puncture the pipe an excavator in excess of 65 tonnes weight would be required, due to the large wall thickness of the pipeline. Indeed, the estimated energy required to puncture the pipeline would be equivalent to that of an excavator of 150 tonnes weight (it is likely that excavators operating in the locality will be a maximum of approximately 30 tonnes).
Denting or gouging of the pipeline that may not immediately lead to loss of containment but may result in subsequent failure should the pressure in the pipeline increase (so-called burst pressure) would also require an excavator in excess of 65 tonnes to produce a dent gouge that would fail at a burst pressure less than the MAOP.
6.4.6.1 Accidental External Interference Failure Frequency
The DNV QRA of 2009 [16] contained a study by Haswell and Lyons (PIE) [27] which is also included with this QRA (see Attachment A). This gave a detailed calculation for the failure frequency due to external interference. Further studies for this EIS (Appendix Q4.10) confirm that the conclusions of Attachment A are unchanged. The PIE study gives a total failure frequency of 2.24E-09 per km per year for a pipeline at 100 barg.
For the tunnelled section of the pipeline, given that the bay is too shallow for significant marine traffic together with the burial depth and the protection afforded by the fully grouted concrete walled tunnel, no credible failure scenario has been identified and hence a failure frequency of zero has been assigned to this section of pipeline.
6.4.7 Third Party Intentional Damage
It is not normal practice to consider this mode of failure in a QRA, but it has been specifically requested by An Bord Pleanála in their letter of 2nd November 2009, page 2, item (d).
Throughout the majority of its route onshore the Corrib pipeline will be protected against intentional damage by its burial depth and the large wall thickness. Additionally for the section running beneath Sruwaddacon Bay, the line will be encased within a concrete tunnel, rendering such damage extremely difficult.
The LVI will be surrounded by a security fence. The only equipment within the LVI plot which will be above ground and connected to the buried pipeline will be the valve actuators and instrument connections. The compound will be protected by, CCTV monitoring and intruder alarms.
CONCAWE [6] reports that on liquid pipelines there were 23 spillages caused by intentional damage by third parties; two resulting from terrorist activities, five from vandalism, but the majority (16) were from attempted or successful product theft. The incidents were either on above ground sections of pipelines/valve stations or at road or river crossings.
For
insp
ectio
n pur
pose
s only
.
Conse
nt of
copy
right
owne
r req
uired
for a
ny ot
her u
se.
EPA Export 19-02-2014:23:33:59
DET NORSKE VERITAS
Report for Shell E&P Ireland Ltd. Corrib Onshore Pipeline EIS
MANAGING RISK
DNV Reg. No.: 12LKQW5-2 Revision No.: 0 Date : 2010-05-18 Page 43
Experience with natural gas pipelines in USA records four incidents attributed to vandalism. Although no descriptive text is recorded, one incident was in an underground pipeline. Data on liquid pipelines give 10 vandalism incidents, but only one in an underground pipeline.
6.4.7.1 Third Party Intentional Damage Failure Frequency
For the base case a value of zero has been used, and a sensitivity has been carried out in order to comply with the request from An Bord Pleanála. A failure frequency has been taken from de Stefani [10] assuming that the frequency is in the lowest (of three categories) for a gas pipeline. This frequency is 9.3E-06 per km per year and is applied to the ‘hole’ category. There is no similar factor that can be referenced for below ground equipment, so a factor of 10 increase was used for the potential for holes at the LVI. Intentional damage to the tunnelled section of the pipeline is not considered to be a credible scenario and has not been considered further.
6.4.8 Other / Unknown
The qualitative risk analysis is the primary means for identification of specific failure modes; the use of failure causes specified in the databases is the secondary means of identification. The former have been considered in the previous sections, the latter are considered in this section. The only other/unknown cause specifically identified in EGIG [5] is lightning (and this is also the most common cause in this category). Although not specified in EGIG, it is understood that most if not all of the lightning strike incidents occurred on above ground sections; it is difficult to comprehend lightning causing loss of containment of a below ground pipeline although ignition of existing leaks from such pipelines could occur.
Of the loss causes in UKOPA [8], (see Table 4) pipe fitting welds, leaking clamps and threaded joints are not applicable. Internal cracking due to wet town’s gas is also not applicable (see Appendix Q4.7) as the pipeline will not be used for this purpose. This corrosion mechanism requires the presence of CO2 and carbon monoxide (and is enhanced by oxygen). Neither carbon monoxide nor oxygen is present in the Corrib gas. Electric arc strike is a maintenance activity but is not applicable because of the thickness of the Corrib pipeline. The incident classified as soil stress is known to be a combination of a pipeline modification and external loading; the latter has been considered and allocated a zero frequency. This leaves only lightning in the ‘other’ category in the UKOPA database.
6.4.8.1 Failure Frequency due to Other Causes
As the measures taken to protect the pipeline from lightning will be the same as those for any other buried pipeline, the frequency due to lightning has been included by taking 20 incidents and the EGIG exposure during the period 1970-2007 (6.4E-06 per km per year).
6.5 Pipeline Hole Size Distribution As stated previously EGIG [5] gives failures in terms of three hole sizes. In this analysis, possible releases from holes and ruptures have been included; ignited leaks from pinholes would
For
insp
ectio
n pur
pose
s only
.
Conse
nt of
copy
right
owne
r req
uired
for a
ny ot
her u
se.
EPA Export 19-02-2014:23:33:59
DET NORSKE VERITAS
Report for Shell E&P Ireland Ltd. Corrib Onshore Pipeline EIS
MANAGING RISK
DNV Reg. No.: 12LKQW5-2 Revision No.: 0 Date : 2010-05-18 Page 44
impact only very near to the pipeline and have been neglected. The distribution of the overall frequency into the different hole sizes has been based on the databases and Attachment A.
A hole in a high pressure gas pipeline can, if certain conditions are met, propagate to a full bore rupture. Consequently in order to determine a hole size that is appropriate to use for the ‘hole’ category, (i.e. from an equivalent diameter of 20mm up to a hole with the same cross sectional area as the pipeline), the size of the defect that will propagate to a rupture needs to be determined. This is known as the critical defect length. The critical defect length for a pipeline operating at 100 barg has been determined as 447mm and an equivalent hole is estimated to have diameter of 80mm (Attachment A). It has been assumed that any hole with an equivalent diameter in excess of 80mm would propagate to give a full bore rupture, irrespective of the cause. In the ‘hole’ category of releases it was thus assumed that the representative hole for the purposes of the analysis had an average cross sectional area between the lower diameter of the ‘hole’ category (20mm) and the upper critical hole size (80mm) which gives a hole diameter of 58mm.
A summary of the overall failure frequency for each failure cause, the basis for the hole size distribution and the corresponding frequency of each hole size used in the QRA are given in Table 9.
6.6 Overall Corrib Pipeline Failure Frequency The overall failure frequency of the Corrib pipeline is the total of the frequencies for the three different hole sizes in Table 9 (1.28E-05 per km per year). This value may be compared with that derived from specific Shell unprocessed gas experience for 40384 km years without a loss of containment incident, which, assuming a Poisson distribution and a 50% confidence interval, gives a frequency of 1.7E-05per km per year (for all causes).
For
insp
ectio
n pur
pose
s only
.
Conse
nt of
copy
right
owne
r req
uired
for a
ny ot
her u
se.
EPA Export 19-02-2014:23:33:59

DET NORSKE VERITAS
Report for Shell E&P Ireland Ltd. Corrib Onshore Pipeline EIS
MANAGING RISK
DNV Reg. No.: 12LKQW5-2 Revision No.: 0 Date : 2010-05-18 Page 45
Table 9: Base Failure Frequencies for the Pipeline
Failure Mode Pressure Source of Base Data
Total Failure Frequency
Source of Hole distribution
Probability of Pinhole
Probability of Hole
Probability of Rupture
PinholeFrequency (Per km per year)
HoleFrequency(Per km per year)
RuptureFrequency(Per km per year)
barg per km per year per km per
yearper km per year
per km per year
Internal Corrosion - All sections All CONCAWE
Crude Oil 3.07E-08 CONCAWE 0.59 0.34 0.07 1.81E-08 1.04E-08 2.15E-09
External Corrosion - All sections All EGIG 7 3.0E-08 EGIG 7 1 0 0 3.0E-08 0 0
Material & Construction Defects - All sections
All EGIG 7 6.36E-06 IGEM 0.83 0.17 0 5.28E-06 1.08E-06 0
100 ATTACHMENT A 2.24E-09 ATTACHMENT A 0 0.98 0.02 0 2.19E-09 5.35E-11 Accidental External Interference – Buried Sections 150 ATTACHMENT A 4.46E-09 ATTACHMENT A 0 0.85 0.16 0 3.77E-09 6.92E-10
Accidental External Interference - Tunnelled Section
100 0 0 0 0 0 0 0
Ground Movement Glengad and Aghoos All PD 8010-3 and
Specialist Reports 0 0 0 1 0 0 0
Other and Unknown - All sections All EGIG 7 6.4E-06 EGIG 7 0.95 0.05 0 6.03E-06 3.17E-07 0
Total for buried sections 1.14E-05 1.41E-06 2.20E-09
Total for tunnelled section 1.14E-05 1.41E-06 2.15E-09
For
insp
ectio
n pur
pose
s only
.
Conse
nt of
copy
right
owne
r req
uired
for a
ny ot
her u
se.
EPA Export 19-02-2014:23:33:59

DET NORSKE VERITAS
Report for Shell E&P Ireland Ltd. Corrib Onshore Pipeline EIS
MANAGING RISK
DNV Reg. No.: 12LKQW5-2 Revision No.: 0 Date : 2010-05-18 Page 46
6.7 Equipment at the LVI - Generic Frequencies and Hole Size Distribution The LVI comprises the following equipment, specified in accordance with the categories included in the Hydrocarbon Releases Database [9];
Large valves (>11” diameter).
Small valves (<3” diameter).
Large flanges (>11” diameter).
Instruments.
The data for these items have been screened to eliminate entries where;
The hole was less than 1 mm diameter.
The release was from equipment that was at a pressure of less than 1 bar (‘zero’ pressure releases).
The hole size was unspecified (but a hole size was estimated by calculation based on the material released and the conditions at the time of release if this information was given).
The hole sizes are given in the database numerically up to 100mm diameter and then as ‘>100’ mm diameter. For the purposes of the QRA these need to be grouped and a single hole size determined to represent the group. Grouping is normally undertaken so that the average of the area of the upper and lower hole sizes is a diameter found in piping or equipment. The hole size grouping and the associated generic frequencies for the items of equipment that have been selected for the LVI are shown in Table 10.
There were no failures in the ‘>100mm’ group for large flanges or for large valves. It is normal for the largest hole size to be taken as the gasket thickness multiplied by the pipe circumference. The gasket thickness for the 16” pipeline will be 1.2mm (there are no flanges on the 20” pipeline) so this would give a 41mm equivalent diameter hole. This is in the range 31-100mm diameter, so the largest hole size considered for a large flange is 75mm. The absence of data in any particular group of data indicates that such a failure is either very rare or not credible. For very rare events a frequency may be derived by assuming a statistical distribution with a percentage confidence. Two statistical values based on a Poisson distribution with 50% confidence are thus included in Table 10.
For
insp
ectio
n pur
pose
s only
.
Conse
nt of
copy
right
owne
r req
uired
for a
ny ot
her u
se.
EPA Export 19-02-2014:23:33:59
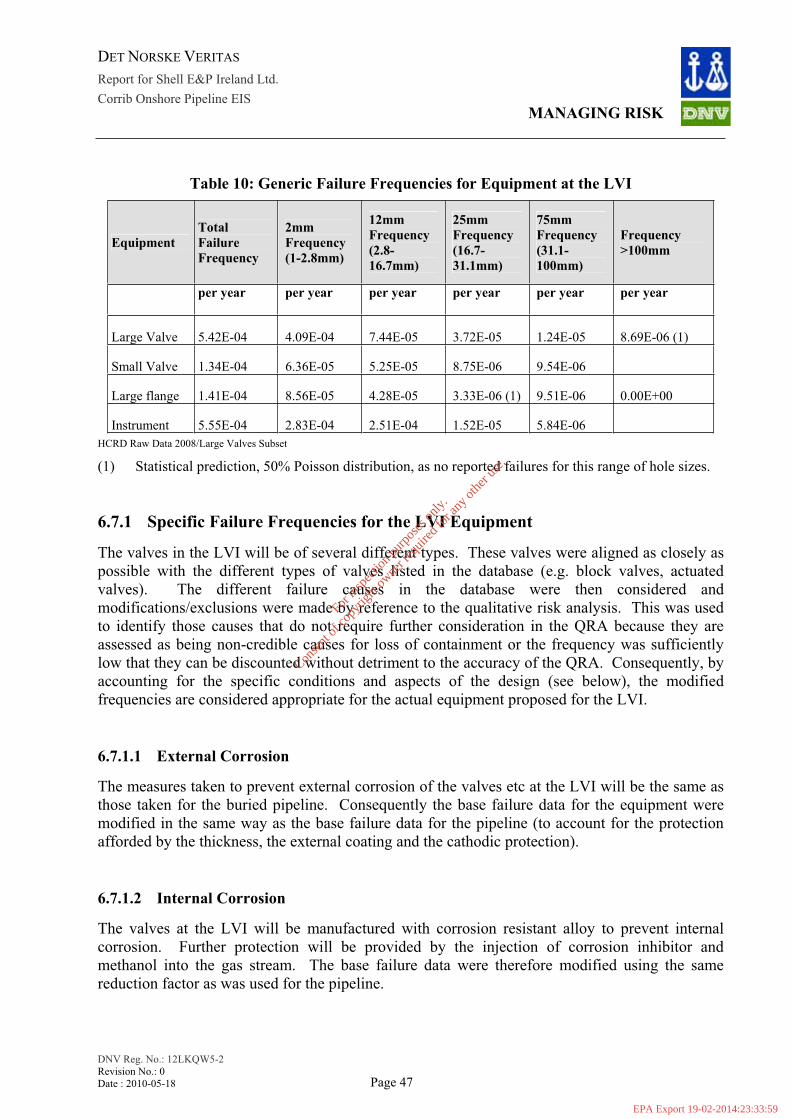
DET NORSKE VERITAS
Report for Shell E&P Ireland Ltd. Corrib Onshore Pipeline EIS
MANAGING RISK
DNV Reg. No.: 12LKQW5-2 Revision No.: 0 Date : 2010-05-18 Page 47
Table 10: Generic Failure Frequencies for Equipment at the LVI
EquipmentTotal Failure Frequency
2mmFrequency (1-2.8mm)
12mmFrequency (2.8-16.7mm)
25mmFrequency (16.7-31.1mm)
75mmFrequency (31.1-100mm)
Frequency >100mm
per year per year per year per year per year per year
Large Valve 5.42E-04 4.09E-04 7.44E-05 3.72E-05 1.24E-05 8.69E-06 (1)
Small Valve 1.34E-04 6.36E-05 5.25E-05 8.75E-06 9.54E-06
Large flange 1.41E-04 8.56E-05 4.28E-05 3.33E-06 (1) 9.51E-06 0.00E+00
Instrument 5.55E-04 2.83E-04 2.51E-04 1.52E-05 5.84E-06 HCRD Raw Data 2008/Large Valves Subset
(1) Statistical prediction, 50% Poisson distribution, as no reported failures for this range of hole sizes.
6.7.1 Specific Failure Frequencies for the LVI Equipment
The valves in the LVI will be of several different types. These valves were aligned as closely as possible with the different types of valves listed in the database (e.g. block valves, actuated valves). The different failure causes in the database were then considered and modifications/exclusions were made by reference to the qualitative risk analysis. This was used to identify those causes that do not require further consideration in the QRA because they are assessed as being non-credible causes for loss of containment or the frequency was sufficiently low that they can be discounted without detriment to the accuracy of the QRA. Consequently, by accounting for the specific conditions and aspects of the design (see below), the modified frequencies are considered appropriate for the actual equipment proposed for the LVI.
6.7.1.1 External Corrosion
The measures taken to prevent external corrosion of the valves etc at the LVI will be the same as those taken for the buried pipeline. Consequently the base failure data for the equipment were modified in the same way as the base failure data for the pipeline (to account for the protection afforded by the thickness, the external coating and the cathodic protection).
6.7.1.2 Internal Corrosion
The valves at the LVI will be manufactured with corrosion resistant alloy to prevent internal corrosion. Further protection will be provided by the injection of corrosion inhibitor and methanol into the gas stream. The base failure data were therefore modified using the same reduction factor as was used for the pipeline.
For
insp
ectio
n pur
pose
s only
.
Conse
nt of
copy
right
owne
r req
uired
for a
ny ot
her u
se.
EPA Export 19-02-2014:23:33:59
DET NORSKE VERITAS
Report for Shell E&P Ireland Ltd. Corrib Onshore Pipeline EIS
MANAGING RISK
DNV Reg. No.: 12LKQW5-2 Revision No.: 0 Date : 2010-05-18 Page 48
6.7.1.3 Erosion
As was the case for the pipeline, internal erosion is not considered to be a credible failure mode and hence failures due to this mode have been excluded (see Section 6.4.2.1 for the pipeline).
6.7.1.4 Manufacturing or Material Defect
The equipment will be manufactured to standard quality assurance procedures and processes by recognised and qualified suppliers. There will be frequent examinations, tests in accordance with an Inspection and Test Plan approved by SEPIL, independent inspections and both factory and site acceptance tests. As with the pipeline, however, there are no grounds for assuming that the equipment is more (or less) vulnerable to material or construction defects than any other similar equipment, so no modifications have been made to the generic data.
6.7.1.5 Mechanical Failure due Improper Maintenance or Wear
Invasive maintenance is not a routine activity and if it were to take place there is a maintenance management system to control and coordinate such operations which would also be verified, and work would only be carried out under a formal Permit to Work system and by personnel with appropriate training and competence. Further, as the valves are not duty valves, wear to cause loss of containment will not occur. Consequently loss of containment failures due to this cause are not considered credible.
6.7.1.6 Incorrect Fitting
Failures due to this cause were neglected as the initial hydrostatic test during pre commissioning is specifically carried out to prove the integrity of the system and this would indicate incorrect fitting. This failure cause has been neglected.
6.7.1.7 Mechanical Failure due to other causes
The database contains entries classed as ‘mechanical failure’, but no secondary cause is given. There are consequently no grounds to consider such failures as non credible and so no modifications have been made to the generic frequencies for this cause.
6.7.1.8 Opened in Error
These releases are caused by incorrect identification of equipment and they were excluded as this is inappropriate for the LVI as it is of simple design with few valves.
For
insp
ectio
n pur
pose
s only
.
Conse
nt of
copy
right
owne
r req
uired
for a
ny ot
her u
se.
EPA Export 19-02-2014:23:33:59
DET NORSKE VERITAS
Report for Shell E&P Ireland Ltd. Corrib Onshore Pipeline EIS
MANAGING RISK
DNV Reg. No.: 12LKQW5-2 Revision No.: 0 Date : 2010-05-18 Page 49
6.7.1.9 Other/unknown
As for 6.7.1.7 no information is given in the database so it was not possible to further screen these releases. No change was made to the generic frequencies.
6.7.1.10 Frequency Derivation
By separating the data into the different valve types and removing some failures because of non-credible failure modes, the population for each valve type was reduced. If this resulted in zero failures for a specific hole size or an extremely low population, rather than determining a statistical value the reduction factor was applied to the generic frequency for all valves in the relevant hole size range. Where the modifications resulted in a specific frequency which was higher than the generic frequency (because of the lower population), the higher value was retained.
As identified previously, the upper hole size in the data for large valves is 75mm and there are no recorded holes in the >100mm category for large valves. The experience with large valves tends to indicate that a failure to give a hole size >100mm is non-credible rather than very rare. This is considered especially to be the case for valves that are on concrete supports and buried below ground. Consequently the base case has used a zero failure frequency for an event to give a hole size >100mm diameter, but a sensitivity has been carried out using the statistically determined value. Failure of a large flange that leads to a hole in the range 16-31mm was considered to be a rare rather than a non-credible event (as there has been a larger failure), so the statistical value was used for this event. The failure frequencies determined by this process, the hole sizes and the number of each item of equipment at the LVI (base case) are shown in Table 11.
6.8 Overall LVI Failure Frequency The overall frequency for loss of containment of gas at the LVI is calculated by multiplying the frequencies in Table 11 by the number of equipment items in high pressure gas service, which gives an overall frequency of release of gas through a hole 16mm or above of 4.9E-04 per year.
For
insp
ectio
n pur
pose
s only
.
Conse
nt of
copy
right
owne
r req
uired
for a
ny ot
her u
se.
EPA Export 19-02-2014:23:33:59
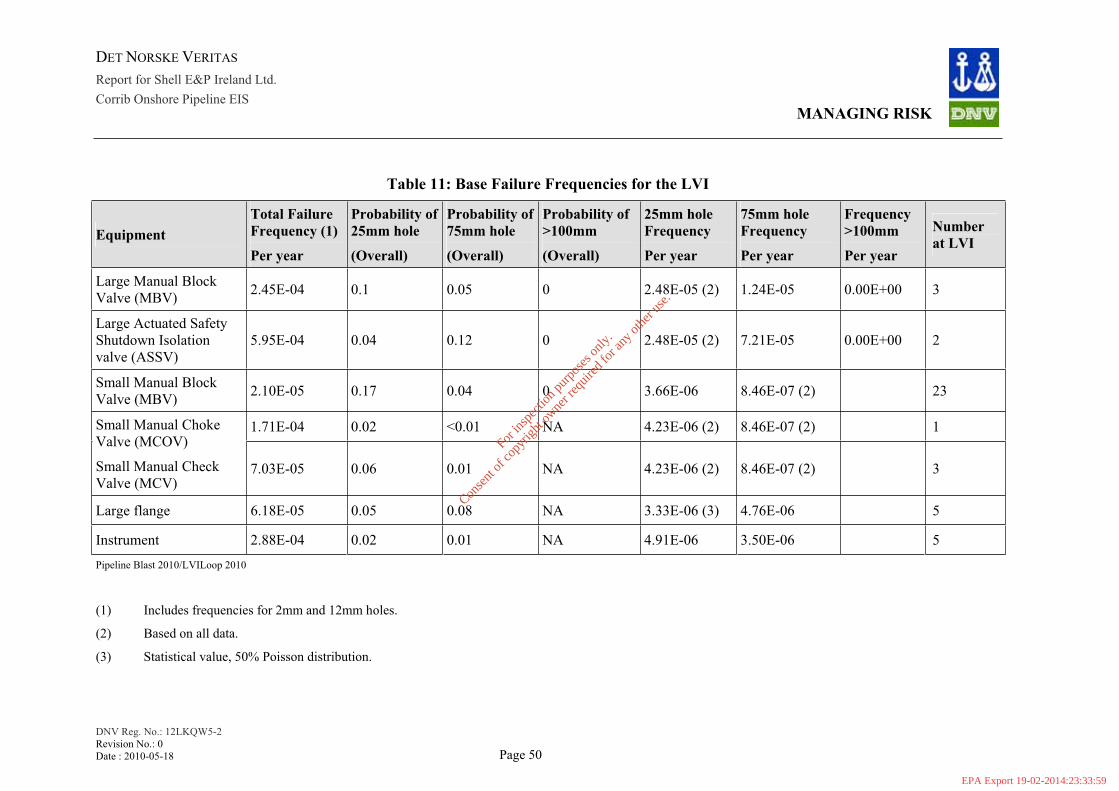
DET NORSKE VERITAS
Report for Shell E&P Ireland Ltd. Corrib Onshore Pipeline EIS
MANAGING RISK
DNV Reg. No.: 12LKQW5-2 Revision No.: 0 Date : 2010-05-18 Page 50
Table 11: Base Failure Frequencies for the LVI
EquipmentTotal Failure Frequency (1)
Per year
Probability of 25mm hole
(Overall)
Probability of 75mm hole
(Overall)
Probability of >100mm
(Overall)
25mm hole Frequency
Per year
75mm hole Frequency
Per year
Frequency>100mm
Per year
Number at LVI
Large Manual Block Valve (MBV) 2.45E-04 0.1 0.05 0 2.48E-05 (2) 1.24E-05 0.00E+00 3
Large Actuated Safety Shutdown Isolation valve (ASSV)
5.95E-04 0.04 0.12 0 2.48E-05 (2) 7.21E-05 0.00E+00 2
Small Manual Block Valve (MBV) 2.10E-05 0.17 0.04 0 3.66E-06 8.46E-07 (2) 23
1.71E-04 0.02 <0.01 NA 4.23E-06 (2) 8.46E-07 (2) 1 Small Manual Choke Valve (MCOV)
Small Manual Check Valve (MCV)
7.03E-05 0.06 0.01 NA 4.23E-06 (2) 8.46E-07 (2) 3
Large flange 6.18E-05 0.05 0.08 NA 3.33E-06 (3) 4.76E-06 5
Instrument 2.88E-04 0.02 0.01 NA 4.91E-06 3.50E-06 5 Pipeline Blast 2010/LVILoop 2010
(1) Includes frequencies for 2mm and 12mm holes.
(2) Based on all data.
(3) Statistical value, 50% Poisson distribution.
For
insp
ectio
n pur
pose
s only
.
Conse
nt of
copy
right
owne
r req
uired
for a
ny ot
her u
se.
EPA Export 19-02-2014:23:33:59
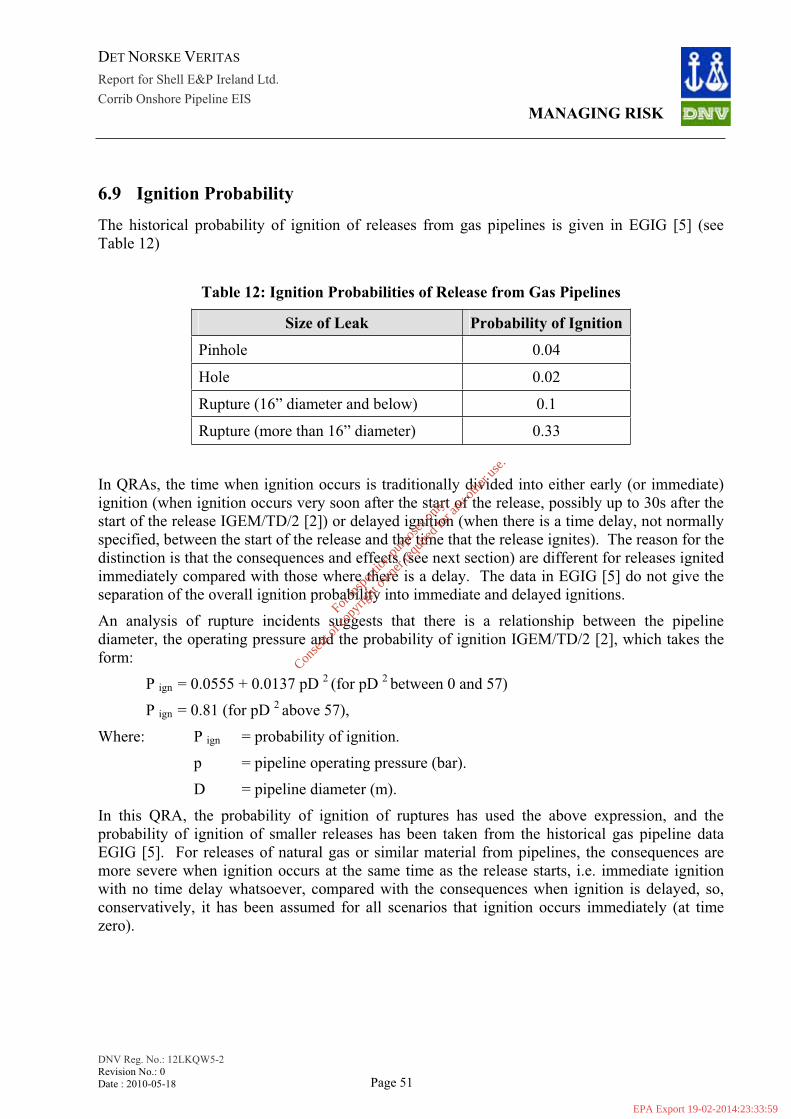
DET NORSKE VERITAS
Report for Shell E&P Ireland Ltd. Corrib Onshore Pipeline EIS
MANAGING RISK
DNV Reg. No.: 12LKQW5-2 Revision No.: 0 Date : 2010-05-18 Page 51
6.9 Ignition Probability The historical probability of ignition of releases from gas pipelines is given in EGIG [5] (see Table 12)
Table 12: Ignition Probabilities of Release from Gas Pipelines
Size of Leak Probability of Ignition
Pinhole 0.04
Hole 0.02
Rupture (16” diameter and below) 0.1
Rupture (more than 16” diameter) 0.33
In QRAs, the time when ignition occurs is traditionally divided into either early (or immediate) ignition (when ignition occurs very soon after the start of the release, possibly up to 30s after the start of the release IGEM/TD/2 [2]) or delayed ignition (when there is a time delay, not normally specified, between the start of the release and the time that the release ignites). The reason for the distinction is that the consequences and effects (see next section) are different for releases ignited immediately compared with those where there is a delay. The data in EGIG [5] do not give the separation of the overall ignition probability into immediate and delayed ignitions.
An analysis of rupture incidents suggests that there is a relationship between the pipeline diameter, the operating pressure and the probability of ignition IGEM/TD/2 [2], which takes the form:
P ign = 0.0555 + 0.0137 pD 2 (for pD 2 between 0 and 57)
P ign = 0.81 (for pD 2 above 57),
Where: P ign = probability of ignition.
p = pipeline operating pressure (bar).
D = pipeline diameter (m).
In this QRA, the probability of ignition of ruptures has used the above expression, and the probability of ignition of smaller releases has been taken from the historical gas pipeline data EGIG [5]. For releases of natural gas or similar material from pipelines, the consequences are more severe when ignition occurs at the same time as the release starts, i.e. immediate ignition with no time delay whatsoever, compared with the consequences when ignition is delayed, so, conservatively, it has been assumed for all scenarios that ignition occurs immediately (at time zero).
For
insp
ectio
n pur
pose
s only
.
Conse
nt of
copy
right
owne
r req
uired
for a
ny ot
her u
se.
EPA Export 19-02-2014:23:33:59

DET NORSKE VERITAS
Report for Shell E&P Ireland Ltd. Corrib Onshore Pipeline EIS
MANAGING RISK
DNV Reg. No.: 12LKQW5-2 Revision No.: 0 Date : 2010-05-18 Page 52
6.10 Presence Factor The presence factor is the probability that a person is in the vicinity of the pipeline and whether they may be indoors or outdoors at the time of failure.
For the purposes of predicting individual risk within this QRA the rule set has been adopted that people are residing at a dwelling 365 days per year, and the typical resident spends 10% of the time outdoors at the same location and the rest indoors. A sensitivity has been carried out using 36% of the time outdoors (60 hours per week) with the balance indoors.
For the determination of societal risk it is necessary to adopt a rule set that defines the number of occupants residing at each normally occupied dwelling as well as the probability of persons being indoors or outdoors. It is specified in I.S. 328-2003 [11] that, for population density purposes, there are four persons per dwelling, and this number of persons has been adopted within the rule-set. For the calculation of societal risk at Glengad it has been assumed that there is one person outdoors for 50 hours per week, two people outdoors together for 25 hours per week, three people outdoors together for 10 hours per week and four people outdoors together for 5 hours per week.
For
insp
ectio
n pur
pose
s only
.
Conse
nt of
copy
right
owne
r req
uired
for a
ny ot
her u
se.
EPA Export 19-02-2014:23:33:59

DET NORSKE VERITAS
Report for Shell E&P Ireland Ltd. Corrib Onshore Pipeline EIS
MANAGING RISK
DNV Reg. No.: 12LKQW5-2 Revision No.: 0 Date : 2010-05-18 Page 53
7 CONSEQUENCE ANALYSIS Should the measures taken to prevent a failure of the pipeline or equipment at the LVI fail, gas will be released. Consequence analysis determines the potential severity of these releases should ignition occur The approach applied and the steps taken during the analysis are shown in Figure 3. Each of these steps is now described.
7.1 Release Rate The release rate from a hole is assumed to be constant as the pressure in the pipeline is assumed to remain constant. The release rate of gas following a full bore rupture of a pipeline decays rapidly with time as the pressure in the pipeline falls. The release immediately after a rupture occurs may be described as ‘quasi instantaneous’; it is changing rapidly (decreasing).
7.1.1 Release Rate from Holes
The standard gas equation for sonic releases has been used to determine the release rate from holes (58mm diameter for holes in the pipeline, 75mm and 25mm diameter for holes in the equipment at the LVI). In this equation a discharge coefficient is used to account for turbulence and viscosity losses; conservatively a value of unity has been used. These assumptions give release rates of 48, 80 and 9 kg/s respectively.
7.1.2 Release Rate from Ruptures
When a gas pipeline ruptures, typically part of the pipeline length fails resulting in two open ends with a crater between the two open ends. Gas is released from both the upstream failure and the downstream failure (i.e. there is discharge from two open ends each with a cross sectional area equal to the cross sectional area of the pipeline).
There are several models available to predict the rate at which the release of gas decreases with time. For this analysis an in house model incorporated within DNV software Neptune [18] was used rather than a bespoke model as these cannot easily be integrated into the sequential steps of the overall consequence analysis. The predictions from the in house model were, however, aligned with release rates predicted by two bespoke models (Pipetech [20] and Pipesafe [21]) so that the release rate predictions over the first few minutes used in the QRA were comparable with the predictions from these codes. The predicted release rate with time for a rupture of the 20” pipeline is shown in Figure 11 for a pressure of 100 barg.
In the determination of the release rate, the pressure is of critical importance as the higher the pressure the greater is the release rate for the same size hole. The QRA has been conservatively based on all releases occurring at the MAOP.
For a release downstream of the LVI at the MAOP it is assumed that the LVI would remain open and as a result gas would be released from both open ends of pipe.
For the upstream pipeline to reach the MAOP, the LVI valves would be in the closed position. The release upstream of the LVI is modelled on the basis that the pipeline fails near to the LVI at
For
insp
ectio
n pur
pose
s only
.
Conse
nt of
copy
right
owne
r req
uired
for a
ny ot
her u
se.
EPA Export 19-02-2014:23:33:59

DET NORSKE VERITAS
Report for Shell E&P Ireland Ltd. Corrib Onshore Pipeline EIS
MANAGING RISK
DNV Reg. No.: 12LKQW5-2 Revision No.: 0 Date : 2010-05-18 Page 54
the MAOP of 150barg (resulting in a release of gas from the pipeline upstream of the failure, but an insignificant release from the pipeline downstream of the failure).
For
insp
ectio
n pur
pose
s only
.
Conse
nt of
copy
right
owne
r req
uired
for a
ny ot
her u
se.
EPA Export 19-02-2014:23:33:59
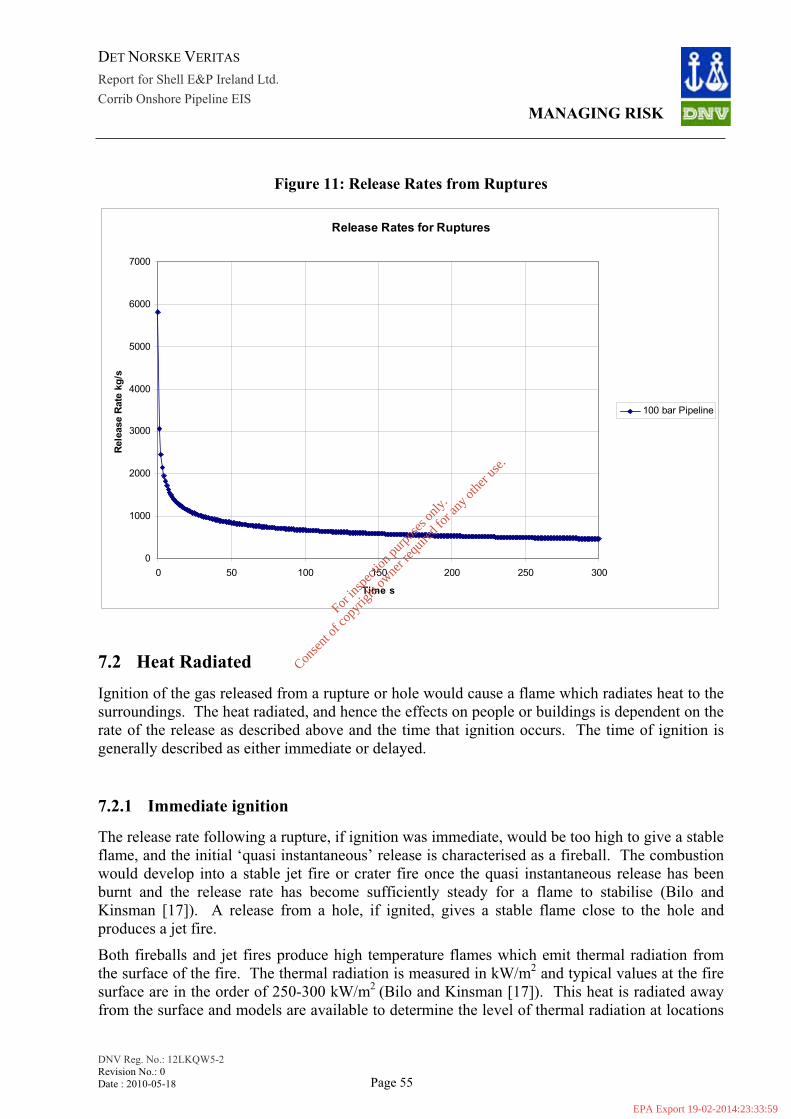
DET NORSKE VERITAS
Report for Shell E&P Ireland Ltd. Corrib Onshore Pipeline EIS
MANAGING RISK
DNV Reg. No.: 12LKQW5-2 Revision No.: 0 Date : 2010-05-18 Page 55
Figure 11: Release Rates from Ruptures
Release Rates for Ruptures
0
1000
2000
3000
4000
5000
6000
7000
0 50 100 150 200 250 300
Time s
Rele
ase
Rat
e kg
/s
100 bar Pipeline
7.2 Heat Radiated Ignition of the gas released from a rupture or hole would cause a flame which radiates heat to the surroundings. The heat radiated, and hence the effects on people or buildings is dependent on the rate of the release as described above and the time that ignition occurs. The time of ignition is generally described as either immediate or delayed.
7.2.1 Immediate ignition
The release rate following a rupture, if ignition was immediate, would be too high to give a stable flame, and the initial ‘quasi instantaneous’ release is characterised as a fireball. The combustion would develop into a stable jet fire or crater fire once the quasi instantaneous release has been burnt and the release rate has become sufficiently steady for a flame to stabilise (Bilo and Kinsman [17]). A release from a hole, if ignited, gives a stable flame close to the hole and produces a jet fire.
Both fireballs and jet fires produce high temperature flames which emit thermal radiation from the surface of the fire. The thermal radiation is measured in kW/m2 and typical values at the fire surface are in the order of 250-300 kW/m2 (Bilo and Kinsman [17]). This heat is radiated away from the surface and models are available to determine the level of thermal radiation at locations
For
insp
ectio
n pur
pose
s only
.
Conse
nt of
copy
right
owne
r req
uired
for a
ny ot
her u
se.
EPA Export 19-02-2014:23:33:59
DET NORSKE VERITAS
Report for Shell E&P Ireland Ltd. Corrib Onshore Pipeline EIS
MANAGING RISK
DNV Reg. No.: 12LKQW5-2 Revision No.: 0 Date : 2010-05-18 Page 56
away from the fire (i.e. at a receptor). Two models have been utilised in this analysis: one for the fireball and one for the jet (or crater) fire. Both models are of the solid flame type, i.e. they consider a uniform thermal flux over the fire surface which has a specified shape. The heat received by the receptor is then determined using the view factor between the shape and the receptor taking account of the heat absorbed by the atmosphere as the radiation travels between the surface of the flame and the receptor.
7.2.2 Delayed Ignition
If the release of gas from a rupture or hole in the pipeline is not ignited immediately, the gas would mix with air and the gas concentration in the gas/air cloud would be progressively reduced.The gas/air cloud would be potentially ignitable if the gas concentration is within the flammable range (approximately 5-15% of gas in air by volume). Dispersion of the release has been modelled using DNV’s PHAST model (v 6.5.3) [19]. Delayed ignition of the gas/air cloud would cause a flame to flash back to the release location and develop into a stable jet or crater fire. Under certain circumstances delayed ignition can give overpressure as well as a thermal radiation (see next section). The effect range associated with a delayed ignition is mainly dependent on the release rate at the time of the ignition. For a full bore rupture the release rate decays rapidly and so delayed ignition would give a smaller flame than immediate ignition, so the effect range would be less. For a hole, as the rate of release is constant, the effect range is the same for immediate and delayed ignition.
7.2.2.1 Overpressure Hazard
Overpressure hazards are not normally considered for natural gas releases from pipelines (PD 8010-3 [1]), however, for this analysis the possibility has been specifically considered. In order for a delayed ignition of a gas release in the open air to create overpressure, some or all of the flammable cloud has to be in a region of congestion. Congestion can take many forms, but includes process plant, forest and dense undergrowth. The influence of the congestion is to increase the flame front and thus the rate of burning (flame speed) and this generates the overpressure. The minimum distance between the pipeline and any form of congestion (in this case conifer forest) is 40 m. Dispersion predictions for a full bore rupture for two weather conditions (see Section 7.2.4) show that the flammable gas/air cloud is well above any trees, and so could not give rise to overpressure in the event of delayed ignition (see Attachment C). The maximum predicted dispersion distance to the lower flammable limit for a release from a hole which is directed horizontally is 98m (see Attachment C)*. Consequently overpressure could be generated within the conifer forest should there be a release at this location, with the release directed horizontally towards the congestion and the release is ignited. However, even if overpressure was generated by this mechanism, the degree of overpressure would not be sufficient to present a threat to any people in the vicinity over and above the effect of the jet fire that would follow.
* Note that the gas cloud shown in Attachment C updates the gas cloud predictions presented at the 2009 Oral Hearing
For
insp
ectio
n pur
pose
s only
.
Conse
nt of
copy
right
owne
r req
uired
for a
ny ot
her u
se.
EPA Export 19-02-2014:23:33:59
DET NORSKE VERITAS
Report for Shell E&P Ireland Ltd. Corrib Onshore Pipeline EIS
MANAGING RISK
DNV Reg. No.: 12LKQW5-2 Revision No.: 0 Date : 2010-05-18 Page 57
7.2.3 Model Validation
The fireball modelling is based on the model used by the UK HSE when assessing the risk from natural gas pipelines (Bilo and Kinsman [17]). The cumulative mass burnt in the fireball is given by the discharge model. The time required to release a particular mass is compared with the burn time of a fireball containing that mass. The mass of gas in the fireball is taken as that released from the pipeline when these two times are equal. The fireball is assumed to be spherical and to touch the ground for its duration (i.e. no fireball rise is incorporated). The thermal radiation absorbed by the water vapour and carbon dioxide in the atmosphere was calculated in DNV’s PHAST model [19] using the method of Wayne [23]. A research report (Kinsman and Lewis [24]) compared the predictions of the UK HSE model with historical information on pipeline accidents. This comparison indicated that the fireball model tends to over estimate the ‘burn’ area by up to a factor of seven. Use of this model is therefore considered to be conservative.
Once the fireball phase has been completed, the release is then modelled as a jet fire (with a declining release rate modelled in steps of 30s intervals). The basic jet fire model used was that in DNV’s PHAST software [19] based on work by Chamberlain [25]. The jet fire which follows the fireball is assumed to be directed vertically upwards out of the crater. The jet fire shape is the frustum of a cone and the location and orientation of the frustum are dependent on a number of factors including the rate of release and the wind speed. Recent work has compared the base PHAST predictions with predictions from the Pipesafe* [21], which has been internationally developed over a period of more than 10 years through basic research and experimental validation (and is approved by the Dutch government for Gasunie pipeline QRAs). Pipesafe has been validated for larger release rates than the Chamberlain model and the comparison indicated that the PHAST model overpredicts the thermal flux when compared with the Pipesafe model. A slight modification to the fraction of heat radiated in the DNV model enabled the predictions to align more closely with the Pipesafe model, and this adjustment was made for the modelling of jet fires that followed the fireball. The jet fire modelling for the releases from the holes are within the validation range for the base model, so no adjustment was made to the modelling of jet fires from holes. It was assumed that the direction of the jet from a hole was either as for the rupture (vertical with loss of some momentum - impeded), or vertically upwards with no loss of momentum (unimpeded), or horizontal. The thermal radiation from the jet fire absorbed by the atmosphere was calculated in the same way as that for the fireball.
7.2.4 Weather
The meteorological conditions, such as the wind speed and direction, have an influence on the potential consequences following a failure of the pipeline; the fireball is considered to be located at the release location and independent of the weather conditions, but the jet fire and unignited releases are affected by the wind. It is common practice to reduce the large number of possible wind speeds to one or two representative speeds (typically 2 m/s and 5 m/s, see Health and Safety Authority March 2010 [13]). The predictions for the level of thermal radiation received at a particular location generally increase with wind speed (as the flame angle with the horizontal reduces). For the jet fire analysis a single wind speed of 5 m/s was used to represent the different wind conditions. The local meteorological data indicate that the annual average wind speed is 3.8
* Pipesafe is a software package for risk calculations relating to underground natural gas transmission
For
insp
ectio
n pur
pose
s only
.
Conse
nt of
copy
right
owne
r req
uired
for a
ny ot
her u
se.
EPA Export 19-02-2014:23:33:59

DET NORSKE VERITAS
Report for Shell E&P Ireland Ltd. Corrib Onshore Pipeline EIS
MANAGING RISK
DNV Reg. No.: 12LKQW5-2 Revision No.: 0 Date : 2010-05-18 Page 58
m/s and the wind speed is less than 5 m/s for over 70% of the time. The use of 5 m/s is therefore considered to be conservative. A local wind rose was not used; consequences were assumed to be distributed uniformly (this is normal practice for pipeline analyses because of the changing direction of the pipeline). The relative humidity assumed for the predictions was 70%.
7.3 Physical Effects The heat received from the flame can affect both people and structures. The way that these effects have been predicted is described below.
7.3.1 Effects on People
The effect of thermal radiation on people from ignited releases from pipelines is typically determined by considering both the level of thermal radiation (in kW/m2) and the duration of the exposure. The measure adopted by the UK HSE is termed a thermal dose unit (tdu) which has units of (kW/m2) 4/3 s. The rule-sets governing the effects of various levels of thermal dose as adopted by the UK HSE on people are shown in Table 13.
Table 13: Rule sets for the Effect of Thermal Radiation Dose on People
Thermal Dose (tdu) Effect
3500 Assume 100% fatality (due to the spontaneous ignition of clothing)
1800 Assume 50% fatality
1000 Dangerous dose – Assume 1% fatality (typical population)
500 Dangerous dose for a vulnerable or sensitive population.
A dangerous dose of thermal radiation is defined by the UK HSE as a dose that:
Would cause severe distress to almost everyone;
Would cause a substantial proportion to require medical attention;
Would cause serious injury, which could require prolonged treatment, to some people;
Could be potentially fatal to any highly susceptible people.
When assessing the risks from ignited releases from pipelines, the UK HSE assumes that people are able to move away and seek shelter or be sufficiently far from the source of heat that their thermal dose received when moving away does not exceed the dangerous dose threshold (1000tdu). In rural areas people are assumed to move away from the incident at a speed of 2.5m/s and a distance of 75m is taken as the distance over which the thermal dose received is calculated.
For
insp
ectio
n pur
pose
s only
.
Conse
nt of
copy
right
owne
r req
uired
for a
ny ot
her u
se.
EPA Export 19-02-2014:23:33:59

DET NORSKE VERITAS
Report for Shell E&P Ireland Ltd. Corrib Onshore Pipeline EIS
MANAGING RISK
DNV Reg. No.: 12LKQW5-2 Revision No.: 0 Date : 2010-05-18 Page 59
In the QRA when modelling an immediately ignited full bore rupture it is further assumed that there is a 5 s reaction time between the ignition of the gas to form the fireball and a person starting to move.
The effect on people is calculated by determining the thermal dose received as a hypothetical person travels the 75m plus, in the case of an immediately ignited full bore rupture, the thermal dose received during the reaction time. The distance from the pipeline from which a person would just receive a thermal dose of 1000 tdu is termed by the UK HSE as the ‘escape distance’.
The ground in the vicinity of the Corrib pipeline is generally at a higher elevation than the pipeline. As the thermal flux received increases with increasing height (at the same plan distance from the pipeline), effect distances for the fireball and subsequent jet fire have been calculated assuming that persons and buildings are 38m higher than the pipeline.
It is recognised that not all people will be able to move away from the incident at 2.5 m/s. The UK HSE use a lower speed of moving away of 1 m/s for vulnerable people (e.g. nursery children or very old people) and a sensitivity has been carried out using this lower speed over the same distance (75m).
The size of the effect area for a jet fire from a hole is significantly less than that associated with a fireball. There is a rapid reduction in the predicted level of thermal radiation with distance for these jet fires, consequently people accumulate only low doses when moving away from the fire. It is therefore more appropriate to determine the effects by the level of thermal radiation (flux) rather than the thermal dose, the following rule-sets have been applied for people outdoors:
The extent of a thermal flux of 35 kW/m2 was used to define the area within which people would be fatally injured.
The extent of a thermal flux of 6 kW/m2 was used to determine the extent of the outer limit beyond which persons would be assumed to survive
7.3.2 Effects on Buildings
People inside a building at the time of an incident are assumed to be safe unless the building catches fire. Two rule sets (see Bilo and Kinsman [22]) are used by the UK HSE to determine whether a building exposed to thermal radiation catches fire. One rule set is for spontaneous ignition, the second is for piloted ignition*. There are limiting levels of thermal flux for these relationships; the thermal flux for spontaneous ignition must be above 25.6 kW/m2 and for piloted ignition the thermal flux must be above 14.7 kW/m2. The UK HSE assumes that if a building is exposed to more than 40 kW/m2, then all the occupants are fatally injured; this assumption has been used in this QRA.
The rule sets used to define the two ignition levels for buildings are based on experimental tests on American whitewood. As the dwellings in the vicinity of the pipeline are primarily stone and slate construction, which are incombustible, and there are relatively small areas of potentially combustible materials, these rule sets are considered to be conservative for the buildings in the vicinity of this pipeline.
* Spontaneous ignition takes place if the incident thermal flux is sufficiently high to ignite combustible material. Piloted ignitionoccurs if the combustible parts of the building are heated but do not ignite until induced to do so by a source of flame (e.g. aburning brand).
For
insp
ectio
n pur
pose
s only
.
Conse
nt of
copy
right
owne
r req
uired
for a
ny ot
her u
se.
EPA Export 19-02-2014:23:33:59
DET NORSKE VERITAS
Report for Shell E&P Ireland Ltd. Corrib Onshore Pipeline EIS
MANAGING RISK
DNV Reg. No.: 12LKQW5-2 Revision No.: 0 Date : 2010-05-18 Page 60
In the event that a building is ignited, however, people are assumed to leave the building and are then subject to the thermal radiation from the ignited release. The effects of this on the people escaping from the building are determined by applying the same rule sets as people who are outdoors at the time of the start of the incident (but without a reaction time).
For people indoors subject to thermal radiation from ignited releases from holes in the pipeline, the following rule-sets have been applied:
People in buildings exposed to a thermal flux above or equal to 40 kW/m2 were assumed not to survive
People in buildings exposed to a thermal flux below 25 kW/m2 were assumed to be safe or able to move away to safety.
7.4 Sensitivity Studies Various sensitivity studies have been identified in Sections 6 and 7 of this report, where it was considered appropriate to test an assumption (frequency assumptions in Section 6 and consequence assumptions in Section 7). These sensitivities are summarised in Table 14.
For
insp
ectio
n pur
pose
s only
.
Conse
nt of
copy
right
owne
r req
uired
for a
ny ot
her u
se.
EPA Export 19-02-2014:23:33:59
DET NORSKE VERITAS
Report for Shell E&P Ireland Ltd. Corrib Onshore Pipeline EIS
MANAGING RISK
DNV Reg. No.: 12LKQW5-2 Revision No.: 0 Date : 2010-05-18 Page 61
Table 14: Sensitivity Studies
Sensitivity Base Case Sensitivity Case
Ground movement leading to pipeline failure
Frequency of zero (considered not credible). Lower value from the lowest frequency range in PD 8010-3 [1]
Frequency of 9E-08 per km used. Upper value from the lowest frequency range in PD 8010-3 [1]
Third party intentional action leading to failure of the pipeline or equipment at the LVI
Frequency of zero (not normally considered in a QRA)
Frequency of 9.3E-06 per km per year for a hole in the pipeline. Value taken from the lowest category of third party intentional action in de Stefani [10]. No known data for equipment items so the frequency of holes at the LVI was increased by a factor of 10.
Failure of a valve at the LVI which gives a hole size with an equivalent diameter >100mm
Frequency of zero (not credible).
Statistically determined frequency of 8.7E-06 per year. The determination of a representative hole size followed the same principle as the other holes at the LVI to give 296mm and 366mm diameter for the 16” and 20” valves respectively.
Time that a person spends outdoors
10% (standard assumption which represents 17 hours per week)
36% (which represents 60 hours per week)
Speed of moving away 2.5 m/s (standard assumption for an able bodied person)
1 m/s (standard assumption for a vulnerable person, e.g. children, old people).
For
insp
ectio
n pur
pose
s only
.
Conse
nt of
copy
right
owne
r req
uired
for a
ny ot
her u
se.
EPA Export 19-02-2014:23:33:59

DET NORSKE VERITAS
Report for Shell E&P Ireland Ltd. Corrib Onshore Pipeline EIS
MANAGING RISK
DNV Reg. No.: 12LKQW5-2 Revision No.: 0 Date : 2010-05-18 Page 62
7.5 Risk Estimation Rule Sets It is apparent that the potential effects of an ignited release on people either indoors or outdoors decrease as the distance from the pipeline increases to the point where the effects are not hazardous. In order to determine the risk at distances from the pipeline the distances to the flux and dose levels used as rule-sets and as shown in Table 15 were calculated.
Table 15: Thermal Flux and Dose Rule -sets Used for Risk Calculations
Dose or Flux Rule-set Effects
40 kW/m2 Assume the building will ignite and all occupants are fatally injured
Spontaneous ignition of building
The building is assumed to ignite, and people initially inside the building will need to leave the building and seek shelter further away from the pipeline
Piloted ignition of building The building may ignite with ignition being induced, and in this case people will need to leave the building and seek shelter further away from the pipeline
Either 35 kW/m2 or 3500 tdu Assume 100% fatality for people outdoors
1800 tdu If a person receives this dose level whilst stationary for 5s then moving away from the pipeline for 75m at 2.5m/s in the open air, it is assumed there is a 50% chance of becoming fatally injured.
1000 tdu If a person receives this dose level whilst stationary for 5s then moving away from the pipeline for 75m at 2.5m/s in the open air, it is assumed there is a 1% chance of becoming fatally injured.
25 kW/m2 The assumed threshold of fatality for people indoors when exposed to a jet fire from a hole in the pipeline.
6 kW/m2 The assumed threshold of fatality for people outdoors when exposed to a jet fire from a hole in the pipeline..
For
insp
ectio
n pur
pose
s only
.
Conse
nt of
copy
right
owne
r req
uired
for a
ny ot
her u
se.
EPA Export 19-02-2014:23:34:00
DET NORSKE VERITAS
Report for Shell E&P Ireland Ltd. Corrib Onshore Pipeline EIS
MANAGING RISK
DNV Reg. No.: 12LKQW5-2 Revision No.: 0 Date : 2010-05-18 Page 63
8 PREDICTIONSThe pipeline comprises several different sections as identified in Section 3.2.
Predictions for the release rate and associated fireball mass from a pipeline rupture upstream of the LVI at a pressure of 150 barg and isolated from the pipeline downstream of the LVI were greater than those for a rupture of the pipeline (unisolated, with the LVI open) at 100 barg:
Upstream of the LVI at the MAOP of 150barg, with the LVI closed, the mass into the fireball was 21.1 te.
Downstream and upstream of the LVI at the downstream MAOP of 100barg, with the LVI open, the mass into the fireball was 28.2 te.
The latter case is the determinant for the risk to people both indoors and outdoors and has been used in this QRA.
The predictions from this QRA are presented as shown in Table 16.
Table 16: Rule Set Consequence, and Risk Predictions
Section Rule Set Consequence, and Risk Predictions
8.1 Rule set based consequence distances used in conjunction with frequency
8.2 Transects of individual risk of exceeding a dangerous dose at locations perpendicular to the pipeline and at the LVI
8.3 Individual risk of exceeding a dangerous dose presented as risk contours for the LVI
8.4 Predicted risks at houses closest to the pipeline
8.5 Societal risk
8.6 Risk zones
8.7 Sensitivity studies
For
insp
ectio
n pur
pose
s only
.
Conse
nt of
copy
right
owne
r req
uired
for a
ny ot
her u
se.
EPA Export 19-02-2014:23:34:00
DET NORSKE VERITAS
Report for Shell E&P Ireland Ltd. Corrib Onshore Pipeline EIS
MANAGING RISK
DNV Reg. No.: 12LKQW5-2 Revision No.: 0 Date : 2010-05-18 Page 64
8.1 Rule Set based Consequence Distances The maximum distances to the various rule set based consequence levels used with associated frequencies in the prediction of risk from immediately ignited releases from the pipeline are shown in Table 17.
Table 17: Consequence Distances
Dose or Flux Effect and Scenario Distance (m)
40 kW/m2 Building ignition from rupture, 100% fatality
193
Spontaneous ignition of buildings
Building ignition from rupture, people evacuate building
180
Piloted ignition of buildings Possible building ignition from rupture, people evacuate building
205
Either 35 kW/m2 or 3500 tdu 100% fatality for people outdoors (rupture or hole)
205
1800 tdu 50% fatality for people outdoors (rupture)
218
1000 tdu 1% fatality for people outdoors (rupture)
273
25 kW/m2 1% fatality for people indoors (hole)
100
6 kW/m2 1% fatality for people outdoors (hole)
136
In the unlikely event of failure of the umbilical there would be a release of methanol. This may ignite and burn as a pool fire. The predicted distance from the pool fire to a thermal flux of 6 kW/m2 is less than 35m, so cannot affect any existing dwellings. It has been demonstrated (Section 6.4.2.8) that ignited methanol could not cause escalation to the pipeline, so this scenario is not considered further.
For
insp
ectio
n pur
pose
s only
.
Conse
nt of
copy
right
owne
r req
uired
for a
ny ot
her u
se.
EPA Export 19-02-2014:23:34:00
DET NORSKE VERITAS
Report for Shell E&P Ireland Ltd. Corrib Onshore Pipeline EIS
MANAGING RISK
DNV Reg. No.: 12LKQW5-2 Revision No.: 0 Date : 2010-05-18 Page 65
8.2 Risk Transects The risk transects for the pipeline and the LVI (base case) are presented in Figure 12 in terms of the frequency of exceeding a dangerous dose for a person who spends 10% of the time outdoors and 90% of the time indoors.
Figure 12: Transects of Individual Risk of a Dangerous Dose or more (LVI and Pipeline)
Dangerous Dose Transects
1.00E-14
1.00E-13
1.00E-12
1.00E-11
1.00E-10
1.00E-09
1.00E-08
1.00E-07
1.00E-06
1.00E-05
1.00E-04
-300 -200 -100 0 100 200 300
Distance m
Freq
uenc
y of
Rec
eivi
ng a
Dan
gero
us D
ose
or m
ore
per y
ear
Pipeline
LVI (Bypass)
C:\Data\321766\New Pipeline\NewPipelinePreds\Base Out andgraphs
8.3 Risk Contours The risk of receiving a dangerous dose or more in contour format are shown in Figure 13. Contours are shown for risk levels of 1E-06 per year and 1E-07 per year. The predicted risk levels at the pipeline are below these levels.
For
insp
ectio
n pur
pose
s only
.
Conse
nt of
copy
right
owne
r req
uired
for a
ny ot
her u
se.
EPA Export 19-02-2014:23:34:00
Corrib Onshore Pipeline and LVI: Individual Risk Contour Plots
COR25MDR0470Mi2490R01
CORRIB ONSHORE PIPELINECORRIB ONSHORE PIPELINECORRIB ONSHORE PIPELINECORRIB ONSHORE PIPELINE
File Ref:May 2010Date:
LEGEND:
Proposed Route:
Trenched Section
House Location
LVI
1 x 10 -5
Individual risk level of receiving a dangerous dose as requested in An Bord Pleanála's letters of 29 November 2009 Section 3a and 2 February 2010
Individual Risk of Receiving a Dangerous Dose or more per year
Distance from Pipeline centreline
Distance from LVI
Cannot be plotted Cannot be plotted
1 x 10 -6
Cannot be plotted 63m
1 x 10 -7
Cannot be plotted 111m
Note 1) Highest risk predicted (base case) at centreline of the pipeline is 3 x 10 .
1)
th nd
-9
Note 2) Nearest dwelling to LVI, 280m.
1 x 10⁻⁶
1 x 10⁻⁷
63m
111m
2)
3)
Note 3) Plotted for Information.
Figure 13
For
insp
ectio
n pur
pose
s only
.
Conse
nt of
copy
right
owne
r req
uired
for a
ny ot
her u
se.
EPA Export 19-02-2014:23:34:00
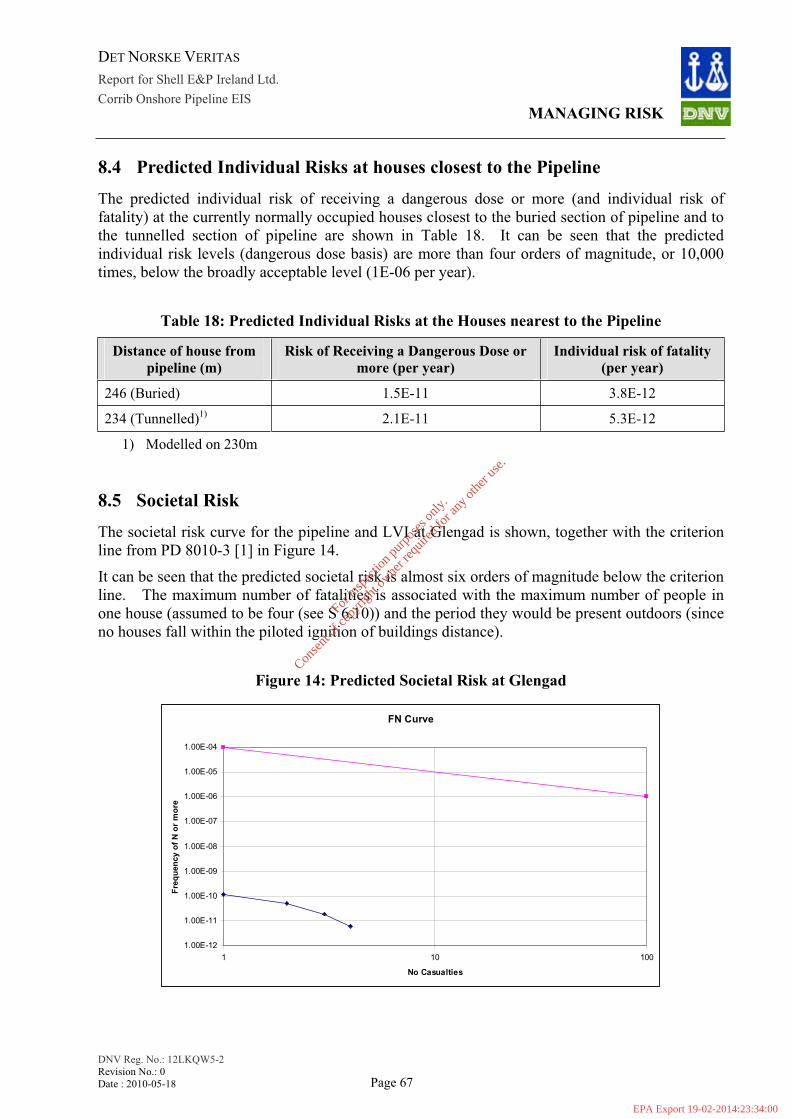
DET NORSKE VERITAS
Report for Shell E&P Ireland Ltd. Corrib Onshore Pipeline EIS
MANAGING RISK
DNV Reg. No.: 12LKQW5-2 Revision No.: 0 Date : 2010-05-18 Page 67
8.4 Predicted Individual Risks at houses closest to the PipelineThe predicted individual risk of receiving a dangerous dose or more (and individual risk of fatality) at the currently normally occupied houses closest to the buried section of pipeline and to the tunnelled section of pipeline are shown in Table 18. It can be seen that the predicted individual risk levels (dangerous dose basis) are more than four orders of magnitude, or 10,000 times, below the broadly acceptable level (1E-06 per year).
Table 18: Predicted Individual Risks at the Houses nearest to the Pipeline
Distance of house from pipeline (m)
Risk of Receiving a Dangerous Dose or more (per year)
Individual risk of fatality (per year)
246 (Buried) 1.5E-11 3.8E-12
234 (Tunnelled)1) 2.1E-11 5.3E-12
1) Modelled on 230m
8.5 Societal Risk The societal risk curve for the pipeline and LVI at Glengad is shown, together with the criterion line from PD 8010-3 [1] in Figure 14.
It can be seen that the predicted societal risk is almost six orders of magnitude below the criterion line. The maximum number of fatalities is associated with the maximum number of people in one house (assumed to be four (see S 6.10)) and the period they would be present outdoors (since no houses fall within the piloted ignition of buildings distance).
Figure 14: Predicted Societal Risk at Glengad
FN Curve
1.00E-12
1.00E-11
1.00E-10
1.00E-09
1.00E-08
1.00E-07
1.00E-06
1.00E-05
1.00E-04
1 10 100
No Casualties
Freq
uenc
y of
N o
r m
ore
For
insp
ectio
n pur
pose
s only
.
Conse
nt of
copy
right
owne
r req
uired
for a
ny ot
her u
se.
EPA Export 19-02-2014:23:34:00
DET NORSKE VERITAS
Report for Shell E&P Ireland Ltd. Corrib Onshore Pipeline EIS
MANAGING RISK
DNV Reg. No.: 12LKQW5-2 Revision No.: 0 Date : 2010-05-18 Page 68
8.6 Risk Zones The risk of receiving a dangerous dose or more at the pipeline is 3E-09 per year. This is two orders of magnitude (or 100 times) below the level specified by An Bord Pleanála in their letter dated 2nd November 2009 at item 3(a) of 0.3x10⁻⁶ per year for the outer zone.
The risk of receiving a dangerous dose or more at the LVI is 7E-06 per year. The distance to the outer boundary of the middle zone (1E-06 per year of receiving a dangerous dose or more) is 63m from the LVI and the distance to the outer boundary of the outer zone (3E-07 per year of receiving a dangerous dose or more) is 91m from the LVI.
The risk zones for the LVI are plotted in Figure 15, It is not possible to plot any risk zones for the pipeline.
For
insp
ectio
n pur
pose
s only
.
Conse
nt of
copy
right
owne
r req
uired
for a
ny ot
her u
se.
EPA Export 19-02-2014:23:34:00
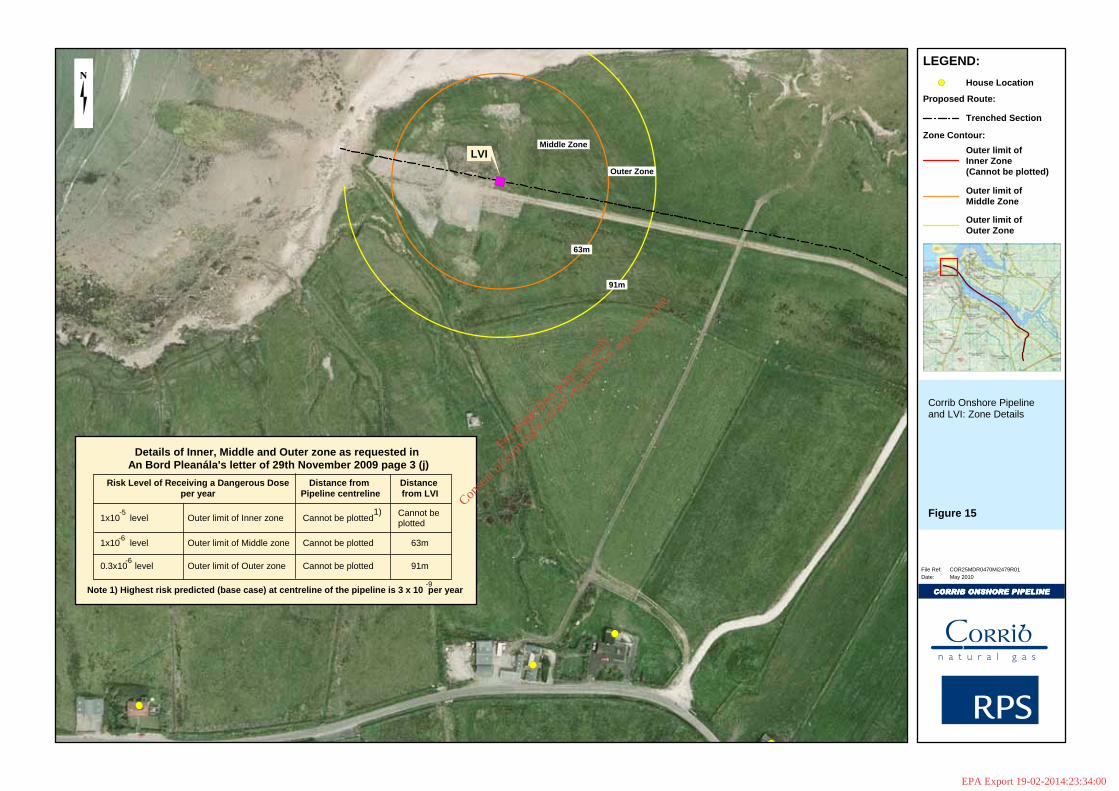
Outer Zone
Middle Zone
Corrib Onshore Pipeline and LVI: Zone Details
COR25MDR0470Mi2479R01
CORRIB ONSHORE PIPELINECORRIB ONSHORE PIPELINECORRIB ONSHORE PIPELINECORRIB ONSHORE PIPELINE
File Ref:May 2010Date:
LEGEND:
Proposed Route:
Trenched Section
Zone Contour:
Outer limit ofInner Zone (Cannot be plotted)
Outer limit of Middle Zone
Outer limit of Outer Zone
House Location
LVI
1x10 level-5
Details of Inner, Middle and Outer zone as requested in An Bord Pleanála's letter of 29th November 2009 page 3 (j)
Risk Level of Receiving a Dangerous Doseper year
Distance from Pipeline centreline
Distance from LVI
Outer limit of Inner zone Cannot be plotted Cannot be plotted
1x10 level-6
Outer limit of Middle zone Cannot be plotted 63m
0.3x10 level-6
Outer limit of Outer zone Cannot be plotted 91m
Note 1) Highest risk predicted (base case) at centreline of the pipeline is 3 x 10 per year
1)
-9
63m
91m
Figure 15
For
insp
ectio
n pur
pose
s only
.
Conse
nt of
copy
right
owne
r req
uired
for a
ny ot
her u
se.
EPA Export 19-02-2014:23:34:00
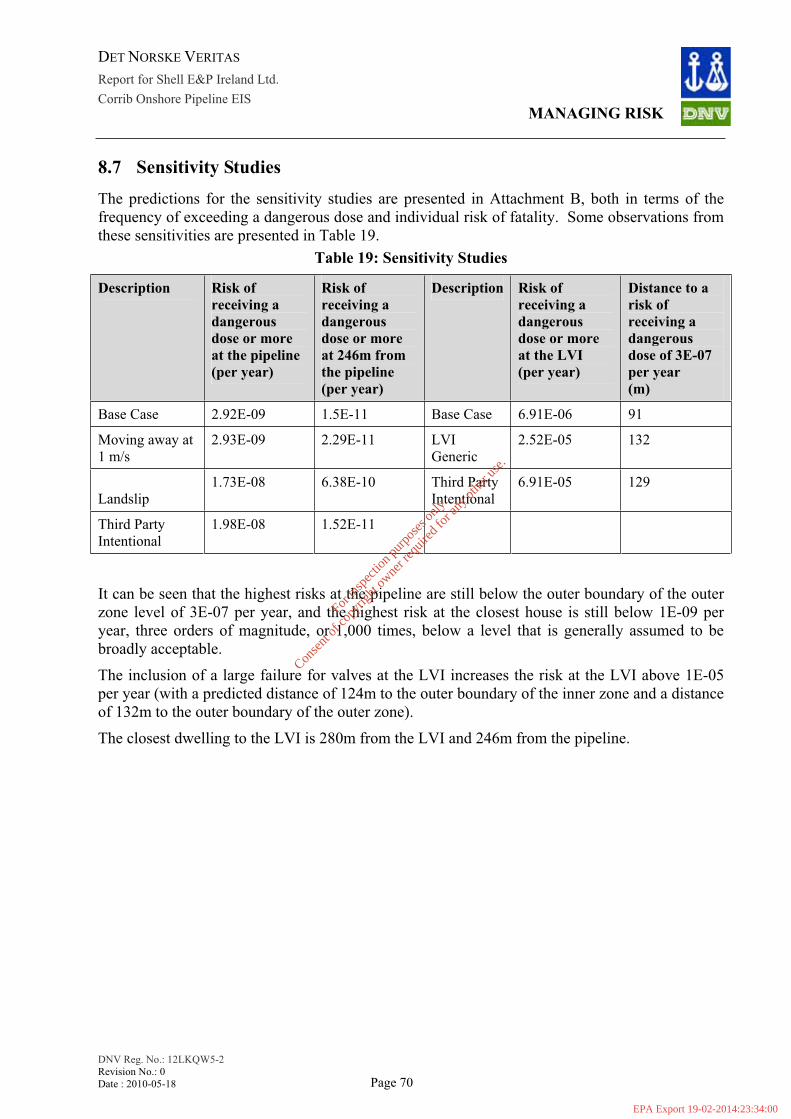
DET NORSKE VERITAS
Report for Shell E&P Ireland Ltd. Corrib Onshore Pipeline EIS
MANAGING RISK
DNV Reg. No.: 12LKQW5-2 Revision No.: 0 Date : 2010-05-18 Page 70
8.7 Sensitivity Studies The predictions for the sensitivity studies are presented in Attachment B, both in terms of the frequency of exceeding a dangerous dose and individual risk of fatality. Some observations from these sensitivities are presented in Table 19.
Table 19: Sensitivity Studies
Description Risk of receiving a dangerousdose or more at the pipeline (per year)
Risk of receiving a dangerousdose or more at 246m from the pipeline (per year)
Description Risk of receiving a dangerousdose or more at the LVI (per year)
Distance to a risk of receiving a dangerousdose of 3E-07 per year (m)
Base Case 2.92E-09 1.5E-11 Base Case 6.91E-06 91
Moving away at 1 m/s
2.93E-09 2.29E-11 LVI Generic
2.52E-05 132
Landslip1.73E-08 6.38E-10 Third Party
Intentional6.91E-05 129
Third Party Intentional
1.98E-08 1.52E-11
It can be seen that the highest risks at the pipeline are still below the outer boundary of the outer zone level of 3E-07 per year, and the highest risk at the closest house is still below 1E-09 per year, three orders of magnitude, or 1,000 times, below a level that is generally assumed to be broadly acceptable.
The inclusion of a large failure for valves at the LVI increases the risk at the LVI above 1E-05 per year (with a predicted distance of 124m to the outer boundary of the inner zone and a distance of 132m to the outer boundary of the outer zone).
The closest dwelling to the LVI is 280m from the LVI and 246m from the pipeline.
For
insp
ectio
n pur
pose
s only
.
Conse
nt of
copy
right
owne
r req
uired
for a
ny ot
her u
se.
EPA Export 19-02-2014:23:34:00
DET NORSKE VERITAS
Report for Shell E&P Ireland Ltd. Corrib Onshore Pipeline EIS
MANAGING RISK
DNV Reg. No.: 12LKQW5-2 Revision No.: 0 Date : 2010-05-18 Page 71
9 REFERENCES
/1/ BS PD 8010-3:2009. Code of Practice for pipelines - Part 3: Steel pipelines on land - Guide to the application of pipeline risk assessment to proposed developments in the vicinity of major accident hazard pipelines containing flammables - Supplement to PD 8010-1:2004
/2/ IGEM/TD/2 Communication 1737. Application of pipeline risk assessment to proposed developments in the vicinity of high pressure Natural Gas Pipelines. Institute of Gas Engineers and Managers, Dec 2008.
/3/ BS PD 8010-1:2004. Code of Practice for pipelines - Part 1: Steel pipelines on land.
/4/ IGEM/TD/1 Edition 5 Communication 1735. Steel pipelines and associated installations for high pressure gas transmission.
/5/ European Gas Pipeline Incident Data Group (EGIG) 7th Report 1970-2007.
/6/ CONCAWE (Conservation of Clean Air and Water in Europe) Report 7/08. Performance of European cross-country oil pipelines. August 2008.
/7/ PARLOC 2001: The Update of Loss of Containment Data for Offshore Pipelines, Prepared by Mott MacDonald, publ by Energy Institute, London
8 United Kingdom Onshore Pipelines Operators Association (UKOPA). Product Loss Incidents (1962-2008). Dec 2009
9 Data in Offshore Hydrocarbon Releases Statistics (HCRD Database). 1993-2008.
10 De Stefani V, Wattis Z and Acton M. A model to evaluate Pipeline Failure Frequencies based on Design and Operating Conditions. AIChE Spring meeting 2009.
11 I.S. 328: 2003. Code of Practice for Gas Transmission Pipelines and Pipeline Installations (Edition 3.1).
12 Petroleum (Exploration and Extraction) Safety Act 2010.
13 Health and Safety Authority. Policy and Approach of the Health and Safety Authority to COMAH Risk based Land use Planning. March 2010.
14 I.S. EN 14161:2004 Petroleum and Natural Gas Industries – Pipeline Transportation Systems (ISO 13623:2000 Modified)
15 Barker PH. Impact of Methanol pool fire and peat fire on Corrib Pipeline. Shell Global Solutions. GS.10.50880. April 2010.
16 Quantified Risk Analysis for the Corrib Onshore Pipeline DNV Report 32176602 Rev 3. Jan 2009.
17 Bilo M and Kinsman PR. MISHAP - HSE’s pipeline risk assessment methodology..
For
insp
ectio
n pur
pose
s only
.
Conse
nt of
copy
right
owne
r req
uired
for a
ny ot
her u
se.
EPA Export 19-02-2014:23:34:00
DET NORSKE VERITAS
Report for Shell E&P Ireland Ltd. Corrib Onshore Pipeline EIS
MANAGING RISK
DNV Reg. No.: 12LKQW5-2 Revision No.: 0 Date : 2010-05-18 Page 72
Pipes and Pipelines International. July-Aug 1997.
18 Neptune Technical Help System : TDGAS Model", Neptune 2.0, DNV Software.
19 DNV Phast. http://www.dnv.com/services/software/products/safeti/index.asp.
20 Oke, A., Mahgerefteh, H., Economou, I.G and Rykov, Y., 'A transient outflow model for pipeline puncture', Chemical Engineering Science, 58(20), 4591-4604 (2003).
21 Acton M.R., Baldwin P.J., Baldwin T.R., Jager E.E.R., Recent Developments in the Design and Application of the PIPESAFE Risk Assessment Package for Gas Transmission Pipelines, Proceedings of the International Pipeline Conference, IPCO2 27196, Calgary, Canada, 2002.
22 Bilo M and Kinsman PR. Thermal Radiation Criteria used in pipeline risk assessments. Pipes and Pipelines International. Nov-Dec 1997.
23 Wayne, F.D., An economical formula for calculating atmospheric infrared transmissivities, J. Loss Prev. Process Ind. 4, pp. 86-92 (1991)
24 Kinsman P and Lewis J. Report on a second study of pipeline accidents using the Health and Safety Executive’s risk assessment programs MISHAP and PIPERS. HSE Research Report RR036. 2002.
25 Chamberlain GA. Developments in methods for predicting thermal radiation in flares. Chem Eng Res and Des. 65. July 1987.
26 Health and Safety Executive. Reducing risk, protecting people. ISBN 0 7176 2151 0 (2001).
27 Haswell J and Lyons C. Failure frequency predictions due to 3rd party interference for Corrib pipeline. PIE/07/R0176. Feb 2008.
28 HSE. Offshore Hydrocarbon releases statistics and analysis 2002. Feb 2003.
29 Grishin et al., “Experimental Study of Peat Ignition and Combustion, Journal of Engineering Physics and Thermophysics, Vol. 79, No.3, 2006
30 British Geological Survey. Seismicity and earthquake hazard in the UK. . http://www.earthquakes.bgs.ac.uk/hazard/Hazard_UK.htm
For
insp
ectio
n pur
pose
s only
.
Conse
nt of
copy
right
owne
r req
uired
for a
ny ot
her u
se.
EPA Export 19-02-2014:23:34:00
DET NORSKE VERITAS
Report for Shell E&P Ireland Ltd. Corrib Onshore Pipeline EIS
MANAGING RISK
DNV Reg. No.: 12LKQW5-2 Revision No.: 0 Date : 2010-05-18 Page 1
ATTACHMENTA
FAILURE FREQUENCY PREDICTIONS DUE TO 3RD PARTY INTERFERENCE FOR CORRIB PIPELINE
REPORT BY HASWELL J AND LYONS C
(PIE REPORT)
- o0o -
For
insp
ectio
n pur
pose
s only
.
Conse
nt of
copy
right
owne
r req
uired
for a
ny ot
her u
se.
EPA Export 19-02-2014:23:34:00
PIE/07/R0176
ISSUE 1.0 – February 2008 FAILURE FREQUENCY
PREDICTIONS DUE TO 3RD
PARTY INTERFERENCE FOR THE CORRIB PIPELINE Page 1 of 37
CONFIDENTIAL
FAILURE FREQUENCY PREDICTIONS DUE TO 3rd PARTY INTERFERENCE
FOR CORRIB PIPELINE
Authors: J Haswell & C Lyons
CLIENT DNV
Contract Number -
Client Document Number
-
Pipeline Integrity Engineers Ltd 262A Chillingham Road HeatonNewcastle Upon Tyne NE6 5LQ
www.pieuk.co.uk
PIE/07/R0176Issue: v1.0 February 2008
For
insp
ectio
n pur
pose
s only
.
Conse
nt of
copy
right
owne
r req
uired
for a
ny ot
her u
se.
EPA Export 19-02-2014:23:34:00

PIE/07/R0176
ISSUE 1.0 – February 2008 FAILURE FREQUENCY
PREDICTIONS DUE TO 3RD
PARTY INTERFERENCE FOR THE CORRIB PIPELINE Page 2 of 37
CONFIDENTIAL
Amendment and Approval Record
1.0
Final including Client Comments 12/02/08
J V Haswell
RAMcConnell
G Senior
0.1
Draft for Client Comment 08.10.07
J V Haswell
RAMcConnell
G Senior
J V Haswell
0Draft Issue 02/10/07
C Lyons
Name Sign Name Sign Name Sign Issue Change
Author Reviewer Approver
Distribution List: February 08
Internal External
Authors P Crossthwaite DNV
G Senior
W P Jones
PIE Central File
For
insp
ectio
n pur
pose
s only
.
Conse
nt of
copy
right
owne
r req
uired
for a
ny ot
her u
se.
EPA Export 19-02-2014:23:34:00
PIE/07/R0176
ISSUE 1.0 – February 2008
FAILURE FREQUENCY PREDICTIONS DUE TO 3RD
PARTY INTERFERENCE FOR CORRIB PIPELINE Page 3 of 37
CONFIDENTIAL
Executive Summary In assessing the risks posed by hazardous pipelines, the damage mechanism which may result in failure which is most relevant is that due to 3rd party interference. A key objective of UKOPA (United Kingdom Pipeline Operators’ Association) is the development and agreement with all stakeholders of an accepted and consistent approach to pipeline risk assessment. To this end, UKOPA have drafted risk assessment code supplements to the UK pipeline codes IGE/TD/1 Edition 4 and PD 8010 Part 1. These code supplements, which are scheduled for final publication in 2008, include guidance on the prediction of failure frequencies due to 3rd party interference, which is of particular importance in assessing the residual risk levels of pipelines. To develop this guidance, UKOPA required a methodology for the prediction of pipeline failure frequencies due to dent and gouge damage.
A prediction methodology was developed for UKOPA by Pipeline Integrity Engineers Ltd (PIE). The methodology is a reconstruction of the dent-gouge failure model developed and prediction methodology using damage probability distributions for the prediction of pipeline leak and rupture failure frequencies, which was originally developed and published by British Gas. The methodology developed by PIE uses damage probability distributions constructed using the current UKOPA fault data.
The reconstructed model, entitled the PIE model in this report, has been used to carry out investigative studies for UKOPA Predictions obtained using this model compare well with predictions from the gas industry failure frequency prediction methodology, FFREQ, and operational failure data from the UKOPA fault database. The results have been reviewed in detail by UKOPA, and the model is accepted by UKOPA as a method for the predicting the leak and rupture frequency of pipelines due to 3rd party interference for use in quantified risk assessments carried out in accordance with the UK pipeline codes PD 8010 Part 1 and IGE/TD/1 Edition 4. The PIE model has been used to predict failure frequencies for the Corrib pipeline at the request of DNV. The failure model and the predictive methodology are described, and the results obtained for the Corrib pipeline are presented in this report.
Conclusions
A methodology for the prediction of pipeline failure frequencies due to 3rd
party interference developed by, and based on work originally carried out for and published by British Gas has been used to predict failure frequencies for the Corrib pipeline.
The predicted failure frequencies for the specified operating pressures are:-
For
insp
ectio
n pur
pose
s only
.
Conse
nt of
copy
right
owne
r req
uired
for a
ny ot
her u
se.
EPA Export 19-02-2014:23:34:00
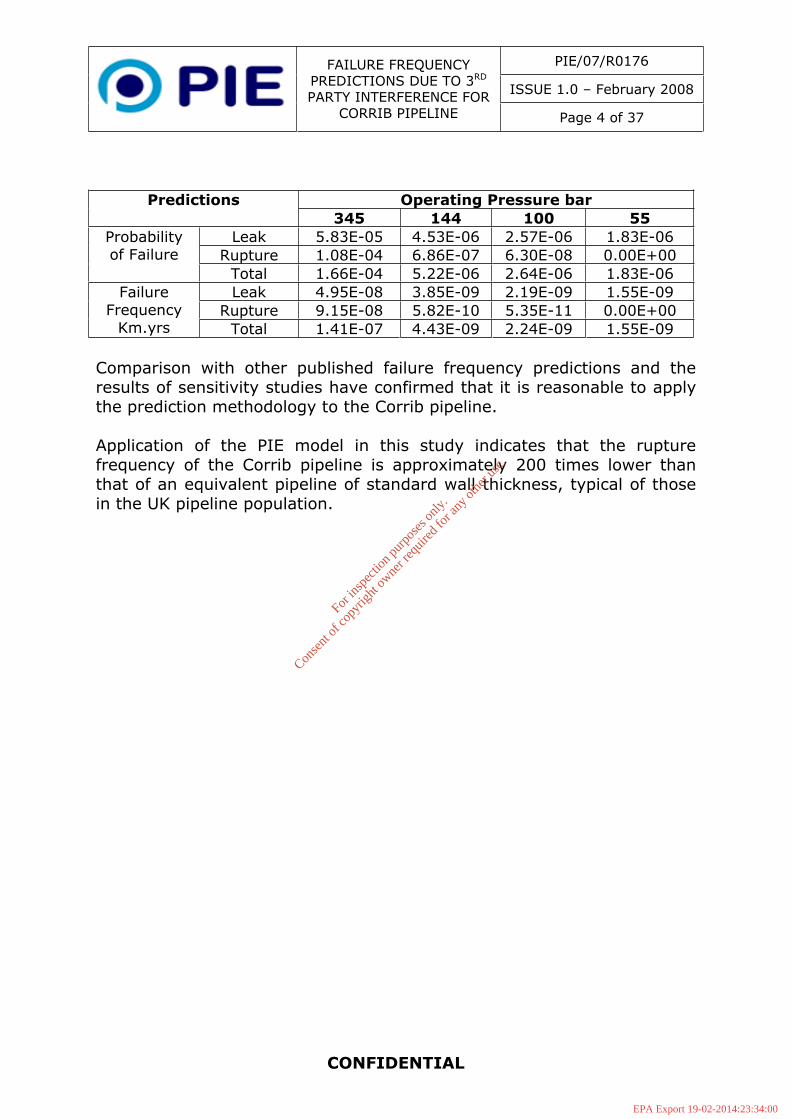
PIE/07/R0176
ISSUE 1.0 – February 2008
FAILURE FREQUENCY PREDICTIONS DUE TO 3RD
PARTY INTERFERENCE FOR CORRIB PIPELINE Page 4 of 37
CONFIDENTIAL
Operating Pressure barPredictions345 144 100 55
Leak 5.83E-05 4.53E-06 2.57E-06 1.83E-06 Rupture 1.08E-04 6.86E-07 6.30E-08 0.00E+00
Probability of Failure
Total 1.66E-04 5.22E-06 2.64E-06 1.83E-06 Leak 4.95E-08 3.85E-09 2.19E-09 1.55E-09
Rupture 9.15E-08 5.82E-10 5.35E-11 0.00E+00 Failure
Frequency Km.yrs Total 1.41E-07 4.43E-09 2.24E-09 1.55E-09
Comparison with other published failure frequency predictions and the results of sensitivity studies have confirmed that it is reasonable to apply the prediction methodology to the Corrib pipeline.
Application of the PIE model in this study indicates that the rupture frequency of the Corrib pipeline is approximately 200 times lower than that of an equivalent pipeline of standard wall thickness, typical of those in the UK pipeline population.
For
insp
ectio
n pur
pose
s only
.
Conse
nt of
copy
right
owne
r req
uired
for a
ny ot
her u
se.
EPA Export 19-02-2014:23:34:00
PIE/07/R0176
ISSUE 1.0 – February 2008
FAILURE FREQUENCY PREDICTIONS DUE TO 3RD
PARTY INTERFERENCE FOR CORRIB PIPELINE Page 5 of 37
CONFIDENTIAL
Contents
Executive Summary .......................................................................3
1.0 Introduction ..........................................................................7
1.1 Scope............................................................................. 71.2 Report Structure .............................................................. 81.3 Glossary ......................................................................... 8
2.0 Methodology for prediction of failure of pipelines due to 3rd
party interference..........................................................................8
2.1 Overview ........................................................................ 82.2 Failure Models for Damaged Pipelines.................................. 92.3 Probability of Failure ....................................................... 102.4 Failure Frequency........................................................... 10
3.0 Development of the PIE Model for the prediction of failure frequencies due to 3rd party interference ....................................11
3.1 Background................................................................... 113.2 The PIE Model................................................................ 113.3 Comparison of the PIE model and FFREQ ........................... 133.4 Prediction of pipeline failure frequencies – UKOPA recommendations ................................................................. 15
4.0 Prediction of Failure Frequencies due to 3rd party interference for the Corrib Pipeline .............................................16
4.1 Pipeline Parameters ........................................................ 164.2 Probability of failure and failure frequency predictions ......... 16
5.0 Discussion ...........................................................................17
5.1 Factors affecting the failure of gas pipelines ....................... 175.2 Comparison of current with previous predictions................. 195.3 Sensitivity studies .......................................................... 205.4 Application of the PIE model to the Corrib Pipeline. ............. 23
6.0 Conclusions .........................................................................23
7.0 References ..........................................................................24
Appendix 1: Glossary...................................................................26
For
insp
ectio
n pur
pose
s only
.
Conse
nt of
copy
right
owne
r req
uired
for a
ny ot
her u
se.
EPA Export 19-02-2014:23:34:00
PIE/07/R0176
ISSUE 1.0 – February 2008
FAILURE FREQUENCY PREDICTIONS DUE TO 3RD
PARTY INTERFERENCE FOR CORRIB PIPELINE Page 6 of 37
CONFIDENTIAL
Appendix 2: Pipeline Failure Model and Methodology for Prediction of Probability of Failure due to 3rd Party Interference .................28
Appendix 3: Flow Diagram for Failure Frequency Prediction Methodology using PIE Model......................................................35
Appendix 4: Summary of 3rd Party Interference Failure Frequency Models Applied to Corrib Pipeline ................................................37
For
insp
ectio
n pur
pose
s only
.
Conse
nt of
copy
right
owne
r req
uired
for a
ny ot
her u
se.
EPA Export 19-02-2014:23:34:00
PIE/07/R0176
ISSUE 1.0 – February 2008
FAILURE FREQUENCY PREDICTIONS DUE TO 3RD
PARTY INTERFERENCE FOR CORRIB PIPELINE Page 7 of 37
CONFIDENTIAL
1.0 Introduction In assessing the risks posed by hazardous pipelines, the damage mechanism which may result in failure which is most relevant is that due to 3rd party interference. A key objective of UKOPA (United Kingdom Pipeline Operators’ Association) is the development and agreement with all stakeholders of an accepted and consistent approach to pipeline risk assessment. To this end, UKOPA have drafted risk assessment code supplements to the UK pipeline codes IGE/TD/1 Ed 4 and PD 8010 Part 1. These code supplements, which are scheduled for final publication in 2008, include guidance on the prediction of failure frequencies due to 3rd party interference, which is of particular importance in assessing the residual risk levels of pipelines. To develop this guidance, UKOPA required a methodology for the prediction of pipeline failure frequencies due to dent and gouge damage.
A prediction methodology was developed for UKOPA by Pipeline Integrity Engineers Ltd (PIE). Studies carried out for UKOPA included assessment of pipeline failure models [1,2,3,4], reconstruction of the methodology for the prediction of pipeline leak and rupture failure frequencies originally developed and published by British Gas [1,5] and application of damage probability distributions developed using the current UKOPA fault data [6].The methodology is a reconstruction of the dent-gouge failure model and prediction methodology using damage probability distributions for the prediction of pipeline leak and rupture failure frequencies, which was originally developed and published by British Gas. The methodology developed by PIE uses damage probability distributions constructed using the current UKOPA fault data [6].
The reconstructed model, entitled the PIE model in this report, has been used to carry out investigative studies for UKOPA, and is an accepted method for the predicting the leak and rupture frequency of pipelines due to 3rd party interference for use in quantified risk assessments carried out in accordance with the UK pipeline codes PD 8010 Part 1 [7] and IGE/TD/1 Edition 4 [8]. Predictions obtained using this model compare well with predictions from the gas industry failure frequency prediction methodology FFREQ [9] and operational failure data from the UKOPA fault database. The PIE model has been used to predict failure frequencies for the Corrib pipeline on behalf of DNV. The failure model and the predictive methodology are described, and the results obtained for the Corrib pipeline are presented in this report.
1.1 Scope
This report describes the fracture mechanics model used to predict the failure of pipelines containing damage, the methodology used to predict failure frequency using damage probability distributions based on fault data from the current UKOPA Pipeline Fault Database, and presents failure frequency predictions obtained using the model and methodology for the Corrib pipeline.
For
insp
ectio
n pur
pose
s only
.
Conse
nt of
copy
right
owne
r req
uired
for a
ny ot
her u
se.
EPA Export 19-02-2014:23:34:00
PIE/07/R0176
ISSUE 1.0 – February 2008
FAILURE FREQUENCY PREDICTIONS DUE TO 3RD
PARTY INTERFERENCE FOR CORRIB PIPELINE Page 8 of 37
CONFIDENTIAL
1.2 Report Structure
The report is structured as follows:
Section 2: Provides a general overview of the methodology for predicting the probability and frequency of failure of a pipeline subject to 3rd party interference.
Section 3: Describes the PIE model for the prediction of failure frequencies due to 3rd party interference.
Section 4: Presents failure frequency predictions for the Corrib pipeline.
Section 5: Discussion of results.
Section 6: Presents the conclusions drawn.
Appendix 1 Provides a glossary of terms.
Appendix 2 Includes full details of the PIE dent-gouge failure model.
Appendix 3 Includes a flow diagram for the PIE predictive procedure.
Appendix 4 Gives a summary of 3rd party failure frequency models applied to the Corrib pipeline.
1.3 Glossary The report refers to a number of organisations and models by acronyms; these are defined and explained in Appendix 1.
2.0 Methodology for prediction of failure of pipelines due to 3rd party interference
2.1 Overview
Pipeline damage due to 3rd party interference occurs in the form of gouges, dents or combinations of these. This type of damage is random in nature, and as operational failure data are sparse, recognised engineering practice requires that a predictive model is used to calculate leak and rupture failure frequencies for specific pipelines. The approach taken to develop a methodology for the prediction of the probability and frequency of pipeline failure due to 3rd party interference involves three key requirements:
For
insp
ectio
n pur
pose
s only
.
Conse
nt of
copy
right
owne
r req
uired
for a
ny ot
her u
se.
EPA Export 19-02-2014:23:34:00
PIE/07/R0176
ISSUE 1.0 – February 2008
FAILURE FREQUENCY PREDICTIONS DUE TO 3RD
PARTY INTERFERENCE FOR CORRIB PIPELINE Page 9 of 37
CONFIDENTIAL
i) Modelling of the failure state of a specific pipeline subject to dent-gouge damage, using a fracture mechanics failure model (or limit state). Such models are used to calculate whether a given combination of pipeline conditions together with specific dent and gouge damage exceed the failure condition (see Section 2.2).
ii) Prediction of the likelihood of occurrence of the dent-gouge damage which results in failure for specified pipeline conditions. The likelihood of occurrence of specific dent-gouge damage is obtained from the statistical distributions of measured gouge length, gouge depth and dent depth damage in operational pipelines (see Section 2.3).
iii) Modelling of the incidence rate of 3rd party damage. The rate at which 3rd
party damage occurs is obtained from the number of damage incidents recorded over the operational exposure of a pipeline population (see Section 2.4).
2.2 Failure Models for Damaged Pipelines
The original work to develop a failure model for damaged pipelines was carried out for British Gas at the Engineering Research Station, Newcastle, UK. The model is a general, two parameter fracture mechanics model, which assumes steel structures containing defects can fail due to a combination of plastic collapse and brittle fracture. The model, which is used to calculate the failure conditions of a pipeline containing specified dent and gouge damage and is referred to as the original dent-gouge model in this report, is semi-empirical, in that the basic formulation is theoretical, but the actual formulation is fitted in accordance with empirical failure data.
The empirical data comprises burst test results for pipe rings and vessels containing gouge and dent damage. This recorded failure data was used to calibrate the model. As the model is semi-empirical, its application is constrained by the limits of the data used in its calibration. Additionally, the model is intrinsically conservative, in that it is 2–dimensional, and represents the through-wall failure of an infinitely long part wall defect. This model and its application have been critically reviewed by experts and are well understood [1,2]. The model is well documented and published, and is relatively straightforward to reconstruct.
The original dent-gouge model was updated by Advantica for UKOPA. The updated model, referred to as the UKOPA mechanical damage limit state model in this report, includes incorporation of a number of additional parameters (eg. micro-crack, plasticity and residual stress due to the dent etc.), and a revision of the statistical calibration to the empirical data used to develop the original dent-gouge model to take account of the additional parameters. This model represents an update to the original dent-gouge model, but is essentially a similar, semi-empirical model.
Failure calculations carried out using the fracture mechanics models described above may be performed as simple, deterministic calculations, in which single
For
insp
ectio
n pur
pose
s only
.
Conse
nt of
copy
right
owne
r req
uired
for a
ny ot
her u
se.
EPA Export 19-02-2014:23:34:00
PIE/07/R0176
ISSUE 1.0 – February 2008
FAILURE FREQUENCY PREDICTIONS DUE TO 3RD
PARTY INTERFERENCE FOR CORRIB PIPELINE Page 10 of 37
CONFIDENTIAL
mean, upper or lower bound parameter values are assumed, or as a sophisticated structural reliability analysis, which takes account of the probabilistic variation of all parameters.
2.3 Probability of Failure
In order to determine the probability of failure due to 3rd party interference, the likelihood of dent and gouge damage which may occur and the probability that this will cause failure of the pipe is required.
In the original British Gas (dent-gouge) methodology, the likelihood of damage is modelled as damage size probability distributions. This approach assumes that damage of a given size can occur in any pipeline, ie the damage size is not related to the resistance of the pipe in which it occurs. This is conservative for pipes with a high resistance to damage (ie large diameter, thick wall).
One alternative and potentially more realistic approach is to convert the damage data into a force probability distribution, ie the force required to produce specific dent and gouge damage is calculated from the pipe parameters and recorded damage data. The force probability distribution is then applied in the failure calculation, so the dent and gouge damage caused to a pipe of specified geometry and material is predicted. This approach takes account of the pipe resistance, and is therefore less conservative for high resistance pipes, such as the Corrib pipeline.
A further approach would be to model the force applied by specific excavation machines, and calculate the dent and gouge damage which this causes. Unfortunately, however, there is no published data available in UK relating machine size/type to applied force to support such an approach.
With respect to the Corrib pipeline, application of the original British Gas methodology using existing dent and gouge damage data is conservative, as in applying the damage to the pipe, this model does not take account of the increased resistance of the thick wall of this pipeline. Less conservative predictions would be obtained if the damage size distribution was represented by a force distribution, but this has not been done in this analysis.
2.4 Failure Frequency
In order to calculate the failure frequency, the probability of failure is multiplied by the incident rate for 3rd party interference for a given population of pipelines:-
Failure Frequency = Probability of Failure x number of incidents of 3rd party interference per km yr
The incident rate applied is derived from the UKOPA Pipeline Damage Database (i.e.8.49E-04 per year, see Appendices 2 and 3).
For
insp
ectio
n pur
pose
s only
.
Conse
nt of
copy
right
owne
r req
uired
for a
ny ot
her u
se.
EPA Export 19-02-2014:23:34:00

PIE/07/R0176
ISSUE 1.0 – February 2008
FAILURE FREQUENCY PREDICTIONS DUE TO 3RD
PARTY INTERFERENCE FOR CORRIB PIPELINE Page 11 of 37
CONFIDENTIAL
3.0 Development of the PIE Model for the prediction of failure frequencies due to 3rd
party interference
3.1 Background
In order to derive realistic failure frequencies for UK major accident hazard pipelines due to 3rd party interference, UKOPA has initiated work to assess available failure models, and the predicted failure frequencies obtained using these models. As stated in 2.2 above, Advantica updated the original British Gas dent-gouge failure model to the UKOPA limit state model. A comparison was carried out of predicted pipeline failure frequencies provided by Transco (now National Grid) using (1) the original dent-gouge model implemented in the failure frequency prediction software FFREQ, (2) the UKOPA limit state model incorporated in Advantica’s pipeline structural reliability analysis software, and (3) the PIPIN software developed and used by the HSE. It was observed that the predictions obtained by Advantica using the updated failure model and structural reliability analysis were up to an order of magnitude higher than the predictions obtained by Transco using FFREQ and HSE using PIPIN.
In order to investigate this difference, PIE undertook a series of studies looking into predictions obtained using different models. As part of this work, the original failure frequency prediction methodology published by British Gas and later incorporated into the gas industry risk assessment software PIPESAFE [7] as FFREQ was reconstructed. The reconstructed methodology, referred to as the PIE Model in this report, uses 3rd party damage (gouge depth, gouge length and dent depth) data obtained from the UKOPA Pipeline Fault Database, filtered and interpreted in the same way as in the original British Gas work.
3.2 The PIE Model
The PIE model uses the original dent-gouge failure model to predict failure caused by dent and gouge damage. The probabilities of the size of damage which may occur, and the incidence or hit rate of 3rd party damage, are obtained from the UKOPA Pipeline Fault Database. The model is illustrated in Figure 1.
For
insp
ectio
n pur
pose
s only
.
Conse
nt of
copy
right
owne
r req
uired
for a
ny ot
her u
se.
EPA Export 19-02-2014:23:34:00
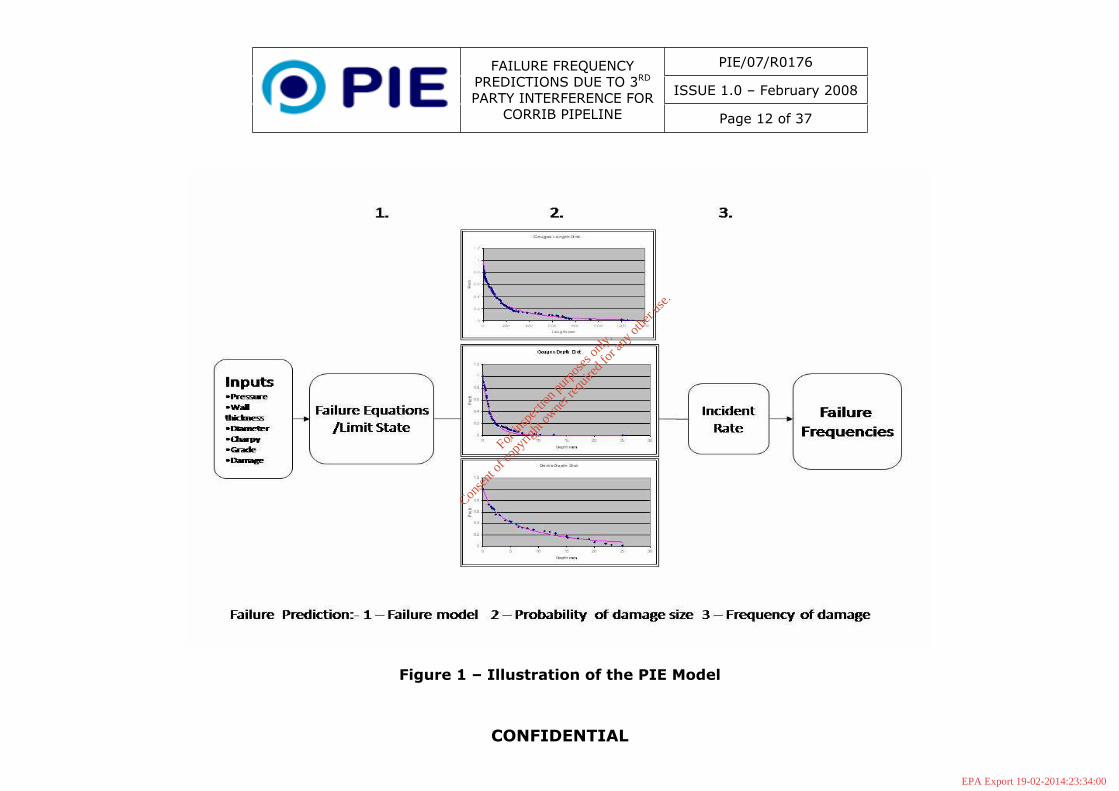
PIE/07/R0176
ISSUE 1.0 – February 2008
FAILURE FREQUENCY PREDICTIONS DUE TO 3RD
PARTY INTERFERENCE FOR CORRIB PIPELINE Page 12 of 37
CONFIDENTIAL
Figure 1 – Illustration of the PIE Model
For in
spec
tion p
urpo
ses o
nly.
Conse
nt of
copy
right
owne
r req
uired
for a
ny ot
her u
se.
EPA Export 19-02-2014:23:34:00

PIE/07/R0176
ISSUE 1.0 – February 2008
FAILURE FREQUENCY PREDICTIONS DUE TO 3RD
PARTY INTERFERENCE FOR CORRIB PIPELINE Page 13 of 37
CONFIDENTIAL
Details of the PIE model, the procedure for predicting the probability of failure and the dent and gouge damage data used to predict pipeline failure frequency are given in Appendices 2 and 3.
3.3 Comparison of the PIE model and FFREQ
As part of the work undertaken for UKOPA, a detailed comparison of predictions obtained using the PIE model and FFREQ for a number of pipeline cases was carried out. As these models are similar, in that they both use the original dent-gouge failure model, demonstration of reasonable agreement was required. A summary of the results is given in Table 1 and Figures 2 and 3.
PIE failure frequency km.yrs
FFREQ Failure Frequency km.yrs
Pbar
Diamm
Wtmm
GradeRupture Total Rupture Total
69 273 6.4 X46 3.13E-05 6.33E-05 3.19E-05 6.45E-05 70 324 7.1 X46 2.51E-05 5.06E-05 2.79E-05 5.80E-05 70 508 11.1 X46 4.32E-06 1.05E-05 3.41E-06 1.10E-05 75 610 9.5 X52 1.80E-05 3.22E-05 1.14E-05 3.11E-05 75 762 11.9 X52 7.73E-06 1.55E-05 3.37E-06 1.07E-05 70 914 12.7 X60 4.22E-06 1.28E-05 2.81E-06 1.00E-05 85 914 19.1 X60 1.97E-07 1.50E-06 4.12E-08 2.30E-06
Table 1 – Comparison of PIE and FFREQ Failure Frequency Predictions
Figure 2 – Comparison of PIE and FFREQ Total Failure Frequency Predictions
For
insp
ectio
n pur
pose
s only
.
Conse
nt of
copy
right
owne
r req
uired
for a
ny ot
her u
se.
EPA Export 19-02-2014:23:34:00
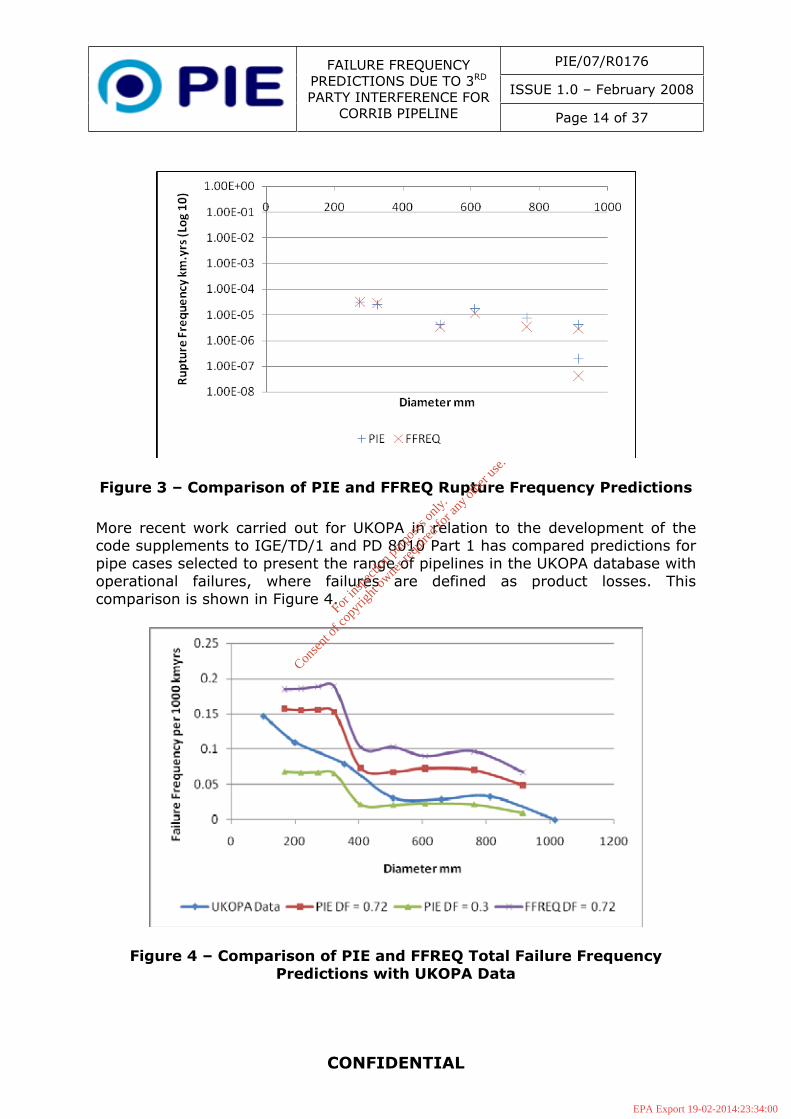
PIE/07/R0176
ISSUE 1.0 – February 2008
FAILURE FREQUENCY PREDICTIONS DUE TO 3RD
PARTY INTERFERENCE FOR CORRIB PIPELINE Page 14 of 37
CONFIDENTIAL
Figure 3 – Comparison of PIE and FFREQ Rupture Frequency Predictions
More recent work carried out for UKOPA in relation to the development of the code supplements to IGE/TD/1 and PD 8010 Part 1 has compared predictions for pipe cases selected to present the range of pipelines in the UKOPA database with operational failures, where failures are defined as product losses. This comparison is shown in Figure 4.
Figure 4 – Comparison of PIE and FFREQ Total Failure Frequency Predictions with UKOPA Data
For
insp
ectio
n pur
pose
s only
.
Conse
nt of
copy
right
owne
r req
uired
for a
ny ot
her u
se.
EPA Export 19-02-2014:23:34:00
PIE/07/R0176
ISSUE 1.0 – February 2008
FAILURE FREQUENCY PREDICTIONS DUE TO 3RD
PARTY INTERFERENCE FOR CORRIB PIPELINE Page 15 of 37
CONFIDENTIAL
Figure 4 shows that the PIE model predictions of total failure frequency for pipelines operating at a design factor of 0.72 and 0.3 bound the operational data, and the FFREQ predictions of total failure frequency are higher than the PIE model. Based on the above comparisons, UKOPA concluded that reasonable agreement had been demonstrated between the PIE model, FFREQ and operational data recorded in the UKOPA pipeline fault database.
3.4 Prediction of pipeline failure frequencies – UKOPA recommendations
Following detailed review and consideration of the results of the study shown above and comparison of pipeline failure models and failure frequency predictions obtained using the original dent-gouge and the UKOPA limit state models, UKOPA concluded that the original dent-gouge model has been subject to detailed review, and has been applied extensively in the period of its existence. It is widely recognised and is included in a number of expert methodologies, including the PIPESAFE risk assessment software package [7], the EPRG defect assessment guidelines [9] and the Pipeline Defect Assessment Manual PDAM [2]. The same level of review is not yet available for other models, including the UKOPA limit state [3, 4]. In addition, it is appreciated that further work relating the probability of damage caused to specific pipelines by the force applied by different machinery is required, but currently this data does not exist in detail for the UK. In this situation, the application of UKOPA dent-gouge damage data is conservative, particularly with respect to larger diameter and thicker wall pipelines.
Based on the above, UKOPA has therefore recommended that failure frequency predictions for use in pipeline risk analysis should be based on application of the original dent-gouge model (i.e. the PIE model in this work), as there is extensive practical experience in the use and interpretation of predictions from this model, and comprehensive validation against empirical failure data has been carried out. In addition, UKOPA has recommended the use of FFREQ as the standard industry failure frequency prediction software tool. The FFREQ software is currently being prepared by Advantica for release to UKOPA members as a standalone software module, and the damage data distributions are being updated to include data from the current UKOPA Pipeline Fault Database. At the time of the current work, these developments were not available, so the PIE model was used to obtain failure frequency predictions due to 3rd party interference for the Corrib pipeline.
For
insp
ectio
n pur
pose
s only
.
Conse
nt of
copy
right
owne
r req
uired
for a
ny ot
her u
se.
EPA Export 19-02-2014:23:34:00

PIE/07/R0176
ISSUE 1.0 – February 2008
FAILURE FREQUENCY PREDICTIONS DUE TO 3RD
PARTY INTERFERENCE FOR CORRIB PIPELINE Page 16 of 37
CONFIDENTIAL
4.0 Prediction of Failure Frequencies due to 3rd
party interference for the Corrib Pipeline
4.1 Pipeline Parameters
DNV required failure frequency predictions for the Corrib pipeline at four operating pressures, 345 bar, 144 bar, 100 bar and 55 bar. The pipeline parameters supplied by DNV for use in the PIE model are given in Table 2.
Parameter Value Diameter 508 mm
Wall thickness 27.1mm Material Grade X70
Table 2 – Pipeline Parameters for the Corrib Pipeline
The material properties used in the analysis are based on BS EN 10208-2:-
SMYS = 485 N/mm2
SMTS = 570 N/mm2
In addition, the Charpy energy value assumed was taken from published risk analyses for the Corrib pipeline [10,11], which quote a Charpy impact energy of 130 Joules with a COV of 0.4. Based on this, a Charpy energy value of 70 Joules was selected for use in the analysis.
4.2 Probability of failure and failure frequency predictions
The probability of failure and failure frequency predictions for the Corrib pipeline obtained using the PIE model are given in Table 3.
Operating Pressure barPredictions345 144 100 55
Leak 5.83E-05 4.53E-06 2.57E-06 1.83E-06 Rupture 1.08E-04 6.86E-07 6.30E-08 0.00E+00
Probability of Failure
Total 1.66E-04 5.22E-06 2.64E-06 1.83E-06 Leak 4.95E-08 3.85E-09 2.19E-09 1.55E-09
Rupture 9.15E-08 5.82E-10 5.35E-11 0.00E+00 Failure
Frequency Km.yrs Total 1.41E-07 4.43E-09 2.24E-09 1.55E-09
Table 3 – Probability of Failure and Failure Frequency Predictions for the Corrib Pipeline
Note:- Failure Frequency = Probability of failure x number of incidents per kmyr
For
insp
ectio
n pur
pose
s only
.
Conse
nt of
copy
right
owne
r req
uired
for a
ny ot
her u
se.
EPA Export 19-02-2014:23:34:00
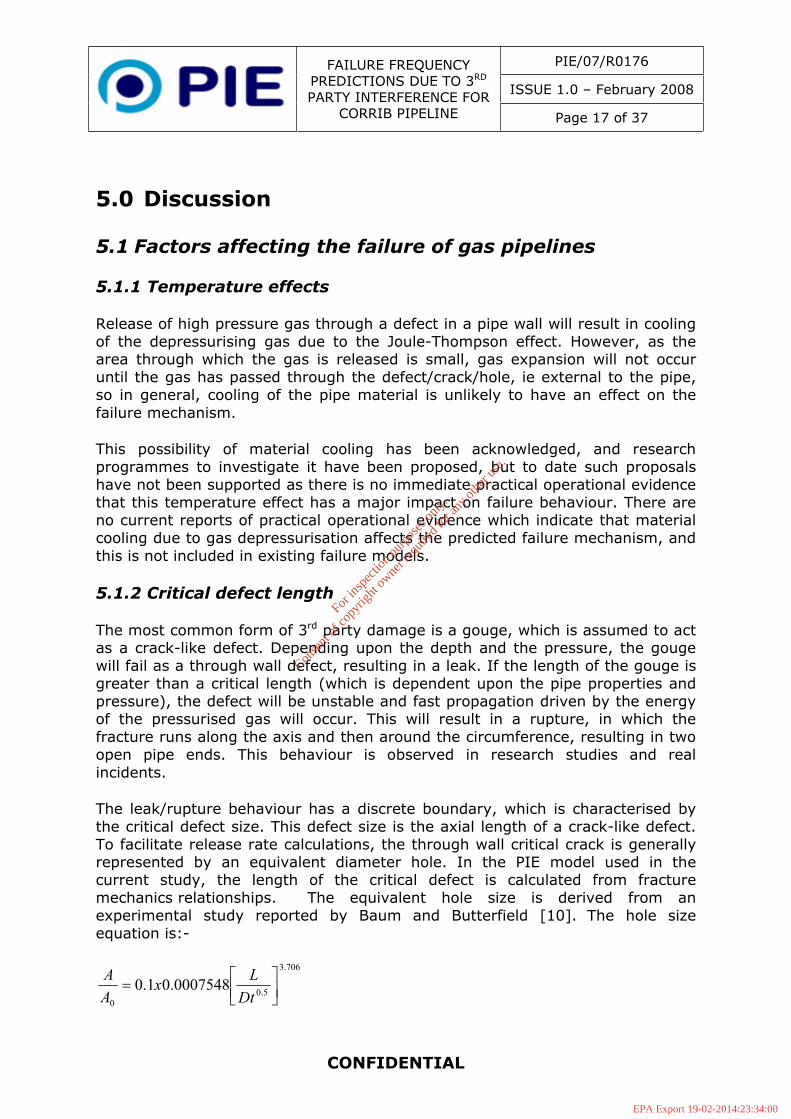
PIE/07/R0176
ISSUE 1.0 – February 2008
FAILURE FREQUENCY PREDICTIONS DUE TO 3RD
PARTY INTERFERENCE FOR CORRIB PIPELINE Page 17 of 37
CONFIDENTIAL
5.0 Discussion
5.1 Factors affecting the failure of gas pipelines
5.1.1 Temperature effects
Release of high pressure gas through a defect in a pipe wall will result in cooling of the depressurising gas due to the Joule-Thompson effect. However, as the area through which the gas is released is small, gas expansion will not occur until the gas has passed through the defect/crack/hole, ie external to the pipe, so in general, cooling of the pipe material is unlikely to have an effect on the failure mechanism.
This possibility of material cooling has been acknowledged, and research programmes to investigate it have been proposed, but to date such proposals have not been supported as there is no immediate practical operational evidence that this temperature effect has a major impact on failure behaviour. There are no current reports of practical operational evidence which indicate that material cooling due to gas depressurisation affects the predicted failure mechanism, and this is not included in existing failure models.
5.1.2 Critical defect length
The most common form of 3rd party damage is a gouge, which is assumed to act as a crack-like defect. Depending upon the depth and the pressure, the gouge will fail as a through wall defect, resulting in a leak. If the length of the gouge is greater than a critical length (which is dependent upon the pipe properties and pressure), the defect will be unstable and fast propagation driven by the energy of the pressurised gas will occur. This will result in a rupture, in which the fracture runs along the axis and then around the circumference, resulting in two open pipe ends. This behaviour is observed in research studies and real incidents.
The leak/rupture behaviour has a discrete boundary, which is characterised by the critical defect size. This defect size is the axial length of a crack-like defect. To facilitate release rate calculations, the through wall critical crack is generally represented by an equivalent diameter hole. In the PIE model used in the current study, the length of the critical defect is calculated from fracture mechanics relationships. The equivalent hole size is derived from an experimental study reported by Baum and Butterfield [10]. The hole size equation is:-
706.3
5.00
0007548.01.0Dt
LxAA
For
insp
ectio
n pur
pose
s only
.
Conse
nt of
copy
right
owne
r req
uired
for a
ny ot
her u
se.
EPA Export 19-02-2014:23:34:00
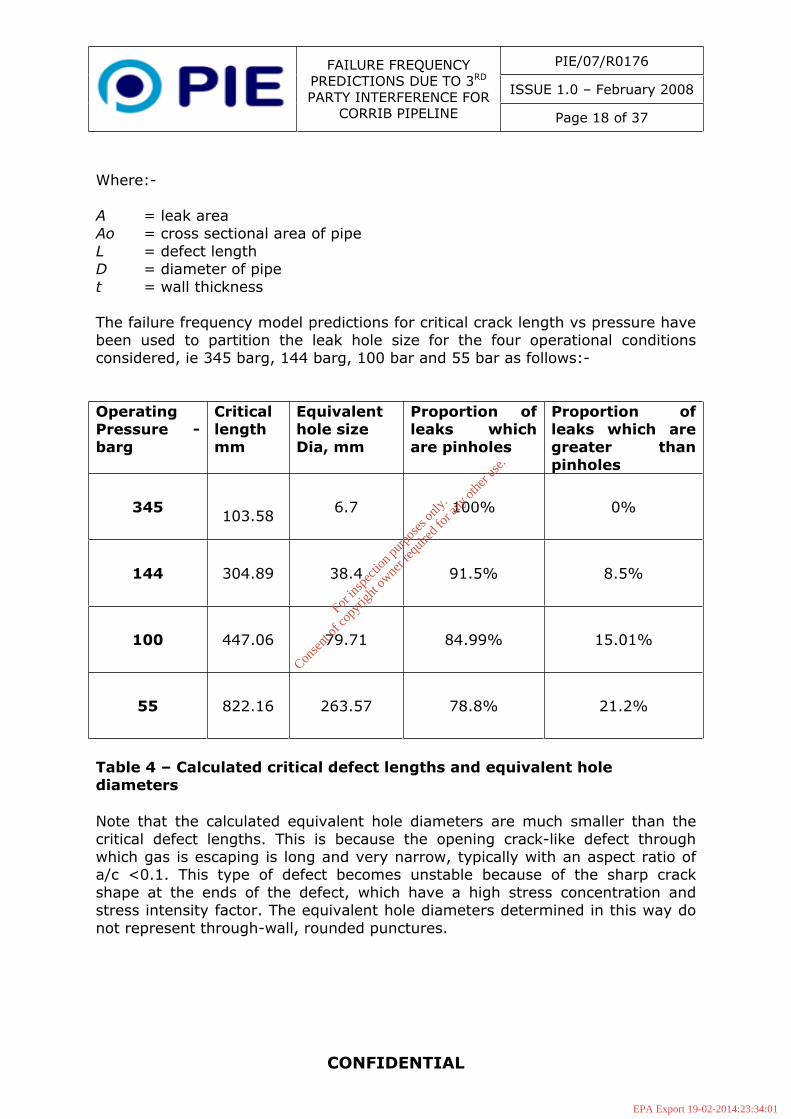
PIE/07/R0176
ISSUE 1.0 – February 2008
FAILURE FREQUENCY PREDICTIONS DUE TO 3RD
PARTY INTERFERENCE FOR CORRIB PIPELINE Page 18 of 37
CONFIDENTIAL
Where:-
A = leak area Ao = cross sectional area of pipe L = defect length D = diameter of pipe t = wall thickness
The failure frequency model predictions for critical crack length vs pressure have been used to partition the leak hole size for the four operational conditions considered, ie 345 barg, 144 barg, 100 bar and 55 bar as follows:-
OperatingPressure - barg
Criticallengthmm
Equivalenthole size Dia, mm
Proportion of leaks which are pinholes
Proportion of leaks which are greater than pinholes
345103.58
6.7 100% 0%
144 304.89 38.4 91.5% 8.5%
100 447.06 79.71 84.99% 15.01%
55 822.16 263.57 78.8% 21.2%
Table 4 – Calculated critical defect lengths and equivalent hole diameters
Note that the calculated equivalent hole diameters are much smaller than the critical defect lengths. This is because the opening crack-like defect through which gas is escaping is long and very narrow, typically with an aspect ratio of a/c <0.1. This type of defect becomes unstable because of the sharp crack shape at the ends of the defect, which have a high stress concentration and stress intensity factor. The equivalent hole diameters determined in this way do not represent through-wall, rounded punctures.
For
insp
ectio
n pur
pose
s only
.
Conse
nt of
copy
right
owne
r req
uired
for a
ny ot
her u
se.
EPA Export 19-02-2014:23:34:01
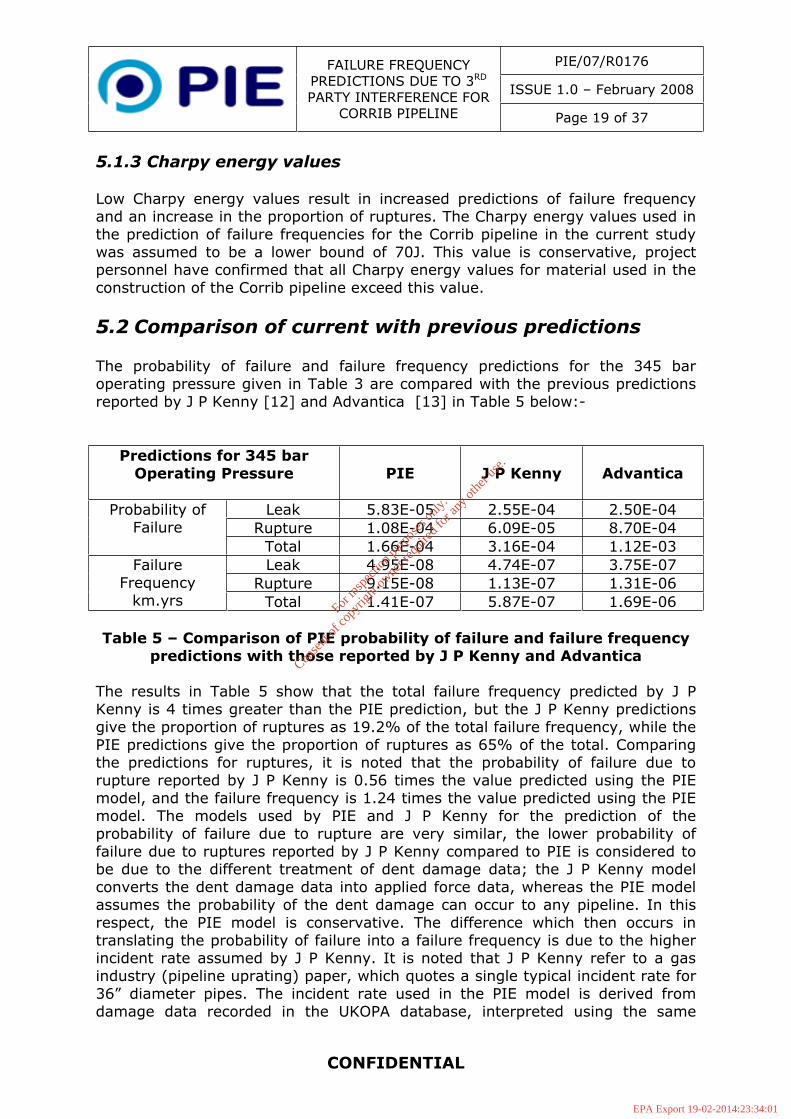
PIE/07/R0176
ISSUE 1.0 – February 2008
FAILURE FREQUENCY PREDICTIONS DUE TO 3RD
PARTY INTERFERENCE FOR CORRIB PIPELINE Page 19 of 37
CONFIDENTIAL
5.1.3 Charpy energy values
Low Charpy energy values result in increased predictions of failure frequency and an increase in the proportion of ruptures. The Charpy energy values used in the prediction of failure frequencies for the Corrib pipeline in the current study was assumed to be a lower bound of 70J. This value is conservative, project personnel have confirmed that all Charpy energy values for material used in the construction of the Corrib pipeline exceed this value.
5.2 Comparison of current with previous predictions
The probability of failure and failure frequency predictions for the 345 bar operating pressure given in Table 3 are compared with the previous predictions reported by J P Kenny [12] and Advantica [13] in Table 5 below:-
Predictions for 345 barOperating Pressure PIE J P Kenny Advantica
Leak 5.83E-05 2.55E-04 2.50E-04 Rupture 1.08E-04 6.09E-05 8.70E-04
Probability of Failure
Total 1.66E-04 3.16E-04 1.12E-03 Leak 4.95E-08 4.74E-07 3.75E-07
Rupture 9.15E-08 1.13E-07 1.31E-06 Failure
Frequency km.yrs Total 1.41E-07 5.87E-07 1.69E-06
Table 5 – Comparison of PIE probability of failure and failure frequency predictions with those reported by J P Kenny and Advantica
The results in Table 5 show that the total failure frequency predicted by J P Kenny is 4 times greater than the PIE prediction, but the J P Kenny predictions give the proportion of ruptures as 19.2% of the total failure frequency, while the PIE predictions give the proportion of ruptures as 65% of the total. Comparing the predictions for ruptures, it is noted that the probability of failure due to rupture reported by J P Kenny is 0.56 times the value predicted using the PIE model, and the failure frequency is 1.24 times the value predicted using the PIE model. The models used by PIE and J P Kenny for the prediction of the probability of failure due to rupture are very similar, the lower probability of failure due to ruptures reported by J P Kenny compared to PIE is considered to be due to the different treatment of dent damage data; the J P Kenny model converts the dent damage data into applied force data, whereas the PIE model assumes the probability of the dent damage can occur to any pipeline. In this respect, the PIE model is conservative. The difference which then occurs in translating the probability of failure into a failure frequency is due to the higher incident rate assumed by J P Kenny. It is noted that J P Kenny refer to a gas industry (pipeline uprating) paper, which quotes a single typical incident rate for 36” diameter pipes. The incident rate used in the PIE model is derived from damage data recorded in the UKOPA database, interpreted using the same
For
insp
ectio
n pur
pose
s only
.
Conse
nt of
copy
right
owne
r req
uired
for a
ny ot
her u
se.
EPA Export 19-02-2014:23:34:01
PIE/07/R0176
ISSUE 1.0 – February 2008
FAILURE FREQUENCY PREDICTIONS DUE TO 3RD
PARTY INTERFERENCE FOR CORRIB PIPELINE Page 20 of 37
CONFIDENTIAL
approach developed in the original British Gas work, ie the data has been interrogated to remove incorrectly classified damage, and to remove wrap-only damage. Taking these factors into account, the rupture failure frequencies reported by J P Kenny and PIE are not dissimilar.
The major difference in the total failure frequency predictions and the proportion of leaks vs ruptures is due to the higher leak frequency predicted by J P Kenny. J P Kenny use a model which predicts the probability of pipewall puncture by an excavator bucket tooth, whereas the PIE model uses the same failure model for the prediction of the probability of leaks and ruptures, the model calculates the critical gouge length, and the failure is predicted to be a rupture if this critical length is exceeded. The J P Kenny report states that the puncture model has been calibrated against results obtained from a recent joint industry project carried out in North America. The J P Kenny report notes that the machine size distribution data is considered conservative, and truncates the distribution to account for this. In this respect, it is considered that the J P Kenny model predicts a higher probability of failure due to leaks than the PIE model.
The comparison in Table 4 shows that the probability of failure reported by Advantica is 8.08 times the value predicted using the PIE model, and the failure frequency is 14.4 times the value predicted using the PIE model. This indicates the values reported by Advantica are higher than those predicted by the PIE model. The differences in predictions are similar to those considered by UKOPA (ref Section 3.1) and are considered to be due to the use of i) the updated failure model, which includes additional parameters (microcrack, plasticity and residual stress, modified Charpy correlation) which result in more conservative predictions but for which there is currently no validation data or verification process, and ii) the Advantica structural reliability analysis software, which gives conservative predictions, but the reasons for this are unknown.
A summary of the methodologies used for predicting the failure frequency due to 3rd party interference for the Corrib pipeline is given in Appendix 4.
5.3 Sensitivity studies
The Corrib pipeline differs from the general population of UK MAHPs in that it is ultra-thick wall. Simple sensitivity studies were therefore carried out to assess the influences of the pipeline parameters on the predicted failure frequency.
The variation of the rupture and total failure frequency for a 508 mm diameter, X70, 0.72 design factor pipeline of varying wall thickness is shown in Figure 5.
Figure 5 shows that failure frequency falls to minimal value at wall thicknesses greater than 15mm. Typically, 508 mm diameter gas pipelines in the UK population have wall thicknesses of 8mm. The above figure shows that the rupture frequency for a 508 mm diameter pipeline is approximately 3.5E-05, compared to a rupture frequency of 1.76E-07 for a pipeline of 27mm wall thickness, ie the rupture frequency of the 27mm wall thickness pipe is
For
insp
ectio
n pur
pose
s only
.
Conse
nt of
copy
right
owne
r req
uired
for a
ny ot
her u
se.
EPA Export 19-02-2014:23:34:01
PIE/07/R0176
ISSUE 1.0 – February 2008
FAILURE FREQUENCY PREDICTIONS DUE TO 3RD
PARTY INTERFERENCE FOR CORRIB PIPELINE Page 21 of 37
CONFIDENTIAL
approximately 200 times lower than that of a pipeline with a typical wall thickness. This confirms that the increase in wall thickness significantly reduces the pipeline rupture frequency.
Figure 5 – Variation of Failure Frequency for a 508mm dia, X70, 0.72 design factor pipeline with varying wall thickness
The variation of the total failure frequency with design factor is shown in Figure 6, and the rupture frequency as a proportion of the total frequency with design factor is shown in Figure 7.
Figure 6 – Variation of Total Failure Frequency with Design Factor
For
insp
ectio
n pur
pose
s only
.
Conse
nt of
copy
right
owne
r req
uired
for a
ny ot
her u
se.
EPA Export 19-02-2014:23:34:01
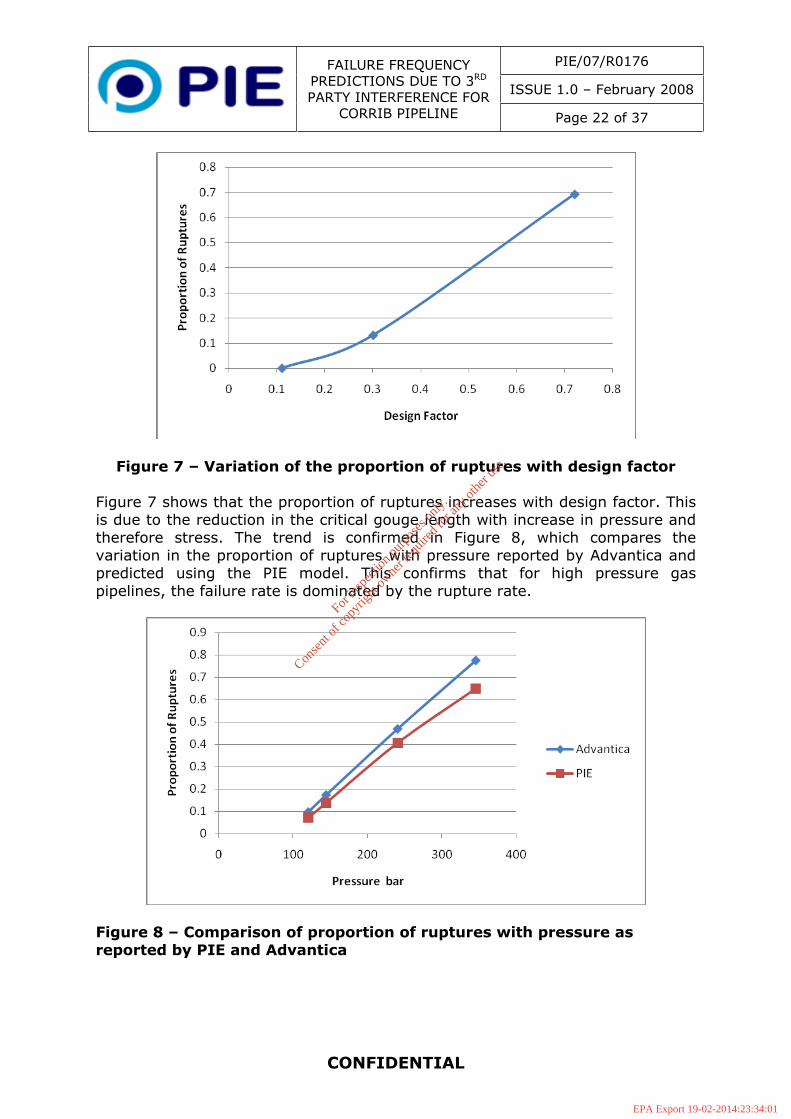
PIE/07/R0176
ISSUE 1.0 – February 2008
FAILURE FREQUENCY PREDICTIONS DUE TO 3RD
PARTY INTERFERENCE FOR CORRIB PIPELINE Page 22 of 37
CONFIDENTIAL
Figure 7 – Variation of the proportion of ruptures with design factor
Figure 7 shows that the proportion of ruptures increases with design factor. This is due to the reduction in the critical gouge length with increase in pressure and therefore stress. The trend is confirmed in Figure 8, which compares the variation in the proportion of ruptures with pressure reported by Advantica and predicted using the PIE model. This confirms that for high pressure gas pipelines, the failure rate is dominated by the rupture rate.
Figure 8 – Comparison of proportion of ruptures with pressure as reported by PIE and Advantica
For
insp
ectio
n pur
pose
s only
.
Conse
nt of
copy
right
owne
r req
uired
for a
ny ot
her u
se.
EPA Export 19-02-2014:23:34:01
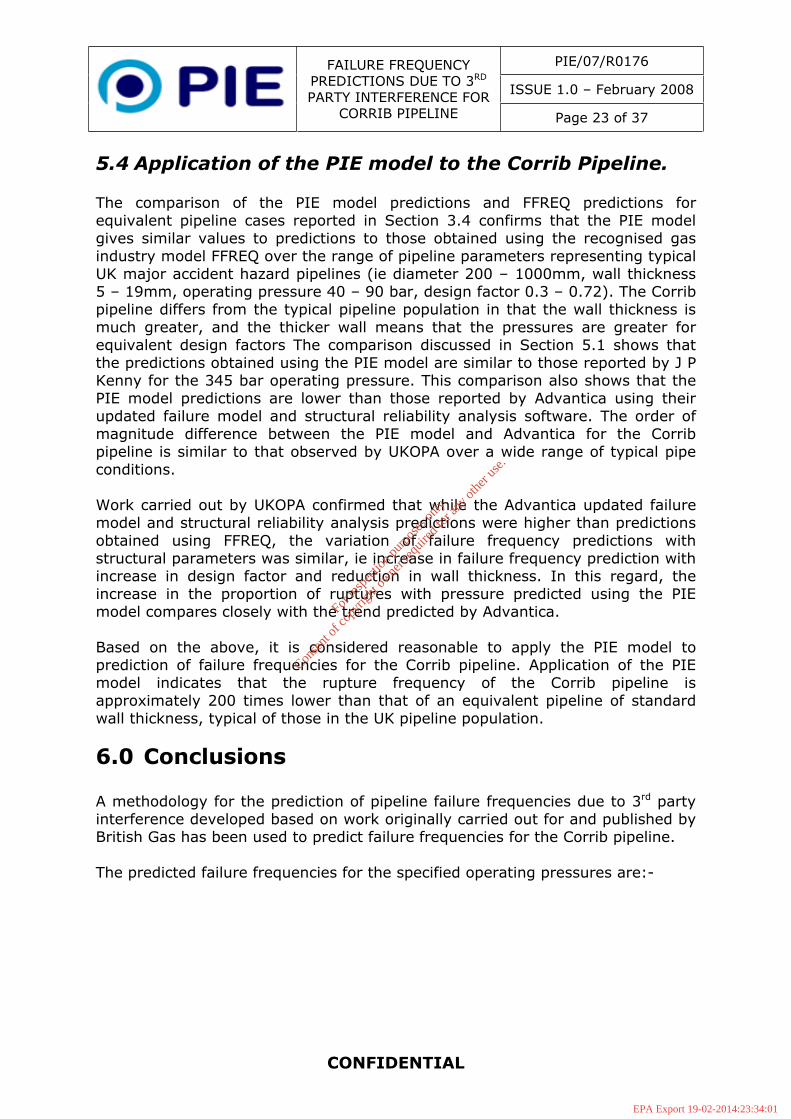
PIE/07/R0176
ISSUE 1.0 – February 2008
FAILURE FREQUENCY PREDICTIONS DUE TO 3RD
PARTY INTERFERENCE FOR CORRIB PIPELINE Page 23 of 37
CONFIDENTIAL
5.4 Application of the PIE model to the Corrib Pipeline.
The comparison of the PIE model predictions and FFREQ predictions for equivalent pipeline cases reported in Section 3.4 confirms that the PIE model gives similar values to predictions to those obtained using the recognised gas industry model FFREQ over the range of pipeline parameters representing typical UK major accident hazard pipelines (ie diameter 200 – 1000mm, wall thickness 5 – 19mm, operating pressure 40 – 90 bar, design factor 0.3 – 0.72). The Corrib pipeline differs from the typical pipeline population in that the wall thickness is much greater, and the thicker wall means that the pressures are greater for equivalent design factors The comparison discussed in Section 5.1 shows that the predictions obtained using the PIE model are similar to those reported by J P Kenny for the 345 bar operating pressure. This comparison also shows that the PIE model predictions are lower than those reported by Advantica using their updated failure model and structural reliability analysis software. The order of magnitude difference between the PIE model and Advantica for the Corrib pipeline is similar to that observed by UKOPA over a wide range of typical pipe conditions.
Work carried out by UKOPA confirmed that while the Advantica updated failure model and structural reliability analysis predictions were higher than predictions obtained using FFREQ, the variation of failure frequency predictions with structural parameters was similar, ie increase in failure frequency prediction with increase in design factor and reduction in wall thickness. In this regard, the increase in the proportion of ruptures with pressure predicted using the PIE model compares closely with the trend predicted by Advantica.
Based on the above, it is considered reasonable to apply the PIE model to prediction of failure frequencies for the Corrib pipeline. Application of the PIE model indicates that the rupture frequency of the Corrib pipeline is approximately 200 times lower than that of an equivalent pipeline of standard wall thickness, typical of those in the UK pipeline population.
6.0 Conclusions
A methodology for the prediction of pipeline failure frequencies due to 3rd party interference developed based on work originally carried out for and published by British Gas has been used to predict failure frequencies for the Corrib pipeline.
The predicted failure frequencies for the specified operating pressures are:-
For
insp
ectio
n pur
pose
s only
.
Conse
nt of
copy
right
owne
r req
uired
for a
ny ot
her u
se.
EPA Export 19-02-2014:23:34:01
PIE/07/R0176
ISSUE 1.0 – February 2008
FAILURE FREQUENCY PREDICTIONS DUE TO 3RD
PARTY INTERFERENCE FOR CORRIB PIPELINE Page 24 of 37
CONFIDENTIAL
Operating Pressure barPredictions345 144 100 55
Leak 5.83E-05 4.53E-06 2.57E-06 1.83E-06 Rupture 1.08E-04 6.86E-07 6.30E-08 0.00E+00
Probability of Failure
Total 1.66E-04 5.22E-06 2.64E-06 1.83E-06 Leak 4.95E-08 3.85E-09 2.19E-09 1.55E-09
Rupture 9.15E-08 5.82E-10 5.35E-11 0.00E+00 Failure
Frequency Km.yrs Total 1.41E-07 4.43E-09 2.24E-09 1.55E-09
Comparison with other published failure frequency predictions and the results of sensitivity studies have confirmed it is reasonable to apply the prediction methodology to the Corrib pipeline.
Application of the PIE model indicates that the rupture frequency of the Corrib pipeline is approximately 200 times lower than that of an equivalent pipeline of standard wall thickness, typical of those in the UK pipeline population.
7.0 References
1 The Application of Risk Techniques to the Design and operation of Pipelines. I Corder. Ageing Pipelines I Mech E Conference September 1995. C50-2/016/95
2 IPC02-27067 The Pipeline Defect Assessment Manual. Proceedings of IPC 2002 International Pipeline Conference. Andrew Cosham and Phil Hopkins.
3 A New Limit State Function for the Instantaneous Failure of a Dent Containing A Gouge In A Pressurised Pipeline. A Francis, T Miles and V Chauhan October 2004.
4 Development of a New Limit State Function for the Failure of pipelines Due To Mechanical Damage. A Francis, C S Jandu, R M Andrews, T J Miles, V Chauhan. PRCI Paper April 2005.
5 ERS E576 Prediction of Pipeline Failure Frequencies. I Corder and G D Fearnehough. Presented at the Second International Conference on Pipes, Pipelines, and Pipeline Systems. Utrecht, Netherlands, June 1987.
6 UKOPA Pipeline Fault Database – Pipeline Product Loss Incidents 1962 – 2004. April 2005.
7 PD 8010: Code of Practice for Pipelines – Part 1: Steel pipelines on land. BSI 2004.
For
insp
ectio
n pur
pose
s only
.
Conse
nt of
copy
right
owne
r req
uired
for a
ny ot
her u
se.
EPA Export 19-02-2014:23:34:01
PIE/07/R0176
ISSUE 1.0 – February 2008
FAILURE FREQUENCY PREDICTIONS DUE TO 3RD
PARTY INTERFERENCE FOR CORRIB PIPELINE Page 25 of 37
CONFIDENTIAL
8 IGE/TD/1 Edition 4 – Steel Pipelines for High Pressure Gas Transmission. IGEM 2001.
9 Recent Developments in the Design and Application of the PIPESAFE Risk Assessment Package for Gas Transmission Pipelines. M R Acton, T R Baldwin, E E R Jager. ASME International, Proceedings of the International Pipeline Conference, 2002, Calgary September 2002.
10 EPRG Methods for Assessing the Tolerance and Resistance of Pipelines to External Damage, P Roovers, R Bood, M Galli, U Marewski, Steiner, M Zarea. Proceedings of the Third International Pipeline Technology Conference, Brugge, Belgium, R. Denys, Ed., Elsevier Science, 2000, pp. 405-425.
11 Studies of the Depressurisation of Gas Pressurised Pipes During Rupture. M Baum, J M Butterfield. Journal of Mechanical Engineering Science. Vol 21 No 4 1979. IMechE
12 J P Kenny 05-2102-02-F-3-835 Corrib Field Development (Phase II) Onshore Pipeline Quantified Risk Assessment. April 2005.
13 Advantica Report R 8391 Independent Safety Review of the Onshore Section of the Proposed Corrib Gas Pipeline. M Acton and R Andrews. January 2006.
For
insp
ectio
n pur
pose
s only
.
Conse
nt of
copy
right
owne
r req
uired
for a
ny ot
her u
se.
EPA Export 19-02-2014:23:34:01

PIE/07/R0176
ISSUE 1.0 – February 2008
FAILURE FREQUENCY PREDICTIONS DUE TO 3RD
PARTY INTERFERENCE FOR CORRIB PIPELINE Page 26 of 37
CONFIDENTIAL
Appendix 1: Glossary
UKOPA - United Kingdom Onshore Pipeline Operators Association is an industry association formed to co-ordinate industry best practice with respect to safe operation and integrity management of pipelines. This organisation has a long term strategic goal to achieve consistency in pipeline risk assessment with respect to models, methods assumptions and data, specifically with respect to risk based land use planning zones. UKOPA is currently progressing risk assessment supplements to the onshore pipeline codes IGE/TD/1 and PD 8010 Part 1. UKOPA membership comprises in the UK: National Grid, Shell, BP, Sabic UK Petrochemicals, Esso, Ineos, Total UK, BPA, OPA, Northern Gas Networks, Scotia Gas Network, Wales and West Utilities, BG Group, Eon UK, Unipen, Centrica.
EPRG - European Pipeline Research Group is a cooperation of European pipe manufacturers and gas transmission companies. EPRG undertakes a wide range of research directed to increased integrity and safety of gas transmission pipelines, and provides authoritative guidance to members and publishes the results of its research widely. EPRG membership comprises 18 member companies, 9 gas transmission and 9 pipe manufacturing companies, from 8 European countries.
FFREQ - methodology for the prediction of pipeline failure probability due to 3rd
party interference damage. It combines historical UK gas industry data on the frequency and severity of damage (using Weibull distributions for the gouge and dent damage parameters) with a structural model that determines the severity of damage required to cause failure of a specific pipeline. This method allows the influence of the main pipeline parameters (diameter, wall thickness, grade and toughness) on failure probability to be quantified.
PIE Model – Reconstruction of the FFREQ methodology using the original dent-gouge failure model and dent and gouge damage probability distributions derived from operational data recorded in the UKOPA database. PDAM - Pipeline Damage Assessment Manual – comprehensive manual developed as a joint industry project sponsored by sixteen major oil and gas companies. The manual provides a critical and authoritative review of available pipeline defect assessment models and methods, reports comparisons with empirical data and gives recommendations for the best current method for each type of damage.
PIPESAFE – knowledge-based, integrated software package for risk assessment of gas transmission pipelines, originally developed in 1994 by an international collaboration of a number of gas transmission companies, and since then has been developed and enhanced in a number of key phases. The software package allows risk assessments to be carried out following different methodologies, depending on company practices and/or the regulatory
For
insp
ectio
n pur
pose
s only
.
Conse
nt of
copy
right
owne
r req
uired
for a
ny ot
her u
se.
EPA Export 19-02-2014:23:34:01

PIE/07/R0176
ISSUE 1.0 – February 2008
FAILURE FREQUENCY PREDICTIONS DUE TO 3RD
PARTY INTERFERENCE FOR CORRIB PIPELINE Page 27 of 37
CONFIDENTIAL
environment in which the pipeline is operated, and provides the user withsubstantial flexibility and freedom to select different rules and procedures.
For
insp
ectio
n pur
pose
s only
.
Conse
nt of
copy
right
owne
r req
uired
for a
ny ot
her u
se.
EPA Export 19-02-2014:23:34:01
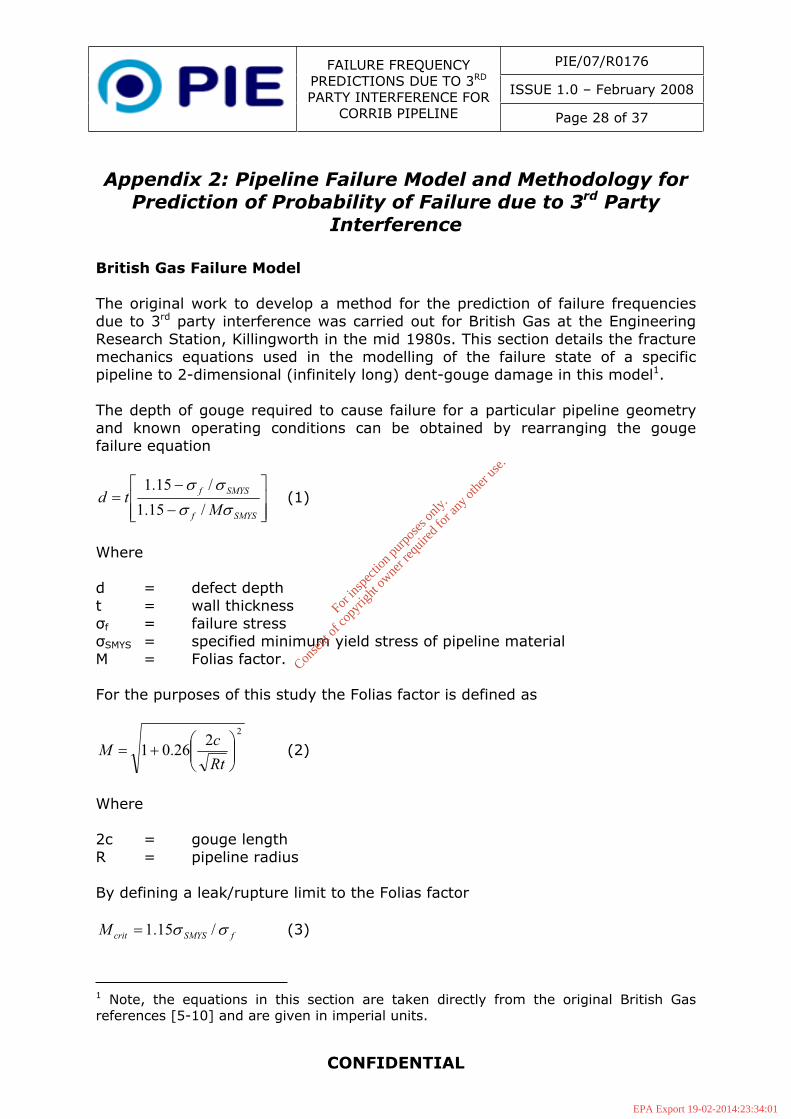
PIE/07/R0176
ISSUE 1.0 – February 2008
FAILURE FREQUENCY PREDICTIONS DUE TO 3RD
PARTY INTERFERENCE FOR CORRIB PIPELINE Page 28 of 37
CONFIDENTIAL
Appendix 2: Pipeline Failure Model and Methodology for Prediction of Probability of Failure due to 3rd Party
Interference
British Gas Failure Model
The original work to develop a method for the prediction of failure frequencies due to 3rd party interference was carried out for British Gas at the Engineering Research Station, Killingworth in the mid 1980s. This section details the fracture mechanics equations used in the modelling of the failure state of a specific pipeline to 2-dimensional (infinitely long) dent-gouge damage in this model1.
The depth of gouge required to cause failure for a particular pipeline geometry and known operating conditions can be obtained by rearranging the gouge failure equation
SMYSf
SMYSf
Mtd
/15.1/15.1
(1)
Where
d = defect depth t = wall thickness
f = failure stress SMYS = specified minimum yield stress of pipeline material
M = Folias factor.
For the purposes of this study the Folias factor is defined as
2226.01RtcM (2)
Where
2c = gouge length R = pipeline radius
By defining a leak/rupture limit to the Folias factor
fSMYScritM /15.1 (3)
1 Note, the equations in this section are taken directly from the original British Gas references [5-10] and are given in imperial units.
For
insp
ectio
n pur
pose
s only
.
Conse
nt of
copy
right
owne
r req
uired
for a
ny ot
her u
se.
EPA Export 19-02-2014:23:34:01

PIE/07/R0176
ISSUE 1.0 – February 2008
FAILURE FREQUENCY PREDICTIONS DUE TO 3RD
PARTY INTERFERENCE FOR CORRIB PIPELINE Page 29 of 37
CONFIDENTIAL
And substituting in to the original Folias factor definition the critical length of the gouge can be determined
2/12
846.313225.1 RtLf
SMYScrit (4)
Gouges of length Lcrit or larger will rupture, shorter gouges will leak2. This is used to determine the differences between leak failure frequencies and rupture failure frequencies.
It has been shown that the failure stress of a pipeline incorporating a dent/gouge combination of known geometry can be predicted with reasonable accuracy from:
57.09.1)ln(
exp2
2.102
8.115.1expcos22
2121 vf C
RD
tRY
RDY
AdE
(5)
Where:
E = elastic modulus of pipeline material A = 0.083 d = gouge depth D = dent depth Cv = Charpy energy (measured using 2/3 specimen)
All other factors are as above is the flow stress, a measure of the resistance of the material to plastic
collapse and is defined as:
td
SMYS 115.1 (6)
Y1 and Y2 are defined as follows:
432
2
432
1
0.141.1332.739.112.1
4.307.216.1023.012.1
td
td
td
tdY
td
td
td
tdY
(7, 8)
2 Note: risk analysis consequence models require interpretation of critical gouge length in terms of hole size.
For
insp
ectio
n pur
pose
s only
.
Conse
nt of
copy
right
owne
r req
uired
for a
ny ot
her u
se.
EPA Export 19-02-2014:23:34:01
PIE/07/R0176
ISSUE 1.0 – February 2008
FAILURE FREQUENCY PREDICTIONS DUE TO 3RD
PARTY INTERFERENCE FOR CORRIB PIPELINE Page 30 of 37
CONFIDENTIAL
The size of dent required to cause failure with a particular gouge can be obtained by re-arranging equation (5):
8.12.10
1
5.12secln
57.09.1ln
exp
2/
1
2
2/1
21
2
tR
YY
YE
Ad
C
RD
f
v
(9)
Equation (5) is semi-empirical based on multiple regression of the 57.0/9.1ln vC term. The subject of the equation has been changed from
f/ SMYS in equation (5) to D/2R and hence it is necessary to perform a new regression for the new subject. This procedure results in the constants 1.9 and 0.57 being replaced by 2.049 and 0.534 respectively [5]
A more detailed discussion of this model and the parameters which influence predictions is given by Cosham and Hopkins [2].
Methodology for prediction of the likelihood of occurrence of dent-gouge damage
The methodology developed for the prediction of the likelihood of occurrence of the dent-gouge damage which results in failure for the specified pipeline conditions is summarised in this section. This methodology is reconstructed from the original work undertaken by the British Gas Engineering Research Station [5,6,7,8,9,10].
Weibull Probability Curves
The methodology for the prediction of the likelihood of occurrence of the dent-gouge damage is a probabilistic model making use of Weibull probability distributions specific to the dimensions of the dent-gouge damage to give the probabilities of the damage occurring.
Cumulative probability distribution curves were produced for i) gouge length, ii) gouge depth and iii) dent depth. In each case the cumulative probability relates to the probability of occurrence for a specified size of damage or greater.
The cumulative probabilities shown with fitted Weibull probability distributions are given in Figures A1 – A3 below. In all cases, operational damage data has been interpreted conservatively, i.e. the worst case damage dimensions recorded for each incident are assumed, based on using the gouge depth as the overall selection parameter.
For
insp
ectio
n pur
pose
s only
.
Conse
nt of
copy
right
owne
r req
uired
for a
ny ot
her u
se.
EPA Export 19-02-2014:23:34:01
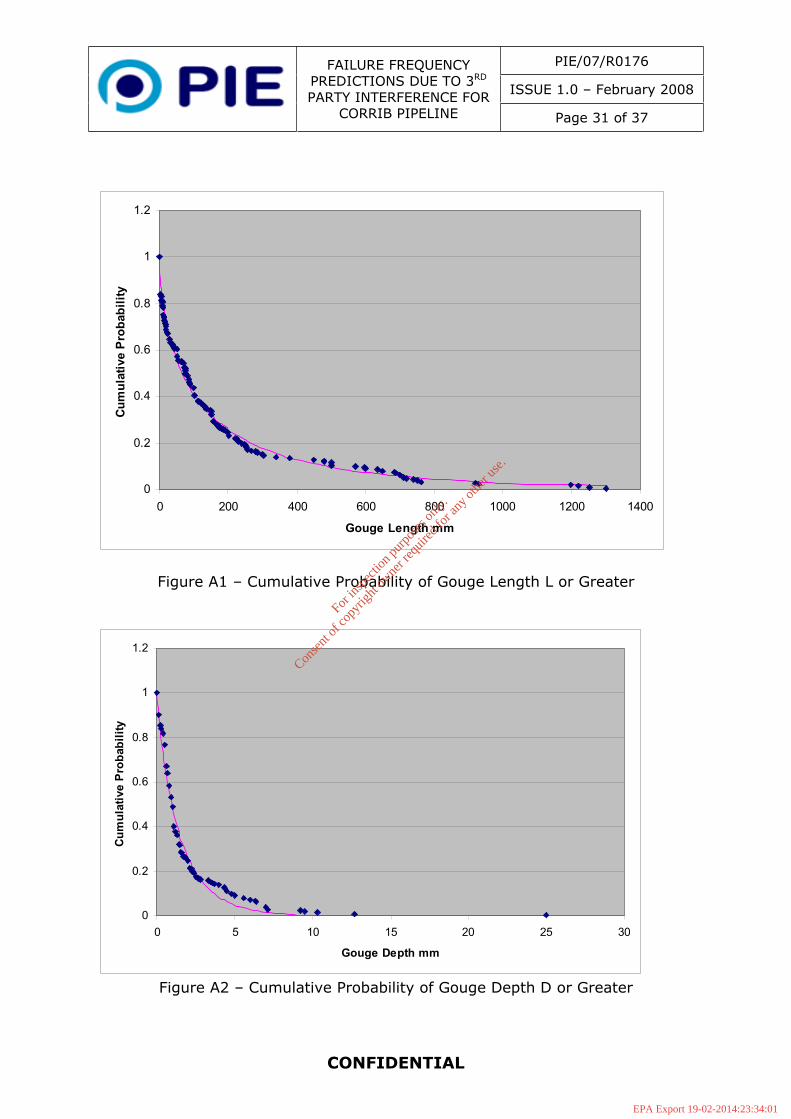
PIE/07/R0176
ISSUE 1.0 – February 2008
FAILURE FREQUENCY PREDICTIONS DUE TO 3RD
PARTY INTERFERENCE FOR CORRIB PIPELINE Page 31 of 37
CONFIDENTIAL
0
0.2
0.4
0.6
0.8
1
1.2
0 200 400 600 800 1000 1200 1400
Gouge Length mm
Cum
ulat
ive
Prob
abili
ty
Figure A1 – Cumulative Probability of Gouge Length L or Greater
0
0.2
0.4
0.6
0.8
1
1.2
0 5 10 15 20 25 30
Gouge Depth mm
Cum
ulat
ive
Pro
babi
lity
Figure A2 – Cumulative Probability of Gouge Depth D or Greater
For
insp
ectio
n pur
pose
s only
.
Conse
nt of
copy
right
owne
r req
uired
for a
ny ot
her u
se.
EPA Export 19-02-2014:23:34:01
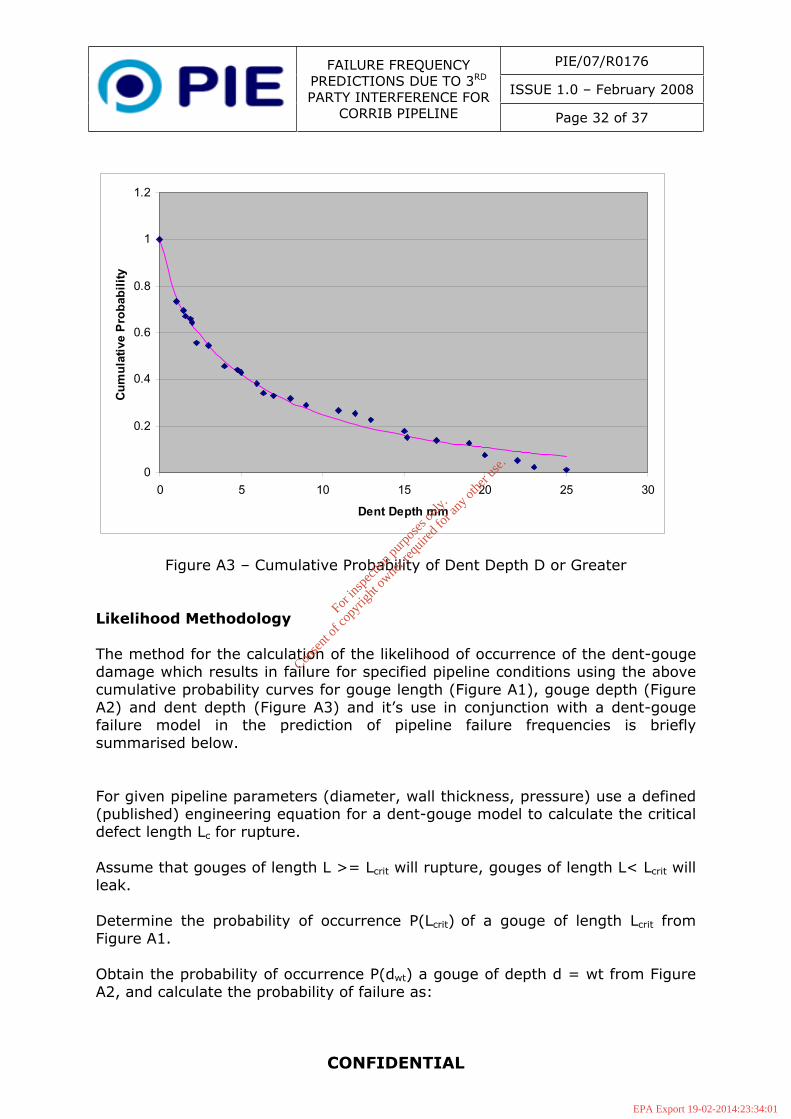
PIE/07/R0176
ISSUE 1.0 – February 2008
FAILURE FREQUENCY PREDICTIONS DUE TO 3RD
PARTY INTERFERENCE FOR CORRIB PIPELINE Page 32 of 37
CONFIDENTIAL
0
0.2
0.4
0.6
0.8
1
1.2
0 5 10 15 20 25 30
Dent Depth mm
Cum
ulat
ive
Pro
babi
lity
Figure A3 – Cumulative Probability of Dent Depth D or Greater
Likelihood Methodology
The method for the calculation of the likelihood of occurrence of the dent-gouge damage which results in failure for specified pipeline conditions using the above cumulative probability curves for gouge length (Figure A1), gouge depth (Figure A2) and dent depth (Figure A3) and it’s use in conjunction with a dent-gouge failure model in the prediction of pipeline failure frequencies is briefly summarised below.
For given pipeline parameters (diameter, wall thickness, pressure) use a defined (published) engineering equation for a dent-gouge model to calculate the critical defect length Lc for rupture.
Assume that gouges of length L >= Lcrit will rupture, gouges of length L< Lcrit will leak.
Determine the probability of occurrence P(Lcrit) of a gouge of length Lcrit from Figure A1.
Obtain the probability of occurrence P(dwt) a gouge of depth d = wt from Figure A2, and calculate the probability of failure as:
For
insp
ectio
n pur
pose
s only
.
Conse
nt of
copy
right
owne
r req
uired
for a
ny ot
her u
se.
EPA Export 19-02-2014:23:34:01
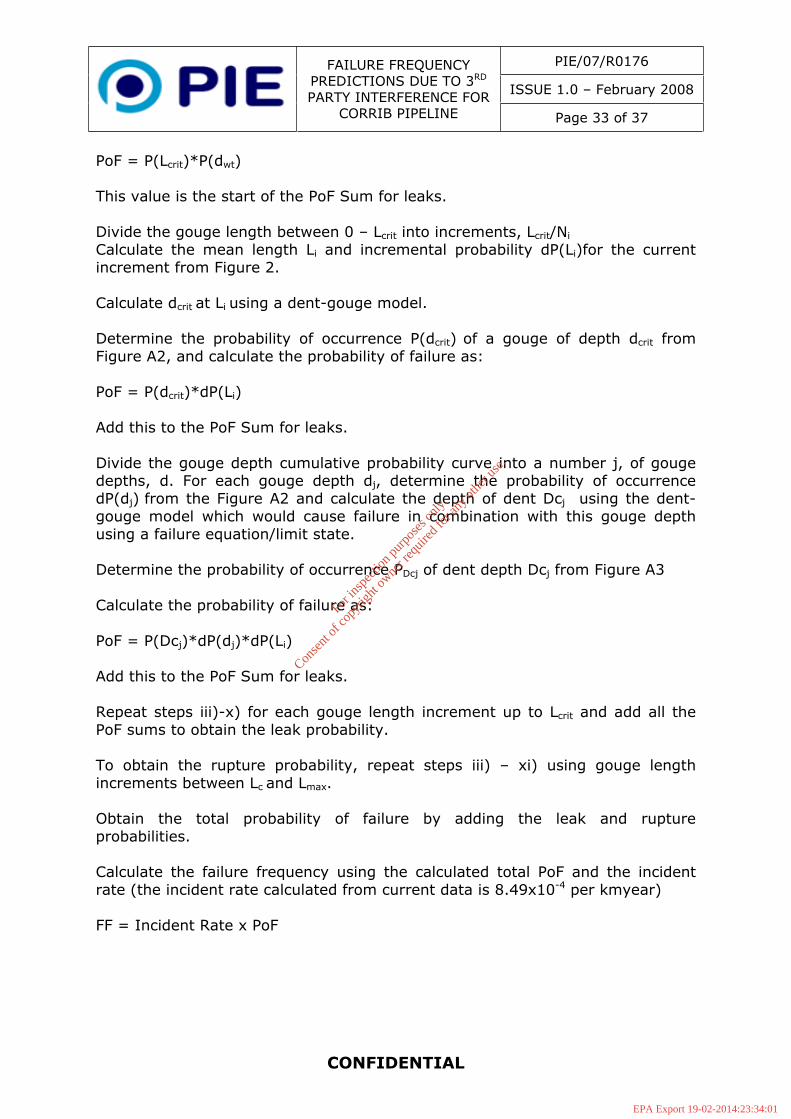
PIE/07/R0176
ISSUE 1.0 – February 2008
FAILURE FREQUENCY PREDICTIONS DUE TO 3RD
PARTY INTERFERENCE FOR CORRIB PIPELINE Page 33 of 37
CONFIDENTIAL
PoF = P(Lcrit)*P(dwt)
This value is the start of the PoF Sum for leaks.
Divide the gouge length between 0 – Lcrit into increments, Lcrit/Ni
Calculate the mean length Li and incremental probability dP(Li)for the current increment from Figure 2.
Calculate dcrit at Li using a dent-gouge model.
Determine the probability of occurrence P(dcrit) of a gouge of depth dcrit from Figure A2, and calculate the probability of failure as:
PoF = P(dcrit)*dP(Li)
Add this to the PoF Sum for leaks.
Divide the gouge depth cumulative probability curve into a number j, of gouge depths, d. For each gouge depth dj, determine the probability of occurrence dP(dj) from the Figure A2 and calculate the depth of dent Dcj using the dent-gouge model which would cause failure in combination with this gouge depth using a failure equation/limit state.
Determine the probability of occurrence PDcj of dent depth Dcj from Figure A3
Calculate the probability of failure as:
PoF = P(Dcj)*dP(dj)*dP(Li)
Add this to the PoF Sum for leaks.
Repeat steps iii)-x) for each gouge length increment up to Lcrit and add all the PoF sums to obtain the leak probability.
To obtain the rupture probability, repeat steps iii) – xi) using gouge length increments between Lc and Lmax.
Obtain the total probability of failure by adding the leak and rupture probabilities.
Calculate the failure frequency using the calculated total PoF and the incident rate (the incident rate calculated from current data is 8.49x10⁻⁴ per kmyear)
FF = Incident Rate x PoF
For
insp
ectio
n pur
pose
s only
.
Conse
nt of
copy
right
owne
r req
uired
for a
ny ot
her u
se.
EPA Export 19-02-2014:23:34:01
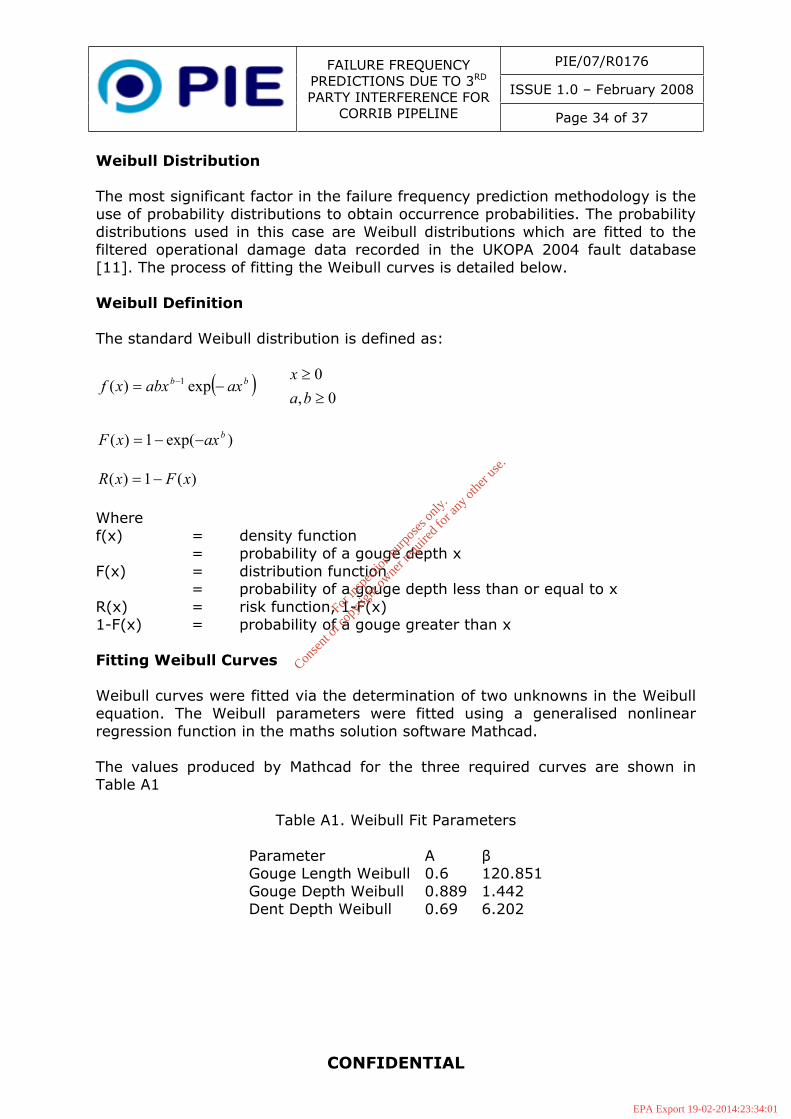
PIE/07/R0176
ISSUE 1.0 – February 2008
FAILURE FREQUENCY PREDICTIONS DUE TO 3RD
PARTY INTERFERENCE FOR CORRIB PIPELINE Page 34 of 37
CONFIDENTIAL
Weibull Distribution
The most significant factor in the failure frequency prediction methodology is the use of probability distributions to obtain occurrence probabilities. The probability distributions used in this case are Weibull distributions which are fitted to the filtered operational damage data recorded in the UKOPA 2004 fault database [11]. The process of fitting the Weibull curves is detailed below.
Weibull Definition
The standard Weibull distribution is defined as:
bb axabxxf exp)( 1
0,0
bax
)exp(1)( baxxF
)(1)( xFxR
Wheref(x) = density function = probability of a gouge depth x F(x) = distribution function = probability of a gouge depth less than or equal to x R(x) = risk function, 1-F(x) 1-F(x) = probability of a gouge greater than x
Fitting Weibull Curves
Weibull curves were fitted via the determination of two unknowns in the Weibull equation. The Weibull parameters were fitted using a generalised nonlinear regression function in the maths solution software Mathcad.
The values produced by Mathcad for the three required curves are shown in Table A1
Table A1. Weibull Fit Parameters
Parameter Gouge Length Weibull 0.6 120.851Gouge Depth Weibull 0.889 1.442 Dent Depth Weibull 0.69 6.202
For
insp
ectio
n pur
pose
s only
.
Conse
nt of
copy
right
owne
r req
uired
for a
ny ot
her u
se.
EPA Export 19-02-2014:23:34:01
PIE/07/R0176
ISSUE 1.0 – February 2008
FAILURE FREQUENCY PREDICTIONS DUE TO 3RD
PARTY INTERFERENCE FOR CORRIB PIPELINE Page 35 of 37
CONFIDENTIAL
Appendix 3: Flow Diagram for Failure Frequency Prediction Methodology using PIE Model
For
insp
ectio
n pur
pose
s only
.
Conse
nt of
copy
right
owne
r req
uired
for a
ny ot
her u
se.
EPA Export 19-02-2014:23:34:01
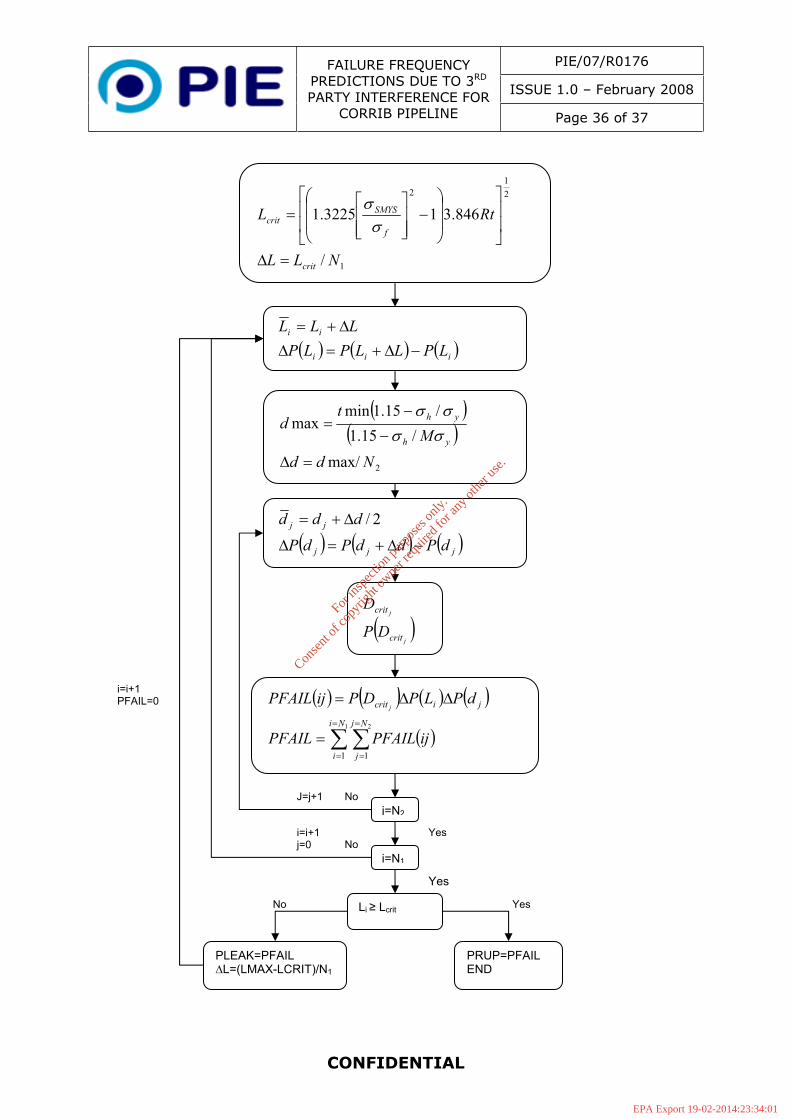
PIE/07/R0176
ISSUE 1.0 – February 2008
FAILURE FREQUENCY PREDICTIONS DUE TO 3RD
PARTY INTERFERENCE FOR CORRIB PIPELINE Page 36 of 37
CONFIDENTIAL
1
21
2
/
846.313225.1
NLL
RtL
crit
f
SMYScrit
iii
ii
LPLLPLPLLL
2max//15.1
/15.1minmax
NddM
td
yh
yh
jjj
jj
dPddPdPddd 2/
j
j
crit
crit
DP
D
1 2
1 1
Ni
i
Nj
j
jicrit
ijPFAILPFAIL
dPLPDPijPFAILj
j=N2
i=N1
Li Lcrit
PLEAK=PFAILL=(LMAX-LCRIT)/N1
PRUP=PFAILEND
Yes No
Yes
Yes No
NoJ=j+1
i=i+1j=0
i=i+1PFAIL=0
For
insp
ectio
n pur
pose
s only
.
Conse
nt of
copy
right
owne
r req
uired
for a
ny ot
her u
se.
EPA Export 19-02-2014:23:34:01
PIE/07/R0176
ISSUE 1.0 – February 2008
FAILURE FREQUENCY PREDICTIONS DUE TO 3RD
PARTY INTERFERENCE FOR CORRIB PIPELINE Page 37 of 37
CONFIDENTIAL
Appendix 4: Summary of 3rd Party Interference Failure Frequency Models Applied to Corrib Pipeline
Methodology Probability of Damage Structural modelling of through-wall failure
Probability of failure due to i) leaks and ii) ruptures
Failure Frequency
J P Kenny Gouge depth & length parameters as published by BG Technology for UK gas industry (Gouge depth - Weibull distribution, length – offset logistic ) Dent force calculated using dent-force relationship published by Corder and Chatain using correlation with excavator mass from US JIP
EPRG published version of the original dent-gouge failure model developed by the UK gas industry
Probability calculations carried out using Monte Carlo simulation taking into account probability distributions for wall thickness, yield strength and fracture toughness as well as damage dimensions (dent depth, gouge length and depth).
Probability of failure x 3rd party damage incident rate published in BG Technology technical paper on structural reliability modelling applied to pipeline uprating
Advantica Gouge depth and length parameters as above, Dent-force – Weibull distribution based on dent force calculated for gas industry dent data.
Dent-gouge model updated to include Alignment with latest R6 defect assessment procedures, dent residual stress and microcrack in gouge.
Probability calculations carried out using structural reliability analysis, taking into account probability distributions for wall thickness, yield strength and fracture toughness as well as damage dimensions (dent depth, gouge length and depth).
Assume - Probability of failure x 3rd party damage incident rate from gas industry data
PIE Model Weibull distributions for gouge depth and length and dent depth from UKOPA database
EPRG published version of the original dent-gouge failure model developed by the UK gas industry
Probability calculations consider damage dimensions (dent depth, gouge length and depth) only, nominal wall thickness assumed, specified minimum yield stress and lower bound Charpy energy. Rupture probability calculated from the cumulative probability of a gouge length equal to or exceeding the critical defect length.
Probability of failure x 3rd party damage incident rate from UKOPA database
For
insp
ectio
n pur
pose
s only
.
Conse
nt of
copy
right
owne
r req
uired
for a
ny ot
her u
se.
EPA Export 19-02-2014:23:34:01
DET NORSKE VERITAS
Report for Shell E&P Ireland Ltd. Corrib Onshore Pipeline QRA
MANAGING RISK
DNV Reg. No.: 12LKQW5-2 Revision No.: 0 Date : 2010-05-18 Page 1
ATTACHMENTB
SENSITIVITY PREDICTIONS
- o0o -
For
insp
ectio
n pur
pose
s only
.
Conse
nt of
copy
right
owne
r req
uired
for a
ny ot
her u
se.
EPA Export 19-02-2014:23:34:01
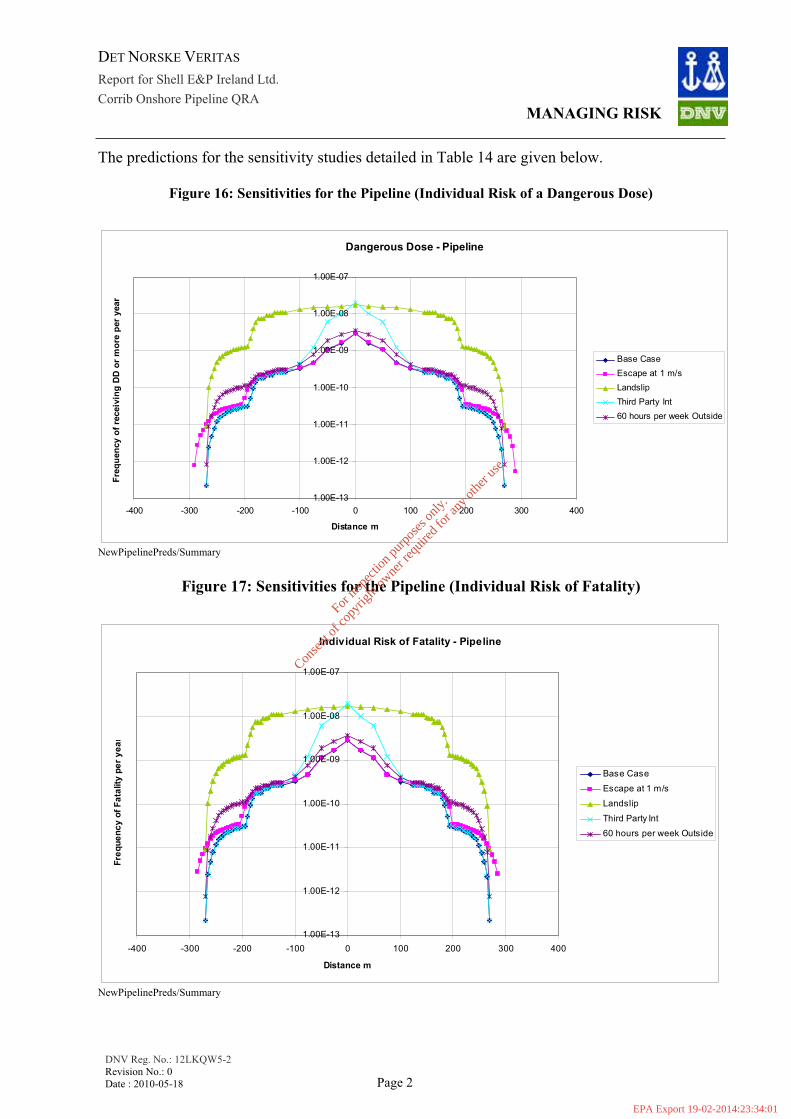
DET NORSKE VERITAS
Report for Shell E&P Ireland Ltd. Corrib Onshore Pipeline QRA
MANAGING RISK
DNV Reg. No.: 12LKQW5-2 Revision No.: 0 Date : 2010-05-18 Page 2
The predictions for the sensitivity studies detailed in Table 14 are given below.
Figure 16: Sensitivities for the Pipeline (Individual Risk of a Dangerous Dose)
Dangerous Dose - Pipeline
1.00E-13
1.00E-12
1.00E-11
1.00E-10
1.00E-09
1.00E-08
1.00E-07
-400 -300 -200 -100 0 100 200 300 400
Distance m
Freq
uenc
y of
rec
eivi
ng D
D o
r m
ore
per
year
Base Case
Escape at 1 m/s
Landslip
Third Party Int
60 hours per week Outside
NewPipelinePreds/Summary
Figure 17: Sensitivities for the Pipeline (Individual Risk of Fatality)
Individual Risk of Fatality - Pipeline
1.00E-13
1.00E-12
1.00E-11
1.00E-10
1.00E-09
1.00E-08
1.00E-07
-400 -300 -200 -100 0 100 200 300 400
Distance m
Freq
uenc
y of
Fat
ality
per
yea
r
Base Case
Escape at 1 m/s
Landslip
Third Party Int
60 hours per week Outside
NewPipelinePreds/Summary
For
insp
ectio
n pur
pose
s only
.
Conse
nt of
copy
right
owne
r req
uired
for a
ny ot
her u
se.
EPA Export 19-02-2014:23:34:01
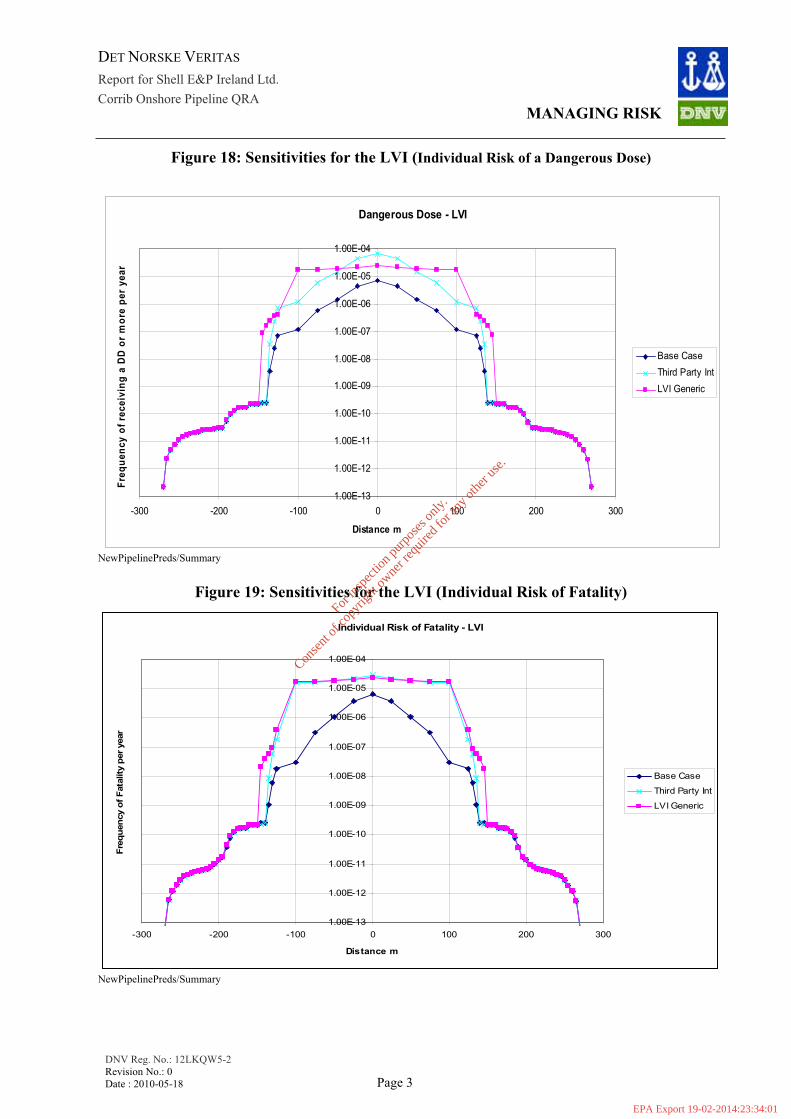
DET NORSKE VERITAS
Report for Shell E&P Ireland Ltd. Corrib Onshore Pipeline QRA
MANAGING RISK
DNV Reg. No.: 12LKQW5-2 Revision No.: 0 Date : 2010-05-18 Page 3
Figure 18: Sensitivities for the LVI (Individual Risk of a Dangerous Dose)
Dangerous Dose - LVI
1.00E-13
1.00E-12
1.00E-11
1.00E-10
1.00E-09
1.00E-08
1.00E-07
1.00E-06
1.00E-05
1.00E-04
-300 -200 -100 0 100 200 300
Distance m
Freq
uenc
y of
rec
eivi
ng a
DD
or m
ore
per y
ear
Base Case
Third Party Int
LVI Generic
NewPipelinePreds/Summary
Figure 19: Sensitivities for the LVI (Individual Risk of Fatality)
Individual Risk of Fatality - LVI
1.00E-13
1.00E-12
1.00E-11
1.00E-10
1.00E-09
1.00E-08
1.00E-07
1.00E-06
1.00E-05
1.00E-04
-300 -200 -100 0 100 200 300
Distance m
Freq
uenc
y of
Fat
ality
per
yea
r
Base Case
Third Party Int
LVI Generic
NewPipelinePreds/Summary
For
insp
ectio
n pur
pose
s only
.
Conse
nt of
copy
right
owne
r req
uired
for a
ny ot
her u
se.
EPA Export 19-02-2014:23:34:01

DET NORSKE VERITAS
Report for Shell E&P Ireland Ltd. Corrib Onshore Pipeline QRA
MANAGING RISK
DNV Reg. No.: 12LKQW5-2 Revision No.: 0 Date : 2010-05-18 Page 4
Table 20: Sensitivity Predictions (Individual Risk of Fatality)
Description IndividualRisk of fatality at the pipeline (per year)
IndividualRisk of fatality at 246m from the pipeline (per year)
IndividualRisk of fatality at the LVI(per year)
Distance to a risk of fatality of 3E-07 per year (m)
Base Case 2.18E-09 3.80E-12 Base Case 6.53E-06 76
Moving away at 1 m/s 2.19E-09 5.73E-12
LVIGeneric 2.47E-05 125
Landslip 3.84E-09 1.60E-10
Third Party IntentionalDamage 2.92E-05 125
Third Party IntentionalDamage 3.95E-09 3.80E-12
NewPipelinePreds/Summary
For
insp
ectio
n pur
pose
s only
.
Conse
nt of
copy
right
owne
r req
uired
for a
ny ot
her u
se.
EPA Export 19-02-2014:23:34:01
DET NORSKE VERITAS
Report for Shell E&P Ireland Ltd. Corrib Onshore Pipeline QRA
MANAGING RISK
DNV Reg. No.: 12LKQW5-2 Revision No.: 0 Date : 2010-05-18 Page 1
ATTACHMENTC
GAS DISPERSION PREDICTIONS
- o0o -
For
insp
ectio
n pur
pose
s only
.
Conse
nt of
copy
right
owne
r req
uired
for a
ny ot
her u
se.
EPA Export 19-02-2014:23:34:01
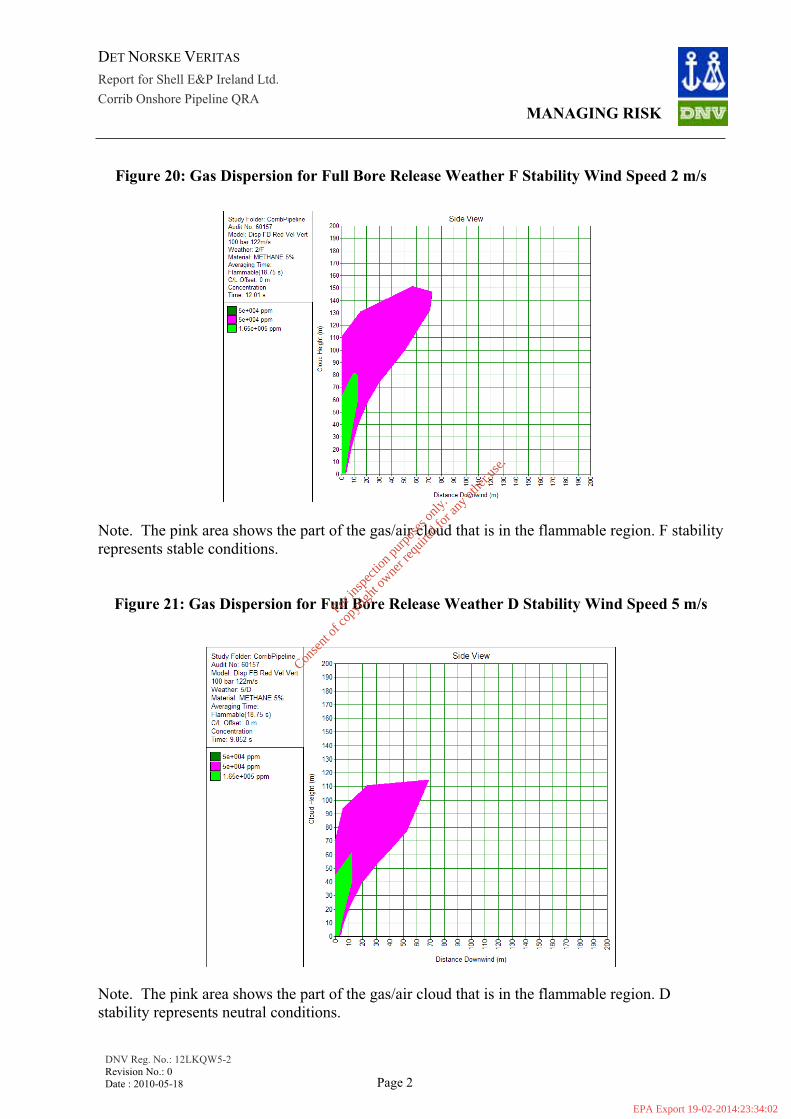
DET NORSKE VERITAS
Report for Shell E&P Ireland Ltd. Corrib Onshore Pipeline QRA
MANAGING RISK
DNV Reg. No.: 12LKQW5-2 Revision No.: 0 Date : 2010-05-18 Page 2
Figure 20: Gas Dispersion for Full Bore Release Weather F Stability Wind Speed 2 m/s
Note. The pink area shows the part of the gas/air cloud that is in the flammable region. F stability represents stable conditions.
Figure 21: Gas Dispersion for Full Bore Release Weather D Stability Wind Speed 5 m/s
Note. The pink area shows the part of the gas/air cloud that is in the flammable region. D stability represents neutral conditions.
For
insp
ectio
n pur
pose
s only
.
Conse
nt of
copy
right
owne
r req
uired
for a
ny ot
her u
se.
EPA Export 19-02-2014:23:34:02
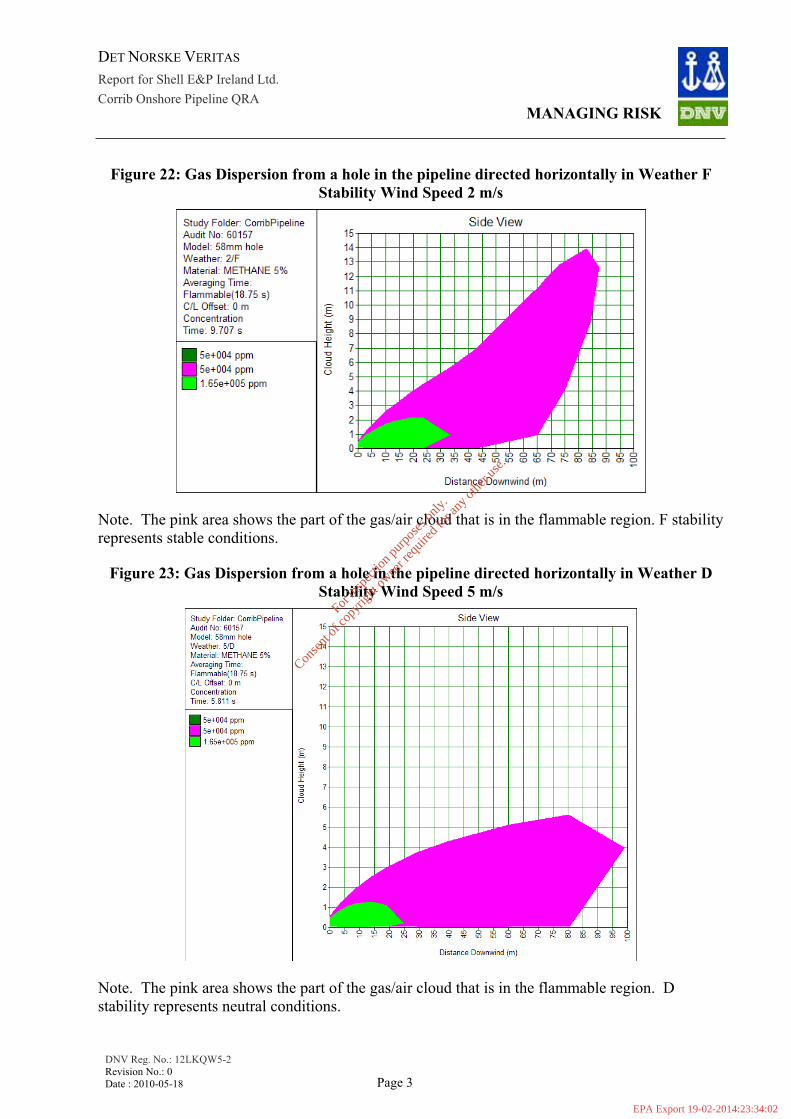
DET NORSKE VERITAS
Report for Shell E&P Ireland Ltd. Corrib Onshore Pipeline QRA
MANAGING RISK
DNV Reg. No.: 12LKQW5-2 Revision No.: 0 Date : 2010-05-18 Page 3
Figure 22: Gas Dispersion from a hole in the pipeline directed horizontally in Weather F Stability Wind Speed 2 m/s
Note. The pink area shows the part of the gas/air cloud that is in the flammable region. F stability represents stable conditions.
Figure 23: Gas Dispersion from a hole in the pipeline directed horizontally in Weather D Stability Wind Speed 5 m/s
Note. The pink area shows the part of the gas/air cloud that is in the flammable region. D stability represents neutral conditions.
For
insp
ectio
n pur
pose
s only
.
Conse
nt of
copy
right
owne
r req
uired
for a
ny ot
her u
se.
EPA Export 19-02-2014:23:34:02

DET NORSKE VERITAS
Det Norske Veritas:
Det Norske Veritas (DNV) is a leading, independent provider of services for managing risk with a global presence and a network of 300 offices in 100 different countries. DNV’s objective is to safeguard life, property and the environment.
DNV assists its customers in managing risk by providing three categories of service: classification, certification and consultancy. Since establishment as an independent foundation in 1864, DNV has become an internationally recognised provider of technical and managerial consultancy services and one of the world’s leading classification societies. This means continuously developing new approaches to health, safety, quality and environmental management, so businesses can run smoothly in a world full of surprises.
Global impact for a safe and sustainable future:
Learn more on www.dnv.com
For
insp
ectio
n pur
pose
s only
.
Conse
nt of
copy
right
owne
r req
uired
for a
ny ot
her u
se.
EPA Export 19-02-2014:23:34:02
SHELL E&P IRELAND LIMITED
CORRIB GAS FIELD DEVELOPMENT PROJECT
Q6.5(i) – Response To An Bord PleanálaRegarding The Query Raised In Section 3b of Letter
Dated 2nd November 2009DOCUMENT No: COR-14-SH-077
For in
spec
tion p
urpo
ses o
nly.
Conse
nt of
copy
right
owne
r req
uired
for a
ny ot
her u
se.
EPA Export 19-02-2014:23:34:02
Corrib Onshore Pipeline EIS Q6.5(i) - Response to An Bord Pleanála
COR-14-SH-077 i
TABLE OF CONTENTS
SUMMARY
1 BACKGROUND ......................................................................................................................... 12 INTRODUCTION ........................................................................................................................ 2
2.1 CONCLUSION OF THIS ANALYSIS........................................................................................ 2
3 INTERPRETATION OF AN BORD PLEANÁLA’S REQUEST ................................................. 43.1 INTERPRETATION OF AN BORD PLEANÁLA’S LETTER .......................................................... 4
4 BASIS OF CONSEQUENCE ANALYSIS .................................................................................. 54.1 EVENT SCENARIO ............................................................................................................ 5
4.1.1 Scenario Overview ........................................................................................... 5
4.1.2 Release Conditions .......................................................................................... 5
4.2 CONSEQUENCE ANALYSIS ................................................................................................ 6
4.2.1 Release Rate.................................................................................................... 7
4.2.2 Heat Radiated................................................................................................... 7
4.2.3 Consequential Effect Analysis.......................................................................... 8
4.3 CONSEQUENCE EVALUATION ............................................................................................ 8
4.3.1 Evaluation Criteria for Persons in the Open..................................................... 8
4.3.2 Evaluation Criteria for People Within Buildings.............................................. 10
5 APPLICATION OF ADOPTED CALCULATION BASIS ......................................................... 125.1 DETERMINING CASES..................................................................................................... 12
5.2 ADOPTED PARAMETERS & SENSITIVITIES ........................................................................ 14
5.3 PREDICTIONS FOR DETERMINING CASES......................................................................... 15
5.3.1 Outcome of Analysis....................................................................................... 15
5.3.2 Discussion of Predictions ............................................................................... 16
5.4 CONSEQUENCE CONTOUR DISTANCE.............................................................................. 17
ATTACHMENT A: CONTOUR PLOTS................................................................................................. 18REFERENCES ...................................................................................................................................... 27
LIST OF FIGURES
Fig. 4.1: Corrib Pipeline Pressure Regimes ................................................................................... 6
Fig. 4.2: Consequence Assessment............................................................................................... 6
Figure 5.1: Consequence Analysis: Determining Cases............................................................... 13
For
insp
ectio
n pur
pose
s only
.
Conse
nt of
copy
right
owne
r req
uired
for a
ny ot
her u
se.
EPA Export 19-02-2014:23:34:02
Corrib Onshore Pipeline EIS Q6.5(i) - Response to An Bord Pleanála
COR-14-SH-077 ii
LIST OF TABLES
Table 1: Summary of Key Predictions ............................................................................................. 3
Table 2: Determining Cases .......................................................................................................... 12
Table 3: Parameters and Sensitivity Studies used for the Consequence Analysis...................... 14
Table 4: Predictions for the Determining Cases............................................................................ 15
Table 5: Basis for Contour Plot of Consequence Distance ........................................................... 17
Table 6: Contours Plotted.............................................................................................................. 18
For
insp
ectio
n pur
pose
s only
.
Conse
nt of
copy
right
owne
r req
uired
for a
ny ot
her u
se.
EPA Export 19-02-2014:23:34:02

Corrib Onshore Pipeline EIS Q6.5(i) - Response to An Bord Pleanála
COR-14-SH-077 1
1 BACKGROUND
The key paragraphs extracted from letters received from An Bord Pleanála following the 2009 Oral Hearing are reproduced here to enable ready reference to the context of the request to address what An Bord Pleanála designate as ‘appropriate hazard distance’.
In the letter received from An Bord Pleanála dated 2nd November 2009 it was stated:
“[…..the Board should, therefore,] adopt a standard for the Corrib upstream untreated gas pipeline that the routing distance for proximity to a dwelling shall not be less than the appropriate hazard distance for the pipeline in the event of a pipeline failure. The appropriate hazard distance shall be calculated for the specific pipeline proposed such that a person at that distance from the pipeline would be safe in the event of a failure of the pipeline”.
An Bord Pleanála’s letter of 29th January 2010 in response to SEPIL’s request for clarification stated:
“..it is the intent of An Bord Pleanála to ensure that persons standing beside the dwellings will not receive a dangerous dose of thermal radiation in the worst case scenario of “full-bore rupture” of the pipeline at maximum pressure”.
This document addresses the above request from An Bord Pleanála.
For
insp
ectio
n pur
pose
s only
.
Conse
nt of
copy
right
owne
r req
uired
for a
ny ot
her u
se.
EPA Export 19-02-2014:23:34:02
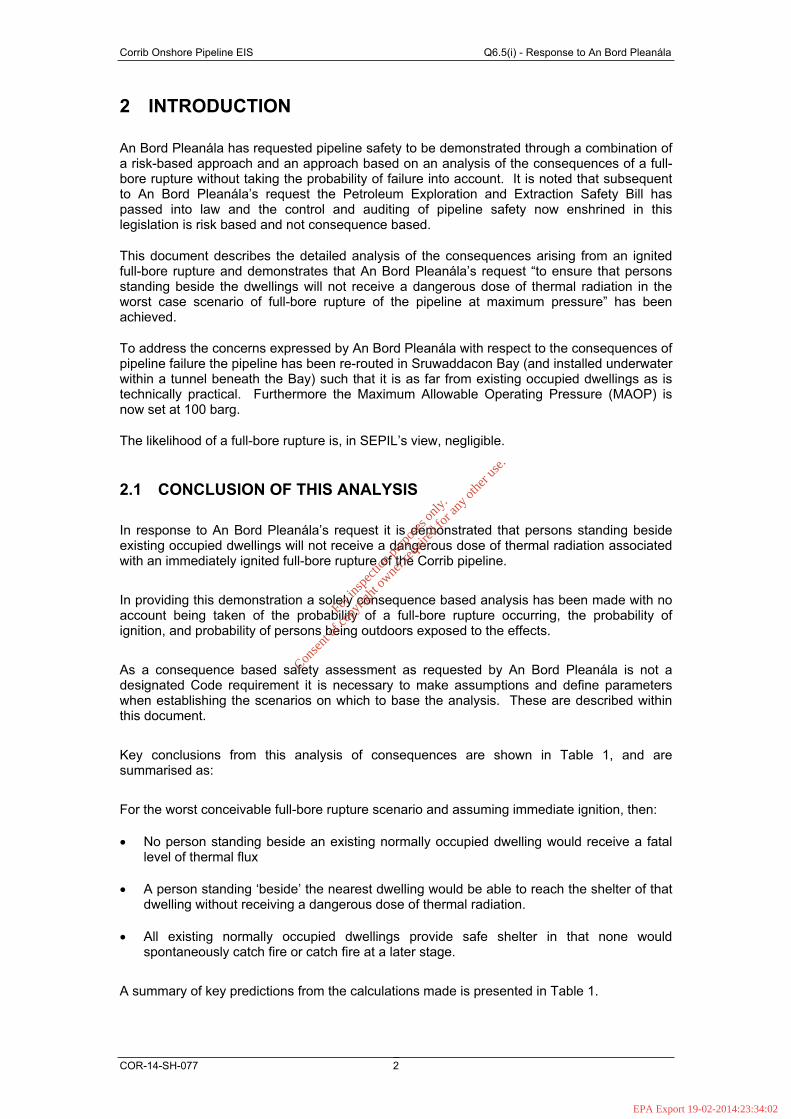
Corrib Onshore Pipeline EIS Q6.5(i) - Response to An Bord Pleanála
COR-14-SH-077 2
2 INTRODUCTION
An Bord Pleanála has requested pipeline safety to be demonstrated through a combination of a risk-based approach and an approach based on an analysis of the consequences of a full-bore rupture without taking the probability of failure into account. It is noted that subsequent to An Bord Pleanála’s request the Petroleum Exploration and Extraction Safety Bill has passed into law and the control and auditing of pipeline safety now enshrined in this legislation is risk based and not consequence based.
This document describes the detailed analysis of the consequences arising from an ignited full-bore rupture and demonstrates that An Bord Pleanála’s request “to ensure that persons standing beside the dwellings will not receive a dangerous dose of thermal radiation in the worst case scenario of full-bore rupture of the pipeline at maximum pressure” has been achieved.
To address the concerns expressed by An Bord Pleanála with respect to the consequences of pipeline failure the pipeline has been re-routed in Sruwaddacon Bay (and installed underwater within a tunnel beneath the Bay) such that it is as far from existing occupied dwellings as is technically practical. Furthermore the Maximum Allowable Operating Pressure (MAOP) is now set at 100 barg.
The likelihood of a full-bore rupture is, in SEPIL’s view, negligible.
2.1 CONCLUSION OF THIS ANALYSIS
In response to An Bord Pleanála’s request it is demonstrated that persons standing beside existing occupied dwellings will not receive a dangerous dose of thermal radiation associated with an immediately ignited full-bore rupture of the Corrib pipeline.
In providing this demonstration a solely consequence based analysis has been made with no account being taken of the probability of a full-bore rupture occurring, the probability of ignition, and probability of persons being outdoors exposed to the effects.
As a consequence based safety assessment as requested by An Bord Pleanála is not a designated Code requirement it is necessary to make assumptions and define parameters when establishing the scenarios on which to base the analysis. These are described within this document.
Key conclusions from this analysis of consequences are shown in Table 1, and are summarised as:
For the worst conceivable full-bore rupture scenario and assuming immediate ignition, then:
No person standing beside an existing normally occupied dwelling would receive a fatal level of thermal flux
A person standing ‘beside’ the nearest dwelling would be able to reach the shelter of that dwelling without receiving a dangerous dose of thermal radiation.
All existing normally occupied dwellings provide safe shelter in that none would spontaneously catch fire or catch fire at a later stage.
A summary of key predictions from the calculations made is presented in Table 1.
For
insp
ectio
n pur
pose
s only
.
Conse
nt of
copy
right
owne
r req
uired
for a
ny ot
her u
se.
EPA Export 19-02-2014:23:34:02
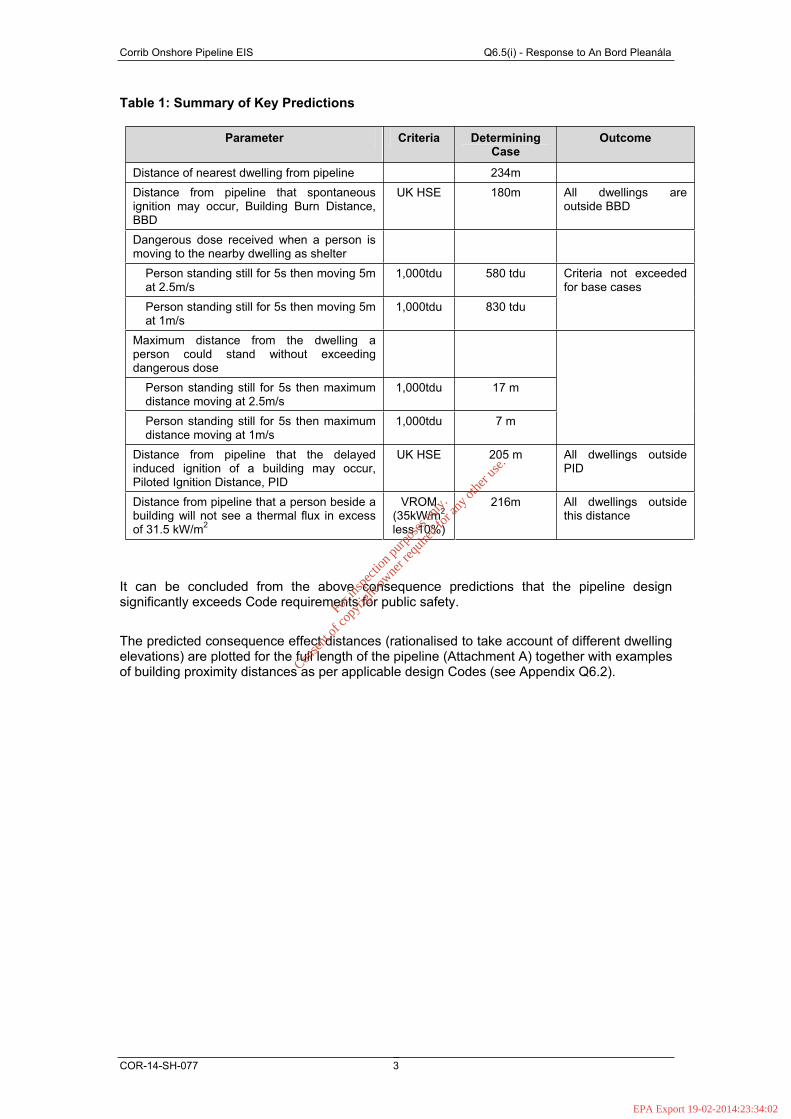
Corrib Onshore Pipeline EIS Q6.5(i) - Response to An Bord Pleanála
COR-14-SH-077 3
Table 1: Summary of Key Predictions
Parameter Criteria DeterminingCase
Outcome
Distance of nearest dwelling from pipeline 234m
Distance from pipeline that spontaneous ignition may occur, Building Burn Distance, BBD
UK HSE 180m All dwellings are outside BBD
Dangerous dose received when a person is moving to the nearby dwelling as shelter
Person standing still for 5s then moving 5m at 2.5m/s
1,000tdu 580 tdu
Person standing still for 5s then moving 5m at 1m/s
1,000tdu 830 tdu
Criteria not exceeded for base cases
Maximum distance from the dwelling a person could stand without exceeding dangerous dose
Person standing still for 5s then maximum distance moving at 2.5m/s
1,000tdu 17 m
Person standing still for 5s then maximum distance moving at 1m/s
1,000tdu 7 m
Distance from pipeline that the delayed induced ignition of a building may occur, Piloted Ignition Distance, PID
UK HSE 205 m All dwellings outside PID
Distance from pipeline that a person beside a building will not see a thermal flux in excess of 31.5 kW/m2
VROM(35kW/m2
less 10%)
216m All dwellings outside this distance
It can be concluded from the above consequence predictions that the pipeline design significantly exceeds Code requirements for public safety.
The predicted consequence effect distances (rationalised to take account of different dwelling elevations) are plotted for the full length of the pipeline (Attachment A) together with examples of building proximity distances as per applicable design Codes (see Appendix Q6.2).
For
insp
ectio
n pur
pose
s only
.
Conse
nt of
copy
right
owne
r req
uired
for a
ny ot
her u
se.
EPA Export 19-02-2014:23:34:02

Corrib Onshore Pipeline EIS Q6.5(i) - Response to An Bord Pleanála
COR-14-SH-077 4
3 INTERPRETATION OF AN BORD PLEANÁLA’S REQUEST
3.1 INTERPRETATION OF AN BORD PLEANÁLA’S LETTER
As An Bord Pleanála’s request does not relate to a defined Code requirement it is necessary to define the approach and key assumptions used in SEPIL’s response; this is outlined as follows:
‘Maximum pressure’ is taken as Maximum Allowable Operating Pressure, MAOP which is 100barg downstream of the Land Valve Installation, LVI, and 150barg upstream.
Consequence models are those used for the QRA (see Appendix Q6.4, sub-section 6.1).
The safety of persons beside dwellings is demonstrated for the nearest dwellings to the pipeline and to the LVI (for releases upstream of the LVI) on the basis that persons beside dwellings further away would also be safe.
It is assumed that persons standing beside dwellings would, after taking a short time to react, move directly to the dwelling to seek shelter from the heat radiated
It is demonstrated that all dwellings provide safe shelter
It is demonstrated that when persons beside the dwelling moves to that dwelling the initial intensity of the fireball does not prove fatal and in moving to the dwelling they do not receive a ‘dangerous dose of radiated heat’.
Subsequent sections of this document detail this approach, define the assumptions and parameters adopted, and present the outcome of the analysis.
For
insp
ectio
n pur
pose
s only
.
Conse
nt of
copy
right
owne
r req
uired
for a
ny ot
her u
se.
EPA Export 19-02-2014:23:34:02
Corrib Onshore Pipeline EIS Q6.5(i) - Response to An Bord Pleanála
COR-14-SH-077 5
4 BASIS OF CONSEQUENCE ANALYSIS
This Section identifies and describes the basic principles and parameters adopted in order to reply to An Bord Pleanála’s request.
4.1 EVENT SCENARIO
4.1.1 Scenario Overview
For the analysis of a full-bore rupture it is assumed that gas is released from the two open ends of the pipeline. The initial release would rapidly mix with air and create a rising vapour cloud that, if immediately ignited, becomes a fireball burning back to a crater fire. (If ignition is delayed beyond the initial release (greater than 15 seconds) this would result in a short-lived fire burning back to a crater fire). The crater fire would diminish over time as the pressure in the pipeline declines.
In the analysis of a full-bore rupture it is assumed that the gas is immediately ignited whereas, in reality, this would not always be the case and, indeed, for the section of pipeline in the tunnel under Sruwaddacon bay an ignition source cannot be present
4.1.2 Release Conditions
4.1.2.1 Maximum Pressure
For over 95% of the time during the first years of operation the pipeline will generally operate within the Normal Operating Pressure Profile shown in Figure 4.1. 4 - 7 years after start-up, depending on reservoir depletion, pipeline operating pressures will be reduced by some 30%, also at a reduced gas throughput.
The sub-sea wells are equipped with isolation valves designed to automatically shut such that 150 barg (MAOP upstream of LVI) is not exceeded. Similarly the onshore LVI is equipped with isolation valves that will automatically shut such that the MAOP downstream of the LVI of 100 barg is not exceeded. The pressure regimes are shown in Figure 4.1.
For
insp
ectio
n pur
pose
s only
.
Conse
nt of
copy
right
owne
r req
uired
for a
ny ot
her u
se.
EPA Export 19-02-2014:23:34:02
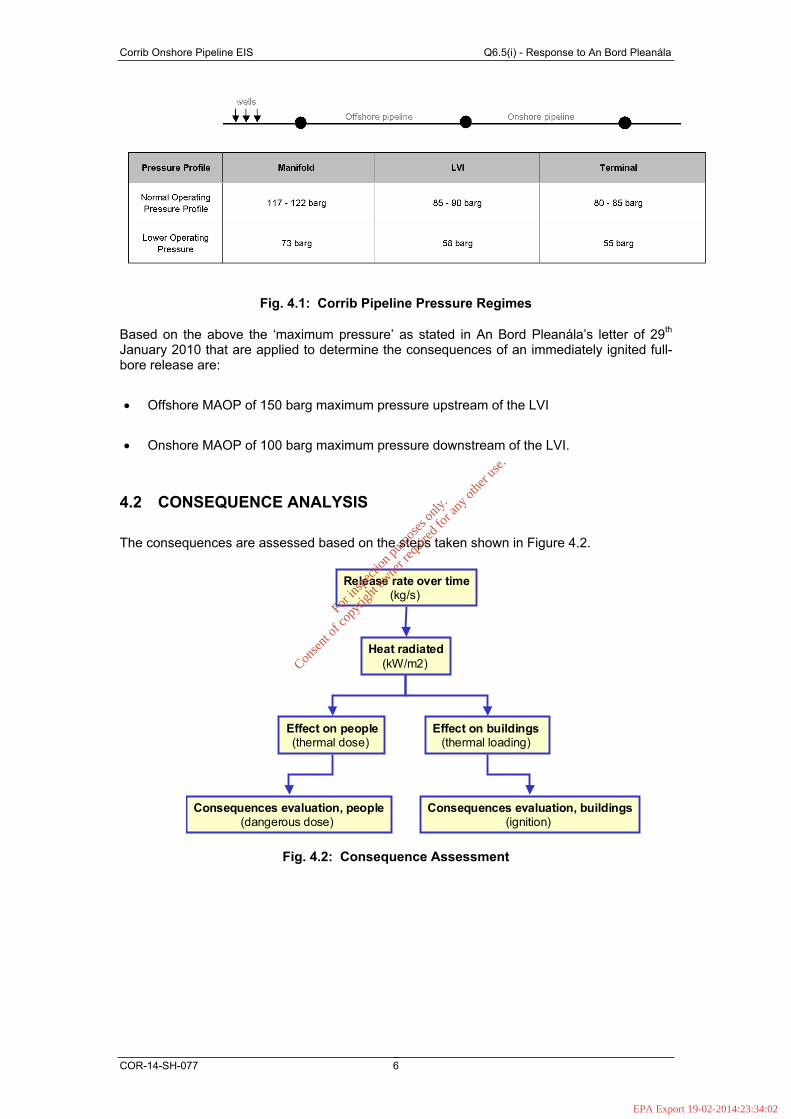
Corrib Onshore Pipeline EIS Q6.5(i) - Response to An Bord Pleanála
COR-14-SH-077 6
Fig. 4.1: Corrib Pipeline Pressure Regimes
Based on the above the ‘maximum pressure’ as stated in An Bord Pleanála’s letter of 29th
January 2010 that are applied to determine the consequences of an immediately ignited full-bore release are:
Offshore MAOP of 150 barg maximum pressure upstream of the LVI
Onshore MAOP of 100 barg maximum pressure downstream of the LVI.
4.2 CONSEQUENCE ANALYSIS
The consequences are assessed based on the steps taken shown in Figure 4.2.
Fig. 4.2: Consequence Assessment
Release rate over time(kg/s)
Heat radiated(kW/m2)
Effect on people(thermal dose)
Effect on buildings (thermal loading)
Consequences evaluation, people(dangerous dose)
Consequences evaluation, buildings(ignition)
For
insp
ectio
n pur
pose
s only
.
Conse
nt of
copy
right
owne
r req
uired
for a
ny ot
her u
se.
EPA Export 19-02-2014:23:34:02
Corrib Onshore Pipeline EIS Q6.5(i) - Response to An Bord Pleanála
COR-14-SH-077 7
4.2.1 Release Rate
The two worst release cases are:
Release Case 1:
A full-bore rupture assumed to be immediately upstream of the LVI at maximum pressure of 150barg.
Release Case 2:
A full-bore rupture assumed to take place anywhere downstream of the LVI just before the LVI closes. The maximum pressure applied for this case is the MAOP of 100barg (although the LVI valves would close at 99barg and settle out pressure would be less than 99barg).
Release Case 1, Upstream of the LVI at 150barg: The LVI must be closed for the upstream MAOP of 150 barg to be reached. Any rupture that would occur upstream of, and close to, the LVI at 150 barg would therefore release gas from the 83km of pipeline upstream of the rupture and the relatively small inventory of, say, 50m of pipeline between the rupture and the closed LVI. For this Case therefore, only the release from the upstream open end of the rupture is modelled.
Release Case 2: Downstream of the LVI at 100barg: A full-bore failure when the pipeline is approaching the downstream MAOP would release gas from the full length of the pipeline through both open ends of the rupture as the LVI would be open at the time of the rupture. The energy that would be released during a full-bore rupture would most probably destroy any signal cables, umbilicals etc. routed alongside the pipeline; the resultant cessation of the signal from the Bellanaboy Bridge Gas Terminal would cause the safety shutdown valves at the LVI to automatically close. Full closure would take some 12 seconds and, whilst this would not significantly reduce the fireball size or duration, it would significantly reduce the intensity and duration of the subsequent crater fire. No credit has been taken for this in the calculation of consequence distance.
The predicted release rate calculated for Case 2 is greater than that for Case 1, nevertheless the predictions from both Cases have been presented.
4.2.2 Heat Radiated
Consequence modelling of the physical effects arising from a full-bore release is carried out through the use of the DNV models as used in the QRA (see Appendix Q6.4).
It is conservatively assumed that the effects of the full-bore release from the section of the pipeline under Sruwaddacon Bay will be equivalent to those of the trenched pipeline.
Elevation is taken into account within the model as the degree of exposure to thermal radiation, which is a function of the area of the fireball being seen, increases with height. .
It is assumed that a wind of 5m/s would always be blowing from the rupture location towards the dwelling.
The model shows that the fireball provides the dominant contribution to heat radiated; the crater fire is less intense.
For
insp
ectio
n pur
pose
s only
.
Conse
nt of
copy
right
owne
r req
uired
for a
ny ot
her u
se.
EPA Export 19-02-2014:23:34:02
Corrib Onshore Pipeline EIS Q6.5(i) - Response to An Bord Pleanála
COR-14-SH-077 8
4.2.3 Consequential Effect Analysis
The basic premise adopted is that the “persons standing beside the dwellings” would move directly to the dwelling and take shelter such that:
1. The initial intensity of the fireball does not prove fatal.
2. When moving to the dwelling the persons do not receive a dangerous dose of radiated heat.
3. When sheltering behind or within the dwelling the building itself provides safe shelter (i.e. it does not catch fire before it is safe for persons to move away from the building).
It is assumed for the base case analysis that ‘persons standing beside the dwellings’ are standing 5m from the dwelling (i.e. they have to move 5m to reach shelter) and would move at 2.5m/s. It is also assumed for the base case that persons would take 5 seconds to react before moving to shelter. A sensitivity analysis is made applying 1m/s speed of movement and 5 seconds reaction time. For both the analyses based on 2.5m/s and 1m/s speed of movement the maximum distance a person could be away from the dwelling without receiving a dangerous dose is derived.
The selection of 5m distance from the dwelling provides a purely arbitrary start-point for the analysis. The use of 2.5m/s and 1m/s speed of movement to safety stems from the UK HSE. [1]
4.3 CONSEQUENCE EVALUATION
Thermal loading criteria adopted by the UK Health & Safety Executive [1] and the Dutch Ministry of Housing, Spatial Planning and the Environment [2] for people in the open and people within buildings are used here as the basis for consequence evaluation. These criteria are selected because they are well documented, mature in their application, and consistent with the criteria suggested by An Bord Pleanála within their correspondence.
It is noted that it is not normal practice to apply these criteria to evaluate absolute measures of consequence as a basis for establishing safe proximity distances. These criteria are primarily used in combination with a frequency of ignited release events within a QRA to provide a consistent basis for determining potential loss of life or injury per scenario. This has the advantage of achieving consistency within and between studies thus enabling valid comparisons of major accident risks for different facilities.
4.3.1 Evaluation Criteria for Persons in the Open
Evaluation criteria are required to enable an assessment of how a person in the open may be impacted by the initial intensity of the fireball and thermal dose received until safe shelter is reached or on leaving shelter that may catch fire.
4.3.1.1 Initial Thermal Loading
For
insp
ectio
n pur
pose
s only
.
Conse
nt of
copy
right
owne
r req
uired
for a
ny ot
her u
se.
EPA Export 19-02-2014:23:34:02

Corrib Onshore Pipeline EIS Q6.5(i) - Response to An Bord Pleanála
COR-14-SH-077 9
The rule-set adopted for the QRA is that persons exposed to a 35kW/m2 thermal flux become fatalities. The value of 35 kW/m2 is applied within the Purple Book [2]. (The Purple Book also allows people subject to thermal flux lower than 35 kW/m2 to escape).
For the calculation of consequence distance as adopted by An Bord Pleanála consideration has been given as to how to address the cut-off point inherent in determining if a person receives a 35kW/m2 thermal loading or not. In the absence of any known precedence within consequence analyses that can be used as a reference a conservative basis has been adopted here that only allows persons to move to safe shelter when the maximum thermal flux seen by the person beside the dwelling does not exceed 31.5kW/m2 (i.e. 35kW/m2 less 10%). Any thermal flux received by a person beside the dwelling that is higher than 31.5kW/m2 is therefore considered as not meeting An Bord Pleanála's criteria.
For
insp
ectio
n pur
pose
s only
.
Conse
nt of
copy
right
owne
r req
uired
for a
ny ot
her u
se.
EPA Export 19-02-2014:23:34:02

Corrib Onshore Pipeline EIS Q6.5(i) - Response to An Bord Pleanála
COR-14-SH-077 10
4.3.1.2 Dangerous Dose
The concept of ‘dangerous dose’, measured in Thermal Dose Units, tdu, is adopted by the UK HSE. This measure is used to determine the effect of thermal radiation on a person who is moving. It indicates that the effect of thermal radiation on an exposed person depends on both the level of thermal radiation and the duration of exposure.
The paper Thermal Radiation Criteria Used In Pipeline Risk Assessment [1] states that: “The UK HSE opted for a dangerous dose defined as 1000 tdu for a normal population and 500 tdu for particularly vulnerable people. These criteria are based on the assumption that the exposed people are clothed normally and in the open”. This analysis is based on a person receiving a Dangerous Dose if they receive a dose of 1,000 tdu or greater whilst moving to the building.
4.3.2 Evaluation Criteria for People Within Buildings
The methodology used by the UK HSE [1] assumes that people who are indoors are fully protected from any thermal radiation if the building they occupy does not catch fire. Buildings will ignite if their outer combustible parts catch fire, and this may occur by either of two mechanisms, spontaneous ignition or piloted ignition.
Spontaneous ignition occurs if the incident thermal radiation flux on the building is sufficiently high to ignite combustible material; put simply, the absolute amount of radiated heat generated in the early phase of the fire is sufficient to ignite the fabric of the building should that building be close enough. The term Building Burn Distance, BBD, is used in this analysis to define the closest a building can be to the pipeline without spontaneously igniting. This is a conservative metric based on experiments on the ignition of American white wood. Buildings adjacent to the Corrib pipeline are predominantly stone or brick walled with tiled or slate roofing and therefore would not be expected to spontaneously ignite at the predicted BBD.
Piloted ignition occurs if a building does not spontaneously ignite but over time the building is heated to the point when the fabric of the building would catch fire if induced by a source of flame such as a burning ember or brand. The UK HSE adopt the term Piloted Ignition Distance, PID, again this is a conservative metric used within a QRA based on experiments carried out with American white wood.
The evaluation criteria used within the Corrib Pipeline QRA (i.e. where the likelihood of an unwanted event is also taken into account) to determine the number of potential fatalities for each event scenario are:
For buildings located inside the BBD the building is assumed to ignite, and people initially inside the building will need to leave the building and seek shelter further away from the pipeline in order to survive and in doing so receive less than a dangerous dose of thermal radiation.
For buildings between the BBD and PID the building may ignite at a later stage, and in this case people will need to leave the building and seek shelter further away from the pipeline and in doing so receive less than a dangerous dose of thermal radiation. .
People sheltering within buildings outside the PID are fully protected from thermal radiation.
For
insp
ectio
n pur
pose
s only
.
Conse
nt of
copy
right
owne
r req
uired
for a
ny ot
her u
se.
EPA Export 19-02-2014:23:34:02

Corrib Onshore Pipeline EIS Q6.5(i) - Response to An Bord Pleanála
COR-14-SH-077 11
Conservatively therefore (given that the above criteria are based on buildings constructed of American white wood) the evaluation criteria adopted in this response to An Bord Pleanála request are:
No building shall be within the Building Burn Distance
For a building to be guaranteed to provide safe shelter then that building shall not be within the Piloted Ignition Distance.
Should any buildings between the BBD and PID catch fire then any dose of thermal radiation received by persons leaving the building in addition to the dose received moving to the building, would be taken into account in their total dose received.
For
insp
ectio
n pur
pose
s only
.
Conse
nt of
copy
right
owne
r req
uired
for a
ny ot
her u
se.
EPA Export 19-02-2014:23:34:02

Corrib Onshore Pipeline EIS Q6.5(i) - Response to An Bord Pleanála
COR-14-SH-077 12
5 APPLICATION OF ADOPTED CALCULATION BASIS
The previous Section identified and described the assumptions and parameters adopted. This Section describes the Corrib pipeline-specific application of the adopted assumptions and parameters the steps being:
1. Section 5.1: Describes the determining cases (the dwellings potentially most exposed to Release Cases 1 and 2)
2. Section 5.2: Tabulates the assigned values of parameters used for base case and sensitivity studies
3. Section 5.3: Presents the predictions for determining cases
4. Section 5.4: Tabulates the basis for the consequence distance contour plots provided in Attachment A.
5.1 DETERMINING CASES
Two groups of dwellings (A and B) are identified as determining. Refer Figure 5.1:
Group A: Closest to the LVI and therefore closest to a full-bore rupture upstream of the LVI (Release Case 1).
Group B: South of the Bay and closest to the pipeline, and therefore closest to a full-bore rupture when LVI is open (Release Case 2).
Table 1 provides the dimensions used as input to this consequence analysis.
Table 2: Determining Cases
Determining Cases
Dwelling Group
Distance to Pipeline
Distance to LVI
Elevation above msl
Release Case Applied
A (246m1)) 280 +25m Case 1
B 234m 2) (Approx 900m 3))
+38m Case 2
Notes:
1) Distance to pipeline downstream of the LVI (Group B dwellings are closer and at higher elevation and therefore provide the determining case)
2) The distance to the pipeline from the closest dwelling is 242m +/- 8m, which gives an actual minimum distance of 234m. A distance of 230m is used to model the determining case.
3) Group A is the determining case for the consequences arising from any release upstream of the LVI.
For
insp
ectio
n pur
pose
s only
.
Conse
nt of
copy
right
owne
r req
uired
for a
ny ot
her u
se.
EPA Export 19-02-2014:23:34:02
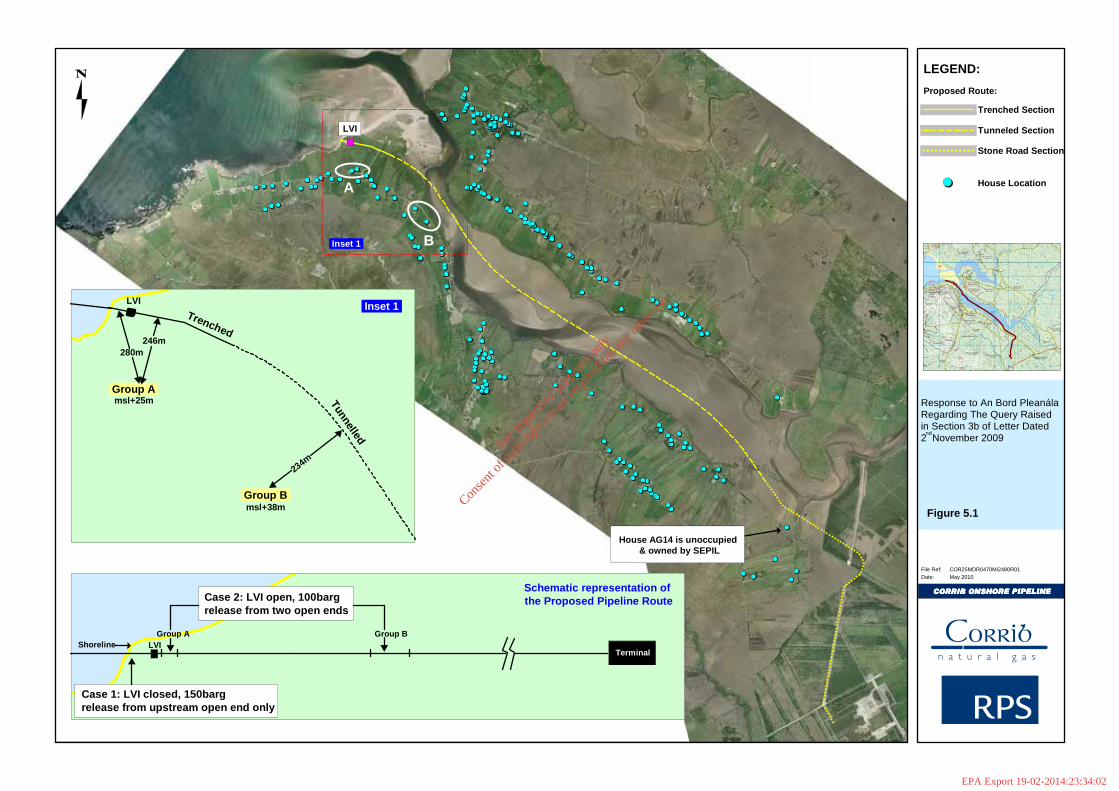
B
A
Response to An Bord Pleanála Regarding The Query Raisedin Section 3b of Letter Dated2 November 2009
COR25MDR0470Mi2480R01
CORRIB ONSHORE PIPELINECORRIB ONSHORE PIPELINECORRIB ONSHORE PIPELINECORRIB ONSHORE PIPELINE
File Ref:May 2010Date:
House Location
Proposed Route:
LEGEND:
Group A
Group B
Tunnelled
Trenched
LVI
House AG14 is unoccupied & owned by SEPIL
House AG14 is unoccupied & owned by SEPIL
msl+25m
msl+38m
Inset 1
Terminal
Group BGroup ALVIShoreline
Case 2: LVI open, 100bargrelease from two open ends
� �
Case 1: LVI closed, 150bargrelease from upstream open end only
�
Schematic representation of the Proposed Pipeline Route
280m246m
234m
LVI
Inset 1
Trenched Section
Tunneled Section
Stone Road Section
nd
Figure 5.1
For
insp
ectio
n pur
pose
s only
.
Conse
nt of
copy
right
owne
r req
uired
for a
ny ot
her u
se.
EPA Export 19-02-2014:23:34:02
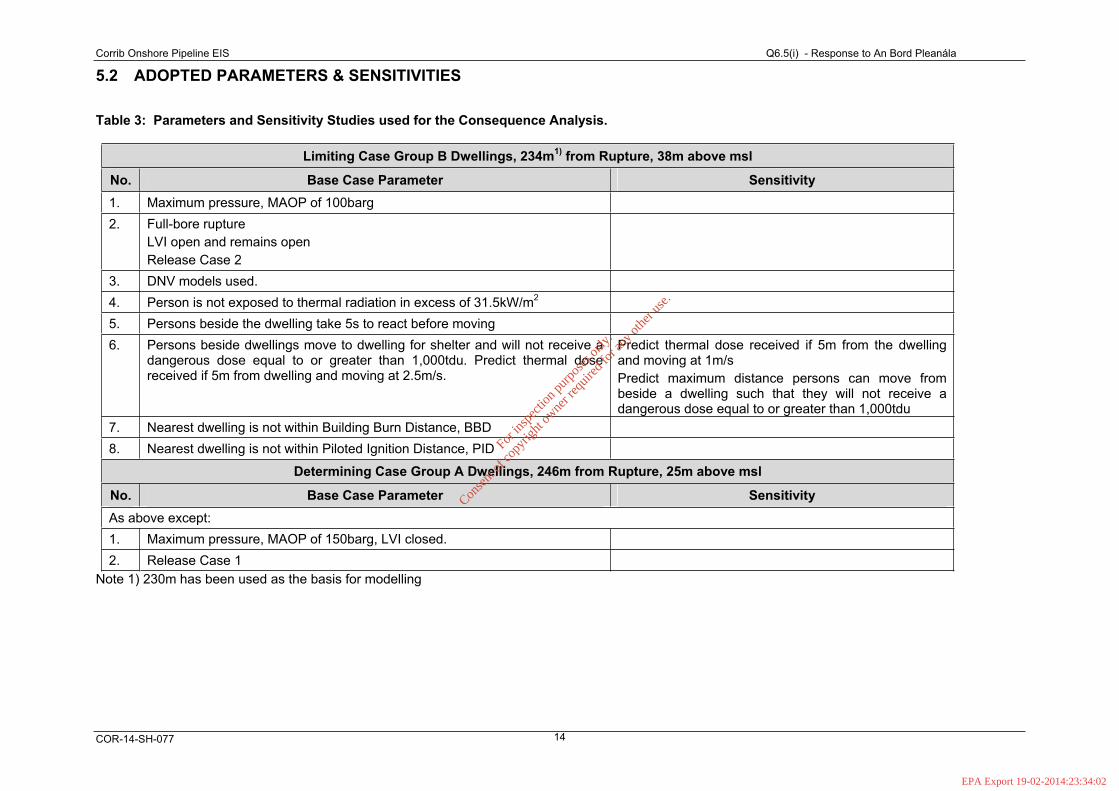
Corrib Onshore Pipeline EIS Q6.5(i) - Response to An Bord Pleanála
COR-14-SH-077 14
5.2 ADOPTED PARAMETERS & SENSITIVITIES
Table 3: Parameters and Sensitivity Studies used for the Consequence Analysis.
Limiting Case Group B Dwellings, 234m1) from Rupture, 38m above msl
No. Base Case Parameter Sensitivity 1. Maximum pressure, MAOP of 100barg
2. Full-bore rupture LVI open and remains open Release Case 2
3. DNV models used.
4. Person is not exposed to thermal radiation in excess of 31.5kW/m2
5. Persons beside the dwelling take 5s to react before moving
6. Persons beside dwellings move to dwelling for shelter and will not receive a dangerous dose equal to or greater than 1,000tdu. Predict thermal dose received if 5m from dwelling and moving at 2.5m/s.
Predict thermal dose received if 5m from the dwelling and moving at 1m/s Predict maximum distance persons can move from beside a dwelling such that they will not receive a dangerous dose equal to or greater than 1,000tdu
7. Nearest dwelling is not within Building Burn Distance, BBD
8. Nearest dwelling is not within Piloted Ignition Distance, PID
Determining Case Group A Dwellings, 246m from Rupture, 25m above msl
No. Base Case Parameter Sensitivity As above except:
1. Maximum pressure, MAOP of 150barg, LVI closed.
2. Release Case 1
Note 1) 230m has been used as the basis for modelling
For
insp
ectio
n pur
pose
s only
.
Conse
nt of
copy
right
owne
r req
uired
for a
ny ot
her u
se.
EPA Export 19-02-2014:23:34:02
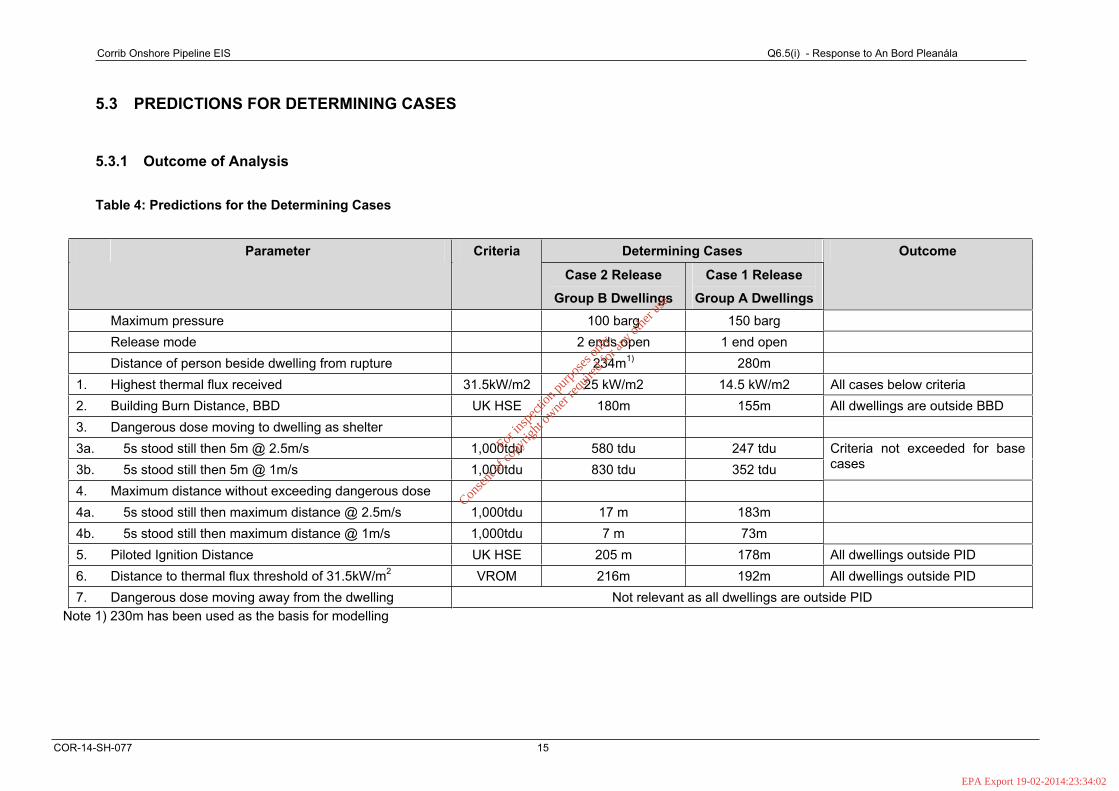
COR-14-SH-077 15
5.3 PREDICTIONS FOR DETERMINING CASES
5.3.1 Outcome of Analysis
Table 4: Predictions for the Determining Cases
Determining Cases Parameter Criteria
Case 2 Release
Group B Dwellings
Case 1 Release
Group A Dwellings
Outcome
Maximum pressure 100 barg 150 barg
Release mode 2 ends open 1 end open
Distance of person beside dwelling from rupture 234m1) 280m
1. Highest thermal flux received 31.5kW/m2 25 kW/m2 14.5 kW/m2 All cases below criteria
2. Building Burn Distance, BBD UK HSE 180m 155m All dwellings are outside BBD
3. Dangerous dose moving to dwelling as shelter
3a. 5s stood still then 5m @ 2.5m/s 1,000tdu 580 tdu 247 tdu
3b. 5s stood still then 5m @ 1m/s 1,000tdu 830 tdu 352 tdu
Criteria not exceeded for base cases
4. Maximum distance without exceeding dangerous dose
4a. 5s stood still then maximum distance @ 2.5m/s 1,000tdu 17 m 183m
4b. 5s stood still then maximum distance @ 1m/s 1,000tdu 7 m 73m
5. Piloted Ignition Distance UK HSE 205 m 178m All dwellings outside PID
6. Distance to thermal flux threshold of 31.5kW/m2 VROM 216m 192m All dwellings outside PID
7. Dangerous dose moving away from the dwelling Not relevant as all dwellings are outside PID
Note 1) 230m has been used as the basis for modelling
Corrib Onshore Pipeline EIS Q6.5(i) - Response to An Bord Pleanála
For
insp
ectio
n pur
pose
s only
.
Conse
nt of
copy
right
owne
r req
uired
for a
ny ot
her u
se.
EPA Export 19-02-2014:23:34:02

Corrib Onshore Pipeline EIS Q6.5(i) - Response to An Bord Pleanála
COR-14-SH-077 16
5.3.2 Discussion of Predictions
The key outcomes are:
Case 1 (150barg upstream of LVI, LVI closed) release has less severe consequences than Case 2 (100barg, LVI open)
For Case 2 releases:
No normally occupied dwellings fall within the Building Burn Distance.
No normally occupied dwellings fall within the Piloted Ignition Distance thus all such buildings can be regarded as safe shelter in the event of an immediately ignited full-bore rupture.
No person beside a dwelling would receive a fatal level of thermal flux
A person standing ‘beside’ the nearest dwelling and 5m from the dwelling would be able to reach safe shelter without receiving a dangerous dose of thermal radiation.
Sensitivity studies with respect to the latter demonstrate that persons beside a dwelling moving at a speed of 2.5m/s towards the dwelling can be 17m away and a person moving at a speed of 1m/s 7m away.
For
insp
ectio
n pur
pose
s only
.
Conse
nt of
copy
right
owne
r req
uired
for a
ny ot
her u
se.
EPA Export 19-02-2014:23:34:02
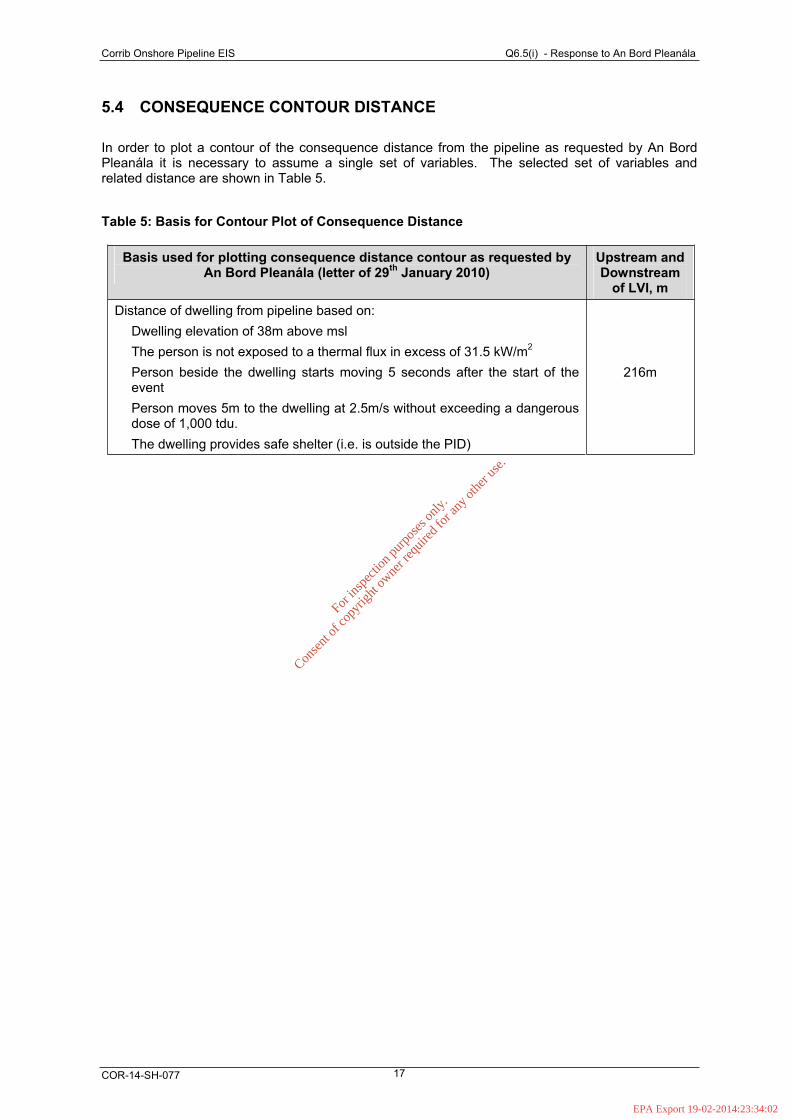
Corrib Onshore Pipeline EIS Q6.5(i) - Response to An Bord Pleanála
COR-14-SH-077 17
5.4 CONSEQUENCE CONTOUR DISTANCE
In order to plot a contour of the consequence distance from the pipeline as requested by An Bord Pleanála it is necessary to assume a single set of variables. The selected set of variables and related distance are shown in Table 5.
Table 5: Basis for Contour Plot of Consequence Distance
Basis used for plotting consequence distance contour as requested by An Bord Pleanála (letter of 29th January 2010)
Upstream and Downstream
of LVI, m Distance of dwelling from pipeline based on:
Dwelling elevation of 38m above msl
The person is not exposed to a thermal flux in excess of 31.5 kW/m2
Person beside the dwelling starts moving 5 seconds after the start of the event
Person moves 5m to the dwelling at 2.5m/s without exceeding a dangerous dose of 1,000 tdu.
The dwelling provides safe shelter (i.e. is outside the PID)
216m
For
insp
ectio
n pur
pose
s only
.
Conse
nt of
copy
right
owne
r req
uired
for a
ny ot
her u
se.
EPA Export 19-02-2014:23:34:02
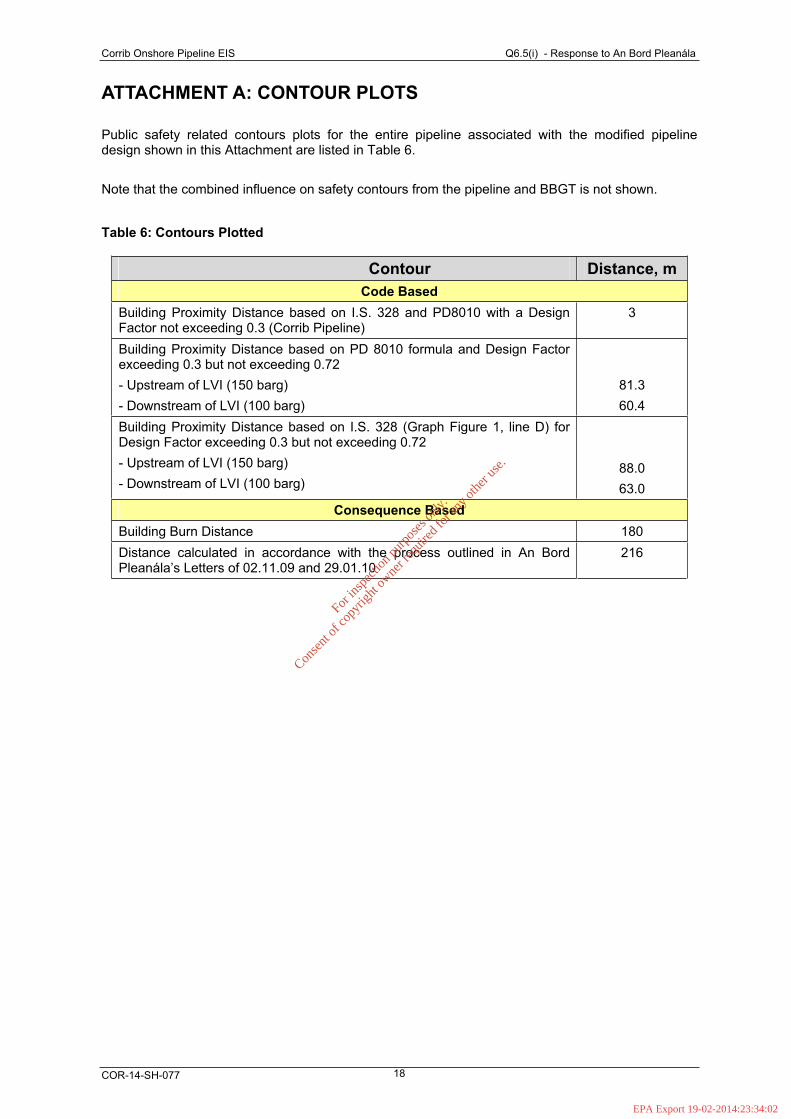
Corrib Onshore Pipeline EIS Q6.5(i) - Response to An Bord Pleanála
COR-14-SH-077 18
ATTACHMENT A: CONTOUR PLOTS
Public safety related contours plots for the entire pipeline associated with the modified pipeline design shown in this Attachment are listed in Table 6.
Note that the combined influence on safety contours from the pipeline and BBGT is not shown.
Table 6: Contours Plotted
Contour Distance, m Code Based
Building Proximity Distance based on I.S. 328 and PD8010 with a Design Factor not exceeding 0.3 (Corrib Pipeline)
3
Building Proximity Distance based on PD 8010 formula and Design Factor exceeding 0.3 but not exceeding 0.72
- Upstream of LVI (150 barg)
- Downstream of LVI (100 barg)
81.3
60.4
Building Proximity Distance based on I.S. 328 (Graph Figure 1, line D) for Design Factor exceeding 0.3 but not exceeding 0.72
- Upstream of LVI (150 barg)
- Downstream of LVI (100 barg) 88.0
63.0
Consequence Based Building Burn Distance 180
Distance calculated in accordance with the process outlined in An Bord Pleanála’s Letters of 02.11.09 and 29.01.10
216
For
insp
ectio
n pur
pose
s only
.
Conse
nt of
copy
right
owne
r req
uired
for a
ny ot
her u
se.
EPA Export 19-02-2014:23:34:02
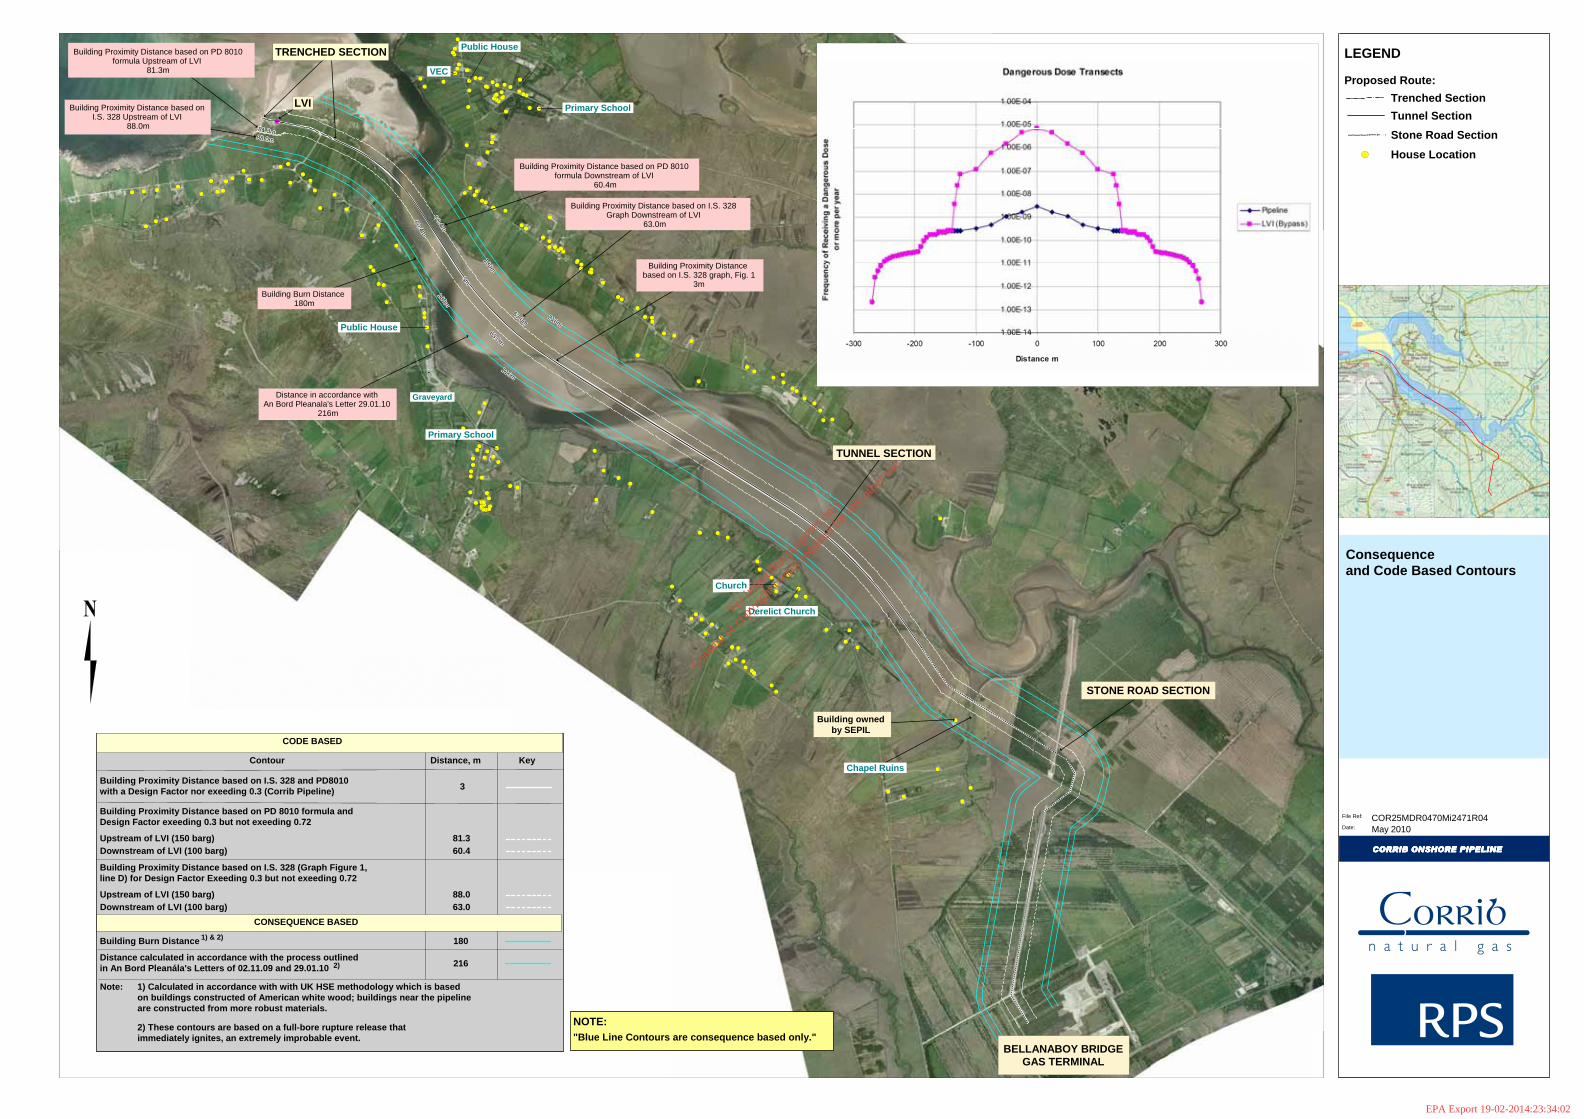
Consequence and Code Based Contours
CORRIB ONSHORE PIPELINECORRIB ONSHORE PIPELINECORRIB ONSHORE PIPELINECORRIB ONSHORE PIPELINE
File Ref:
May 2010Date:
216m216m216m216m216m216m216m216m216m
216m216m216m216m216m216m216m216m216m
180m180m180m180m180m180m180m180m180m
180m180m180m180m180m180m180m180m180m
60.4m60.4m60.4m60.4m60.4m60.4m60.4m60.4m60.4m
3m3m3m3m3m3m3m3m3m
60.4m60.4m60.4m60.4m60.4m60.4m60.4m60.4m60.4m
81.3m81.3m81.3m81.3m81.3m81.3m81.3m81.3m81.3m
63.0m63.0m63.0m63.0m63.0m63.0m63.0m63.0m63.0m
63.0m63.0m63.0m63.0m63.0m63.0m63.0m63.0m63.0m
88.0m88.0m88.0m88.0m88.0m88.0m88.0m88.0m88.0m
Primary School
Public House
Primary School
Church
Derelict Church
VEC
Public House LEGEND
Proposed Route:
House Location
TUNNEL SECTION
LVI
STONE ROAD SECTION
BELLANABOY BRIDGEGAS TERMINAL
Building Proximity Distance based on I.S. 328 graph, Fig. 1
3m
Building Proximity Distance based on PD 8010 formula Downstream of LVI 60.4m
Building Burn Distance 180m
Safe Distance in accordance with An Bord Pleanala's Letter 29.01.10
205m
COR25MDR0470Mi2471R04
iii
Graveyard
Chapel Ruins
Trenched Section
Tunnel Section
Stone Road Section
TRENCHED SECTIONTRENCHED SECTIONTRENCHED SECTION
LVI
Building Burn Distance 180m
Distance in accordance with An Bord Pleanala's Letter 29.01.10
216m
STONE ROAD SECTION
TUNNEL SECTION
Building Proximity Distance based on I.S. 328 graph, Fig. 1
3m
Building Proximity Distance based on PD 8010 formula Downstream of LVI
60.4m
Building owned by SEPIL
Building owned by SEPIL
Contour
Building Proximity Distance based on I.S. 328 and PD8010 with a Design Factor nor exeeding 0.3 (Corrib Pipeline)
Distance, m Key
3
Building Proximity Distance based on PD 8010 formula andDesign Factor exeeding 0.3 but not exeeding 0.72
Upstream of LVI (150 barg)Downstream of LVI (100 barg)
81.360.4
Building Burn Distance
Distance calculated in accordance with the process outlinedin An Bord Pleanála's Letters of 02.11.09 and 29.01.10
Note:
180
216
NOTE: "Blue Line Contours are consequence based only."
CODE BASED
CONSEQUENCE BASED
1) Calculated in accordance with with UK HSE methodology which is basedon buildings constructed of American white wood; buildings near the pipeline are constructed from more robust materials.
Building Proximity Distance based on I.S. 328 (Graph Figure 1, line D) for Design Factor Exeeding 0.3 but not exeeding 0.72
Upstream of LVI (150 barg)Downstream of LVI (100 barg)
88.063.0
1) & 2)
2)
2) These contours are based on a full-bore rupture release that immediately ignites, an extremely improbable event.
Building Proximity Distance based on PD 8010 formula Downstream of LVI 60.4m
Building Proximity Distance based on I.S. 328 Graph Downstream of LVI
63.0m
Building Proximity Distance based on PD 8010formula Upstream of LVI 81.3m
Building Proximity Distance based on PD 8010formula Upstream of LVI
81.3m
Building Proximity Distance based on I.S. 328 Upstream of LVI
88.0m
Building Proximity Distance based on I.S. 328 Upstream of LVI
88.0m
For
insp
ectio
n pur
pose
s only
.
Conse
nt of
copy
right
owne
r req
uired
for a
ny ot
her u
se.
EPA Export 19-02-2014:23:34:02
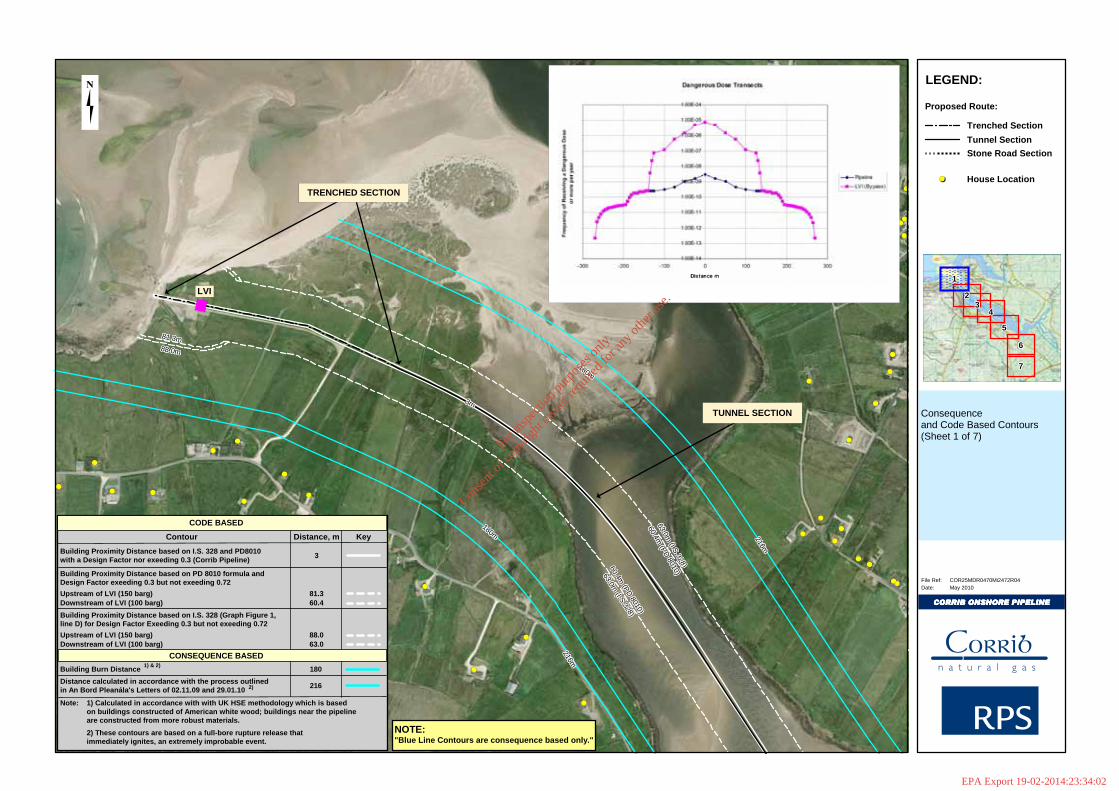
180m180m180m180m180m180m180m180m180m
216m216m216m216m216m216m216m216m216m
180m180m180m180m180m180m180m180m180m
216m216m216m216m216m216m216m216m216m
3m3m3m3m3m3m3m3m3m
81.3m81.3m81.3m81.3m81.3m81.3m81.3m81.3m81.3m88.0m88.0m88.0m88.0m88.0m88.0m88.0m88.0m88.0m
63.0m(I.S.328)
63.0m(I.S.328)
63.0m(I.S.328)
63.0m(I.S.328)
63.0m(I.S.328)
63.0m(I.S.328)
63.0m(I.S.328)
63.0m(I.S.328)
63.0m(I.S.328)
60.4m(P
D8010)
60.4m(P
D8010)
60.4m(P
D8010)
60.4m(P
D8010)
60.4m(P
D8010)
60.4m(P
D8010)
60.4m(P
D8010)
60.4m(P
D8010)
60.4m(P
D8010)
60.4m(PD
8010)
60.4m(PD
8010)
60.4m(PD
8010)
60.4m(PD
8010)
60.4m(PD
8010)
60.4m(PD
8010)
60.4m(PD
8010)
60.4m(PD
8010)
60.4m(PD
8010)
63.0m(I.S.328)
63.0m(I.S.328)
63.0m(I.S.328)
63.0m(I.S.328)
63.0m(I.S.328)
63.0m(I.S.328)
63.0m(I.S.328)
63.0m(I.S.328)
63.0m(I.S.328)
Public House VEC
Consequence and Code Based Contours(Sheet 1 of 7)
COR25MDR0470Mi2472R04
CORRIB ONSHORE PIPELINECORRIB ONSHORE PIPELINECORRIB ONSHORE PIPELINECORRIB ONSHORE PIPELINE
File Ref:May 2010Date:
LEGEND:
222222222333333333
444444444
555555555
666666666
777777777
111111111
House Location
Proposed Route:
TUNNEL SECTION
Trenched Section
Tunnel Section
Stone Road Section
TRENCHED SECTIONTRENCHED SECTION
LVI
TRENCHED SECTION
TUNNEL SECTION
Contour
Building Proximity Distance based on I.S. 328 and PD8010 with a Design Factor nor exeeding 0.3 (Corrib Pipeline)
Distance, m Key
3
Building Proximity Distance based on PD 8010 formula andDesign Factor exeeding 0.3 but not exeeding 0.72
Upstream of LVI (150 barg)Downstream of LVI (100 barg)
81.360.4
Building Burn Distance
Distance calculated in accordance with the process outlinedin An Bord Pleanála's Letters of 02.11.09 and 29.01.10
Note:
180
216
NOTE: "Blue Line Contours are consequence based only."
CODE BASED
CONSEQUENCE BASED
1) Calculated in accordance with with UK HSE methodology which is basedon buildings constructed of American white wood; buildings near the pipeline are constructed from more robust materials.
Building Proximity Distance based on I.S. 328 (Graph Figure 1, line D) for Design Factor Exeeding 0.3 but not exeeding 0.72
Upstream of LVI (150 barg)Downstream of LVI (100 barg)
88.063.0
1) & 2)
2)
2) These contours are based on a full-bore rupture release that immediately ignites, an extremely improbable event.
For
insp
ectio
n pur
pose
s only
.
Conse
nt of
copy
right
owne
r req
uired
for a
ny ot
her u
se.
EPA Export 19-02-2014:23:34:02
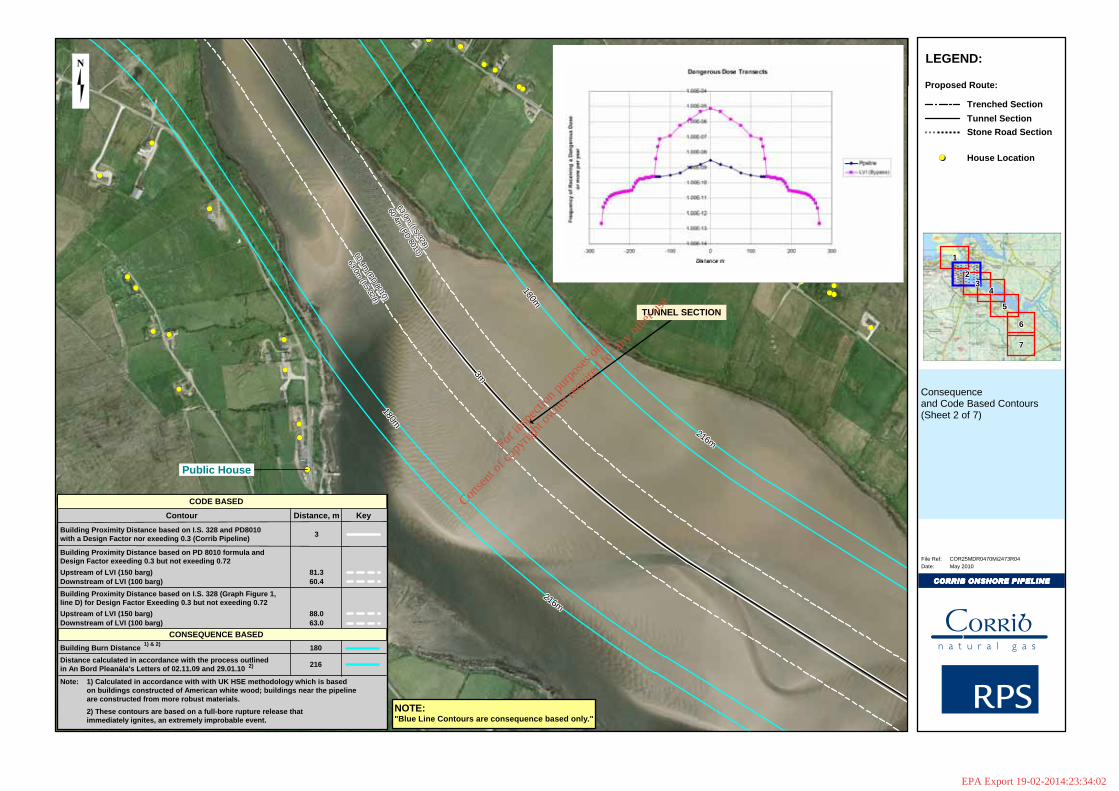
216m216m216m216m216m216m216m216m216m
216m216m216m216m216m216m216m216m216m
180m180m180m180m180m180m180m180m180m
180m180m180m180m180m180m180m180m180m
3m3m3m3m3m3m3m3m3m
63.0m(I.S.328)
63.0m(I.S.328)
63.0m(I.S.328)
63.0m(I.S.328)
63.0m(I.S.328)
63.0m(I.S.328)
63.0m(I.S.328)
63.0m(I.S.328)
63.0m(I.S.328)
60.4m(PD
8010)
60.4m(PD
8010)
60.4m(PD
8010)
60.4m(PD
8010)
60.4m(PD
8010)
60.4m(PD
8010)
60.4m(PD
8010)
60.4m(PD
8010)
60.4m(PD
8010)60.4m(PD
8010)
60.4m(PD
8010)
60.4m(PD
8010)
60.4m(PD
8010)
60.4m(PD
8010)
60.4m(PD
8010)
60.4m(PD
8010)
60.4m(PD
8010)
60.4m(PD
8010)
63.0m(I.S.328)
63.0m(I.S.328)
63.0m(I.S.328)
63.0m(I.S.328)
63.0m(I.S.328)
63.0m(I.S.328)
63.0m(I.S.328)
63.0m(I.S.328)
63.0m(I.S.328)
Public House
Consequence and Code Based Contours(Sheet 2 of 7)
COR25MDR0470Mi2473R04
CORRIB ONSHORE PIPELINECORRIB ONSHORE PIPELINECORRIB ONSHORE PIPELINECORRIB ONSHORE PIPELINE
File Ref:May 2010Date:
LEGEND:
222222222333333333
444444444
555555555
666666666
777777777
111111111
House Location
Proposed Route:
TUNNEL SECTION
Trenched Section
Tunnel Section
Stone Road Section
TUNNEL SECTION
Contour
Building Proximity Distance based on I.S. 328 and PD8010 with a Design Factor nor exeeding 0.3 (Corrib Pipeline)
Distance, m Key
3
Building Proximity Distance based on PD 8010 formula andDesign Factor exeeding 0.3 but not exeeding 0.72
Upstream of LVI (150 barg)Downstream of LVI (100 barg)
81.360.4
Building Burn Distance
Distance calculated in accordance with the process outlinedin An Bord Pleanála's Letters of 02.11.09 and 29.01.10
Note:
180
216
NOTE: "Blue Line Contours are consequence based only."
CODE BASED
CONSEQUENCE BASED
1) Calculated in accordance with with UK HSE methodology which is basedon buildings constructed of American white wood; buildings near the pipeline are constructed from more robust materials.
Building Proximity Distance based on I.S. 328 (Graph Figure 1, line D) for Design Factor Exeeding 0.3 but not exeeding 0.72
Upstream of LVI (150 barg)Downstream of LVI (100 barg)
88.063.0
1) & 2)
2)
2) These contours are based on a full-bore rupture release that immediately ignites, an extremely improbable event.
For
insp
ectio
n pur
pose
s only
.
Conse
nt of
copy
right
owne
r req
uired
for a
ny ot
her u
se.
EPA Export 19-02-2014:23:34:02
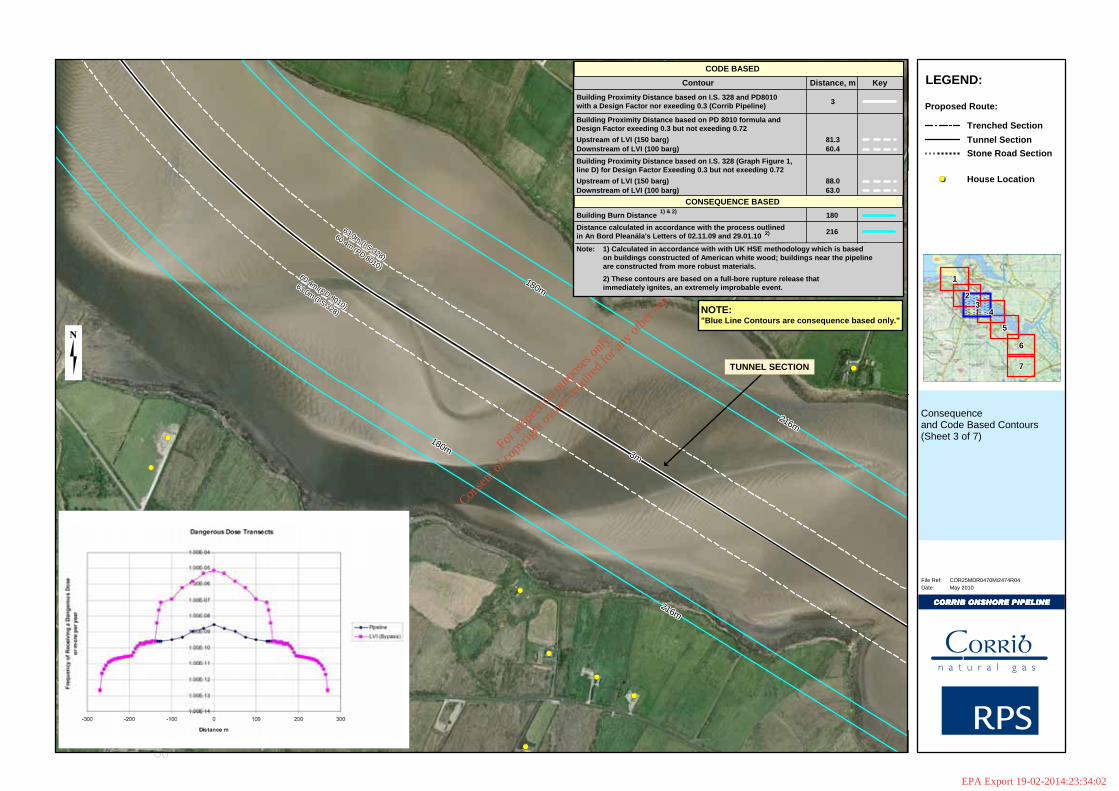
216m216m216m216m216m216m216m216m216m
180m180m180m180m180m180m180m180m180m
180m180m180m180m180m180m180m180m180m
216m216m216m216m216m216m216m216m216m
3m3m3m3m3m3m3m3m3m
63.0m(I.S.328)
63.0m(I.S.328)
63.0m(I.S.328)
63.0m(I.S.328)
63.0m(I.S.328)
63.0m(I.S.328)
63.0m(I.S.328)
63.0m(I.S.328)
63.0m(I.S.328)
60.4m(PD 8010)
60.4m(PD 8010)
60.4m(PD 8010)
60.4m(PD 8010)
60.4m(PD 8010)
60.4m(PD 8010)
60.4m(PD 8010)
60.4m(PD 8010)
60.4m(PD 8010)
60.4m(PD 8010)
60.4m(PD 8010)
60.4m(PD 8010)
60.4m(PD 8010)
60.4m(PD 8010)
60.4m(PD 8010)
60.4m(PD 8010)
60.4m(PD 8010)
60.4m(PD 8010)
63.0m(I.S.328)
63.0m(I.S.328)
63.0m(I.S.328)
63.0m(I.S.328)
63.0m(I.S.328)
63.0m(I.S.328)
63.0m(I.S.328)
63.0m(I.S.328)
63.0m(I.S.328)
Kilcommon Lodge Hostel
School
Consequence and Code Based Contours(Sheet 3 of 7)
COR25MDR0470Mi2474R04
CORRIB ONSHORE PIPELINECORRIB ONSHORE PIPELINECORRIB ONSHORE PIPELINECORRIB ONSHORE PIPELINE
File Ref:May 2010Date:
LEGEND:
222222222333333333
444444444
555555555
666666666
777777777
111111111
House Location
Proposed Route:
TUNNEL SECTION
Trenched Section
Tunnel Section
Stone Road Section
TUNNEL SECTION
Contour
Building Proximity Distance based on I.S. 328 and PD8010 with a Design Factor nor exeeding 0.3 (Corrib Pipeline)
Distance, m Key
3
Building Proximity Distance based on PD 8010 formula andDesign Factor exeeding 0.3 but not exeeding 0.72
Upstream of LVI (150 barg)Downstream of LVI (100 barg)
81.360.4
Building Burn Distance
Distance calculated in accordance with the process outlinedin An Bord Pleanála's Letters of 02.11.09 and 29.01.10
Note:
180
216
NOTE: "Blue Line Contours are consequence based only."
CODE BASED
CONSEQUENCE BASED
1) Calculated in accordance with with UK HSE methodology which is basedon buildings constructed of American white wood; buildings near the pipeline are constructed from more robust materials.
Building Proximity Distance based on I.S. 328 (Graph Figure 1, line D) for Design Factor Exeeding 0.3 but not exeeding 0.72
Upstream of LVI (150 barg)Downstream of LVI (100 barg)
88.063.0
1) & 2)
2)
2) These contours are based on a full-bore rupture release that immediately ignites, an extremely improbable event.
For
insp
ectio
n pur
pose
s only
.
Conse
nt of
copy
right
owne
r req
uired
for a
ny ot
her u
se.
EPA Export 19-02-2014:23:34:02
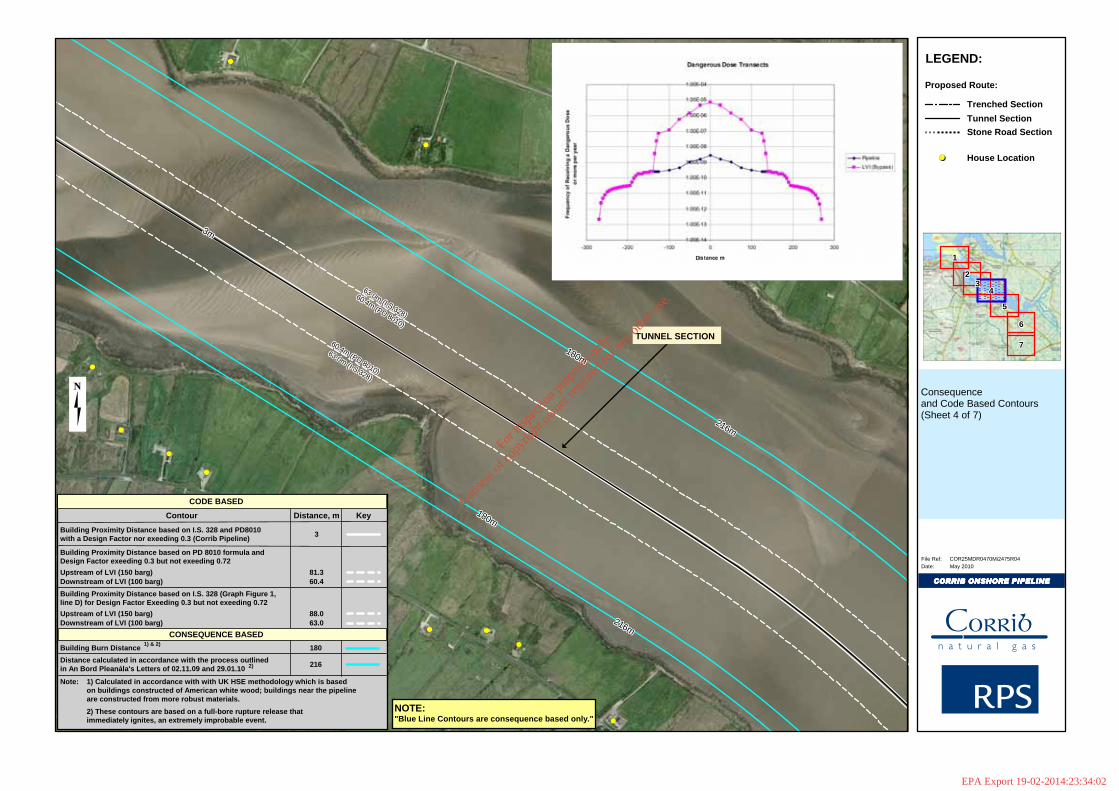
216m216m216m216m216m216m216m216m216m
180m180m180m180m180m180m180m180m180m
180m180m180m180m180m180m180m180m180m
216m216m216m216m216m216m216m216m216m
3m3m3m3m3m3m3m3m3m
63.0m (I.S.328)
63.0m (I.S.328)
63.0m (I.S.328)
63.0m (I.S.328)
63.0m (I.S.328)
63.0m (I.S.328)
63.0m (I.S.328)
63.0m (I.S.328)
63.0m (I.S.328)
60.4m (PD 8010)
60.4m (PD 8010)
60.4m (PD 8010)
60.4m (PD 8010)
60.4m (PD 8010)
60.4m (PD 8010)
60.4m (PD 8010)
60.4m (PD 8010)
60.4m (PD 8010)
60.4m (PD 8010)
60.4m (PD 8010)
60.4m (PD 8010)
60.4m (PD 8010)
60.4m (PD 8010)
60.4m (PD 8010)
60.4m (PD 8010)
60.4m (PD 8010)
60.4m (PD 8010)
63.0m (I.S.328)
63.0m (I.S.328)
63.0m (I.S.328)
63.0m (I.S.328)
63.0m (I.S.328)
63.0m (I.S.328)
63.0m (I.S.328)
63.0m (I.S.328)
63.0m (I.S.328)
Consequence and Code Based Contours(Sheet 4 of 7)
COR25MDR0470Mi2475R04
CORRIB ONSHORE PIPELINECORRIB ONSHORE PIPELINECORRIB ONSHORE PIPELINECORRIB ONSHORE PIPELINE
File Ref:May 2010Date:
LEGEND:
222222222333333333
444444444
555555555
666666666
777777777
111111111
House Location
Proposed Route:
TUNNEL SECTION
Trenched Section
Tunnel Section
Stone Road Section
TUNNEL SECTION
Contour
Building Proximity Distance based on I.S. 328 and PD8010 with a Design Factor nor exeeding 0.3 (Corrib Pipeline)
Distance, m Key
3
Building Proximity Distance based on PD 8010 formula andDesign Factor exeeding 0.3 but not exeeding 0.72
Upstream of LVI (150 barg)Downstream of LVI (100 barg)
81.360.4
Building Burn Distance
Distance calculated in accordance with the process outlinedin An Bord Pleanála's Letters of 02.11.09 and 29.01.10
Note:
180
216
NOTE: "Blue Line Contours are consequence based only."
CODE BASED
CONSEQUENCE BASED
1) Calculated in accordance with with UK HSE methodology which is basedon buildings constructed of American white wood; buildings near the pipeline are constructed from more robust materials.
Building Proximity Distance based on I.S. 328 (Graph Figure 1, line D) for Design Factor Exeeding 0.3 but not exeeding 0.72
Upstream of LVI (150 barg)Downstream of LVI (100 barg)
88.063.0
1) & 2)
2)
2) These contours are based on a full-bore rupture release that immediately ignites, an extremely improbable event.
For
insp
ectio
n pur
pose
s only
.
Conse
nt of
copy
right
owne
r req
uired
for a
ny ot
her u
se.
EPA Export 19-02-2014:23:34:02
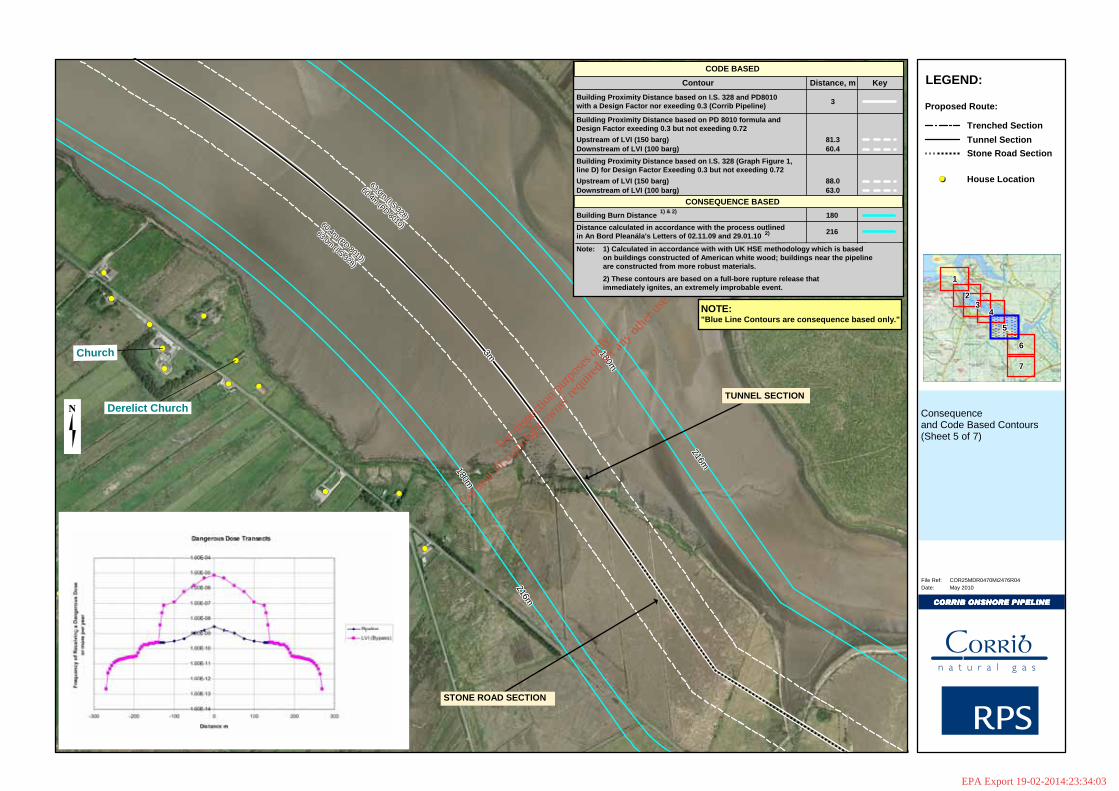
216m216m216m216m216m216m216m216m216m
180m180m180m180m180m180m180m180m180m
216m216m216m216m216m216m216m216m216m
180m180m180m180m180m180m180m180m180m
3m3m3m3m3m3m3m3m3m
63.0m(I.S.328)
63.0m(I.S.328)
63.0m(I.S.328)
63.0m(I.S.328)
63.0m(I.S.328)
63.0m(I.S.328)
63.0m(I.S.328)
63.0m(I.S.328)
63.0m(I.S.328)
60.4m(PD
8010)
60.4m(PD
8010)
60.4m(PD
8010)
60.4m(PD
8010)
60.4m(PD
8010)
60.4m(PD
8010)
60.4m(PD
8010)
60.4m(PD
8010)
60.4m(PD
8010)60.4m(PD
8010)
60.4m(PD
8010)
60.4m(PD
8010)
60.4m(PD
8010)
60.4m(PD
8010)
60.4m(PD
8010)
60.4m(PD
8010)
60.4m(PD
8010)
60.4m(PD
8010)
63.0m(I.S.328)
63.0m(I.S.328)
63.0m(I.S.328)
63.0m(I.S.328)
63.0m(I.S.328)
63.0m(I.S.328)
63.0m(I.S.328)
63.0m(I.S.328)
63.0m(I.S.328)
Church
Derelict Church Consequence and Code Based Contours(Sheet 5 of 7)
COR25MDR0470Mi2476R04
CORRIB ONSHORE PIPELINECORRIB ONSHORE PIPELINECORRIB ONSHORE PIPELINECORRIB ONSHORE PIPELINE
File Ref:May 2010Date:
LEGEND:
222222222333333333
444444444
555555555
666666666
777777777
111111111
House Location
Proposed Route:
TUNNEL SECTION
Trenched Section
Tunnel Section
Stone Road Section
TUNNEL SECTION
TUNNEL SECTIONSTONE ROAD SECTION
Contour
Building Proximity Distance based on I.S. 328 and PD8010 with a Design Factor nor exeeding 0.3 (Corrib Pipeline)
Distance, m Key
3
Building Proximity Distance based on PD 8010 formula andDesign Factor exeeding 0.3 but not exeeding 0.72
Upstream of LVI (150 barg)Downstream of LVI (100 barg)
81.360.4
Building Burn Distance
Distance calculated in accordance with the process outlinedin An Bord Pleanála's Letters of 02.11.09 and 29.01.10
Note:
180
216
NOTE: "Blue Line Contours are consequence based only."
CODE BASED
CONSEQUENCE BASED
1) Calculated in accordance with with UK HSE methodology which is basedon buildings constructed of American white wood; buildings near the pipeline are constructed from more robust materials.
Building Proximity Distance based on I.S. 328 (Graph Figure 1, line D) for Design Factor Exeeding 0.3 but not exeeding 0.72
Upstream of LVI (150 barg)Downstream of LVI (100 barg)
88.063.0
1) & 2)
2)
2) These contours are based on a full-bore rupture release that immediately ignites, an extremely improbable event.
For
insp
ectio
n pur
pose
s only
.
Conse
nt of
copy
right
owne
r req
uired
for a
ny ot
her u
se.
EPA Export 19-02-2014:23:34:03
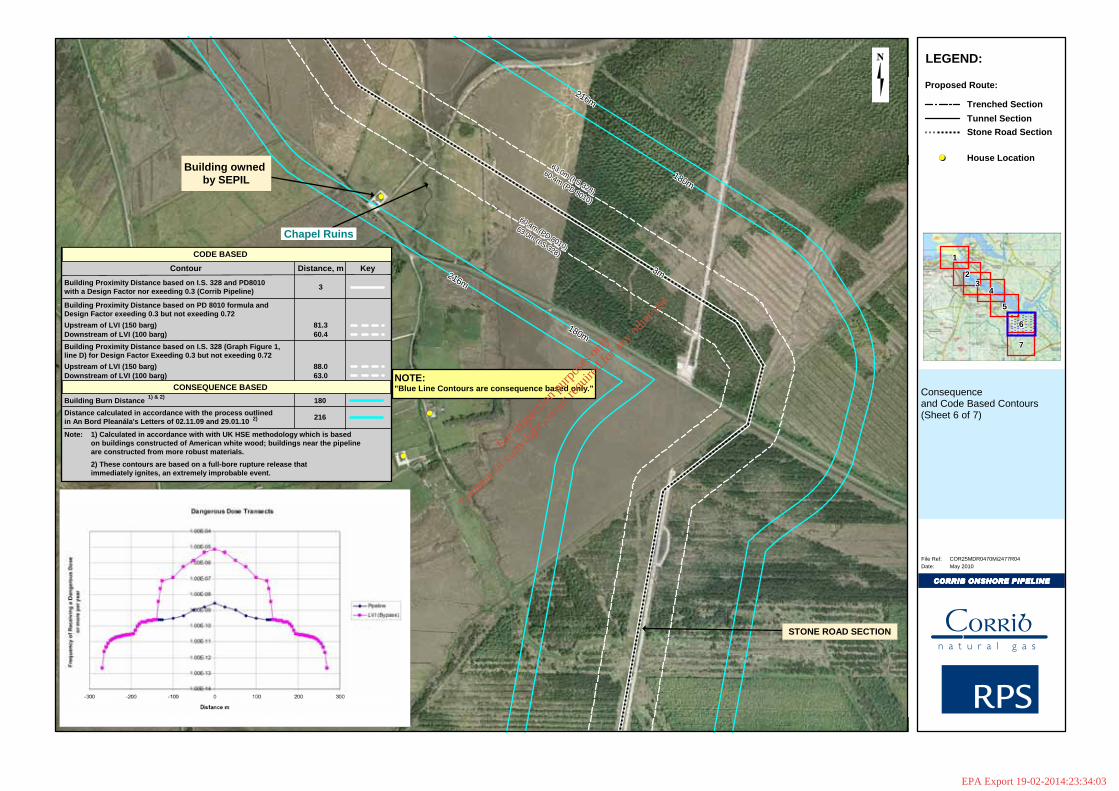
216m216m216m216m216m216m216m216m216m
216m216m216m216m216m216m216m216m216m
180m180m180m180m180m180m180m180m180m
180m180m180m180m180m180m180m180m180m
3m3m3m3m3m3m3m3m3m
63.0m (I.S.328)
63.0m (I.S.328)
63.0m (I.S.328)
63.0m (I.S.328)
63.0m (I.S.328)
63.0m (I.S.328)
63.0m (I.S.328)
63.0m (I.S.328)
63.0m (I.S.328)
60.4m (PD 8010)
60.4m (PD 8010)
60.4m (PD 8010)
60.4m (PD 8010)
60.4m (PD 8010)
60.4m (PD 8010)
60.4m (PD 8010)
60.4m (PD 8010)
60.4m (PD 8010)
60.4m (PD 8010)
60.4m (PD 8010)
60.4m (PD 8010)
60.4m (PD 8010)
60.4m (PD 8010)
60.4m (PD 8010)
60.4m (PD 8010)
60.4m (PD 8010)
60.4m (PD 8010)
63.0m (I.S.328)
63.0m (I.S.328)
63.0m (I.S.328)
63.0m (I.S.328)
63.0m (I.S.328)
63.0m (I.S.328)
63.0m (I.S.328)
63.0m (I.S.328)
63.0m (I.S.328)
Consequence and Code Based Contours(Sheet 6 of 7)
COR25MDR0470Mi2477R04
CORRIB ONSHORE PIPELINECORRIB ONSHORE PIPELINECORRIB ONSHORE PIPELINECORRIB ONSHORE PIPELINE
File Ref:May 2010Date:
LEGEND:
222222222333333333
444444444
555555555
666666666
777777777
111111111
House Location
Proposed Route:
TUNNEL SECTION
Trenched Section
Tunnel Section
Stone Road Section
Building owned by SEPIL
TUNNEL SECTIONSTONE ROAD SECTION
Chapel Ruins
Contour
Building Proximity Distance based on I.S. 328 and PD8010 with a Design Factor nor exeeding 0.3 (Corrib Pipeline)
Distance, m Key
3
Building Proximity Distance based on PD 8010 formula andDesign Factor exeeding 0.3 but not exeeding 0.72
Upstream of LVI (150 barg)Downstream of LVI (100 barg)
81.360.4
Building Burn Distance
Distance calculated in accordance with the process outlinedin An Bord Pleanála's Letters of 02.11.09 and 29.01.10
Note:
180
216
NOTE: "Blue Line Contours are consequence based only."
CODE BASED
CONSEQUENCE BASED
1) Calculated in accordance with with UK HSE methodology which is basedon buildings constructed of American white wood; buildings near the pipeline are constructed from more robust materials.
Building Proximity Distance based on I.S. 328 (Graph Figure 1, line D) for Design Factor Exeeding 0.3 but not exeeding 0.72
Upstream of LVI (150 barg)Downstream of LVI (100 barg)
88.063.0
1) & 2)
2)
2) These contours are based on a full-bore rupture release that immediately ignites, an extremely improbable event.
For
insp
ectio
n pur
pose
s only
.
Conse
nt of
copy
right
owne
r req
uired
for a
ny ot
her u
se.
EPA Export 19-02-2014:23:34:03
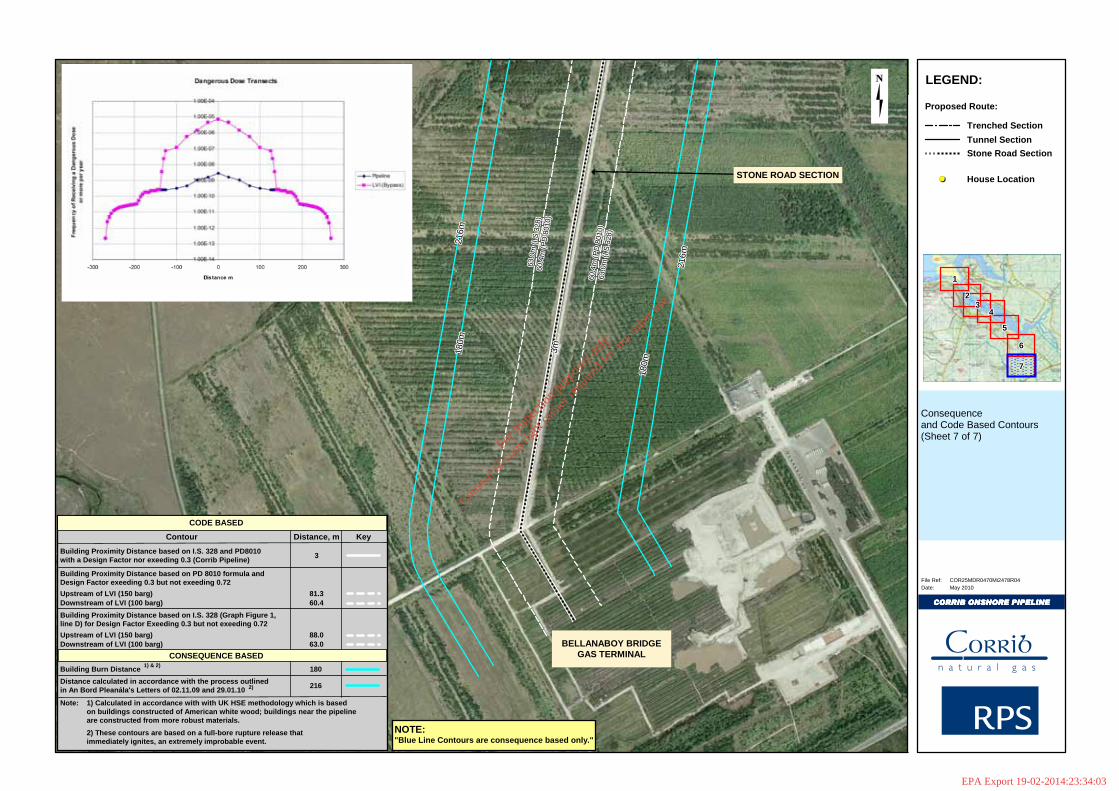
216m
216m
216m
216m
216m
216m
216m
216m
216m
180m
180m
180m
180m
180m
180m
180m
180m
180m
180m
180m
180m
180m
180m
180m
180m
180m
180m
216m
216m
216m
216m
216m
216m
216m
216m
216m
3m3m3m3m
3m3m
3m3m3m
63.0
m(I
.S.3
28)
63.0
m(I
.S.3
28)
63.0
m(I
.S.3
28)
63.0
m(I
.S.3
28)
63.0
m(I
.S.3
28)
63.0
m(I
.S.3
28)
63.0
m(I
.S.3
28)
63.0
m(I
.S.3
28)
63.0
m(I
.S.3
28)
60.4
m(P
D80
10)
60.4
m(P
D80
10)
60.4
m(P
D80
10)
60.4
m(P
D80
10)
60.4
m(P
D80
10)
60.4
m(P
D80
10)
60.4
m(P
D80
10)
60.4
m(P
D80
10)
60.4
m(P
D80
10)
60.4
m(P
D80
10)
60.4
m(P
D80
10)
60.4
m(P
D80
10)
60.4
m(P
D80
10)
60.4
m(P
D80
10)
60.4
m(P
D80
10)
60.4
m(P
D80
10)
60.4
m(P
D80
10)
60.4
m(P
D80
10)
63.0
m(I
.S.3
28)
63.0
m(I
.S.3
28)
63.0
m(I
.S.3
28)
63.0
m(I
.S.3
28)
63.0
m(I
.S.3
28)
63.0
m(I
.S.3
28)
63.0
m(I
.S.3
28)
63.0
m(I
.S.3
28)
63.0
m(I
.S.3
28)
Consequence and Code Based Contours(Sheet 7 of 7)
COR25MDR0470Mi2478R04
CORRIB ONSHORE PIPELINECORRIB ONSHORE PIPELINECORRIB ONSHORE PIPELINECORRIB ONSHORE PIPELINE
File Ref:May 2010Date:
LEGEND:
222222222333333333
444444444
555555555
666666666
777777777
111111111
House Location
Proposed Route:
Trenched Section
Tunnel Section
Stone Road Section
TUNNEL SECTIONSTONE ROAD SECTION
BELLANABOY BRIDGEGAS TERMINAL
Contour
Building Proximity Distance based on I.S. 328 and PD8010 with a Design Factor nor exeeding 0.3 (Corrib Pipeline)
Distance, m Key
3
Building Proximity Distance based on PD 8010 formula andDesign Factor exeeding 0.3 but not exeeding 0.72
Upstream of LVI (150 barg)Downstream of LVI (100 barg)
81.360.4
Building Burn Distance
Distance calculated in accordance with the process outlinedin An Bord Pleanála's Letters of 02.11.09 and 29.01.10
Note:
180
216
NOTE: "Blue Line Contours are consequence based only."
CODE BASED
CONSEQUENCE BASED
1) Calculated in accordance with with UK HSE methodology which is basedon buildings constructed of American white wood; buildings near the pipeline are constructed from more robust materials.
Building Proximity Distance based on I.S. 328 (Graph Figure 1, line D) for Design Factor Exeeding 0.3 but not exeeding 0.72
Upstream of LVI (150 barg)Downstream of LVI (100 barg)
88.063.0
1) & 2)
2)
2) These contours are based on a full-bore rupture release that immediately ignites, an extremely improbable event.
For
insp
ectio
n pur
pose
s only
.
Conse
nt of
copy
right
owne
r req
uired
for a
ny ot
her u
se.
EPA Export 19-02-2014:23:34:03
Corrib Onshore Pipeline EIS Q6.5(i) - Response to An Bord Pleanála
COR-14-SH-077 27
REFERENCES
1. Thermal Radiation Criteria Used In Pipeline Risk Assessment. Bilio & Kinsman. December 1997
2. Uijt de Haag PAM and Ale BJM. Guidelines for Quantitative Risk Assessment. PGS 3. (Purple Book). VROM (Verantwoordelijk voor wonen, ruimte en milieu). Dec 2005
For
insp
ectio
n pur
pose
s only
.
Conse
nt of
copy
right
owne
r req
uired
for a
ny ot
her u
se.
EPA Export 19-02-2014:23:34:03
SHELL E&P IRELAND LIMITED
CORRIB GAS FIELD DEVELOPMENT PROJECT
Q6.5(ii): Response to An Bord PleanálaRegarding the Request for Further Information, Item (i)
of Letter 2nd NovemberDOCUMENT No: COR 14 SH 0078
For
insp
ectio
n pur
pose
s only
.
Conse
nt of
copy
right
owne
r req
uired
for a
ny ot
her u
se.
EPA Export 19-02-2014:23:34:03
Corrib Onshore Pipeline EIS Q6.5(ii) - Response to An Bord Pleanála
COR-14-SH-0078 i
TABLE OF CONTENTS
1 INTRODUCTION ........................................................................................................................ 12 LIMITATIONS AND ASSUMPTIONS APPLIED........................................................................ 2
2.1 LIMITATIONS .................................................................................................................... 2
2.2 ASSUMPTIONS APPLIED.................................................................................................... 2
3 CONTOUR PLOTS..................................................................................................................... 3
For
insp
ectio
n pur
pose
s only
.
Conse
nt of
copy
right
owne
r req
uired
for a
ny ot
her u
se.
EPA Export 19-02-2014:23:34:03

Corrib Onshore Pipeline EIS Q6.5(ii) - Response to An Bord Pleanála
COR-14-SH-0078 1
1 INTRODUCTION
This document is prepared in response to An Bord Pleanála’s letter of the 2nd November 2009 Page 3 item (i) requesting information as follows:
“Provide details of the hazard distances, building burn distances and escape distances in contours for the entire pipeline. The applicant should indicate the outer hazard line contour, which should show the distance from the pipeline at which a person would be safe. A number of these contours were provided at the oral hearing (copies of which are attached to this letter), however, the set of hazard contours should be completed and should include the entire onshore pipeline as far as the terminal. Please indicate the assumption made in determining these hazard contours and indicate any limitations that apply to these hazard contours.”
The distance from the pipeline at which a person would be safe is covered in Appendix Q 6.5(i), which takes account of An Bord Pleanála’s letter of clarification dated 29th January 2010.
This document covers the provision of the Building Burn and Escape Distances for the full length of the pipeline onshore in order to complete the submission provided at the oral hearing.
For
insp
ectio
n pur
pose
s only
.
Conse
nt of
copy
right
owne
r req
uired
for a
ny ot
her u
se.
EPA Export 19-02-2014:23:34:03
Corrib Onshore Pipeline EIS Q6.5(ii) - Response to An Bord Pleanála
COR-14-SH-0078 2
2 LIMITATIONS AND ASSUMPTIONS APPLIED
2.1 LIMITATIONS
The Building Burn and Escape Distance are those applied within the rule sets adopted for the Quantitative Risk Assessment, QRA, (Appendix Q 6.4).
These consequence based rule sets are intended for use in combination with frequency of pipeline loss of containment events, probability of ignition, probability of persons being exposed, various meteorological conditions etc. in order to derive the level of risk associated with the Corrib pipeline. The Building Burn Distance is used in the context of determining whether persons inside buildings within this distance would survive. Escape distance is used in the context of whether persons outdoors may survive when escaping the event. In combination with other rule-sets these two distances are used to generate a value of potential loss of life or receipt of a dangerous dose per scenario outcome for a range of release scenarios.
2.2 ASSUMPTIONS APPLIED
Together with the base assumption that a number of preventative measures have failed simultaneously, the following key assumptions are applied in the application of these rule sets:
General:
A full bore rupture occurs (the likelihood of which SEPIL regard as negligible)
The release is the worst-case release scenario, being a release at 100barg with the LVI open and the full pipeline inventory of gas escaping from two open ends. (see Appendix Q6.3 Section 7.1.2)
The release immediately ignites
The wind is blowing at 5m/s from the point of release towards the receptor
Receptors are at an elevation of 38m above the release point (the higher the elevation the greater the thermal loading received)
For Building Burn Distance:
The building is made of American white wood (as opposed to the building materials used in the vicinity of the pipeline which are brick, stone, slate, tile etc.)
Thermal flux for spontaneous ignition is equal to or greater than 25.6 kW/m2
For Escape Distance:
The person is outdoors at the time of the event
There is a reaction time of 5s during which the person is stationary
The person does not receive a fatal level of thermal flux greater than 31.5 kW/m2 and moves at a speed of 2.5 m/s for a distance of 75m away from the source of heat (perpendicular to the pipeline) and in doing so does not receive a dose greater than 1000 tdu
For
insp
ectio
n pur
pose
s only
.
Conse
nt of
copy
right
owne
r req
uired
for a
ny ot
her u
se.
EPA Export 19-02-2014:23:34:03
Corrib Onshore Pipeline EIS Q6.5(ii) - Response to An Bord Pleanála
COR-14-SH-0078 3
3 CONTOUR PLOTS
Contours of Building Burn Distance and Escape Distance are overlaid on aerial photographs for the entire length of the pipeline.
For
insp
ectio
n pur
pose
s only
.
Conse
nt of
copy
right
owne
r req
uired
for a
ny ot
her u
se.
EPA Export 19-02-2014:23:34:03
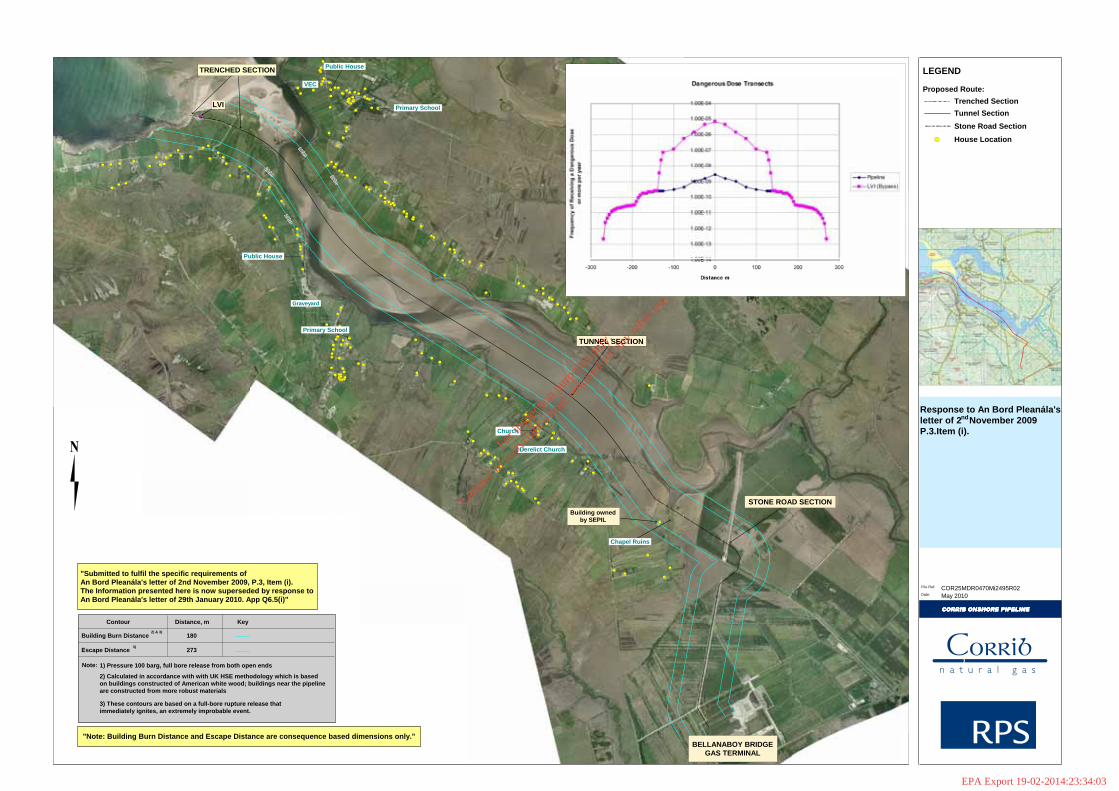
Response to An Bord Pleanála's letter of 2 November 2009 P.3.Item (i).
CORRIB ONSHORE PIPELINECORRIB ONSHORE PIPELINECORRIB ONSHORE PIPELINECORRIB ONSHORE PIPELINE
File Ref:
May 2010Date:
273m273m273m273m273m273m273m273m273m
273m273m273m273m273m273m273m273m273m
180m180m180m180m180m180m180m180m180m
180m180m180m180m180m180m180m180m180m
Public House
Primary School
Primary School
Church
Derelict Church
Public House
VEC
LEGEND
Proposed Route:
House Location
TUNNEL SECTION
LVI
STONE ROAD SECTION
BELLANABOY BRIDGEGAS TERMINAL
COR25MDR0470Mi2495R02
iii
Graveyard
Chapel Ruins
Trenched Section
Tunnel Section
Stone Road Section
TRENCHED SECTIONTRENCHED SECTIONTRENCHED SECTION
LVI
STONE ROAD SECTION
TUNNEL SECTION
iii
Building owned by SEPIL
Building owned by SEPIL
nd
Contour Distance, m Key
Building Burn Distance
Escape Distance
Note:
180
273
"Note: Building Burn Distance and Escape Distance are consequence based dimensions only."
"Submitted to fulfil the specific requirements ofAn Bord Pleanála's letter of 2nd November 2009, P.3, Item (i). The Information presented here is now superseded by response to An Bord Pleanála's letter of 29th January 2010. App Q6.5(i)"
1) Pressure 100 barg, full bore release from both open ends
2) Calculated in accordance with with UK HSE methodology which is basedon buildings constructed of American white wood; buildings near the pipeline are constructed from more robust materials
2) & 3)
3)
3) These contours are based on a full-bore rupture release that immediately ignites, an extremely improbable event.
For
insp
ectio
n pur
pose
s only
.
Conse
nt of
copy
right
owne
r req
uired
for a
ny ot
her u
se.
EPA Export 19-02-2014:23:34:03
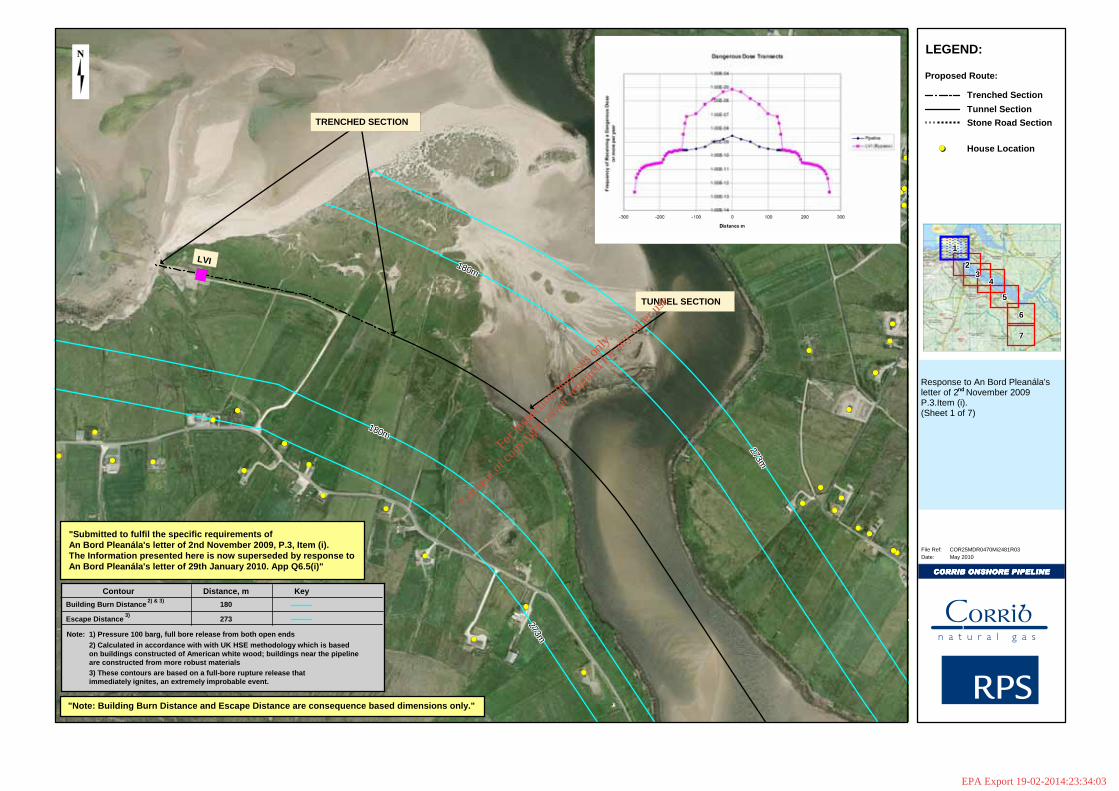
273m273m273m273m273m273m273m273m273m
273m273m273m273m273m273m273m273m273m
180m180m180m180m180m180m180m180m180m
180m180m180m180m180m180m180m180m180m
VEC
Public House
Response to An Bord Pleanála's letter of 2 November 2009 P.3.Item (i).(Sheet 1 of 7)
COR25MDR0470Mi2481R03
CORRIB ONSHORE PIPELINECORRIB ONSHORE PIPELINECORRIB ONSHORE PIPELINECORRIB ONSHORE PIPELINE
File Ref:May 2010Date:
LEGEND:
222222222333333333
444444444
555555555
666666666
777777777
111111111
House Location
Proposed Route:
Contour Distance, m Key
Building Burn Distance
Escape Distance
Note:
180
273
"Note: Building Burn Distance and Escape Distance are consequence based dimensions only."
Trenched Section
Tunnel Section
Stone Road Section
LVI
"Submitted to fulfil the specific requirements ofAn Bord Pleanála's letter of 2nd November 2009, P.3, Item (i). The Information presented here is now superseded by response to An Bord Pleanála's letter of 29th January 2010. App Q6.5(i)"
TRENCHED SECTIONTRENCHED SECTIONTRENCHED SECTION
TUNNEL SECTIONTUNNEL SECTION
1) Pressure 100 barg, full bore release from both open ends
2) Calculated in accordance with with UK HSE methodology which is basedon buildings constructed of American white wood; buildings near the pipeline are constructed from more robust materials
nd
2) & 3)
3)
3) These contours are based on a full-bore rupture release that immediately ignites, an extremely improbable event.
For
insp
ectio
n pur
pose
s only
.
Conse
nt of
copy
right
owne
r req
uired
for a
ny ot
her u
se.
EPA Export 19-02-2014:23:34:03
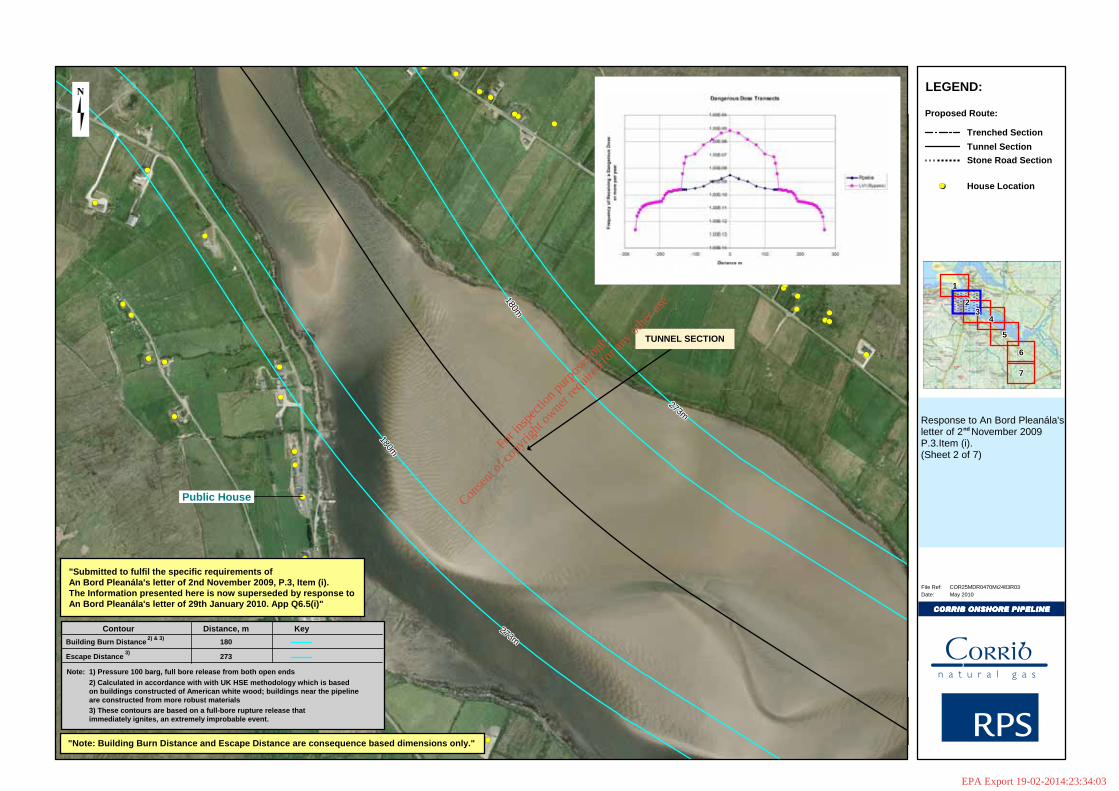
180m180m180m180m180m180m180m180m180m
180m180m180m180m180m180m180m180m180m
273m273m273m273m273m273m273m273m273m
Public House
273m273m273m273m273m273m273m273m273m
Response to An Bord Pleanála's letter of 2 November 2009 P.3.Item (i).(Sheet 2 of 7)
COR25MDR0470Mi2483R03
CORRIB ONSHORE PIPELINECORRIB ONSHORE PIPELINECORRIB ONSHORE PIPELINECORRIB ONSHORE PIPELINE
File Ref:May 2010Date:
LEGEND:
222222222333333333
444444444
555555555
666666666
777777777
111111111
House Location
Proposed Route:
Trenched Section
Tunnel Section
Stone Road Section
TUNNEL SECTIONTUNNEL SECTION
nd
Contour Distance, m Key
Building Burn Distance
Escape Distance
Note:
180
273
"Note: Building Burn Distance and Escape Distance are consequence based dimensions only."
"Submitted to fulfil the specific requirements ofAn Bord Pleanála's letter of 2nd November 2009, P.3, Item (i). The Information presented here is now superseded by response to An Bord Pleanála's letter of 29th January 2010. App Q6.5(i)"
1) Pressure 100 barg, full bore release from both open ends
2) Calculated in accordance with with UK HSE methodology which is basedon buildings constructed of American white wood; buildings near the pipeline are constructed from more robust materials
2) & 3)
3)
3) These contours are based on a full-bore rupture release that immediately ignites, an extremely improbable event.
For
insp
ectio
n pur
pose
s only
.
Conse
nt of
copy
right
owne
r req
uired
for a
ny ot
her u
se.
EPA Export 19-02-2014:23:34:03
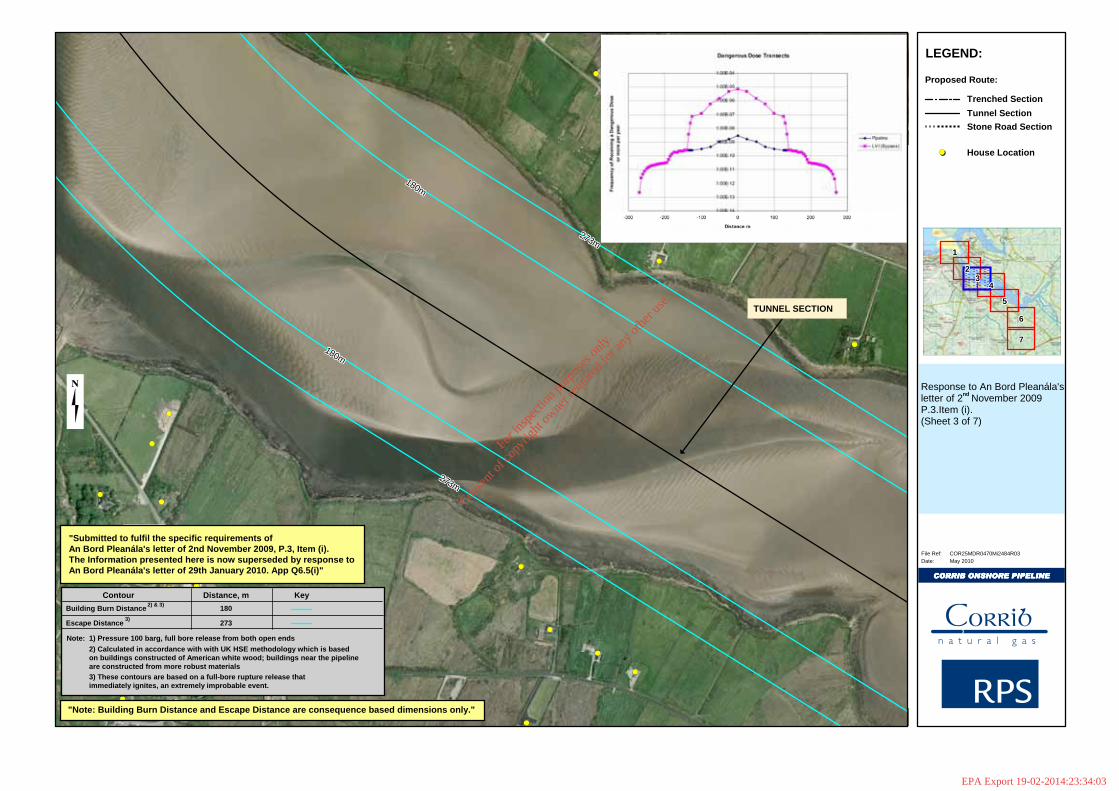
273m273m273m273m273m273m273m273m273m
180m180m180m180m180m180m180m180m180m
273m273m273m273m273m273m273m273m273m
180m180m180m180m180m180m180m180m180m
School
Response to An Bord Pleanála's letter of 2 November 2009 P.3.Item (i).(Sheet 3 of 7)
COR25MDR0470Mi2484R03
CORRIB ONSHORE PIPELINECORRIB ONSHORE PIPELINECORRIB ONSHORE PIPELINECORRIB ONSHORE PIPELINE
File Ref:May 2010Date:
LEGEND:
222222222333333333
444444444
555555555
666666666
777777777
111111111
House Location
Proposed Route:
Trenched Section
Tunnel Section
Stone Road Section
TUNNEL SECTIONTUNNEL SECTION
nd
Contour Distance, m Key
Building Burn Distance
Escape Distance
Note:
180
273
"Note: Building Burn Distance and Escape Distance are consequence based dimensions only."
"Submitted to fulfil the specific requirements ofAn Bord Pleanála's letter of 2nd November 2009, P.3, Item (i). The Information presented here is now superseded by response to An Bord Pleanála's letter of 29th January 2010. App Q6.5(i)"
1) Pressure 100 barg, full bore release from both open ends
2) Calculated in accordance with with UK HSE methodology which is basedon buildings constructed of American white wood; buildings near the pipeline are constructed from more robust materials
2) & 3)
3)
3) These contours are based on a full-bore rupture release that immediately ignites, an extremely improbable event.
For
insp
ectio
n pur
pose
s only
.
Conse
nt of
copy
right
owne
r req
uired
for a
ny ot
her u
se.
EPA Export 19-02-2014:23:34:03
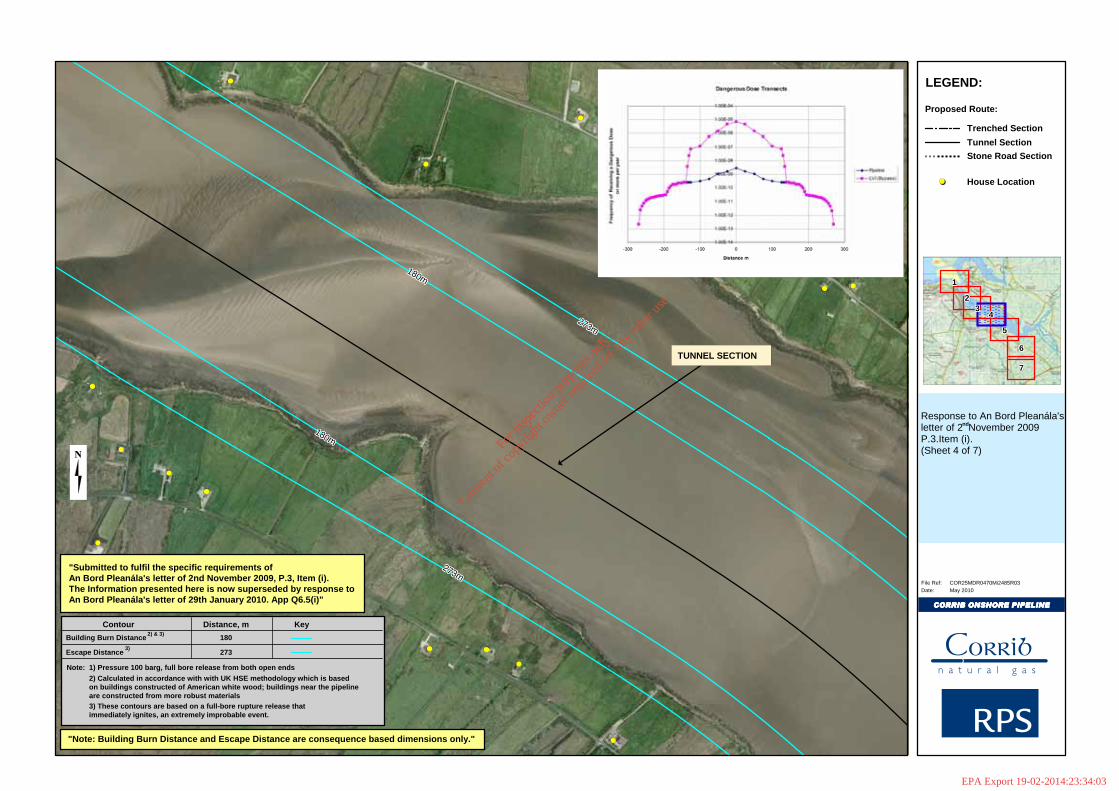
273m273m273m273m273m273m273m273m273m
180m180m180m180m180m180m180m180m180m
180m180m180m180m180m180m180m180m180m
273m273m273m273m273m273m273m273m273m
Response to An Bord Pleanála's letter of 2 November 2009 P.3.Item (i).(Sheet 4 of 7)
COR25MDR0470Mi2485R03
CORRIB ONSHORE PIPELINECORRIB ONSHORE PIPELINECORRIB ONSHORE PIPELINECORRIB ONSHORE PIPELINE
File Ref:May 2010Date:
LEGEND:
222222222333333333
444444444
555555555
666666666
777777777
111111111
House Location
Proposed Route:
Trenched Section
Tunnel Section
Stone Road Section
TUNNEL SECTIONTUNNEL SECTION
nd
Contour Distance, m Key
Building Burn Distance
Escape Distance
Note:
180
273
"Note: Building Burn Distance and Escape Distance are consequence based dimensions only."
"Submitted to fulfil the specific requirements ofAn Bord Pleanála's letter of 2nd November 2009, P.3, Item (i). The Information presented here is now superseded by response to An Bord Pleanála's letter of 29th January 2010. App Q6.5(i)"
1) Pressure 100 barg, full bore release from both open ends
2) Calculated in accordance with with UK HSE methodology which is basedon buildings constructed of American white wood; buildings near the pipeline are constructed from more robust materials
2) & 3)
3)
3) These contours are based on a full-bore rupture release that immediately ignites, an extremely improbable event.
For
insp
ectio
n pur
pose
s only
.
Conse
nt of
copy
right
owne
r req
uired
for a
ny ot
her u
se.
EPA Export 19-02-2014:23:34:03
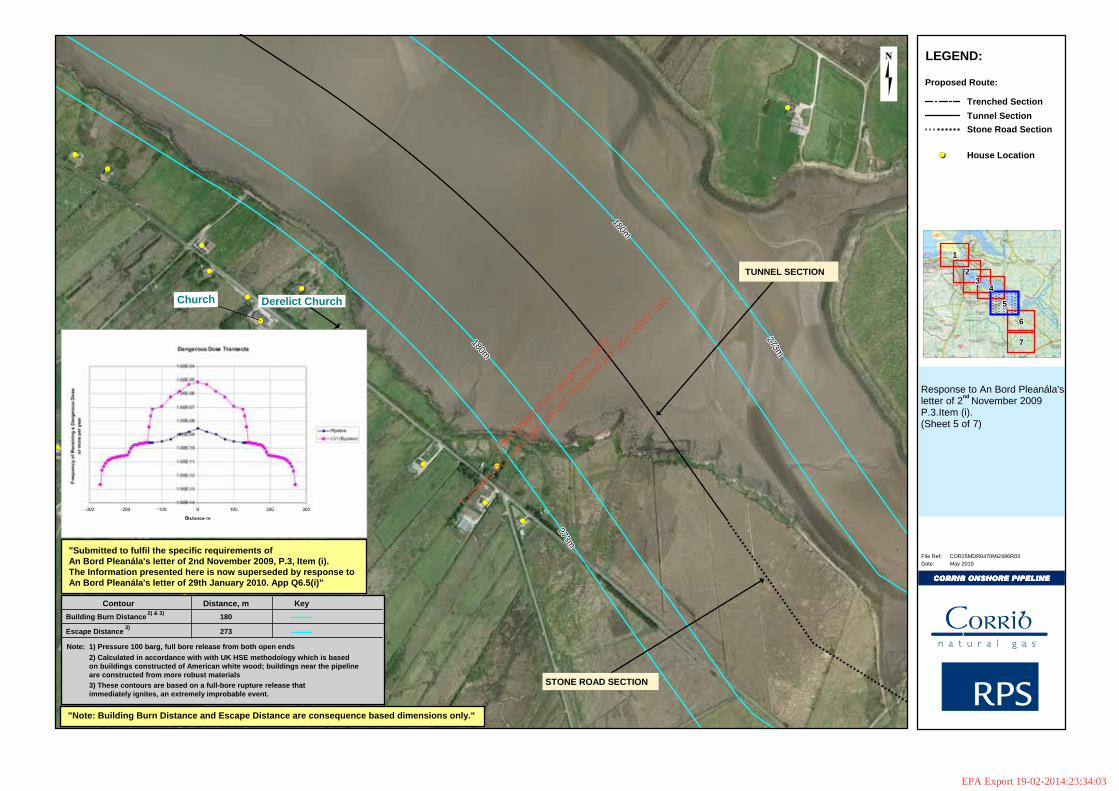
Derelict Church
180m180m180m180m180m180m180m180m180m
273m273m273m273m273m273m273m273m273m
180m180m180m180m180m180m180m180m180m
273m273m273m273m273m273m273m273m273m
Church
Response to An Bord Pleanála's letter of 2 November 2009 P.3.Item (i).(Sheet 5 of 7)
COR25MDR0470Mi2486R03
CORRIB ONSHORE PIPELINECORRIB ONSHORE PIPELINECORRIB ONSHORE PIPELINECORRIB ONSHORE PIPELINE
File Ref:May 2010Date:
LEGEND:
222222222333333333
444444444
555555555
666666666
777777777
111111111
House Location
Proposed Route:
Trenched Section
Tunnel Section
Stone Road Section
TUNNEL SECTIONTUNNEL SECTION
TUNNEL SECTIONSTONE ROAD SECTION
nd
Contour Distance, m Key
Building Burn Distance
Escape Distance
Note:
180
273
"Note: Building Burn Distance and Escape Distance are consequence based dimensions only."
"Submitted to fulfil the specific requirements ofAn Bord Pleanála's letter of 2nd November 2009, P.3, Item (i). The Information presented here is now superseded by response to An Bord Pleanála's letter of 29th January 2010. App Q6.5(i)"
1) Pressure 100 barg, full bore release from both open ends
2) Calculated in accordance with with UK HSE methodology which is basedon buildings constructed of American white wood; buildings near the pipeline are constructed from more robust materials
2) & 3)
3)
3) These contours are based on a full-bore rupture release that immediately ignites, an extremely improbable event.
Derelict Church
For
insp
ectio
n pur
pose
s only
.
Conse
nt of
copy
right
owne
r req
uired
for a
ny ot
her u
se.
EPA Export 19-02-2014:23:34:03
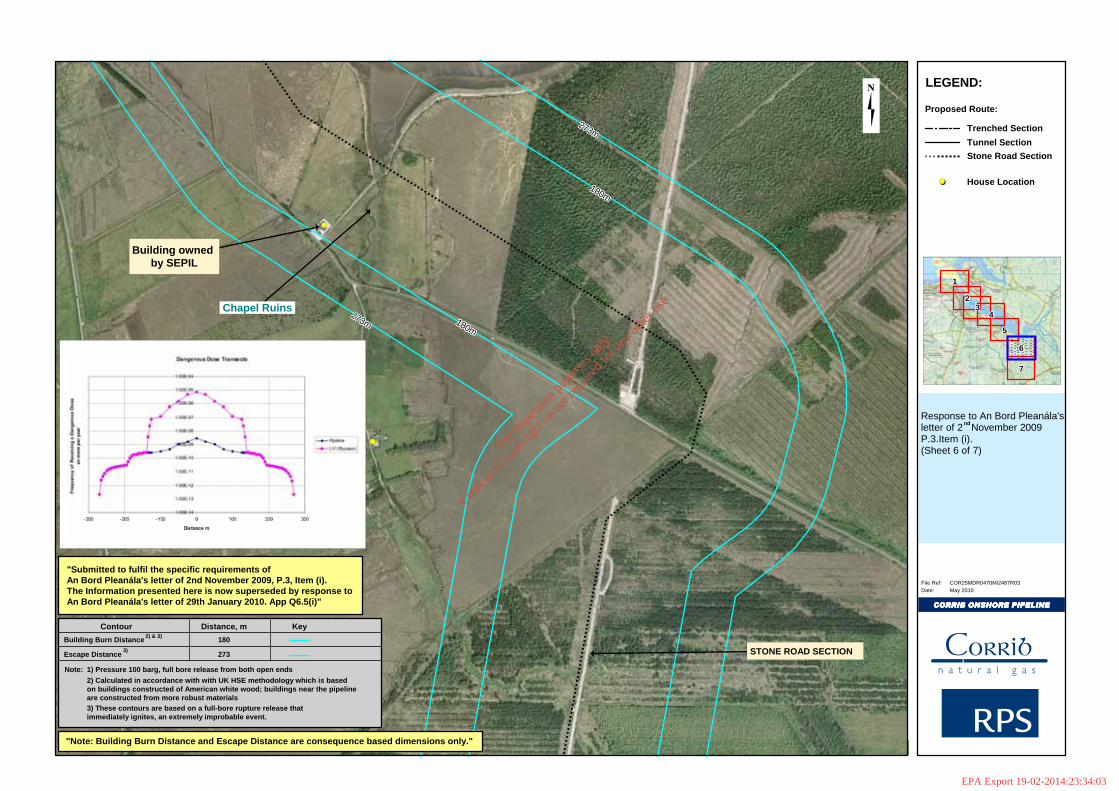
180m180m180m180m180m180m180m180m180m
180m180m180m180m180m180m180m180m180m
273m273m273m273m273m273m273m273m273m
273m273m273m273m273m273m273m273m273m
Response to An Bord Pleanála's letter of 2 November 2009 P.3.Item (i).(Sheet 6 of 7)
COR25MDR0470Mi2487R03
CORRIB ONSHORE PIPELINECORRIB ONSHORE PIPELINECORRIB ONSHORE PIPELINECORRIB ONSHORE PIPELINE
File Ref:May 2010Date:
LEGEND:
222222222333333333
444444444
555555555
666666666
777777777
111111111
House Location
Proposed Route:
Trenched Section
Tunnel Section
Stone Road Section
TUNNEL SECTIONSTONE ROAD SECTION
TUNNEL SECTIONBuilding owned
by SEPIL
Chapel Ruins
nd
Contour Distance, m Key
Building Burn Distance
Escape Distance
Note:
180
273
"Note: Building Burn Distance and Escape Distance are consequence based dimensions only."
"Submitted to fulfil the specific requirements ofAn Bord Pleanála's letter of 2nd November 2009, P.3, Item (i). The Information presented here is now superseded by response to An Bord Pleanála's letter of 29th January 2010. App Q6.5(i)"
1) Pressure 100 barg, full bore release from both open ends
2) Calculated in accordance with with UK HSE methodology which is basedon buildings constructed of American white wood; buildings near the pipeline are constructed from more robust materials
2) & 3)
3)
3) These contours are based on a full-bore rupture release that immediately ignites, an extremely improbable event.
For
insp
ectio
n pur
pose
s only
.
Conse
nt of
copy
right
owne
r req
uired
for a
ny ot
her u
se.
EPA Export 19-02-2014:23:34:03
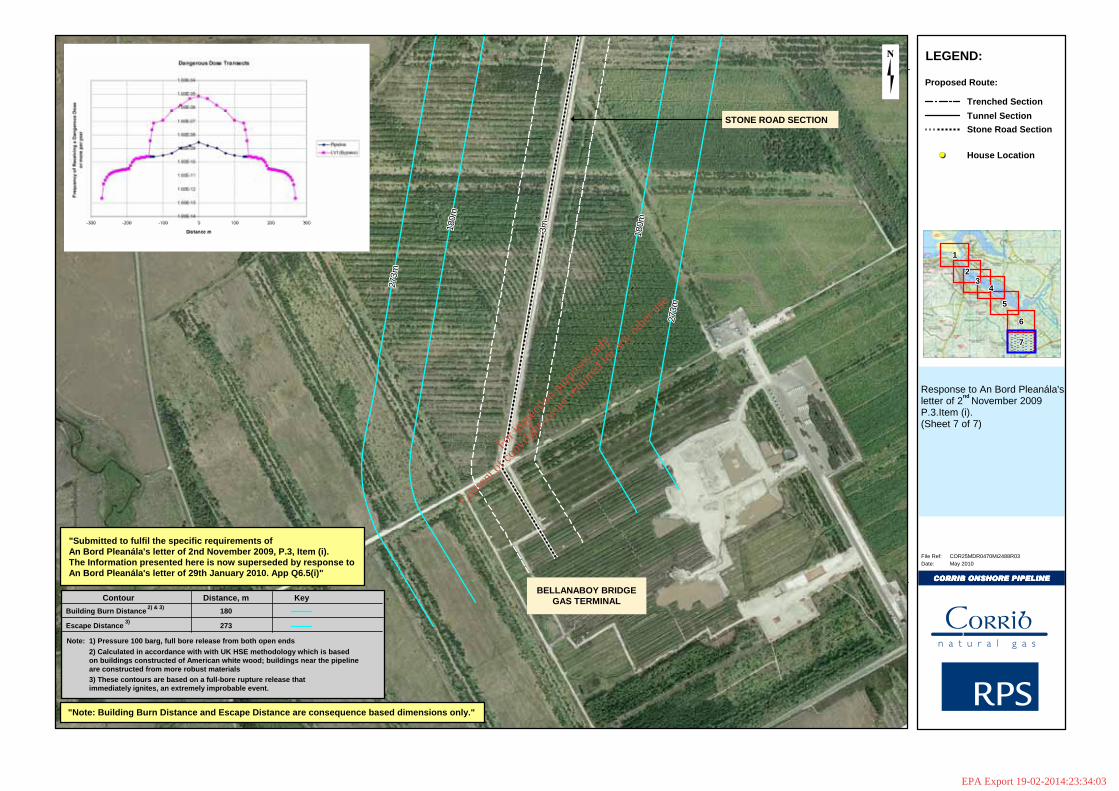
180m
180m
180m
180m
180m
180m
180m
180m
180m
273m
273m
273m
273m
273m
273m
273m
273m
273m
180m
180m
180m
180m
180m
180m
180m
180m
180m
273m
273m
273m
273m
273m
273m
273m
273m
273m
3m3m3m3m
3m3m
3m3m3m
Response to An Bord Pleanála's letter of 2 November 2009 P.3.Item (i).(Sheet 7 of 7)
COR25MDR0470Mi2488R03
CORRIB ONSHORE PIPELINECORRIB ONSHORE PIPELINECORRIB ONSHORE PIPELINECORRIB ONSHORE PIPELINE
File Ref:May 2010Date:
LEGEND:
222222222333333333
444444444
555555555
666666666
777777777
111111111
House Location
Proposed Route:
Trenched Section
Tunnel Section
Stone Road SectionTUNNEL SECTIONSTONE ROAD SECTION
BELLANABOY BRIDGEGAS TERMINAL
nd
Contour Distance, m Key
Building Burn Distance
Escape Distance
Note:
180
273
"Note: Building Burn Distance and Escape Distance are consequence based dimensions only."
"Submitted to fulfil the specific requirements ofAn Bord Pleanála's letter of 2nd November 2009, P.3, Item (i). The Information presented here is now superseded by response to An Bord Pleanála's letter of 29th January 2010. App Q6.5(i)"
1) Pressure 100 barg, full bore release from both open ends
2) Calculated in accordance with with UK HSE methodology which is basedon buildings constructed of American white wood; buildings near the pipeline are constructed from more robust materials
2) & 3)
3)
3) These contours are based on a full-bore rupture release that immediately ignites, an extremely improbable event.
For
insp
ectio
n pur
pose
s only
.
Conse
nt of
copy
right
owne
r req
uired
for a
ny ot
her u
se.
EPA Export 19-02-2014:23:34:03
SHELL E&P IRELAND LIMITED
CORRIB GAS FIELD DEVELOPMENT PROJECT
Q6.6 – EMERGENCY RESPONSE PLANNING AND PROVISIONSDOCUMENT No: COR 14 SH 0069
For in
spec
tion p
urpo
ses o
nly.
Conse
nt of
copy
right
owne
r req
uired
for a
ny ot
her u
se.
EPA Export 19-02-2014:23:34:03
Corrib Onshore Pipeline EIS Q6.6 – Emergency Response Planning and Provisions
COR-14-SH-0069 i
TABLE OF CONTENTS
1 INTRODUCTION ........................................................................................................................ 12 INTERFACE WITH THE PUBLIC .............................................................................................. 2
2.1 COMMUNITY LIAISON........................................................................................................ 2
2.2 PUBLIC NOTIFICATION ...................................................................................................... 2
2.3 INFORMATION DURING AN INCIDENT.................................................................................. 2
3 OVERVIEW OF PIPELINE EMERGENCY RESPONSE SCENARIOS..................................... 33.1 HYDROCARBON RELEASE FROM OFFSHORE PIPELINE........................................................ 3
3.2 HYDROCARBON RELEASE FROM LVI ................................................................................. 3
3.3 HYDROCARBON RELEASE FROM ONSHORE PIPELINE ......................................................... 4
4 MANAGEMENT OF EMERGENCY RESPONSE FOR THE CORRIB DEVELOPMENT ......... 54.1 DEFINITIONS AND CLASSIFICATIONS .................................................................................. 5
4.2 SAFETY AND EMERGENCY RESPONSE POLICY & PHILOSOPHY ........................................... 7
4.3 KEY CONTROLS ............................................................................................................... 8
4.4 EMERGENCY RESPONSE MANAGEMENT SYSTEM............................................................... 9
4.4.1 ER-MS Owner and Custodian............................................................................. 9
4.4.2 ER-MS Review Periods....................................................................................... 9
4.4.3 ER-MS Standards ............................................................................................. 10
5 PIPELINE EMERGENCY RESPONSE PROVISIONS ............................................................ 115.1 DESIGN LAYOUT ............................................................................................................ 11
5.2 RELEASE DETECTION..................................................................................................... 11
5.2.1 Pipeline Mass Balance...................................................................................... 11
5.2.2 Fibre Optic System............................................................................................ 11
5.2.3 Well Pressure Sensors...................................................................................... 11
5.2.4 Terminal Pressure/Flow Sensors ...................................................................... 11
5.2.5 Personnel Intervention ...................................................................................... 11
5.2.6 CCTV................................................................................................................. 12
5.3 SAFEGUARDING EMERGENCY SHUTDOWN....................................................................... 12
5.4 ISOLATION ..................................................................................................................... 12
5.5 DEPRESSURISATION....................................................................................................... 12
5.6 COMMUNICATIONS TO SUPPORT EMERGENCY RESPONSE................................................ 12
5.6.1 Telephone System ............................................................................................ 12
5.6.2 Plant Radio System........................................................................................... 13
5.7 EMERGENCY EQUIPMENT ............................................................................................... 13
6 EMERGENCY RESPONSE ORGANISATION AND STRUCTURE ........................................ 146.1 SEPIL EMERGENCY RESPONSE STRUCTURE .................................................................. 14
6.2 LOCATION RESPONSE TEAM ORGANISATION ................................................................... 15
7 EMERGENCY RESPONSE ROLES........................................................................................ 177.1 ROLE OF THE PLANT INSTALLATION MANAGER OR APPOINTED DELEGATE ....................... 17
7.2 ROLE OF THE HSSE ADVISOR....................................................................................... 17
For
insp
ectio
n pur
pose
s only
.
Conse
nt of
copy
right
owne
r req
uired
for a
ny ot
her u
se.
EPA Export 19-02-2014:23:34:03
Corrib Onshore Pipeline EIS Q6.6 – Emergency Response Planning and Provisions
COR-14-SH-0069 ii
7.3 ROLE OF LOCATION RESPONSE TEAM MEMBERS............................................................ 17
7.3.1 Role of the Site Main Controller ........................................................................ 17
7.3.2 Role of the Control Room Operator (CRO)....................................................... 17
7.4 ROLE OF THE EMERGENCY COORDINATION TEAM (ECT) ................................................ 17
7.5 DUTIES OF THE EMERGENCY SERVICES LEAD AGENCY .................................................... 18
7.5.1 Duties of the Emergency Services Upon Arrival at Scene................................ 18
8 RESPONSE FOR EMERGENCY SCENARIOS ...................................................................... 198.1 OFFSHORE PIPELINE AND SUBSEA FACILITIES EMERGENCY ............................................. 19
8.2 ONSHORE, NEARSHORE OR LVI EMERGENCY.................................................................. 20
8.3 PIPELINE DAMAGE ......................................................................................................... 20
8.4 DUTIES OF SITE MAIN CONTROLLER ON TERMINATION OF THE EMERGENCY...................... 21
9 EMERGENCY RESPONSE PREPARATION .......................................................................... 229.1 EMERGENCY RESPONSE PLAN DEVELOPMENT ................................................................ 22
9.2 DRILLS AND EXERCISES.................................................................................................. 22
10 ABBREVIATIONS.................................................................................................................... 23
LIST OF FIGURES Figure 4.1: Emergency Response Philosophy ........................................................................................ 7
Figure 6.1: Emergency Response Structure for SEPIL Organisation ................................................... 14
Figure 6.2: Location Response Team Structure.................................................................................... 15
Figure 6.3: Incident Organisation .......................................................................................................... 16
LIST OF TABLES Table 4.1: ER-MS Review Programme ................................................................................................. 10
Table 9.1: Drill and Exercise Schedule.................................................................................................. 22
ATTACHMENTSATTACHMENT Q6.6A Notifying Emergency Services 3 Pages
For
insp
ectio
n pur
pose
s only
.
Conse
nt of
copy
right
owne
r req
uired
for a
ny ot
her u
se.
EPA Export 19-02-2014:23:34:03

Corrib Onshore Pipeline EIS Q6.6 – Emergency Response Planning and Provisions
COR-14-SH-0069 1 Rev 2
1 INTRODUCTION
This document presents a summary of the emergency response arrangements that will be in place for the operation of the Corrib pipeline. It presents information regarding the provisions (e.g. plans and equipment) that will be established, key roles and responsibilities and the means by which it will be ensured that the emergency response plans will be fit for purpose for all credible emergency scenarios. Figure 1.1 in Chapter 1 shows the onshore pipeline routing. It also outlines the interface with the local public in such an event and how people will be informed during such an event.
The document specifically addresses major accident scenarios that may have the potential to escalate and threaten the public.
Note:1. This document has been prepared for inclusion in the Corrib Onshore Environmental Impact Statement (EIS). It will ultimately cease to be a stand-alone document but instead be incorporated within the Corrib asset-wide documented Emergency Response Planning and Provisions.
2. As the route and detailed design of the onshore pipeline are fully developed, the pipeline specific aspects of this document will be finalised. Consequently parts of this document represent work in progress.
3. Formal liaison with Emergency Services and Mayo County Council will commence after planning permission has been granted, thus this document outlines the anticipated action and issues relevant to the role and involvement of those Agencies.
4. The term “Emergency Services” is used throughout this document to refer to the Principal Response Agencies (Gardaí, Ambulance Service, Fire Brigade) and the Coastguard.
For
insp
ectio
n pur
pose
s only
.
Conse
nt of
copy
right
owne
r req
uired
for a
ny ot
her u
se.
EPA Export 19-02-2014:23:34:03
Corrib Onshore Pipeline EIS Q6.6 – Emergency Response Planning and Provisions
COR-14-SH-0069 2 Rev 2
2 INTERFACE WITH THE PUBLIC
An Emergency Response Plan is a mandatory regulatory requirement for pipeline systems in Ireland. SEPIL has given due consideration to the development of the proposed Emergency Response Plan which will be required to be put in place should the pipeline receive planning permission.
A key element of any emergency response system is the interface with the public and the following points highlight SEPIL intentions with respect to interfacing with the local community on issues relating to the Emergency Response Plan.
2.1 COMMUNITY LIAISON
Prior to the pipeline becoming operational SEPIL plant personnel responsible for emergency provisions, will liaise with all residents living within a pre-determined emergency planning zone. Part of this liaison will be to ensure that residents are briefed on the specific details of what they are advised to do in the case of an emergency and how they would be contacted.
It is proposed that residents would receive an information pack containing briefing material on what to do in an emergency, with all relevant contact details of emergency response services. The briefing pack would also contain details of the automated IT contact system (see below) to be operated by SEPIL emergency response. This information will also be published on the SEPIL website.
2.2 PUBLIC NOTIFICATION
The Bellanaboy Bridge Gas Terminal will be equipped with an automated IT system to enable rapid and synchronous notification of all parties in the event of an incident associated with the pipeline. The system will allow for messages to be entered at the Gas Terminal and will then in turn relay the message to all the telephone numbers held within the system database
Prior to commencement of pipeline operations, all dwellings within a specified distance of the pipeline route will be contacted and invited to submit their priority contact details for entry into the automated system. Local residents and other relevant community neighbours can register their details, only if they wish to do so. It will be the ongoing responsibility of the Terminal HSSE Advisor to ensure that these important details are maintained up to date. The information will be retained as confidential strictly for use in an emergency or if an exercise is being planned of which the public should be made aware
2.3 INFORMATION DURING AN INCIDENT
The following information will be released to the general public during an incident:
Type of incident
Location and proximity of the incident to people in the vicinity
Actions the general public should take
Action being taken to correct the situation and time period anticipated
Contacts for additional information
For
insp
ectio
n pur
pose
s only
.
Conse
nt of
copy
right
owne
r req
uired
for a
ny ot
her u
se.
EPA Export 19-02-2014:23:34:03
Corrib Onshore Pipeline EIS Q6.6 – Emergency Response Planning and Provisions
COR-14-SH-0069 3 Rev 2
3 OVERVIEW OF PIPELINE EMERGENCY RESPONSE SCENARIOS
Emergency Response Plans are a mandatory regulatory requirement for pipeline systems in Ireland. Any Emergency Response system is developed on the basis that, although extremely unlikely, adverse events may occur (should the preventative measures fail). An Emergency Response Plan, however does not provide any indication of the likelihood of such events occurring in practice. The design and operational controls in place to minimise the possibility that such events may occur are discussed in detail in Appendix Q6.3.
The hazard assessment studies performed for the Corrib pipeline are brought together in the Qualitative Risk Assessment (Appendix Q6.3), with detailed consequence effects e.g. distances, contained within Appendix Q6.4. From these studies, the following major accident scenarios with the potential to threaten the public exist for the pipeline:
Hydrocarbon release from subsea facilities (wells, flexible flowlines, manifold or offshore pipeline);
Hydrocarbon release from LVI; and
Hydrocarbon release from onshore pipeline;
The design and operational controls in place to minimise the possibility that such events may occur are discussed in detail in the Qualitative Risk Assessment in the form of bowtie diagrams.
3.1 HYDROCARBON RELEASE FROM OFFSHORE PIPELINE
Potential causes of a release from the offshore pipeline (including the small on-land section up to the LVI) are described in the Qualitative Risk Assessment together with detailed review of the preventative controls. Should a release occur, the credible outcomes are:
an unignited, relatively small leak of hydrocarbons;
an unignited large hydrocarbon release or rupture; and / or
an ignited release with associated fire effects.
For the majority of the offshore pipeline length, should a release occur, any released gas will be into deep water and hence it is probable that the gas will disperse to below its lower flammable limit and cannot be ignited. Should the release occur in shallower water near-shore, then the possibility exists that ignitable gas clouds (i.e. above the lower flammable limit) may occur (which may impact persons onshore) and, for the duration of the release, the gas may cause a reduction in water density (affecting buoyancy) which may affect any nearby vessels.
The potential environmental effects of any release are minimal as the hydrocarbon fluids contain only very small amounts of condensate, methanol and water.
3.2 HYDROCARBON RELEASE FROM LVI
Potential causes of a release from the LVI are described in the Qualitative Risk Assessment together with detailed review of the preventative controls. Should a release occur, the credible outcomes are:
an unignited, relatively small leak of hydrocarbons;
an unignited large hydrocarbon release; and/or
an ignited release.
Should a large ignited event occur, then possible consequences may be a jet fire (should ignition occur immediately) or a flash fire (should gas accumulate and later ignite).
The LVI is a normally unmanned installation and is remote from occupied dwellings. There are few ignition sources at the LVI; all electrical systems are installed and maintained to the appropriate
For
insp
ectio
n pur
pose
s only
.
Conse
nt of
copy
right
owne
r req
uired
for a
ny ot
her u
se.
EPA Export 19-02-2014:23:34:03
Corrib Onshore Pipeline EIS Q6.6 – Emergency Response Planning and Provisions
COR-14-SH-0069 4 Rev 2
hazardous area classification and hot work is an infrequent occurrence managed and controlled by the permit-to-work system.
As noted above, the potential environmental effects of any release are minimised as the gas has only very small amounts of condensate, methanol and water. For any releases occurring at the LVI, there are drainage and spill containment systems to further reduce the potential for offsite effects.
3.3 HYDROCARBON RELEASE FROM ONSHORE PIPELINE
Potential causes of a release from the onshore pipeline are described in the Qualitative Risk Assessment together with detailed review of the preventative controls. Should the preventive measures fail and one of the potential causes result in a hydrocarbon release, the magnitude of any consequences will primarily be determined by the size of the hole in the pipeline and the operating pressure at that time. Should a release occur, the credible outcomes are:
an unignited, relatively small leak of hydrocarbons;
an unignited large hydrocarbon release; and/or
an ignited release.
For the purposes of emergency response planning, the majority of potential pipeline releases taken into account would be from small holes rather than rupture of the pipeline itself. For these majority cases, depending on whether the gas immediately ignites (in which case a jet fire will occur) or disperses (in which case should an ignition source be found, a flash fire may occur) the extent of possible harm has been assessed in Appendix Q6.4.
For a rupture on land, very early ignition of the release generally results in a fireball which then rapidly dies back to a jet fire burning within the crater formed by the force of the release. The intensity of the fire will decline as the pressure within the pipeline reduces.
For releases underwater (i.e. in Sruwaddacon Bay), as with the offshore section, some dispersion may occur as the gas passes through the water, however this will depend on the water depth at the release point, and the potential hence exists for a gas cloud above the lower flammable limit to form at the surface and/or localised buoyancy effects. Although the pipeline is encased within a fully grouted tunnel for the underwater section (providing additional protection against impact and also ignition), the tunnel is not intended to be gas-tight, and hence any small releases will be revealed as surface bubbles, allowing for corrective actions to be taken.
For in
spec
tion p
urpo
ses o
nly.
Conse
nt of
copy
right
owne
r req
uired
for a
ny ot
her u
se.
EPA Export 19-02-2014:23:34:03
Corrib Onshore Pipeline EIS Q6.6 – Emergency Response Planning and Provisions
COR-14-SH-0069 5 Rev 2
4 MANAGEMENT OF EMERGENCY RESPONSE FOR THE CORRIB DEVELOPMENT
The Corrib Gas Field Development comprises four distinct but inter-related elements:
reservoir and offshore seabed installation (subsea wells, wellheads and manifold);
offshore gas pipeline (between the wellheads and landfall at Glengad);
onshore gas pipeline between landfall and the gas terminal at Bellanboy including the Landfall Valve Installation (LVI), at Glengad; and
Bellanboy Bridge Gas Terminal and export to the Bord Gáis Éireann (BGE) operated pipeline.
Emergency response for the entire Corrib asset operations will be managed in an integrated fashion, with a single internal organisation responsible for ensuring appropriate response to emergencies within Corrib associated with any of the four elements from the offshore wells through to the point of export of treated natural gas to the BGE pipeline. SEPIL’s emergency response arrangements will provide support and back-up to the active response provided by the emergency services and Mayo County Council as required by the exact nature of the situation.
The emergency response arrangements for operation of the Corrib facilities will be documented in the operation’s Emergency Response Management System documentation, which ensures that the findings of the facility and pipeline safety assessments are used to identify the credible foreseeable emergencies and to prepare and test the emergency plans.
The emergency response organisation consists of three tiers that provide the operational, tactical and strategic response to dealing with a major incident or emergency. These three tiers are based on emergency response being handled at the incident site (Local Response Team, LRT), with emergency management and strategic support being provided by an Emergency Co-ordination Team (ECT) at SEPIL’s Belmullet office and crisis management being provided for by the SEPIL Crisis Management Team (CMT) based in Corrib House in Dublin. For significant offshore incidents, management of the response is escalated up to Shell’s Dispatch Co-ordination Centre in Aberdeen.
At all stages, the local Emergency Services will be fully involved in management of on-the-ground activities.
4.1 DEFINITIONS AND CLASSIFICATIONS
In the context of this document the following definitions are used by SEPIL:
Emergency
“Any sudden, abnormal or unplanned situation, which requires immediate attention and may endanger human life or the environment.”
Emergency Response
“The marshalling of support to physically intervene and respond to an emergency such that the situation is brought under control in order that recovery measures can be implemented.”
Crisis
“Any event, or series of events, that falls outside normal business contingency and emergency response arrangements”
Whilst an emergency may escalate into a crisis, it must be recognised that this will not always be the case. The Duty Manager will make the decision whether or not “emergency response” needs to be escalated to “crisis response”.
For
insp
ectio
n pur
pose
s only
.
Conse
nt of
copy
right
owne
r req
uired
for a
ny ot
her u
se.
EPA Export 19-02-2014:23:34:03

Corrib Onshore Pipeline EIS Q6.6 – Emergency Response Planning and Provisions
COR-14-SH-0069 6 Rev 2
Escalation of an Emergency to a Crisis
Phase I Emergency
Phase II Emergency
Phase III Emergency / Level 1 CrisisLocal CrisisAn incident occurs at a local business level and is not likely to have immediate country or broader business implications.
Local Emergency A local incident that requires immediate attention To re-establish control
Location EmergencyA non-routine situation needing immediate attention (e.g. medical, minor fires and oil spills)
Escalation of the situation is defined using “Emergency phases” (Phases I to III) and “Crisis levels” (Levels 1 to 3). There is a crossover point when an “Emergency” becomes a “Crisis” and this occurs at “Phase III Emergency / Level 1 Crisis”.
Emergency Phases
Phase I Emergency - Location Emergency A non-routine situation needing immediate attention (e.g. medical, minor fires and minor spills)
Emergencies will be reported to the Location Manager (anyone who is responsible for managing the situation at a local level, i.e. Plant Installation Manager). A Location Response Team (LRT) will be formed to support the Location Manager.
The Location Manager will inform the Emergency Co-ordinator (EC) and, if the situation allows, their Asset Leader. If the situation escalates, the EC will liaise with the location Asset Leader to declare an emergency.
Depending on the nature and location of the emergency, the EC will constantly monitor the requirement for alerting/involvement of local services (Gardaí, ambulance, fire brigade, coastguard) to assist in managing the incident and ensuring public safety.
Phase II Emergency - Local EmergencyA local incident that requires immediate attention that is not under control
If an emergency is called, the EC is responsible for managing the situation. The EC will mobilise the Emergency Co-ordination Team (ECT), and inform the Crisis Management Team (CMT) depending on the situation.
If an ECT is assembled, they will provide support to the Location Response Team. The EC shall follow initial verbal notification by a written incident summary for all events to the CMT.
Phase III Emergency / Level 1 Crisis - Local CrisisAn incident occurs that has the potential to have wider implications.
If a crisis is called the Crisis Management Team (CMT) will convene in a Crisis Room (in Dublin), with the CMT leader responsible for managing the crisis in support of the affected Asset and addressing broader and longer-term implications.
In consultation with local Asset/Country management, the UIE duty manager will decide what resource and support is needed and, if the crisis escalates, whether to activate the UIE Regional Crisis Team.
The focus of this document is emergency response and thus crisis management is not further described in this document.
For
insp
ectio
n pur
pose
s only
.
Conse
nt of
copy
right
owne
r req
uired
for a
ny ot
her u
se.
EPA Export 19-02-2014:23:34:03
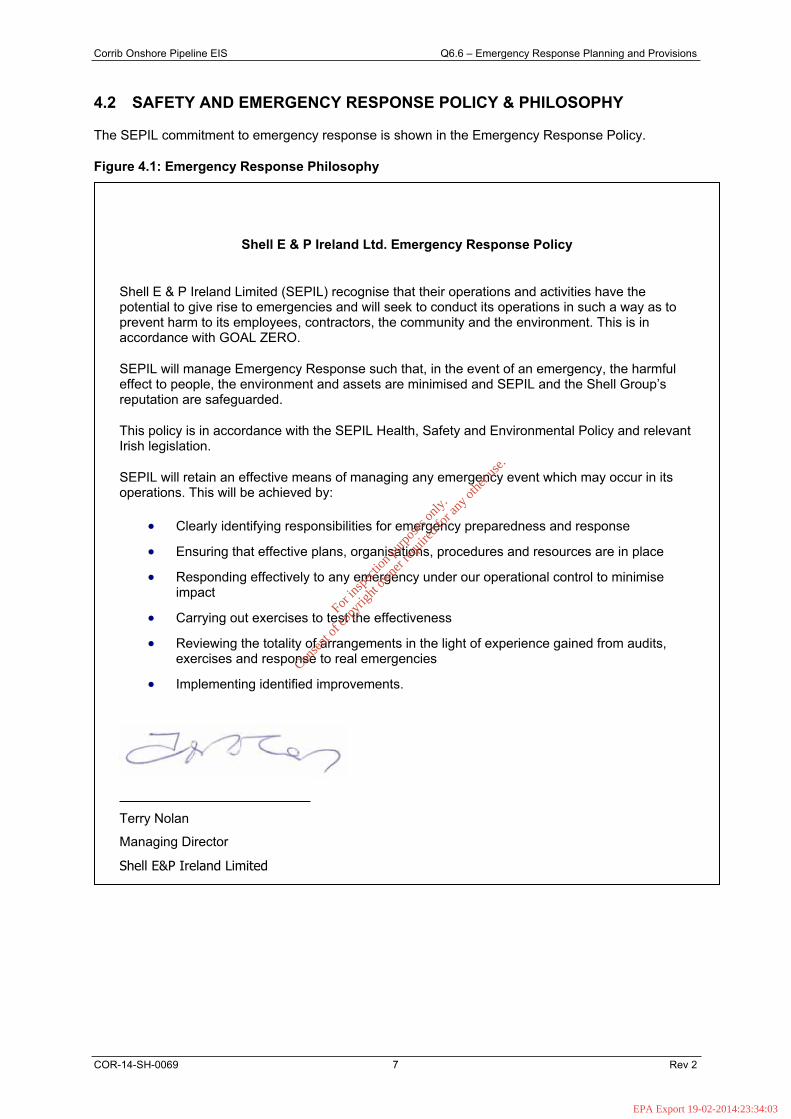
Corrib Onshore Pipeline EIS Q6.6 – Emergency Response Planning and Provisions
COR-14-SH-0069 7 Rev 2
4.2 SAFETY AND EMERGENCY RESPONSE POLICY & PHILOSOPHY
The SEPIL commitment to emergency response is shown in the Emergency Response Policy.
Figure 4.1: Emergency Response Philosophy
Shell E & P Ireland Ltd. Emergency Response Policy
Shell E & P Ireland Limited (SEPIL) recognise that their operations and activities have the potential to give rise to emergencies and will seek to conduct its operations in such a way as to prevent harm to its employees, contractors, the community and the environment. This is in accordance with GOAL ZERO.
SEPIL will manage Emergency Response such that, in the event of an emergency, the harmful effect to people, the environment and assets are minimised and SEPIL and the Shell Group’s reputation are safeguarded.
This policy is in accordance with the SEPIL Health, Safety and Environmental Policy and relevant Irish legislation.
SEPIL will retain an effective means of managing any emergency event which may occur in its operations. This will be achieved by:
Clearly identifying responsibilities for emergency preparedness and response
Ensuring that effective plans, organisations, procedures and resources are in place
Responding effectively to any emergency under our operational control to minimise impact
Carrying out exercises to test the effectiveness
Reviewing the totality of arrangements in the light of experience gained from audits, exercises and response to real emergencies
Implementing identified improvements.
Terry Nolan
Managing Director
Shell E&P Ireland Limited
For
insp
ectio
n pur
pose
s only
.
Conse
nt of
copy
right
owne
r req
uired
for a
ny ot
her u
se.
EPA Export 19-02-2014:23:34:03
Corrib Onshore Pipeline EIS Q6.6 – Emergency Response Planning and Provisions
COR-14-SH-0069 8 Rev 2
The underlying philosophy of the Corrib facility’s Emergency Response arrangements is to minimise:
Risk to life i.e. harm to public, staff, contractors, visitors and the Emergency Services;
Any possible harmful effects on the environment; and
Damage to facilities and infrastructure.
With these critical and overriding objectives in mind, much of the plans and procedures are based upon minimising direct exposure of people to risk while containing and mitigating the consequence of any loss of control that creates an emergency situation.
In the event of an emergency all facility personnel are trained and instructed in the correct response to the various scenarios as described further in this document.
All planned responses are based upon quickly and effectively:
Evacuating all personnel away from the area(s) of risk and into a safe location.
Protecting the local community.
Protecting the environment.
Mitigating the effects of the emergency in other ways that are practical and do not increase the overall risk.
4.3 KEY CONTROLS
Due to the pipeline and terminal’s location, the response, control and mitigation of any potential emergency situation are designed as far as is practicable to be self-sufficient.
Prompt direct intervention by the operations personnel and executive action by the automatic safeguarding systems is specifically designed to prevent an escalation of any emergency event.Operations personnel will take initial action in accordance with the final emergency response plan (e.g. gas test, cordoning, alerting) until such time as the public services arrive.
While the pipeline is designed and will be operated to prevent any uncontrolled/unintended events potentially leading to emergency situations, it is essential that plans and procedures must be in place to enable the recovery of control and mitigation of the consequences, however unlikely. Consultation, co-ordination and co-operation with the Emergency Services is a vital part of any emergency response plan to ensure they can fulfil any required roles and also are fully aware of any potential hazards associated with response to such incidents.
The plans and procedures for any unwanted event are to a significant degree based upon the robust and comprehensive automatic detection and shutdown systems described in greater detail in Appendix Q6.3.
Essentially, the pipeline routing and separation from occupied areas, remote location of the LVI, together with the manning strategy, effectively limits the numbers of people exposed to potential risks.
Maintenance and other activities that involve process interventions will, with the exception of some approved routine activities, be planned and executed during normal dayshift schedules. All activities whether on dayshift or nightshift will only be permitted following the appropriate level of risk assessments and controls including the Integrated Safe System of Work Permit Procedures. Note also that limitations will be in place in the Operation’s HSE Case, as to the type and scale of activities that are permitted to take place during periods of lower manning levels and also during times where equipment and operational systems are taken out of service or have their effectiveness reduced.
Training, formal assessment, competence assurance, supervisory and management controls additionally enhance the inherent safe design features of the Corrib pipeline.
For
insp
ectio
n pur
pose
s only
.
Conse
nt of
copy
right
owne
r req
uired
for a
ny ot
her u
se.
EPA Export 19-02-2014:23:34:03
Corrib Onshore Pipeline EIS Q6.6 – Emergency Response Planning and Provisions
COR-14-SH-0069 9 Rev 2
4.4 EMERGENCY RESPONSE MANAGEMENT SYSTEM
Emergency response for the pipeline will be managed in an integrated fashion, with a single internal organisational structure responsible for an appropriate response to incidents both at the pipeline and at the Gas Terminal through the emergency services and Mayo County Council as appropriate. With these objectives in mind, the Corrib Emergency Response Management System (ER-MS) will ensure all personnel know their roles, responsibilities and responses should an emergency occur at the Corrib facilities; defining the Emergency Response Organisation, philosophy and principles, together with all required actions.
It is recognised that such a management system cannot cover every emergency situation that may arise, however the effectiveness of the response depends on individuals being aware of their responsibilities and accountability within the framework of the emergency procedures. The actions taken in the event of an emergency will depend on the circumstances at the time, and hence the ER-MS acts as guidance for dealing with emergency situations.
The ER-MS is intended for several groups of target readers, including:
Regulatory bodies and agencies such as Gardaí, Health and Safety Authority, Irish Coastguard, Health Service Executive, Department of Communications, Energy and Natural Resources, Commission for Energy Regulation and Fire Services who provide support or interface with SEPIL in the event of an emergency on the Corrib Facilities.
All Corrib personnel, specifically those with Emergency Response duties;
Other Shell personnel that may support Emergency Response;
Contract companies and their personnel who interface with SEPIL on the Corrib Facilities;
4.4.1 ER-MS Owner and Custodian
The Gas Terminal Plant Installation Manager is accountable for the content of the ER-MS and for ensuring that sufficient competent resources are available to respond to any foreseeable emergency associated with the Corrib Facilities.
The Gas Terminal Health, Safety, Security and Environmental Advisor is responsible for ensuring that the ER-MS remains a controlled document, which is updated and revised as necessary.
4.4.2 ER-MS Review Periods
It is the responsibility of the Gas Terminal HSSE Advisor to ensure that the contents of the Emergency Response management system are updated as appropriate e.g. telephone directory is checked every six months etc. All relevant changes will be communicated to the SEPIL HSE Coordinator immediately.
The Gas Terminal review and audit programme includes Emergency Response as either a potential stand-alone subject, or integral with, for example a HSE MS audit. This will be incorporated as part of the agenda for the SEPIL HSE Committee meetings and significant conclusions of any audits and reviews will be included in the Annual Assurance Letter
Review and, if necessary, updating of the Gas Terminal ER-MS will take place:
a) In accordance with the facility’s review programme (Table 4.1)
b) As a minimum on an annual basis as part of the HSE-MS review;
c) When changes occur that may impact the major accident hazards or how they are managed;
d) When hardware or software changes occur which may impact the document contents;
e) To implement mandatory Emergency Response requirements from Shell Group, UI or UIE.
For
insp
ectio
n pur
pose
s only
.
Conse
nt of
copy
right
owne
r req
uired
for a
ny ot
her u
se.
EPA Export 19-02-2014:23:34:03
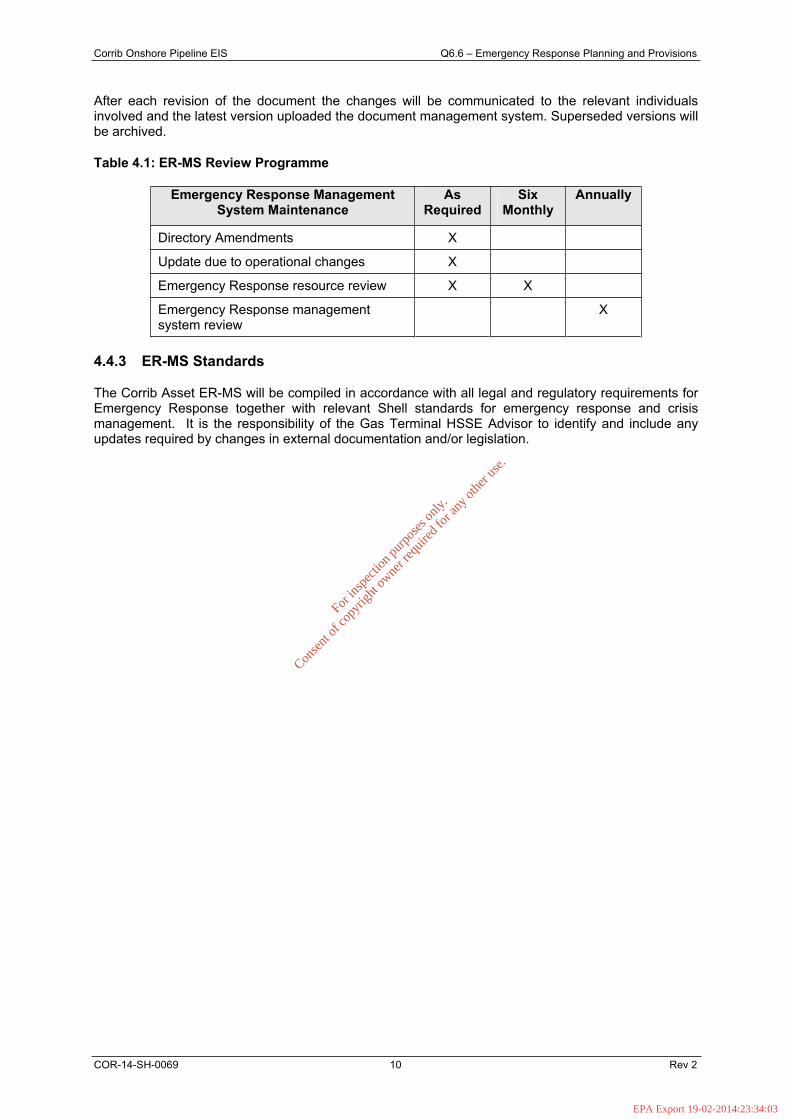
Corrib Onshore Pipeline EIS Q6.6 – Emergency Response Planning and Provisions
COR-14-SH-0069 10 Rev 2
After each revision of the document the changes will be communicated to the relevant individuals involved and the latest version uploaded the document management system. Superseded versions will be archived.
Table 4.1: ER-MS Review Programme
Emergency Response Management System Maintenance
AsRequired
SixMonthly
Annually
Directory Amendments X
Update due to operational changes X
Emergency Response resource review X X
Emergency Response management system review
X
4.4.3 ER-MS Standards
The Corrib Asset ER-MS will be compiled in accordance with all legal and regulatory requirements for Emergency Response together with relevant Shell standards for emergency response and crisis management. It is the responsibility of the Gas Terminal HSSE Advisor to identify and include any updates required by changes in external documentation and/or legislation.
For
insp
ectio
n pur
pose
s only
.
Conse
nt of
copy
right
owne
r req
uired
for a
ny ot
her u
se.
EPA Export 19-02-2014:23:34:03
Corrib Onshore Pipeline EIS Q6.6 – Emergency Response Planning and Provisions
COR-14-SH-0069 11 Rev 2
5 PIPELINE EMERGENCY RESPONSE PROVISIONS
5.1 DESIGN LAYOUT
The design of the pipeline routing and landfall valve installation (LVI) has been placed to achieve separation from locations where people (both public and plant personnel) may be present. The LVI is unmanned during normal operations (monitored from the terminal control room) and all initial emergency response will be from the terminal control room which is designed to give a high degree of protection to its occupants from any incidents occurring at the pipeline or terminal.
5.2 RELEASE DETECTION
The primary means of detecting releases from the pipeline system will be from process monitoring and alarms at the Gas Terminal control room. Depending on the size and location of any release, the following systems may be used:
Pipeline mass balance
Fibre optic system
Well pressure sensors
Terminal pressure/flow sensors
Personnel intervention
CCTV at the LVI.
5.2.1 Pipeline Mass Balance
The pipeline mass balance is a dedicated leak detection system that compares the pressures and flows from the subsea wells and the terminal using statistical and mass balance techniques. It monitors both the onshore and offshore sections with an interface to the Gas Terminal Distributed Control System that alerts the operator in the event of a problem. The speed of response of the mass balance system will be influenced by the magnitude of the release, allowing for the more onerous, larger, releases to be detected most rapidly.
5.2.2 Fibre Optic System
The onshore pipeline is to be fitted with a fibre optic system that will have dual functions of detecting disturbance (e.g. from an external digger) and also leak detection by registering the sound signature and reporting to the terminal control room.
5.2.3 Well Pressure Sensors
Each well is fitted with pressure sensors at the Xmas tree which, in the event of a major release from the offshore flexible flowline, will raise a low pressure alarm to the terminal operator.
5.2.4 Terminal Pressure/Flow Sensors
Low pressure trip and loss of flow into terminal will automatically stop terminal processes and cause equipment to shutdown, allowing for operator intervention to isolate the pipeline (e.g. at the wells, at the LVI).
5.2.5 Personnel Intervention
In addition to the above systems, releases may also be identified by plant personnel, security patrols or members of the public e.g. from water discolouration, noise of release, vapour cloud. It should be noted, however, that given the pipeline routing away from occupied areas no reliance is placed on external notification of a release.
For
insp
ectio
n pur
pose
s only
.
Conse
nt of
copy
right
owne
r req
uired
for a
ny ot
her u
se.
EPA Export 19-02-2014:23:34:03
Corrib Onshore Pipeline EIS Q6.6 – Emergency Response Planning and Provisions
COR-14-SH-0069 12 Rev 2
Information will be provided to all local residents and notices posted (e.g. at the LVI) of actions to be taken if a release is suspected and of contact details.
5.2.6 CCTV
CCTV is provided for the interior and exterior of the LVI which may give a visual alert to the terminal control room operators of releases in this area from vapour signs.
5.3 SAFEGUARDING EMERGENCY SHUTDOWN
The pipeline is protected against overpressure scenarios by a number of layers. A detailed description of the layers of protection is given in Appendix Q4.5.
In the event of an incident, the shutdown levels cascade to place the terminal and pipeline progressively into a safer and safer condition.
5.4 ISOLATION
Isolation of various parts of the pipeline may be both manually initiated by the control operator or automatically by the plant protection systems. Dependent upon the exact nature of the emergency situation, isolation may be performed at:
Individual Wells
Pipeline End Manifold (by remotely operated vehicle (ROV))
Landfall Valve Installation (LVI)
Terminal Isolation Valve
5.5 DEPRESSURISATION
Where required by a loss of containment emergency situation, the control room operator may isolate the affected part of the pipeline either by closing the offshore wells or isolating at the LVI, and then may perform a controlled drawdown (or emergency blowdown using the flare) of the pipeline pressure using the terminal facilities, to reduce the pipeline pressure and hence outflow rates (See Appendix Q4.5).
5.6 COMMUNICATIONS TO SUPPORT EMERGENCY RESPONSE
An example of a Notifying the Emergency Services list for use by operators is shown in Attachment Q6.6A. A list of Relevant Emergency Contact Numbers will be completed at the appropriate time. A list such as this will be in place during pipeline operations and will be continuously updated.
5.6.1 Telephone System
In addition to the Gas Terminal internal telephone system, telephones with the ability to dial external numbers and the ability to receive calls directly from outside numbers and mobile numbers are provided at various locations. These telephones operate on the Private Automatic Branch Exchange which, in the event of failure is backed up by the Public Switch Telephone Network (PSTN) telephones located:
Security x 2 Control Room x 2 Plant Installation Manager’s Office Production Supervisors Office HSSE Advisors Office Conference / Main meeting Room Telecommunications Equipment Room for testing and general use.
For
insp
ectio
n pur
pose
s only
.
Conse
nt of
copy
right
owne
r req
uired
for a
ny ot
her u
se.
EPA Export 19-02-2014:23:34:03
Corrib Onshore Pipeline EIS Q6.6 – Emergency Response Planning and Provisions
COR-14-SH-0069 13 Rev 2
The LVI will be fitted with a landline telephone connection and is also covered by a mobile phone network.
In the event of failure of the PSTN, the Gas Terminal has a Vodafone cell on site in the telecommunications equipment room providing mobile phone coverage over the entire SEPIL land plot and pipeline route. The only type of mobile phones permitted on site are Intrinsically Safe mobile phones which are provided for staff working at the LVI and authorised personnel working on the Gas Terminal.
See also Section 2.2.
5.6.2 Plant Radio System
A UHF radio system is provided to give coverage throughout the entire Gas Terminal site, with sufficient spare radios to issue to Emergency Services’ personnel on arrival at the terminal. This would be done in accordance with pre-incident planning agreements. The radios have four channels;
Operations Maintenance Security Emergency Response
For pipeline incidents off the main terminal site, intrinsically safe mobile phones will be used to allow for communications between the Location Response Team members and the control room.
For offsite incidents, the emergency services will manage their own communications systems using their existing systems. A common centre e.g. the control room, will be designated, where command personnel e.g. the Chief Fire Officer and the Site Main Controller, will be located, allowing for close communication between all parties.
5.7 EMERGENCY EQUIPMENT
The dedicated Emergency Response Equipment storage base will be located at the terminal and will contain the following equipment:
Breathing Apparatus (BA) Rescue Team equipment Additional PPE for fire fighting team Stretchers Chemical Spill Response Team equipment First Aid Equipment
Transportation of Emergency BA equipment will be via use of the on site Emergency Response Vehicle and Trailer.
Mobile and hand-held fire extinguishers are provided at the LVI and at the terminal.
In addition to the above, a contract is maintained with a specialist pollution response organisation providing 24 hour cover for any onshore events. Pollution response offshore will be coordinated with the Coastguard, with access to Shell’s resources where required.
For
insp
ectio
n pur
pose
s only
.
Conse
nt of
copy
right
owne
r req
uired
for a
ny ot
her u
se.
EPA Export 19-02-2014:23:34:03
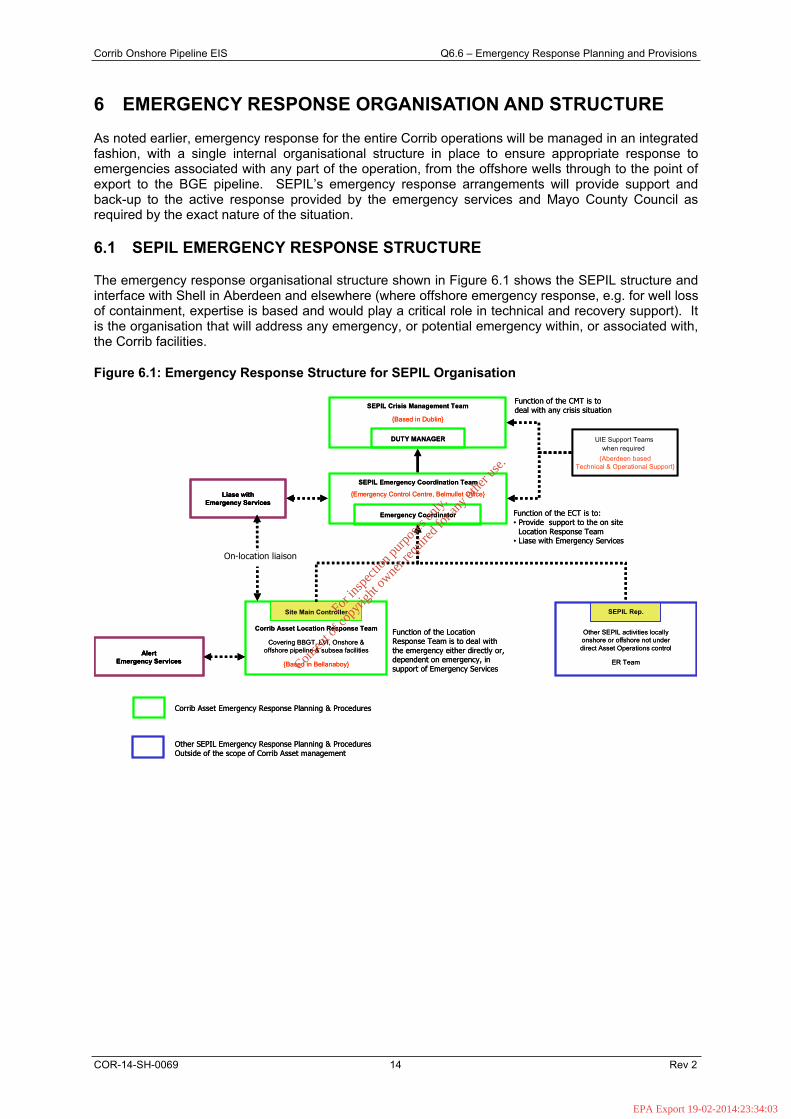
Corrib Onshore Pipeline EIS Q6.6 – Emergency Response Planning and Provisions
COR-14-SH-0069 14 Rev 2
6 EMERGENCY RESPONSE ORGANISATION AND STRUCTURE
As noted earlier, emergency response for the entire Corrib operations will be managed in an integrated fashion, with a single internal organisational structure in place to ensure appropriate response to emergencies associated with any part of the operation, from the offshore wells through to the point of export to the BGE pipeline. SEPIL’s emergency response arrangements will provide support and back-up to the active response provided by the emergency services and Mayo County Council as required by the exact nature of the situation.
6.1 SEPIL EMERGENCY RESPONSE STRUCTURE
The emergency response organisational structure shown in Figure 6.1 shows the SEPIL structure and interface with Shell in Aberdeen and elsewhere (where offshore emergency response, e.g. for well loss of containment, expertise is based and would play a critical role in technical and recovery support). It is the organisation that will address any emergency, or potential emergency within, or associated with, the Corrib facilities.
Figure 6.1: Emergency Response Structure for SEPIL Organisation
SEPIL Crisis Management Team
{Based in Dublin}
Corrib Asset Location Response Team
Covering BBGT, LVI, Onshore & offshore pipeline & subsea facilities
{Based in Bellanaboy}
SEPIL Emergency Coordination Team
{Emergency Control Centre, Belmullet Office}
Other SEPIL activities locally onshore or offshore not under direct Asset Operations control
ER Team
UIE Support Teams when required
{Aberdeen basedTechnical & Operational Support}
DUTY MANAGER
Emergency Coordinator
Corrib Asset Emergency Response Planning & Procedures
Other SEPIL Emergency Response Planning & Procedures Outside of the scope of Corrib Asset management
Site Main Controller
Liase withEmergency Services
SEPIL Rep.
AlertEmergency Services
Function of the CMT is to deal with any crisis situation
Function of the ECT is to:• Provide support to the on site
Location Response Team• Liase with Emergency Services
Function of the Location Response Team is to deal with the emergency either directly or, dependent on emergency, in support of Emergency Services
On-location liaison
SEPIL Crisis Management Team
{Based in Dublin}
Corrib Asset Location Response Team
Covering BBGT, LVI, Onshore & offshore pipeline & subsea facilities
{Based in Bellanaboy}
SEPIL Emergency Coordination Team
{Emergency Control Centre, Belmullet Office}
Other SEPIL activities locally onshore or offshore not under direct Asset Operations control
ER Team
UIE Support Teams when required
{Aberdeen basedTechnical & Operational Support}
DUTY MANAGER
Emergency Coordinator
Corrib Asset Emergency Response Planning & Procedures
Other SEPIL Emergency Response Planning & Procedures Outside of the scope of Corrib Asset management
Site Main Controller
Liase withEmergency Services
Liase withEmergency Services
SEPIL Rep.
AlertEmergency Services
AlertEmergency Services
Function of the CMT is to deal with any crisis situation
Function of the ECT is to:• Provide support to the on site
Location Response Team• Liase with Emergency Services
Function of the Location Response Team is to deal with the emergency either directly or, dependent on emergency, in support of Emergency Services
On-location liaison
For
insp
ectio
n pur
pose
s only
.
Conse
nt of
copy
right
owne
r req
uired
for a
ny ot
her u
se.
EPA Export 19-02-2014:23:34:03
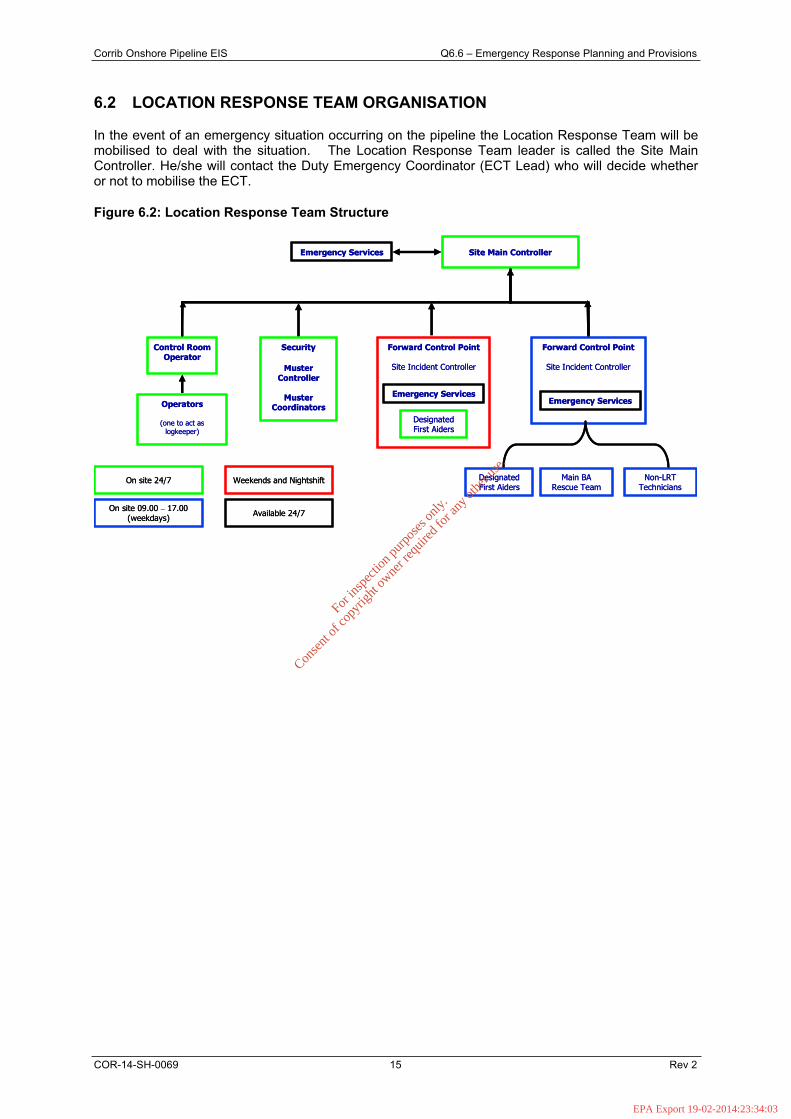
Corrib Onshore Pipeline EIS Q6.6 – Emergency Response Planning and Provisions
COR-14-SH-0069 15 Rev 2
6.2 LOCATION RESPONSE TEAM ORGANISATION
In the event of an emergency situation occurring on the pipeline the Location Response Team will be mobilised to deal with the situation. The Location Response Team leader is called the Site Main Controller. He/she will contact the Duty Emergency Coordinator (ECT Lead) who will decide whether or not to mobilise the ECT.
Figure 6.2: Location Response Team Structure
Control Room Operator
Security
Muster Controller
Muster Coordinators
Site Main Controller
Operators
(one to act as logkeeper)
Main BA Rescue Team
Non-LRT Technicians
Forward Control Point
Site Incident Controller
Emergency Services
Designated First Aiders
Forward Control Point
Site Incident Controller
Designated First Aiders
Emergency Services
Emergency Services
Weekends and Nightshift
On site 09.00 – 17.00 (weekdays)
On site 24/7
Available 24/7
For
insp
ectio
n pur
pose
s only
.
Conse
nt of
copy
right
owne
r req
uired
for a
ny ot
her u
se.
EPA Export 19-02-2014:23:34:03
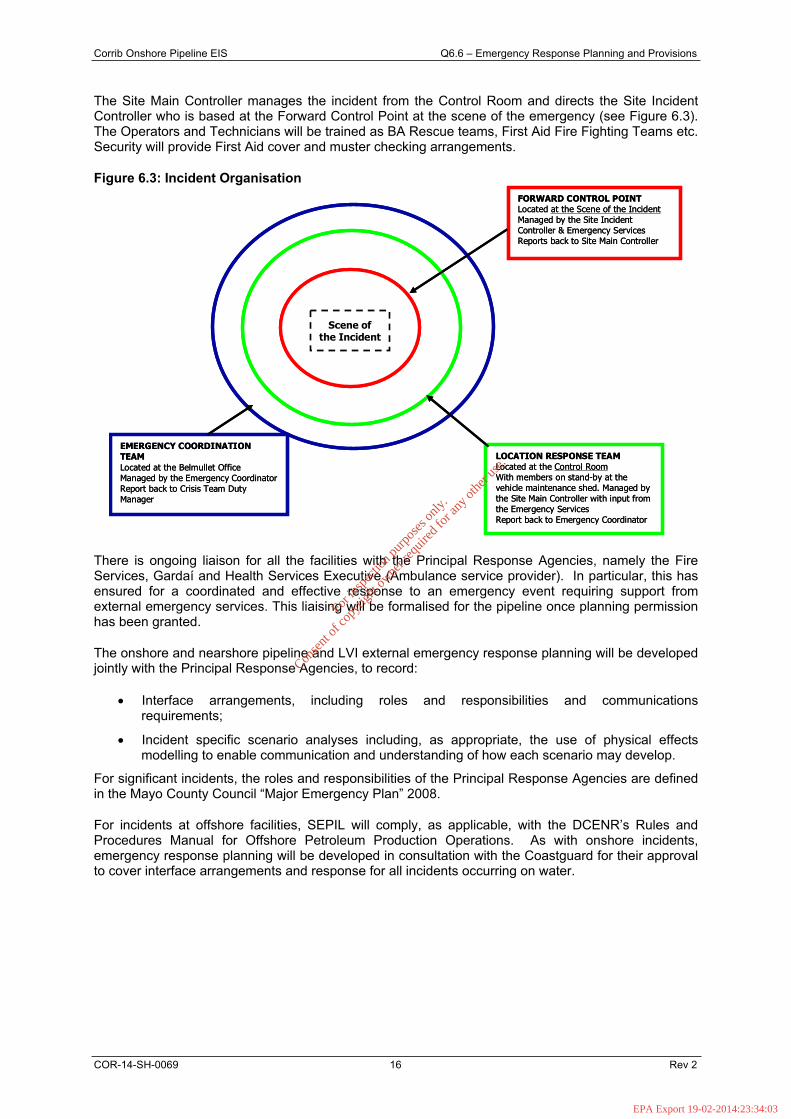
Corrib Onshore Pipeline EIS Q6.6 – Emergency Response Planning and Provisions
COR-14-SH-0069 16 Rev 2
The Site Main Controller manages the incident from the Control Room and directs the Site Incident Controller who is based at the Forward Control Point at the scene of the emergency (see Figure 6.3). The Operators and Technicians will be trained as BA Rescue teams, First Aid Fire Fighting Teams etc. Security will provide First Aid cover and muster checking arrangements.
Figure 6.3: Incident Organisation
Scene of the Incident
FORWARD CONTROL POINTLocated at the Scene of the IncidentManaged by the Site Incident Controller & Emergency ServicesReports back to Site Main Controller
LOCATION RESPONSE TEAMLocated at the Control RoomWith members on stand-by at the vehicle maintenance shed. Managed by the Site Main Controller with input from the Emergency ServicesReport back to Emergency Coordinator
EMERGENCY COORDINATION TEAMLocated at the Belmullet OfficeManaged by the Emergency Coordinator Report back to Crisis Team Duty Manager
There is ongoing liaison for all the facilities with the Principal Response Agencies, namely the Fire Services, Gardaí and Health Services Executive (Ambulance service provider). In particular, this has ensured for a coordinated and effective response to an emergency event requiring support from external emergency services. This liaising will be formalised for the pipeline once planning permission has been granted.
The onshore and nearshore pipeline and LVI external emergency response planning will be developed jointly with the Principal Response Agencies, to record:
Interface arrangements, including roles and responsibilities and communications requirements;
Incident specific scenario analyses including, as appropriate, the use of physical effects modelling to enable communication and understanding of how each scenario may develop.
For significant incidents, the roles and responsibilities of the Principal Response Agencies are defined in the Mayo County Council “Major Emergency Plan” 2008.
For incidents at offshore facilities, SEPIL will comply, as applicable, with the DCENR’s Rules and Procedures Manual for Offshore Petroleum Production Operations. As with onshore incidents, emergency response planning will be developed in consultation with the Coastguard for their approval to cover interface arrangements and response for all incidents occurring on water.
For
insp
ectio
n pur
pose
s only
.
Conse
nt of
copy
right
owne
r req
uired
for a
ny ot
her u
se.
EPA Export 19-02-2014:23:34:03
Corrib Onshore Pipeline EIS Q6.6 – Emergency Response Planning and Provisions
COR-14-SH-0069 17 Rev 2
7 EMERGENCY RESPONSE ROLES
7.1 ROLE OF THE PLANT INSTALLATION MANAGER OR APPOINTED DELEGATE
The Plant Installation Manager is ultimately responsible for ensuring that, at all times, that adequate emergency response arrangements exist to cover the entire Corrib facilities.
Holds overall responsibility for Emergency Response Management of the Gas Terminal, pipeline and wells.
Ensures that only competent personnel are appointed to positions on the Location Response Team.
Liaises with Emergency Services.
7.2 ROLE OF THE HSSE ADVISOR
Ensures the emergency response documentation is maintained up to date in accordance with the relevant statutory provisions, any organisational or technical changes that may occur, and any Shell requirements
Ensures all training and drill exercises are incorporated into the Gas Terminal HSSE Plan and carried out accordingly
7.3 ROLE OF LOCATION RESPONSE TEAM MEMBERS
The roles and responsibilities of all of the Location Response Team Members (shown in Figure 6.2) will be included in detail in the Corrib asset-wide documented Emergency Response Management System. The roles of the Site Main Controller and Control Room Operator are given below.
7.3.1 Role of the Site Main Controller
(Normally the Shift Supervisor based in the Control Room) The initial responsibility for managing an incident will be with the on Duty Operations Shift Supervisor who assumes the role of Site Main Controller (SMC). Should the SMC be incapacitated then a pre-appointed stand-in (normally the CRO) will assume the role.
The role of SMC is crucial to ensure that the initial and ongoing response to any incident is robust, co-ordinated, and effective. In order to ensure this can be achieved, persons undertaking this role have the appropriate skills, knowledge, experience, and training.
Note: Depending on the emergency scenario and based on pre-incident planning agreements, the Site Main Controller may hand over overall on-site emergency management responsibility to the Emergency Services. In this case the intervention and control responsibilities below would, after handover, alter. However, the individual’s fundamental responsibility for ensuring internal coordination and communication remains.
7.3.2 Role of the Control Room Operator (CRO)
The role of the CRO is to control the incident during an emergency event and to assist the Site Main Controller in responding to the incident by monitoring the wells, pipeline and plant and all safety systems from the Control Room (if safe to do so) and advising the Site Main Controller of any significant changes or developments.
7.4 ROLE OF THE EMERGENCY COORDINATION TEAM (ECT)
The role of the Emergency Coordination Team is to provide additional support to, and to reduce the administrative burden of the Location Response Team.
The duties of the Emergency Coordination Team will be included in detail in the Corrib asset-wide documented Emergency Response Management System.
For
insp
ectio
n pur
pose
s only
.
Conse
nt of
copy
right
owne
r req
uired
for a
ny ot
her u
se.
EPA Export 19-02-2014:23:34:03
Corrib Onshore Pipeline EIS Q6.6 – Emergency Response Planning and Provisions
COR-14-SH-0069 18 Rev 2
7.5 DUTIES OF THE EMERGENCY SERVICES LEAD AGENCY
The mandate of the Lead Agency is described in Appendix A9 (pp. 82-83) of the Mayo County Council “Major Emergency Plan” 2008.
7.5.1 Duties of the Emergency Services Upon Arrival at Scene
The following is proposed as the basis for discussion and agreement with the Emergency Services following receipt of planning permission:
1. Mobilise to the pre-agreed Rendezvous Point (RVP)
2. Issue intrinsically safe radios compatible with the Gas Terminal LRT radios
3. Obtain a briefing from the Site Main Controller or his delegate on:
a. The nature of the event, b. Missing or injured persons c. Possible escalation scenarios d. Any essential controls or precautions necessary e. Status of the pipeline f. Status of Site Incident Controller and their team
4. The Senior Emergency Services officer will now take control of the situation and carry out any action they deem necessary to bring the situation under control. These actions will, as appropriate, be based upon advice from the Site Main Controller.
5. The Senior Emergency Services officer may dispatch personnel to the Forward Control Point and take over command from the Site Incident Controller. The Site Incident Controller will follow the direction of the Principle Response Agencies.
For
insp
ectio
n pur
pose
s only
.
Conse
nt of
copy
right
owne
r req
uired
for a
ny ot
her u
se.
EPA Export 19-02-2014:23:34:03
Corrib Onshore Pipeline EIS Q6.6 – Emergency Response Planning and Provisions
COR-14-SH-0069 19 Rev 2
8 RESPONSE FOR EMERGENCY SCENARIOS
The information presented provides initial guidance only, scenario specific pre-incident planning will be further developed to define, in detail, incident specific response plans. For all incidents the Site Main Controller and Emergency Services have authority to take any actions considered necessary to prevent escalation of any incident.
As noted in Section 3 there are three major accident hazard scenarios associated with the Corrib pipeline. The nature of the response will be dictated by the precise nature of the emergency and the status of any release (ignited, location, size etc.), but will typically, for major incidents, include:
Operator intervention to isolate the pipeline (at wells, LVI etc.) and reduce pipeline pressures thus minimising the release
Assessing the situation
Alerting relevant parties e.g. public, Emergency Services
Establishing restricted access areas
Managing situation on-site until the arrival of Emergency Services
One of the initial tasks will be to confirm the release location i.e. offshore, LVI, on- or near-shore and then to ensure that the appropriate Emergency Services are alerted e.g. Coastguard for offshore releases. The following general principles will apply and will be developed further, tested and implemented prior to operations commencing.
8.1 OFFSHORE PIPELINE AND SUBSEA FACILITIES EMERGENCY
Offshore pipeline incidents can be expected to be reported by any the following ways:
Instrument detection
Pipeline patrols (ROV inspections)
A member of the public e.g. fishing vessels (reporting to the Emergency Services or directly to the Gas Terminal)
By the Emergency Services (Coastguard patrol)
Control Room Operator
Inform Site Main Controller of any unexpected changes in flow characteristics.
Attempt to confirm source of flow characteristics
If flow characteristics indicate a leak or problem with the wells start shut in procedures (in consultation with Site Main Controller)
Site Main Controller
Inform Duty Emergency Coordinator
Attempt to confirm cause of changes to flow characteristics and release location
Consider shutting in wells
Consider shutting in flow lines
If leak confirmed, or indication of a potential leak strengthens: o Initiate safeguarding procedure (well and LVI shut in etc.) o Depressurise flow lines o Escalate to SEPIL ECT
For
insp
ectio
n pur
pose
s only
.
Conse
nt of
copy
right
owne
r req
uired
for a
ny ot
her u
se.
EPA Export 19-02-2014:23:34:03
Corrib Onshore Pipeline EIS Q6.6 – Emergency Response Planning and Provisions
COR-14-SH-0069 20 Rev 2
8.2 ONSHORE, NEARSHORE OR LVI EMERGENCY
Onshore, nearshore or LVI incidents can be expected to be reported by any the following ways:
Instrument detection
Pipeline patrols
Operators / Maintenance Technicians carrying out routine activities
A member of the public (reporting to the Emergency Services or directly to the Gas Terminal)
By the Emergency Services
Control Room Operator (CRO)
Notify the Site Main Controller
Notify the Emergency Services if required
In the event of a confirmed line failure initiate blowdown via emergency flare and wells shutdown as deemed necessary
Site Main Controller
Inform Duty Emergency Coordinator and confirm notification of Emergency Services
Dispatch LRT Technicians (including the Site Incident Controller) to the incident location with Gas Detectors
Assess the situation based on information from CRO and Site Incident Controller
Interface with the Emergency Services and offer technical support
Confirm terminal shut down and depressurisation as deemed necessary
Confirm off shore wells shutdown as deemed necessary
Site Incident Controller
Set up Forward Control Point and liaise with Principle Response Agencies to provide support
8.3 PIPELINE DAMAGE
A potential scenario is damage to the pipeline as a result of SEPIL or 3rd party activities (e.g. excavation, maintenance activities). Extensive measures have been incorporated into the design to minimise this possibility (see Section 2.3) and contact details are posted at regular intervals throughout the onshore sections of the pipeline to enable the Gas Terminal to be contacted and appropriate emergency response initiated.
In the event that a near miss has been reported or is thought to have occurred response measures will include:
Initiation of emergency response procedures
Gas testing and inspection and assessment of damage
Cordoning of area as appropriate
Alerting of Emergency Services as appropriate
Possible precautionary depressurisation of the pipeline
Assessment of damage
Implementation of ‘Pipeline Damage Procedure’ (See Appendix Q5)
For
insp
ectio
n pur
pose
s only
.
Conse
nt of
copy
right
owne
r req
uired
for a
ny ot
her u
se.
EPA Export 19-02-2014:23:34:03
Corrib Onshore Pipeline EIS Q6.6 – Emergency Response Planning and Provisions
COR-14-SH-0069 21 Rev 2
8.4 DUTIES OF SITE MAIN CONTROLLER ON TERMINATION OF THE EMERGENCY
The all clear is announced by the SMC in agreement with the Duty EC, when the incident site is declared safe and under control by the Site Incident Controller or the Emergency Services.
Inform BGE and Aberdeen EC.
Make arrangements to stand down personnel and facilities.
Control rehabilitation of affected areas.
Ensure all evidence is retained or barrier off and secure area if required for investigation purposes (in liaison with Emergency Services).
Assess the environmental impact of the incident and initiate the appropriate environmental remediation
Retain all log sheet originals from Control Room
Arrange for an internal investigation
For
insp
ectio
n pur
pose
s only
.
Conse
nt of
copy
right
owne
r req
uired
for a
ny ot
her u
se.
EPA Export 19-02-2014:23:34:03
Corrib Onshore Pipeline EIS Q6.6 – Emergency Response Planning and Provisions
COR-14-SH-0069 22 Rev 2
9 EMERGENCY RESPONSE PREPARATION
9.1 EMERGENCY RESPONSE PLAN DEVELOPMENT
The emergency response plans for the pipeline will be continuously developed and tested ready for commissioning. Where required e.g. for commissioning, additional supplemental emergency plans may be developed. All emergency plans will be finalised prior to pipeline operations commencing.
The development of the pipeline Emergency Response Plans will include, but will not be limited to;
Working arrangements with Emergency Services e.g. facilities, call-out and communications
Designation of Rendezvous Points (RVP) (with alternates in case of impairment)
Notifications for occupied buildings, including multi-occupancy such as public houses, and public places e.g. beaches, where appropriate
Evacuation plans and treatment arrangements for the injured
9.2 DRILLS AND EXERCISES
Training will be scheduled (Table 9.1) to establish response capability prior to any new operation being implemented, when personnel are changed or at planned regular periods throughout the year.
Training will be progressive and will contain the following:
Presentations, defining systems and teaching processes.
Tabletop exercises, practicing the team procedures without mobilisation of resources and in slow time. Evaluating performance, identifying areas for development and establishing further training needs.
Simulated/major exercises, practicing the combined response, mobilising resources in real time, evaluating performance, identifying areas for development and establishing further planning needs.
Lessons learnt from previous actual mobilisations
Post-exercise learning sessions
The public will be informed in advance of any major exercises.
Appropriate training and exercises may be outsourced to suitably qualified professional trainers who will be responsible for developing, delivering and evaluating such activities. This will also provide opportunities for external review and to share ‘best practices’.
Upon stand-down, it is the responsibility of the Site Main Controller (in liaison with Principle Response Agencies if involved) to ensure a “Lessons Learnt” session is held with all participants and with those responsible for incident response management. Table 9.1: Drill and Exercise Schedule
Drill Type Frequency Personnel involved General Muster 1/week (day shift only) All personnel at terminal Location Response Team (Safety) every 4 weeks (day shift
only)All LRT members
Location Response Team (Environmental)
every 4 weeks (all shifts)
All LRT members
Exercise Type Frequency Personnel Involved Table top exercise 2 per shift per year All Operations shifts External Exercise 1 per year All Gas Terminal personnel
plus external Principal Response Agencies
For
insp
ectio
n pur
pose
s only
.
Conse
nt of
copy
right
owne
r req
uired
for a
ny ot
her u
se.
EPA Export 19-02-2014:23:34:03

Corrib Onshore Pipeline EIS Q6.6 – Emergency Response Planning and Provisions
COR-14-SH-0069 23 Rev 2
10 ABBREVIATIONS
BA Breathing Apparatus BGE Bord Gáis Éireann CCTV Closed Circuit Television CMT Crisis Management Team DCENR Department of Communications, Energy and Natural Resources EC Emergency Co-ordinator ECT Emergency Co-ordination Team E&P Exploration and Production ER-MS Emergency Response Management System HSE Health, Safety and Environment HSE-MS Health, Safety and Environment Management System HSSE Health, Safety Security and Environment LRT Local Response Team LVI Landfall Valve Installation PSTN Public Switch Telephone Network ROV Remotely Operated Vehicle RVP Rendezvous Point SMC Site Main Controller UHF Ultra High Frequency UIE Upstream International Europe
For
insp
ectio
n pur
pose
s only
.
Conse
nt of
copy
right
owne
r req
uired
for a
ny ot
her u
se.
EPA Export 19-02-2014:23:34:03
Corrib Onshore Pipeline EIS Q6.6 – Emergency Response Planning and Provisions
ATTACHMENT Q6.6A
NOTIFYING EMERGENCY SERVICES
For
insp
ectio
n pur
pose
s only
.
Conse
nt of
copy
right
owne
r req
uired
for a
ny ot
her u
se.
EPA Export 19-02-2014:23:34:03
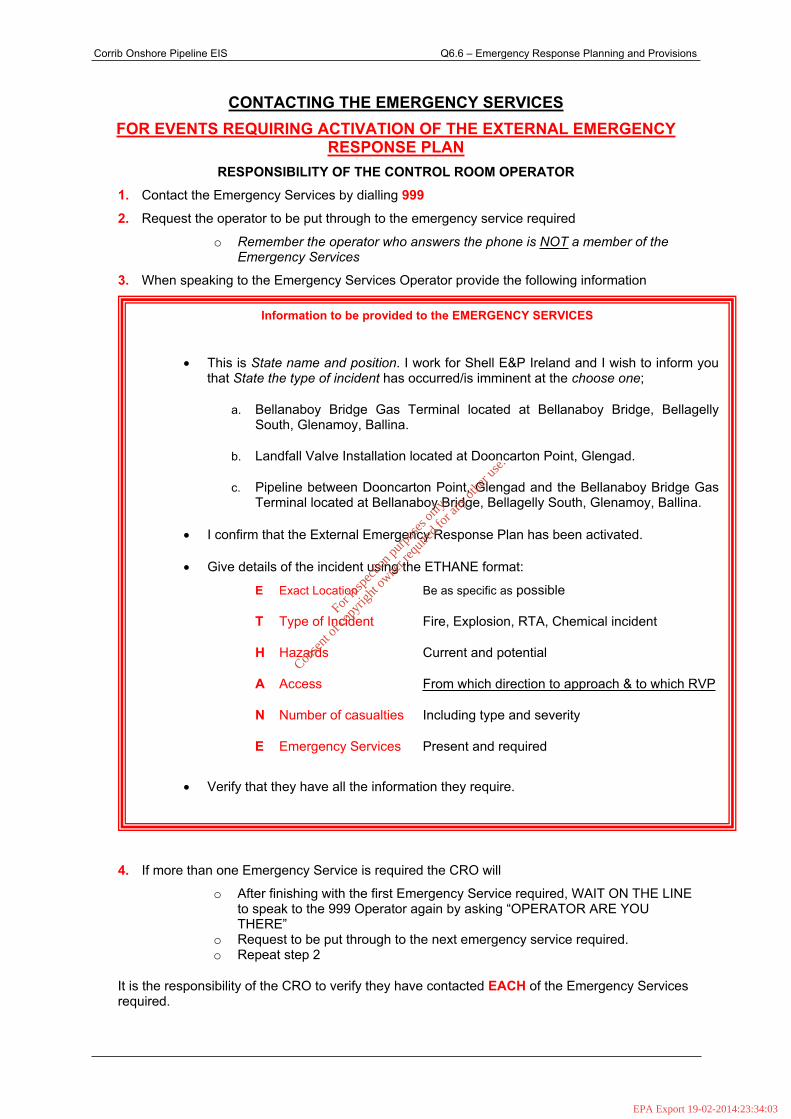
Corrib Onshore Pipeline EIS Q6.6 – Emergency Response Planning and Provisions
CONTACTING THE EMERGENCY SERVICESFOR EVENTS REQUIRING ACTIVATION OF THE EXTERNAL EMERGENCY
RESPONSE PLANRESPONSIBILITY OF THE CONTROL ROOM OPERATOR
1. Contact the Emergency Services by dialling 999
2. Request the operator to be put through to the emergency service required
o Remember the operator who answers the phone is NOT a member of the Emergency Services
3. When speaking to the Emergency Services Operator provide the following information
4. If more than one Emergency Service is required the CRO will
o After finishing with the first Emergency Service required, WAIT ON THE LINE to speak to the 999 Operator again by asking “OPERATOR ARE YOU THERE”
o Request to be put through to the next emergency service required. o Repeat step 2
It is the responsibility of the CRO to verify they have contacted EACH of the Emergency Services required.
Information to be provided to the EMERGENCY SERVICES
This is State name and position. I work for Shell E&P Ireland and I wish to inform you that State the type of incident has occurred/is imminent at the choose one;
a. Bellanaboy Bridge Gas Terminal located at Bellanaboy Bridge, Bellagelly South, Glenamoy, Ballina.
b. Landfall Valve Installation located at Dooncarton Point, Glengad.
c. Pipeline between Dooncarton Point, Glengad and the Bellanaboy Bridge Gas Terminal located at Bellanaboy Bridge, Bellagelly South, Glenamoy, Ballina.
I confirm that the External Emergency Response Plan has been activated.
Give details of the incident using the ETHANE format:
E Exact Location Be as specific as possible
T Type of Incident Fire, Explosion, RTA, Chemical incident
H Hazards Current and potential
A Access From which direction to approach & to which RVP
N Number of casualties Including type and severity
E Emergency Services Present and required
Verify that they have all the information they require.
For
insp
ectio
n pur
pose
s only
.
Conse
nt of
copy
right
owne
r req
uired
for a
ny ot
her u
se.
EPA Export 19-02-2014:23:34:03
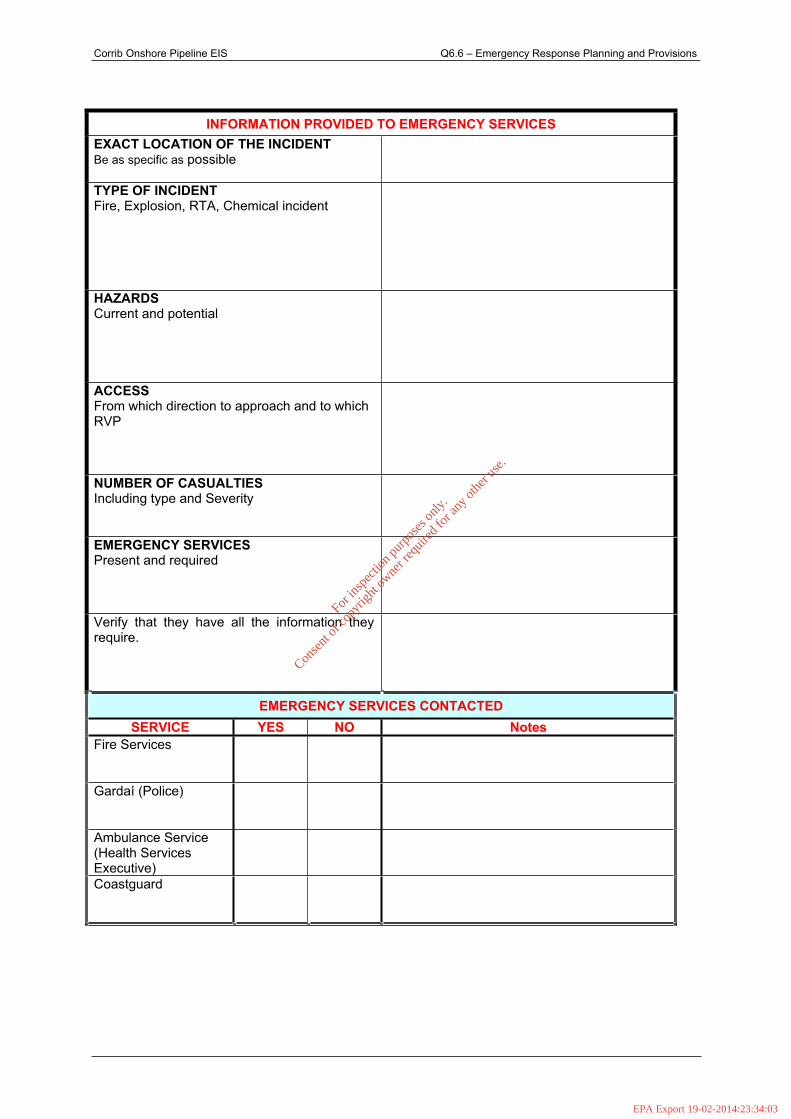
Corrib Onshore Pipeline EIS Q6.6 – Emergency Response Planning and Provisions
INFORMATION PROVIDED TO EMERGENCY SERVICES EXACT LOCATION OF THE INCIDENT Be as specific as possible
TYPE OF INCIDENT Fire, Explosion, RTA, Chemical incident
HAZARDS Current and potential
ACCESSFrom which direction to approach and to which RVP
NUMBER OF CASUALTIES Including type and Severity
EMERGENCY SERVICES Present and required
Verify that they have all the information they require.
EMERGENCY SERVICES CONTACTEDSERVICE YES NO Notes
Fire Services
Gardaí (Police)
Ambulance Service (Health Services Executive)
Coastguard
For
insp
ectio
n pur
pose
s only
.
Conse
nt of
copy
right
owne
r req
uired
for a
ny ot
her u
se.
EPA Export 19-02-2014:23:34:03