Embed Size (px)
Citation preview
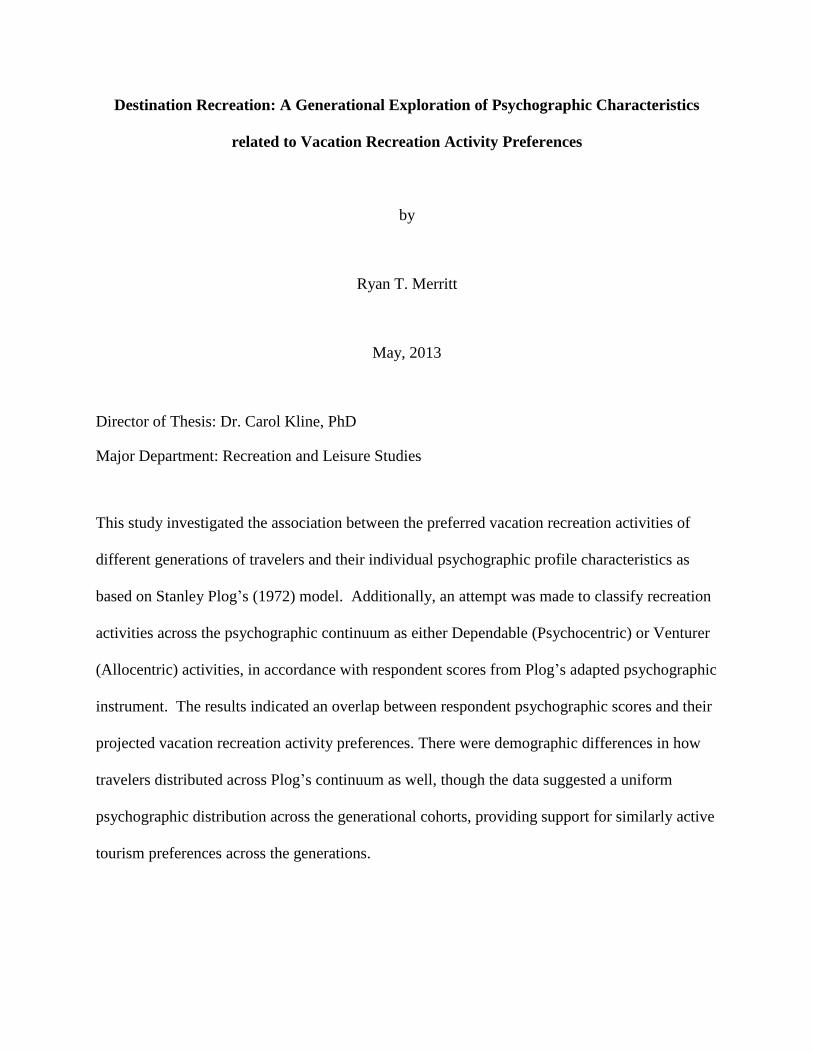
Destination Recreation: A Generational Exploration of Psychographic Characteristics
related to Vacation Recreation Activity Preferences
by
Ryan T. Merritt
May, 2013
Director of Thesis: Dr. Carol Kline, PhD
Major Department: Recreation and Leisure Studies
This study investigated the association between the preferred vacation recreation activities of
different generations of travelers and their individual psychographic profile characteristics as
based on Stanley Plog’s (1972) model. Additionally, an attempt was made to classify recreation
activities across the psychographic continuum as either Dependable (Psychocentric) or Venturer
(Allocentric) activities, in accordance with respondent scores from Plog’s adapted psychographic
instrument. The results indicated an overlap between respondent psychographic scores and their
projected vacation recreation activity preferences. There were demographic differences in how
travelers distributed across Plog’s continuum as well, though the data suggested a uniform
psychographic distribution across the generational cohorts, providing support for similarly active
tourism preferences across the generations.

i
Destination Recreation: A Generational Exploration of Psychographic Characteristics
related to Vacation Recreation Activity Preferences
A Thesis
Presented to the Faculty of the Department of the Graduate School
East Carolina University
In Partial Fulfillment of the Requirements for the Degree
M.S. Recreation and Park Administration
By
Ryan T. Merritt
May, 2013

ii
© Copyright by Ryan T. Merritt 2013
All Rights Reserved
iii
Destination Recreation: A Generational Exploration of Psychographic Characteristics
related to Vacation Recreation Activity Preferences
by
Ryan Merritt
APPROVED BY:
DIRECTOR OF
DISSERTATION/THESIS: _______________________________________________________
(Carol Kline, PhD)
COMMITTEE MEMBER: ________________________________________________________
(Alleah Crawford, PhD)
COMMITTEE MEMBER: _______________________________________________________
(Paige Schneider, PhD)
COMMITTEE MEMBER: _______________________________________________________
(Ginni Dilworth, PhD)
CHAIR OF THE DEPARTMENT
OF (Recreation and Leisure Studies): ________________________________________________
(Debra Jordan, ReD)
DEAN OF THE
GRADUATE SCHOOL: _________________________________________________________
Paul J. Gemperline, PhD
Paul J. Gemperline, PhD
iv
Table of Contents
List of Tables .........................................................................................................................vii
List of Figures ........................................................................................................................ix
Chapter 1: Introduction ..........................................................................................................1
Chapter 2: Literature Review .................................................................................................4
Active tourism ............................................................................................................4
Psychographic conceptual framework – Plog model .................................................7
Segmentation..............................................................................................................14
Generational tourists ..................................................................................................15
Chapter 3: Methods ................................................................................................................20
Sample........................................................................................................................21
Survey design and distribution...................................................................................22
Analysis......................................................................................................................23
Chapter 4: Results ..................................................................................................................25
Introduction ................................................................................................................25
Descriptive Results ....................................................................................................25
Test Results ................................................................................................................39
Results Summary .......................................................................................................50
v
Chapter 5: Discussion ............................................................................................................53
Introduction ................................................................................................................53
Discussion of research results ....................................................................................53
Implications................................................................................................................59
Study limitations ........................................................................................................61
Suggestions for future research ..................................................................................62
Conclusion .................................................................................................................63
References ..............................................................................................................................66
vi
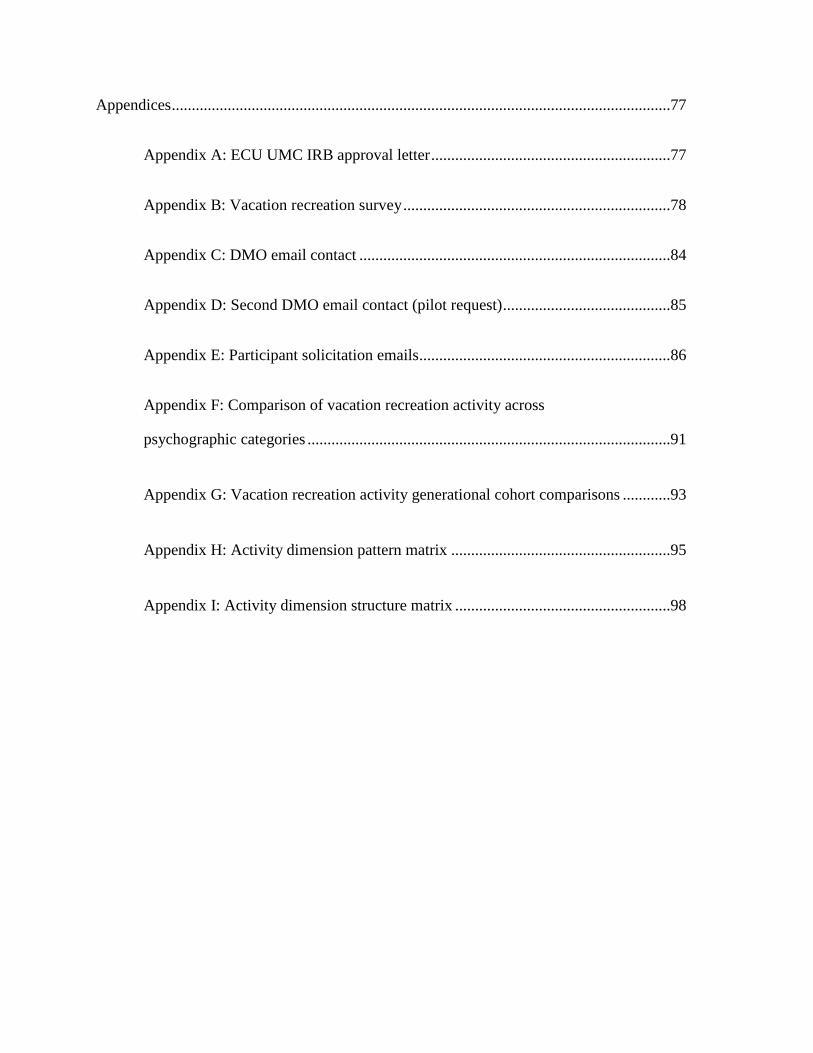
Appendices .............................................................................................................................77
Appendix A: ECU UMC IRB approval letter ............................................................77
Appendix B: Vacation recreation survey ...................................................................78
Appendix C: DMO email contact ..............................................................................84
Appendix D: Second DMO email contact (pilot request) ..........................................85
Appendix E: Participant solicitation emails ...............................................................86
Appendix F: Comparison of vacation recreation activity across
psychographic categories ...........................................................................................91
Appendix G: Vacation recreation activity generational cohort comparisons ............93
Appendix H: Activity dimension pattern matrix .......................................................95
Appendix I: Activity dimension structure matrix ......................................................98
vii
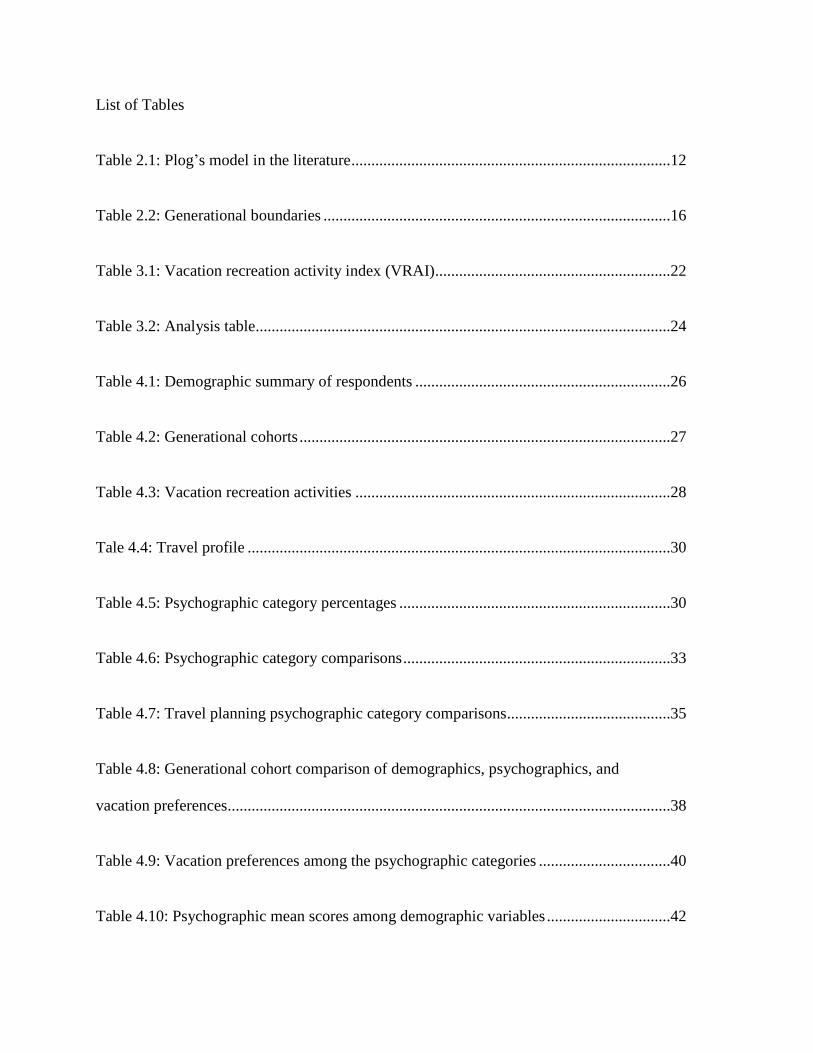
List of Tables
Table 2.1: Plog’s model in the literature ................................................................................12
Table 2.2: Generational boundaries .......................................................................................16
Table 3.1: Vacation recreation activity index (VRAI) ...........................................................22
Table 3.2: Analysis table........................................................................................................24
Table 4.1: Demographic summary of respondents ................................................................26
Table 4.2: Generational cohorts .............................................................................................27
Table 4.3: Vacation recreation activities ...............................................................................28
Tale 4.4: Travel profile ..........................................................................................................30
Table 4.5: Psychographic category percentages ....................................................................30
Table 4.6: Psychographic category comparisons ...................................................................33
Table 4.7: Travel planning psychographic category comparisons .........................................35
Table 4.8: Generational cohort comparison of demographics, psychographics, and
vacation preferences...............................................................................................................38
Table 4.9: Vacation preferences among the psychographic categories .................................40
Table 4.10: Psychographic mean scores among demographic variables ...............................42
viii
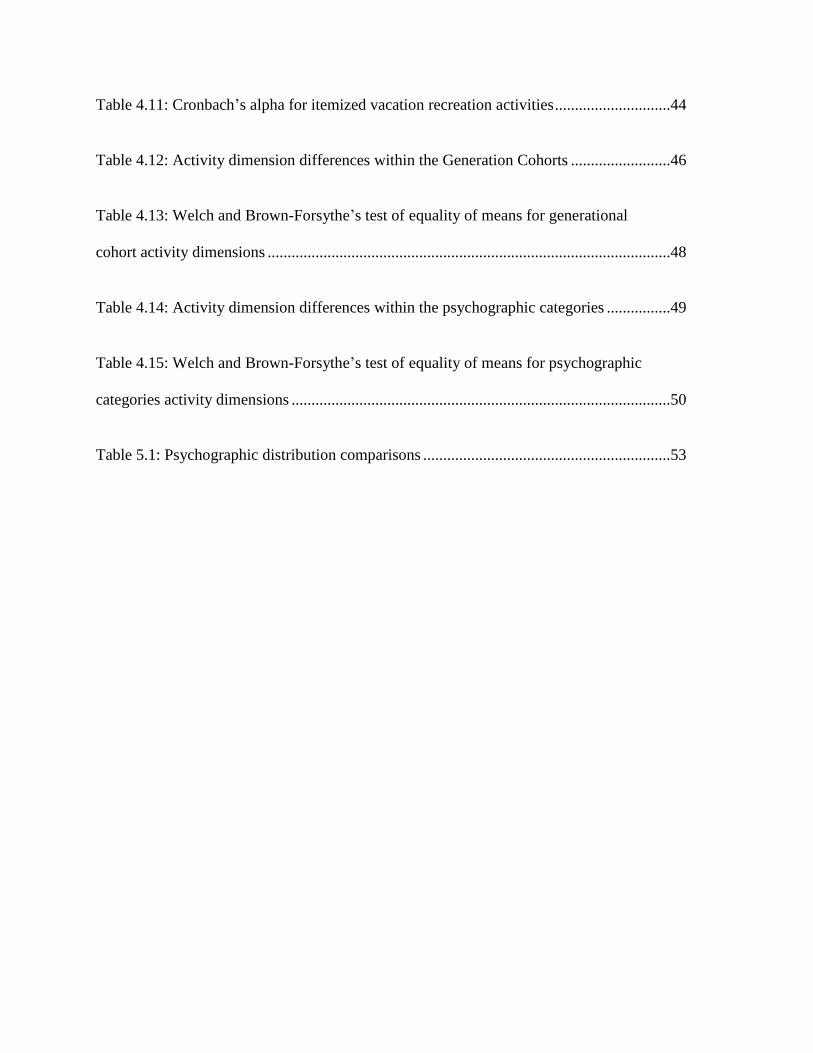
Table 4.11: Cronbach’s alpha for itemized vacation recreation activities .............................44
Table 4.12: Activity dimension differences within the Generation Cohorts .........................46
Table 4.13: Welch and Brown-Forsythe’s test of equality of means for generational
cohort activity dimensions .....................................................................................................48
Table 4.14: Activity dimension differences within the psychographic categories ................49
Table 4.15: Welch and Brown-Forsythe’s test of equality of means for psychographic
categories activity dimensions ...............................................................................................50
Table 5.1: Psychographic distribution comparisons ..............................................................53
ix
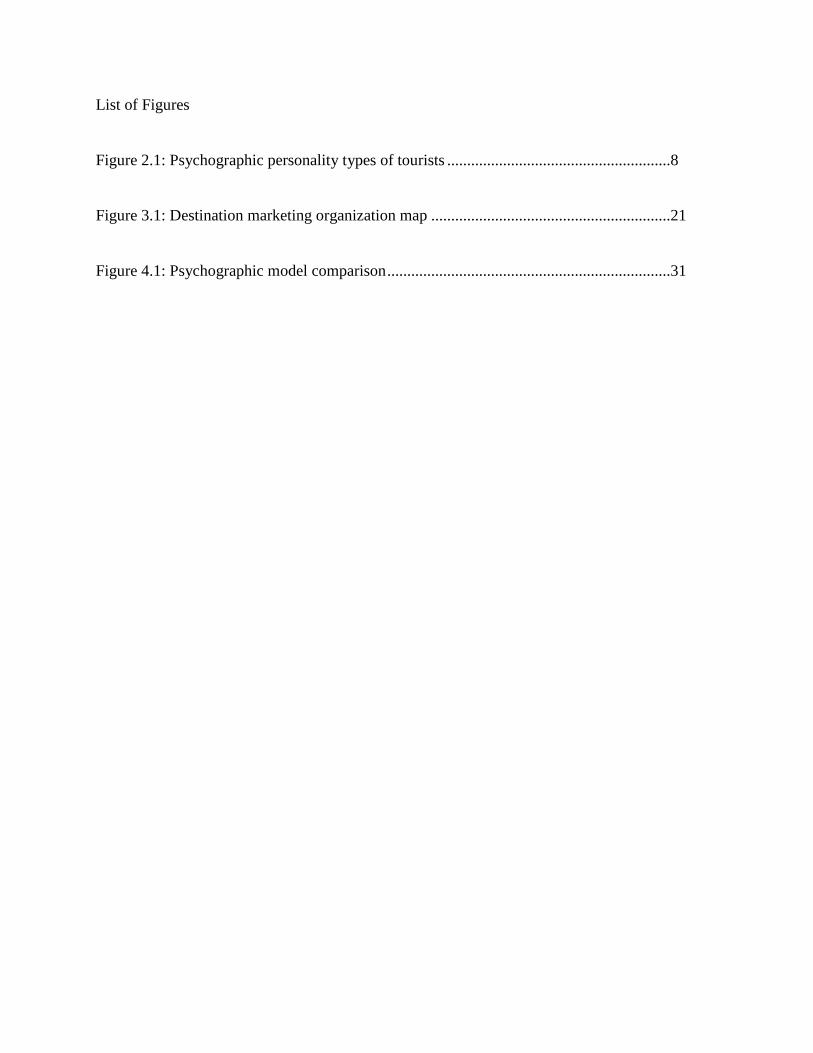
List of Figures
Figure 2.1: Psychographic personality types of tourists ........................................................8
Figure 3.1: Destination marketing organization map ............................................................21
Figure 4.1: Psychographic model comparison .......................................................................31
1
Chapter 1: Introduction
For many individuals, recreation activities are integrally linked to vacation behavior.
Previous scholarly investigations have indicated that recreation participants display analogous
psychological and behavioral indicators at home and while traveling (Carr, 2002; Chang &
Gibson, 2011; Hamilton-Smith, 1987; Mannell & Iso-Ahola, 1987; Ryan, 1994). Still,
“conceptual and practical gaps” (Chang & Gibson, 2011, p. 162) have been described to exist in
the literature concerning recreation and tourism, and these gaps have limited the empirical
advancement of both fields (Fedler, 1987; Harris, McLaughlin, & Ham, 1987; Moore, Cushman,
& Simmons, 1995; Smith & Godbey, 1991).
Tourism is an extensive field of study that draws from many other disciplines, including
recreation (Hardy, 2010). One description of tourism proposed by Gilbert (1990) defines it
within a broader recreation perspective: “tourism is one part of recreation which involves
travel…in order to satisfy a consumer need for one or a combination of activities” (p. 2).
Tourism has also been expressed as a special form of recreation (Cohen, 1974), and is generally
mentioned in the form of leisure or vacation tourism. Since its conception in the mid-nineteenth
century, the modern “vacation” within American culture has grown out of the need for recovery
from work (Americans on Vacation, 1990). Americans are still in need of “time off”; however,
factors such as the increase in national health consciousness and outdoor recreation participation,
as well as the continued expansion of active and adventure tourism across the generations have
led to a shift toward more active vacation trends within the tourism industry (ATTA, 2011; Chon
& Singh, 1995; Glover & Prideaux, 2009; Jefferson, 1995; Lehto, Jang, Achana, & O’Leary,
2008; Loverseed, 1997; Mihelj, 2010; Sorensen, 1993; Sung, Morrison, & O’Leary, 2001;
Swarbrooke, 2003; Tourism Canada, 1995; Travel Industry Association of America, 1998;
Weiler & Hall, 1992).
2
Active tourism has been expressed as a part of the nature tourism industry; nature tourism
is defined as:
[a segment] whose main motivations are conducting recreational and leisure activities,
along with the interpretation and / or knowledge of nature, including varying degrees of
physical intensity and risk associated with different forms of activity, and the use of the
natural environment to ensure the safety of the tourist, without degrading or depleting
resources. (Antar-Ecotono, 2004, p. 14)
Thus, nature tourism includes “any activity related to the natural environment” (Antar-Ecotono,
2004, p. 61), and nature activities have been determined to exist within three subgroups: leisure
tourism, active tourism, and ecotourism (Vila, Brea, & Carril, 2012). Active tourism is defined
as a segment “whose main motivations are conducting recreational and leisure activities,
including varying degrees of physical intensity and risk associated with different forms of
activity” (Antar-Ecotono, 2004, p. 14). In spite of the suggested shift toward active tourism,
without understanding tourism behavior it is difficult to provide a full understanding of tourist
dynamics, limiting the ability to express destination products in terms of tourist needs (Pizam &
Mansfeld, 1999).
Over the years, researchers have sought to establish a variety of theoretical frameworks to
predict tourist behavior: role of novelty in destination choice (Cohen, 1972; Lee & Crompton,
1992; Mo, Howard, & Ravitz 1993), mass tourist or adventurer typology (Boorstin, 1964), the
concept of pilgrimage as experienced through separation, margin, and reaggregation (Turner,
1972), and the push-pull model of tourism motivation (Crompton, 1979). However, of the
typologies generated in the past, the classifications attempting to distinguish tourism behavior in
3
terms of individual personality characteristics have been shown to provide a more in-depth
explanation of destination preference (Griffith & Albanese, 1996; Plog, 1991b).
Psychographics are personality profiles used to quantify lifestyle preferences (Waryszak
& Kim, 1995). Within a tourism context, Stanley Plog (1972) developed a model to examine
destination preferences based upon psychographic scores measuring distinguishing personality
traits. The initial attempt by Plog was to understand tourist preferences based upon
psychographic characteristics (Plog, 1972). The purpose of this study is to examine Plog’s
psychographic model four decades later, within a potential visitor population to destinations in
North Carolina, and to explore links between personality, generation membership, and recreation
preferences while on vacation. With the apparent increase in active tourism, and the exhibited
usefulness of personality in projecting tourism behavior, research is needed to analyze the
psychological indicators related to individual recreational activities to establish tourist
preferences. The specific research questions that have been explored in this study are:
1. Is Plog’s psychographic model still representative of present-day tourists? (Does the
model still fit?)
2. Are the travel planning profiles as expected for each Plog category?
3. Are there demographic differences in regard to how tourists distribute across Plog’s
continuum?
4. How do preferred vacation recreation activities of tourists relate to their
psychographic scores?
4
Chapter 2: Literature review
2.1 Active tourism
Tourism has an exceptional bearing on the world economy. As reported by the World
Travel & Tourism Council (WTTC), the direct contribution of the tourism industry to the world-
wide Gross Domestic Product (GDP) in 2011 was $2 trillion and was projected to grow by 2.8%
in 2012 (World Travel & Tourism Council, n.d.). The active tourism industry has shown to be in
a stage of economic advancement as well, with a 17% increase in earnings between 2009 and
2010 (ATTA, 2012).
With the maturation of the American tourism industry, tourists continue to expand their
vacation preferences (ATTA, 2011; Sung et al., 2001). With destination product preferences
evolving, tourism motivations have become more specialized, and tourism marketers are
challenged to supply the ever-increasing market niches (Sung et al., 2001; Dwyer, 2005). As
reported by Schneider & Vogt (2012):
Today, consumers are driving demand; therefore, understanding the underlying
psychological and social dimensions that motivate consumers may offer the tourism
industry insight into how to meet their changing needs. (p. 704)
Active tourism experiences have become well-known to tourists in search of unique
vacation alternatives (Sung, 2000; Sung, 2004; Sung, Morrison, & O’Leary, 2001), and current
tourism predictions have indicated a sustained rise in nature-based outdoor adventure activities
(Zeppel & Sibtain, 2011). Adventure tourism is one such alternative that appeals to tourists
seeking active opportunities on vacation, and has progressed out of the widespread outdoor
recreation participation of the 20th century (Ewert, 1989); it falls under the active tourism
5
definition of a segment offering activities with “varying degrees of physical intensity and risk”
(Antar-Ecotono, 2004, p. 14)
Adventure tourism has been expressed as the fastest growing tourism segment in North
America (Loverseed, 1997), and one of the fastest growing segments within the international
tourism industry (ATTA, 2011; Chon & Singh, 1995; Glover & Prideaux, 2009; Jefferson, 1995;
Lehto, Jang, Achana, & O’Leary, 2008; Loverseed, 1997; Mihelj, 2010; Sorensen, 1993; Sung,
Morrison, & O’leary, 2001; Swarbrooke, 2003; Tourism Canada, 1995; Travel Industry
Association of America, 1998; Weiler & Hall, 1992). The rapid growth of the active tourism
market has been evident, and as expressed by Sung, Morrison, and O’Leary (1997, p.3), “the
variety and availability of adventure travel activities to satisfy a wide range of interests and
abilities appear to be limitless.” Further, the needs expressed by tourists within this niche sector
have the potential to introduce new service trends, and the ability to improve the marketing
potential of tourism providers offering active tourism opportunities (Sung, Morrison, & O’Leary,
2001).
Moreover, a shift has been seen in the increasing popularity and development of sport
related leisure tourism (Hinch & Higham, 2003). The idea of vacation for rest and relaxation has
shifted to more active, recreation-oriented trips. In industrialized countries, sports tourism
contributes between 1% and 2% to the GDP (Hudson, 2003). A survey commissioned by
Marriott International found close to one fourth (22%) of tourists surveyed indicated that
“opportunities to participate in sports were important when selecting a vacation” (Elrick &
Lavidge, Inc. 1994, as cited by Tekin, 2004, p. 320) and trends presented by Hinch and Higham
(2011) have displayed comparable results, indicative of the continued relevance of sports
tourism.
6
In conjunction with the steady national increase shown in outdoor recreation participation
over the last four years (Outdoor Recreation Participation Report, 2012), Brey (2007) indicated
that everyday recreation and leisure activity participation (for ages 18+) parallels vacation
activity participation. The link demonstrated by Brey (2007) between everyday leisure activities
and tourism activities supports former empirical studies (Carr, 2002; Currie, 1997), “proposing a
connection between involvement in leisure activities and subsequent tourism behaviors” (Chang
& Gibson, 2011, p. 162).
Additionally, with the increased health consciousness in the United States, destination
sites offering active tourism opportunities appeal to a larger group. Consumer demand,
specifically in tourism, has grown to include the ever-present need for access to a variety of
different physical activities (Yeoman & Butterfield, 2011). Throughout the tourism industry,
destinations promoting physical and emotional health through their programs have dramatically
increased in the past decade as “new strategies and initiatives imbedding a health label both
physical and psychological in scope have been developed by … hospitality sectors” (Chen,
Huan, & Prebensen, 2011, p. 105).
These factors presented above, as well as an increase in active tourism patterns
throughout the generations, have given rise to the expansion of active tourism. Research has
demonstrated that the Baby Boomer generation will continue setting the pace for consumer
tourism products (Glover & Prideaux, 2009); however Boomer preferences align closely to those
of younger generations, specifically Generation Y (Lehto et al., 2008), who is soon projected to
surpass them in size and spending power (Stevens, Lathrop, & Bradish, 2005). The investigation
into active tourism preferences then should be trans-generational to expand the understanding of
psychographics and the ever-growing trend of active tourism. Plog’s psychographic model is
7
used as the conceptual framework for this study, and therefore it is necessary to outline the
applications of his model.
2.2 Psychographic conceptual framework – Plog model
In 1972 Plog offered a bipolar continuum of personality types that was normally
distributed. At one extreme of the continuum are Allocentrics or Venturers, who travel
frequently to explore the world around them seeking novel experiences (e.g., undeveloped
tourism markets) and often enjoy participating in active endeavors when traveling (Plog, 2002).
At the other extreme, Psychocentrics or Dependables are generally more cautious (e.g., travel
with tour groups), seek familiarity, and desire little activity while traveling (Plog, 2002). The
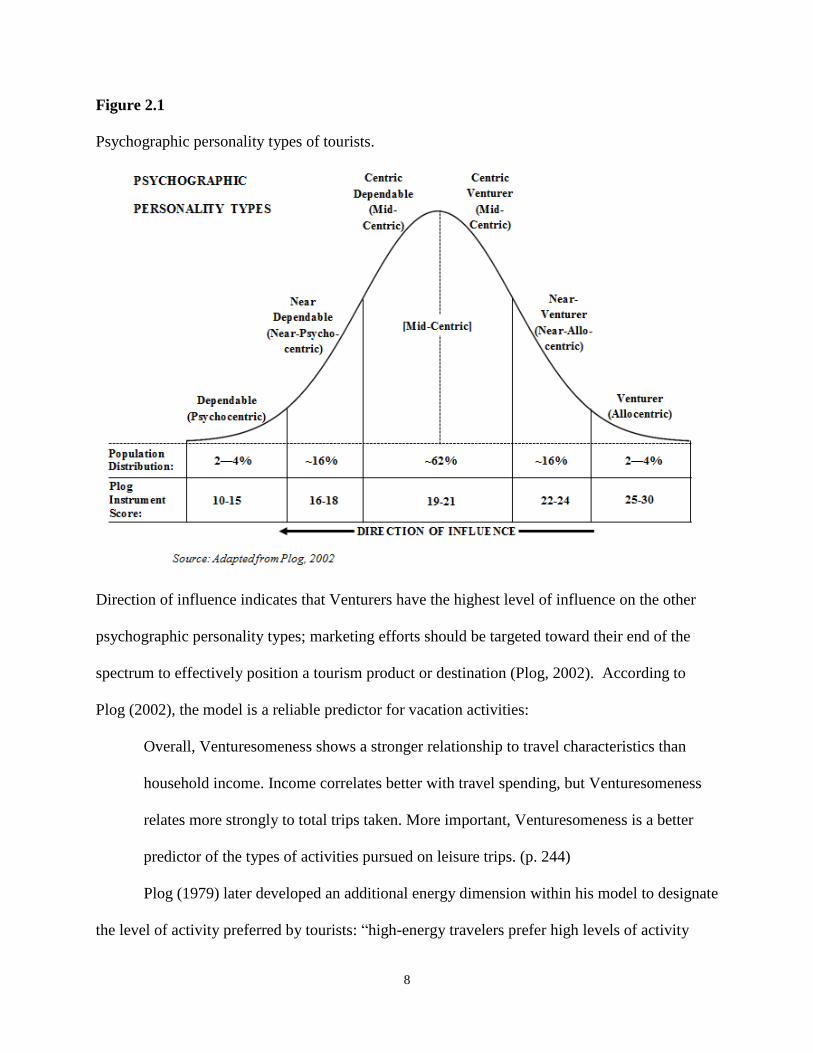
continuum is divided into five segments shown in Figure 2.1: (1) Dependable (Psychocentric),
(2) Near-Dependables (Near-Psychocentric), (3) Mid-Centric, (4) Near-Venturer (Near-
Allocentric), and (5) Venturer (Allocentric) (Griffith & Albanese, 1996). Based on research
estimates by Plog (2002), the model disperses normally across the population: 2% to 4 % of
tourists align as either pure Dependable or Venturer, nearly 16% as Near-Dependables or Near-
Venturer, and approximately 62% of the population is classified as Mid-Centric.
8
Figure 2.1
Psychographic personality types of tourists.
Direction of influence indicates that Venturers have the highest level of influence on the other
psychographic personality types; marketing efforts should be targeted toward their end of the
spectrum to effectively position a tourism product or destination (Plog, 2002). According to
Plog (2002), the model is a reliable predictor for vacation activities:
Overall, Venturesomeness shows a stronger relationship to travel characteristics than
household income. Income correlates better with travel spending, but Venturesomeness
relates more strongly to total trips taken. More important, Venturesomeness is a better
predictor of the types of activities pursued on leisure trips. (p. 244)
Plog (1979) later developed an additional energy dimension within his model to designate
the level of activity preferred by tourists: “high-energy travelers prefer high levels of activity
9
while low-energy travelers prefer fewer activities” (Nickerson & Ellis, 1991, p. 26). Plog
(1991b) further established the model with the formation of 28 descriptors defining specific
Psychocentric/Allocentric tourist types. Finally, Plog (1995) condensed his original
psychographic questionnaire to eight questions measuring both Venturesomeness and energy
categories. Due to the proprietary nature of these questionnaires, the original 10 question-
questionnaire was selected and implemented within this study based on the transparency of the
scoring system.
The fundamental theories encompassing Plog’s model are trait aggregation and cross-
situational consistency (Griffith & Albanese, 1996). Both theories are founded on the notion that
personality variables are enduring, even though individuals change over time (Buss, 1989;
Epstein 1979, 1983; Epstein and Teraspulsky, 1986; Foxall and Goldsmith, 1994). The general
consistency of personality characteristics has been shown to lead to patterns of reliable behavior
within multiple situations (Albanese, 1990; Epstein, 1983; Epstein and Teraspulsky, 1986).
According to Griffith and Albanese (1996):
Although situational and demographic characteristics of individuals will change over
time, their underlying personality characteristics are relatively enduring. This indicates
that although travel destination choices will vary over time, the general types of
destination decisions will remain relatively stable. (p. 48)
Plog’s model has not been without criticism. Smith (1990) and Dimanche and Havitz
(1994) reproached Plog’s theory for insufficient empirical verification. Additionally, some
researchers (Gilbert & Cooper, 1991; Andreu, Kozak, Avci, & Cifter, 2005) have raised concern
over Plog’s psychographic model, claiming that there are different motivations surrounding each
destination choice and travel occasion. Other reservations surrounding the Plog model include:
10
subjectivity towards U.S. travelers (Smith, 1990), restricted predictability of tourism behaviors
(Chon & Sparrowe, 2000 as cited in Litvin, 2006), and external factors (e.g. financial)
influencing archetypal psychographic positioning (Crossley & Jamieson, 1993).
Though the Plog method has received critique, it still can be used as a valuable
investigative tool (Siguaw, Enz, & Liu, 2008). A recent analysis of the model by Litvin (2006)
showed support for the model observing that it offers a practical foundation for understanding
idyllic tourism preferences. Plog’s model continues to provide a pragmatic representation of
tourist behavior, as shown by its use in contemporary tourism textbooks (Goeldner & Ritchie,
2005; Woodside & Martin, 2007) and through a highly frequented website devoted to
determining tourism personalities based on his psychographic research (Best Trip Choices,
2012).
According to Plog (2004), a straight-line relationship has been shown between
psychographic influences and certain individual participant recreation activities on vacation,
identifying that Venturers participate more frequently in some recreation activities than
Dependables, including golf, tennis, and downhill skiing. Further research by Wolfe, Hsu, and
Kang (2002) examined niche tourism offerings, revealing distinct psychographic and
demographic profiles of leisure tourists and their corresponding activity preferences.
Interestingly, participants attracted to outdoor recreation activities were shown to be exploratory,
children centered, and outgoing (Wolfe et al., 2002). Another psychographic study by Chandler
and Costello (2002) presented research collected from a heritage tourism site in the U.S. Results
of the study indicated moderate activity level recreation interests (birdwatching, nature walking)
associated with Mid-Centric tourists (Chandler & Costello, 2002). Chandler and Costello’s
(2002) research is important because it demonstrated the potential to develop a consistent

11
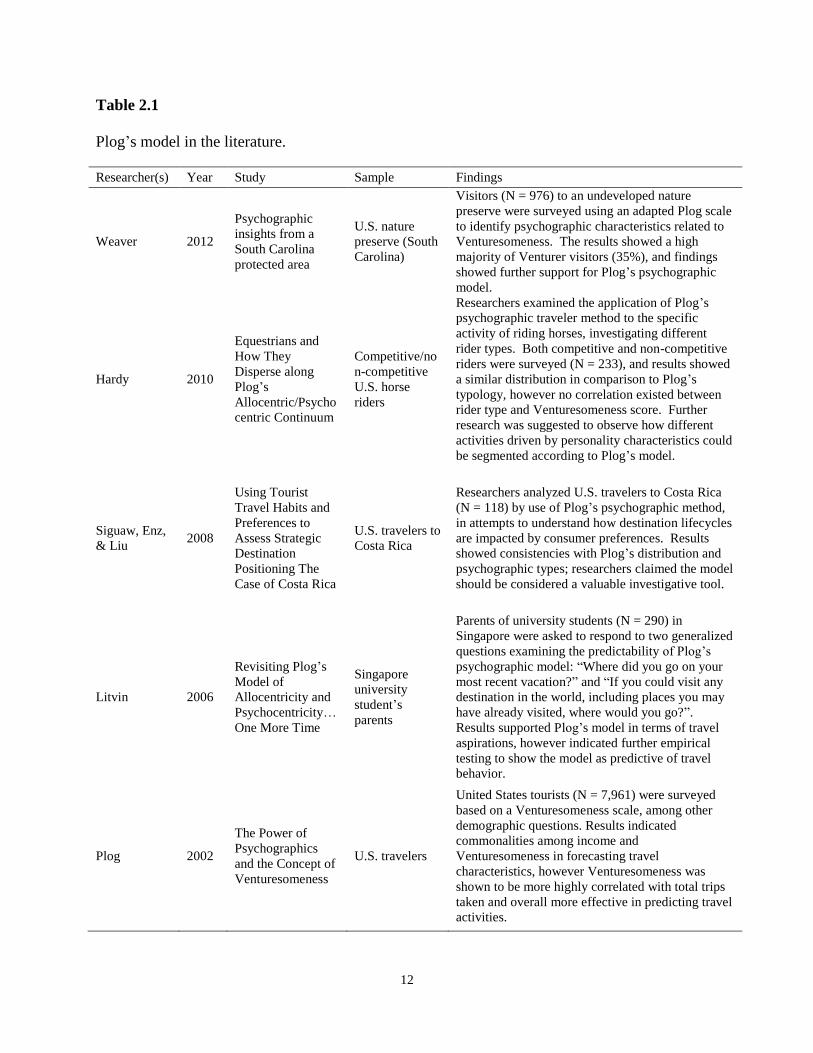
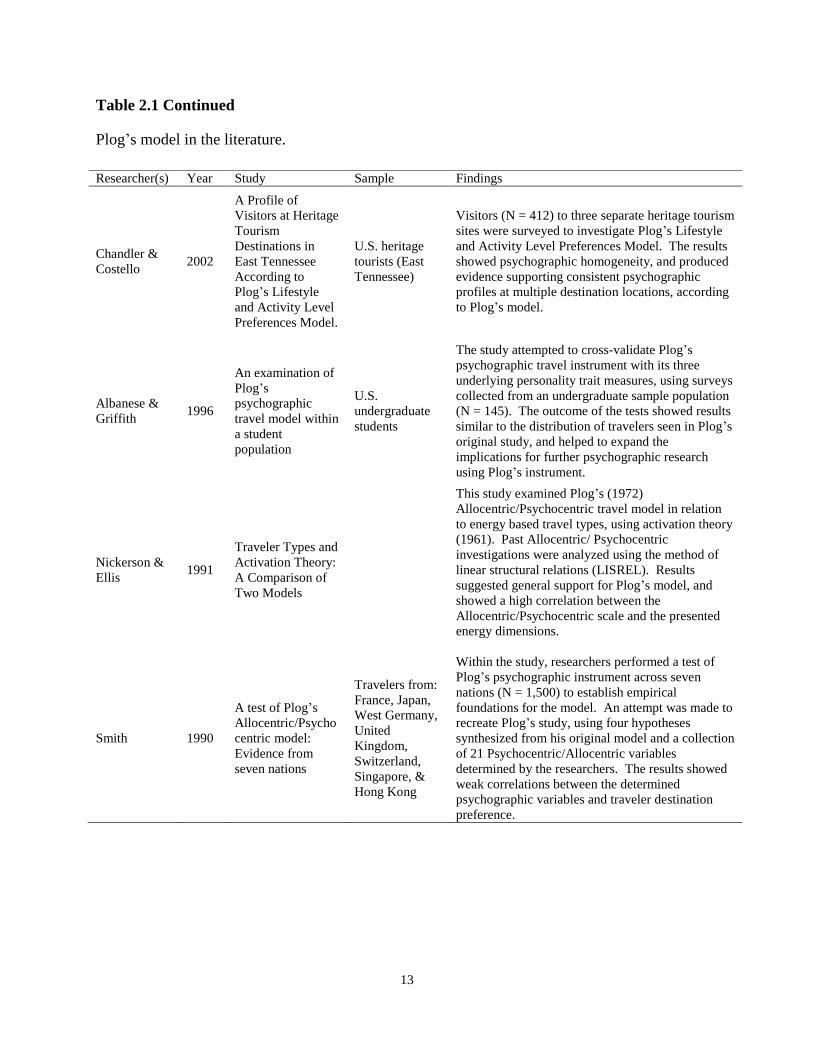
psychographic profile at multiple types of destinations. Table 2.1 summarizes research where
Plog’s model has been employed.
12
Table 2.1
Plog’s model in the literature.
Researcher(s) Year Study Sample Findings
Weaver 2012
Psychographic
insights from a
South Carolina
protected area
U.S. nature
preserve (South
Carolina)
Visitors (N = 976) to an undeveloped nature
preserve were surveyed using an adapted Plog scale
to identify psychographic characteristics related to
Venturesomeness. The results showed a high
majority of Venturer visitors (35%), and findings
showed further support for Plog’s psychographic
model.
Hardy 2010
Equestrians and
How They
Disperse along
Plog’s
Allocentric/Psycho
centric Continuum
Competitive/no
n-competitive
U.S. horse
riders
Researchers examined the application of Plog’s
psychographic traveler method to the specific
activity of riding horses, investigating different
rider types. Both competitive and non-competitive
riders were surveyed (N = 233), and results showed
a similar distribution in comparison to Plog’s
typology, however no correlation existed between
rider type and Venturesomeness score. Further
research was suggested to observe how different
activities driven by personality characteristics could
be segmented according to Plog’s model.
Siguaw, Enz,
& Liu 2008
Using Tourist
Travel Habits and
Preferences to
Assess Strategic
Destination
Positioning The
Case of Costa Rica
U.S. travelers to
Costa Rica
Researchers analyzed U.S. travelers to Costa Rica
(N = 118) by use of Plog’s psychographic method,
in attempts to understand how destination lifecycles
are impacted by consumer preferences. Results
showed consistencies with Plog’s distribution and
psychographic types; researchers claimed the model
should be considered a valuable investigative tool.
Litvin 2006
Revisiting Plog’s
Model of
Allocentricity and
Psychocentricity…
One More Time
Singapore
university
student’s
parents
Parents of university students (N = 290) in
Singapore were asked to respond to two generalized
questions examining the predictability of Plog’s
psychographic model: “Where did you go on your
most recent vacation?” and “If you could visit any
destination in the world, including places you may
have already visited, where would you go?”.
Results supported Plog’s model in terms of travel
aspirations, however indicated further empirical
testing to show the model as predictive of travel
behavior.
Plog 2002
The Power of
Psychographics
and the Concept of
Venturesomeness
U.S. travelers
United States tourists (N = 7,961) were surveyed
based on a Venturesomeness scale, among other
demographic questions. Results indicated
commonalities among income and
Venturesomeness in forecasting travel
characteristics, however Venturesomeness was
shown to be more highly correlated with total trips
taken and overall more effective in predicting travel
activities.
13
Table 2.1 Continued
Plog’s model in the literature.
Researcher(s) Year Study Sample Findings
Chandler &
Costello 2002
A Profile of
Visitors at Heritage
Tourism
Destinations in
East Tennessee
According to
Plog’s Lifestyle
and Activity Level
Preferences Model.
U.S. heritage
tourists (East
Tennessee)
Visitors (N = 412) to three separate heritage tourism
sites were surveyed to investigate Plog’s Lifestyle
and Activity Level Preferences Model. The results
showed psychographic homogeneity, and produced
evidence supporting consistent psychographic
profiles at multiple destination locations, according
to Plog’s model.
Albanese &
Griffith 1996
An examination of
Plog’s
psychographic
travel model within
a student
population
U.S.
undergraduate
students
The study attempted to cross-validate Plog’s
psychographic travel instrument with its three
underlying personality trait measures, using surveys
collected from an undergraduate sample population
(N = 145). The outcome of the tests showed results
similar to the distribution of travelers seen in Plog’s
original study, and helped to expand the
implications for further psychographic research
using Plog’s instrument.
Nickerson &
Ellis 1991
Traveler Types and
Activation Theory:
A Comparison of
Two Models
This study examined Plog’s (1972)
Allocentric/Psychocentric travel model in relation
to energy based travel types, using activation theory
(1961). Past Allocentric/ Psychocentric
investigations were analyzed using the method of
linear structural relations (LISREL). Results
suggested general support for Plog’s model, and
showed a high correlation between the
Allocentric/Psychocentric scale and the presented
energy dimensions.
Smith 1990
A test of Plog’s
Allocentric/Psycho
centric model:
Evidence from
seven nations
Travelers from:
France, Japan,
West Germany,
United
Kingdom,
Switzerland,
Singapore, &
Hong Kong
Within the study, researchers performed a test of
Plog’s psychographic instrument across seven
nations (N = 1,500) to establish empirical
foundations for the model. An attempt was made to
recreate Plog’s study, using four hypotheses
synthesized from his original model and a collection
of 21 Psychocentric/Allocentric variables
determined by the researchers. The results showed
weak correlations between the determined
psychographic variables and traveler destination
preference.
14
While the previous studies have shed light on the use of psychographic profiles for
leisure tourism segmentation, there is very little psychographic research exploring active
tourism, specifically from a generational perspective. Traditionally, psychographics have been a
major variable for segmentation (Kotler, 1994) because of the ability to use them “to insightfully
describe the market segments” (Wolfe, Hsu, & Kang, 2002, p. 20). Psychographics have been
shown to provide rich data within market segments, and research by Plummer (1974)
emphasized the increased dimensionality of consumer market data when psychographics and
demographics were combined, creating more in-depth consumer lifestyle patterns.
2.3 Segmentation
From a tourism standpoint, the purpose of segmentation is to distinguish homogeneous
tourist groups with similar preferences from the overall heterogeneous tourist population
(Andereck & Caldwell, 1994). Understanding the individualities of the homogenous groups
helps marketers to “tailor the product or service and promote the product or service more
effectively” (Andereck & Caldwell, 1994, p. 40).
Past studies have segmented tourism markets in a number of ways, including:
expenditure volume (Spotts & Mahoney, 1991; Mills, Couturier, & Snepenger, 1986)
demographics (Anderson & Langmeyer 1978), psychographics (Kotler, 1994; Plummer, 1974;
Wolfe, Hsu, & Kang, 2002), repeat and non-repeat visitation (Perdue, 1985; Gitelson &
Crompton 1984), and travel motivations and sought benefits (Andereck, Caldwell, & Debbage,
1991; Calantone & Johar, 1984; Moisey & McCool 1990; Snepenger, 1987; Woodside & Jacobs,
1985). Indiscriminant of which market segmentation strategy was used, the researchers
consistently found that demographic variables remained relatively constant (Andereck &
15
Caldwell, 1994). Of all the demographic variables, age has been contended as the most essential
for consumer marketers and researchers (Roberts & Manolis, 2000). The importance of age as a
demographic characteristic is not only found in its numeric value, but in its ability to externalize
time periods through the use of generational cohorts (Stevens et al., 2005). According to Huang
and Petrick (2010, p. 27):
In order to develop an accurate understanding of a consumer segment and subsequent
effective marketing and promotion strategies, it is imperative to take into consideration
both age segments and cohort characteristics to fully understand consumer preferences.
A limited amount of practical research representing cohorts can be found within the tourism
literature (Pennington-Gray, Fridgen, & Stynes, 2003). Therefore, with the practicality of using
both age segmentation and cohort characteristics, this study will describe the sample both in
terms of cohorts (Baby Boomers, Generation X, and Generation Y) and chronologic age. It is
also essential to note that the formative experiences associated with cohorts have been shown to
“shape specific preferences, beliefs and psychographic tendencies” (Moscardo, Murphy, &
Benckendorff, 2011, p. 87).
2.4 Generational tourists
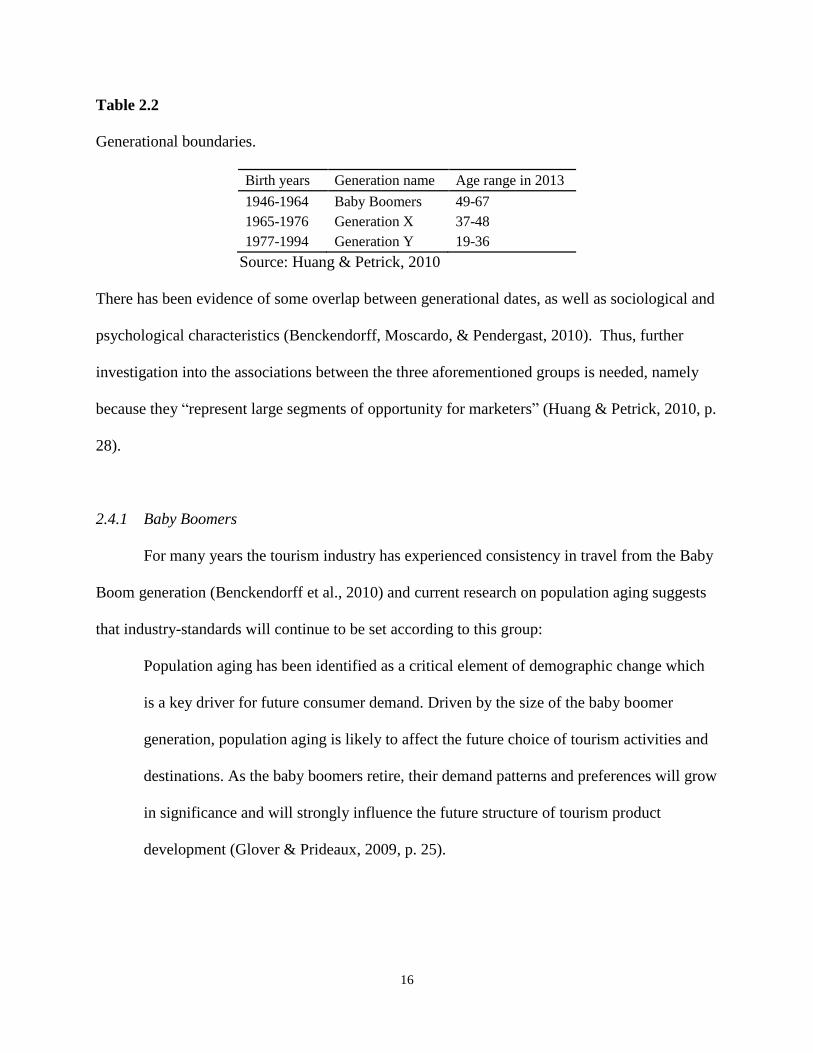
Generational cohorts are defined loosely by generational boundaries; however, the
endpoints referenced in this study place Baby Boomers between the years of 1946-1964,
Generation X, 1965-1976, and Generation Y from 1977-1994 as shown in Table 2.2.
16
Table 2.2
Generational boundaries.
Birth years Generation name Age range in 2013
1946-1964 Baby Boomers 49-67
1965-1976 Generation X 37-48
1977-1994 Generation Y 19-36
Source: Huang & Petrick, 2010
There has been evidence of some overlap between generational dates, as well as sociological and
psychological characteristics (Benckendorff, Moscardo, & Pendergast, 2010). Thus, further
investigation into the associations between the three aforementioned groups is needed, namely
because they “represent large segments of opportunity for marketers” (Huang & Petrick, 2010, p.
28).
2.4.1 Baby Boomers
For many years the tourism industry has experienced consistency in travel from the Baby
Boom generation (Benckendorff et al., 2010) and current research on population aging suggests
that industry-standards will continue to be set according to this group:
Population aging has been identified as a critical element of demographic change which
is a key driver for future consumer demand. Driven by the size of the baby boomer
generation, population aging is likely to affect the future choice of tourism activities and
destinations. As the baby boomers retire, their demand patterns and preferences will grow
in significance and will strongly influence the future structure of tourism product
development (Glover & Prideaux, 2009, p. 25).
17
With the sustained influence on tourism held by the Boomer generation, it is vital to understand
the needs and wants of this group and how they can be adapted into the mainstream tourism
industry, while keeping in mind the younger tourism segments (Glover & Prideaux, 2009).
A recent cross-generational study has shown that “a much more active senior will
become the mainstream senior traveler” (Lehto et al., 2008, p. 249), and that senior travelers are
traveling specifically for outdoor recreation and the exploration of adventurous locales (Lehto et
al., 2008). With the development of active tourism patterns for the senior segment, current
research has supported the need for destinations to cater to the more physically conscious seniors
to sustain business (Glover & Prideaux, 2009; Grant, 2002). Lehto et al. (2008) reported that
Baby Boomers are expected to continue “defying their physical age and seeking experiences that
will lead them to venture off the beaten path and engage in adventurous or experimental
experiences” (p. 248). With the tourism development of Boomers shown to be active, there is
evidence that current mature tourists may be more closely connected to the younger tourism
contingent (Lehto et al., 2008). Not only are Baby Boomers looking for the same active tourism
opportunities as their younger counterparts, they do not want to be considered old (Glover &
Prideaux, 2009). The obstacle then, that tourism suppliers face is “designing products and
services that are suitable for this age group without offending their own sense of youthfulness”
(Glover & Prideaux, 2009, p. 35). Schroeder and Widmann (2007) have noted that “destinations
that consciously cater to the senior segment will be able to profit from a demographic change”
(p. 11).
Research efforts have been made comparing the workplace similarities (Wesner & Miller,
2008), size (Sullivan & Heitmeyer, 2008), and value (Corporate Leadership Council 1999, as
cited by Jorgensen, 2003) among Boomers, Gen X, and Gen Y. The recurring theme is that the
18
generations are more compatible than previously thought (Treuren & Anderson, 2010). Baby
Boomers have also shown travel consistencies with the younger generations. Through the use of
cohort analysis, Pennington-Grey et al. (2003) introduced common generational tourist
preference variables, which included heightened interest in visiting national and provincial parks
as a part of leisure tourism and may also correspond to the more recent upgrowth in nature-based
tourism. Glover and Prideaux (2009) asserted, however, that “the tourism industry must also
acknowledge the needs and demand of the less numerous younger generations in order to provide
products and destinations tailored to their demand preferences” (p. 35).
2.4.2 Generation X and Y
As Generation X ages, research has begun to indicate that their values are becoming
progressively similar to those of the Baby Boomers (Corporate Leadership Council 1999, as
cited by Jorgensen, 2003). Generation X is beginning to reach its highest earning potential, and
according to DeLollis (2005), Gen X is the most free-spending generation, already outspending
Boomers in certain travel stays.
Prior research by Neuborne and Kerwin (1999), concerning projected generational size,
shows the Y generation exceeding 60 million, making it nearly three times larger than
Generation X (Stevens et al., 2005). Investigations by Markley (2002) and Dotson, Clark, and
Dave (2008) propose that Gen Y will shortly reach the same populace as the Boomers and
considerations should be made as how to accommodate this expansive group.
An important topic of research for some time has been the inquiry into the consumer
behavior of the youth market (Hollander & Germain, 1992), and as Generation Y enters the
consumer marketplace, experts have begun to pay attention to spending patterns due to the sheer
19
size of their consumer segment (Morton, 2002; Kueh & Voon, 2007). Gen Y represents a highly
valued youth market, responsible for an assessed 83 million consumers in the United States alone
(Schmitt, 2008). Stevens et al. (2005) suggested that by as early as 2020, the spending power of
Gen Y will surpass that of the Baby Boomers.
Further, Gen Y has been shown to expend for recreation and sport related consumer
products (Stevens et al., 2005). An overall increase in outdoor recreation participation for the 6
to 24 years old age group was seen from 2008 to 2011, with $4.2 billion total outdoor outings
and an average of 87.2 outings per participant (Outdoor Recreation Participation Report, 2012).
For the age range of 25-44 years, within the same time frame (2008-2011) outdoor participation
has gradually increased as well, with results showing 7.3 billion total outdoor outings and an
average of 79.2 outings per participant. The 45+ age group has shown relative consistency,
presenting a steady trend in outdoor participation from 2008 to 2011 (38%, 2008; 39%, 2009;
38%, 2010; 38%, 2011) (Outdoor Recreation Participation Report, 2012).
As previously noted, empirical research by Brey (2007), Carr (2002), and Currie (1997)
has demonstrated support for everyday leisure trends corresponding with tourism leisure activity.
The interrelation of tourism among the three cohorts is essential in understanding the true nature
of psychographics. Therefore this study will investigate the vacation recreation activity patterns
of potential visitors to North Carolina, across three generations, using Plog’s psychographic
framework.
20
Chapter 3: Methods
In order to accommodate increases in active tourism, destination operators need to
recognize what types of experiences are most attractive to tourists (Glover & Prideaux, 2009;
Scroeder & Widmann, 2007). As new active tourism trends emerge, researchers and planners
are beginning to explore the travel phenomenon of active tourism. However, current
methodological research has yet to investigate where vacation recreation activities engaged in by
tourists fall on Plog’s psychographic continuum. Sung et al. (2001) suggested the need for
current segmentation research within active tourism in order for tourism marketers to more
effectively match preferred destination activities to potential guests. With the increase in active
tourism across the generations and the presented effectiveness of personality in predicting
tourism patterns, new research is needed to accurately define the psychographic markers
associated with particular vacation recreation activities in order to determine traveler
preferences. Consequently, the research questions that this study investigated were:
1. Is Plog’s psychographic model still representative of present-day tourists? (Does the
model still fit?)
2. Are the travel planning profiles as expected for each Plog category?
3. Are there demographic differences in regard to how tourists distribute across Plog’s
continuum?
4. How do preferred vacation recreation activities of tourists relate to their
psychographic score?
21
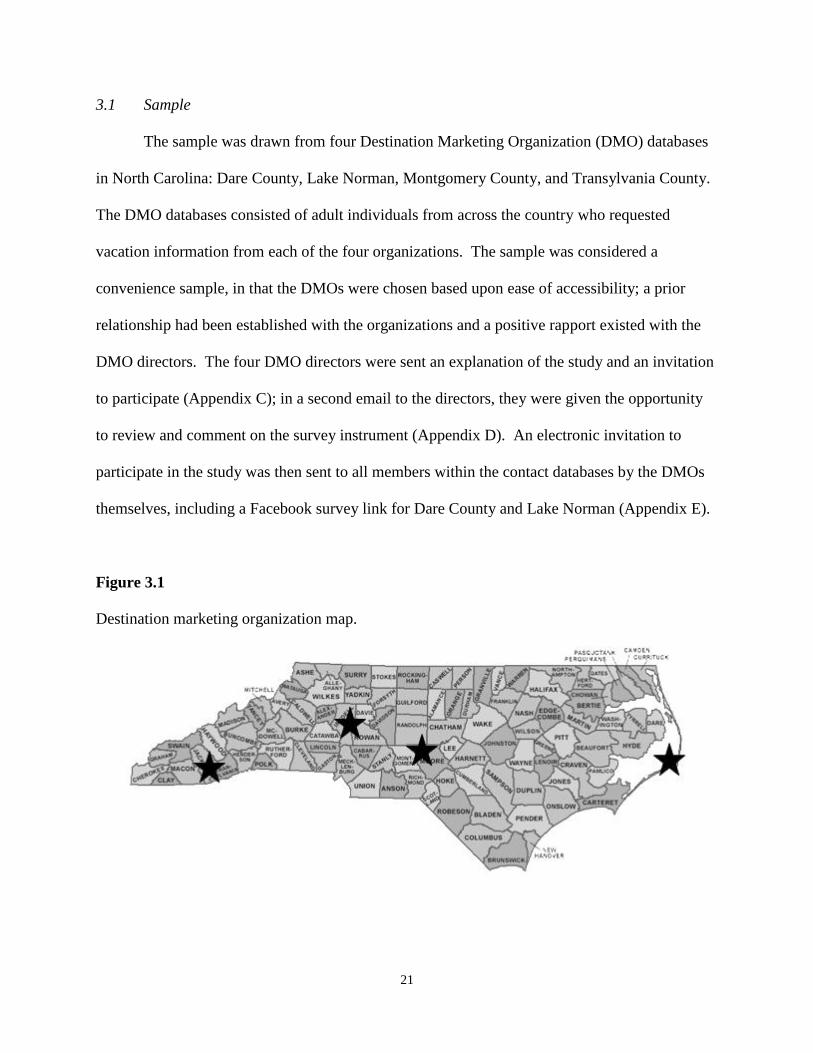
3.1 Sample
The sample was drawn from four Destination Marketing Organization (DMO) databases
in North Carolina: Dare County, Lake Norman, Montgomery County, and Transylvania County.
The DMO databases consisted of adult individuals from across the country who requested
vacation information from each of the four organizations. The sample was considered a
convenience sample, in that the DMOs were chosen based upon ease of accessibility; a prior
relationship had been established with the organizations and a positive rapport existed with the
DMO directors. The four DMO directors were sent an explanation of the study and an invitation
to participate (Appendix C); in a second email to the directors, they were given the opportunity
to review and comment on the survey instrument (Appendix D). An electronic invitation to
participate in the study was then sent to all members within the contact databases by the DMOs
themselves, including a Facebook survey link for Dare County and Lake Norman (Appendix E).
Figure 3.1
Destination marketing organization map.
22
3.2 Survey design and distribution
The survey contained four sections. The first section of the survey consisted of general
demographic questions such as gender, age, income, education level, and geographic location
(zip code).
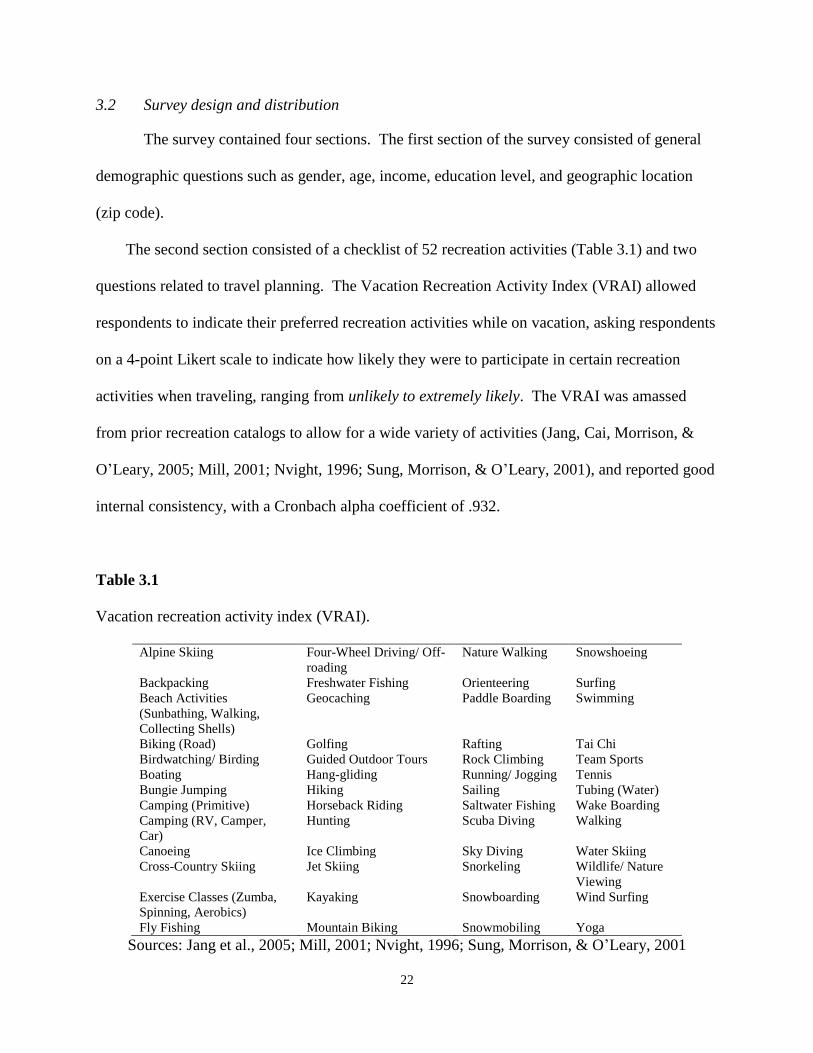
The second section consisted of a checklist of 52 recreation activities (Table 3.1) and two
questions related to travel planning. The Vacation Recreation Activity Index (VRAI) allowed
respondents to indicate their preferred recreation activities while on vacation, asking respondents
on a 4-point Likert scale to indicate how likely they were to participate in certain recreation
activities when traveling, ranging from unlikely to extremely likely. The VRAI was amassed
from prior recreation catalogs to allow for a wide variety of activities (Jang, Cai, Morrison, &
O’Leary, 2005; Mill, 2001; Nvight, 1996; Sung, Morrison, & O’Leary, 2001), and reported good
internal consistency, with a Cronbach alpha coefficient of .932.
Table 3.1
Vacation recreation activity index (VRAI).
Alpine Skiing Four-Wheel Driving/ Off-
roading
Nature Walking Snowshoeing
Backpacking Freshwater Fishing Orienteering Surfing
Beach Activities
(Sunbathing, Walking,
Collecting Shells)
Geocaching Paddle Boarding Swimming
Biking (Road) Golfing Rafting Tai Chi
Birdwatching/ Birding Guided Outdoor Tours Rock Climbing Team Sports
Boating Hang-gliding Running/ Jogging Tennis
Bungie Jumping Hiking Sailing Tubing (Water)
Camping (Primitive) Horseback Riding Saltwater Fishing Wake Boarding
Camping (RV, Camper,
Car)
Hunting Scuba Diving Walking
Canoeing Ice Climbing Sky Diving Water Skiing
Cross-Country Skiing Jet Skiing Snorkeling Wildlife/ Nature
Viewing
Exercise Classes (Zumba,
Spinning, Aerobics)
Kayaking Snowboarding Wind Surfing
Fly Fishing Mountain Biking Snowmobiling Yoga
Sources: Jang et al., 2005; Mill, 2001; Nvight, 1996; Sung, Morrison, & O’Leary, 2001
23
Following the VRAI, two vacation travel planning questions were asked, At what point in your
travel planning do you typically make decisions about your recreational activities?, and How far
in advance do you usually make your lodging reservations? The purpose of the recreational
travel planning and lodging travel planning questions was to establish if any differences in travel
planning behavior existed among groups.
Plog’s 10-question psychographic instrument comprised the third section of the survey,
with an adaptation of two questions for modern-day context. The question When a new
electronic gadget or product appears in the marketplace, will you probably… was changed to
When a new electronic product appears in the marketplace, will you probably… and the question
In terms of the current health-and-exercise phenomenon that has swept the nation, do you… was
changed to In terms of your current exercise participation, do you…. The final section of the
survey included two confirmation questions asking respondents to identify vacation preferences
for both vacation location and activity level while on vacation. These questions were included to
test for concurrence with the Plog instrument.
The survey was piloted with an expert panel including faculty members in the Recreation
and Leisure Studies department at East Carolina University, students in the Principles of Tourism
and Sustainability class at East Carolina University, employees at an outdoor recreation supply
store, and destination marketing professionals. The responses and edits to the survey were taken
into consideration and used to create the final instrument for data collection (Appendix B). The
primary researcher worked with four participating Destination Marketing Organizations (DMOs)
within North Carolina to distribute surveys through email and Facebook databases. The first
distribution of the survey was the week of November 26th, 2012, followed by two reminders
24
after initial contact to prompt respondents to complete the survey. The survey was closed on
December 20th, 2013 (Appendix E).
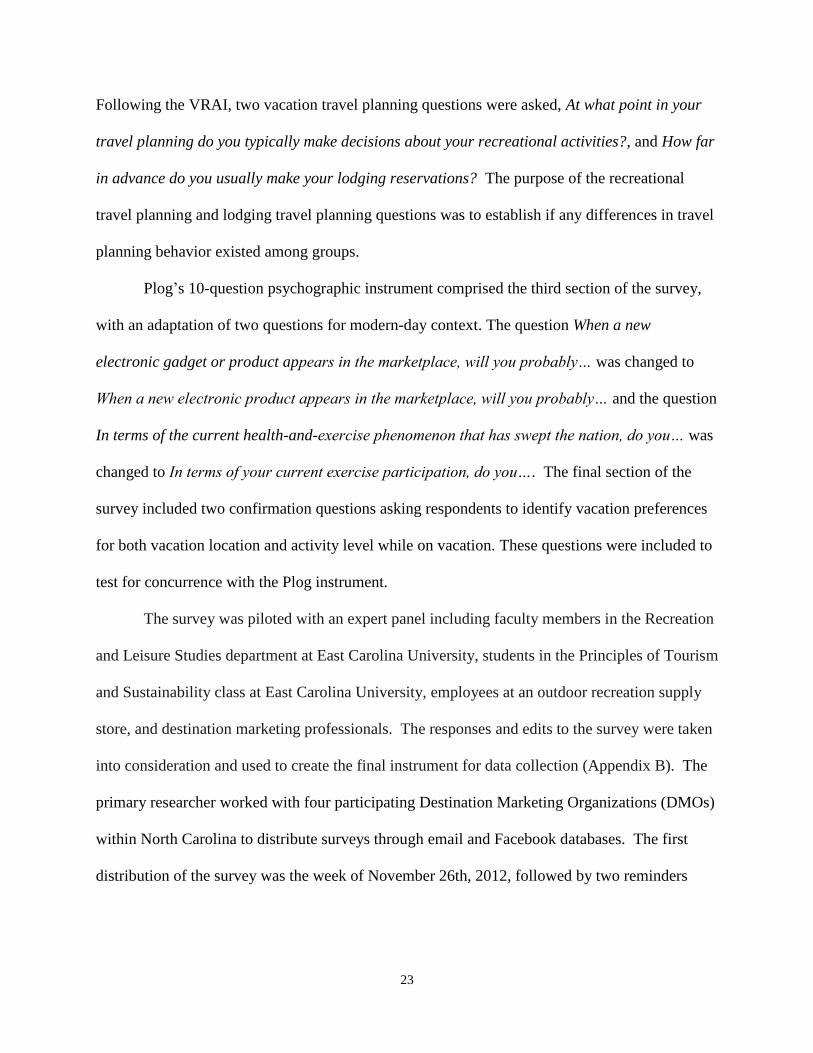
3.4 Analysis
The present study operated under a cross-sectional approach, observing tourists at a
specific point in time. A statistical package (SPSS 20) was used for data analysis. With the
VRAI data, blank responses for likeliness to participate were assumed to be Unlikely; because of
the large number of response options, it was consistently found that respondents skipped
activities they were not interested in. Respondent answers from the Plog instrument were
summed to create a psychographic profile for each respondent using the assigned values: one
point for every “a” answer, two points for every “b” answer, and three points for every “c”
answer – in keeping with the Plog model. A participant score between 10 to 15 points
designated a “Dependable” tourist, 16 to 18 “Near-Dependables,” 19 to 21 “Mid-Centric,” 22 to
24 “Near-Venturer,” and a “Venturer” tourist was denoted by a score of 25 to 30 points.
Table 3.2
Analysis table.
Research
questions
Independent
variable
Level of
measurement
Dependent variable Level of
measurement
Analysis type
1 Plog categories Categorical Psychographic
confirmation questions
Interval One-way ANOVA
1 Plog score Interval Psychographic
confirmation questions
Interval Pearson’s
correlation
coefficient
2 Plog categories Categorical Recreation travel
planning questions
Categorical Chi-square
3 Demographics Categorical Plog score Interval One-way ANOVA/
t-test
4 Plog categories Categorical Activity dimensions
likeliness scores
Interval One-way ANOVA
4 Generational
cohorts
Categorical Activity dimensions
likeliness scores
Interval One-way ANOVA
25
Chapter 4: Results
4.1 Introduction
The goal of this project was to better understand how personality characteristics influence
recreation activity choices while on vacation. The basis of the study was founded in
psychographics, a way of looking at personality profiles that has been shown to reliably establish
tourist preferences. This study assessed how adventurous the respondents were in general, and
investigated the links between their generation, their level of adventurousness, and reported
recreation preferences while on vacation.
4.2 Descriptive results
As previously stated, the sample of respondents was comprised of potential visitors to
North Carolina who requested information from four DMOs within the state. The four DMOs
represented geographically distinct recreational regions in North Carolina, including mountains,
piedmont, and coast. To answer the specified research questions, usable data analyzed were
restricted to members of Generation Y, Generation X, and Baby Boomers. This resulted in the
researcher removing 54 respondents from other age groups and reducing the overall sample size
to 528.
4.2.1 Demographics
The demographic descriptive data are displayed in Tables 4.1 and 4.2. All data in the
table are valid percent scores, where “N” represents the number of visitors who responded to
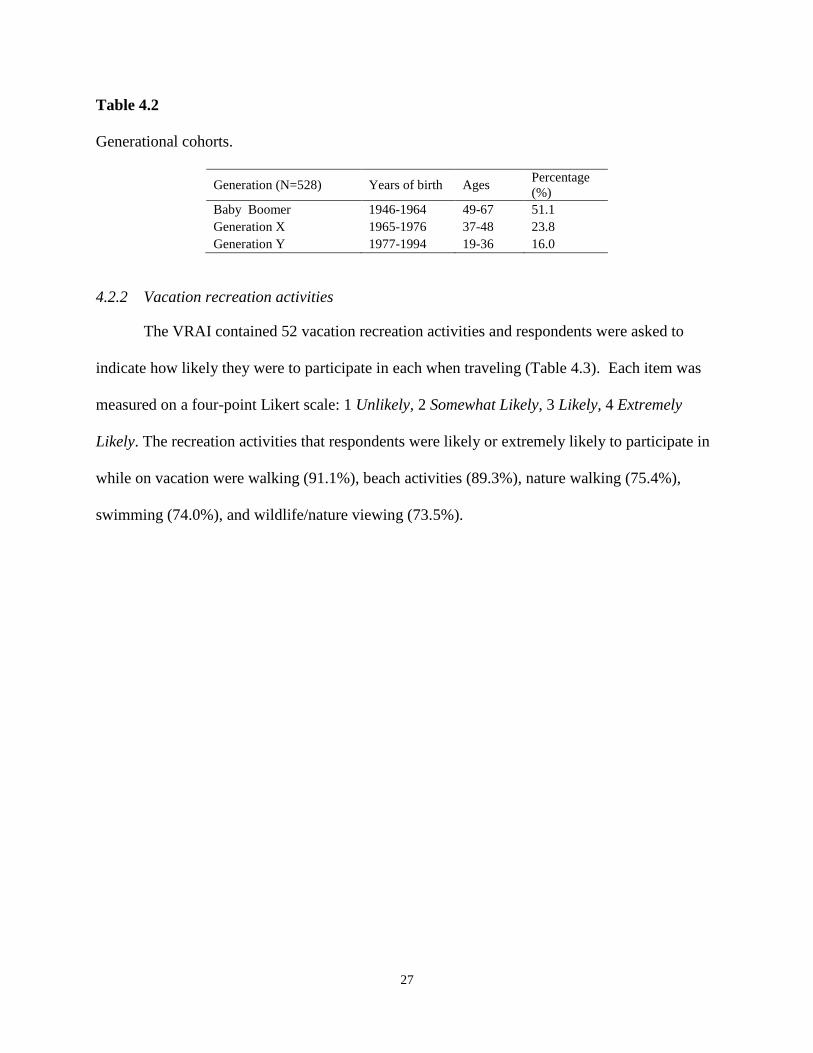
each question. The majority of respondents were in the Baby Boomer cohort (between the ages
of 49 and 67 - 51.1%), female (68.6%), and well educated, with most having attended college or
graduated from college (64.5%), and over one quarter holding a post graduate degree (27.6%).
26
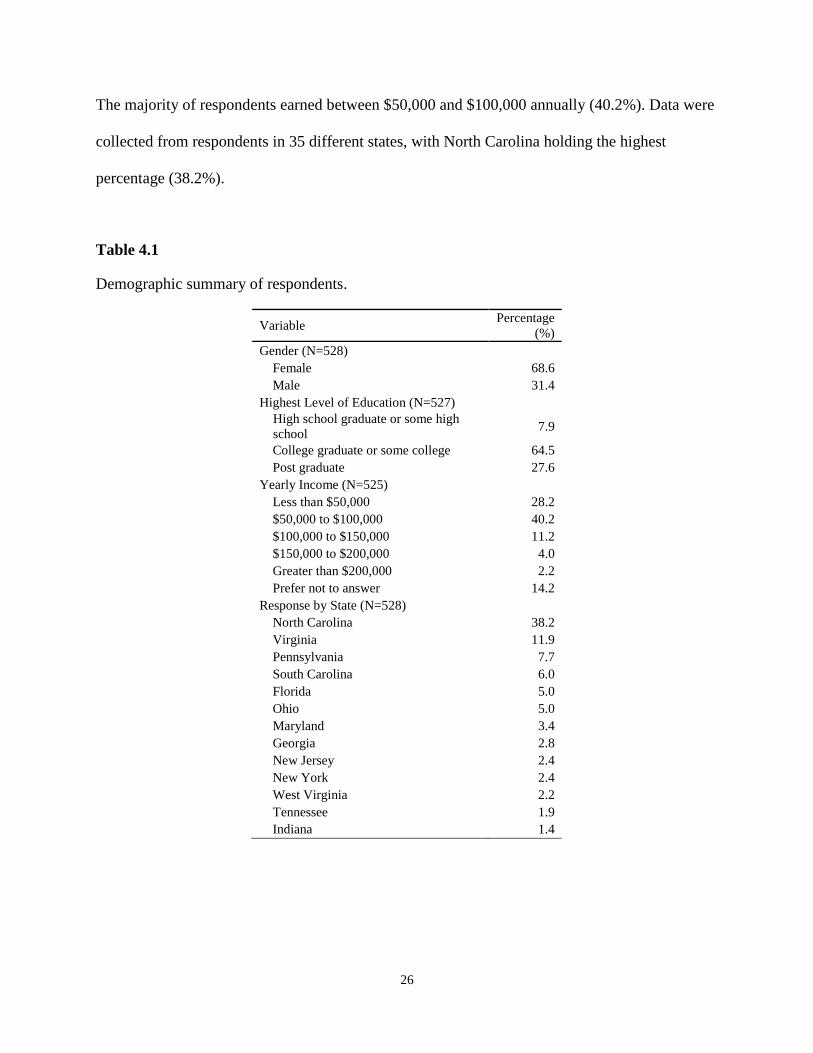
The majority of respondents earned between $50,000 and $100,000 annually (40.2%). Data were
collected from respondents in 35 different states, with North Carolina holding the highest
percentage (38.2%).
Table 4.1
Demographic summary of respondents.
Variable Percentage
(%)
Gender (N=528)
Female 68.6
Male 31.4
Highest Level of Education (N=527)
High school graduate or some high
school 7.9
College graduate or some college 64.5
Post graduate 27.6
Yearly Income (N=525)
Less than $50,000 28.2
$50,000 to $100,000 40.2
$100,000 to $150,000 11.2
$150,000 to $200,000 4.0
Greater than $200,000 2.2
Prefer not to answer 14.2
Response by State (N=528)
North Carolina 38.2
Virginia 11.9
Pennsylvania 7.7
South Carolina 6.0
Florida 5.0
Ohio 5.0
Maryland 3.4
Georgia 2.8
New Jersey 2.4
New York 2.4
West Virginia 2.2
Tennessee 1.9
Indiana 1.4
27
Table 4.2
Generational cohorts.
Generation (N=528) Years of birth Ages Percentage
(%)
Baby Boomer 1946-1964 49-67 51.1
Generation X 1965-1976 37-48 23.8
Generation Y 1977-1994 19-36 16.0
4.2.2 Vacation recreation activities
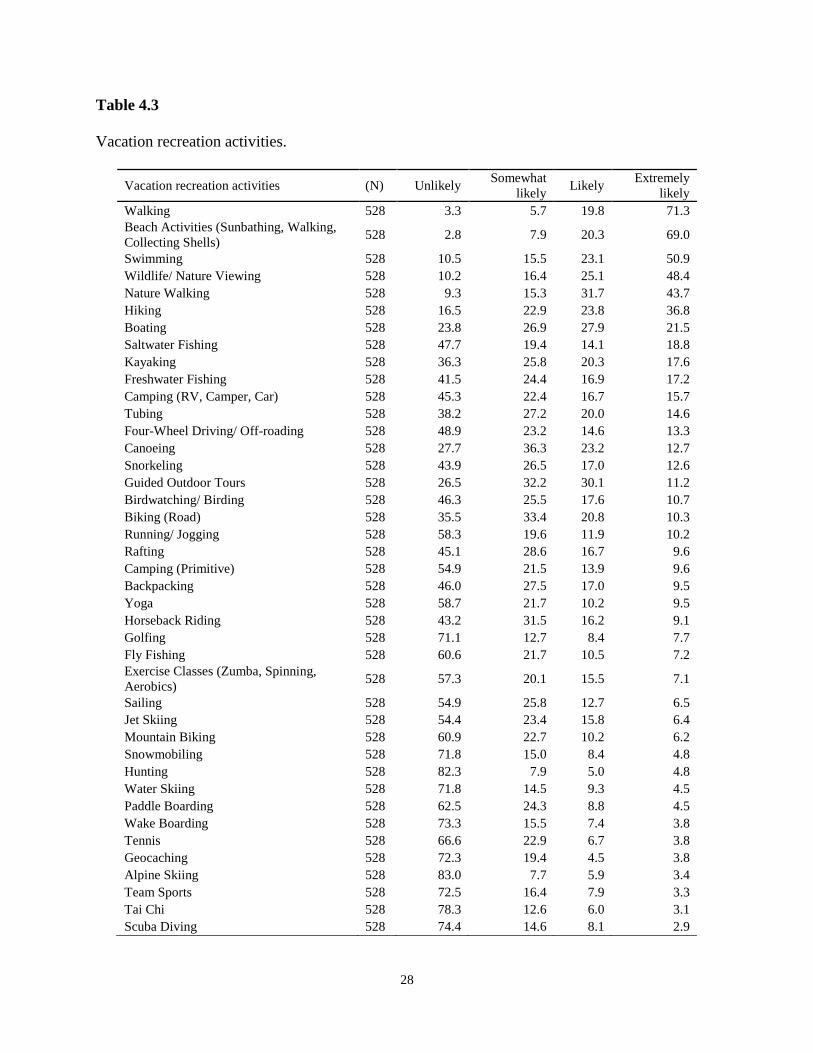
The VRAI contained 52 vacation recreation activities and respondents were asked to
indicate how likely they were to participate in each when traveling (Table 4.3). Each item was
measured on a four-point Likert scale: 1 Unlikely, 2 Somewhat Likely, 3 Likely, 4 Extremely
Likely. The recreation activities that respondents were likely or extremely likely to participate in
while on vacation were walking (91.1%), beach activities (89.3%), nature walking (75.4%),
swimming (74.0%), and wildlife/nature viewing (73.5%).
28
Table 4.3
Vacation recreation activities.
Vacation recreation activities (N) Unlikely Somewhat
likely Likely
Extremely
likely
Walking 528 3.3 5.7 19.8 71.3
Beach Activities (Sunbathing, Walking,
Collecting Shells) 528 2.8 7.9 20.3 69.0
Swimming 528 10.5 15.5 23.1 50.9
Wildlife/ Nature Viewing 528 10.2 16.4 25.1 48.4
Nature Walking 528 9.3 15.3 31.7 43.7
Hiking 528 16.5 22.9 23.8 36.8
Boating 528 23.8 26.9 27.9 21.5
Saltwater Fishing 528 47.7 19.4 14.1 18.8
Kayaking 528 36.3 25.8 20.3 17.6
Freshwater Fishing 528 41.5 24.4 16.9 17.2
Camping (RV, Camper, Car) 528 45.3 22.4 16.7 15.7
Tubing 528 38.2 27.2 20.0 14.6
Four-Wheel Driving/ Off-roading 528 48.9 23.2 14.6 13.3
Canoeing 528 27.7 36.3 23.2 12.7
Snorkeling 528 43.9 26.5 17.0 12.6
Guided Outdoor Tours 528 26.5 32.2 30.1 11.2
Birdwatching/ Birding 528 46.3 25.5 17.6 10.7
Biking (Road) 528 35.5 33.4 20.8 10.3
Running/ Jogging 528 58.3 19.6 11.9 10.2
Rafting 528 45.1 28.6 16.7 9.6
Camping (Primitive) 528 54.9 21.5 13.9 9.6
Backpacking 528 46.0 27.5 17.0 9.5
Yoga 528 58.7 21.7 10.2 9.5
Horseback Riding 528 43.2 31.5 16.2 9.1
Golfing 528 71.1 12.7 8.4 7.7
Fly Fishing 528 60.6 21.7 10.5 7.2
Exercise Classes (Zumba, Spinning,
Aerobics) 528 57.3 20.1 15.5 7.1
Sailing 528 54.9 25.8 12.7 6.5
Jet Skiing 528 54.4 23.4 15.8 6.4
Mountain Biking 528 60.9 22.7 10.2 6.2
Snowmobiling 528 71.8 15.0 8.4 4.8
Hunting 528 82.3 7.9 5.0 4.8
Water Skiing 528 71.8 14.5 9.3 4.5
Paddle Boarding 528 62.5 24.3 8.8 4.5
Wake Boarding 528 73.3 15.5 7.4 3.8
Tennis 528 66.6 22.9 6.7 3.8
Geocaching 528 72.3 19.4 4.5 3.8
Alpine Skiing 528 83.0 7.7 5.9 3.4
Team Sports 528 72.5 16.4 7.9 3.3
Tai Chi 528 78.3 12.6 6.0 3.1
Scuba Diving 528 74.4 14.6 8.1 2.9
29
Table 4.3 Continued
Vacation recreation activities.
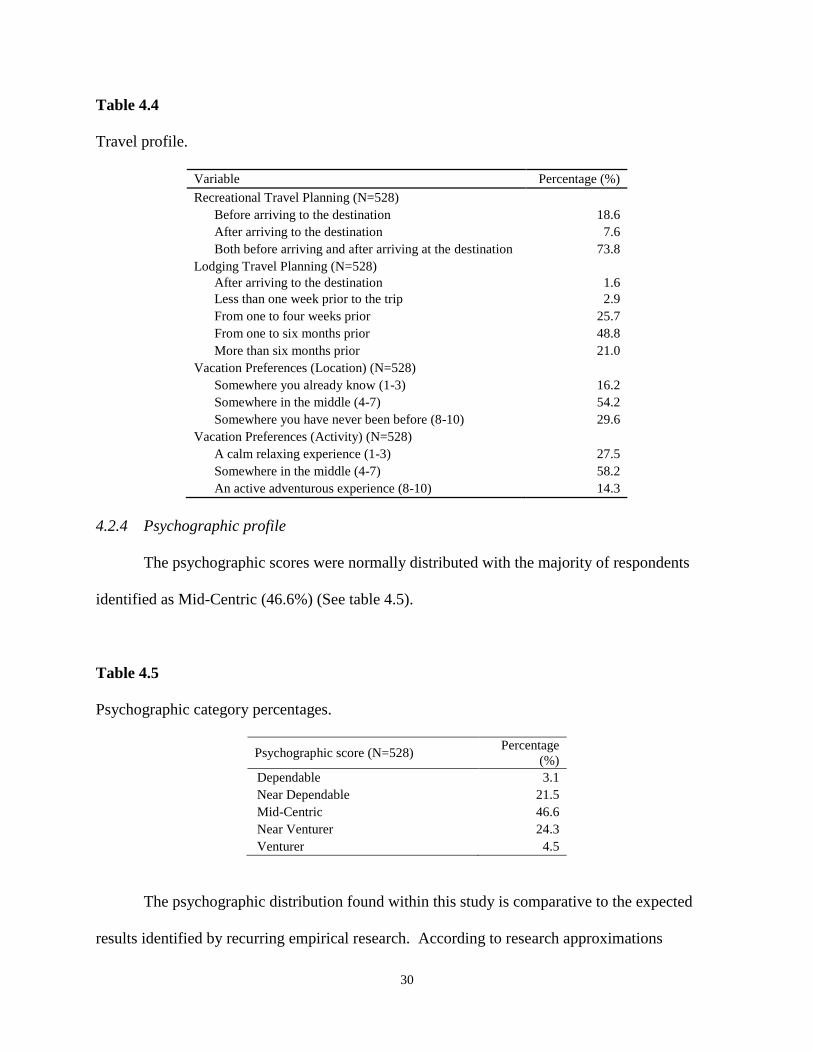
4.2.3 Travel profile
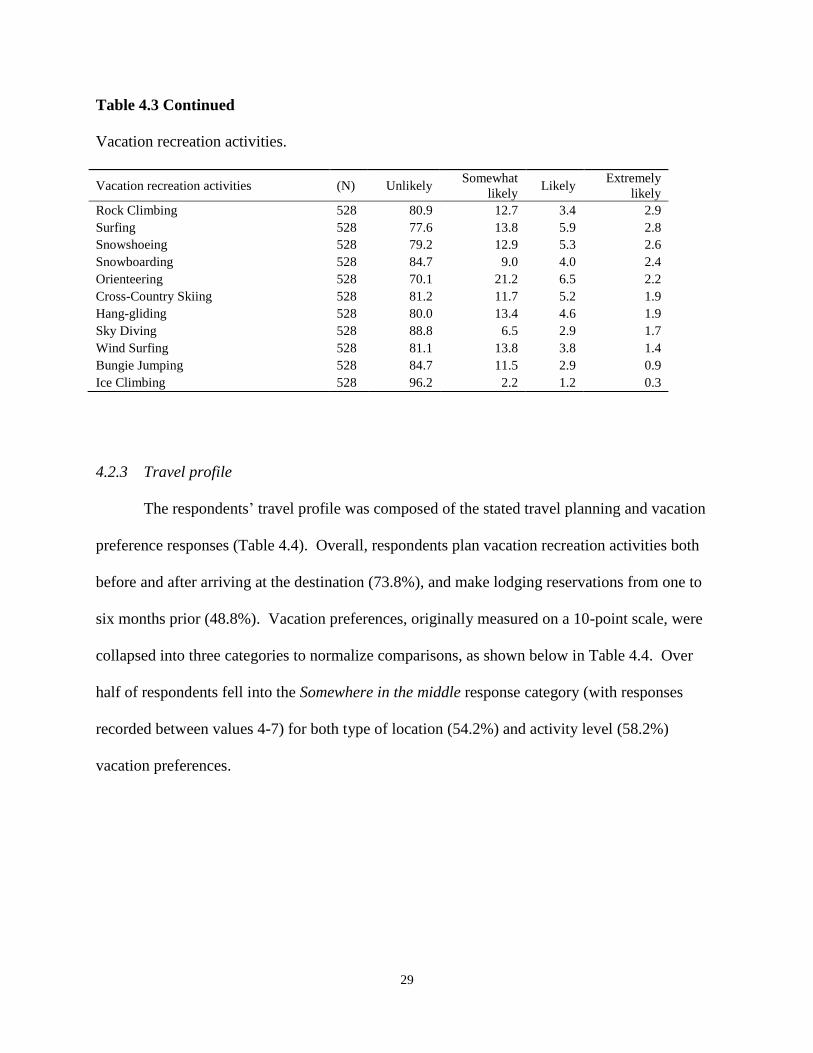
The respondents’ travel profile was composed of the stated travel planning and vacation
preference responses (Table 4.4). Overall, respondents plan vacation recreation activities both
before and after arriving at the destination (73.8%), and make lodging reservations from one to
six months prior (48.8%). Vacation preferences, originally measured on a 10-point scale, were
collapsed into three categories to normalize comparisons, as shown below in Table 4.4. Over
half of respondents fell into the Somewhere in the middle response category (with responses
recorded between values 4-7) for both type of location (54.2%) and activity level (58.2%)
vacation preferences.
Vacation recreation activities (N) Unlikely Somewhat
likely Likely
Extremely
likely
Rock Climbing 528 80.9 12.7 3.4 2.9
Surfing 528 77.6 13.8 5.9 2.8
Snowshoeing 528 79.2 12.9 5.3 2.6
Snowboarding 528 84.7 9.0 4.0 2.4
Orienteering 528 70.1 21.2 6.5 2.2
Cross-Country Skiing 528 81.2 11.7 5.2 1.9
Hang-gliding 528 80.0 13.4 4.6 1.9
Sky Diving 528 88.8 6.5 2.9 1.7
Wind Surfing 528 81.1 13.8 3.8 1.4
Bungie Jumping 528 84.7 11.5 2.9 0.9
Ice Climbing 528 96.2 2.2 1.2 0.3
30
Table 4.4
Travel profile.
Variable Percentage (%)
Recreational Travel Planning (N=528)
Before arriving to the destination 18.6
After arriving to the destination 7.6
Both before arriving and after arriving at the destination 73.8
Lodging Travel Planning (N=528)
After arriving to the destination 1.6
Less than one week prior to the trip 2.9
From one to four weeks prior 25.7
From one to six months prior 48.8
More than six months prior 21.0
Vacation Preferences (Location) (N=528)
Somewhere you already know (1-3) 16.2
Somewhere in the middle (4-7) 54.2
Somewhere you have never been before (8-10) 29.6
Vacation Preferences (Activity) (N=528)
A calm relaxing experience (1-3) 27.5
Somewhere in the middle (4-7) 58.2
An active adventurous experience (8-10) 14.3
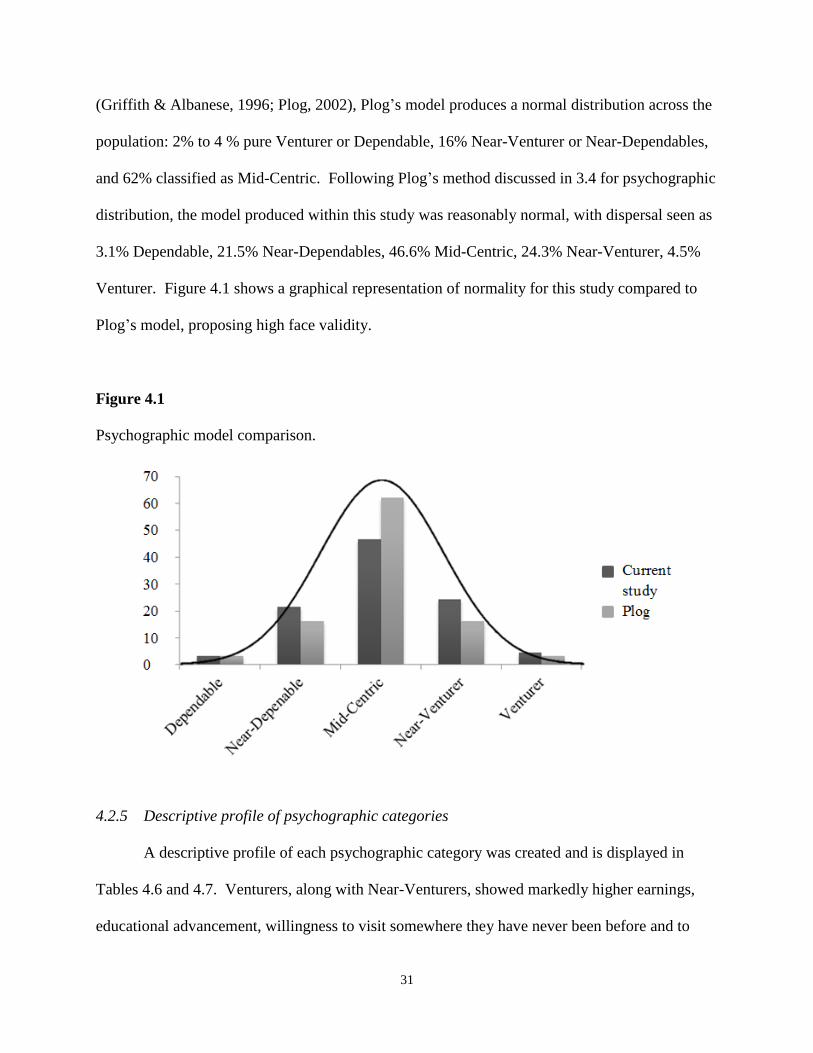
4.2.4 Psychographic profile
The psychographic scores were normally distributed with the majority of respondents
identified as Mid-Centric (46.6%) (See table 4.5).
Table 4.5
Psychographic category percentages.
Psychographic score (N=528) Percentage
(%)
Dependable 3.1
Near Dependable 21.5
Mid-Centric 46.6
Near Venturer 24.3
Venturer 4.5
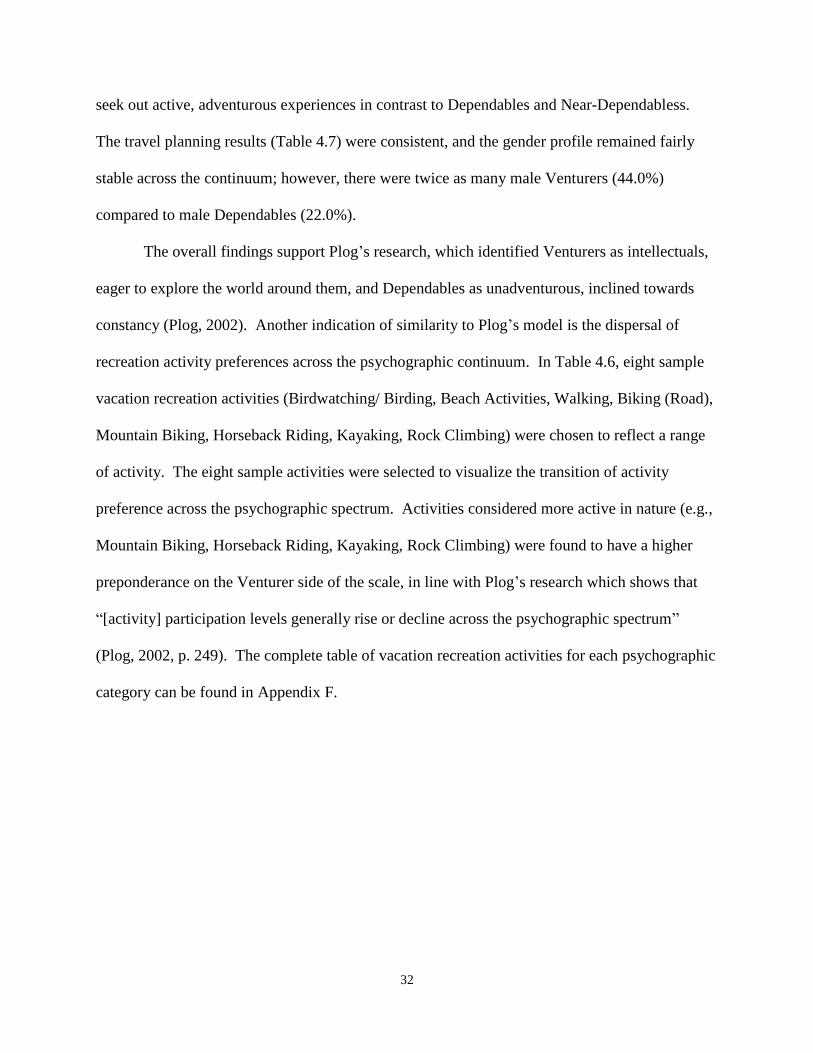
The psychographic distribution found within this study is comparative to the expected
results identified by recurring empirical research. According to research approximations
31
(Griffith & Albanese, 1996; Plog, 2002), Plog’s model produces a normal distribution across the
population: 2% to 4 % pure Venturer or Dependable, 16% Near-Venturer or Near-Dependables,
and 62% classified as Mid-Centric. Following Plog’s method discussed in 3.4 for psychographic
distribution, the model produced within this study was reasonably normal, with dispersal seen as
3.1% Dependable, 21.5% Near-Dependables, 46.6% Mid-Centric, 24.3% Near-Venturer, 4.5%
Venturer. Figure 4.1 shows a graphical representation of normality for this study compared to
Plog’s model, proposing high face validity.
Figure 4.1
Psychographic model comparison.
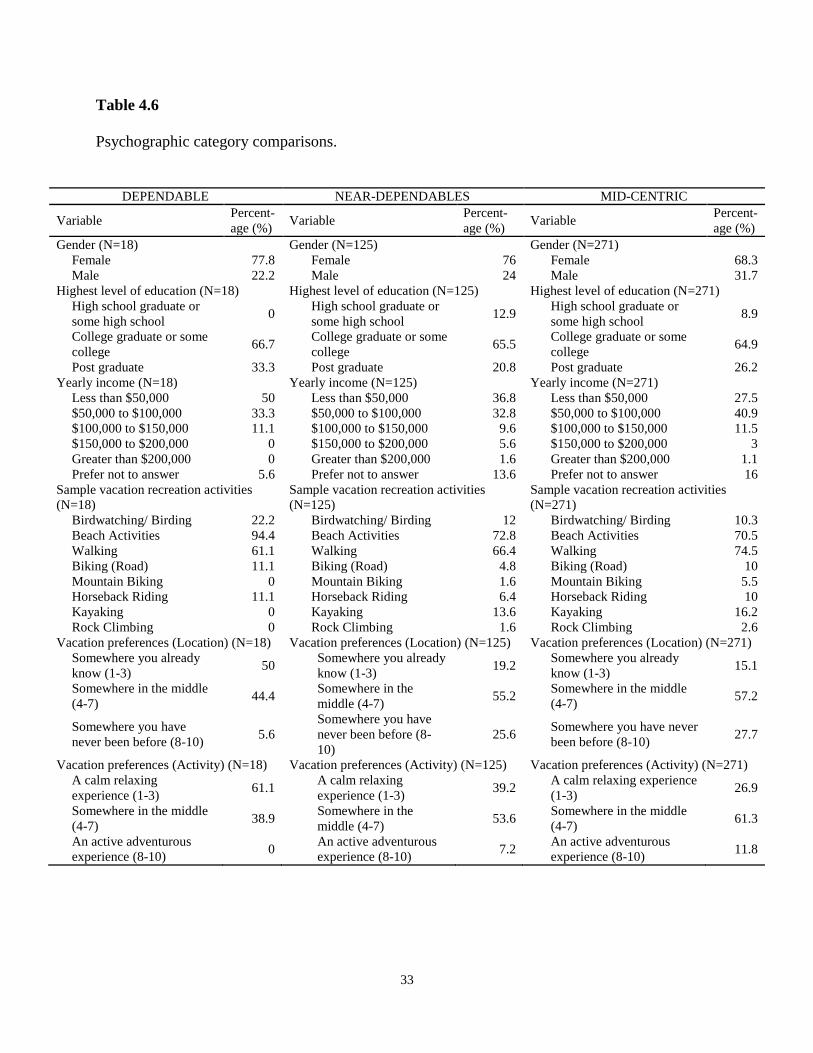
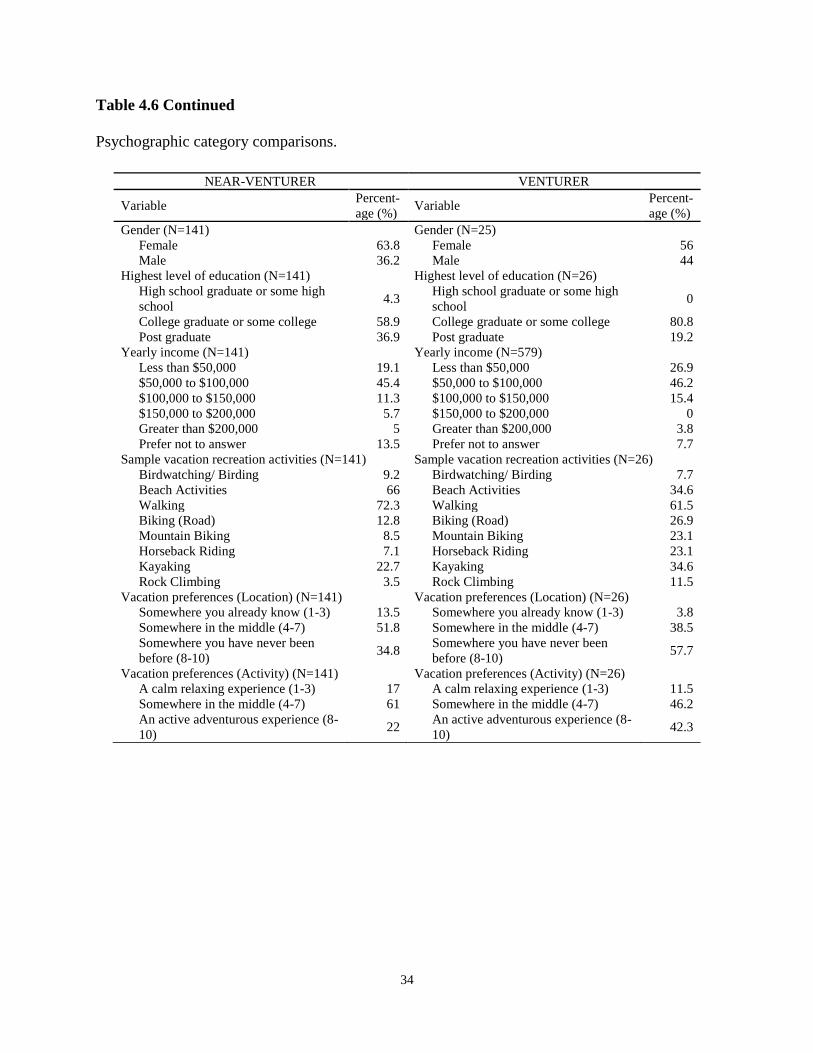
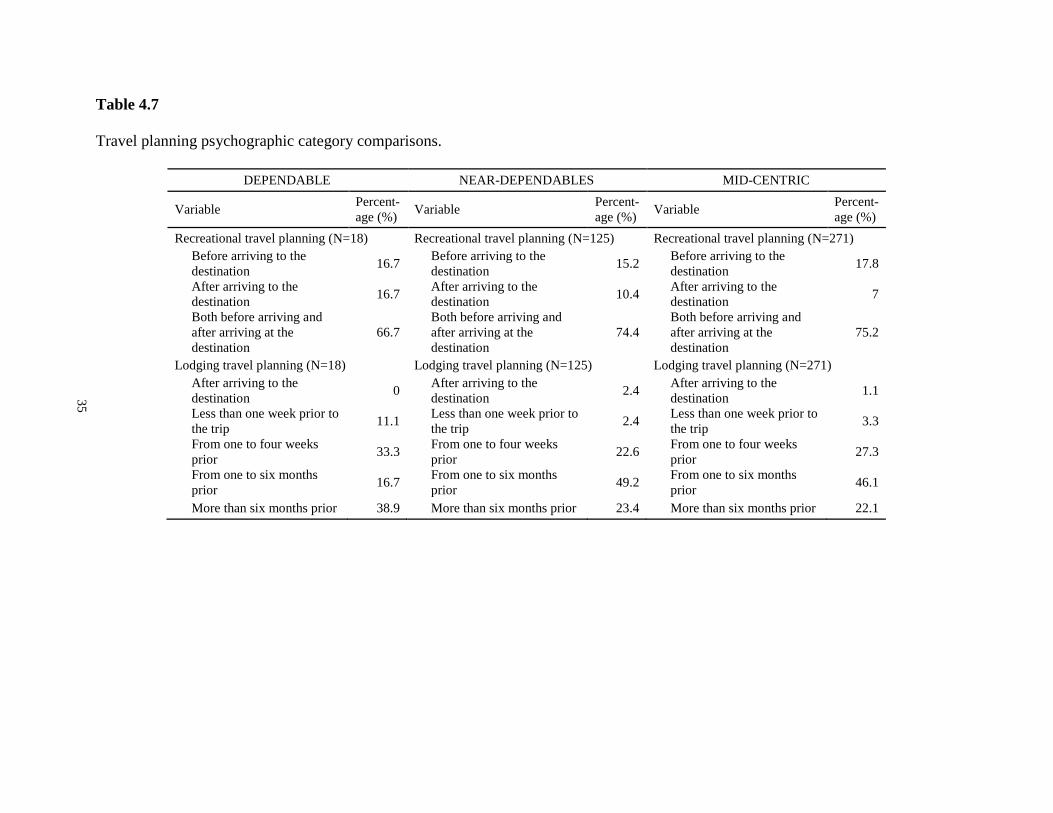
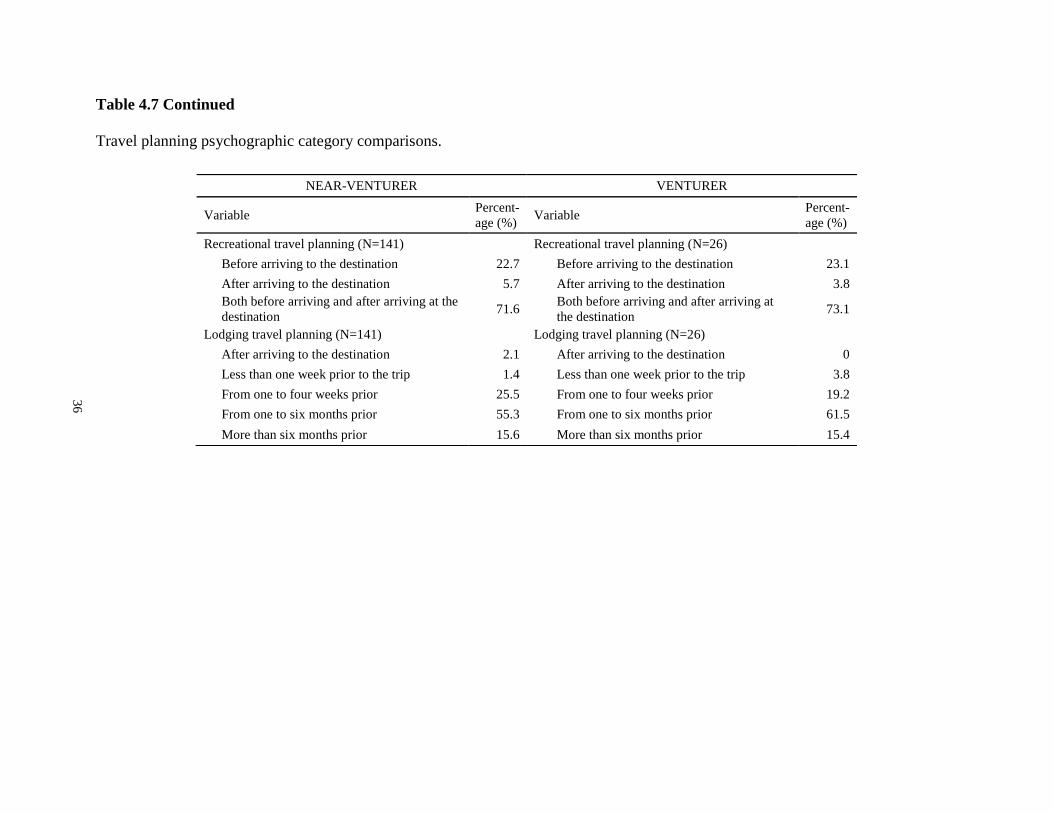
4.2.5 Descriptive profile of psychographic categories
A descriptive profile of each psychographic category was created and is displayed in
Tables 4.6 and 4.7. Venturers, along with Near-Venturers, showed markedly higher earnings,
educational advancement, willingness to visit somewhere they have never been before and to
32
seek out active, adventurous experiences in contrast to Dependables and Near-Dependabless.
The travel planning results (Table 4.7) were consistent, and the gender profile remained fairly
stable across the continuum; however, there were twice as many male Venturers (44.0%)
compared to male Dependables (22.0%).
The overall findings support Plog’s research, which identified Venturers as intellectuals,
eager to explore the world around them, and Dependables as unadventurous, inclined towards
constancy (Plog, 2002). Another indication of similarity to Plog’s model is the dispersal of
recreation activity preferences across the psychographic continuum. In Table 4.6, eight sample
vacation recreation activities (Birdwatching/ Birding, Beach Activities, Walking, Biking (Road),
Mountain Biking, Horseback Riding, Kayaking, Rock Climbing) were chosen to reflect a range
of activity. The eight sample activities were selected to visualize the transition of activity
preference across the psychographic spectrum. Activities considered more active in nature (e.g.,
Mountain Biking, Horseback Riding, Kayaking, Rock Climbing) were found to have a higher
preponderance on the Venturer side of the scale, in line with Plog’s research which shows that
“[activity] participation levels generally rise or decline across the psychographic spectrum”
(Plog, 2002, p. 249). The complete table of vacation recreation activities for each psychographic
category can be found in Appendix F.
33
Table 4.6
Psychographic category comparisons.
DEPENDABLE NEAR-DEPENDABLES MID-CENTRIC
Variable Percent-
age (%) Variable
Percent-
age (%) Variable
Percent-
age (%)
Gender (N=18) Gender (N=125) Gender (N=271)
Female 77.8 Female 76 Female 68.3
Male 22.2 Male 24 Male 31.7
Highest level of education (N=18) Highest level of education (N=125) Highest level of education (N=271)
High school graduate or
some high school 0
High school graduate or
some high school 12.9
High school graduate or
some high school 8.9
College graduate or some
college 66.7
College graduate or some
college 65.5
College graduate or some
college 64.9
Post graduate 33.3 Post graduate 20.8 Post graduate 26.2
Yearly income (N=18) Yearly income (N=125) Yearly income (N=271)
Less than $50,000 50 Less than $50,000 36.8 Less than $50,000 27.5
$50,000 to $100,000 33.3 $50,000 to $100,000 32.8 $50,000 to $100,000 40.9
$100,000 to $150,000 11.1 $100,000 to $150,000 9.6 $100,000 to $150,000 11.5
$150,000 to $200,000 0 $150,000 to $200,000 5.6 $150,000 to $200,000 3
Greater than $200,000 0 Greater than $200,000 1.6 Greater than $200,000 1.1
Prefer not to answer 5.6 Prefer not to answer 13.6 Prefer not to answer 16
Sample vacation recreation activities
(N=18)
Sample vacation recreation activities
(N=125)
Sample vacation recreation activities
(N=271)
Birdwatching/ Birding 22.2 Birdwatching/ Birding 12 Birdwatching/ Birding 10.3
Beach Activities 94.4 Beach Activities 72.8 Beach Activities 70.5
Walking 61.1 Walking 66.4 Walking 74.5
Biking (Road) 11.1 Biking (Road) 4.8 Biking (Road) 10
Mountain Biking 0 Mountain Biking 1.6 Mountain Biking 5.5
Horseback Riding 11.1 Horseback Riding 6.4 Horseback Riding 10
Kayaking 0 Kayaking 13.6 Kayaking 16.2
Rock Climbing 0 Rock Climbing 1.6 Rock Climbing 2.6
Vacation preferences (Location) (N=18) Vacation preferences (Location) (N=125) Vacation preferences (Location) (N=271)
Somewhere you already
know (1-3) 50
Somewhere you already
know (1-3) 19.2
Somewhere you already
know (1-3) 15.1
Somewhere in the middle
(4-7) 44.4
Somewhere in the
middle (4-7) 55.2
Somewhere in the middle
(4-7) 57.2
Somewhere you have
never been before (8-10) 5.6
Somewhere you have
never been before (8-
10)
25.6 Somewhere you have never
been before (8-10) 27.7
Vacation preferences (Activity) (N=18) Vacation preferences (Activity) (N=125) Vacation preferences (Activity) (N=271)
A calm relaxing
experience (1-3) 61.1
A calm relaxing
experience (1-3) 39.2
A calm relaxing experience
(1-3) 26.9
Somewhere in the middle
(4-7) 38.9
Somewhere in the
middle (4-7) 53.6
Somewhere in the middle
(4-7) 61.3
An active adventurous
experience (8-10) 0
An active adventurous
experience (8-10) 7.2
An active adventurous
experience (8-10) 11.8
34
Table 4.6 Continued
Psychographic category comparisons.
NEAR-VENTURER VENTURER
Variable Percent-
age (%) Variable
Percent-
age (%)
Gender (N=141) Gender (N=25)
Female 63.8 Female 56
Male 36.2 Male 44
Highest level of education (N=141) Highest level of education (N=26)
High school graduate or some high
school 4.3
High school graduate or some high
school 0
College graduate or some college 58.9 College graduate or some college 80.8
Post graduate 36.9 Post graduate 19.2
Yearly income (N=141) Yearly income (N=579)
Less than $50,000 19.1 Less than $50,000 26.9
$50,000 to $100,000 45.4 $50,000 to $100,000 46.2
$100,000 to $150,000 11.3 $100,000 to $150,000 15.4
$150,000 to $200,000 5.7 $150,000 to $200,000 0
Greater than $200,000 5 Greater than $200,000 3.8
Prefer not to answer 13.5 Prefer not to answer 7.7
Sample vacation recreation activities (N=141) Sample vacation recreation activities (N=26)
Birdwatching/ Birding 9.2 Birdwatching/ Birding 7.7
Beach Activities 66 Beach Activities 34.6
Walking 72.3 Walking 61.5
Biking (Road) 12.8 Biking (Road) 26.9
Mountain Biking 8.5 Mountain Biking 23.1
Horseback Riding 7.1 Horseback Riding 23.1
Kayaking 22.7 Kayaking 34.6
Rock Climbing 3.5 Rock Climbing 11.5
Vacation preferences (Location) (N=141) Vacation preferences (Location) (N=26)
Somewhere you already know (1-3) 13.5 Somewhere you already know (1-3) 3.8
Somewhere in the middle (4-7) 51.8 Somewhere in the middle (4-7) 38.5
Somewhere you have never been
before (8-10) 34.8
Somewhere you have never been
before (8-10) 57.7
Vacation preferences (Activity) (N=141) Vacation preferences (Activity) (N=26)
A calm relaxing experience (1-3) 17 A calm relaxing experience (1-3) 11.5
Somewhere in the middle (4-7) 61 Somewhere in the middle (4-7) 46.2
An active adventurous experience (8-
10) 22
An active adventurous experience (8-
10) 42.3
35
35
Table 4.7
Travel planning psychographic category comparisons.
DEPENDABLE NEAR-DEPENDABLES MID-CENTRIC
Variable Percent-
age (%) Variable
Percent-
age (%) Variable
Percent-
age (%)
Recreational travel planning (N=18) Recreational travel planning (N=125) Recreational travel planning (N=271)
Before arriving to the
destination 16.7
Before arriving to the
destination 15.2
Before arriving to the
destination 17.8
After arriving to the
destination 16.7
After arriving to the
destination 10.4
After arriving to the
destination 7
Both before arriving and
after arriving at the
destination
66.7
Both before arriving and
after arriving at the
destination
74.4
Both before arriving and
after arriving at the
destination
75.2
Lodging travel planning (N=18) Lodging travel planning (N=125) Lodging travel planning (N=271)
After arriving to the
destination 0
After arriving to the
destination 2.4
After arriving to the
destination 1.1
Less than one week prior to
the trip 11.1
Less than one week prior to
the trip 2.4
Less than one week prior to
the trip 3.3
From one to four weeks
prior 33.3
From one to four weeks
prior 22.6
From one to four weeks
prior 27.3
From one to six months
prior 16.7
From one to six months
prior 49.2
From one to six months
prior 46.1
More than six months prior 38.9 More than six months prior 23.4 More than six months prior 22.1
36
36
Table 4.7 Continued
Travel planning psychographic category comparisons.
NEAR-VENTURER VENTURER
Variable Percent-
age (%) Variable
Percent-
age (%)
Recreational travel planning (N=141) Recreational travel planning (N=26)
Before arriving to the destination 22.7 Before arriving to the destination 23.1
After arriving to the destination 5.7 After arriving to the destination 3.8
Both before arriving and after arriving at the
destination 71.6
Both before arriving and after arriving at
the destination 73.1
Lodging travel planning (N=141) Lodging travel planning (N=26)
After arriving to the destination 2.1 After arriving to the destination 0
Less than one week prior to the trip 1.4 Less than one week prior to the trip 3.8
From one to four weeks prior 25.5 From one to four weeks prior 19.2
From one to six months prior 55.3 From one to six months prior 61.5
More than six months prior 15.6 More than six months prior 15.4
37
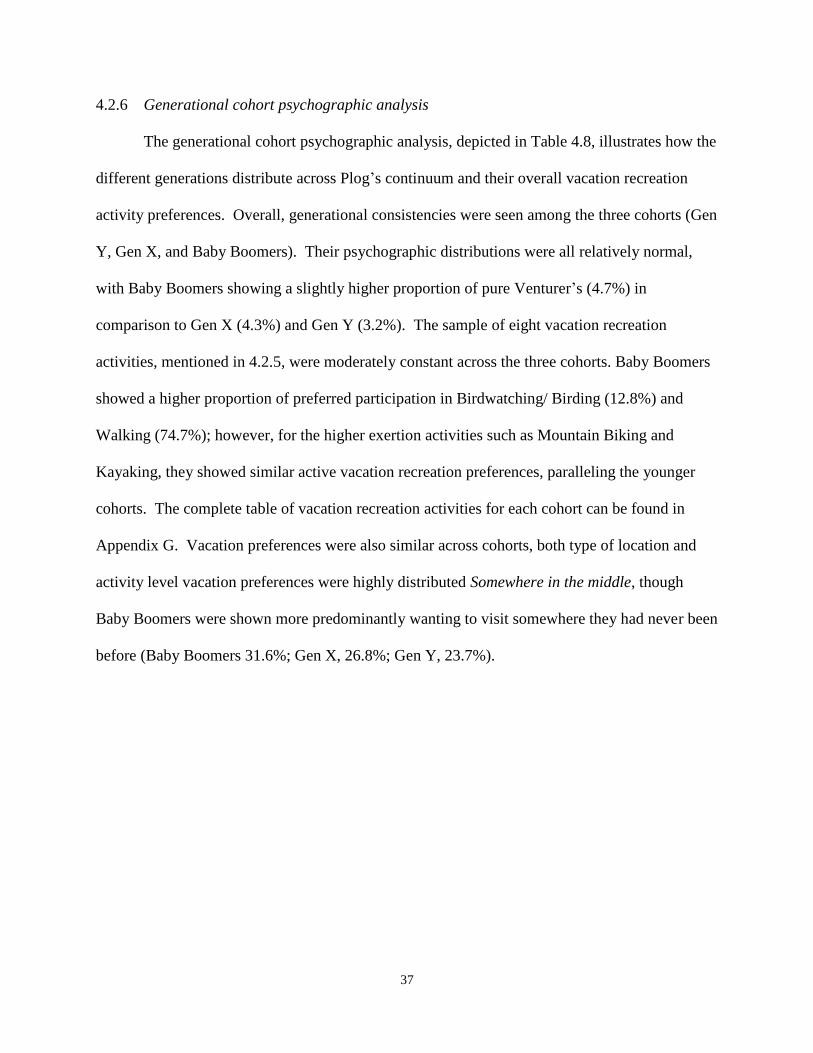
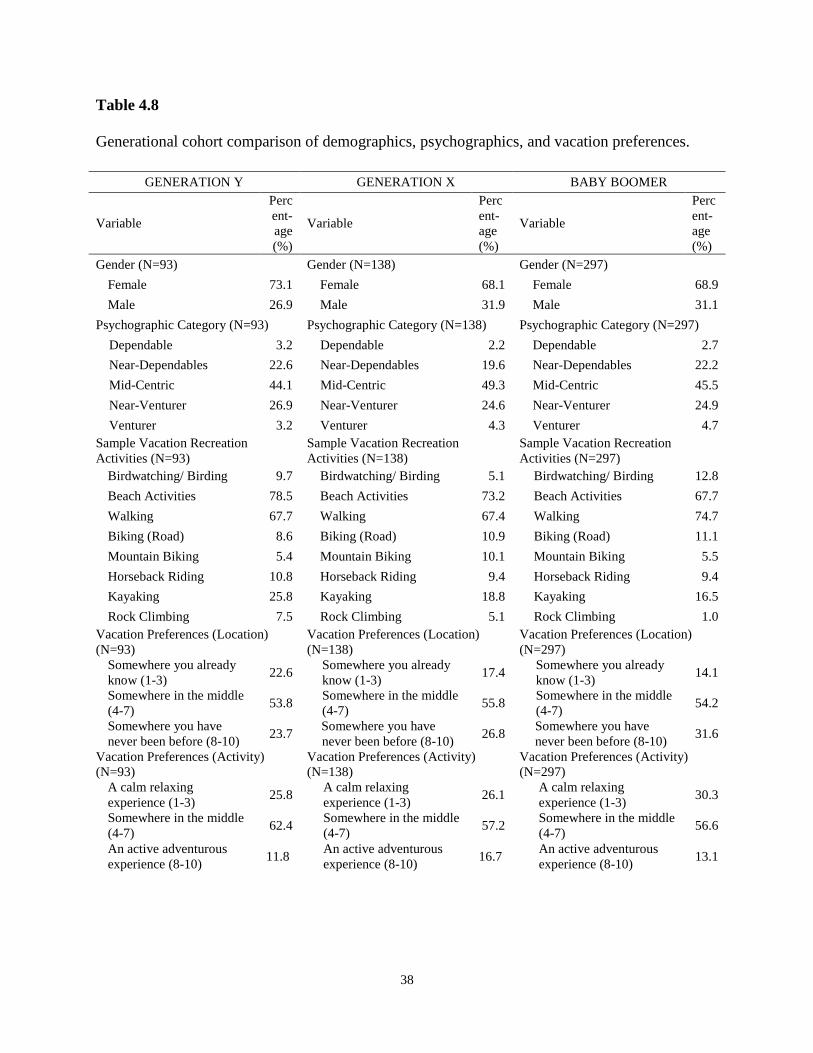
4.2.6 Generational cohort psychographic analysis
The generational cohort psychographic analysis, depicted in Table 4.8, illustrates how the
different generations distribute across Plog’s continuum and their overall vacation recreation
activity preferences. Overall, generational consistencies were seen among the three cohorts (Gen
Y, Gen X, and Baby Boomers). Their psychographic distributions were all relatively normal,
with Baby Boomers showing a slightly higher proportion of pure Venturer’s (4.7%) in
comparison to Gen X (4.3%) and Gen Y (3.2%). The sample of eight vacation recreation
activities, mentioned in 4.2.5, were moderately constant across the three cohorts. Baby Boomers
showed a higher proportion of preferred participation in Birdwatching/ Birding (12.8%) and
Walking (74.7%); however, for the higher exertion activities such as Mountain Biking and
Kayaking, they showed similar active vacation recreation preferences, paralleling the younger
cohorts. The complete table of vacation recreation activities for each cohort can be found in
Appendix G. Vacation preferences were also similar across cohorts, both type of location and
activity level vacation preferences were highly distributed Somewhere in the middle, though
Baby Boomers were shown more predominantly wanting to visit somewhere they had never been
before (Baby Boomers 31.6%; Gen X, 26.8%; Gen Y, 23.7%).
38
Table 4.8
Generational cohort comparison of demographics, psychographics, and vacation preferences.
GENERATION Y GENERATION X BABY BOOMER
Variable
Perc
ent-
age
(%)
Variable
Perc
ent-
age
(%)
Variable
Perc
ent-
age
(%)
Gender (N=93) Gender (N=138) Gender (N=297)
Female 73.1 Female 68.1 Female 68.9
Male 26.9 Male 31.9 Male 31.1
Psychographic Category (N=93) Psychographic Category (N=138) Psychographic Category (N=297)
Dependable 3.2 Dependable 2.2 Dependable 2.7
Near-Dependables 22.6 Near-Dependables 19.6 Near-Dependables 22.2
Mid-Centric 44.1 Mid-Centric 49.3 Mid-Centric 45.5
Near-Venturer 26.9 Near-Venturer 24.6 Near-Venturer 24.9
Venturer 3.2 Venturer 4.3 Venturer 4.7
Sample Vacation Recreation
Activities (N=93)
Sample Vacation Recreation
Activities (N=138)
Sample Vacation Recreation
Activities (N=297)
Birdwatching/ Birding 9.7 Birdwatching/ Birding 5.1 Birdwatching/ Birding 12.8
Beach Activities 78.5 Beach Activities 73.2 Beach Activities 67.7
Walking 67.7 Walking 67.4 Walking 74.7
Biking (Road) 8.6 Biking (Road) 10.9 Biking (Road) 11.1
Mountain Biking 5.4 Mountain Biking 10.1 Mountain Biking 5.5
Horseback Riding 10.8 Horseback Riding 9.4 Horseback Riding 9.4
Kayaking 25.8 Kayaking 18.8 Kayaking 16.5
Rock Climbing 7.5 Rock Climbing 5.1 Rock Climbing 1.0
Vacation Preferences (Location)
(N=93)
Vacation Preferences (Location)
(N=138)
Vacation Preferences (Location)
(N=297)
Somewhere you already
know (1-3) 22.6
Somewhere you already
know (1-3) 17.4
Somewhere you already
know (1-3) 14.1
Somewhere in the middle
(4-7) 53.8
Somewhere in the middle
(4-7) 55.8
Somewhere in the middle
(4-7) 54.2
Somewhere you have
never been before (8-10) 23.7
Somewhere you have
never been before (8-10) 26.8
Somewhere you have
never been before (8-10) 31.6
Vacation Preferences (Activity)
(N=93)
Vacation Preferences (Activity)
(N=138)
Vacation Preferences (Activity)
(N=297)
A calm relaxing
experience (1-3) 25.8
A calm relaxing
experience (1-3) 26.1
A calm relaxing
experience (1-3) 30.3
Somewhere in the middle
(4-7) 62.4
Somewhere in the middle
(4-7) 57.2
Somewhere in the middle
(4-7) 56.6
An active adventurous
experience (8-10) 11.8
An active adventurous
experience (8-10) 16.7
An active adventurous
experience (8-10) 13.1
39
4.3 Test results
4.3.1 Vacation preferences among psychographic categories
To explore research question one, Is Plog’s psychographic model still representative of
present-day tourists? (Does the model still fit?), and to explore the variability in vacation
preferences (location and activity) among the five psychographic categories (Dependable, Near-
Dependables, Mid-Centric, Near-Venturer, and Venturer), a one-way analysis of variance
(ANOVA) was conducted. Participants in each psychographic category were assessed according
to two confirmation questions measuring vacation preferences: vacation preference location,
asking When planning a vacation or getaway, do you prefer to visit?, response options ranged
from Somewhere you already know (1) to Somewhere you have never been before (10), and
vacation preference activity, asking When planning a vacation or getaway, do you prefer to
have?, responses ranged from A calm relaxing experience (1) to An active adventurous
experience (10). Both vacation preference questions were placed in the survey as a confirmation
for the Plog instrument or to reveal potential inconsistencies within the instrument.
The Levene’s test for homogeneity of variances for both analyses indicated that the
assumption of homogeneity of variance was not violated. Results showed that there was a
statistically significant difference at the p < .05 level in the psychographic categories for both
psychographic confirmation questions: vacation preference location [F (4, 523) = 6.87, p < .001]
and vacation preference activity [F (4, 523) = 16.7, p < .001]. The effect size, calculated using
eta squared, was moderate for vacation preference location (eta squared = .05) and for vacation
preference activity (eta squared = .11). Using the Tukey HSD post-hoc test, comparisons for
vacation preferences location indicated that the mean score for Dependables (M = 3.64, SD =
2.06) was significantly different than all other groups, and Venturers (M = 7.3, SD = 1.96)
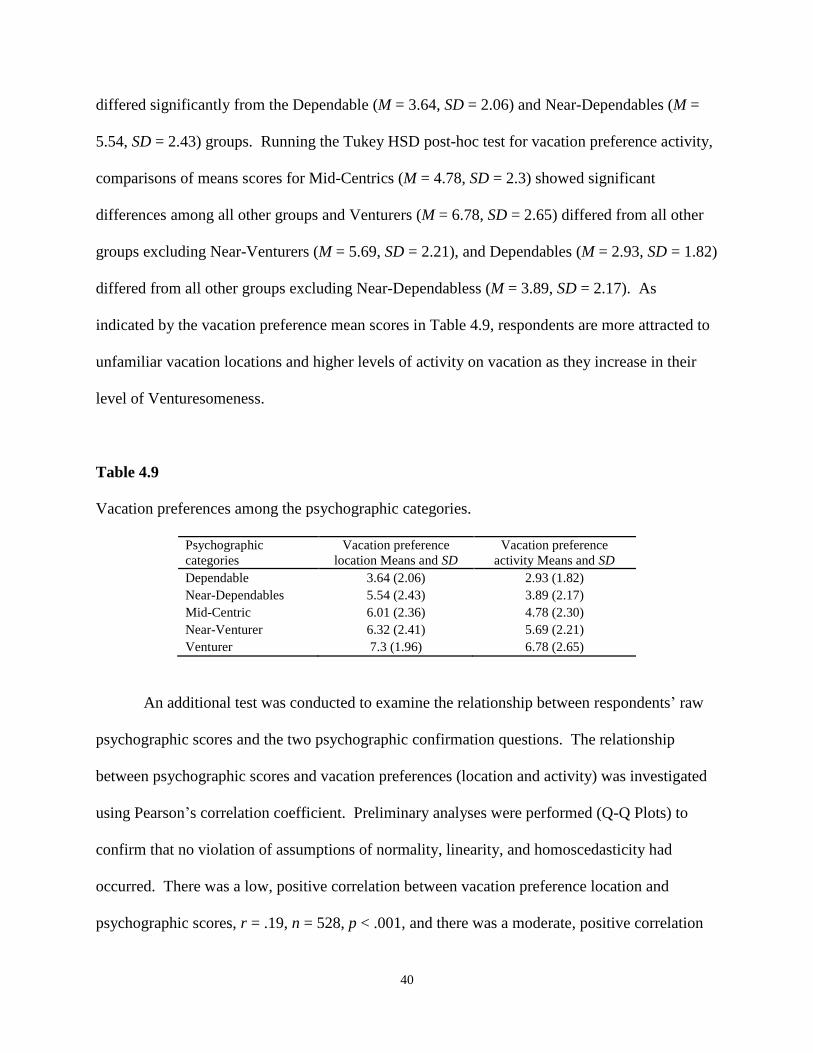
40
differed significantly from the Dependable (M = 3.64, SD = 2.06) and Near-Dependables (M =
5.54, SD = 2.43) groups. Running the Tukey HSD post-hoc test for vacation preference activity,
comparisons of means scores for Mid-Centrics (M = 4.78, SD = 2.3) showed significant
differences among all other groups and Venturers (M = 6.78, SD = 2.65) differed from all other
groups excluding Near-Venturers (M = 5.69, SD = 2.21), and Dependables (M = 2.93, SD = 1.82)
differed from all other groups excluding Near-Dependabless (M = 3.89, SD = 2.17). As
indicated by the vacation preference mean scores in Table 4.9, respondents are more attracted to
unfamiliar vacation locations and higher levels of activity on vacation as they increase in their
level of Venturesomeness.
Table 4.9
Vacation preferences among the psychographic categories.
Psychographic
categories
Vacation preference
location Means and SD
Vacation preference
activity Means and SD
Dependable 3.64 (2.06) 2.93 (1.82)
Near-Dependables 5.54 (2.43) 3.89 (2.17)
Mid-Centric 6.01 (2.36) 4.78 (2.30)
Near-Venturer 6.32 (2.41) 5.69 (2.21)
Venturer 7.3 (1.96) 6.78 (2.65)
An additional test was conducted to examine the relationship between respondents’ raw
psychographic scores and the two psychographic confirmation questions. The relationship
between psychographic scores and vacation preferences (location and activity) was investigated
using Pearson’s correlation coefficient. Preliminary analyses were performed (Q-Q Plots) to
confirm that no violation of assumptions of normality, linearity, and homoscedasticity had
occurred. There was a low, positive correlation between vacation preference location and
psychographic scores, r = .19, n = 528, p < .001, and there was a moderate, positive correlation
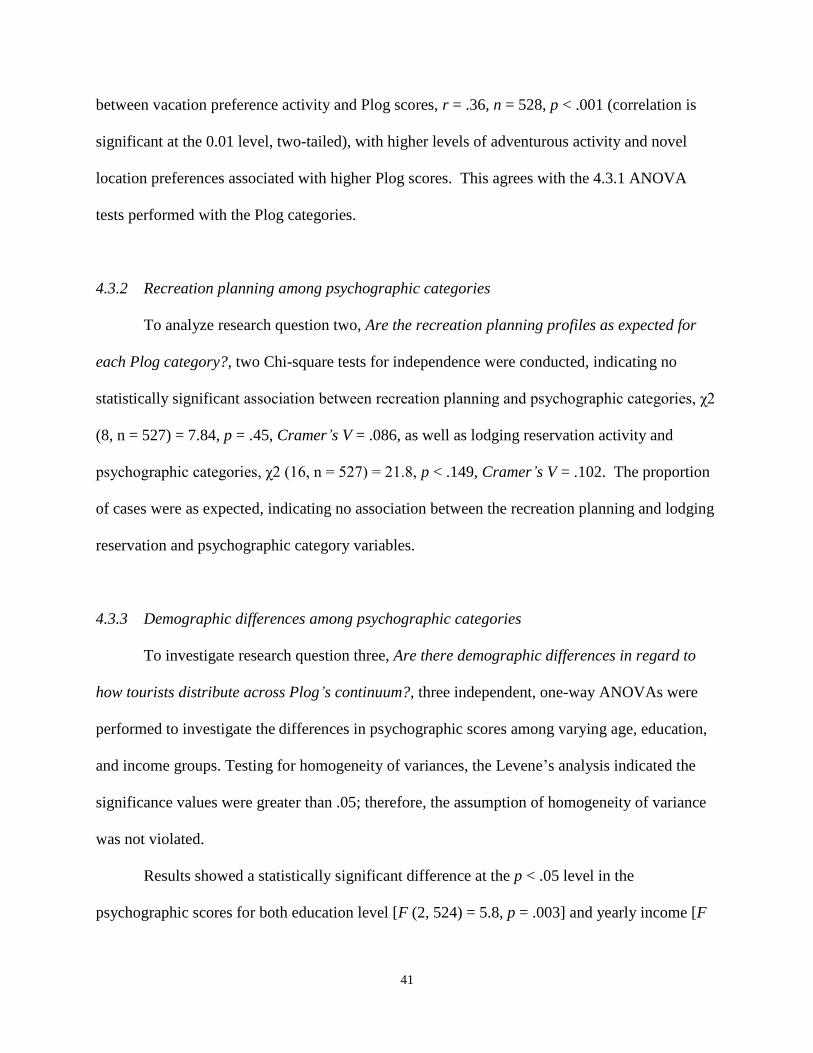
41
between vacation preference activity and Plog scores, r = .36, n = 528, p < .001 (correlation is
significant at the 0.01 level, two-tailed), with higher levels of adventurous activity and novel
location preferences associated with higher Plog scores. This agrees with the 4.3.1 ANOVA
tests performed with the Plog categories.
4.3.2 Recreation planning among psychographic categories
To analyze research question two, Are the recreation planning profiles as expected for
each Plog category?, two Chi-square tests for independence were conducted, indicating no
statistically significant association between recreation planning and psychographic categories, χ2
(8, n = 527) = 7.84, p = .45, Cramer’s V = .086, as well as lodging reservation activity and
psychographic categories, χ2 (16, n = 527) = 21.8, p < .149, Cramer’s V = .102. The proportion
of cases were as expected, indicating no association between the recreation planning and lodging
reservation and psychographic category variables.
4.3.3 Demographic differences among psychographic categories
To investigate research question three, Are there demographic differences in regard to
how tourists distribute across Plog’s continuum?, three independent, one-way ANOVAs were
performed to investigate the differences in psychographic scores among varying age, education,
and income groups. Testing for homogeneity of variances, the Levene’s analysis indicated the
significance values were greater than .05; therefore, the assumption of homogeneity of variance
was not violated.
Results showed a statistically significant difference at the p < .05 level in the
psychographic scores for both education level [F (2, 524) = 5.8, p = .003] and yearly income [F
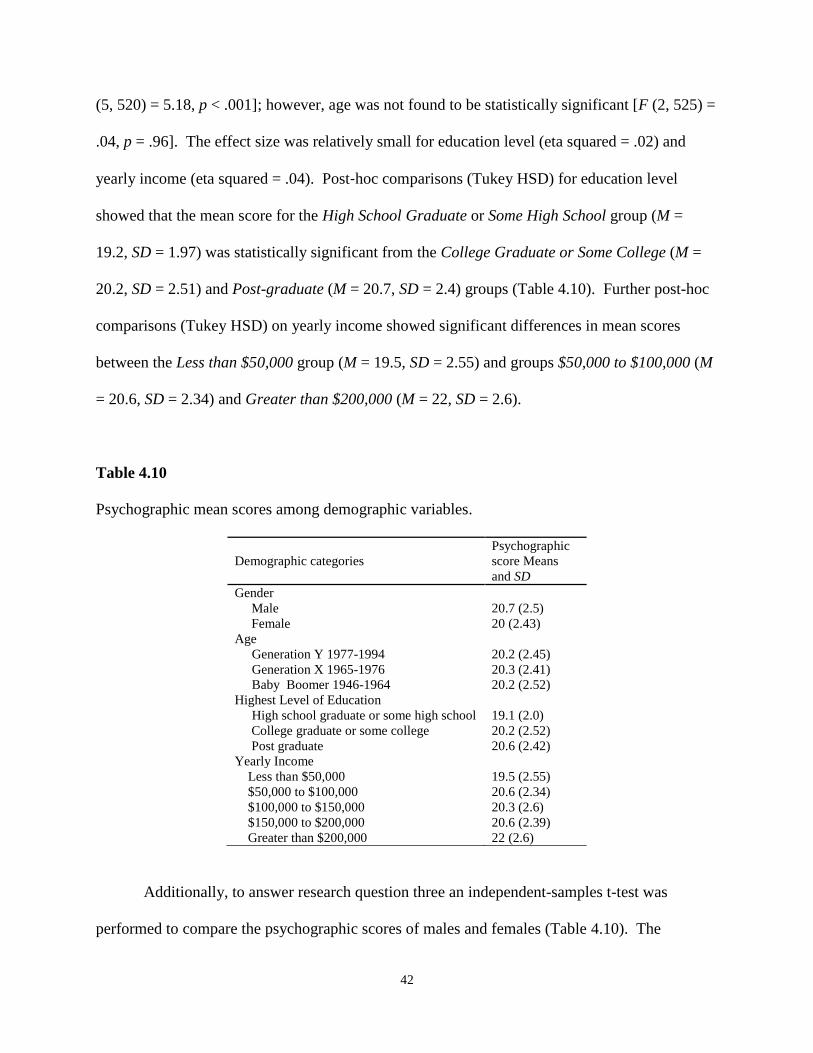
42
(5, 520) = 5.18, p < .001]; however, age was not found to be statistically significant [F (2, 525) =
.04, p = .96]. The effect size was relatively small for education level (eta squared = .02) and
yearly income (eta squared = .04). Post‐hoc comparisons (Tukey HSD) for education level
showed that the mean score for the High School Graduate or Some High School group (M =
19.2, SD = 1.97) was statistically significant from the College Graduate or Some College (M =
20.2, SD = 2.51) and Post-graduate (M = 20.7, SD = 2.4) groups (Table 4.10). Further post-hoc
comparisons (Tukey HSD) on yearly income showed significant differences in mean scores
between the Less than $50,000 group (M = 19.5, SD = 2.55) and groups $50,000 to $100,000 (M
= 20.6, SD = 2.34) and Greater than $200,000 (M = 22, SD = 2.6).
Table 4.10
Psychographic mean scores among demographic variables.
Demographic categories
Psychographic
score Means
and SD
Gender
Male 20.7 (2.5)
Female 20 (2.43)
Age
Generation Y 1977-1994 20.2 (2.45)
Generation X 1965-1976 20.3 (2.41)
Baby Boomer 1946-1964 20.2 (2.52)
Highest Level of Education
High school graduate or some high school 19.1 (2.0)
College graduate or some college 20.2 (2.52)
Post graduate 20.6 (2.42)
Yearly Income
Less than $50,000 19.5 (2.55)
$50,000 to $100,000 20.6 (2.34)
$100,000 to $150,000 20.3 (2.6)
$150,000 to $200,000 20.6 (2.39)
Greater than $200,000 22 (2.6)
Additionally, to answer research question three an independent-samples t-test was
performed to compare the psychographic scores of males and females (Table 4.10). The
43
significance value for Levene’s test was larger than .05; therefore, equal variances were
assumed. There was a significant difference in the scores for males (M = 20.7, SD = 2.5) and
females (M = 20, SD = 2.43; t (525) 2.86, p = .004, two-tailed). However, the magnitude of the
differences in the means (mean difference = .66, 95% CI: .207 – 1.12) was small (eta squared =
.014), indicating that only 1.4 percent of the variance in psychographic score was explained by
gender.
4.3.4 Vacation recreation activity dimensions
To examine the central research question within this study, How do preferred vacation
recreation activities of tourists relate to their psychographic score?, a factor analysis was
conducted to group the vacation recreation activities into activity dimensions. Factor analysis
“involves determining the smallest number of factors that can be used to best represent the
interrelationships among [a] set of variables” (Pallant, 2011, p. 183). In this instance, the 52
variables from the Vacation Recreation Activity Index (VRAI) were subjected to principal
components analysis (PCA) using SPSS version 19. Prior to PCA testing, the appropriateness of
data for factor extraction was evaluated. Examination of the correlation matrix revealed multiple
coefficients above .3, confirming that a majority of the items shared some common variance.
The Kaiser-Meyer-Olkin value was .92, exceeding the recommended value of .6 and the
Bartlett’s Test of Sphericity was also significant [χ2 (1326) = 12,277.6, p < .001].
A 12 factor solution explained 62.2% of the total variance. There was a partial leveling
off of eigenvalues as seen in most scree plots; however, the 12 factor solution showed a number
of strong loadings with most variables loading on only one dimension. The resulting twelve
activity dimensions were: Board Sports, Passive Nature, Sportsman, Extreme Adventure,
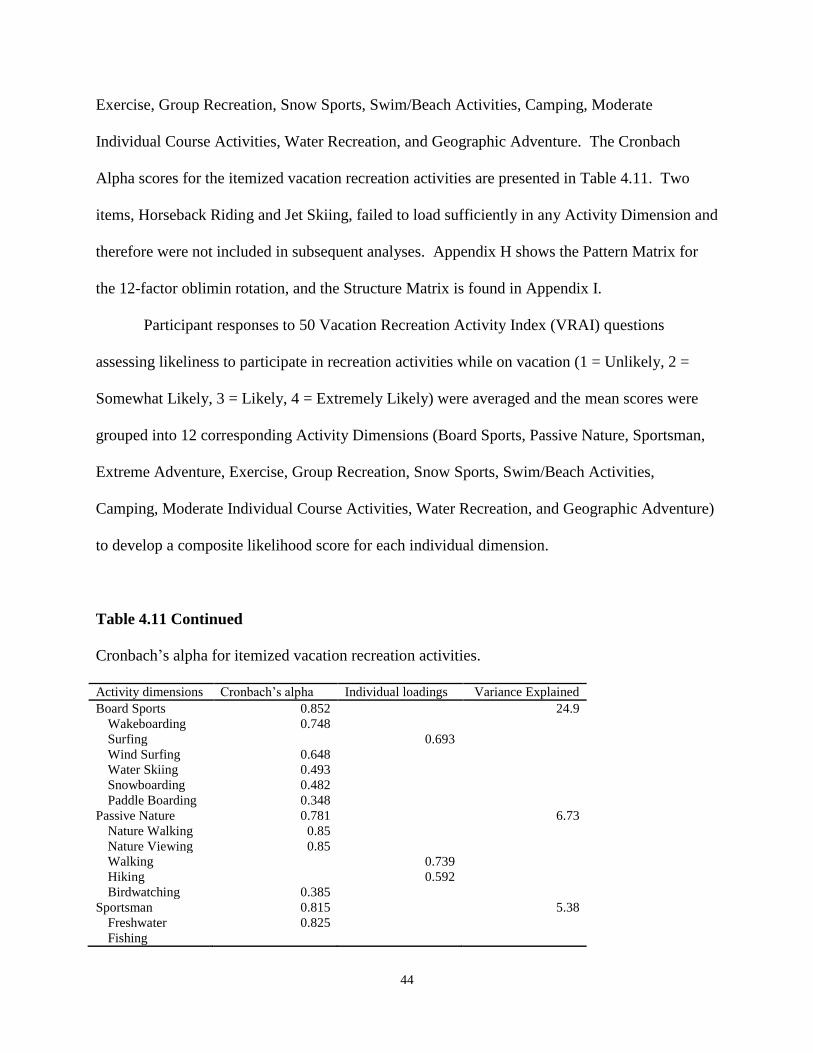
44
Exercise, Group Recreation, Snow Sports, Swim/Beach Activities, Camping, Moderate
Individual Course Activities, Water Recreation, and Geographic Adventure. The Cronbach
Alpha scores for the itemized vacation recreation activities are presented in Table 4.11. Two
items, Horseback Riding and Jet Skiing, failed to load sufficiently in any Activity Dimension and
therefore were not included in subsequent analyses. Appendix H shows the Pattern Matrix for
the 12-factor oblimin rotation, and the Structure Matrix is found in Appendix I.
Participant responses to 50 Vacation Recreation Activity Index (VRAI) questions
assessing likeliness to participate in recreation activities while on vacation (1 = Unlikely, 2 =
Somewhat Likely, 3 = Likely, 4 = Extremely Likely) were averaged and the mean scores were
grouped into 12 corresponding Activity Dimensions (Board Sports, Passive Nature, Sportsman,
Extreme Adventure, Exercise, Group Recreation, Snow Sports, Swim/Beach Activities,
Camping, Moderate Individual Course Activities, Water Recreation, and Geographic Adventure)
to develop a composite likelihood score for each individual dimension.
Table 4.11 Continued
Cronbach’s alpha for itemized vacation recreation activities.
Activity dimensions Cronbach’s alpha Individual loadings Variance Explained
Board Sports 0.852 24.9
Wakeboarding 0.748
Surfing 0.693
Wind Surfing 0.648
Water Skiing 0.493
Snowboarding 0.482
Paddle Boarding 0.348
Passive Nature 0.781 6.73
Nature Walking 0.85
Nature Viewing 0.85
Walking 0.739
Hiking 0.592
Birdwatching 0.385
Sportsman 0.815 5.38
Freshwater
Fishing
0.825
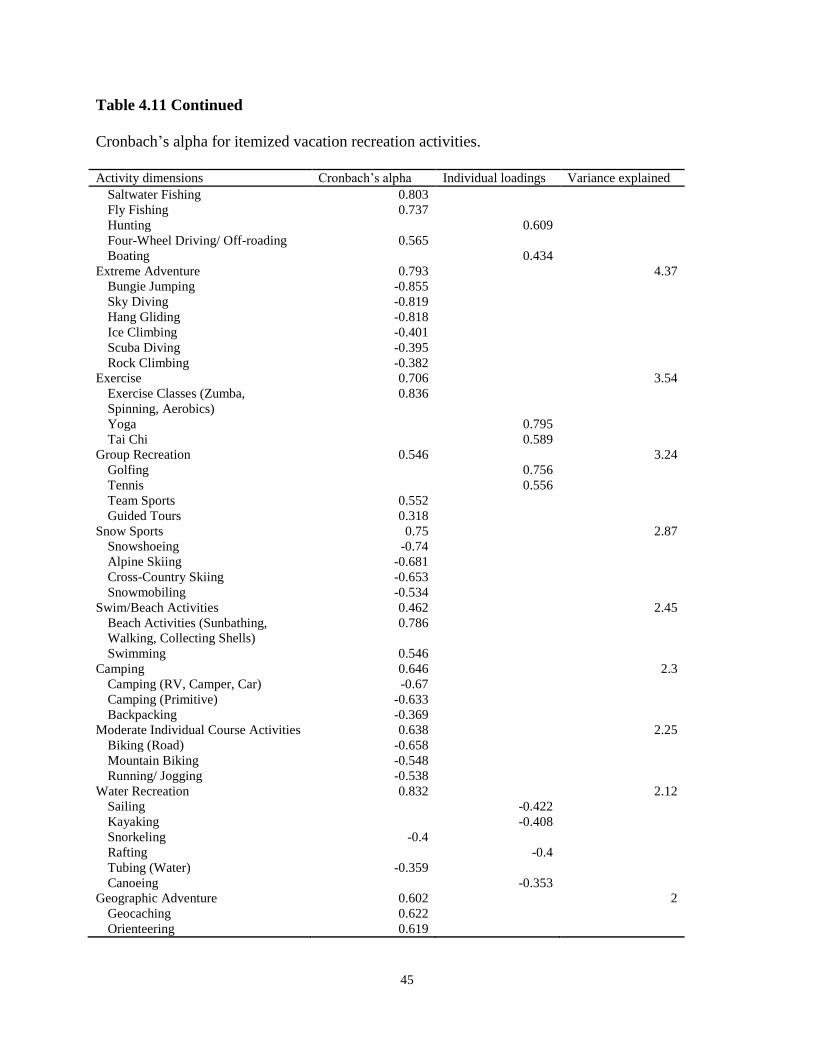
45
Table 4.11 Continued
Cronbach’s alpha for itemized vacation recreation activities.
Activity dimensions Cronbach’s alpha Individual loadings Variance explained
Saltwater Fishing 0.803
Fly Fishing 0.737
Hunting 0.609
Four-Wheel Driving/ Off-roading 0.565
Boating 0.434
Extreme Adventure 0.793 4.37
Bungie Jumping -0.855
Sky Diving -0.819
Hang Gliding -0.818
Ice Climbing -0.401
Scuba Diving -0.395
Rock Climbing -0.382
Exercise 0.706 3.54
Exercise Classes (Zumba, 0.836
Spinning, Aerobics)
Yoga 0.795
Tai Chi 0.589
Group Recreation 0.546 3.24
Golfing 0.756
Tennis 0.556
Team Sports 0.552
Guided Tours 0.318
Snow Sports 0.75 2.87
Snowshoeing -0.74
Alpine Skiing -0.681
Cross-Country Skiing -0.653
Snowmobiling -0.534
Swim/Beach Activities 0.462 2.45
Beach Activities (Sunbathing, 0.786
Walking, Collecting Shells)
Swimming 0.546
Camping 0.646 2.3
Camping (RV, Camper, Car) -0.67
Camping (Primitive) -0.633
Backpacking -0.369
Moderate Individual Course Activities 0.638 2.25
Biking (Road) -0.658
Mountain Biking -0.548
Running/ Jogging -0.538
Water Recreation 0.832 2.12
Sailing -0.422
Kayaking -0.408
Snorkeling -0.4
Rafting -0.4
Tubing (Water) -0.359
Canoeing -0.353
Geographic Adventure 0.602 2
Geocaching 0.622
Orienteering 0.619
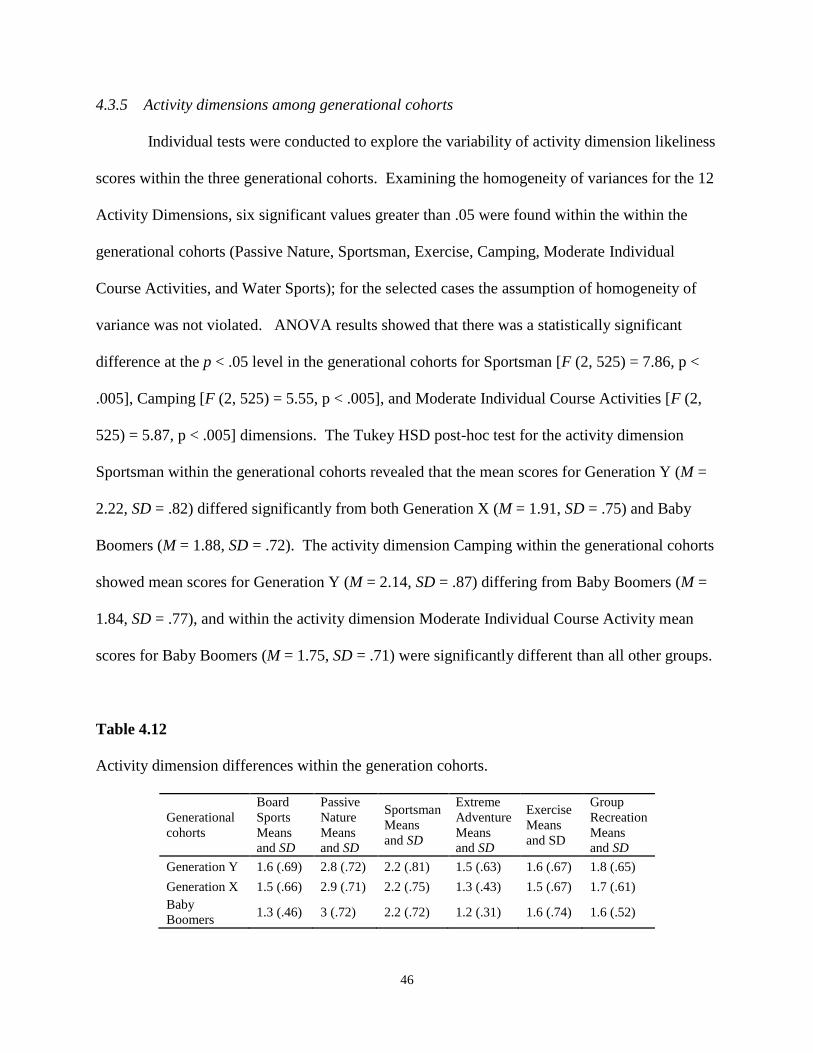
46
4.3.5 Activity dimensions among generational cohorts
Individual tests were conducted to explore the variability of activity dimension likeliness
scores within the three generational cohorts. Examining the homogeneity of variances for the 12
Activity Dimensions, six significant values greater than .05 were found within the within the
generational cohorts (Passive Nature, Sportsman, Exercise, Camping, Moderate Individual
Course Activities, and Water Sports); for the selected cases the assumption of homogeneity of
variance was not violated. ANOVA results showed that there was a statistically significant
difference at the p < .05 level in the generational cohorts for Sportsman [F (2, 525) = 7.86, p <
.005], Camping [F (2, 525) = 5.55, p < .005], and Moderate Individual Course Activities [F (2,
525) = 5.87, p < .005] dimensions. The Tukey HSD post-hoc test for the activity dimension
Sportsman within the generational cohorts revealed that the mean scores for Generation Y (M =
2.22, SD = .82) differed significantly from both Generation X (M = 1.91, SD = .75) and Baby
Boomers (M = 1.88, SD = .72). The activity dimension Camping within the generational cohorts
showed mean scores for Generation Y (M = 2.14, SD = .87) differing from Baby Boomers (M =
1.84, SD = .77), and within the activity dimension Moderate Individual Course Activity mean
scores for Baby Boomers (M = 1.75, SD = .71) were significantly different than all other groups.
Table 4.12
Activity dimension differences within the generation cohorts.
Generational
cohorts
Board
Sports
Means
and SD
Passive
Nature
Means
and SD
Sportsman
Means
and SD
Extreme
Adventure
Means
and SD
Exercise
Means
and SD
Group
Recreation
Means
and SD
Generation Y 1.6 (.69) 2.8 (.72) 2.2 (.81) 1.5 (.63) 1.6 (.67) 1.8 (.65)
Generation X 1.5 (.66) 2.9 (.71) 2.2 (.75) 1.3 (.43) 1.5 (.67) 1.7 (.61)
Baby
Boomers 1.3 (.46) 3 (.72) 2.2 (.72) 1.2 (.31) 1.6 (.74) 1.6 (.52)
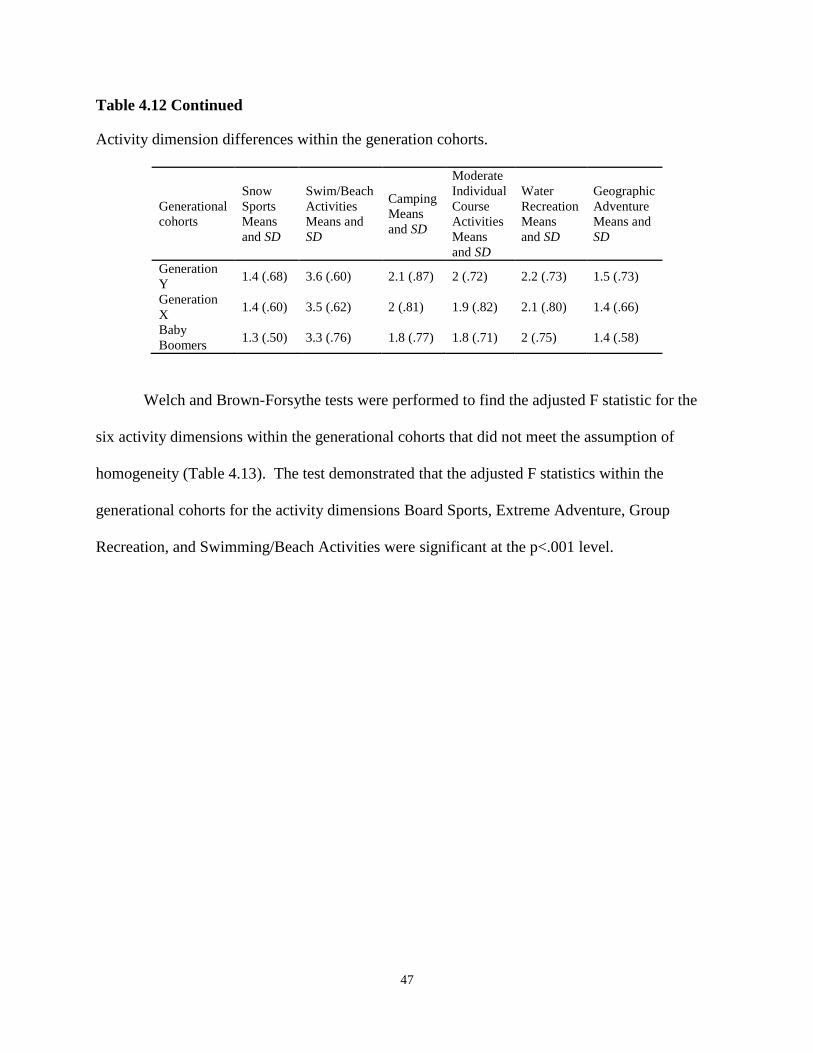
47
Table 4.12 Continued
Activity dimension differences within the generation cohorts.
Generational
cohorts
Snow
Sports
Means
and SD
Swim/Beach
Activities
Means and
SD
Camping
Means
and SD
Moderate
Individual
Course
Activities
Means
and SD
Water
Recreation
Means
and SD
Geographic
Adventure
Means and
SD
Generation
Y 1.4 (.68) 3.6 (.60) 2.1 (.87) 2 (.72) 2.2 (.73) 1.5 (.73)
Generation
X 1.4 (.60) 3.5 (.62) 2 (.81) 1.9 (.82) 2.1 (.80) 1.4 (.66)
Baby
Boomers 1.3 (.50) 3.3 (.76) 1.8 (.77) 1.8 (.71) 2 (.75) 1.4 (.58)
Welch and Brown-Forsythe tests were performed to find the adjusted F statistic for the
six activity dimensions within the generational cohorts that did not meet the assumption of
homogeneity (Table 4.13). The test demonstrated that the adjusted F statistics within the
generational cohorts for the activity dimensions Board Sports, Extreme Adventure, Group
Recreation, and Swimming/Beach Activities were significant at the p<.001 level.
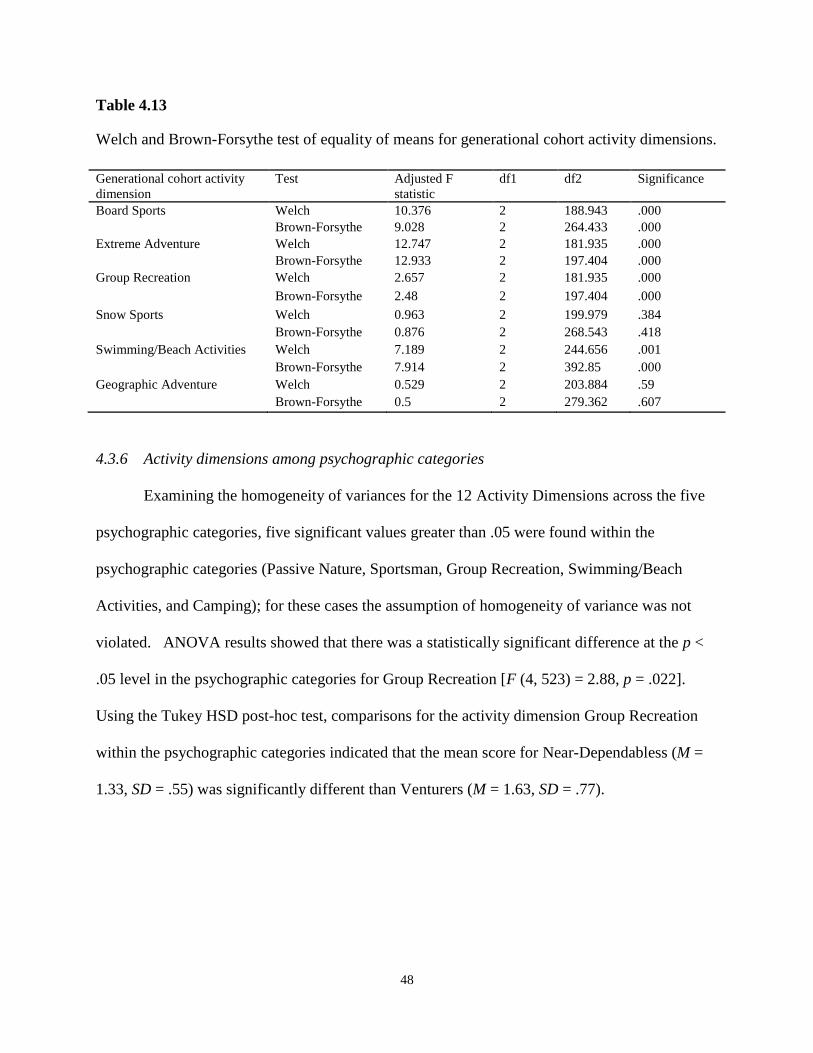
48
Table 4.13
Welch and Brown-Forsythe test of equality of means for generational cohort activity dimensions.
4.3.6 Activity dimensions among psychographic categories
Examining the homogeneity of variances for the 12 Activity Dimensions across the five
psychographic categories, five significant values greater than .05 were found within the
psychographic categories (Passive Nature, Sportsman, Group Recreation, Swimming/Beach
Activities, and Camping); for these cases the assumption of homogeneity of variance was not
violated. ANOVA results showed that there was a statistically significant difference at the p <
.05 level in the psychographic categories for Group Recreation [F (4, 523) = 2.88, p = .022].
Using the Tukey HSD post-hoc test, comparisons for the activity dimension Group Recreation
within the psychographic categories indicated that the mean score for Near-Dependabless (M =
1.33, SD = .55) was significantly different than Venturers (M = 1.63, SD = .77).
Generational cohort activity
dimension
Test Adjusted F
statistic
df1 df2 Significance
Board Sports Welch 10.376 2 188.943 .000
Brown-Forsythe 9.028 2 264.433 .000
Extreme Adventure Welch 12.747 2 181.935 .000
Brown-Forsythe 12.933 2 197.404 .000
Group Recreation Welch 2.657 2 181.935 .000
Brown-Forsythe 2.48 2 197.404 .000
Snow Sports Welch 0.963 2 199.979 .384
Brown-Forsythe 0.876 2 268.543 .418
Swimming/Beach Activities Welch 7.189 2 244.656 .001
Brown-Forsythe 7.914 2 392.85 .000
Geographic Adventure Welch 0.529 2 203.884 .59
Brown-Forsythe 0.5 2 279.362 .607
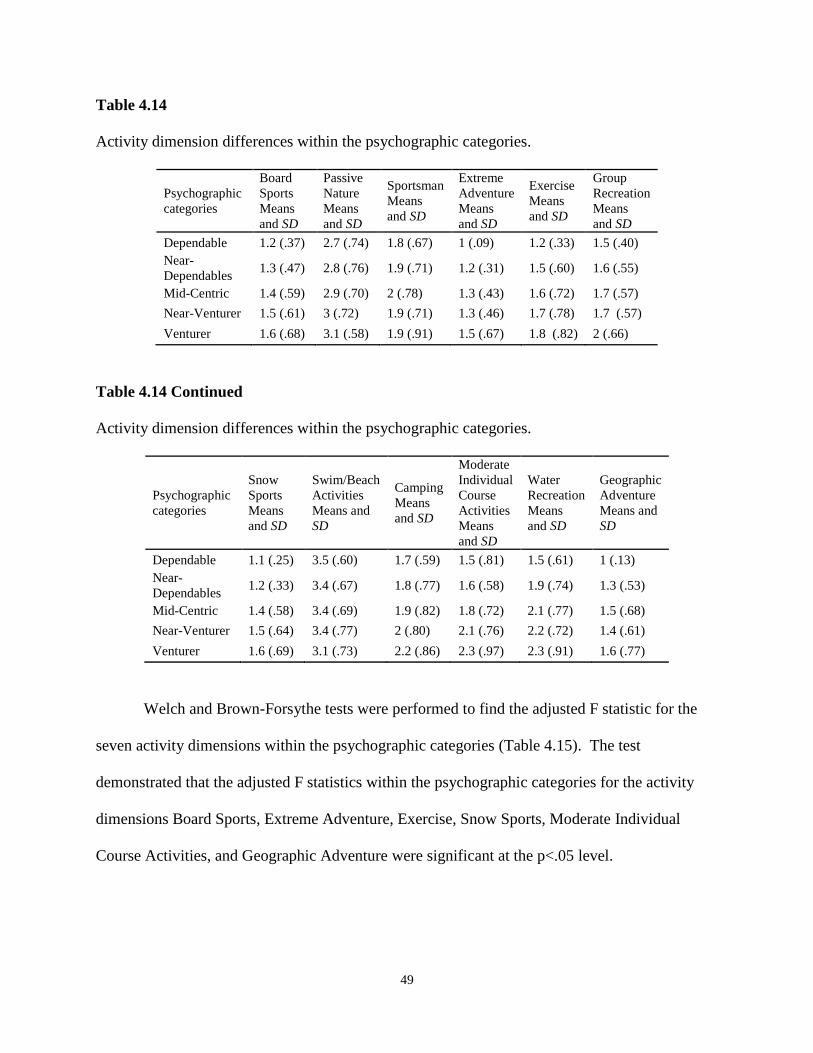
49
Table 4.14
Activity dimension differences within the psychographic categories.
Psychographic
categories
Board
Sports
Means
and SD
Passive
Nature
Means
and SD
Sportsman
Means
and SD
Extreme
Adventure
Means
and SD
Exercise
Means
and SD
Group
Recreation
Means
and SD
Dependable 1.2 (.37) 2.7 (.74) 1.8 (.67) 1 (.09) 1.2 (.33) 1.5 (.40)
Near-
Dependables 1.3 (.47) 2.8 (.76) 1.9 (.71) 1.2 (.31) 1.5 (.60) 1.6 (.55)
Mid-Centric 1.4 (.59) 2.9 (.70) 2 (.78) 1.3 (.43) 1.6 (.72) 1.7 (.57)
Near-Venturer 1.5 (.61) 3 (.72) 1.9 (.71) 1.3 (.46) 1.7 (.78) 1.7 (.57)
Venturer 1.6 (.68) 3.1 (.58) 1.9 (.91) 1.5 (.67) 1.8 (.82) 2 (.66)
Table 4.14 Continued
Activity dimension differences within the psychographic categories.
Psychographic
categories
Snow
Sports
Means
and SD
Swim/Beach
Activities
Means and
SD
Camping
Means
and SD
Moderate
Individual
Course
Activities
Means
and SD
Water
Recreation
Means
and SD
Geographic
Adventure
Means and
SD
Dependable 1.1 (.25) 3.5 (.60) 1.7 (.59) 1.5 (.81) 1.5 (.61) 1 (.13)
Near-
Dependables 1.2 (.33) 3.4 (.67) 1.8 (.77) 1.6 (.58) 1.9 (.74) 1.3 (.53)
Mid-Centric 1.4 (.58) 3.4 (.69) 1.9 (.82) 1.8 (.72) 2.1 (.77) 1.5 (.68)
Near-Venturer 1.5 (.64) 3.4 (.77) 2 (.80) 2.1 (.76) 2.2 (.72) 1.4 (.61)
Venturer 1.6 (.69) 3.1 (.73) 2.2 (.86) 2.3 (.97) 2.3 (.91) 1.6 (.77)
Welch and Brown-Forsythe tests were performed to find the adjusted F statistic for the
seven activity dimensions within the psychographic categories (Table 4.15). The test
demonstrated that the adjusted F statistics within the psychographic categories for the activity
dimensions Board Sports, Extreme Adventure, Exercise, Snow Sports, Moderate Individual
Course Activities, and Geographic Adventure were significant at the p<.05 level.
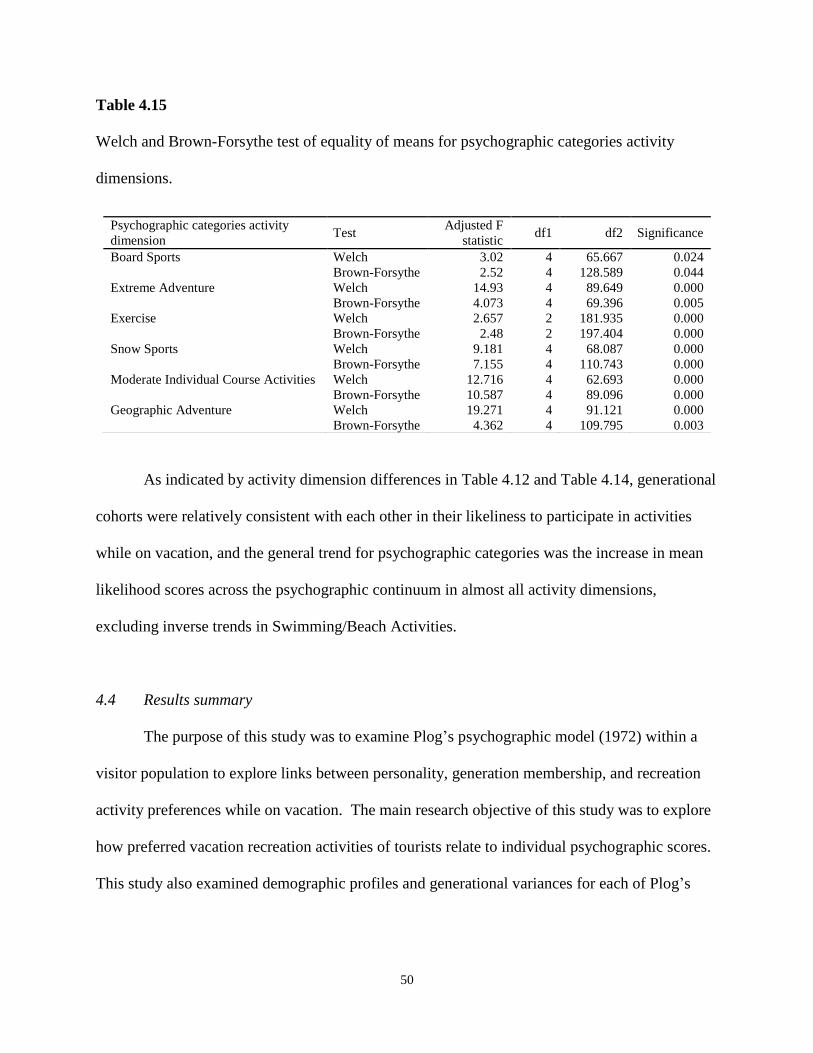
50
Table 4.15
Welch and Brown-Forsythe test of equality of means for psychographic categories activity
dimensions.
As indicated by activity dimension differences in Table 4.12 and Table 4.14, generational
cohorts were relatively consistent with each other in their likeliness to participate in activities
while on vacation, and the general trend for psychographic categories was the increase in mean
likelihood scores across the psychographic continuum in almost all activity dimensions,
excluding inverse trends in Swimming/Beach Activities.
4.4 Results summary
The purpose of this study was to examine Plog’s psychographic model (1972) within a
visitor population to explore links between personality, generation membership, and recreation
activity preferences while on vacation. The main research objective of this study was to explore
how preferred vacation recreation activities of tourists relate to individual psychographic scores.
This study also examined demographic profiles and generational variances for each of Plog’s
Psychographic categories activity
dimension Test
Adjusted F
statistic df1 df2 Significance
Board Sports Welch 3.02 4 65.667 0.024
Brown-Forsythe 2.52 4 128.589 0.044
Extreme Adventure Welch 14.93 4 89.649 0.000
Brown-Forsythe 4.073 4 69.396 0.005
Exercise Welch 2.657 2 181.935 0.000
Brown-Forsythe 2.48 2 197.404 0.000
Snow Sports Welch 9.181 4 68.087 0.000
Brown-Forsythe 7.155 4 110.743 0.000
Moderate Individual Course Activities Welch 12.716 4 62.693 0.000
Brown-Forsythe 10.587 4 89.096 0.000
Geographic Adventure Welch 19.271 4 91.121 0.000
Brown-Forsythe 4.362 4 109.795 0.003
51
psychographic tourist types (Dependable, Near-Dependables, Mid-Centric, Near-Venturer,
Venturer).
The first research question investigated whether Plog’s model was still applicable to
present day tourists. The results indicated that the Plog instrument does correspond to tourist
vacation preferences, in terms of both location and activity level.
The second research question investigated the travel planning profiles within each
psychographic category. Results indicated that no statistically significant association between
travel planning and psychographic categories existed.
The third research question investigated the demographic differences among the
psychographic categories. Results showed Venturers as more educated and earning a higher
yearly income than the other psychographic categories. Results also indicated generational
uniformity for active tourist preferences among the three cohorts, although Baby Boomers
presented slightly higher proportions of pure Venturers (Baby Boomers 4.7%; Gen X 4.3%: Gen
Y 3.2%), and Boomers more commonly responded as wanting to visit somewhere they had never
been before (Baby Boomers, 31.6%; Gen X, 26.8%; Gen Y, 23.7%).
The final research question investigated how vacation recreation activities related to
psychographic scores. After removing the two activities Horseback Riding and Jet Skiing due to
insufficient loading, 50 Vacation recreation activities from the VRAI were factored into 12
activity dimensions, which explained 62.2% of the total variance. The dimensions were
examined for psychographic and generational differences. Generational cohorts showed parity in
their activity participation likeliness scores, with the highest likeliness scores for all cohorts seen
in Passive Nature and Swimming/Beach Activities dimensions. The results for mean likelihood
scores across the psychographic categories increased from Dependable to Venturer in 10 of the

52
12 activity dimensions, excluding Swimming/Beach Activities and Sportsman activity
dimensions.
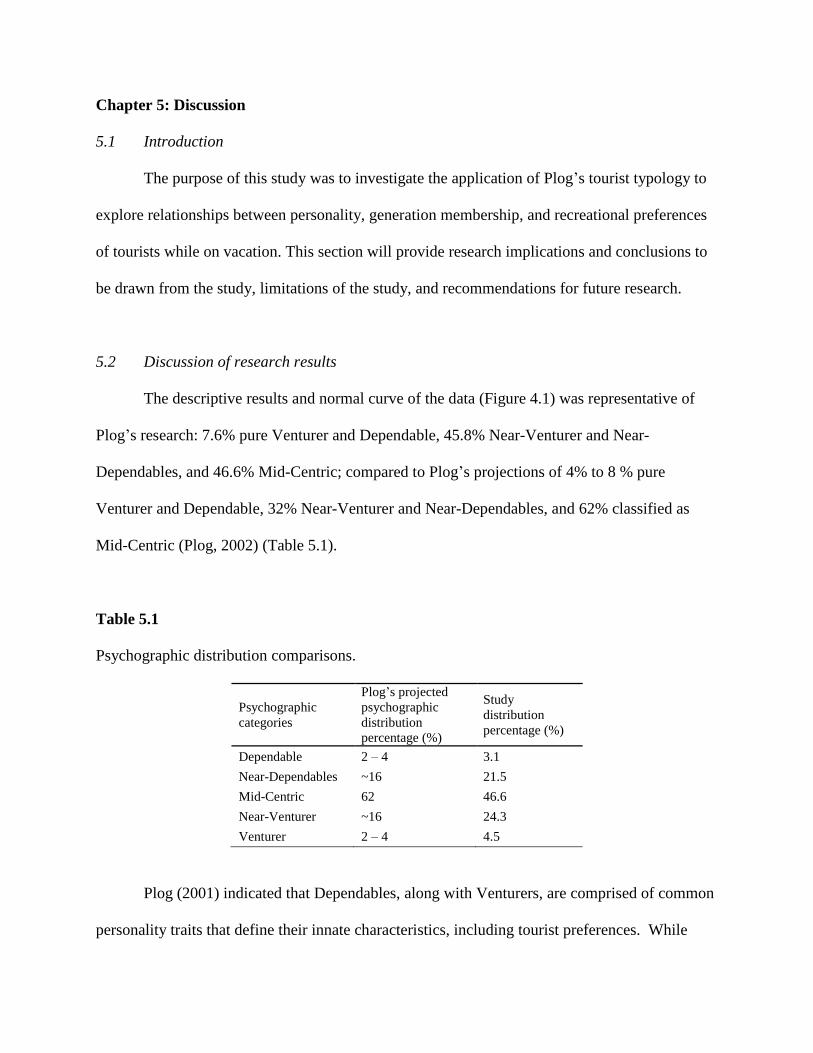
53
Chapter 5: Discussion
5.1 Introduction
The purpose of this study was to investigate the application of Plog’s tourist typology to
explore relationships between personality, generation membership, and recreational preferences
of tourists while on vacation. This section will provide research implications and conclusions to
be drawn from the study, limitations of the study, and recommendations for future research.
5.2 Discussion of research results
The descriptive results and normal curve of the data (Figure 4.1) was representative of
Plog’s research: 7.6% pure Venturer and Dependable, 45.8% Near-Venturer and Near-
Dependables, and 46.6% Mid-Centric; compared to Plog’s projections of 4% to 8 % pure
Venturer and Dependable, 32% Near-Venturer and Near-Dependables, and 62% classified as
Mid-Centric (Plog, 2002) (Table 5.1).
Table 5.1
Psychographic distribution comparisons.
Psychographic
categories
Plog’s projected
psychographic
distribution
percentage (%)
Study
distribution
percentage (%)
Dependable 2 – 4 3.1
Near-Dependables ~16 21.5
Mid-Centric 62 46.6
Near-Venturer ~16 24.3
Venturer 2 – 4 4.5
Plog (2001) indicated that Dependables, along with Venturers, are comprised of common
personality traits that define their innate characteristics, including tourist preferences. While
54
Plog (2001) contended that “no person is a perfect exemplar of any [specific] personality type”
(p. 15), typical personality characteristics assigned to individuals with a Dependable personality
are described below:
Intellectual restriction – Dependables “do not seek out new ideas and experiences on a
daily basis … they are less Venturesome and less exploring than most persons” (p. 15),
also they tend to read less and are less educated compared to Venturers (Plog, 2001).
Popular consumer preferences – Dependable prefer well known consumer products and
locales because “the popularity of such items makes them safe choices” (Plog, 2001,
p.15).
Low activity level – Dependables are generally less active and prefer activities that
require lower levels of effort (Plog, 2001).
Venturers, however, are noticeably at the other end of the spectrum, and their representative
personality traits include:
Intellectual curiosity – Venturers “want to explore the world around them in all of its
diversity … they continually seek new experiences and enjoy activity (Plog, 2001, p.16).
Venturers also appreciate novel and unusual experiences, and tend to be well read and
more educated than Dependables (Plog, 2001).
Rare consumer preferences – Venturers do not prefer popular brands or destinations, as
“the thrill of discovery overrides disappointments that can come from a new product”
(Plog, 2001, p. 16).
High activity level – Venturers are highly active individuals, looking to venture out to
explore new activities and landscapes.
55
5.2.1 Confirmation of Plog model with tourist vacation preferences
In line with the practice of including psychographic confirmation questions (Nickerson &
Ellis, 1991), two questions in the current study were created specifically to act as a confirmation
for the Plog instrument. Comparison of the confirmation questions to the Plog results showed
expected relationships: “[activity] participation levels generally rise or decline across the
psychographic spectrum” (Plog, 2002, p. 249). Additionally, in agreement with Nickerson and
Ellis’ conclusion that a correlation exists between activity level and Venturesomeness
(Nickerson & Ellis, 1991), the results of the current study demonstrated higher levels of
adventurous activity and novel location preferences linked to higher Plog scores.
5.2.2 Travel planning profiles of each Plog category
There was no significant association between the psychographic categories and lodging
and recreational activity planning. This is a unique finding in that previous research has found
that Mid-Centrics are generally “more inclined to take the “safe” choice” (Siguaw, Enz, & Liu,
2008, p. 272) and therefore tend to plan ahead, in contrast to the Venturer mindset of taking a
chance with their vacation plans (Plog, 2001). These findings could be related to the high
proponderan
5.2.3 Demographic differences in tourists
Examining the psychographic scores among the demographic categories in Table 4.6,
Post graduate and College graduate or some college mean psychographic scores were found to
be significantly different than High school graduate or some high school and yearly income
results showed significant differences in mean psychographic scores between Less than $50,000
56
and Greater than $200,000. Both of these results correspond with Plog’s (2001) psychographic
profile descriptors, showing higher Venturesome averages more closely associated with higher
education and elevated yearly earnings. Research by Siguaw, Enz, and Liu (2008) has reported
that “a willingness to spend large sums of discretionary income on travel is consistent with
Venturesome travelers”; however, this study did not inspect travel spending and therefore cannot
infer commonalities between willingness to spend discretionary income and Venturesomeness.
Overall, there was generational uniformity for active tourism preferences among the three
cohorts, showing results across the generations consistent with Lehto et al. (2008) who reported
that Baby Boomers are expected to continue “defying their physical age and seeking experiences
that will lead them to venture off the beaten path and engage in adventurous or experimental
experiences” and that mature tourist preferences may be more closely related to younger
generational tourists (p. 248).
Baby Boomers exhibited slightly higher proportions of pure Venturers (4.7%), indicating
that their cohort is seeking out increasingly adventurous and potentially more active tourism
experiences in comparison to Gen X (4.3%) and Gen Y (3.2%). The response for vacation
recreation activities throughout the three cohorts was also comparable, though Boomer vacation
recreation preferences corresponded to younger cohort participation in activities such as Biking
(Road), Mountain Biking, Horseback Riding, and Kayaking. These findings relate to research by
Lehto et al. (2008), reestablishing that Baby Boomer preferences line up closely to those of
younger generations, and should be considered when implementing new consumer tourism
products (Glover & Prideaux, 2009); with the similarities among the generations, marketing
efforts could incorporate all three generations. Additionally, trait aggregation theories denote the
dependability of personality characteristics, demonstrating that personalities can produce patterns
57
of reliable behavior in multiple environments (Epstein, 1983; Epstein and Teraspulsky, 1986;
Albanese, 1990). This implies that if psychographic personality types can be related to specific
vacation recreation activities, then marketing efforts can be more consistent for determined
psychographic tourists.
Vacation preferences were also parallel across cohorts, which could be attributed to the
high volume of Mid-Centric respondents. Vacation preferences, location and activity level, were
generally distributed Somewhere in the middle; however, Boomers more commonly responded as
wanting to visit somewhere they had never been before, in contrast to the other cohorts (Baby
Boomers, 31.6%; Gen X, 26.8%; Gen Y, 23.7%). With the growth of increasingly active tourism
patterns for Baby Boomers, existing research has specified a need for destinations to cater to
more active senior tourists in order to maintain business (Glover & Prideaux, 2009; Grant, 2002).
Also, cross-generational research reports that “a much more active senior will become the
mainstream senior traveler” (Lehto et al., 2008, p. 249), which goes along with the concept that
Boomers are traveling more actively, and may be more closely connected to younger tourist
contingents.
Previous research also identifies Baby Boomers as searching for the same active tourism
opportunities as Generation X and Generation Y; however, it has been shown that older tourists
typically do not wish to be perceived as aged (Glover & Prideaux, 2009), meaning that
destinations and vacation recreation providers need to adapt their programs and attempt to plan
“products and services that are suitable for [Baby Boomers] without offending their own sense of
youthfulness” (Glover & Prideaux, 2009, p. 35). In short, the generational data suggest a
uniform distribution across the generational cohorts, providing support for similar tourism
preferences throughout the generations.
58
5.2.4 Preferred vacation recreation activities of tourists
When measuring for the primary research question, principal components factor analysis
revealed an initial 12 factor solution, condensing 50 of the 52 vacation recreation activities into
12 activity dimensions. The dimensions were examined for psychographic and generational
differences. Generational cohorts were shown as being consistent in their likeliness to
participate in activities while on vacation, though results showed increases in mean likelihood
scores across the psychographic categories in a majority of the activity dimensions, echoing the
common theme for increased activity level moving towards the Venturer psychographic
category. These results imply that level of Venturesomeness (psychographic category) has more
of an influence than generational cohorts in regard to vacation recreation activity preference. In
keeping with Plog (2004), the relationship between Venturesomeness and activity preference has
shown that Venturers take part in specific recreation activities more often than their Dependable
counterparts, and that “Venturesomeness is a better predictor of the types of activities pursued on
leisure trips” (Plog, 2002, p. 244).
Through the data generated in this study, it is apparent that preferred vacation recreation
activities of tourists are related to their psychographic score, indicating higher activity and
adventurousness is related to increased Venturesomeness scores. Plog (2004) has shown that a
relationship exists between psychographic influences and recreation activities on vacation,
finding that Venturers take part more commonly in certain recreation activities than
Dependables, including golf, tennis, and downhill skiing. Research by Wolfe, Hsu, and Kang
(2002) has inspected niche tourism activities, illuminating recognizably different psychographic
and demographic profiles related to activity preferences of leisure tourists. The research by
Wolfe et al. (2002) showed more Venturesome tourists interested in outdoor recreation activities.
Further psychographic research by Chandler and Costello (2002) presented activity level data
59
from a heritage tourism site in the U.S.; results produced consistent psychographic profiles at
multiple types of destinations and indicated moderate intensity recreation interests such as
birdwatching and nature walking more closely related with Mid-Centric tourists (Chandler &
Costello, 2002). More recent research by Weaver (2012) showed visitor psychographic
characteristics within a undeveloped nature preserve as highly Venturesome, providing
additional support for Venturers exploring more adventurous regions.
5.3 Implications
5.3.1 Implications for active tourism
With the rapid expansion of active tourism worldwide, and expressly within the United
States (Sung, Morrison, & O’Leary, 2001; Sung, 2000; Sung, 2004), it is important to recognize
the relationship between consumer psychographic profiles and individual recreation activity
preferences. Active tourism is currently regarded as a booming industry across generations, and
the current research has combined generational cohorts and psychographic categories because of
the shown effectiveness of these two indicators to fully develop consumer preferences (Huang &
Petrik, 2010).
For tourism planners, destination marketing organizations, and both private and public
recreation agencies, it is important to understand what types of tourists are more closely linked to
specific recreation activities; if a destination offers certain unique recreation opportunities, those
activities need to be leading the marketing strategy. For recreation and tourism providers of any
nature, this research will enable them to use a scientific approach to product definition,
positioning, and marketing.
60
It is also important to acknowledge the direction of influence among the psychographic
categories. Venturers are thought to have the highest level of influence on the other
psychographic categories, meaning they seek out new destinations and influence the other
categories to attend; therefore, marketing efforts should be concentrated towards the
Venturesome side to successfully implement a tourism product or destination (Plog, 2002).
Also, Venturesomeness has been identified as a “better predictor of the types of activities
pursued on leisure trips” (Plog, 2002, p. 244).
5.3.2 Academic implications
Within this study, the VRAI has shown to be a powerful index, and its variance in passive
and active recreation activities may allow for more elaborate comparative research in the future.
Confirmation and refinement of the new Vacation Recreation Activity Index (VRAI) could also
provide practical implications, specifically in defining recreation preferences while on vacation
to improve “destination development, service positioning, and advertising and promotion”
(Nickerson & Ellis, 1991, p. 29).
Destination Marketing Organizations (DMOs) should be utilized more frequently in
academic research settings. Such organizations have built strong ties within regional tourist
locations (and beyond) and allow access to robust visitor databases. DMOs are research hungry
and willing to partner with educational institutions to research topical issues within the tourism
industry. This researcher’s use of regionally specific DMOs is also another important
implication in that it targets geographically distinct locations, diversifying the sample base and
allowing for data collection on multiple recreation activities.
61
This study made an effort to explore generational cohorts through segmentation, and the
findings have supported generational uniformity in travel preferences among the Baby Boomers,
Generation X, and Generation Y cohorts. This observed consistency across the generations is a
unique finding, and it has specific implications within academia. With the results presented in
the current study, and in previous investigations (Lehto et al., 2008), there is increasing data to
support a shift in active tourism preferences of older adults; academicians should therefore
recognize the importance of cohorts, especially in the changing tourism climate.
5.4 Study limitations
While the sample was drawn from visitor inquires to each region of North Carolina
(mountains, piedmont, and coastal), the study cannot be generalized to all areas within the state
or beyond. The regions were unique, in that each area had different types of recreational
offerings. Further, respondents were limited to only those recreation activities listed on the
Vacation Recreation Activity Index (VRAI).
Another potential constraint could be the adaptation of the Plog instrument. Two of
Plog’s ten questions were adapted for modern contextualization, which could have affected the
validity of the instrument. Additionally, it is imperative to note that Plog’s model is one frame of
reference to observe tourism psychology; thus, it is understandable that there are naturally
multiple effects influencing travel choice (McIntosh, Goeldner, & Ritchie, 1995). Also, the Plog
model has been criticized as being somewhat limited having been primarily tested within in the
private sector.
The survey was distributed electronically; therefore, individuals without Internet access
were unable to take the survey. In addition, because of the proprietary nature of the DMO

62
databases, the researcher was not allowed to distribute the survey links directly to the
respondents. Although instructions were provided and follow up phone calls were performed to
keep the DMOs on the same timeline, inconsistencies in the survey distribution may have
impacted the response. The verbiage for survey solicitations and DMO correspondence can be
found in Appendix E. Additionally, two of the DMOs encouraged participation in the study via
their Facebook page; however, this was not consistent for all DMOs.
5.5 Suggestions for future research
To better understand the interactions between psychographics, generation membership,
and recreation preferences, prospects for future research are listed below.
Expand upon the current survey with more vacation recreation activity options
Explore how often individuals engage in specific recreation activities while on vacation
vs. at home
Investigate tourists’ inclination to try new kinds of recreation activities while on vacation
and/or the participation in new activities as partial motivation for selecting vacation
destinations
Examine visitors to multiple geographic regions to understand if similar recreation
activity and demographic trends for the psychographic categories exist across the United
States
Investigate the differences between seemingly active and non-active tourists; what would
make them more active?
Compare active tourists within the United States to international active tourists
63
5.6 Conclusion
Previous research has used the Plog model in attempt to define tourist preferences and
related activity behaviors while on vacation, and though there has been some disagreement, the
general consensus within academia is that Plog’s psychographic instrument is a useful
investigative tool (Siguaw, Enz, & Liu, 2008) and that it offers a real-world understanding of
characteristic travel preferences of tourists (Litvin, 2006).
The apparent need for vacation is inherent, and it is evident that a range of tourists exist,
some more adventurous than others. Also apparent is the potential to link vacation preferences
to certain, individual tourist categories in order to improve target marketing strategies for
destinations and recreation suppliers. Within this study, the increased existence of active tourism
was investigated along with Plog’s psychographic model; the objective was to explain tourist
preference by matching psychographic categories with vacation recreation activities.
The results indicate a connection between respondent psychographic scores and their
projected vacation activity preferences, showing expected results for Plog’s model with regard to
tourist vacation preferences. There were demographic differences in how tourists distribute
across Plog’s continuum, though the data suggest a uniform psychographic distribution across
the generational cohorts, providing support for similarly active tourist preferences throughout the
generations, in line with previous research projections (Glover & Prideaux, 2009; Grant, 2002;
Lehto et al., 2008). The results for mean likelihood scores across the psychographic categories
increased from Dependable to Venturer in 10 of the 12 activity dimensions, excluding
Swimming/Beach Activities and Sportsman activity dimensions. There was further consistency
shown among the generational cohorts for their likeliness to participate in the factored activity
dimensions; however, the results for mean likelihood scores across the psychographic categories
64
increased from Dependable to Venturer in a majority of the activity dimensions, reiterating the
finding that activity level increases moving towards the Venturer psychographic category. This
result was also indicative that level of Venturesomeness has more of an influence than
generational membership in regard to vacation recreation activity preference.
Most interestingly, preferred vacation recreation activities of tourists were intuitively
related to psychographic score, with data indicating higher activity and adventurousness related
to increased Venturesomeness scores. Another intriguing result was that no significant
association in travel planning profiles amidst the psychographic categories existed.
Overall there was support presented within this study for the increase in activity-based
tourism across the generations, and specifically Baby Boomers showed vacation recreation
activity preferences comparable to younger generations. Within a broader context, these results
should aid destinations in recreation activity development, positioning, and marketing,
understanding that generational tourists are seeking out similarly active vacation activities, and
the more Venturesome the tourist contingent, the more adventurous and novel the experiences
that should be offered.
Consumers are the driving force behind demand; thus, it is valuable for social science
researchers to explore the psychological and social characteristics related to consumers to
comprehend their changing preferences (Schneider & Vogt, 2012). This study has the potential
to be expanded in numerous recreation and tourism contexts and to provide a new strategy for
targeting active tourists within the tourism industry; one that has been previously overlooked.
The results should be applied informatively, to help destinations determine tourism patterns
based on recreation activities linked to psychographic profiles, as well as to provide destinations
with a more in-depth view of the current active tourism market trends and how destination

65
service providers can capitalize on the expanding market. Further, this study has made an
attempt to make active tourists a known entity within the broader tourism segment, and helped to
bring the matter of active tourism to the forefront of academic thought, hopefully sparking
further investigation into this diverse topic of study.
66
References
Adventure Travel Trade Association. (2012). Adventure Tourism Development Index. Retrieved
from: http://www.adventuretravel.biz/wp-content/uploads/2012/11/atdi_2011_report.pdf
Adventure Travel Trade Association. (2011). Industry Snapshot First Quarter 2011. Seattle,
WA.
Adventure Travel Trade Association. (2012). Industry Snapshot March 2012. Seattle, WA.
Albanese, P. J. (1990). Personality, Consumer Behavior, and Marketing Research: A New
Theoretical and Empirical Approach. Research in Consumer Behavior 4, 1-49.
Andereck, K., & Caldwell, L. L. (1994). Variable Selection in Tourism Market Segmentation
Models. Journal of Travel Research, 33(2), 40-46.
Andereck, K.L., Caldwell, L. L., & Debbage, K. (1991). A Market Segmentation Analysis of
Zoo Visitors. Paper presented at Tourism: Building Credibility for a Credible Industry.
Proceedings of the Travel and Tourism Research Association Twenty-Second Annual
Conference, Long Beach, CA, 359-372.
Anderson, B. B., & Langmeyer, L. (1984). The Under-50 and Over-50 Travelers: A Profile of
Similarities and Differences. Journal of Travel Research, 20(4), 20-24.
Andreu, L., Kozak, M., Avci, N., & Cifter, N. (2005). Marketing segmentation by motivations to
travel: British tourists visiting Turkey. Journal of Travel and Tourism Marketing 19(1),
1-14.
Benckendorff, P., Moscardo, G., & Pendergast, D. (2010). Tourism and generation Y.
Cambridge, MA: CABI.
Best Trip Choices. (2012). Retrieved from http://besttripchoices.com/travel-personalities/
Boorstin, D. J. (1964). The Image: A Guide to Pseudo-Events in America. New York: Harper.
67
Braden, D. R., & Endelman, J. E. (1990). Americans on vacation. (pp. 8) Henry Ford Museum
and Greenfield Village.
Brey, E.T. (2007). The relationship between daily and vacation activities. Annals of Tourism
Research, 34(1), 160-180.
Calantone, R., & Johar, J. (1984). Seasonal segmentation of the tourism market using a benefit
segmentation framework. Journal of Travel Research, 23(2), 14-24.
Carr, N. (2002). The tourism-leisure behavioral continuum. Annals of Tourism Research, 29(4),
972–986.
Chandler, J. A., & Costello, C. A. (2002). A Profile of Visitors at Heritage Tourism Destinations
in East Tennessee According to Plog’s Lifestyle and Activity Level Preferences Model.
Journal of Travel Research, 41(4), 161-166.
Chang, S. & Gibson, H.J. (2011). Physically Active Leisure and Tourism Connection: Leisure
Involvement and Choice of Tourism Activities Among Paddlers. Leisure Sciences: An
Interdisciplinary Journal, 33(2), 162-181.
Chen, J. S., Prebensen, N., & Huan, T. (2008). Determining the motivation of wellness travelers.
Anatolia, 19(1), 103-115.
Chon, K. S., & Singh, A. (1995). Marketing resorts to 2000: Review of trends in the USA.
Tourism Management, 16(6), 463-459.
Chon, K. S., Sparrowe, R. T. (1999). Welcome to Hospitality: An Introduction. Delmar, 83.
Cohen, E. (1972). Toward a sociology of international tourism. Social Research, 39(1), 164-182.
Cohen, E. (1974). Who is a tourist? A conceptual clarification. The Sociological Review, 22(4),
527-555.
68
Crossley, J. C. & Jamieson, L. M. (1993). Introduction to Commercial and Entrepreneurial
Recreation. Champaign, IL: Sagamore Publishing.
Currie, R. R. (1997). A pleasure-tourism behaviors framework. Annals of Tourism Research,
24(4), 884–897.
Dimanche, F., Havitz, M. E. (1994). Consumer Behavior and Tourism: Review and Extension of
Four Study Areas. In J. C. Crotts and W. F. Van Raaij (Eds.), Economic Psychology of
Travel and Tourism (pp. 37-57). New York: Haworth.
Dotson, M.J., Clark, J.D., & Dave, D.S. (2008). Travel Motivations and Destination Activities of
Young Travelers of Different Ages: An Empirical Study in the United States.
International Journal of Management, 25(4), 665-672.
Dwyer, L. (2005). “Trends underpinning global tourism in the coming decade”, in W.F.
Theobald (ed.), Global Tourism, 3rd
edition, Boston, MA: Elsevier Butterworth-
Heinemann, pp. 529-545.
Ewert, A. (1989). Outdoor Adventure Pursuits: Foundation, Models, and Theories. Columbus,
OH: Publishing Horizons.
Fedler, A. (1987). Introduction: Are leisure, recreation and tourism interrelated. Annals of
Tourism Research, 14, 311–314.
Foxall, G., & Goldsmith, R. (1994). Consumer Psychology for Marketing. New York: Routledge.
Gilbert, D. C. (1990). Conceptual issues in the meaning of tourism. In C. P. Cooper (Ed.),
Progressing tourism, recreation and hospitality management (pp. 1-21). London: Pitman
Publishing.
Gilbert, D. C., & Cooper, C. (1991). An examination of the consumer behaviour process related
to tourism. Progress in Tourism, Recreation and Hospitality Management, 3, 78-105.
69
Gitelson, R. J., & Crompton, J. L. (1984). Insights into the Repeat Vacation Phenomenon.
Annals of Tourism Research,11(2), 199-217.
Glover, P., & Prideaux, B. (2009). Implications of population ageing for the development of
tourism products and destinations. Journal of Vacation Marketing, 15(1), 25-37.
Goeldner, C. R., & Ritchie, J. R. B. (2008). Tourism: Principles, practices, philosophies.
Hoboken, N.J: J. Wiley.
Grant, B. (2002). Over 65 and ready to play. Australian Leisure Management, 35, 36-38.
Griffith, D. A., & Albanese, P. J. (1996). An examination of Plog’s psychographic travel model
within a student population. Journal of Travel Research, 34(4), 47-51.
Hamilton-Smith, E. (1987). Four kinds of tourism. Annals of Tourism Research, 14, 22–344.
Hardy, R. L. (2010). Equestrians and how they disperse along plog’s Allocentric/Psychocentric
continuum. (Doctoral dissertation). Retrieved from ProQuest Dissertations and Theses.
(853134970).
Harris, C., McLaughlin, W. and Ham, S. (1987). Integration of recreation and tourism in Idaho.
Annals of Tourism Research, 14, 405–419.
Hinch, T., & Higham, J. (2003). Sport tourism development. Toronto: Channel View Books.
Hinch, T., & Higham, J. (2011). Sport tourism development (2nd
ed). Toronto: Channel View
Books.
Hollander, S.C., Germain, R. (1992). Was There a Pepsi Generation Before Pepsi Discovered It.
Lincolnwood, IL: NTC Publishing.
Huang, Y. C., & Petrick, J. F. (2010). Generation Y’s Travel Behaviours: a Comparison with
Baby Boomers and Generation X. In P. Benckendorff, G. Moscardo, & D. Pendergast
(Eds.), Tourism and generation Y (pp. 27-37). Cambridge, MA: CABI.
70
Hudson, S. (2003). Sport and adventure tourism. New York: Haworth Hospitality Press.
Jang, S. C. S., Cai, L. A., Morrison, A. M., & O’Leary, J. T. (2005). The effects of travel
activities and seasons on expenditure. International Journal of Tourism Research, 7(6),
335-346.
Jefferson, A. (1995). Prospects for tourism–A practitioner’s view. Tourism Management, 16(2),
101-105.
Jorgensen, B. (2003). Baby boomers, Generation X and Generation Y? Policy implications for
defense forces in the modern era. Foresight: The Journal of Futures Studies, Strategic
Thinking and Policy, 5(4), 41-49.
Kotler, P. (1994). Marketing management: Analysis, planning, implementation, and control.
Englewood Cliffs, NJ: Prentice Hall.
Kueh, K., & Voon, B. H. (2007). Culture and service quality expectations: evidence from
generation Y consumers in Malaysia. Managing Service Quality, 17(6), 656-680.
Leary, M. R. (1983). Social Anxiousness: The Construct and Its Measurement. Journal of
Personality Assessment, 47(1), 66-75.
Lee, T., & Crompton, J. (1992). Measuring Novelty Seeking in Tourism. Annals of Tourism
Research, 19(4), 732-751.
Lehto, X. Y., Jang, S. C. S., Achana, F. T., & O’Leary, J. T. (2008). Exploring tourism
experience sought: A cohort comparison of baby boomers and the silent generation.
Journal of Vacation Marketing, 14(3), 237-252.
Litvin, S. W. (2006). Revisiting Plog’s model of allocentricity and psychocentricity … one more
time. Cornell Hotel and Restaurant Administration Quarterly, 47(3), 245-253.
71
Loverseed, H. (1997). The adventure travel industry in North America. Travel & Tourism
Analyst, (6), 87-104.
Mannell, R. & Iso-Ahola, S. (1987). Psychological nature of leisure and tourism experience.
Annals of Tourism Research, 14, 314–331.
Markley, D. (2002). Here comes Y. Successful Meetings, 51(8), 39-40.
Mihelj, V. (2010). New tourist products for new tourists’ expectations. Faculty of Tourism and
Hospitality Management in Opatija. Biennial International Congress, 1075-1085.
Mill, R. C. (2001). Resorts: Management and Operation. Publisher: John Wiley & Sons,
Incorporated. Retrieved from http://ehis.ebscohost.com.jproxy.lib.ecu.edu/
ehost/ebookviewer/ebook/nlebk_59892_AN?sid=fe52cc63-1c38-42b6-ac00-
507ef53820b6@sessionmgr14&vid=2&ppid=pp_391&nobk=y
Mills, A. S., Couturier, H., & Snepenger, D. J. (1986). Segmenting Texas snow skiers. Journal of
Travel Research, 25(2), 19-23.
Mo, C., Howard, D. R., & Havitz, M. E. (1993). Testing an international tourist role typology.
Annals of Tourism Research, 20(2), 319-335.
Moisey, N. M., & McCool, S. F. (1990) The Benefit Segmentation Expenditure Connection: The
Case of Snowmobilers. Paper presented at The Tourism Connection: Linking Research
and Marketing, Travel and Tourism Research Association Twenty First Annual
Conference, New Orleans, LA, 375-382.
Moore, K., Cushman, G. & Simmons, D. (1995). Behavioral conceptualization of tourism and
leisure. Annals of Tourism Research, 22, 67–85.
Morton, P. (2002). Targeting Generation Y. Public Relations Quarterly, 47(2), 46–48.
72
Moscardo, G., Murphy, L., & Benckendorff, P. (2011). “Generation Y and Travel Futures”, in I.
Yeoman (ed.) Tourism and demography. Oxford: Goodfellow, pp. 87-100.
Nvight, P. A. (1996). North American Ecotourism Markets: Motivations, Preferences, and
Destinations. Journal of Travel Research, 35(1), 3-10.
Outdoor Recreation Participation Report. (2012). Outdoor Foundation. Retrieved from
http://www.outdoorfoundation.org/pdf/ResearchParticipation2012Topline.pdf
Pallant, J. (2011). SPSS Survival Manual - A step by step guide to data analysis using SPSS 4th
edition, Allen & Unwin, Crows Nest, NSW.
Pearce, P. L. (1993). Tourism Research: Critiques and Challenges. In D. G. Pearce & R. W.
Butler (Eds.), Fundamentals of Tourism Motivation (pp. 113-134). London and New
York: Routledge.
Pennington-Gray, L., Fridgen, J. D., & Stynes, D. (2003). Cohort segmentation: an application to
tourism. Leisure Sciences, 25, 341-361.
Perdue, R. R. (1985). Segmenting State Travel Information Inquirers by Timing of the
Destination Decision and Previous Experience. Journal of Travel Research, 23, 6-11.
Pizam, A. & Mansfeld, Y. (1999). Consumer Behavior in Travel & Tourism. New York, NY:
Haworth Press, Inc.
Plog, S. C. (1972). Why Destination Areas Rise and Fall in Popularity. Paper presented to the
Travel Research Association, Southern California Chapter, Los Angeles.
Plog, S. C. (1990). A Carpenter’s Tools: An Answer to Stephen L. J. Smith’s Review of
Psychocentrism/Allocentrism. Journal of Travel Research, 28(4), 43-45.
Plog, S. C. (1991a). A Carpenter’s Tools Re-visited: Measuring Allocentrism and
Psychocentrism Properly . . . the First Time. Journal of Travel Research, 29(4), 51-51.
73
Plog, S. C. (1991b). Leisure Travel: Making it a Growth Market . . . Again! New York: John
Wiley and Sons.
Plog, S. C. (2001). Why destination areas rise and fall in popularity. Cornell Hotel and
Restaurant Administration Quarterly, 42(3), 13-24.
Plog, S. C. (2002). The Power of Psychographics and the Concept of Venturesomeness. Journal
of Travel Research, 40(3), 244-251.
Plog, S. C. (2004). Leisure Travel: a marketing handbook. New Jersey: Pearson Prentice Hall.
Plummer, J. T. (1974). The Concept and Application of Life Style Segmentation. Journal of
Marketing, 38, 33-37.
Roberts, J. A. & Manolis, C. (2000). Baby boomers and busters: An exploratory investigation of
attitudes toward marketing, advertising and consumerism. Journal of Consumer
Marketing, 17(6), 481-497.
Rotter, J. B. (1966). Generalized expectancies for internal versus external control of
reinforcement. Psychological Monographs: General and Applied, 80(1), 1.
Ryan, C. (1994). Leisure and tourism—the application of leisure concepts to tourist behavior—a
proposed model. In A. Seaton, C. Jenkins, R. Wood, P. Dieke, M. Bennett, L. MacLellan
(Eds.), Tourism state of the art (pp. 294–307). Chichester, England: John Wiley & Sons.
Schmitt, G. (2008). Millennial generation. Dealernews, 44.
Schneider, P. P., & Vogt, C. A. (2012). Applying the 3M Model of Personality and Motivation to
Adventure Travelers. Journal of Travel Research, 51(6), 704-716.
Schroeder, A., Widmann, T. (2007). Demographic change and its impact on the travel industry:
Oldies — nothing but goldies? In R. Conrady & M. Buck (Eds.), Trends and Issues in
Global Tourism 2007 (pp. 11). Springer Berlin Heidelberg.
74
Siguaw, J. A., Enz, C. A., & Liu, Z. (2008). Using tourist travel habits and preferences to assess
strategic destination positioning the case of Costa Rica. Cornell Hospitality Quarterly,
49(3), 258-281.
Smith, S. & Godbey, G. (1991). Leisure, recreation and tourism. Annals of Tourism Research,
18, 85–100.
Smith, S. L. J. (1990). A test of Plog’s allocentric/psychocentric model: Evidence from seven
nations. Journal of Travel Research, 28(4), 40-43.
Smith, V. L. (1977). Host and Guests: The Anthropology of Tourism. Philadelphia: University of
Pennsylvania Press.
Snepenger, D. J. (1987). Segmenting the Vacation Market by Novelty-Seeking Role. Journal of
Travel Research, 26(2), 8-14.
Sorensen, L. (1993). The special-interest travel market. The Cornell H. R. A. Quarterly, 34(3),
24-30.
Spotts, D. M., & Mahoney, E. M. (1991). Segmenting Visitors to a Destination Region Based on
the Volume of their Expenditures. Journal of Travel Research, 29(4), 24-31.
Stevens, J., Lathrop, A., & Bradish, C. (2005). Tracking Generation Y: a contemporary sport
consumer profile. Journal of Sport Management, 19(3), 254-277.
Strauss, W., & Howe, N. (1992). Generations: The History of Americas Future 1594-2069.
William Morrow, New York.
Sullivan, P. & Heitmeyer, J. (2008). Looking at Gen Y shopping preferences and intentions:
exploring the role of experience and the apparel movement. International Journal of
Consumer Studies, 32(3), 285-295.
75
Sung, H. (2000). Adventure Travelers: Who Are They and What Do They Do on Their
Adventure Vacations? In Trends 2000. East Lansing, MI: Michigan State University
Sung, H. (2004). Classification of Adventure Travelers: Behavior, Decision Making, and Target
Markets. Journal of Travel Research, 42(4), 343-356.
Sung, H., Morrison, A. M., & O’Leary, J. T. (2001). Segmenting the Adventure Travel Market
by Activities: From the North American Industry Providers’ Perspective. Journal of
Travel & Tourism Marketing, 9(4), 1-20.
Swarbrooke, J. (2003). Adventure tourism: The new frontier. Oxford: Butterworth-Heinemann.
Tekin, D. A. (2004). Sport tourism–an animation perspective. Journal of Sport Tourism, 9(4),
317-322.
Tourism Canada. (1995). Adventure travel in Canada: An overview. Ottawa, Canada: Tourism
Canada.
Treuren, G., & Anderson, K. (2010). The employment expectations of different age cohorts: Is
generation Y really that different? Australian Journal of Career Development, 19(2), 49.
Turner, V. (1973). The Center Out There: Pilgrim’s Goal. History of Religions, 12(3), 191-230.
Vila, N. A., Brea, J. A. F., Carril, V. P. (2012). El turismo activo como modalidad turística en
expansión. Análisis de la oferta de turismo activo en España [Active tourism as a tourist
mode in expansion. Analysis of the supply of active tourism in Spain]. Contabilidad y
Negocios, 7(13), 59-70.
Waryszak, R. Z., & Kim, H. (1995). Psychographic segmentation of tourists as a predictor of
their travel behaviour. Journal of Hospitality & Leisure Marketing, 2(4), 5-19.
Weaver, D. B. (2011). Psychographic insights from a south carolina protected area. Tourism
Management, 33(2), 371.
76
Weiler, B., & Hall, C. M. (1992). Special interest tourism: In search of an alternative. In B.
Weiler & C. M. Hall (Eds.), Special interest tourism (pp. 199-204). London, England:
Belhaven Press.
Wesner, M. S., & Miller, T. (2008). Boomers and millennials have much in common.
Organization Development Journal, 26(3), 89-96. Retrieved from
http://search.proquest.com/docview/198009222?accountid=10639.
Wolfe, K., Hsu, C. H. C., Kang, S. K. (2002) Psychographic and Demographic Profiles of Niche
Market Leisure Travelers. Journal of Hospitality & Tourism Research, 26(1), 3-22.
Woodside, A. G., & Jacobs, L. W. (1985). Step Two in Benefit Segmentation: Learning the
Benefits Realized by Major Travel Markets. Journal of Travel Research, 24(1), 7-13.
Woodside, A. G., & Martin, D. (2007). Tourism management: Analysis, behaviour, and strategy.
Palo Alto, Calif: CABI Pub. Zuckerman, M., & Neeb, M. (1979). Sensation seeking and
psychopathology. Psychiatry Research, 1(3), 255-264.
Yeoman, I., Butterfield, S. (2011). “Tourism and Demography: An Overview”, in I. Yeoman
(ed.) Tourism and demography. Oxford: Goodfellow, pp. 1-21.
Zeppel, H., Sibtain, J. (2011). Families in Nature Tourism: Trends in Holiday Locations and
Activities”, in I. Yeoman (ed.) Tourism and demography. Oxford: Goodfellow, pp. 55-
71.

77
Appendices
Appendix A: ECU UMC IRB approval letter
EAST CAROLINA UNIVERSITY University & Medical Center Institutional Review Board Office 4N-70 Brody Medical Sciences Building· Mail Stop 682
600 Moye Boulevard · Greenville, NC 27834
Office 252-744-2914 · Fax 252-744-2284 · www.ecu.edu/irb
Notification of Exempt Certification
From: Social/Behavioral IRB
To: Ryan Merritt
CC: Carol Kline
Date: 11/5/2012
Re: UMCIRB 12-001764 Destination Recreation Psychographics
I am pleased to inform you that your research submission has been certified as exempt on 11/5/2012. This study is eligible for Exempt Certification under category #2.
It is your responsibility to ensure that this research is conducted in the manner reported in your
application and/or protocol, as well as being consistent with the ethical principles of the Belmont Report and your profession.
This research study does not require any additional interaction with the UMCIRB unless there are proposed changes to this study. Any change, prior to implementing that change, must be submitted to the UMCIRB for review and approval. The UMCIRB will determine if the change impacts the eligibility of the research for exempt status. If more substantive review is required, you will be notified within five business days.
The UMCIRB office will hold your exemption application for a period of five years from the date of this letter. If you wish to continue this protocol beyond this period, you will need to submit an Exemption Certification request at least 30 days before the end of the five year period.
The Chairperson (or designee) does not have a potential for conflict of interest on this study.
IRB00000705 East Carolina U IRB #1 (Biomedical) IORG0000418
IRB00003781 East Carolina U IRB #2 (Behavioral/SS) IORG0000418 IRB0000497
78
Appendix B: Vacation recreation survey
Vacation Recreation Preferences
Thank you for agreeing to participate in this research study. It is being conducted
by a graduate student in the Department of Recreation and Leisure Studies at East
Carolina University. The goal of this project is to better understand how
personality characteristics influence recreation activity choices while on vacation.
The questionnaire should take approximately 10 minutes of your time. Your
participation in this study is voluntary and you may withdraw from the study at any
time without penalty or loss of benefit. Your consent will be indicated by filling
out the survey and returning it. There are no foreseeable risks to participating in the
study. The results of this study may be published but no names will be used and
individual responses will be maintained in confidence by the researchers.
Anonymity and confidentiality will be assured.
While there are no risks to you, your participation will allow us to develop a
greater understanding of recreational preferences while traveling.
If you have any questions concerning the research study, please contact Dr. Carol
Kline at [email protected] or 919-306-1705. If you have questions about your rights
as a research subject, you may call the Chair of the University and Medical Center
Institutional Review Board at phone number 252-744-2914 (week days).
Thank you in advance for taking the time to share your insights with us.
Sincerely,
Ryan Merritt
Recreation and Leisure Studies
East Carolina University

79
These questions are strictly for classification purposes and will be reported in
aggregate only.
1. What is your gender?
Male
Female
2. In what year were you born?
3. What is your highest level of education?
High school or some high school
College graduate or some college
Post graduate
4. What is your yearly household income?
Less than $50,000
$50,000 to $100,000
$100,000 to $150,000
$150,000 to $200,000
Greater than $200,000
Prefer not to answer
5. What is your zip code?
In this section, please indicate the typical recreation activities you prefer while
on vacation.
6. Please indicate by checking the box below how likely you are to
participate in these activities while on a weekend getaway or
vacation.
Unlikely
Somewhat
Likely Likely
Extremely
Likely
Alpine Skiing
Backpacking
Beach Activities
(Sunbathing, Walking,
Collecting Shells)
Biking (Road)
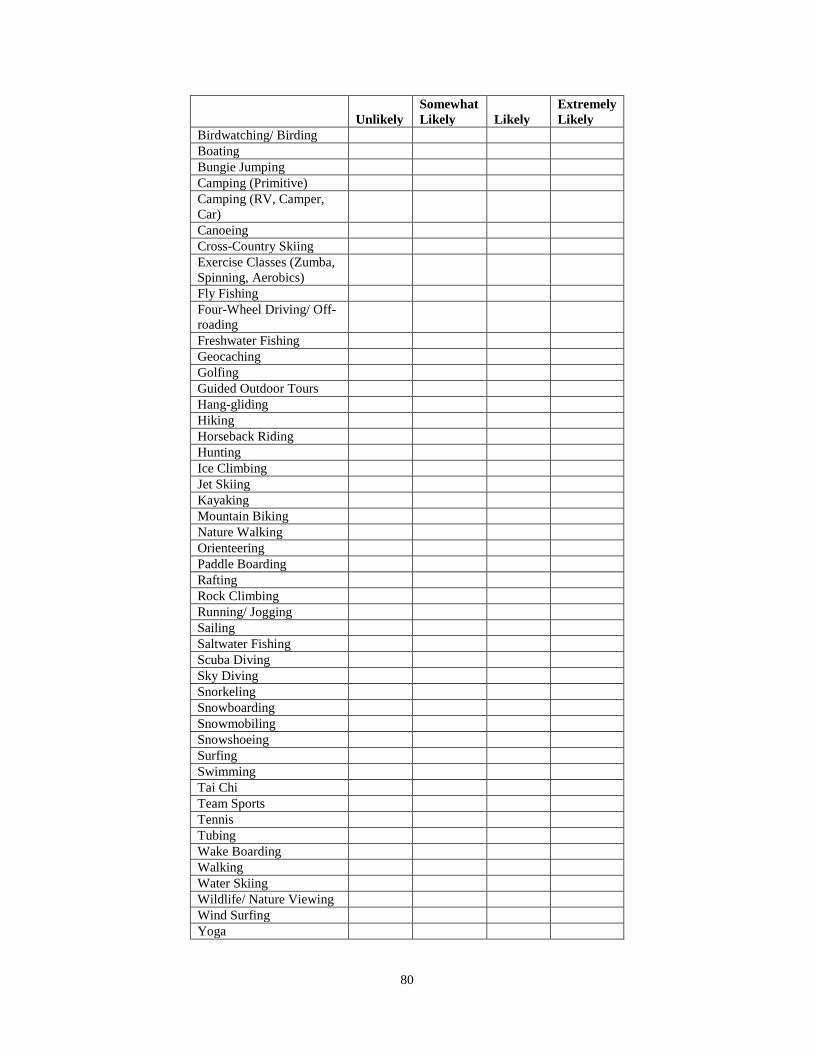
80
Unlikely
Somewhat
Likely Likely
Extremely
Likely
Birdwatching/ Birding
Boating
Bungie Jumping
Camping (Primitive)
Camping (RV, Camper,
Car)
Canoeing
Cross-Country Skiing
Exercise Classes (Zumba,
Spinning, Aerobics)
Fly Fishing
Four-Wheel Driving/ Off-
roading
Freshwater Fishing
Geocaching
Golfing
Guided Outdoor Tours
Hang-gliding
Hiking
Horseback Riding
Hunting
Ice Climbing
Jet Skiing
Kayaking
Mountain Biking
Nature Walking
Orienteering
Paddle Boarding
Rafting
Rock Climbing
Running/ Jogging
Sailing
Saltwater Fishing
Scuba Diving
Sky Diving
Snorkeling
Snowboarding
Snowmobiling
Snowshoeing
Surfing
Swimming
Tai Chi
Team Sports
Tennis
Tubing
Wake Boarding
Walking
Water Skiing
Wildlife/ Nature Viewing
Wind Surfing
Yoga

81
7. At what point in your travel planning do you typically make
decisions about your recreational activities?
Before arriving to the destination
After arriving to the destination
Both before arriving and after arriving at the destination
8. How far in advance do you usually make your lodging reservations?
After arriving to the destination
Less than one week prior to the trip
From one to four weeks prior
From one to six months prior
More than six months prior
This section will assess general personality characteristics. Please respond by
circling one answer from each of the following questions.
9. In most of your daily activities, do you:
a. Try to avoid rushing so you can relax a bit
b. Find that you are sometimes slow and sometimes fast
c. Find yourself hurrying even when you don’t have to hurry
10. When a new electronic product appears in the marketplace, will you
probably:
a. Wait until it has been around for quite awhile and drops low in
price
b. Wait for a short period of time before you buy, just to be certain
they’ve “worked all the bugs out”
c. Pay more to be one of the first to buy it, to enjoy the sense of
discovery
11. When you visit a place that has steep cliffs or canyons, are you likely
to:
a. Stay quite far away from the edge
b. Get a bit closer to look over but feel uncomfortable doing it
c. Get a bit closer to the edge so you can see down the canyon
12. Compared to most people, do you feel your energy level is:
a. Perhaps a little less
b. About the same

82
c. Much higher than others
13. As you work on things around the house or apartment, do you like to
do them:
a. Slowly and deliberately
b. At a moderate pace
c. Quickly to get them over with
14. If you were going to take a short vacation, would you rather:
a. Drive to the destination
b. Fly but stay in one place to relax after you get there
c. Fly, rent a car and explore different places
15. In terms of your current exercise participation, do you:
a. Not participate because you don’t believe it does much good
b. Agree that it’s helpful but don’t do as much of it as you should
c. Exercise regularly to stay in great shape
16. Compared to most people, do you:
a. Have a wide circle of friends and see them more frequently
b. Enjoy family and friends but also have a need to get away from
them
c. Have a very small but perhaps close circle of friends that you see
only occasionally
17. Compared to most people you know, are you:
a. Bothered by the many pressures of daily life
b. Able to handle most things well but sometimes feel strong anxiety
c. Able to handle pressure well without feeling much anxiety
18. When you make a decision, do you:
a. Think and worry about it a lot
b. Make a decision relatively quickly but worry later if you made the
right one
c. Make decisions quickly and easily and seldom worry later whether
or not it was correct
Please respond to the following question by indicating where your typical
vacation preference falls on the scales below.
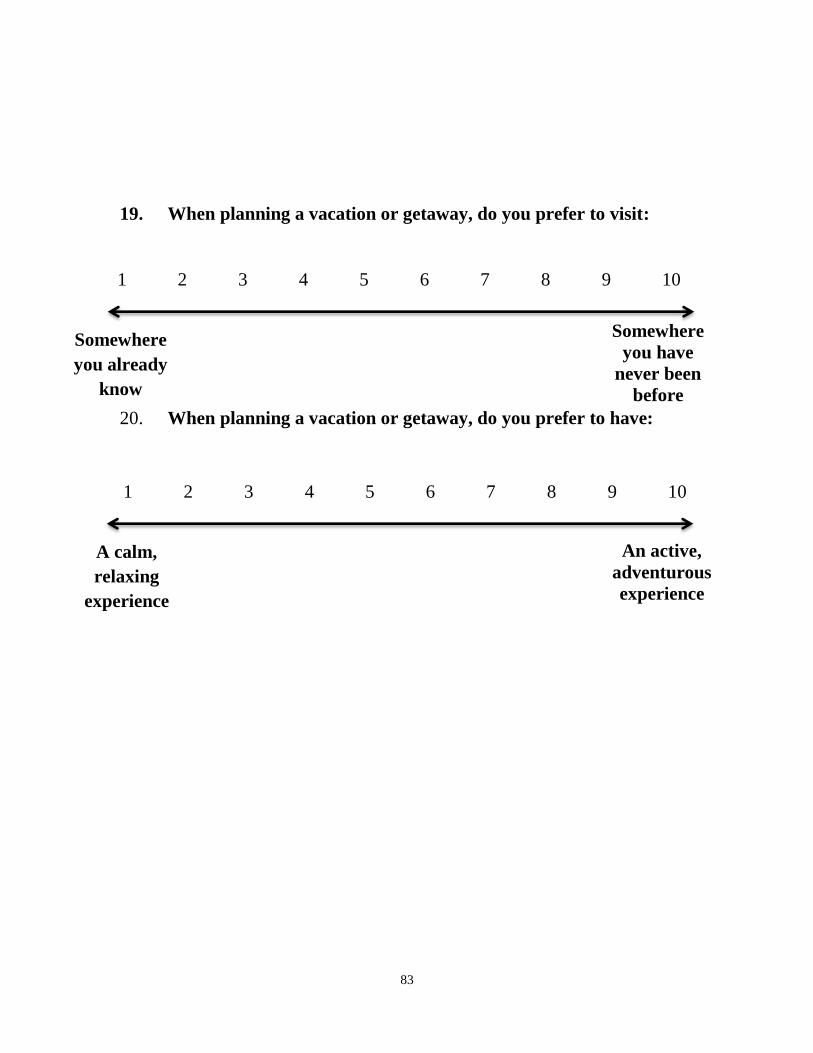
83
Somewhere
you have
never been
before
Somewhere
you already
know
An active,
adventurous
experience
A calm,
relaxing
experience
19. When planning a vacation or getaway, do you prefer to visit:
20. When planning a vacation or getaway, do you prefer to have:
1 2 3 4 5 6 7 8 9 10
1 2 3 4 5 6 7 8 9 10
84
Appendix C: DMO email contact
Hello everyone.
Thank you again for your interest in our project and for helping me work toward the completion
of my Master’s degree.
The basis of the study is founded in psychographics, a way of looking at personality profiles that
will help establish travel preferences. The model for this study will assess how adventurous the
respondent is in general, and explore the links between their personality, their generation, and
their recreation preferences while on vacation.
The first part of the survey gathers demographic information about the respondent. The second
section asks respondents to indicate how likely they are to participate in certain recreation
activities while traveling. The final section includes 10 personality questions. The survey will
include 18 total questions, and should take no longer than 10 minutes.
We have attached a hardcopy of the survey, although as you recall the data will be collected
online. I will provide you three solicitation emails to forward to your contact lists (going back
up to three years).
Ideally, we would like for you to send the first solicitation email out on Tuesday, November
27th
with the survey link, and if possible a reminder email on Wednesday, December 5th
and
Monday, December 10th
. Please consider offering an incentive to the respondents for completing
the survey, e.g. “you will be entered into a drawing for a two-night stay at….” While this isn’t
necessary, it typically increases the response rate and will provide us and you with more reliable
and complete results.
I would greatly appreciate it if you could please review the attached survey in terms of
readability, content, and appropriateness for the subject and audience. If you would like to make
notes electronically on the document, that is fine, or if you prefer to make them on the hardcopy
and scan it, that works too. Also, I ask that you please send me your feedback by Monday,
November 19th
.
Again, we are very appreciative of your participation in this project, and look forward to
collecting valuable information for your office. The completion of this study is projected for
Summer 2012, however a copy of the technical report can be expected by the end of March. If
you have any questions, please do not hesitate to email or call Dr. Kline or me – thank you!
Sincerely,
Ryan Merritt [email protected]
(563) 529-1881

85
Appendix D: Second DMO email contact (pilot request)
Hello again!
I understand this is a very hectic time of year for all of us, but I just wanted to reconnect with
everyone and kindly ask once more if you could please provide feedback for the pilot survey. I
highly regard your expertise, and that’s why it’s beneficial for your organization to go over the
survey instrument, so that the information gathered is representative of what you need/want. If
you can find a few minutes this weekend to glance over it, I would greatly appreciate any and all
suggestion you may have.
Thanks again, and I look forward to hearing from you all!
-Ryan

86
Appendix E: Participant solicitation emails
First Solicitation
Good morning _____,
First off, I hope you had a great Thanksgiving! Secondly, I wanted to remind you that the
vacation recreation survey is scheduled to go out today. I have included the link (below and in
the attached word document) along with a short solicitation (which you may use if needed). The
link can also be posted on your social media accounts, and is specific to _____ County.
Thanks again for your participation, and if you have any questions please don’t hesitate to
contact me.
-Ryan
563-529-1881
Solicitation:
Hello,
You are receiving this email because of your request for travel information from the _____ and
we value your feedback! We are collaborating with the Department of Recreation and Leisure
Studies at East Carolina University to better understand how personality characteristics
influence recreation activity choices while on vacation. The following survey asks you about
your preferred recreation activities while on vacation, as well as details about your travel
behavior. We would greatly appreciate your participation. The survey should only take
approximately 10 minutes of your time. To take the survey, simply click the link below or copy
and paste the text into your browser:
Take Survey
https://ecu.qualtrics.com/SE/?SID=SV_9Rkfh7pQpTVGyMZ
Thank you in advance for taking the time to share your insights with us.
Regards,
87
Second Solicitation (Lake Norman):
Hi Cyndi,
I know you plan to send the vacation recreation survey out again with the January calendar (Dec.
21st), but I wanted to share the final solicitation with you -- I came up with a charitable giving
incentive (that we will be funding) for the seasonal charity “Toys for Tots”. The incentive listed
below (and attached as a word document) allows for a 50 Cent donation to the “Toys for Tots”
organization for every survey completed -- you may use the incentive attached, or create your
own, but either way we ask that you please stress the importance of forwarding the email or
reposting/sharing/retweeting on your social media accounts so that we can get as many responses
as possible for Lake Norman.
Currently, your survey has been taken a total of 8 times, and in order for us to provide a more
beneficial report for your department, we need quite a few more responses. One suggestion that
another department had mentioned was to send the link as a message on your social media
accounts, so that along with being posted as a tweet or status update, it is also distributed to
every contact.
I hope this incentive is acceptable, and that we get a great response for Lake Norman!
Thanks Cyndi, I look forward to hearing from you soon!
-Ryan
(563) 529-1881
(Subject) Help Give the Gift of Holiday Spirit:
The holidays are a busy time of year for all of us, but lets remember the reason for the season --
with a few minutes of your time, your feedback will help provide a gift for children in need. For
every completed survey, 50 Cents will be donated to the “Toys for Tots” organization.
Every survey counts, so please forward/ re-post this message to friends and family.
Again, the following survey asks you about your preferred recreation activities while on
vacation, as well as details about your travel behavior and should only take approximately 10
minutes of your time. To take the survey, simply click the link below or copy and paste the text
into your browser:
Take Survey
https://ecu.qualtrics.com/SE/?SID=SV_3KtNO8CWQboxEX3
HAPPY HOLIDAYS!
88
Second Solicitation (Transylvania County):
Hi Brad,
I know you plan to send the vacation recreation survey out again in mid December with the
January newsletter, but I wanted to share the final solicitation with you. I have included a
solicitation below (and attached as a word document) that you are welcome to reformat
to include the Adventurist.
Thanks again Brad for your participation, and we look forward to getting even more results for
Transylvania County!
-Ryan
(563) 529-1881
Hello again!
We understand this is a very hectic time of year for all of us, but we just wanted to reconnect
with everyone and kindly ask once more for your participation in the vacation recreation
study. We highly regard your feedback, and if you can find a few minutes to take this survey, we
would greatly appreciate your participation. To take the survey, please click the link below or
copy and paste the text into your browser:
Take Survey
https://ecu.qualtrics.com/SE/?SID=SV_eg3mQPLCQkwfNOt
Thanks again, and we look forward to hearing from you all!
89
Second Solicitation (Montgomery County):
Hi Tricia,
I wanted to share the final vacation recreation survey solicitation with you -- I came up with a
charitable giving incentive (that we will be funding) for the seasonal charity
“Toys for Tots”. The incentive listed below (and attached as a word document) allows for a 50
Cent donation to the “Toys for Tots” organization for every survey completed -- you may use the
incentive attached, or create your own, but either way we ask that you please stress the
importance of forwarding the email or reposting/sharing/retweeting on your social media
accounts so that we can get as many responses as possible for Montgomery County.
Currently, your survey has been taken a total of 51 times, and in order for us to provide a more
beneficial report for your department, we need a few more responses. One suggestion that
another department had mentioned was to send the link as a message on your social media
accounts, so that along with being posted as a tweet or status update, it is also distributed to
every contact.
I hope this incentive is acceptable, and that we get a great response for Montgomery County!
Thanks Tricia, I look forward to hearing from you soon!
-Ryan
(563) 529-1881
(Subject) Help Give the Gift of Holiday Spirit: The holidays are a busy time of year for all of us, but let’s remember the reason for the season --
with a few minutes of your time, your feedback will help provide a gift for children in need. For
every completed survey, 50 Cents will be donated to the “Toys for Tots” organization.
Every survey counts, so please forward/repost/retweet this message to friends and family.
Again, the following survey asks you about your preferred recreation activities while on
vacation, as well as details about your travel behavior and should only take approximately 10
minutes of your time. To take the survey, simply click the link below or copy and paste the text
into your browser:
Take Survey
https://ecu.qualtrics.com/SE/?SID=SV_eX2VwAw9JTrVbtb
HAPPY HOLIDAYS!

90
Second Solicitation (Dare County):
Hi Lee,
I wanted to let you know that we’ve already had a great response from Dare County (231
respondents and counting) for the vacation recreation survey, and we look forward to sharing the
results with your department. As we had mentioned in our original conversation, if possible we
would appreciate the distribution of a second solicitation email to Dare County contacts
reminding them to participate in the vacation recreation survey. I have included a solicitation
below (and attached as a word document) that you are welcome to use or reformat to your liking.
Thanks again Lee for your participation, and we look forward to getting even more results for
Dare County!
-Ryan
(563) 529-1881
Hello again!
We understand this is a very hectic time of year for all of us, but we just wanted to reconnect
with everyone and kindly ask once more for your participation in the vacation recreation study.
We highly regard your feedback, and if you can find a few minutes to take this survey, we would
greatly appreciate your participation. To take the survey, please click the link below or copy
and paste the text into your browser:
Take Survey
https://ecu.qualtrics.com/SE/?SID=SV_9Rkfh7pQpTVGyMZ
Thanks again, and we look forward to hearing from you all!
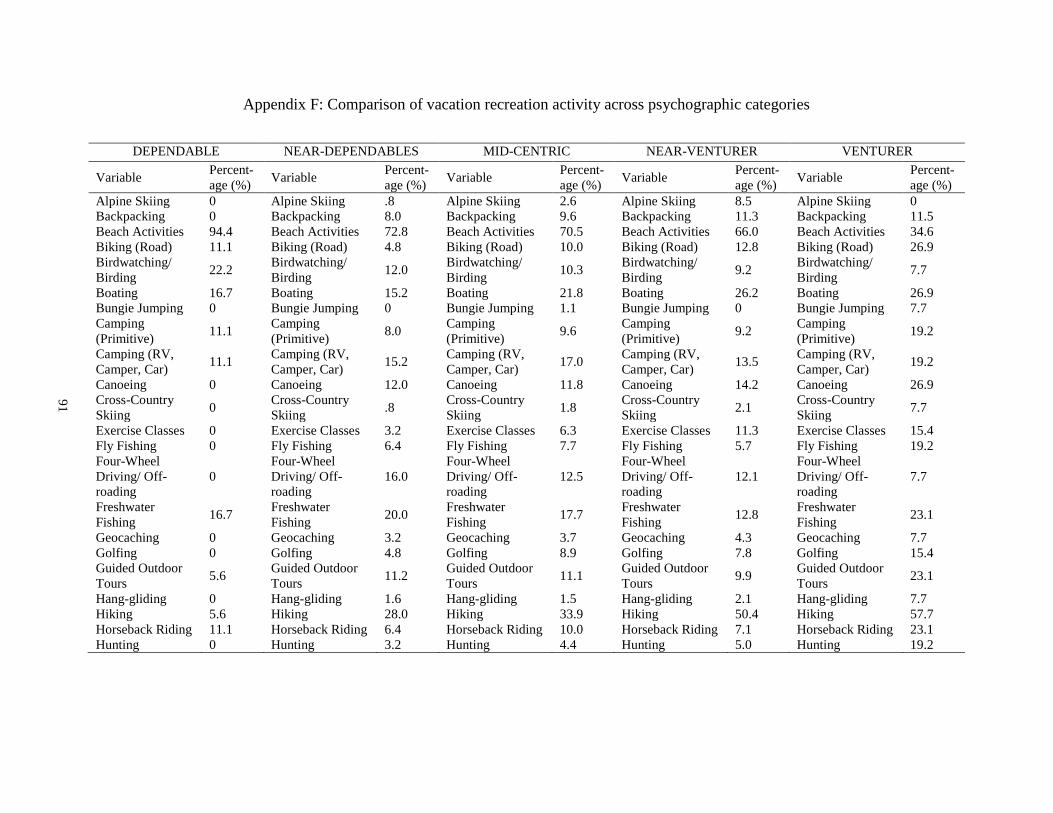
91
Appendix F: Comparison of vacation recreation activity across psychographic categories
DEPENDABLE NEAR-DEPENDABLES MID-CENTRIC NEAR-VENTURER VENTURER
Variable Percent-
age (%) Variable
Percent-
age (%) Variable
Percent-
age (%) Variable
Percent-
age (%) Variable
Percent-
age (%)
Alpine Skiing 0 Alpine Skiing .8 Alpine Skiing 2.6 Alpine Skiing 8.5 Alpine Skiing 0
Backpacking 0 Backpacking 8.0 Backpacking 9.6 Backpacking 11.3 Backpacking 11.5
Beach Activities 94.4 Beach Activities 72.8 Beach Activities 70.5 Beach Activities 66.0 Beach Activities 34.6
Biking (Road) 11.1 Biking (Road) 4.8 Biking (Road) 10.0 Biking (Road) 12.8 Biking (Road) 26.9
Birdwatching/
Birding 22.2
Birdwatching/
Birding 12.0
Birdwatching/
Birding 10.3
Birdwatching/
Birding 9.2
Birdwatching/
Birding 7.7
Boating 16.7 Boating 15.2 Boating 21.8 Boating 26.2 Boating 26.9
Bungie Jumping 0 Bungie Jumping 0 Bungie Jumping 1.1 Bungie Jumping 0 Bungie Jumping 7.7
Camping
(Primitive) 11.1
Camping
(Primitive) 8.0
Camping
(Primitive) 9.6
Camping
(Primitive) 9.2
Camping
(Primitive) 19.2
Camping (RV,
Camper, Car) 11.1
Camping (RV,
Camper, Car) 15.2
Camping (RV,
Camper, Car) 17.0
Camping (RV,
Camper, Car) 13.5
Camping (RV,
Camper, Car) 19.2
Canoeing 0 Canoeing 12.0 Canoeing 11.8 Canoeing 14.2 Canoeing 26.9
Cross-Country
Skiing 0
Cross-Country
Skiing .8
Cross-Country
Skiing 1.8
Cross-Country
Skiing 2.1
Cross-Country
Skiing 7.7
Exercise Classes 0 Exercise Classes 3.2 Exercise Classes 6.3 Exercise Classes 11.3 Exercise Classes 15.4
Fly Fishing 0 Fly Fishing 6.4 Fly Fishing 7.7 Fly Fishing 5.7 Fly Fishing 19.2
Four-Wheel
Driving/ Off-
roading
0
Four-Wheel
Driving/ Off-
roading
16.0
Four-Wheel
Driving/ Off-
roading
12.5
Four-Wheel
Driving/ Off-
roading
12.1
Four-Wheel
Driving/ Off-
roading
7.7
Freshwater
Fishing 16.7
Freshwater
Fishing 20.0
Freshwater
Fishing 17.7
Freshwater
Fishing 12.8
Freshwater
Fishing 23.1
Geocaching 0 Geocaching 3.2 Geocaching 3.7 Geocaching 4.3 Geocaching 7.7
Golfing 0 Golfing 4.8 Golfing 8.9 Golfing 7.8 Golfing 15.4
Guided Outdoor
Tours 5.6
Guided Outdoor
Tours 11.2
Guided Outdoor
Tours 11.1
Guided Outdoor
Tours 9.9
Guided Outdoor
Tours 23.1
Hang-gliding 0 Hang-gliding 1.6 Hang-gliding 1.5 Hang-gliding 2.1 Hang-gliding 7.7
Hiking 5.6 Hiking 28.0 Hiking 33.9 Hiking 50.4 Hiking 57.7
Horseback Riding 11.1 Horseback Riding 6.4 Horseback Riding 10.0 Horseback Riding 7.1 Horseback Riding 23.1
Hunting 0 Hunting 3.2 Hunting 4.4 Hunting 5.0 Hunting 19.2
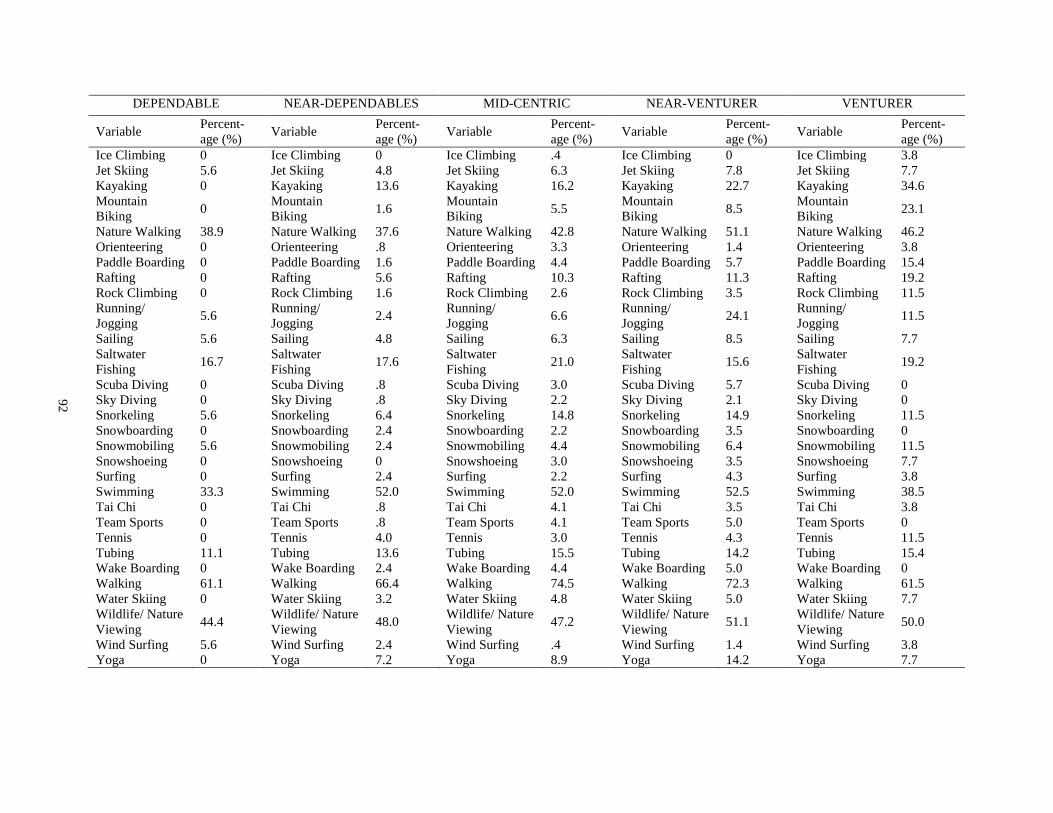
92
DEPENDABLE NEAR-DEPENDABLES MID-CENTRIC NEAR-VENTURER VENTURER
Variable Percent-
age (%) Variable
Percent-
age (%) Variable
Percent-
age (%) Variable
Percent-
age (%) Variable
Percent-
age (%)
Ice Climbing 0 Ice Climbing 0 Ice Climbing .4 Ice Climbing 0 Ice Climbing 3.8
Jet Skiing 5.6 Jet Skiing 4.8 Jet Skiing 6.3 Jet Skiing 7.8 Jet Skiing 7.7
Kayaking 0 Kayaking 13.6 Kayaking 16.2 Kayaking 22.7 Kayaking 34.6
Mountain
Biking 0
Mountain
Biking 1.6
Mountain
Biking 5.5
Mountain
Biking 8.5
Mountain
Biking 23.1
Nature Walking 38.9 Nature Walking 37.6 Nature Walking 42.8 Nature Walking 51.1 Nature Walking 46.2
Orienteering 0 Orienteering .8 Orienteering 3.3 Orienteering 1.4 Orienteering 3.8
Paddle Boarding 0 Paddle Boarding 1.6 Paddle Boarding 4.4 Paddle Boarding 5.7 Paddle Boarding 15.4
Rafting 0 Rafting 5.6 Rafting 10.3 Rafting 11.3 Rafting 19.2
Rock Climbing 0 Rock Climbing 1.6 Rock Climbing 2.6 Rock Climbing 3.5 Rock Climbing 11.5
Running/
Jogging 5.6
Running/
Jogging 2.4
Running/
Jogging 6.6
Running/
Jogging 24.1
Running/
Jogging 11.5
Sailing 5.6 Sailing 4.8 Sailing 6.3 Sailing 8.5 Sailing 7.7
Saltwater
Fishing 16.7
Saltwater
Fishing 17.6
Saltwater
Fishing 21.0
Saltwater
Fishing 15.6
Saltwater
Fishing 19.2
Scuba Diving 0 Scuba Diving .8 Scuba Diving 3.0 Scuba Diving 5.7 Scuba Diving 0
Sky Diving 0 Sky Diving .8 Sky Diving 2.2 Sky Diving 2.1 Sky Diving 0
Snorkeling 5.6 Snorkeling 6.4 Snorkeling 14.8 Snorkeling 14.9 Snorkeling 11.5
Snowboarding 0 Snowboarding 2.4 Snowboarding 2.2 Snowboarding 3.5 Snowboarding 0
Snowmobiling 5.6 Snowmobiling 2.4 Snowmobiling 4.4 Snowmobiling 6.4 Snowmobiling 11.5
Snowshoeing 0 Snowshoeing 0 Snowshoeing 3.0 Snowshoeing 3.5 Snowshoeing 7.7
Surfing 0 Surfing 2.4 Surfing 2.2 Surfing 4.3 Surfing 3.8
Swimming 33.3 Swimming 52.0 Swimming 52.0 Swimming 52.5 Swimming 38.5
Tai Chi 0 Tai Chi .8 Tai Chi 4.1 Tai Chi 3.5 Tai Chi 3.8
Team Sports 0 Team Sports .8 Team Sports 4.1 Team Sports 5.0 Team Sports 0
Tennis 0 Tennis 4.0 Tennis 3.0 Tennis 4.3 Tennis 11.5
Tubing 11.1 Tubing 13.6 Tubing 15.5 Tubing 14.2 Tubing 15.4
Wake Boarding 0 Wake Boarding 2.4 Wake Boarding 4.4 Wake Boarding 5.0 Wake Boarding 0
Walking 61.1 Walking 66.4 Walking 74.5 Walking 72.3 Walking 61.5
Water Skiing 0 Water Skiing 3.2 Water Skiing 4.8 Water Skiing 5.0 Water Skiing 7.7
Wildlife/ Nature
Viewing 44.4
Wildlife/ Nature
Viewing 48.0
Wildlife/ Nature
Viewing 47.2
Wildlife/ Nature
Viewing 51.1
Wildlife/ Nature
Viewing 50.0
Wind Surfing 5.6 Wind Surfing 2.4 Wind Surfing .4 Wind Surfing 1.4 Wind Surfing 3.8
Yoga 0 Yoga 7.2 Yoga 8.9 Yoga 14.2 Yoga 7.7
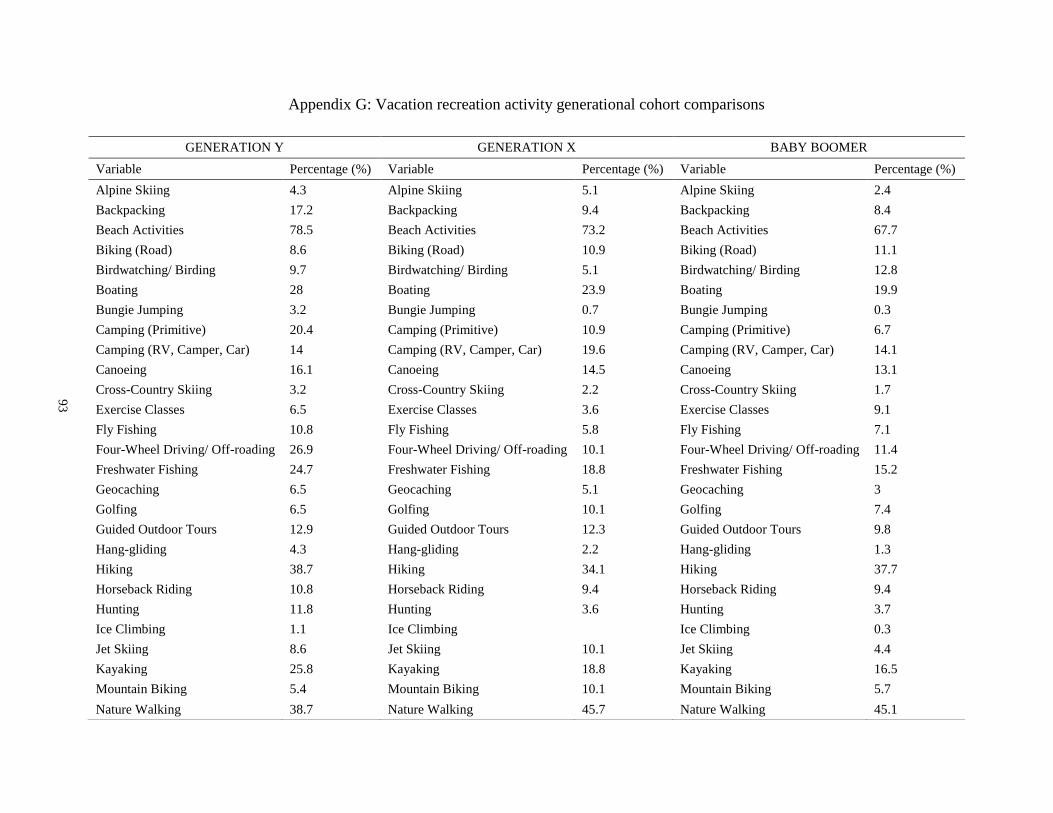
93
Appendix G: Vacation recreation activity generational cohort comparisons
GENERATION Y GENERATION X BABY BOOMER
Variable Percentage (%) Variable Percentage (%) Variable Percentage (%)
Alpine Skiing 4.3 Alpine Skiing 5.1 Alpine Skiing 2.4
Backpacking 17.2 Backpacking 9.4 Backpacking 8.4
Beach Activities 78.5 Beach Activities 73.2 Beach Activities 67.7
Biking (Road) 8.6 Biking (Road) 10.9 Biking (Road) 11.1
Birdwatching/ Birding 9.7 Birdwatching/ Birding 5.1 Birdwatching/ Birding 12.8
Boating 28 Boating 23.9 Boating 19.9
Bungie Jumping 3.2 Bungie Jumping 0.7 Bungie Jumping 0.3
Camping (Primitive) 20.4 Camping (Primitive) 10.9 Camping (Primitive) 6.7
Camping (RV, Camper, Car) 14 Camping (RV, Camper, Car) 19.6 Camping (RV, Camper, Car) 14.1
Canoeing 16.1 Canoeing 14.5 Canoeing 13.1
Cross-Country Skiing 3.2 Cross-Country Skiing 2.2 Cross-Country Skiing 1.7
Exercise Classes 6.5 Exercise Classes 3.6 Exercise Classes 9.1
Fly Fishing 10.8 Fly Fishing 5.8 Fly Fishing 7.1
Four-Wheel Driving/ Off-roading 26.9 Four-Wheel Driving/ Off-roading 10.1 Four-Wheel Driving/ Off-roading 11.4
Freshwater Fishing 24.7 Freshwater Fishing 18.8 Freshwater Fishing 15.2
Geocaching 6.5 Geocaching 5.1 Geocaching 3
Golfing 6.5 Golfing 10.1 Golfing 7.4
Guided Outdoor Tours 12.9 Guided Outdoor Tours 12.3 Guided Outdoor Tours 9.8
Hang-gliding 4.3 Hang-gliding 2.2 Hang-gliding 1.3
Hiking 38.7 Hiking 34.1 Hiking 37.7
Horseback Riding 10.8 Horseback Riding 9.4 Horseback Riding 9.4
Hunting 11.8 Hunting 3.6 Hunting 3.7
Ice Climbing 1.1 Ice Climbing Ice Climbing 0.3
Jet Skiing 8.6 Jet Skiing 10.1 Jet Skiing 4.4
Kayaking 25.8 Kayaking 18.8 Kayaking 16.5
Mountain Biking 5.4 Mountain Biking 10.1 Mountain Biking 5.7
Nature Walking 38.7 Nature Walking 45.7 Nature Walking 45.1
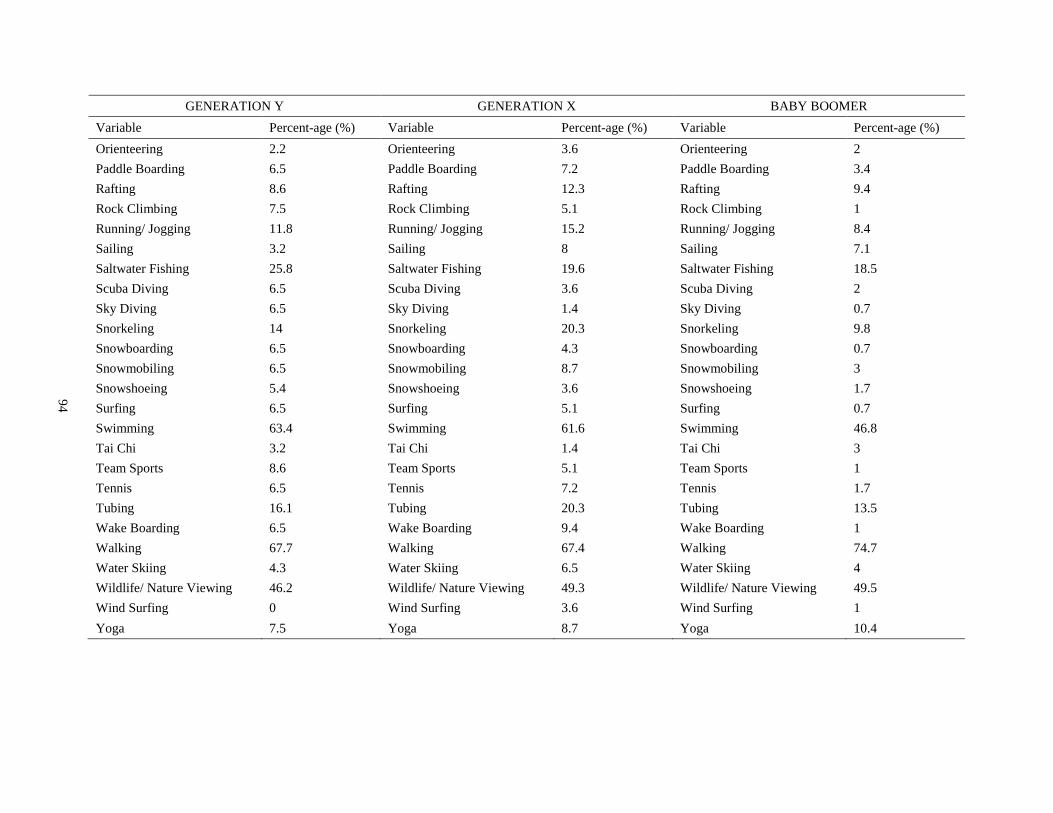
94
GENERATION Y GENERATION X BABY BOOMER
Variable Percent-age (%) Variable Percent-age (%) Variable Percent-age (%)
Orienteering 2.2 Orienteering 3.6 Orienteering 2
Paddle Boarding 6.5 Paddle Boarding 7.2 Paddle Boarding 3.4
Rafting 8.6 Rafting 12.3 Rafting 9.4
Rock Climbing 7.5 Rock Climbing 5.1 Rock Climbing 1
Running/ Jogging 11.8 Running/ Jogging 15.2 Running/ Jogging 8.4
Sailing 3.2 Sailing 8 Sailing 7.1
Saltwater Fishing 25.8 Saltwater Fishing 19.6 Saltwater Fishing 18.5
Scuba Diving 6.5 Scuba Diving 3.6 Scuba Diving 2
Sky Diving 6.5 Sky Diving 1.4 Sky Diving 0.7
Snorkeling 14 Snorkeling 20.3 Snorkeling 9.8
Snowboarding 6.5 Snowboarding 4.3 Snowboarding 0.7
Snowmobiling 6.5 Snowmobiling 8.7 Snowmobiling 3
Snowshoeing 5.4 Snowshoeing 3.6 Snowshoeing 1.7
Surfing 6.5 Surfing 5.1 Surfing 0.7
Swimming 63.4 Swimming 61.6 Swimming 46.8
Tai Chi 3.2 Tai Chi 1.4 Tai Chi 3
Team Sports 8.6 Team Sports 5.1 Team Sports 1
Tennis 6.5 Tennis 7.2 Tennis 1.7
Tubing 16.1 Tubing 20.3 Tubing 13.5
Wake Boarding 6.5 Wake Boarding 9.4 Wake Boarding 1
Walking 67.7 Walking 67.4 Walking 74.7
Water Skiing 4.3 Water Skiing 6.5 Water Skiing 4
Wildlife/ Nature Viewing 46.2 Wildlife/ Nature Viewing 49.3 Wildlife/ Nature Viewing 49.5
Wind Surfing 0 Wind Surfing 3.6 Wind Surfing 1
Yoga 7.5 Yoga 8.7 Yoga 10.4
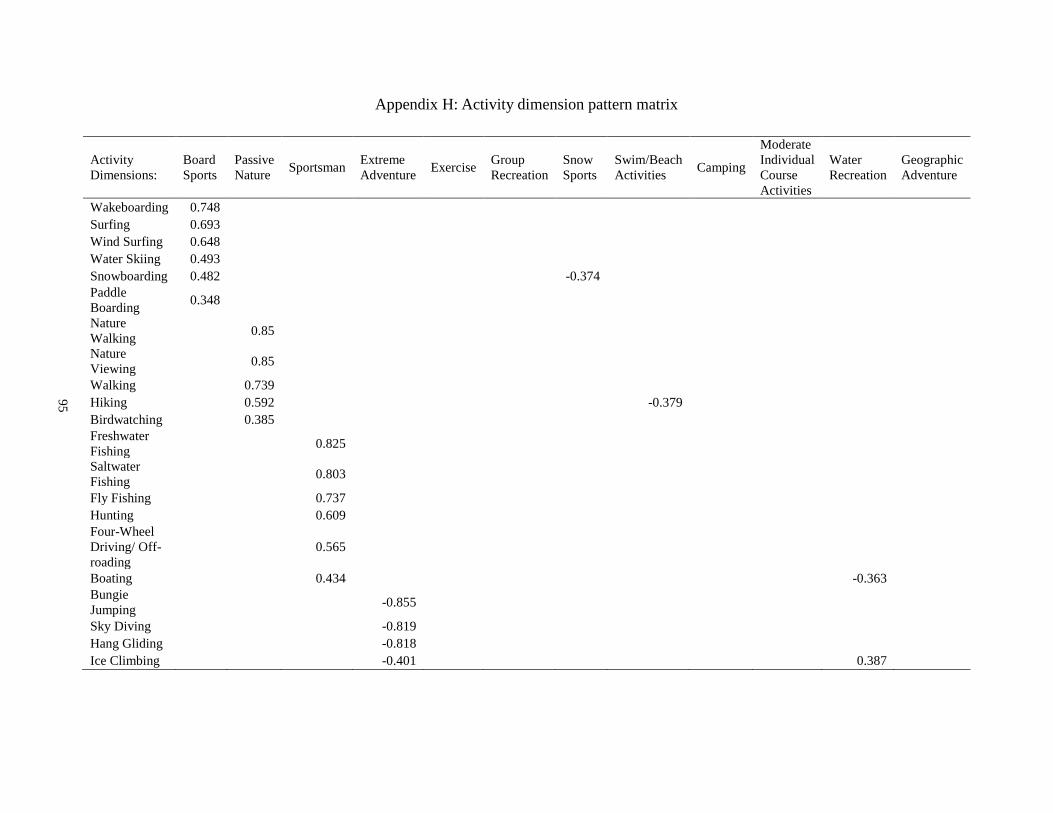
95
Appendix H: Activity dimension pattern matrix
Activity
Dimensions:
Board
Sports
Passive
Nature Sportsman
Extreme
Adventure Exercise
Group
Recreation
Snow
Sports
Swim/Beach
Activities Camping
Moderate
Individual
Course
Activities
Water
Recreation
Geographic
Adventure
Wakeboarding 0.748
Surfing 0.693
Wind Surfing 0.648
Water Skiing 0.493
Snowboarding 0.482
-0.374
Paddle
Boarding 0.348
Nature
Walking 0.85
Nature
Viewing 0.85
Walking
0.739
Hiking
0.592
-0.379
Birdwatching
0.385
Freshwater
Fishing 0.825
Saltwater
Fishing 0.803
Fly Fishing
0.737
Hunting
0.609
Four-Wheel
Driving/ Off-
roading 0.565
Boating
0.434
-0.363
Bungie
Jumping -0.855
Sky Diving
-0.819
Hang Gliding
-0.818
Ice Climbing
-0.401
0.387
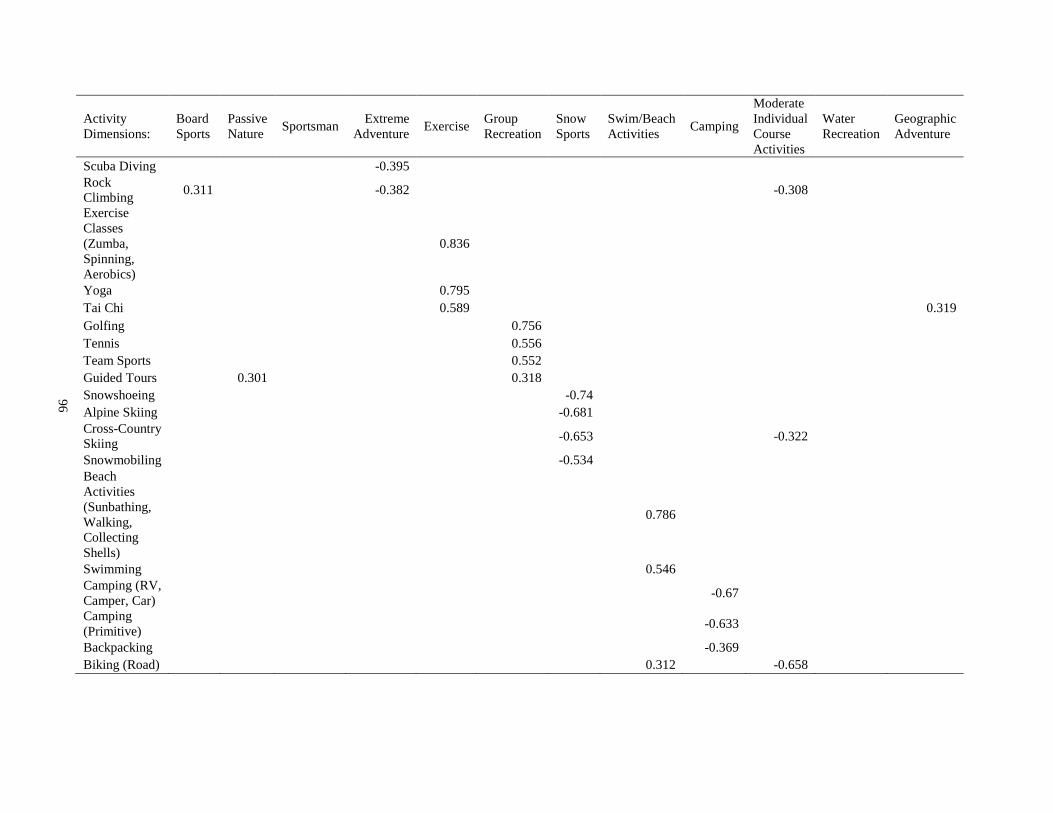
96
Activity
Dimensions:
Board
Sports Passive
Nature Sportsman
Extreme
Adventure Exercise
Group
Recreation Snow
Sports Swim/Beach
Activities Camping
Moderate
Individual
Course
Activities
Water
Recreation Geographic
Adventure
Scuba Diving
-0.395
Rock
Climbing 0.311
-0.382
-0.308
Exercise
Classes
(Zumba,
Spinning,
Aerobics)
0.836
Yoga
0.795
Tai Chi 0.589 0.319
Golfing 0.756 Tennis
0.556
Team Sports
0.552
Guided Tours
0.301
0.318
Snowshoeing
-0.74
Alpine Skiing
-0.681
Cross-Country
Skiing -0.653
-0.322
Snowmobiling
-0.534
Beach
Activities
(Sunbathing,
Walking,
Collecting
Shells)
0.786
Swimming
0.546
Camping (RV,
Camper, Car) -0.67
Camping
(Primitive) -0.633
Backpacking
-0.369
Biking (Road)
0.312
-0.658
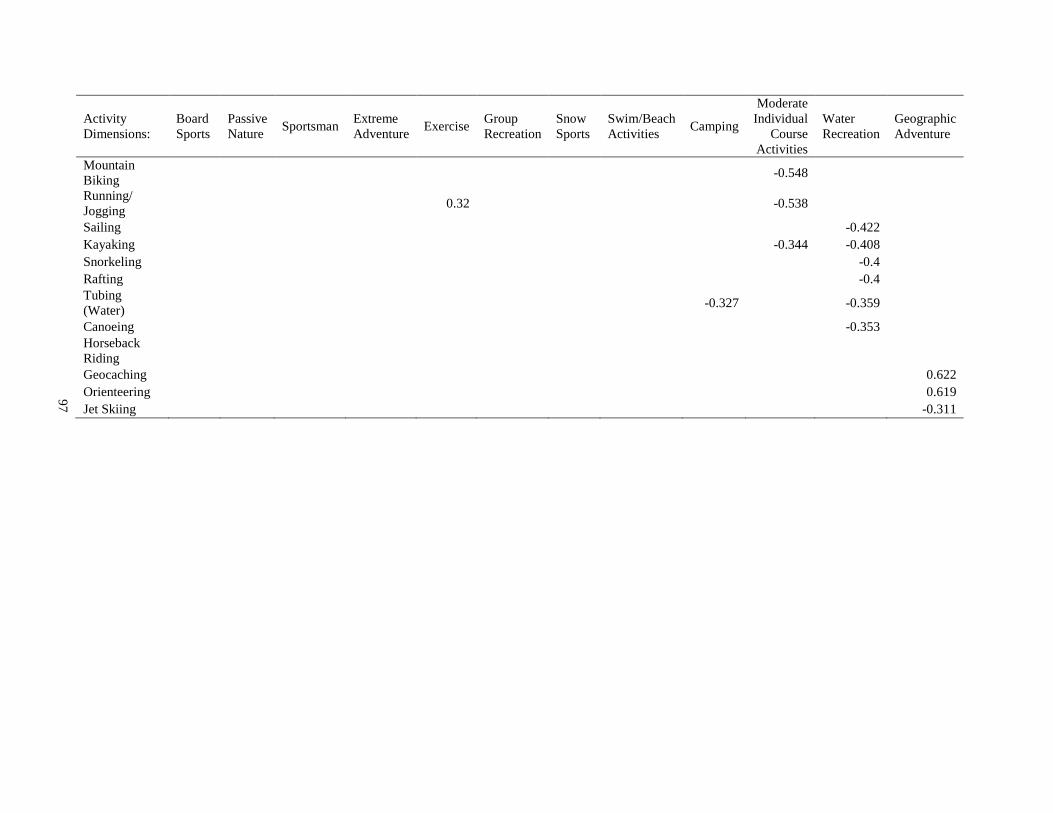
97
Activity
Dimensions:
Board
Sports
Passive
Nature Sportsman
Extreme
Adventure Exercise
Group
Recreation
Snow
Sports
Swim/Beach
Activities Camping
Moderate
Individual
Course
Activities
Water
Recreation
Geographic
Adventure
Mountain
Biking -0.548
Running/
Jogging 0.32
-0.538
Sailing
-0.422
Kayaking
-0.344 -0.408
Snorkeling
-0.4
Rafting
-0.4
Tubing
(Water) -0.327
-0.359
Canoeing
-0.353
Horseback
Riding
Geocaching
0.622
Orienteering
0.619
Jet Skiing -0.311
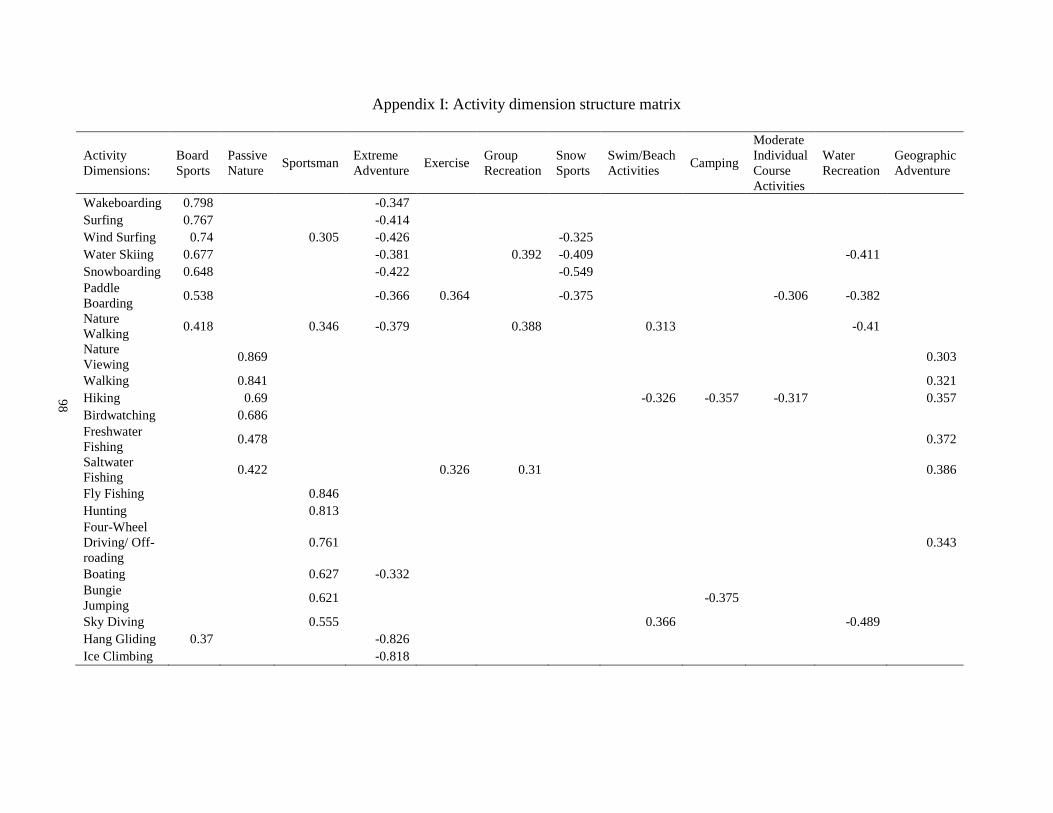
98
Appendix I: Activity dimension structure matrix
Activity
Dimensions:
Board
Sports
Passive
Nature Sportsman
Extreme
Adventure Exercise
Group
Recreation
Snow
Sports
Swim/Beach
Activities Camping
Moderate
Individual
Course
Activities
Water
Recreation
Geographic
Adventure
Wakeboarding 0.798
-0.347
Surfing 0.767
-0.414
Wind Surfing 0.74
0.305 -0.426
-0.325
Water Skiing 0.677
-0.381
0.392 -0.409
-0.411
Snowboarding 0.648
-0.422
-0.549
Paddle
Boarding 0.538
-0.366 0.364
-0.375
-0.306 -0.382
Nature
Walking 0.418
0.346 -0.379
0.388
0.313
-0.41
Nature
Viewing 0.869
0.303
Walking
0.841
0.321
Hiking
0.69
-0.326 -0.357 -0.317
0.357
Birdwatching
0.686
Freshwater
Fishing 0.478
0.372
Saltwater
Fishing 0.422
0.326 0.31
0.386
Fly Fishing
0.846
Hunting
0.813
Four-Wheel
Driving/ Off-
roading 0.761
0.343
Boating
0.627 -0.332
Bungie
Jumping 0.621
-0.375
Sky Diving
0.555
0.366
-0.489
Hang Gliding 0.37
-0.826
Ice Climbing
-0.818
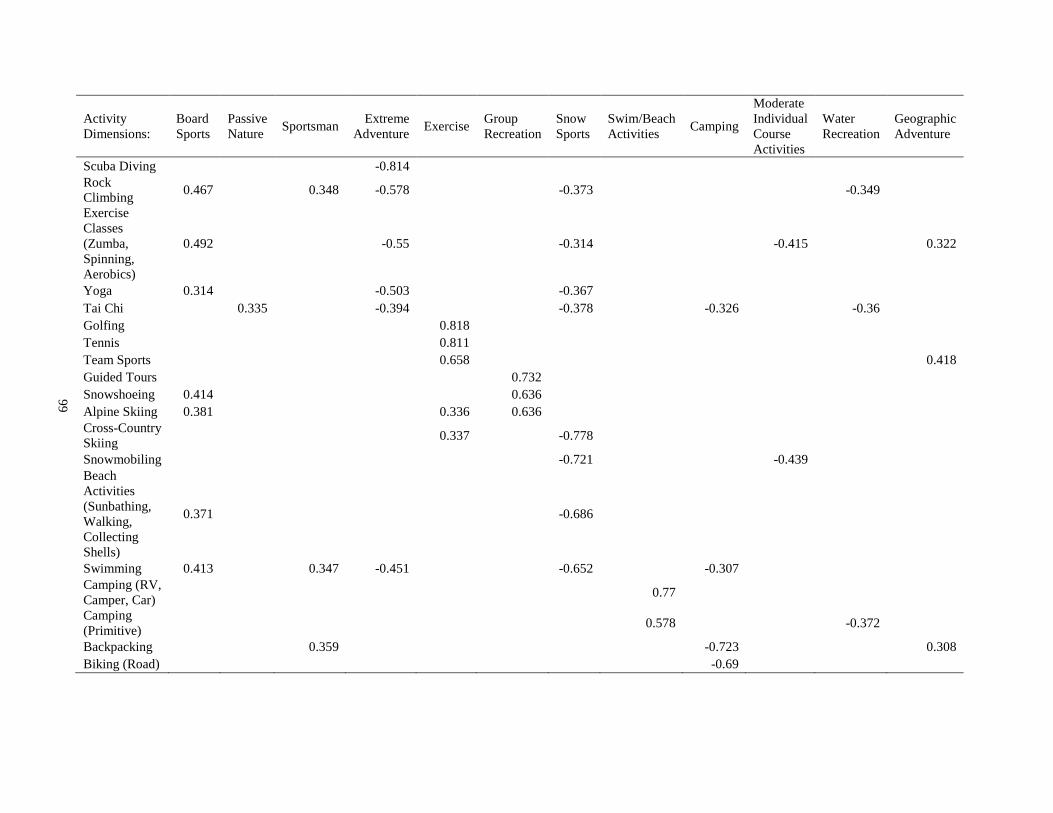
99
Activity
Dimensions:
Board
Sports Passive
Nature Sportsman
Extreme
Adventure Exercise
Group
Recreation Snow
Sports Swim/Beach
Activities Camping
Moderate
Individual
Course
Activities
Water
Recreation Geographic
Adventure
Scuba Diving
-0.814
Rock
Climbing 0.467
0.348 -0.578
-0.373
-0.349
Exercise
Classes
(Zumba,
Spinning,
Aerobics)
0.492
-0.55
-0.314
-0.415
0.322
Yoga 0.314 -0.503 -0.367 Tai Chi
0.335
-0.394
-0.378
-0.326
-0.36
Golfing
0.818
Tennis
0.811
Team Sports
0.658
0.418
Guided Tours
0.732
Snowshoeing 0.414
0.636
Alpine Skiing 0.381
0.336 0.636
Cross-Country
Skiing 0.337
-0.778
Snowmobiling
-0.721
-0.439
Beach
Activities
(Sunbathing,
Walking,
Collecting
Shells)
0.371
-0.686
Swimming 0.413
0.347 -0.451
-0.652
-0.307
Camping (RV,
Camper, Car) 0.77
Camping
(Primitive) 0.578
-0.372
Backpacking
0.359
-0.723
0.308
Biking (Road)
-0.69
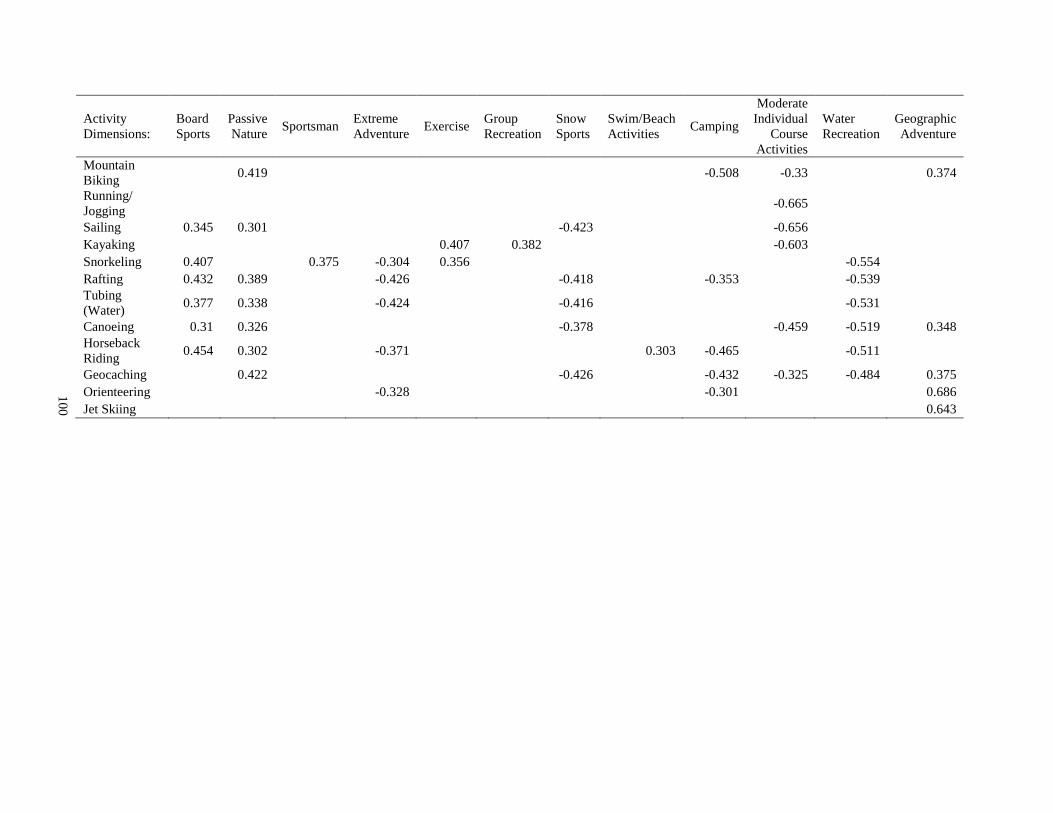
10
0
Activity
Dimensions:
Board
Sports
Passive
Nature Sportsman
Extreme
Adventure Exercise
Group
Recreation
Snow
Sports
Swim/Beach
Activities Camping
Moderate
Individual
Course
Activities
Water
Recreation
Geographic
Adventure
Mountain
Biking 0.419
-0.508 -0.33
0.374
Running/
Jogging -0.665
Sailing 0.345 0.301
-0.423
-0.656
Kayaking
0.407 0.382
-0.603
Snorkeling 0.407
0.375 -0.304 0.356
-0.554
Rafting 0.432 0.389
-0.426
-0.418
-0.353
-0.539
Tubing
(Water) 0.377 0.338
-0.424
-0.416
-0.531
Canoeing 0.31 0.326
-0.378
-0.459 -0.519 0.348
Horseback
Riding 0.454 0.302
-0.371
0.303 -0.465
-0.511
Geocaching
0.422
-0.426
-0.432 -0.325 -0.484 0.375
Orienteering
-0.328
-0.301
0.686
Jet Skiing 0.643

101