Embed Size (px)
Citation preview
UNIVERSITY OF LJUBLJANA
FACULTY OF ECONOMICS
KATARINA MILIČEVIĆ
DESTINATION BRANDING AS A DESTINATION
COMPETITIVENESS FACTOR: CASE OF CROATIA
DOCTORAL DISSERTATION
Ljubljana, 2016
AUTHORSHIP STATEMENT
The undersigned Katarina Miličević a student at the University of Ljubljana, Faculty of Economics,
(hereafter: FELU), declare that I am the author of the doctoral dissertation entitled Destination
branding as a destination competitiveness factor: Case of Croatia, written under supervision of
prof. dr. sc. Tanja Mihalič.
In accordance with the Copyright and Related Rights Act (Official Gazette of the Republic of
Slovenia, Nr. 21/1995 with changes and amendments) I allow the text of my doctoral dissertation to
be published on the FELU website.
I further declare
the text of my doctoral dissertation to be based on the results of my own research;
the text of my doctoral dissertation to be language-edited and technically in adherence with
the FELU’s Technical Guidelines for Written Works which means that I
- cited and / or quoted works and opinions of other authors in my doctoral dissertation in
accordance with the FELU’s Technical Guidelines for Written Works and
- obtained (and referred to in my doctoral dissertation) all the necessary permits to use the
works of other authors which are entirely (in written or graphical form) used in my text;
to be aware of the fact that plagiarism (in written or graphical form) is a criminal offence and
can be prosecuted in accordance with the Copyright and Related Rights Act (Official Gazette
of the Republic of Slovenia, Nr. 55/2008 with changes and amendments);
to be aware of the consequences a proven plagiarism charge based on the submitted doctoral
dissertation could have for my status at the FELU in accordance with the relevant FELU
Rules on Doctoral Dissertation.
Date of public defense: 18 April, 2016
Committee Chair: Prof. dr. Vesna Žabkar
Supervisor: Prof. dr. Tanja Mihalič
Member: Prof. dr. Ljubica Knežević Cvelbar
Member: Prof. dr. sc. Darko Prebežac
Ljubljana, 18 April, 2016 Author’s signature: ________________________
DESTINACIJSKA ZNAMKA KOT DEJAVNIK KONKURENČNOSTI
DESTINACIJE: PRIMER HRVAŠKE
POVZETEK
Doktorska disertacija obravnava destinacijsko znamko, ki velja za relativno nov koncept v
teoriji in praksi turizma, in njen vpliv na konkurenčnost turistične destinacije. Kljub temu da
gre za novo raziskovalno področje, je že splošno priznano, da predstavlja destinacijska znamka
eno izmed najmočnejših in najbolj inovativnih instrumentov v okviru izvajanja strategije trženja
destinacije. Kljub temu je zaznati pomanjkanje teoretičnih okvirov in empiričnih dokazov, ki
bi potrdili povezavo med destinacijsko znamko in konkurenčnostjo destinacije same. Namen
doktorske disertacije je premostiti teoretično vrzel med ciljnim trženjem destinacijske znamke
in konkurenčnosti destinacije ter opredeliti morebitno vlogo destinacijske znamke turistične
destinacije v obstoječih modelih konkurenčnosti turistične destinacije.
Teoretske temelje te tematike je mogoče najti v turistični literaturi, povezani s turistično
destinacijo, ki velja za jedro razvoja turizma, destinacijski znamkami in konkurenčnostjo
destinacije. Natančneje zapisano, disertacija vsebuje obsežen pregled literature o
najpomembnejših konceptih, povezanih z (i) opredelitvijo turistične destinacije in njene vloge
v celotnem razvoju turizma, (ii) znamko in procesom uveljavitve destinacijske znamke na ravni
turistične destinacije in (iii) modeli konkurenčnosti destinacije ter dejavniki, ki vplivajo na
konkurenčnost destinacije. Za zagotovitev empiričnih dokazov, ki bi obravnavali že omenjeno
raziskovalno vrzel, se je v okviru naloge izvedla raziskava na množici hrvaških obmorskih
destinacij. Ta je temeljila na osnovnih informacijah, zbranih s pomočjo vprašalnika, ki so ga
pripravile organizacije za upravljanje destinacij, in dodatnih podatki, ki so se pridobile s
pomočjo vprašalnika TOMAS Summer 2010. Nenazadnje velja omeniti, da doktorska
disertacija raziskuje koncept destinacijske znamke in konkurenčnosti z vidika turističnega
povpraševanja ter z vidika turistične ponudbe.
Empirične ugotovitve študije kažejo, da je destinacijska znamka pozitivno povezana z
destinacija konkurenčnost, merjene s z razliko v prednostnih nalogah (indeks DiPs) med DMO
in turistov. Izvedena raziskava daje empirične dokaze, da imajo poprej navedeni predlogi za
izboljšanje obstoječih modelov destinacijske konkurenčnosti trdne teoretične podlage. Nadalje,
ugotovitve raziskave podajajo nove predloge za izboljšanje trenutnih modelov konkurenčnosti.
Ti predlogi temeljijo na uvedbi destinacijske znamke kot dejavniku, ki vpliva na modele
turistične destinacije. Doktorska disertacija podaja v zaključku sklepne ugotovitve in
priporočila za nadaljnje raziskave.

Ključne besede: turistična destinacija, destinacijska znamka, destinacijska konkurenčnost,
Hrvaška
DESTINATION BRANDING AS A DESTINATION COMPETITIVENESS FACTOR:
CASE OF CROATIA
SUMMARY
This dissertation explores tourism destination branding as a relatively novel concept in tourism
theory and practice, and its influence on tourism destination competitiveness. It is widely
acknowledged that destination branding, although relatively new research area, represents one
of the most powerful and innovative tools of destination marketing strategy. However,
theoretical framework and empirical evidences that would connect destination branding and
destination competitiveness are still missing. Therefore, the purpose of the dissertation is to
bridge the theoretical gap between destination branding and destination competitiveness and to
determine possible role of tourism destination branding in the existing models of tourism
destination competitiveness.
Theoretical underpinnings of this study can be found within tourism research literature related
to the tourism destination, as a nucleus of tourism development, destination branding and
destination competitiveness. More precisely, the dissertation provides an extensive literature
review on the most important concepts related to: (i) definition of tourism destination and its
role in overall tourism development; (ii) brand and branding process at the tourism destination
level; (iii) destination competitiveness models and factors that influence destination
competitiveness. In order to provide an empirical evidence that would address previously
mentioned research gap, an exploratory research on a set of Croatian seaside destinations was
conducted in this study. Exploratory research was based on the primary data, collected through
an on-line questionnaire from destination management organizations (DMO’s), as well as on
the secondary data available from the TOMAS Summer Survey 2010. It is noteworthy that this
dissertation investigates the concept of destination branding and competitiveness from the
perspective of tourism demand as well as from the perspective of tourism supply.
Empirical findings of the study show that destination branding is positively related to
destination competitiveness measured by DMO’s performance using discrepancy in priorities
index (DiPs) between DMOs and tourists. Research findings provided empirical evidence that
previously defined suggestions for advancement of existing destination competitiveness model
with the use of branding have theoretical grounding. Research findings also provide suggestions
for the improvements of the current destination competitiveness models by introducing
destination branding as a factor of tourism destination competitiveness models. Finally,
conclusions and recommendations for further research are also presented in this dissertation.

Key words: tourism destination, destination branding, destination competitiveness, Croatia
i
TABLE OF CONTENTS
LIST OF TABLES .................................................................................................................... iii
LIST OF FIGURES .................................................................................................................... v
1 INTRODUCTION .............................................................................................................. 1
1.1 Rationale for the research ..................................................................................... 2
1.2 Research problem .................................................................................................. 3
1.3 Research goal and research questions ................................................................... 5
1.4 Expected scientific contribution............................................................................ 5
1.5 Dissertation structure ............................................................................................ 6
2 LITERATURE REVIEW ................................................................................................... 7
2.1 The concept of tourism destination ....................................................................... 7
2.1.1 Tourism destination earlier concept ...................................................................... 8
2.1.2 Contemporary understanding of tourism destination ............................................ 9
2.1.3 Types of tourism destinations ............................................................................. 11
2.1.4 Tourism destination management ....................................................................... 13
2.2 Destination branding ........................................................................................... 15
2.2.1 Definition of brand .............................................................................................. 16
2.2.2 From place marketing to place branding ............................................................. 18
2.2.3 Tourism destination branding ............................................................................. 21
2.2.4 Destination branding process .............................................................................. 23
2.3 Competitiveness in tourism ................................................................................. 25
2.3.1 Definition of competitiveness ............................................................................. 26
2.3.2 Competitiveness analysis .................................................................................... 30
2.3.3 The concept of destination competitiveness ....................................................... 33
2.3.4 Destination competitiveness models ................................................................... 36
2.3.4.1 Conceptual tourism destination competitiveness models ........................... 36
2.3.4.2 Empirical tourism destination competitiveness models .............................. 38
2.4 Relation among destination branding and destination competitiveness ............. 40
3 CONCEPTUALIZATION OF THE RESEARCH MODEL ............................................ 45
3.1 Suggestions for destination competitiveness model improvements with the use of
branding .............................................................................................................. 45
3.2 The research model ............................................................................................. 49
3.3 Hypotheses .......................................................................................................... 50
4 RESEARCH METHODOLOGY ...................................................................................... 53
4.1 Desk research ...................................................................................................... 53
4.2 Exploratory research ........................................................................................... 55
4.3 Study setting – Croatian seaside destinations ..................................................... 59
ii
4.3.1 Istria County ........................................................................................................ 60
4.3.2 Primorje-Gorski Kotar County............................................................................ 61
4.3.3 Lika-Senj County ................................................................................................ 62
4.3.4 Zadar County....................................................................................................... 63
4.3.5 Šibenik-Knin County .......................................................................................... 64
4.3.6 Split-Dalmatia County ........................................................................................ 65
4.3.7 Dubrovnik-Neretva County................................................................................. 66
5 INTERPRETATION OF THE RESEARCH RESULTS ................................................. 67
5.1 Analysis of the branding process implementation in Croatia’s seaside
destinations.......................................................................................................... 67
5.2 Effects of branding performance on tourist satisfaction ..................................... 70
5.3 Effect of BiPs on tourist satisfaction ................................................................... 73
5.4 Discrepancy in priorities index ........................................................................... 77
5.5 Relationship between tourist satisfaction and destination competitiveness........ 85
5.6 Effects of branding process on DMO’s performance ......................................... 90
6 CONCLUSION ................................................................................................................. 97
6.1 Summary of the findings ..................................................................................... 97
6.2 Scientific and managerial contributions ............................................................ 100
6.3 Methodological limitations and recommendations for the further research ..... 101
BIBLIOGRAPHY .................................................................................................................. 103
APPENDICES
iii
LIST OF TABLES
Table 1: DMO managerial tasks ............................................................................................... 14
Table 2: Key theoretical concepts of the dissertation............................................................... 42
Table 3: The list of Croatia’s counties and destinations that participated in the TOMAS
Summer Survey 2010 ............................................................................................................... 55
Table 4: The list of Croatia’s counties and destinations that participated in the primary data
collection .................................................................................................................................. 56
Table 5: Existence of planning documents on a destination level (tourism development
plan, marketing plan and/or promotional plan) in surveyed destinations ................................ 67
Table 6: Limitations related to the branding strategy in surveyed destinations ....................... 68
Table 7: Existence of clearly defined destination brand in destination strategic planning
documents ................................................................................................................................. 68
Table 8: Inclusion of brand strategy in strategic planning documents in surveyed
destinations ............................................................................................................................... 69
Table 9: Existence of destination brand definition in surveyed destinations ........................... 69
Table 10: Mean importance of selected elements of destination supply for its
competitiveness ........................................................................................................................ 70
Table 11: Rescaled loadings for extracted principal component ............................................. 72
Table 12: Relationship between BiPs and tourist satisfaction based on IPA scores ................ 75
Table 13: Comparison of mean difference in satisfaction with and importance of different
destination attributes between destinations with above average and below average values
of BiPs index ............................................................................................................................ 76
Table 14: Mean differences in satisfaction-importance scores between destinations with
above average and below average values of BiPs index .......................................................... 76
Table 15: Ranking the elements of tourism supply by importance and derivation of DiPs
index for Poreč as the best performing destination in Istria County ........................................ 78
Table 16: Ranking the elements of tourism supply by importance and derivation of DiPs
index for Opatija as the best performing destination in Primorje-Gorski Kotar County ......... 79
Table 17: Ranking the elements of tourism supply by importance and derivation of DiPs
index for Novalja as the best performing destination for Lika-Senj County ........................... 80
Table 18: Ranking the elements of tourism supply by importance and derivation of DiPs
index for Vir as the best performing destination for Zadar County ......................................... 81
Table 19: Ranking the elements of tourism supply by importance and derivation of DiPs
index for Vodice as the best performing destination for Šibenik-Knin County ....................... 81
Table 20: Ranking the elements of tourism supply by importance and derivation of DiPs
index for Baška Voda as the best performing destination for Split-Dalmatia County ............. 82
Table 21: Ranking the elements of tourism supply by importance and derivation of DiPs
index for Dubrovnik as the best performing destination for Dubrovnik-Neretva County ....... 83
iv
Table 22: Values of DiPs indexes by destination ..................................................................... 84
Table 23: Relationship between DMO’s performance and tourist satisfaction based on
IPA scores ................................................................................................................................ 87
Table 24: Comparisons of mean difference in satisfaction with and importance of different
destination attributes between destinations with above average and (below) average DMO
performance .............................................................................................................................. 88
Table 25: Mean differences in satisfaction-importance scores between destinations with
above average and below average DMO’s performance.......................................................... 89
Table 26: Brand strategy and SWOT analysis by DMO’s performance .................................. 90
Table 27: Effect of branding process elements on DiPs index ................................................ 92
Table 28: Univariate effects of branding process elements on DMO performance ................. 92
Table 29: Correlation between branding process elements ...................................................... 93
Table 30: Effect of destination brand building on DMO’s performance ................................. 93
Table 31: DiPs and BiPs indices for destinations .................................................................... 95
Table 32: Comparison of average values of BiPs index between destinations with above
average and below average values of DiPs index (results of t-test) ......................................... 96
v
LIST OF FIGURES
Figure 1: Example of primary tourism destination .................................................................. 12
Figure 2: Levels of place marketing ......................................................................................... 19
Figure 3: Relation between efficiency, performance, importance and competitiveness .......... 30
Figure 4: Major variables that influence tourism destination competitiveness ....................... 35
Figure 5: Conceptual model of destination competitiveness ................................................... 47
Figure 6: Suggestions for the modification of the Conceptual model of destination
competitiveness ........................................................................................................................ 48
Figure 7: Integrated Model of Destination Competitiveness ................................................... 48
Figure 8: Suggestions for the modification of the Integrated Model of Destination
Competitiveness ....................................................................................................................... 49
Figure 9: Hypotheses model ..................................................................................................... 50
Figure 10: Scree plot ................................................................................................................ 72
Figure 11: IPA plot of elements of destination supply by BiPs index ..................................... 74
Figure 12: IPA plot of elements of destination supply ............................................................. 87
Figure 13: Difference in distributions of DiPs indexes between destinations with strong
and weak performance in branding process elements .............................................................. 91

vi
Chapter 1: Introduction
1
1 INTRODUCTION
Travel and tourism are one of the world’s largest and fastest growing industries, significantly
contributing to the employment, foreign exchange earnings and gross domestic product (GDP)
of many countries, particularly smaller and less developed countries, such as Croatia.
According to the data available from World Travel and Tourism Council (WTTC, 2013), total
contribution of travel and tourism to the world GDP was USD 6,630.4 billion in 2012 (9.3% of
total), and it is forecasted to rise by 4.4% annually in the next ten years. Additionally, in 2012
travel and tourism, directly and indirectly (including jobs created by the supporting and related
industries), generated about 261.4 million jobs, representing 8.7% of total employment, which
is expected to rise by 2.4% by 2023 (WTTC, 2013). Finally, in 2012 tourism generated about
USD 1,243 billion of foreign exchange earnings (or USD 3.4 million per day), which was 5.4%
of total exports in 2012 (WTTC, 2013). According to the WTTC (2013), travel and tourism
foreign exchange revenues are expected to grow by 4.2% annually by the year 2023. It should
also be emphasized that, according to the WTTC data, travel and tourism related investments
amounted to USD 764.7 billion in 2012 (4.7% of total investment) and are expected to rise by
5.3% annually in the next ten years (by 2023).
Tourism is even more important for Croatian economy. According to the Croatian Bureau of
Statistics (2014), Croatia recorded 12.4 million tourist arrivals and 64.8 million tourist
overnights in 2013. Croatian National Bank (2014) reported that international tourism receipts
reached EUR 7.2 billion in 2013. It is estimated that direct contribution of tourism to Croatia’s
GDP is approximately 8.3% (Gatti, 2013) while its direct and indirect contribution is around
14.7% (Šutalo, Ivandić and Marušić, 2011). Additionally, tourism activity has strong and
positive influence on total employment, since tourism generates around 7% of total employment
in Croatia. TTCI index showed that Croatia’s tourism is relatively competitive, ranking the 35th
place among 140 analyzed countries in 2013 (WEF, 2013).
Given the large economic contribution of tourism for the economy, it is not surprising that
tourism market is becoming increasingly saturated and highly competitive environment for
tourism destinations. Destinations are under extreme pressure to rejuvenate in order to remain
competitive and to secure long term sustainable market positions on the global tourism market.
Put it differently, destinations must be attractive, innovative, different and original. Thus, is not
surprising that destination competitiveness, as well as its underlying factors, have been in the
Chapter 1: Introduction
2
focus of travel and tourism research for a relatively long time. Tourism researchers are
constantly developing and improving models of destination competitiveness. As the current
body of knowledge is constantly expanding and evolving, new factors that might potentially
influence destination competitiveness are emerging and being tested empirically. Therefore,
one of the main objectives of this dissertation is to explore the relatively recent concept of
destination branding and its influence on tourism destination competitiveness. One of the main
arguments of the dissertation is that destination branding is one of the key factors for achieving
destination competitiveness. However, this position is still not widely accepted in the tourism
research literature, resulting in the fact that destination branding is still not an integral part of
any of the frequently cited and generally accepted models of destination competitiveness
(Dwyer and Kim, 2003; Gooroochurn and Sugiyarto, 2005; Heath; 2003; Ritchie and Crouch,
2003). Research conducted in this dissertation is aimed at shedding additional light on this
important topic from the perspective of Croatia’s seaside destinations. Croatia, as a mature
tourism receiving country on a highly competitive Mediterranean tourism market, has to
improve a whole range of factors that are affecting its competitiveness. This includes defining
the role of destination branding in the process of achieving destination competitiveness and
subsequently, developing a brand that would clearly communicate Croatia’s major competitive
advantages on the global tourism market.
1.1 Rationale for the research
Global tourism marketplace is becoming increasingly competitive environment for tourism
destination and destinations are under extreme pressure to differentiate themselves against its
competitors, in an attempt to become unique, recognizable and remain competitive (Krešić and
Prebežac, 2011). Therefore, it comes as no surprise that the global interest for competitiveness
has drawn the attention of tourism researchers to competitiveness in tourism, on destination and
as well as on hotel industry level. Ritchie and Crouch (2003, p. 1), as the world’s most
recognized and most frequently cited destination competitiveness researchers, are claiming that
destination competitiveness is “a manifestation of the broader phenomenon of the new
economic competition and the even broader phenomenon of human competition in social,
technological, cultural and political spheres”. Additionally, Dwyer and Kim (2003) pointed out
that destination competitiveness is linked to destination’s performance, which has to be more
successful than their competitors in aspects of complete tourism experience. Therefore, in order
to be competitive on the global tourism marketplace, destinations have to be innovative,
distinctive and continuously seek new sources of competitive advantages.
Among the important sources of destination competitive advantage are its market uniqueness
and visibility, which can be achieved through the destination branding process. However, even
Chapter 1: Introduction
3
though different determinants and attributes of destination competitiveness and destination
branding have been well studied and meticulously documented throughout the tourism research
literature, a comprehensive and generally accepted theoretical framework, connecting the
notions of destination branding and destination competitiveness, has still not been developed.
Consequently, it can be argued that there is still a lack of knowledge and understanding about
the role that destination branding plays in the process of achieving tourism destination
competitiveness and this represents an important research gap, which is partially addressed by
this dissertation. In order to shed some additional light on the complex relationship between
destination branding and destination competitiveness, selected Croatia’s seaside tourism
destinations are used as a case study.
1.2 Research problem
Having in mind all previously mentioned, the main objective of this dissertation is to investigate
whether destination branding is a factor that influence destination competitiveness and to
investigate the role that destination branding, as a relatively novel concept in tourism theory
and practice, plays within the complex process of achieving tourism destination
competitiveness. Here, it is important to point out that this dissertation applies holistic approach
to the destination branding analysis, without special emphasis on any of the elements of the
destination branding.
In the last thirty years branding has become a very important marketing approach, which
involves wide variety of stakeholders who must collaborate in order to achieve a successful
outcome (Green, 2005). On the other hand, destination branding is still a relatively new research
area, which is explained in more detail in the subchapter 2.2 of this dissertation. Although the
importance of destination branding has been recognized in tourism research literature, most
researches have only focused on destination image and identity (Ahmed, 1991; Baloglu, 1997;
Baloglu and Mangaloglu, 2001; Beerli and Martin, 2004; Dimanche and Moody, 1998; Elliot,
Papadopoulos and Kim, 2011; Govers, Go and Kumar, 2007; Konecnik and Go, 2008; Perdue,
2000; Prebensen, 2007; Stock, 2009; Uysal, Chen and Williams, 2000), which is actually a
product of destination branding. Morgan, Pritchard and Pride (2004) pointed out that a brand
has become one of the key determinants of destination’s success, along with products and price.
Kotler, Bowen and Makens (2006a) also argue that the products and the brands are extremely
important for the success of the destination because they can be utilized as a tool to
communicate destination’s unique identity. Zenker and Braun (2010) see destination brand as
“collage” of associations in the consumer’s mind based on the visual, verbal, and behavioral
expression of a place. The literature review has shown some other perspectives to destination
branding such as customer-based brand equity (Boo, Busser and Baloglu, 2009; Konecnik and
Chapter 1: Introduction
4
Gartner, 2007), and brand loyalty (Oppermann, 2000), both important for the destination brand
measurement.
According to Anholt (2008), countries would not and should not be branded like products
because of their complexity. Still, destination branding process is very similar to product
branding process, except that destination branding is a more complex process due to the variety
of stakeholders involved in the process. Destination branding process certainly leads to
destination’s better performance, same as the strong brand leads to competitive advantages (Lee
and Back, 2010). However, a clear relationship between destination competitiveness and
destination branding is still not clear. It is only partially mentioned in the two most known
destination competitiveness models – a general model of destination competitiveness proposed
by Ritchie and Crouch (2003) and the Integrated Model of Destination Competitiveness
proposed by Dwyer and Kim (2003). According to Ritchie and Crouch’s model,
positioning/branding is a part of destination policy, planning and development dimension, while
Dwyer and Kim recognized destination positioning and clarity of destination image as variables
that influence destination competitiveness, but they don’t discuss destination branding process
explicitly.
Pike (2009) recognized three main potential research gaps in destination branding researches:
1. Destination brand identity development,
2. Destination brand positioning, and
3. Destination brand equity measurement and tracking.
Some of the issues that have to be explored are related to better understanding of destination
brand decision making, unified brand “umbrella” strategies, appropriate brand positioning, the
importance of customer relationship management (CRM) for destination loyalty, brand slogans
and logos effectiveness, and destination brand performance measurement. Zenker and Martin
(2011) pointed out that according to the place marketing practice, destination branding is still
limited in approaches aimed at measuring the success of destination. Referring to the literature,
they argued that the measurement of destination’s success is not often performed on regular
basis. Marketers mostly limit their data to key figures and indicators (such as tourist overnight
stays or press clippings) due to the high costs of more comprehensive methods. So, the question
of efficiency and effectiveness of the place marketing activities and their influence on
destination competitiveness remain unanswered.
Since there is a lack of empirical evidence of destination branding as a destination
competitiveness factor in the tourism research literature, destination branding performance and
effectiveness could be identified as major gaps in the current body of knowledge. Therefore, it
should be emphasized that destination branding should be explored in more detail in future
Chapter 1: Introduction
5
research, while destination competitiveness models should be extended with the branding as a
factor of tourism destination competitiveness.
1.3 Research goal and research questions
According to the previously mentioned, it is clear that, on one hand, destination branding is an
important factor of destination competitiveness, but, on the other hand, there is still limited
understanding of how destination branding affects the overall level of destination
competitiveness. Therefore, the main research questions stem from the previously defined
research gap related to the unclear and vague relationship between the concepts of destination
branding and competitiveness, but can also be anticipated from the dissertation topic as well as
from the analyzed literature. The goal of this dissertation is to provide answers to the following
research questions:
RQ1: What are destination competitiveness factors and models?
RQ1A: This research question will be answered in the form of literature review.
RQ2: How is destination competitiveness measured?
RQ2A: This research question will be answered in the form of literature review.
RQ3: What is destination branding?
RQ3A: This research question will be answered in the form of literature review.
RQ4: Are those tourism destinations which implement destination branding more competitive
than those which don’t?
RQ4A: The answer to this research question will be based on the results of the exploratory
research.
The answers to previously formulated research questions should provide a useful informational
basis for assessment of the branding process as a tourism destination competitiveness factor.
This could contribute to the advancement of the existing body of knowledge, and, on the other
hand, might help improve tourism destination competitiveness.
1.4 Expected scientific contribution
The scientific contribution of the dissertation relates to the advancement of the existing body
of knowledge from the field of destination branding and destination competitiveness. The
Chapter 1: Introduction
6
suggested improvements of destination competitiveness model, related to introduction of
branding as a destination competitiveness factor, will try to provide new insights into current
body of knowledge connecting destination branding and competitiveness and attempt to fill the
existing research gaps in destination branding and destination competitiveness literature.
Furthermore, the expected managerial contribution of the dissertation stems from the fact that
the research results should be useful to the destination management experts when making long
term, strategic decision concerning tourism destination development using the improved model
of destination competitiveness.
1.5 Dissertation structure
In addition to Introduction, this dissertation is structured into six chapters. First chapter consists
of the rationale for the research, research problem, research goal and research questions,
expected scientific contribution and dissertation structure. Second chapter provides systematic
and comprehensive literature review from the fields relevant for the topic of this dissertation,
including general tourism literature, brand and destination branding literature, and
competitiveness and destination competitiveness literature.
The third chapter represents the central and most important part of the dissertation. By
explaining the relation between destination branding and destination competitiveness, it
provides methodological framework and theoretical underpinning for the conducted research,
defines the research model and hypotheses. It also provides suggestions for the improvements
of the current destination competitiveness models by introducing destination branding as a
factor of tourism destination competitiveness. Fourth chapter describes research methodology
which includes desk and exploratory research. This chapter also includes study setting which
describes research sample in more detail.
Fifth chapter provides the analysis and interpretation of research results. Additionally, this
chapter includes testing of previously defined research hypothesis. The goal of this chapter is,
through research result analysis and hypothesis testing, to determine whether the theoretical
foundation of the idea proposed in this dissertation is sound and viable. Finally, conclusions
and recommendations for further research are presented in the sixth chapter.
Chapter 2: Literature review
7
2 LITERATURE REVIEW
Having in mind the need for comprehensive and systematic overview of theoretical framework
used in this dissertation, the concept of tourism destination, as a framework of modern tourism
research, is defined in the first part of the Chapter 2. This is followed by the insight into the
notion of general marketing literature that includes topics such as brand definition, branding
process and branding at the tourism destination level. Besides literature related to tourism
destination and marketing literature, literature review also covers tourism competitiveness and
an overview of factors that are affecting the competitiveness of tourism destination. In order for
the dissertation to be completely underpinned by an appropriate theoretical framework, the
literature review also includes measurement of competitiveness, as well as tourism destination
competitiveness models.
2.1 The concept of tourism destination
The term destination originates from the Latin word destinatio and in its original form has been
used as a synonym for a final point of travelling. This term has entered tourism from transport
sector, especially air transport, which uses an English term that foremostly denotes the furthest
and final point of air travel (Hitrec, 1995). The term tourism destination has evolved from terms
such as tourism region, tourism zone, or tourism place, mostly used by spatial planners and
geographers, thus giving a wider and new meaning to the term destination in modern tourism
theory and practice. According to Bartoluci (2013), a tourism region is a geographical area that
is characterized by common characteristics and synergy between tourism products and services,
but also political-administrative boundaries in which tourism planning and tourism policy are
being implemented. Furthermore, a tourism place represents a functional and spatial unit and
does not necessarily need to match administrative boundaries of the place. On the other hand,
tourism destination can be viewed as a wider integrated geographical area of one or more
tourism places that comprise a functional spatial unit and does not need to match administrative
boundaries of a certain place, and is dominantly conditioned by visitors’ wishes, tendencies and
interests (Vukonić and Čavlek, eds., 2001). Today, tourism destination has become the focal
point of contemporary tourism system management as well as tourism research.
Chapter 2: Literature review
8
2.1.1 Tourism destination earlier concept
Many issues related to spatial planning and environmental protection have emerged from the
phenomenon of mass tourism, which led researchers and tourism development planners to try
and define, in certain spatial limits, behavior rules for tourist and their hosts, as well as to
quantify all the necessary infrastructural and carrying capacities a ratio of the number of visitors
and spatial unit area (Kušen, 2002). The previously used term “tourism place” was not sufficient
for a precise definition of a tourism product, market sales and communication activities.
Therefore, an appropriate spatial unit was required, which would contain enough elements to
launch it on the market as a unique and complete product (Kušen, 2002).
The term tourism destination, as we know it today, emerged in the scientific and professional
literature in 1970s. Gunn (1972) was one of the first authors who tried to define the tourism
destination, suggesting the classification of the so-called tourism destination zones as urban,
radial and extended zones. His classification was used as an important starting point for other
authors in defining a tourism destination. From a historical point of view, for a long time
tourism places met tourists’ needs with their supply, while ensuring profit for local population
(Hitrec, 1995). The emergence of tourism places caused by an increasing economic significance
of tourist consumption, which affected the level of awareness about the need to promote tourist
trends, which led to increased investments in accommodation facilities and other elements of
tourism offer necessary to attract and host tourists (Jovičić, Jovičić and Ivanović, 2005). Later
on, the term tourist region was developed, i.e. a geographical area characterized by common
features and synergy between tourism products and services and political-administrative
boundaries within which tourism planning and policy are implemented (Čavlek, Bartoluci,
Prebežac, Kesar et al., 2011).
Evolution of the notion of tourism destination has its grounds in the term tourism resort/tourism
place. In order to be attractive to tourists, destination needs to possess essential attributes, such
as attractive resources, intensity and continuity of visits, as well as a certain level of
consumption which ensures prosperity for the local residents (Kušen, 2002). Tourism places
were classified as coastal, mountain, climate, lake, cultural-historical etc., depending on tourism
potentials, as well as on conditions and legislatives in a certain country (Hitrec, 1995). The
official announcement of certain places as tourism places is considered to be a milestone in the
history of tourism development, which started in the late 19th and early 20th century in Croatia.
For example, under the Health Act from 1906, several recognized maritime spa centers, such
as Opatija, Lošinj, Crikvenica, Dubrovnik and Cavtat, were already famous in the Austrian-
Hungarian Empire (Hitrec, 1995), while the first accommodation facility built for tourist
purposes, was Villa Angiolina in Opatija, finished in 1844. In the second half of the 19th century

Chapter 2: Literature review
9
tourism started spreading in neighboring countries of Slovenia and Bosnia and Herzegovina.
Lake Bled had an open guesthouse Pri Mallnerju in 1848, on the location of today’s Hotel Park.
The Badehaus baths, the forerunner of today’s Hotel Toplice, was opened in 1853. The famous
Hotel Evropa in Sarajevo was built in 1882 and in 1892 the Tourist Club was founded. Tourism
development was within the jurisdiction of the government, which funded the construction of
guesthouses and mountain houses in the alpine regions (Kranjčević, 2012). The emergence of
tourism products in a certain tourism place resulted with the development of a tourism
destination, as a functional spatial unit larger than a tourism place, which ensured the following
(Vukonić, 1995):
• A general better usage of space designated for tourism,
• Economic valorization of tourism resources,
• Creation of a more complex supply for potential tourists,
• Possibility for creation of a tourism identity and recognizable image on a tourism market,
• Better presentation and placement of such a spatial unit on domestic and foreign tourism
market, and finally
• A guarantee for tourists that, in a larger spatial unit, their stay will be more eventful,
which is an important, almost crucial criterion for a decision making process on whether
to visit that or some other area.
Adding up to the theoretical aspects of destination research in tourism, it can be concluded that
over the last 30 years researchers have primarily focused on a concept of tourism destination
which influenced a development of various theories related to destination management,
destination marketing, destination attractiveness, destination competitiveness etc. According to
Krešić (2009), majority of destination research does not investigate the notion of tourism
destination itself, but its physical, temporal and economic characteristics. On the other hand,
earlier authors (Čomić 1988; Gunn, 1972; Marković and Marković, 1972) discuss about tourism
place, primarily within its geographical characteristics, while Cooper, Fletcher, Fyall, Gilbert
and Wanhill (2008) claim that one of the principle barriers for defining tourism destination is
the inconvenient nature of administrative, political or geographical boundaries.
2.1.2 Contemporary understanding of tourism destination
A modern concept of a tourism destination is significantly different from the earlier concepts.
Tourism destination is associated with places and areas defined by certain administrative
boundaries, the formation which was influenced by ownership of land, means of land usage,
geographical and morphological features of a space, as well as important political events. In
contrast to this, the contemporary concept of a tourism destination sets off a destination as a
spatial unit that is visited and used by tourists, regardless of its administrative boundaries that
Chapter 2: Literature review
10
are, in this case, a result of market acceptance and valorization of a certain destination (Jovičić
et al., 2005). According to Kušen (2010, p. 412), “tourism destination is a clearly defined
geographical area; it is always a part of the area strongly marked by distinctive physical
features, potential and real tourism attractions and spatial relations between them and other
tourist attractions”. According to Jafari (2000), tourism destination is a place where tourists
intend to spend their time away from home. That might be a self-contained center, or a village,
a town, a region, an island or a whole country. Also, destination may be a single location or a
set of multi-destinations as part of a tour such as a cruise. According to Medlik (2003), tourism
destination is a main location of tourist activity with a tendency of occupying tourists’ time
which will consequently increase their intention for spending. From consumer’s perspective,
tourism destination is the principal motivating factor behind the consumer’s decision and
expectations (Cooper et al., 2008).
Kušen (2010) claims that today’s generally accepted definitions of tourism destination are
mainly in the function of marketing and less in the function of physical, geographical, and long-
term tourism development. According to Buhalis (2000), tourism destination is a place that
offers different tourism products and services which are under the same brand name in order to
offer an integrated experience to tourists. Harris and Leiper (1995) argues that tourism
destinations are places that people travel to and decide to stay in for a certain period of time in
order to attain a certain experience. While previous definitions, according to Kušen’s claims,
are oriented more on marketing, Čavlek et al. (2011), define a tourism destination from a
tourism economics point of view. According to them, tourism destination represents a space of
temporary tourist stay, a space where tourism activity is conducted and where tourism products
are being consumed, i.e. a space where tourism supply and demand are met.
Generally speaking, tourism destination is commonly defined as an administrative or
geographical area visited by tourists because of certain benefits expected from such temporary
stay. It is a place that is characterized by the real or imagined boundaries that may be natural
boundaries (e.g. between the islands), political boundaries or boundaries created by the market
(Jafari, 2000; Kotler et al., 2006a; Williams and Hall, 2000). For example, a tourist from Japan
or China perceive the Mediterranean as a single tourism destination, especially if, during his/her
trip, more Mediterranean countries are visited. Likewise, tourists from the USA or Northern
Europe often see former Yugoslav countries as a single tourism destination (Krešić, 2009).
Weber and Mikačić (2004) define tourism destination in a similar way. According to them, it
is a spatial unit (autonomous tourism object, settlement, city, region, island, country or
continent) which implies a destination of a tourist travel and enables tourist arrivals and stay
with its capacity.
Chapter 2: Literature review
11
Previously mentioned definitions of tourism destination are mostly representing a scientific
approach of defining this important term. More professionally oriented and technical definition
of tourism destination is provided by the UNWTO (2007, p. 1), which claims that tourism
destination is “a physical space in which a tourist spends at least one overnight. It includes
tourism products such as support services, attractions and other tourist resources within one
day’s return travel time. It has physical and administrative boundaries defining its management,
but also images and perceptions defining its market competitiveness. Local destinations
incorporate various stakeholders often including a host community, and can nest and network
to form larger destinations”. From definition provided by the UNWTO (2007) it is possible to
extract several elements necessary for an area to be considered as a tourism destination:
• Tourism destination must have clearly defined administrative boundaries or borders
defined on the basis of their tourism resources and attractions, such as national parks,
• Tourism destination must have a defined image and certain abstract characteristics and
qualities that can contribute to a clear definition of a destination brand, and
• Tourism destination must be an area where the local community is ready to develop
tourism and where different tourism activity stakeholders find it convenient to cooperate.
In brief, “tourism destination represents a flexible, dynamic space, whose boundaries define the
market itself, regardless of administrative boundaries” (Dulčić, 2001, p. 119). In accordance
with the current explanations of a tourism destination, one can conclude that a tourism
destination implies a market-adjusted area with optimally compliant system of elements and
functions, which, through development of important and dominant features, create conditions
that will lead to beneficial and competitive tourism results in the long run.
2.1.3 Types of tourism destinations
Starting from the definition and the criteria that define tourism destination, various authors
(Buhalis, 2000, Kotler et al., 2006a; Mihalič, 2008; Vukonić, 1995) provide different
classification of tourism destination: (i) homogenous and heterogeneous, (ii) macro and micro,
(iii) traditional, (iv) location-defined destinations, and (v) destinations defined by a basic
attractions. Mihalič (2008) differs monovalent, bivalent and polyvalent tourism destinations.
Monovalent tourism destinations have limited tourism resources and attractions, thus usually
developing only one type of tourism and consequently having a relatively low occupancy rate.
Bivalent tourism destination have two distinctively different types of tourism resources and
attractions which are appealing to tourists in the different periods of the year, therefore having
two peak tourism seasons, e.g. summer and winter. Polyvalent tourism destinations are not
characterized by the seasonality of tourism demand, tourism activity is intensive throughout the
year and those destinations have high occupancy rate, usually above 70%.
Chapter 2: Literature review
12
The UNWTO (2007) also distinguishes three types of destinations: (i) remote destination – the
furthest place away from the domicile, (ii) main destination – a place where most time was
spent and (iii) motivational destination – a place visitors consider a primary goal of their visit.
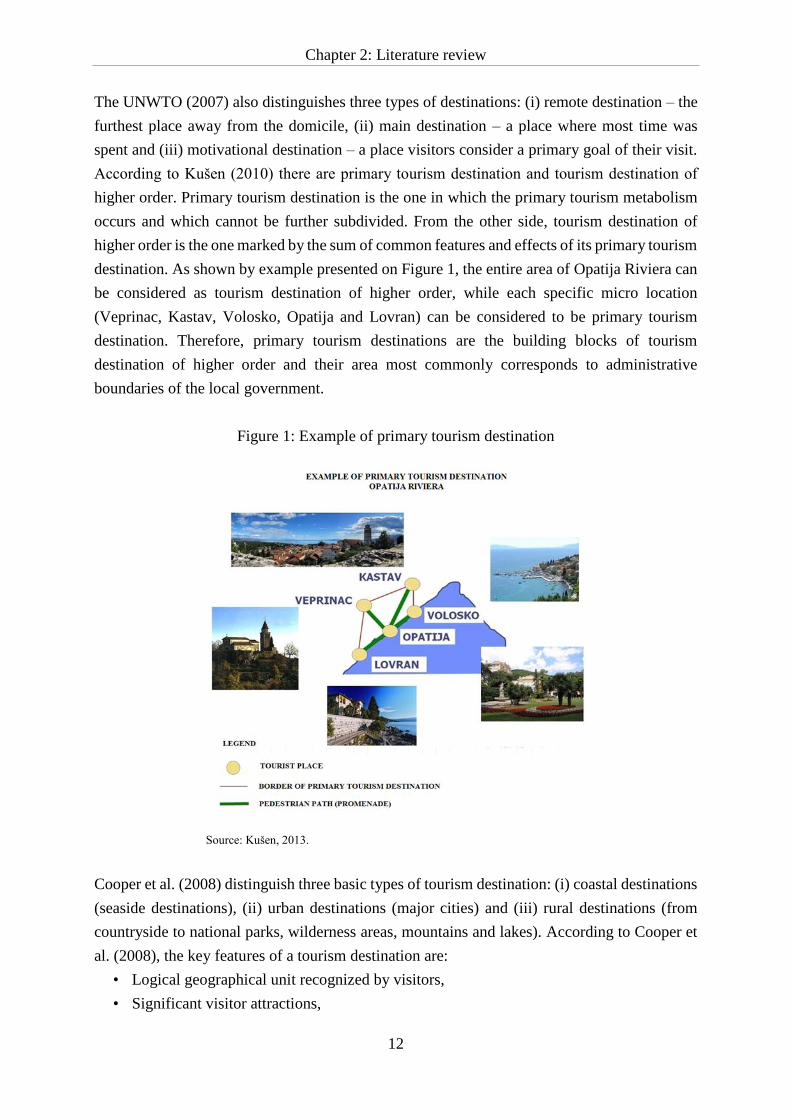
According to Kušen (2010) there are primary tourism destination and tourism destination of
higher order. Primary tourism destination is the one in which the primary tourism metabolism
occurs and which cannot be further subdivided. From the other side, tourism destination of
higher order is the one marked by the sum of common features and effects of its primary tourism
destination. As shown by example presented on Figure 1, the entire area of Opatija Riviera can
be considered as tourism destination of higher order, while each specific micro location
(Veprinac, Kastav, Volosko, Opatija and Lovran) can be considered to be primary tourism
destination. Therefore, primary tourism destinations are the building blocks of tourism
destination of higher order and their area most commonly corresponds to administrative
boundaries of the local government.
Figure 1: Example of primary tourism destination
Source: Kušen, 2013.
Cooper et al. (2008) distinguish three basic types of tourism destination: (i) coastal destinations
(seaside destinations), (ii) urban destinations (major cities) and (iii) rural destinations (from
countryside to national parks, wilderness areas, mountains and lakes). According to Cooper et
al. (2008), the key features of a tourism destination are:
• Logical geographical unit recognized by visitors,
• Significant visitor attractions,
Chapter 2: Literature review
13
• Access or possible provision of access,
• Internal transport network,
• Tourist infrastructure and superstructure are present or can be developed, and
• Administratively possible to plan and manage.
In accordance with the dissertation topic, it is important to mention that Croatian legislation
defines the criteria for the classification of towns and municipalities as tourism destinations
(Official Gazette, 152/08). Legislation uses the level of their overall tourism development as
the criteria for their classification into four tourism classes (A, B, C and D). Those criteria
include quality as well as quantity indicators. Quantity indicators for classification include a 5-
year average number of overnight stays, tourism traffic intensity coefficient, the specific
tourism turnover coefficient and a 5-year average of tourist overnight stays in a municipality,
city or town per bed or housing unit. Quality indicators include tourist and accommodation
capacities of an adequate quality, level of infrastructure development, wealth of natural and
cultural heritage, the condition of health protection organization, place picturesque as well as
additional supply such as sport, culture, shopping etc.
2.1.4 Tourism destination management
In order to achieve certain economic and other benefits, tourism destination development must
be properly managed. According to Buhalis (2000) tourism destination management can be
defined as a set of managerial practices aimed at creating a common platform for achieving a
wide variety of strategic objectives within a destination, with the ultimate goal of satisfying the
needs and wants of different tourism development stakeholders. Destination management
includes the management of tourism supply side, i.e. management of the sites and amenities
available to tourists as well as management of the tourism demand side, i.e. management of
tourism inflows and tourists satisfaction (Goeldner and Ritchie, 2003). Destination
management organizations (DMOs) as a para-state bodies, have a crucial role in the process of
stakeholders networking since they are connecting all the relevant tourism development
stakeholders within a given tourism destination.
According to some authors (Dwyer and Kim, 2003; Ritchie and Crouch, 2003), the process of
tourism destination management is one of the destination competitiveness factors. Ritchie and
Crouch (2003) claim that destination management consists of a total of nine components, listed
as follows:
• Organization,
• Marketing,
• Quality of service/experience,
Chapter 2: Literature review
14
• Information research,
• Human resources development,
• Finance and venture capital,
• Visitor management,
• Resource stewardship, and
• Crisis management.
According to above mentioned components, destination management organization must
effectively perform many tactical functions that require close daily attention in order to
maintain the competitiveness of the destination for which it is responsible. Contemporary
approach to tourism destination management suggests that destination should be managed by
an organization which should encompass a tourist board, travel agencies, hotels, restaurants,
room renters, various entrepreneurs related to tourism, boat owners and other stakeholders in a
destination who participate in the tourism system (Bartoluci, 2013). There are three
fundamental levels on which a DMO most commonly functions – the national level, the
regional/provincial level, and the urban/municipal/city level. The basic roles of a DMO are
generally similar at all destination levels and they include different internal and external tasks
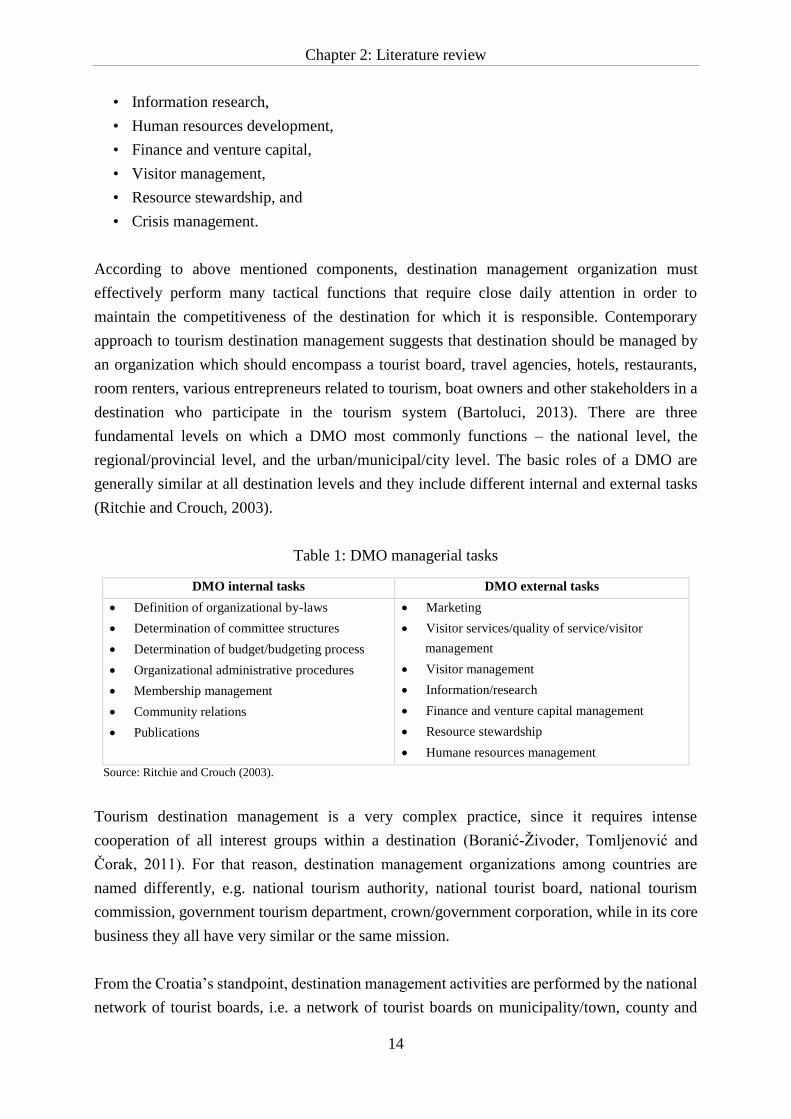
(Ritchie and Crouch, 2003).
Table 1: DMO managerial tasks
DMO internal tasks DMO external tasks
Definition of organizational by-laws
Determination of committee structures
Determination of budget/budgeting process
Organizational administrative procedures
Membership management
Community relations
Publications
Marketing
Visitor services/quality of service/visitor
management
Visitor management
Information/research
Finance and venture capital management
Resource stewardship
Humane resources management
Source: Ritchie and Crouch (2003).
Tourism destination management is a very complex practice, since it requires intense
cooperation of all interest groups within a destination (Boranić-Živoder, Tomljenović and
Čorak, 2011). For that reason, destination management organizations among countries are
named differently, e.g. national tourism authority, national tourist board, national tourism
commission, government tourism department, crown/government corporation, while in its core
business they all have very similar or the same mission.
From the Croatia’s standpoint, destination management activities are performed by the national
network of tourist boards, i.e. a network of tourist boards on municipality/town, county and
Chapter 2: Literature review
15
national levels. The tasks of tourist board network in Croatia are defined by the Act on Tourist
Boards and Promotion of Croatian Tourism (Official Gazette 152/08) and the simplified
description of their common activities and tasks is provided by Magaš and Meler (2013).
According to mentioned authors, the main activities that should be performed by the Croatia’s
tourist board network include tourism promotion, development of new tourism products, and
innovation of existing tourism products for those areas for which they were established. Another
important function of tourist board network is to raise the level of public awareness regarding
the importance of economic, social and other effects of tourism development as well as the level
of public awareness regarding the need for the sustainable tourism development, especially the
importance of sustainable use of natural and cultural heritage.
According to the Strategic marketing plan for Croatian tourism 2014-2020 (CNTB, 2014a),
CNTB’s Central office should become a marketing agency and there should be 10 regional
management organizations and 10 tourism regions defined by the Marketing plan from 2008
(CNTB, 2008). DMOs should replace the existing municipality/town tourist boards. DMO’s
key tasks would be tourism products development, promotion, informing and research, which
is basically very similar to the existing tasks of municipality and town tourist boards.
Considering the increasing role of branding in achieving the overall competitiveness of tourism
destination, Croatian National Tourist Board has decided to make significant changes in this
regard. In 2014 CNTB launched a tender for the development of an umbrella branding
communication concept called “Big Idea”. The main goal of the communication concept is to
improve the existing Croatian tourism brand and to strengthen the sub-brands of Croatian
destinations and regions (CNTB, 2014b). Although the branding is one of the activities of
Croatian National Tourism Board and its subsidiaries, herby, with the communication concept
“Big Idea”, role of branding has been reinforced.
2.2 Destination branding
Today, every country, region and city must compete with others for its share of the world's
economic, political, social and cultural visibility in the market which can be characterized as
mostly intangible assets (ETC/UNWTO, 2009). Tourism destinations will have a short lifecycle
if they don’t manage their products and services properly (Kotler, et al., 2006a). In order to be
widely recognized, destinations don’t need to have some spectacular attractions like the Eiffel
Tower or Great Wall of China, it is more important that the existing attractions are managed
properly and innovatively and in accordance with the current destination management trends
(Kotler et al., 2006a). Countries that have a bad reputation for being underdeveloped, unsafe or
corrupted will face many problems while trying to create positive and encouraging environment
for potential target markets. On the other hand, countries with the positive reputation can
Chapter 2: Literature review
16
achieve these goals much easier. That is the reason why the concept of place branding, and its
sub-sector tourism destination branding has become very important issue. Because of the place
branding, Switzerland is today recognized as safe country, a country of wealth, watches and
precision mechanics which is ideal for foreign investments. Additionally, based on this positive
image, Switzerland has built recognizable tourism brand based on its main competitive
advantages such as beautiful nature, the mountains, chocolate, cheese, etc. In a similar manner,
France is internationally recognized as a country where life can be enjoyed to the fullest because
of fine wines, superb cuisine and high-end luxury products and fashion (Miličević, Skoko and
Krešić, 2012). Having in mind all previously mentioned as well as in the context of the theme
of this dissertation, the basic concepts important for understanding destination branding process
such as brand, place branding and destination branding are analyzed in detail in the next section.
2.2.1 Definition of brand
The term brand appeared during the 1970’s in marketing papers about positioning and many
professionals were protesting due to the similarity of branding concept and the positioning
concept (Kotler and Lee, 2007). According to American Marketing Association (2012), brand
is a “name, term, design, symbol, or any other feature that identifies one seller’s goods or
service as distinct from those of other sellers”. According to Kotler and Keller (2012), elements
of the brand are its features that can be protected by trademark, brand names, URLs, logos,
symbols, characters, spokespersons, slogans, advertisements and are used to identify and
distinguish brand on the market. Although the product might have a name, a trademarked logo,
unique packaging and other design features, a brand does not necessarily have to exist in the
mind of the consumers (Holt, 2004). According to Holt, names, logos and designs are the
material makers of the brand. If the product does not yet have a history, those markers can be
empty. From the other side, famous brands also have markers, but these markers have been
filled with customer experiences. Brand identity encompasses the entire spectrum of
consumers’ awareness, knowledge and images of the brand as well as the company behind it.
It is the sum of all points of encounter or contact that consumers have with the brand, and it
extends beyond the experience or outcome of using it (Belch and Belch, 2007). Brands identify
product manufacturer and they also enable costumers, whether they are individuals or
organizations, to assign specific quality attributes to the manufacturer or a distributer (Kotler
and Keller, 2012). At the same time brands also have important functions within the company.
First of all, brands simplify the process of product handling. Furthermore, brands can help in
organizing the inventory and organizing the accounting data. According to Kotler and Keller
(2012), brands also provide the opportunity for the company to legally protect the unique
features of the product.
Chapter 2: Literature review
17
The concept of branding refers to the transfer of the organization’s values (company, destination
etc.), mission and vision to the employees and clients. Factors that are contributing to the brand
creation decision are (Kotler, et al., 2006a):
1. The development of brand name is a key element in the development of its identity. Brand
name should suggest something about the benefits and attributes of the product, it should
be easily pronounced, recognized and remembered, it should be distinctive, it should be
easily translatable into a foreign languages and it should be possible to register and legally
protect the brand name.
2. The brand name draws its value from the consumer’s perception while brand attracts
consumers by developing good quality and value.
3. To be successful, brands with more units have to develop systematic standards in order
to meet consumers’ expectations. If a brand is successful in quality image development,
consumers will expect the same quality in all units that are positioned under same
umbrella brand. Inconsistency in standards will decrease the brand value, therefore,
consistency and standardization are the key factors for success of any brand.
4. New product is being developed to meet the needs of a certain market segment.
Subsequently, the product can be additionally developed so it is able to cover more market
segments or the original market segment can grow in size making the product more
important because of the large market share, therefore strengthening the brand value.
5. The creation of brand requires significant expenditures, therefore, in order for company
to justify spending on administration and advertising, the brand must provide the effects
of economies of scale. For example, a company lowers advertising costs because all brand
units reached by advertising can benefit from the promotion.
Well known and accepted brands draw customers on the basis of the product offer that is
embodied in their strategy (Kotler and Keller, 2009; Lazer and Layton, 1999). Strong brands
can simplify the choices that have to be made and increase the satisfaction derived from a visit.
For example, a stay at the Plaza Hotel in New York is a memorable experience simply because
of the power of the brand name and the reputation that goes with it (Lazer and Layton, 1999).
According to the same authors, the strength of a brand depends on:
• Brand loyalty,
• The extent of brand awareness among members of key market segments,
• Perceptions of quality embodied in the brand strategy,
• The appeal of ideas or associations linked with the brand, and
• The use of proprietary brand assets such as trademarks and distribution channel linkages.
Many organizations recognize the importance of integration of marketing communications with
the goal of strengthening the strategic position of the brand and its market value, but still
effective implementation of communication activities remains a great organizational challenge
Chapter 2: Literature review
18
(Magzan and Miličević, 2012). Marketers recognize that in the modern world of marketing
there are many different opportunities and methods for contacting current and prospective
customers to provide them with information about brands. The challenge is to understand how
to use the various integrated marketing communication tools to make such contact and deliver
the branding message effectively and efficiently (Belch and Belch, 2007). The above mentioned
has become important especially when it comes to the brand equity measurement (Vranešević,
2007). Vranešević further argues that the company that sells the brand must correctly determine
its brand equity while the company that is buying the brand is going to return the investment
because of the brand’s potential value.
In order to conceptualize destination branding, it is useful to understand product branding and
corporate branding. All of the above is a part of the product branding which can be seen as a
part of the corporate branding. According to Balmer (2001) corporate brand is the sum of the
corporation’s marketing activities whose goal is to present corporation’s value system and
identity. Schultz and Hatch (2003) define corporate branding in four cycles:
1. Stating the foundation for the corporate brand and linking it to corporate vision,
2. Linking vision to culture and image,
3. Involving stakeholders through culture and image, and
4. Integrating vision, culture and image.
According to the same authors, challenge of corporate branding lies in balancing the conflicts
that corporate branding addresses. It is important for corporations to shift between the opposing
forces during different stages of the corporate branding process. Furthermore, branding process
from the perspective of corporate branding and product branding can be seen as a useful basis
for the place, and specifically, destination branding (Saraniemi, 2009).
2.2.2 From place marketing to place branding
Marketing of the places has become one of the leading economic activity and, in some cases,
the dominant generator of local wealth (Anholt, 2007; Kotler et al., 1993). Places differ in their
histories, cultures, politics, leadership, and particular ways of managing their public-private
relationships and must see itself as competitive with other places in order to retain and enhance
their resources. Places are increasingly competing with other places to attract their share of
businesses and investments, to attract new residents as well as new tourists. Kotler et al. (1993)
claim that main target markets for a place are:
• Visitors,
• Residents and workers,
• Business and industry, and
Chapter 2: Literature review
19
• Export markets.
Place marketing refers to the broad set of efforts by country, regional and city governments,
and by industry groups, aimed at marketing the places and sectors they represent. The intent of
such efforts, typically, is to achieve one or more out of four main objectives: enhance the place’s
exports, protect its domestic businesses from nonresidential competition (for sub-national
places this may include those from other regions in the same country), attract or retain
development factors and generally speaking to position the place favorably, domestically and
internationally, in economic, political and social sense (Papadopoulos, 2004).
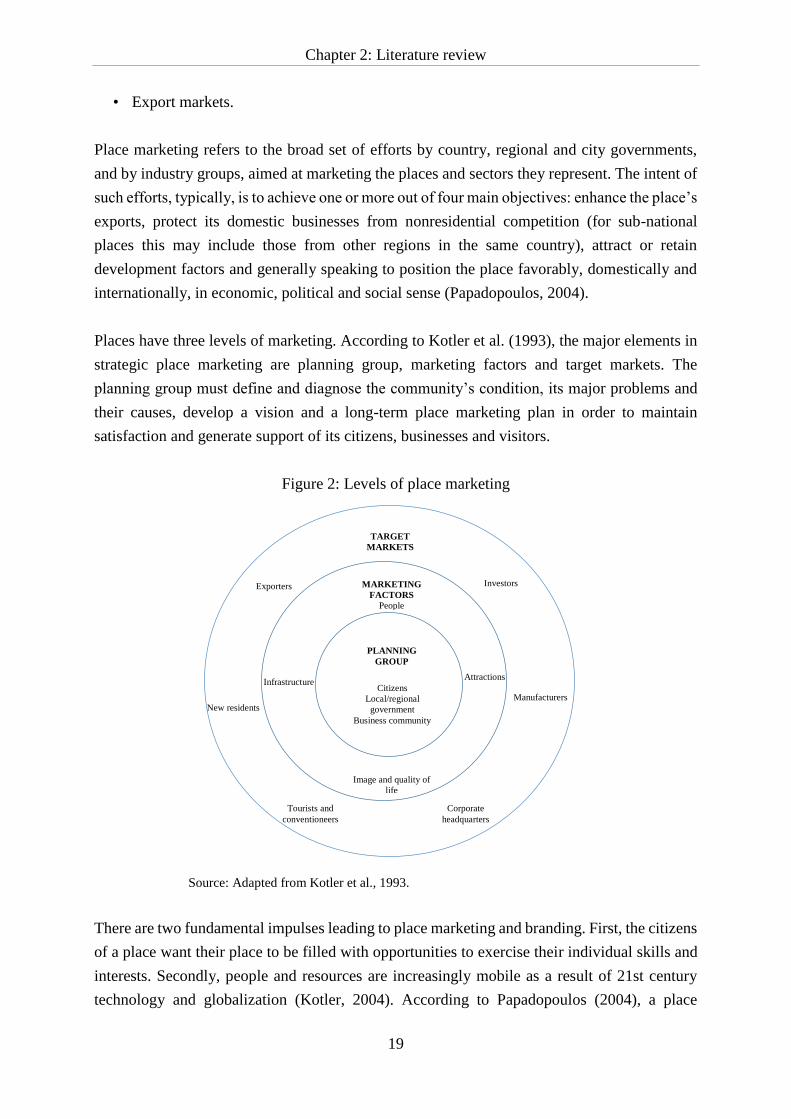
Places have three levels of marketing. According to Kotler et al. (1993), the major elements in
strategic place marketing are planning group, marketing factors and target markets. The
planning group must define and diagnose the community’s condition, its major problems and
their causes, develop a vision and a long-term place marketing plan in order to maintain
satisfaction and generate support of its citizens, businesses and visitors.
Figure 2: Levels of place marketing
Source: Adapted from Kotler et al., 1993.
There are two fundamental impulses leading to place marketing and branding. First, the citizens
of a place want their place to be filled with opportunities to exercise their individual skills and
interests. Secondly, people and resources are increasingly mobile as a result of 21st century
technology and globalization (Kotler, 2004). According to Papadopoulos (2004), a place
TARGET
MARKETS
Investors
Manufacturers
Corporate
headquarters
New residents
Tourists and
conventioneers
Exporters MARKETING
FACTORS
People
Image and quality of
life
Citizens
Local/regional
government
Business community
PLANNING
GROUP
Infrastructure
Attractions
Chapter 2: Literature review
20
branding is becoming commonplace in government circles around the world as well as among
trade association executives. A positive place image, as a result of place marketing and place
branding, is a prerequisite for successful tourism, export or investment (Govers, 2011). From a
place marketing perspective, place brand as umbrella brand can be seen as the corporate brand
versus the category or product brand. As branding has evolved, place branding, while not
necessarily identified by that term, became a significant marketing issue while country image
has been subject to extensive research since the early 1970s (Nebenzahl, 2004).
Parkerson and Saunders (2004) explored the relevance of branding models originally developed
for products and services at the city level by using a city of Birmingham as a case study. The
research results revealed four themes used as a framework for a city brand analysis: namely (i)
the impact of a network on brand models developed for organizations, (ii) segmentation of
brand elements, (iii) corporate branding, and (iv) political dimension. All four themes were
found to be very complex. The research results indicated that brand models developed for
organizations should be modified to suite a network better in the context of city branding. When
it comes to brand elements segmentation, the authors concluded that the Birmingham city brand
can be segmented according to the perceptions of the residents and tourists. These two brand
segments are sharing many of the same brand elements but at the same time the brand promise
for these two groups will be diametrically opposed. Additionally, the authors concluded that
the relation between the brand and its sub-brands is different in the context of city branding.
The main difference is in the decision making process because in the case of city branding there
is no strategic decision maker. Instead, the decision, if and how the city brand will be used, are
made by destination management composed of tourism stakeholders’ representatives. Finally,
the authors concluded that the political dimension (role of local government) is much more
influential in the context of city branding compared to the branding of traditional products or
services.
Place branding should inform place marketing and function as a strategic compass. One needs
to think about how tourism, export or investment policy can contribute to building a strong
corporate brand (Govers, 2011). Finally, it can be concluded that the need for place branding,
as it has surfaced over the last decade and a half, can also be explained as an evolution from
place marketing. Therefore, even though place branding is obviously related to place marketing,
it still represents a separate research area, which is subject to its own theory and practice.
Chapter 2: Literature review
21
2.2.3 Tourism destination branding
Place branding, as a wider approach than destination branding, is mainly induced by the
globalization process, by the appearance and wider utilization of human technologies, typical
of post-industrial economies. From the other side, destination branding, as a new aspect of place
marketing, can help the place to move to a more sophisticated level in their place marketing
practices (Rainisto, 2004). Branding has come a long way since its early days when the brand
was defined as the assignment of a name to products so that they can be uniquely identified
(Nebenzahl, 2004). In today’s global tourism scene, destination marketing and destination
brand development have become strong strategic tools due to the growing competition among
destinations. From the global tourism perspective, countries, along with their names, flags, and
related symbols, represent tourism destination brands (Tasci, Gartner and Cavusgil, 2007). The
ETC/UNWTO (2009) defines “destination brand” as a destination’s positioning in the mind of
potential tourists and destination’s competitive identity. It is what makes a destination
distinctive and memorable and what differentiates it from all others. According to Ritchie and
Ritchie (1998, p. 103) “a destination brand is a name, symbol, logo, word mark or other graphic
that both identifies and differentiates the destination, it conveys the promise of a memorable
travel experience that is uniquely associated with the destination and it serves to consolidate
and reinforce the recollection of pleasurable memories of the destination experience”.
In the last 30 years branding has become a very important marketing approach which involves
many heterogeneous stakeholders who must collaborate in order to achieve a successful
outcome (Green, 2005). On the other hand, destination branding is still relatively recent
research area. The first two articles about the need for destination branding were published by
Croatian authors Ozretić Došen, Vranešević and Prebežac (1998) and by Morgan and Pritchard
(1999). Literature review on destination marketing and destination branding is showing that
this is becoming increasingly popular area of tourism research. Since 1998 when the first papers
on destination branding were published, more than 100 papers and articles covering this topic
has been published (Pike, 2009; Saraniemi, 2009). The focus of the published papers evolved
from the place image, place marketing and place branding topics to destination branding topics,
mostly related to measuring success in destination marketing and branding.
The need for place branding can also be explained as an evolution from place marketing, but
even if place branding is clearly linked to place marketing, it is a separate field of study and
practice in its own right (Govers, 2011). The key of destination branding is that consumers
perceive a difference among brands in a product category because a distinctive and unique
brand is hardly to be replaced by other brands (Qu, Kim and Im, 2011). Morgan et al. (2004),
pointed out that a brand has become the key for destination success, along with products and
Chapter 2: Literature review
22
price. Kotler et al. (2006a), also argue that products and brands are extremely important for the
success of the destination and that the destination must constantly manage its products. In other
words, brand development can be perceived as a way to communicate destination’s unique
identity and considered mutually beneficial from both the supply and demand perspectives
(Pike, 2009).
Since the role of destination branding is to communicate the promise and benefits that the
destination has to offer, the concept of destination branding is becoming more immanent for
the destination management process and therefore a more important factor of the
competitiveness of the destination (Miličević et al., 2012). The need for destinations to promote
a differentiated product is more critical than ever, since today’s leading destinations offer
superb accommodation and attractions, high quality services and facilities and almost every
country as a destination claims unique culture and heritage (Morgan and Pritchard, 2005).
Target groups in destination marketing practice differ, not only with regard to their structure,
but also in their particular needs and demands and it is important to customize destination
marketing to each group (Zenker and Martin, 2011). Destinations are the world’s most under-
realized brands. For many tourists a destination choice is significant lifestyle indicator, and the
places where they choose to spend their squeezed vacation time and hard-earned income
increasingly have to have emotional appeal, high conversational capital and even celebrity
value (Morgan et al., 2004).
According to Anholt (2007), destinations would not and should not be branded like products
because of their complexity. Still, when it comes to destination branding process, there is almost
no difference between product branding, except that destination branding is more complex
process. According to the research conducted by Park and Petric (2006), who interviewed
persons-in-charged in 25 destinations, the main reason for destination branding implementation
were as follows: (i) to build desirable image in order to attract tourists, (ii) to differentiate
destination against its competitors, (iii) to attract high spending tourists, (iv) to manage image,
and (v) to increase economic benefits of tourism as well as the living standard of local
population. Additionally, the authors concluded that the most common measures of branding
effectiveness were level of target markets awareness, perception of a destination, behavior of
tourists and intention to revisit. Today, there is a new view of communications as an interactive
dialogue between the destination and its customers that takes place during the preselling,
selling, consuming and post consuming stages (Kotler et al., 2006a). Destinations have to ask
not only “How can we reach our tourists?” but also “How can our tourists reach us?”. The
importance of marketing communication for every tourism company or destination lies in the
fact that it acts as the “voice” of the brand because it informs, persuades and reminds the
consumers about products that a company or destination sells (Fill, 2006). That is why
communications from tourist boards are seen as a legitimate representation of the country to
Chapter 2: Literature review
23
the global public (Anholt, 2007). Accordingly, tourism is, in most cases, the most important
and most powerful of the nation’s six “booster rockets” (brands, policy, investment, culture,
people, tourism). The rationale behind this line of thought is that tourism offers the opportunity
to brand the country or the destination directly.
2.2.4 Destination branding process
Although the concept of destination branding is similar to the concept of product branding, it
should be stressed that destination branding is more complex process due to the: (i) high
complexity of tourism product, (ii) intangible nature of tourism destination product, and (iii)
large number of different stakeholders involved in the process. Given the fact that tourism
product represents a mix of different products and services, which can be, and usually are
branded separately, destination branding process is more comparable to corporation branding
process aimed at creating an umbrella brand for corporation than to branding process of any
single product or service. This point of view is additionally confirmed by Morgan and Pritchard
(2005) who claim that, even though there are numerous similarities between product branding
and destination branding, at the end destination cannot be branded if it would be a single
product. Kotler (2004) claims that it should be recognized that places are more difficult to brand
then products since every place has a history and heritage that will affect its image. The
introduction of the holistic branding process gives a place a lead over locations which only
practice promotion, because the branding process forces the development of the place resulting
from the process (Rainisto, 2004).
As stated earlier, tourism product besides being very complex, is also mostly intangible product.
According to Cai (2002), the challenge of destination branding lies with the complexity of
decision process tourists have to make when choosing a destination. Author stresses that the
purchase of tourism product, compared to purchase of traditional “physical” product, involves
greater risk and requires extensive information search in order to make informed decision
weather tourism offer on a destination level fits his/hers specific needs and wants. This is a
direct consequence of intangible nature of services in general and specifically of tourism
product which cannot be tested before purchase. Besides this, destination branding process
involves large number of different stakeholders with different interests. Marzano and Scott
(2009) claim that different stakeholders exert different forms of power within the destination
branding process in order to include their own values in the destination brand that is being
developed. The importance of stakeholders in destination branding process is also emphasized
by Garcia, Gomez and Molina (2012) who claim that, when estimating destination brand equity
(BE), it is necessary to take into account not only visitors opinions (visitor-based BE) but also
stakeholders opinions (stakeholder-based BE). Therefore, destination branding should be seen
Chapter 2: Literature review
24
as a collaborative process that has to include all of the stakeholders involved in the tourism
development on the destination level. Large number of tourism stakeholders, as well as the need
for their joint decision-making, is therefore one of the main differences between destination
branding process and the process of branding traditional products and services, where the entire
brand development process is controlled within the single organization. Finally, Morgan and
Pritchard (2005) emphasize that a destination branding process is a long-time effort whose
results are not always visible in the short run. The authors point out that it takes time and
systematic, dedicated work to build a powerful destination brand. Even those destinations,
which at first glance appear to have easily built a recognizable brand, had to go through a time
consuming process of destination branding, which is process that is not always visible to the
general public.
The main objective of destination branding process is to create a desirable and appealing
destination image, based on the distinctive destination features, and to accurately convey this
image to the potential visitors (Blain, Levy and Ritchie, 2005). This process should facilitate
the creation of strong emotional attachment between the destination and the potential visitors.
The created emotional attachment is symbolically represented in the form of the destination
brand and should, consequently, have positive influence the consumers’ choice i.e. their
decisions to visit or revisit particular destination. Ekinci (2003) argues that destination brand
represents emotional component of destination image, therefore only branded destinations can
establish emotional connection with the potential visitors. As noted by Qu, Kim and Im (2011),
the competitive tourism destination must create positive and strong brand in order to increase
repeat visitation and to attract new visitors. Additionally, the authors noted that the destination
image, created through destination branding process, directly influences intention to revisit
since the study found that the overall image of destination was perceived more positively by
the repeated visitors. Therefore, it can be argued that destination branding process and a
destination brand, as its final result, are representing an important elements in the process of
achieving destination competitiveness on a global tourism marketplace. According to the
comprehensive literature review on destination branding published by Pike (2009), destination
branding process most commonly includes following constructs: (i) brand development, (ii)
positioning brand in the market and achieving the desired brand identity and (iii) measuring the
performance of the brand or brand equity. Those three streams of research also represent three
basic steps in destination branding process.
In order to develop a successful destination brand, destinations must go through several
technical phases (steps) of the destination branding process. Some of the most important phases
of the destination branding process, whose importance is emphasized by several authors
(Anholt, 2007; ETC/UNWTO, 2009; Kotler et al., 1993; Paliaga, 2007), are following:
Chapter 2: Literature review
25
• Potential target groups’ definition (visitors, local population, entrepreneurs, investors,
well-known international companies etc.),
• Destination competition analysis,
• SWOT analysis,
• Definition of vision,
• Destination brand building,
• Destination brand integration into the social, tourism, economic and political sphere and
• Destination brand communication to all of the previously defined target groups.
Following theoretical overview analyzes competitiveness in tourism, mainly focused on
destination competitiveness. Also, theoretical findings are synthesized in chapter 2.4 – Relation
among destination branding and destination competitiveness. Summary of key theoretical
concepts used in this dissertation is provided in table 2, page 42.
2.3 Competitiveness in tourism
The term competitiveness is nowadays widely used as a synonym for economic efficiency
(Cracolici, Nijkamp and Rietveld, 2008; Tsai, Song and Wong, 2009). Today everybody wants
to be competitive, regardless of whether they are individuals, family run businesses,
multinational corporations or tourism destinations. The widespread importance of
competitiveness is mostly driven by the globalization process which facilitated easier flow of
the goods and services, capital, labor force and technology. Consequently, increasing
importance of competitiveness has also influenced tourism on the level of tourism businesses
as well as on the level of tourism destinations. Dragičević (2012) argues that competitiveness
related research can answer many important questions such as: Why some individuals, with the
similar or same education, doing the same jobs, are more successful than the others? Why are
some countries in a better competitive position, as measured by the global competitiveness
indexes, and why, at the same time, some countries are lagging behind? Why some regions are
more successful compared to the others? What are the underlying factors of the overall
economic success or failure of regions and countries, companies and individuals and,
considering the context of this dissertation, tourism destinations?
The following text defines the notion of competitiveness, methods of competitiveness analysis
and measurement, the competitiveness in the context of tourism as well as competitiveness
models available in the tourism research literature. Having in mind that the tourism system is
an open system which means it is a subject to many influences and pressures that arise outside
the system itself (Crouch and Ritchie, 2004), competitiveness of tourism destination is still in
focus for many researchers and scholars.
Chapter 2: Literature review
26
2.3.1 Definition of competitiveness
Before defining the notion of competitiveness itself, it is important to emphasize that terms of
competitiveness, competitive advantage and competition are not synonyms. Competitive
advantage implies advantage compared to the competitors, which is achieved by creating added
value for the customers, by price differentiation strategy or by providing greater benefits to the
customers, therefore justifying the premium pricing strategy (Kotler, Wong, Saunders and
Armstrong, 2006b). The sources of competitive advantage have been changing over time, from
the traditional production factors that played important role in the past to the human resources,
managerial skills, the level of innovativeness, technology development, which are all factors
influencing competitive advantage in the modern knowledge-based economies (Vrdoljak
Raguž, Jelenc, Podrug, 2013). The sources of competitive advantage of a nation are based on
the innovativeness of its national development strategy and on the new and specialized skills
and competencies which will be used in the strategy implementation (Dragičević, 2012). When
discussing competitive advantage of the nation, it should be emphasized that the essential
concepts relevant to its competitive advantage should be taken into consideration, such as the
level of its economic development as well as its strengths, weaknesses, opportunities and threats
(Dragičević, 2012; Porter, 1990).
According to Li and Liu (2012) and Vrdoljak Raguž et al. (2013), there are several different
types of competitive advantages:
• Absolute competitive advantage – it implies the competitive advantage unreachable by
the competitors,
• Relative competitive advantage – represents a slight higher competitive advantage in
comparison to the competitors,
• Dynamic competitive advantage – implies the survival and success of the company over
a long period of time, even in the times of uncertainty,
• Temporary competitive advantage – the short term competitive advantage which is
possible to sustain in the long term if the company begins to develop new sources of
competitive advantage which are sustainable in the long run.
According to Porter (1990) competitive advantage can be achieved by low cost of production
and price differentiation. Competitive advantage is a dynamic process which requires
continuous effort in order to be sustainable in the long term, since the competition is always
present and just waiting for its moment (Zoroja, 2013).
According to Webster’s dictionary (2014), competition is the process of trying to get or win
something, price or a higher level of success, that someone else is also trying to get or win, and
those processes are usually done by people, companies, etc., that are competing against each
Chapter 2: Literature review
27
other. In doing so, there are four distinct levels of competitiveness (Dragičević, 2012; Kotler
and Keller, 2009):
1. Product form competition – it occurs when company perceive competition in the form of
other companies which are producing same or similar products and services and offering
it to the similar markets at the similar prices,
2. Product category competition – it occurs when the company perceives competition as all
other companies which are producing similar class of products,
3. General competition – it occurs when companies perceive as competitors all other
companies that are producing products or service which have the same function,
4. Budget competition – it occurs when companies perceive all other companies, regardless
of the products and services they are producing, as competitors.
Competition can be viewed as a necessary but sufficient condition for improving national
competitiveness. In most countries, as well as in Croatia, competition is encouraged preserved
and regulated by the legislative restrictions and limitations that are defining by competition
policy and competition legislation (Dragičević, 2012). Specifically, this role in Croatia has the
Croatian Competition Agency (CCA, established in 1995), which is a governmental body in
charge of ensuring the effective competition, as one of the basic prerequisites for the normal
functioning of the market. According to the information published on the CCA web site
(www.aztn.hr) “the objective of the CCA is not to protect competitors of any undertaking. It is
to create a modern approach to the enforcement policy in the area of competition which relies
on deterrence and sanctioning of anticompetitive practices which harm the consumers”.
At the other hand, competitiveness, as a concept, covers a much broader phenomenon of
economic competition that transcends social, technological, cultural and political spheres
(Ritchie and Crouch, 2003). Intensive competitiveness research started with Porter’s (1990)
work. The competitive advantage of nations introduced competitiveness as a widely accepted
phenomenon and the most important factor determining the long-term success of organizations,
industries, regions and countries (Kozak and Rimmington, 1999). Hence, competitiveness can
be defined as the ability of national economies to achieve long-term sustainable growth rate of
gross domestic product. National competitiveness is an outcome of a nation’s ability to
innovatively achieve an advantageous position over other nations in key industrial sectors
(Porter, 1990). Boltho (1996) is distinguishing between short-term and long-term
competitiveness among nations. According to this author, the short-term international
competitiveness can be observed as the level of the real exchange rate that ensures internal and
external balance with appropriate domestic policies. On the other side, the long-term
international competitiveness could be associated with the highest possible growth of
productivity that was compatible with external equilibrium. Papadakis (1994) argues that
nation’s competitiveness can be measured by the accumulation of the competitiveness of firms
operating within its boundaries. He is also suggesting that competitiveness is reflected by the
Chapter 2: Literature review
28
consumer choice between two or more goods competing for the consumer’s dollar. Therefore,
it is possible to differentiate three levels of competitiveness:
1. Competitiveness of an individual,
2. Competitiveness of the company, and
3. Competitiveness of the nation.
Competitiveness of individuals refers to the ability of an individual to compete with others in
order to achieve better results compared to them. The competitiveness of companies depends
on several factors: internal factors, external factors, the capacity of the management, cost
management as well as political and economic environment in which the company operates in
relation to customers and shareholders (Dragičević, 2012; Man, Lau and Chan, 2002; Vrdoljak
Raguž et al., 2013). In other words, competitiveness is influenced by its micro and macro
environment, i.e. employees, customers, internal and external public, suppliers and competitors
as well as political, social, technological and legislative environment (Kotler et al., 2006b).
National competitiveness represents the most comprehensive form of competitiveness, because
it covers competitiveness of the individuals as well as the competitiveness of the companies.
The ultimate goal of national competitiveness is to increase the overall level of prosperity of its
residents, which is possible only through increased level of economic prosperity and wealth
accumulation for the individuals and companies operating within a national boundaries (Garelli,
2006). Competitive advantage of a nation, i.e. the level of its prosperity, is influenced by three
mutually connected factors: (i) competitiveness of an individual which is focused on the
increase of it personal wealth, (ii) competitiveness of a company which is focused on the
profitability and (iii) competitiveness of a nation, which is focused in the sustainable and
continuous prosperity (Zoroja, 2013). Zoroja also argues that classical economists define
national competitiveness through the productivity and economic growth, i.e. that
competitiveness is determined by traditional production factors such as labor, land, capital and
natural resources. On the other hand, modern economists recognize the importance of
globalization and are claiming that, besides traditional production factors, national
competitiveness is also influenced by other soft factors, such as political and social stability,
legislative framework, and quality of education and promotion of innovativeness (Zoroja,
2013).
According to the World Economic Forum (WEF, 2013), competitiveness is defined as follows:
“The set of institutions, policies, and factors that determine the level of productivity of a
country. The level of productivity, in turn, sets the level of prosperity that can be reached by an
economy. The productivity level also determines the rates of return obtained by investments in
an economy, which in turn are the fundamental drivers of its growth rates. In other words, a
more competitive economy is one that is likely to grow faster over time. The concept of
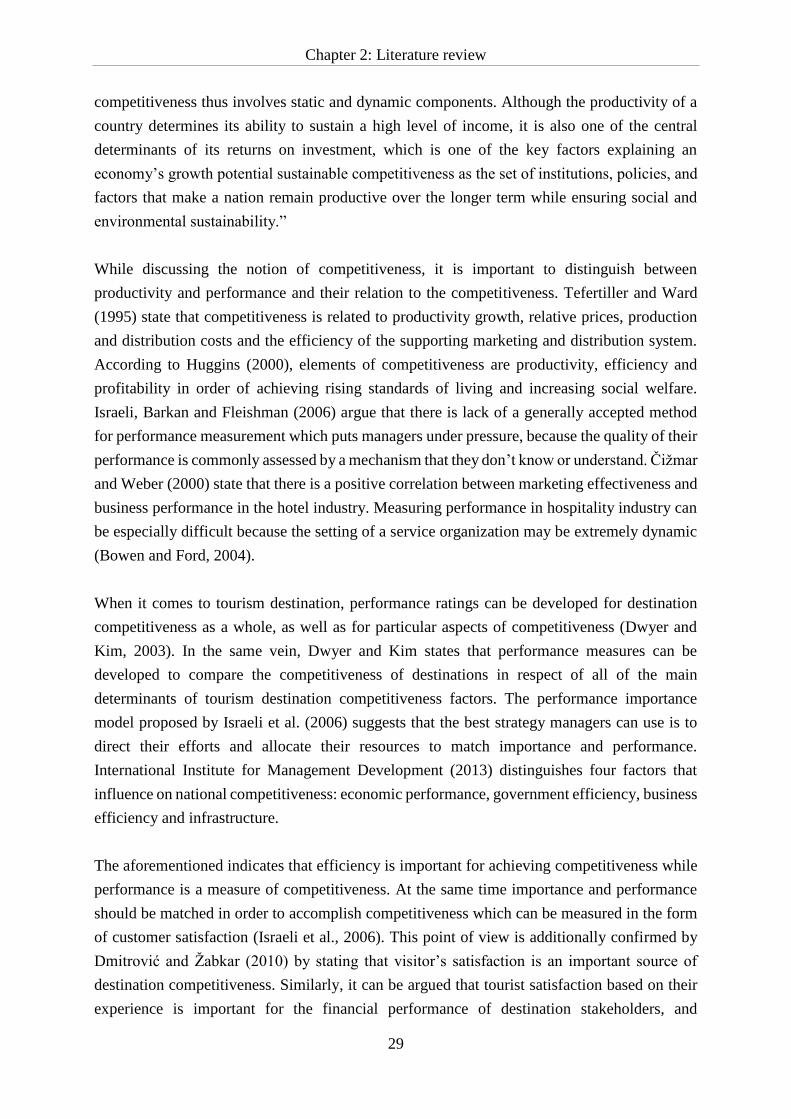
Chapter 2: Literature review
29
competitiveness thus involves static and dynamic components. Although the productivity of a
country determines its ability to sustain a high level of income, it is also one of the central
determinants of its returns on investment, which is one of the key factors explaining an
economy’s growth potential sustainable competitiveness as the set of institutions, policies, and
factors that make a nation remain productive over the longer term while ensuring social and
environmental sustainability.”
While discussing the notion of competitiveness, it is important to distinguish between
productivity and performance and their relation to the competitiveness. Tefertiller and Ward
(1995) state that competitiveness is related to productivity growth, relative prices, production
and distribution costs and the efficiency of the supporting marketing and distribution system.
According to Huggins (2000), elements of competitiveness are productivity, efficiency and
profitability in order of achieving rising standards of living and increasing social welfare.
Israeli, Barkan and Fleishman (2006) argue that there is lack of a generally accepted method
for performance measurement which puts managers under pressure, because the quality of their
performance is commonly assessed by a mechanism that they don’t know or understand. Čižmar
and Weber (2000) state that there is a positive correlation between marketing effectiveness and
business performance in the hotel industry. Measuring performance in hospitality industry can
be especially difficult because the setting of a service organization may be extremely dynamic
(Bowen and Ford, 2004).
When it comes to tourism destination, performance ratings can be developed for destination
competitiveness as a whole, as well as for particular aspects of competitiveness (Dwyer and
Kim, 2003). In the same vein, Dwyer and Kim states that performance measures can be
developed to compare the competitiveness of destinations in respect of all of the main
determinants of tourism destination competitiveness factors. The performance importance
model proposed by Israeli et al. (2006) suggests that the best strategy managers can use is to
direct their efforts and allocate their resources to match importance and performance.
International Institute for Management Development (2013) distinguishes four factors that
influence on national competitiveness: economic performance, government efficiency, business
efficiency and infrastructure.
The aforementioned indicates that efficiency is important for achieving competitiveness while
performance is a measure of competitiveness. At the same time importance and performance
should be matched in order to accomplish competitiveness which can be measured in the form
of customer satisfaction (Israeli et al., 2006). This point of view is additionally confirmed by
Dmitrović and Žabkar (2010) by stating that visitor’s satisfaction is an important source of
destination competitiveness. Similarly, it can be argued that tourist satisfaction based on their
experience is important for the financial performance of destination stakeholders, and
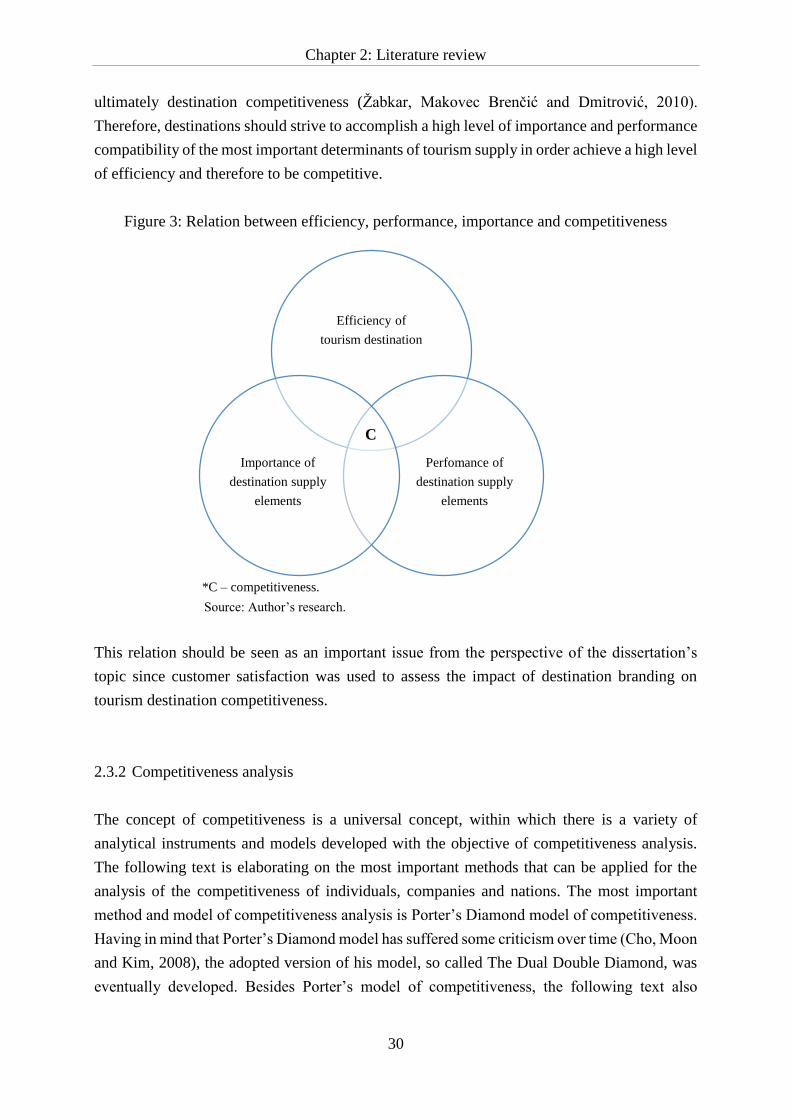
Chapter 2: Literature review
30
ultimately destination competitiveness (Žabkar, Makovec Brenčić and Dmitrović, 2010).
Therefore, destinations should strive to accomplish a high level of importance and performance
compatibility of the most important determinants of tourism supply in order achieve a high level
of efficiency and therefore to be competitive.
Figure 3: Relation between efficiency, performance, importance and competitiveness
*C – competitiveness.
Source: Author’s research.
This relation should be seen as an important issue from the perspective of the dissertation’s
topic since customer satisfaction was used to assess the impact of destination branding on
tourism destination competitiveness.
2.3.2 Competitiveness analysis
The concept of competitiveness is a universal concept, within which there is a variety of
analytical instruments and models developed with the objective of competitiveness analysis.
The following text is elaborating on the most important methods that can be applied for the
analysis of the competitiveness of individuals, companies and nations. The most important
method and model of competitiveness analysis is Porter’s Diamond model of competitiveness.
Having in mind that Porter’s Diamond model has suffered some criticism over time (Cho, Moon
and Kim, 2008), the adopted version of his model, so called The Dual Double Diamond, was
eventually developed. Besides Porter’s model of competitiveness, the following text also
Efficiency of
tourism destination
Perfomance of
destination supply
elements
Importance of
destination supply
elements
C
*
*
**
Chapter 2: Literature review
31
explains some other methods of competitiveness analysis, such as SWOT analysis, VRIO
matrix and benchmarking analysis.
Porter’s Diamond
According to Porter (1990), national competitiveness is not inherited but it is created and should
be permanently built, and only the integration of micro and macro reforms, situational
conditions and government policy can induce the growth of competitiveness and prosperity of
an economy. Porter’s model is a dynamic and comprehensive, it highlights the sources of
national competitive advantage, which includes the essential role of geographic proximity. For
Porter, success in the international market is the primary indicator of the competitive strength
of the nation. Finally, it is important to point out that almost every analysis of the
competitiveness of the regional industrial clusters begins with Porter’s Diamond Four key
drivers of competitiveness, according to Porter’s model, are: business strategy, structure and
rivalry, demand conditions, related and supporting industries factors and conditions
(Dragičević, 2012).
The Dual Double Diamond
Expanded Diamond model, which includes the role of human factors and multinational
activities of a country, was proposed by Cho, Moon and Kim (2008). Model considers physical
and human factors (workers, politicians, bureaucrats and entrepreneurs) in both domestic and
international contexts and is expected to provide a more comprehensive explanation for national
competitiveness than the existing models. Model assumes that different human resource factors
are important for economic development while, at the same time, it accepts Porter’s proposition
that national prosperity is created instead of inherited (Dragičević, 2012). According to this
model countries are classified on the basis of their size and competitiveness.
SWOT analysis
This is an analytical method commonly used in strategic planning, business development, but
can be successfully applied to the analysis of the competitiveness of a country, region or tourist
destinations. SWOT denotes the acronym of strengths, weaknesses, opportunities and threats,
where these factors are identified and analyzed. The goal of the SWOT analysis is to take
advantage of certain strengths, stop weaknesses and try to turn them into strengths, exploit
opportunities and identify threats that could be the basis for development strategy and
competitiveness strategy.
Chapter 2: Literature review
32
VRIO matrix
This matrix is commonly used as an analytical tool in the strategic planning activities of the
company. VRIO is an acronym denoting four questions related to the resources or ability to
determine the competitive potentials, namely: value, rarity, imitability and organization. This
method can also be applied to analyze the potential competitiveness of a nation (Dragičević,
2012). It can be used to identify potential competitors and key success factors.
Benchmarking analysis
The Webster’s Dictionary (2014) defines benchmark as “something that can be used as a way
to judge the quality of similar things”. The term benchmark has historically been associated
with geological investigations in which it has been used as a leveling sign/reference point during
the land measurement. Recently, it is commonly used in a context of comparison or reference
point for the assessment of organizational, managerial and competitive achievements against
the competitors, in the global competitive marketplace (Dragičević, 2012). Put it differently,
benchmarking is the process of analyzing competitors, which establishes the basis for
improving competitiveness. The concept of benchmarking emerged in business management in
the 1980s and it has been used to evaluate products, services and processes in a number of
industries (Kozak, 2002).
Today, there are two widely accepted reports, describing the competitiveness of the nations,
The World Competitiveness Yearbook published by the International Institute for Management
Development (IMD) and the WEF Global Competitiveness Report. These reports are
characterized by some differences in the definition of the concept of competitiveness and the
scope of its analysis (Dragičević, 2012). IMD defines competitiveness as an ability of a nation
to create value added and to increase national wealth. The definition of competitiveness,
according to IMD, is based upon GDP growth and productivity growth but, at the same time, it
is emphasized that competitiveness cannot be reduced only to the growth of GDP and
productivity. The IMD report emphasizes ten golden rules for competitiveness of the nation
(IMD, 2013):
1. Stable and predictable legislative and administrative environment should be created,
2. Speed, transparency and accountability of the administration, as well as the ease of doing
business should be ensured,
3. It should be continually invested in developing and maintaining of economic and social
infrastructure,
4. The middle class as a key source of prosperity and long-term stability should be
strengthened,
Chapter 2: Literature review
33
5. Privately owned and medium sized enterprises, as a key element of diversity in an
economy, should be developed,
6. Balanced relationship between wage levels, productivity and taxation should be
maintained,
7. A local market should be developed by promoting private savings and domestic
investments,
8. Aggressiveness on international markets should be balanced with attractiveness for value
added activities,
9. The advantages of globalization should be in the same proportion with the imperatives of
proximity to preserve social cohesion and value systems, and
10. In order to achieve successful competitiveness, a higher level of prosperity for all
citizens should be provided.
On the other hand, WEF accepts GDP and productivity as a factors of competitiveness, but also
adds additional set of indicators. With this respect, WEF’s concept of competitiveness involves
static and dynamic components grouped into 12 pillars of competitiveness: Institutions,
Infrastructure, Macroeconomic environment, Health and primary education, Higher education
and training, Goods market efficiency, Labor market efficiency, Financial market development,
Technological readiness, Market size, Business sophistication, and Innovation (WEF, 2013).
Although the definitions of competitiveness provided by IMD and WEF are partially different,
both of them are using similar elements of competitiveness: economic performance,
government efficiency, business efficiency and infrastructure, macroeconomic environment,
aggregate indicators of economic activity, public institutions and legislation, domestic
competition, general infrastructure, technological innovation and information and
communication technology (Dragičević, 2012).
2.3.3 The concept of destination competitiveness
Destinations intention to be more competitive is influenced by intense competition among
tourism destinations. It can be argued that the competitiveness of tourism destinations is one of
the most important tourism research themes of the last two decades (Dwyer, Knežević Cvelbar,
Koman and Mihalič, 2013). Many researchers have studied destination competitiveness from
different perspectives. For some authors, custom marketing and management strategies are
important for destination competitiveness (Ahmed and Krohn, 1990; Bordas, 1994; Čižmar and
Weber, 2000; Heath, 2003). Destination marketing is becoming more complex and often has
been recognized as a perceived as a threat to destination sustainability (Buhalis, 2000).
According to Čižmar and Weber (2000), marketing practices are positively contributing to
business performance and they provide an answer to the question of how to attract guests.
Chapter 2: Literature review
34
Buhalis (2000) argues that destination authorities need to realize that strategic marketing should
be used to achieve destination policies and overall competitiveness of tourism destination.
According to Dwyer, Forsyth and Rao (1999), a destination may be price competitive from the
perspective of some tourists, but not for others, depending on visit purpose. It is necessary that
destinations monitor their price competitiveness relative to alternate locations (Dwyer, Forsyth
and Rao, 2000). The price competitiveness also could be seen as one of the marketing practices.
Buhalis (2000) recognizes the importance of suppliers and the multiplicity of the individually
produced products and services that help make up the overall tourism product, but is more
concerned with the difficulties this raises for marketing issue than for the destination
competitiveness. Management performance also has strong influence on destination
competitiveness (Dwyer and Kim, 2003; Go and Govers, 2000; Kozak and Rimmington, 1999).
Destinations can enhance the competitiveness by implementation of integrated quality
management activities (Go and Govers, 2000). Mihalič (2000) pointed out that destination
competitiveness can be enhanced through certain environmental marketing activities.
According to Ritchie and Crouch (2003), enhancing the well-being of destination’s residents
and preserving the natural resources of a destination for future generations has an important
role for destination competitiveness. Enright and Newton (2004) have demonstrated the value
of including business-related factors in determining tourism destination competitiveness.
Buhalis (2000) argues that the use of new technologies is very important in order to manage
and market competitive destination of the future for the benefits of its stakeholders. According
to Kotler et al., (2006a) tourism development has to reflect the balance between the pursuit of
profit maximization and the preservation of natural resources and the quality of life for local
residents.
Destination competitiveness is influenced by many factors which have to be coordinated in
order to accomplish a destination’s successful and continuous competitiveness. Different
management organizations on the destination level have to be very well coordinated in order to
bypass competitiveness complexity, since there is a very large number of attributes difficult to
manage (Crouch, 2011). Competitiveness is widely accepted as the most important factor
determining the long term success of organizations, industries, regions and countries (Kozak
and Rimmington, 1999). According to the Dwyer and Kim (2003), a large number of variables
appear to be linked to the notion of destination competitiveness. These include objectively
measured variables such as number of visitors, market share, size of tourist expenditure, level
of employment, value added by the tourism system, as well as subjectively measured variables
such as richness of cultured heritage, quality of the tourist experience etc. Ritchie and Crouch
(2003) pointed out that tourism destination competitiveness is its ability to increase tourism
expenditure, to increasingly attract visitors while providing them with satisfying, memorable
experiences, and to do so in profitable way, while enhancing the wellbeing of destinations
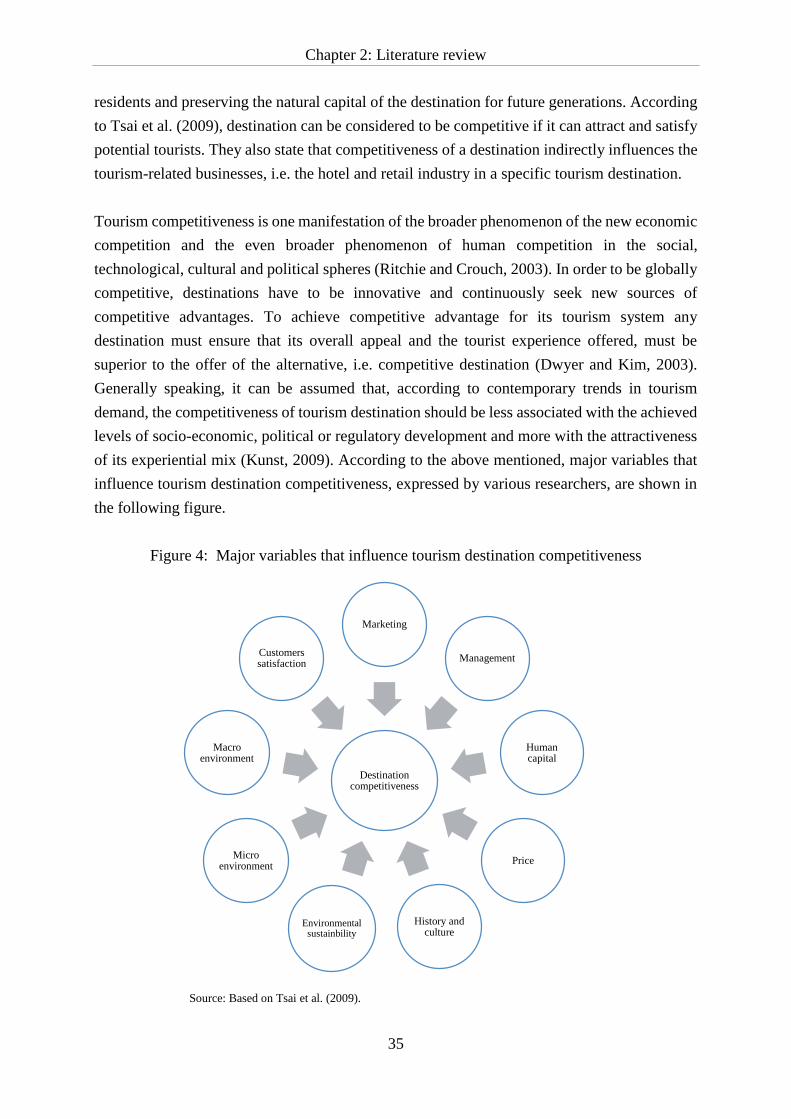
Chapter 2: Literature review
35
residents and preserving the natural capital of the destination for future generations. According
to Tsai et al. (2009), destination can be considered to be competitive if it can attract and satisfy
potential tourists. They also state that competitiveness of a destination indirectly influences the
tourism-related businesses, i.e. the hotel and retail industry in a specific tourism destination.
Tourism competitiveness is one manifestation of the broader phenomenon of the new economic
competition and the even broader phenomenon of human competition in the social,
technological, cultural and political spheres (Ritchie and Crouch, 2003). In order to be globally
competitive, destinations have to be innovative and continuously seek new sources of
competitive advantages. To achieve competitive advantage for its tourism system any
destination must ensure that its overall appeal and the tourist experience offered, must be
superior to the offer of the alternative, i.e. competitive destination (Dwyer and Kim, 2003).
Generally speaking, it can be assumed that, according to contemporary trends in tourism
demand, the competitiveness of tourism destination should be less associated with the achieved
levels of socio-economic, political or regulatory development and more with the attractiveness
of its experiential mix (Kunst, 2009). According to the above mentioned, major variables that
influence tourism destination competitiveness, expressed by various researchers, are shown in
the following figure.
Figure 4: Major variables that influence tourism destination competitiveness
Source: Based on Tsai et al. (2009).
Destination competitiveness
Marketing
Management
Human capital
Price
History and culture
Environmental sustainbility
Micro environment
Macro environment
Customers satisfaction
Chapter 2: Literature review
36
One of the variables that certainly exerts high influence on destination competitiveness is
branding, the process of creating destination as a brand. According to the ETC/UNWTO (2009),
the term destination brand refers to a destinations positioning in the mind of potential tourists
and destinations competitive identity. It is what makes a destination distinctive and memorable
and what differentiates the destination from all others. It is the foundation of the destinations
international competitiveness. In their Conceptual model of destination competitiveness,
Ritchie and Crouch (2003), pointed out that destination brand is a name, symbol, logo, work
mark or other graphic that both identifies and differentiates the destination. Furthermore, it
conveys the promise of a memorable travel experience that is uniquely associated with the
destination and it also serves to consolidate and reinforce the recollection of pleasurable
memories of the destination experience. Dwyer and Kim (2003), also recognized destination
positioning and clarity of destination image as one of variables that influences on destination
competitiveness. According to them, branding is essential to make tourism happen in a
destination. Still, this process certainly leads to destinations’ better performance, but there is
not clear linkage between destination competitiveness and destination branding.
2.3.4 Destination competitiveness models
The researches interested in measuring destination competitiveness are facing several
challenges (Dwyer, Knežević Cvelbar, Edwards and Mihalič, 2012). The main problem lies in
the integration of objective indicators and subjective measures of destination competitiveness
(Dwyer et al., 2012). According to Kozak and Rimmington (1999), destination competitiveness
can be evaluated quantitatively and qualitatively, i.e. destination competitiveness
(performance) can be measured by use of hard data (numbers of tourist arrivals and tourism
receipts) and soft data (customer satisfaction). Every destination has its own competitiveness
set depending on the nature and structure of its tourism industry compared with alternative
tourism products offered in the world wide tourism market (Kozak and Rimmington, 1999). In
order to systematically evaluate and organize current body of knowledge related to tourism
destination competitiveness models, models are divided in two groups:
a) Conceptual models, and
b) Empirical models.
2.3.4.1 Conceptual tourism destination competitiveness models
The Ritchie and Crouch Model
The model developed by Ritchie and Crouch (2003) is one of the best theoretically based and
comprehensive destination competitiveness models (Kunst, 2009). The Conceptual model of
Chapter 2: Literature review
37
destination competitiveness incorporates several categories of factors and sub-factors and the
importance of each factor is relative and depends very much on the unique circumstances of
each destinations. The Ritchie and Crouch Model takes into account supply and demand factors,
i.e. supporting factors and resources, core resources and attractors, destination management
factors and destination policy, planning and development and qualifying and amplifying
determinants, i.e. location, safety/security, cost/value, interdependencies, awareness/image and
carrying capacity suggests that quality of tourism related resources represent the core of the
destination’s market appeal and the primary motive to visit a destination. The model
acknowledges the impact of global macro environmental forces and competitive micro
environments (Dwyer et al., 2013). When it comes to the branding authors identify
“positioning/branding” as a part of destination policy, planning and development dimension.
Positioning is defined as a unique perception of tourism destination in the minds of potential
market segments, but they don’t discuss destination branding.
The Dwyer and Kim Model
Dwyer and Kim (2003) developed an Integrated Model of Destination Competitiveness (IMDC
model). This model encompasses the key theoretical determinants of national and firm
competitiveness and tourism destination competitiveness, as proposed by various tourism
researchers, e.g. Ritchie and Crouch (Dwyer and Kim, 2003). Dwyer and Kim had listed some
of the main dimensions and indicators of destination competitiveness that can enable
comparison between countries and between tourism related industries. Those indicators are:
endowed resources, created resources, supporting factors, destination management, situational
conditions and market performance indicators. According to Dwyer and Kim (2003) model of
destination competitiveness will allow identification of the relative strengths and weaknesses
of different tourism destinations, and can be used by industry and governments to increase
competitiveness in the form of tourism numbers, expenditure and positive socio-economic
impacts resulting from tourism growth. When it comes to the branding authors identify
“destination positioning and clarity of destination image” as a variables that influence
destination competitiveness, but they don’t discuss destination branding process explicitly.
The Heath Model
The model is primarily based on experience gained through the destination strategic planning
processes facilitated in Southern Africa and it brings together the main elements of destination
competitiveness as proposed in the wider literature by various tourism researchers (Heath,
2003). The model is presented in the form of house, consists of various key components: the
foundations that provide an essential base for competitiveness; the cement, which links the
respective facets of competitiveness; the building blocks, which are connecting destination
Chapter 2: Literature review
38
competitiveness involving an integrated development policy and framework and a strategic and
innovative destination marketing framework and strategy (Heath, 2003). The roof represents
the key success drivers including the people factor of destination competitiveness.
2.3.4.2 Empirical tourism destination competitiveness models
World Travel and Tourism Center Model (The Gooroochurn and Sugiyarto Model)
Gooroochurn and Sugiyarto (2005) had developed very pragmatic model for assessing and
comparing tourism competitiveness among countries. The authors applied this model to over
200 countries, comparing all available and comparable data from various credible publications
of the institutions such as the World Bank, United Nations and United Nations Development
Programme (UNDP) (Kunst, 2009). The model provides eight main indicators of tourism
competitiveness – price, openness, technology, infrastructure, human tourism, social
development, environment and human resources (Gooroochurn and Sugiyarto, 2005). The
indicators in the destination Competitiveness Monitor (CM) were similar to those used in
monitoring the mainstream competitiveness of nations based on the Porter's Diamond (Tsai et
al., 2009). The components included in each indicator are far from exhausted, and the
Competitiveness Model is constantly being updated to include new components and data for
more recent years (Gooroochurn and Sugiyarto, 2005).
The World Economic Forum Model
Basis for the World Economic Forum Model was the IMDC model developed by Dwyer and
Kim (2003). Competitiveness of countries as a tourism destinations is based on the so-called
Travel and Tourism Competitiveness Index (TTCI) and presented in Travel and Tourism
Competitiveness Report. It provides a “platform for multi-stakeholder dialogue to ensure the
development of strong and sustainable tourism and travel industries capable of contributing
effectively to international economic development” (WEF, 2013). The aim of Travel and
Tourism Competitiveness Index (TTCI) is to provide strategic tool for measuring the factors
and policies that make tourism destination attractive on the international tourism market. The
TTCI is based on three broad categories of variables that facilitate travel and tourism
competitiveness, summarized into the three subindexes (i) the travel and tourism regulatory
framework subindex, (ii) the travel and tourism business environment and infrastructure
subindex and (iii) the travel and tourism human, cultural, and natural resources subindex. Index
calculation is based on 14 competitiveness pillars: (i) policy rules and regulations, (ii)
environmental sustainability, (iii) safety and security, (iv) health and hygiene, (v) prioritization
of Travel and Tourism, (vi) air transport infrastructure, (vii) ground transport infrastructure,
Chapter 2: Literature review
39
(viii) tourism infrastructure, (ix) ICT infrastructure, (x) price competitiveness in the Travel and
Tourism industry, (xi) human resources, (xii) affinity for Travel and Tourism, (xiii) natural
resources, and (xiv) cultural resources.
According to Vengesayi (2003) researchers should move from conceptual to empirical
validation of the proposed models and the challenge should be to investigate the relationship
between identified variables of competitiveness and how strongly they influence tourism
destination competitiveness. To date, the Integrated Model of Destination Competitiveness has
not been rigorously tested but it has been used to explore destination competitiveness of four
countries including Australia, South Korea, Slovenia and Serbia (Dwyer, Knežević Cvelbar,
Koman, Mihalič, 2013). As previously mentioned, this Integrated Model has originally been
used to explore competitiveness of Australia and South Korea. Omerzel Gomezelj and Mihalič
(2008), applied the Integrated Model of destination competitiveness developed by Dwyer and
Kim (2003) to Slovenia. They have been examining determinants and individual competitive
indicators as perceived by Slovenian tourism stakeholders on the supply side. According to the
results, Slovenia is more competitive in its natural, cultural and created resources, but less
competitive in the management of tourism and according to the IMDC model, demand
conditions, i.e. awareness, perception, preferences, overall destination image. Authors have
argued that understanding of the main competitiveness factors (determinants) and the placement
of their elements that affect the competitiveness of a tourism destination should be common.
The study concluded that the Integrated Model was a useful framework for analyzing the
competitiveness of Slovenia (Dwyer et al., 2013). The Integrated Model of destination
competitiveness has also been applied to Serbia (Armenski, Gomezelj, Djurdjev, Ćurčić and
Dragin, 2012; Dragičević, Jovičić, Blešić, Stankov and Bošković, 2012; Dwyer, Dragičević,
Armenski, Mihalič and Knežević Cvelbar, 2014). In the most recent analysis of destination
competitiveness by Dwyer et al. (2014), authors applied IPA analysis in order to identify
activities, in both public and private sector, which could help Serbia to achieve competitive
advantage on the tourism market.
According to Kunst (2009), above mentioned conceptual destination competitiveness models
are too complex and too demanding for efficient practical implementation, so their significance
is mostly of academic and educational nature. The presented empirical destination
competitiveness models have their base in mainstream economic principles and in the theory
from the field of destination competitiveness, but still, regarded to the variables that they use
for each country, it can be concluded that they are not only highly mechanical and stereotypical
in approach, but also rather unconvincing (Kunst, 2009). One of the reasons is that the factors
affecting the competitiveness of tourism destinations are not the same for all destinations and
the hard data, which they are utilizing for competitiveness assessment and measurement, are
not always accurate. For example, the number of international tourist arrivals and overnight
Chapter 2: Literature review
40
stays, used by the WEF for the purpose of composing Travel and Tourism Competitiveness
Report, in the case of some countries, i.e. Bosnia and Herzegovina, does not correspond to the
actual number of international tourist arrivals (Federal Ministry of Tourism and Environment,
2014). This is not a methodological problem, but the problem of inadequate input tourism
statistics regarding the number of international tourist arrivals and overnight stays in a country,
in this case of Bosnia and Herzegovina.
An empirical test of the Integrated Model of Destination Competitiveness (Dwyer and Kim,
2003) was conducted in 2013 by Dwyer et al. This was the first study in tourism literature that
used secondary data available from international sources for 139 world countries in period 2007
to 2011 to test the validity of Dwyer and Kim’s IMDC model (Dwyer et al., 2013). Results
showed that “the structure of the IMDC, with some exceptions, complies with the empirical
data on a data set of more than 100 countries, thus with the real world of competitiveness
attributes and their groupings” (Dwyer et al.: 219, 2013). Even though, the IMDC model
predicted eight main elements of destination competitiveness, the empirical analysis suggested
five elements, namely: (i) situational conditions, (ii) supporting resources, (iii) endowed and
created resources, (iv) destination management – private and (v) destination management –
public. Contribution of the paper is very important for the future research of the destination
competitiveness, since paper allows policy makers to understand the content of competitiveness
factors and to manage and monitor them better (Dwyer et al., 2013).
2.4 Relation among destination branding and destination competitiveness
Having in mind all of the previously discussed issues related to the destination branding and
destination competitiveness, it can be concluded that destination branding is an important
determinant of destination competitiveness. The following theoretical background is given to
substantiate this point of view. The main goal of destination branding is to emphasize the unique
destination attributes (differentia specifica) and thus, to make that destination recognizable and
different compared to competitors.
Lee and Back (2010) argue that, due to the large overlapping between the concepts of
destination branding and product branding, it is not unreasonable to assume that the process of
destination branding can lead to better destination performance in the same manner as the
process of product branding can lead to a competitive advantage of respective companies.
Additionally, Pike (2009) points out that destination brand performance measurement is
recognized as one of the issues that have to be explored in order to improve destination
competitiveness. In a similar vein, ETC/UNWTO (2009) points out that tourism destination
must have a defined image and certain characteristics and qualities that can contribute to a clear
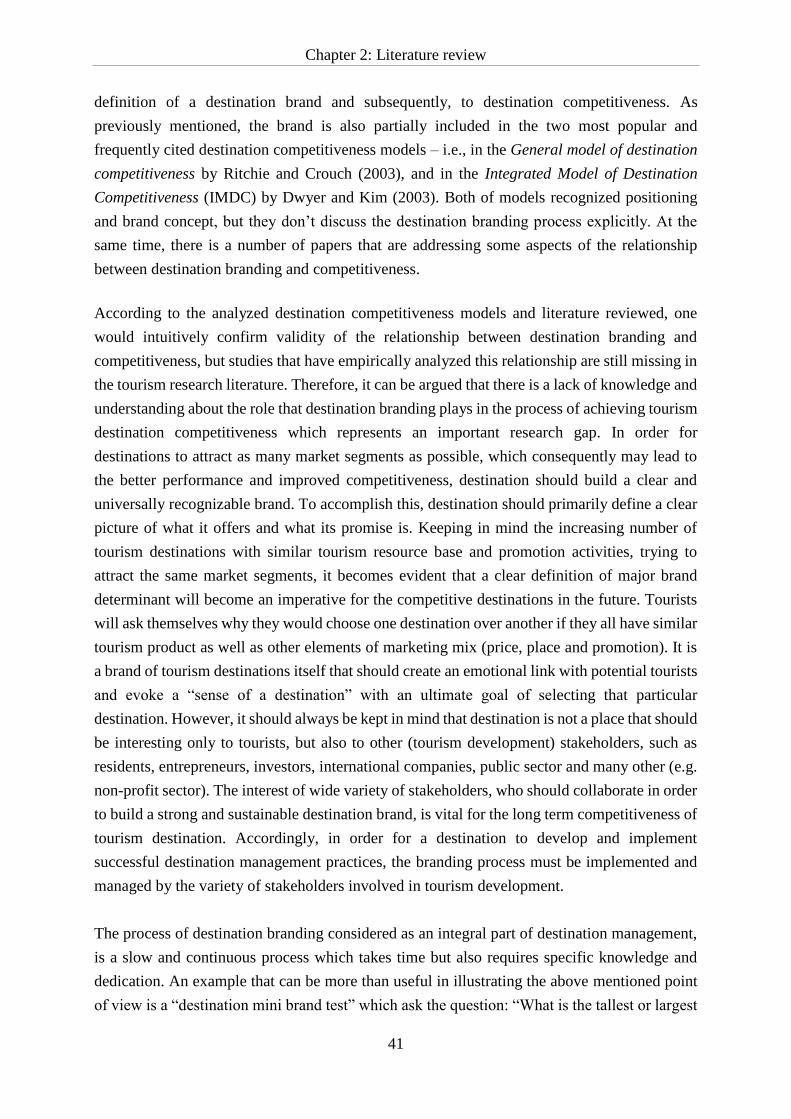
Chapter 2: Literature review
41
definition of a destination brand and subsequently, to destination competitiveness. As
previously mentioned, the brand is also partially included in the two most popular and
frequently cited destination competitiveness models – i.e., in the General model of destination
competitiveness by Ritchie and Crouch (2003), and in the Integrated Model of Destination
Competitiveness (IMDC) by Dwyer and Kim (2003). Both of models recognized positioning
and brand concept, but they don’t discuss the destination branding process explicitly. At the
same time, there is a number of papers that are addressing some aspects of the relationship
between destination branding and competitiveness.
According to the analyzed destination competitiveness models and literature reviewed, one
would intuitively confirm validity of the relationship between destination branding and
competitiveness, but studies that have empirically analyzed this relationship are still missing in
the tourism research literature. Therefore, it can be argued that there is a lack of knowledge and
understanding about the role that destination branding plays in the process of achieving tourism
destination competitiveness which represents an important research gap. In order for
destinations to attract as many market segments as possible, which consequently may lead to
the better performance and improved competitiveness, destination should build a clear and
universally recognizable brand. To accomplish this, destination should primarily define a clear
picture of what it offers and what its promise is. Keeping in mind the increasing number of
tourism destinations with similar tourism resource base and promotion activities, trying to
attract the same market segments, it becomes evident that a clear definition of major brand
determinant will become an imperative for the competitive destinations in the future. Tourists
will ask themselves why they would choose one destination over another if they all have similar
tourism product as well as other elements of marketing mix (price, place and promotion). It is
a brand of tourism destinations itself that should create an emotional link with potential tourists
and evoke a “sense of a destination” with an ultimate goal of selecting that particular
destination. However, it should always be kept in mind that destination is not a place that should
be interesting only to tourists, but also to other (tourism development) stakeholders, such as
residents, entrepreneurs, investors, international companies, public sector and many other (e.g.
non-profit sector). The interest of wide variety of stakeholders, who should collaborate in order
to build a strong and sustainable destination brand, is vital for the long term competitiveness of
tourism destination. Accordingly, in order for a destination to develop and implement
successful destination management practices, the branding process must be implemented and
managed by the variety of stakeholders involved in tourism development.
The process of destination branding considered as an integral part of destination management,
is a slow and continuous process which takes time but also requires specific knowledge and
dedication. An example that can be more than useful in illustrating the above mentioned point
of view is a “destination mini brand test” which ask the question: “What is the tallest or largest
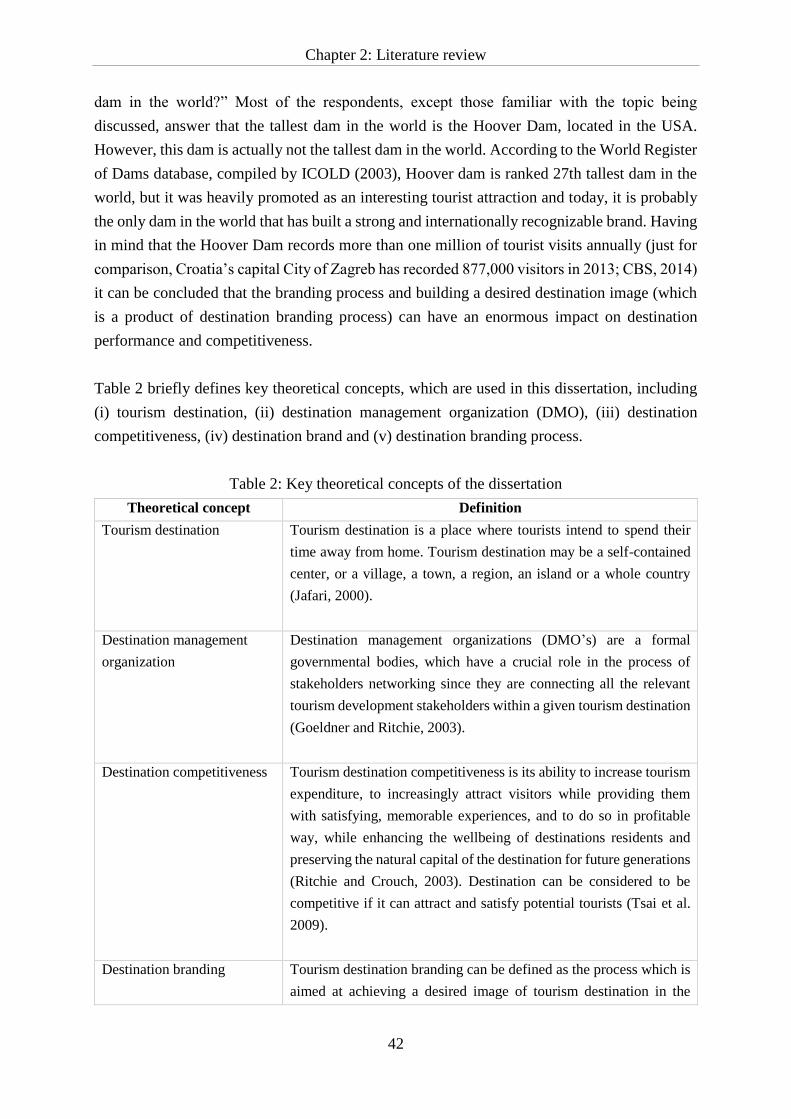
Chapter 2: Literature review
42
dam in the world?” Most of the respondents, except those familiar with the topic being
discussed, answer that the tallest dam in the world is the Hoover Dam, located in the USA.
However, this dam is actually not the tallest dam in the world. According to the World Register
of Dams database, compiled by ICOLD (2003), Hoover dam is ranked 27th tallest dam in the
world, but it was heavily promoted as an interesting tourist attraction and today, it is probably
the only dam in the world that has built a strong and internationally recognizable brand. Having
in mind that the Hoover Dam records more than one million of tourist visits annually (just for
comparison, Croatia’s capital City of Zagreb has recorded 877,000 visitors in 2013; CBS, 2014)
it can be concluded that the branding process and building a desired destination image (which
is a product of destination branding process) can have an enormous impact on destination
performance and competitiveness.
Table 2 briefly defines key theoretical concepts, which are used in this dissertation, including
(i) tourism destination, (ii) destination management organization (DMO), (iii) destination
competitiveness, (iv) destination brand and (v) destination branding process.
Table 2: Key theoretical concepts of the dissertation
Theoretical concept Definition
Tourism destination
Tourism destination is a place where tourists intend to spend their
time away from home. Tourism destination may be a self-contained
center, or a village, a town, a region, an island or a whole country
(Jafari, 2000).
Destination management
organization
Destination management organizations (DMO’s) are a formal
governmental bodies, which have a crucial role in the process of
stakeholders networking since they are connecting all the relevant
tourism development stakeholders within a given tourism destination
(Goeldner and Ritchie, 2003).
Destination competitiveness
Tourism destination competitiveness is its ability to increase tourism
expenditure, to increasingly attract visitors while providing them
with satisfying, memorable experiences, and to do so in profitable
way, while enhancing the wellbeing of destinations residents and
preserving the natural capital of the destination for future generations
(Ritchie and Crouch, 2003). Destination can be considered to be
competitive if it can attract and satisfy potential tourists (Tsai et al.
2009).
Destination branding
Tourism destination branding can be defined as the process which is
aimed at achieving a desired image of tourism destination in the
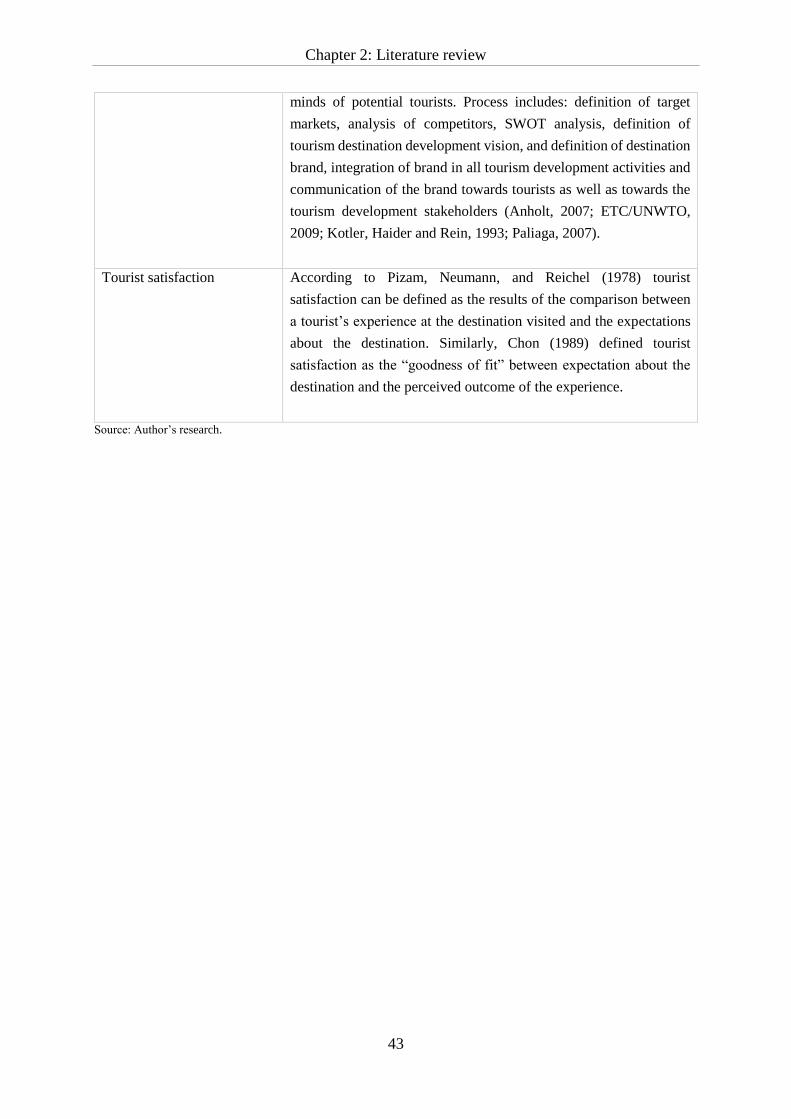
Chapter 2: Literature review
43
minds of potential tourists. Process includes: definition of target
markets, analysis of competitors, SWOT analysis, definition of
tourism destination development vision, and definition of destination
brand, integration of brand in all tourism development activities and
communication of the brand towards tourists as well as towards the
tourism development stakeholders (Anholt, 2007; ETC/UNWTO,
2009; Kotler, Haider and Rein, 1993; Paliaga, 2007).
Tourist satisfaction According to Pizam, Neumann, and Reichel (1978) tourist
satisfaction can be defined as the results of the comparison between
a tourist’s experience at the destination visited and the expectations
about the destination. Similarly, Chon (1989) defined tourist
satisfaction as the “goodness of fit” between expectation about the
destination and the perceived outcome of the experience.
Source: Author’s research.

Chapter 2: Literature review
44
Chapter 3: Conceptualization of the research model
45
3 CONCEPTUALIZATION OF THE RESEARCH MODEL
This chapter includes suggestions for destination competitiveness model improvements with
the use of branding, research model and research hypotheses.
3.1 Suggestions for destination competitiveness model improvements with the use
of branding
In order to achieve high level of overall destination competitiveness with the implementation
of branding, destination should go through all phases of the destination branding process. As
previously discussed, destination branding process includes: (i) definition of potential target
groups, (ii) destination competition analysis, (iii) SWOT analysis, (iv) definition of vision, (v)
destination brand building, (vi) destination brand integration into the social, tourism, economic
and political spheres, and (vii) destination brand communication to all of the previously defined
target groups. First four elements of the process are typical for the destination management
practices and therefore are performed by majority of tourism destinations. On the other hand,
last three elements of the destination branding process are directly related to the destination
brand building and they are applied in order to achieve desirable image which is the product of
the branding process. It should be emphasized that every tourism destination is characterized
by an image that exists in the minds of potential customers, but that image does not necessarily
has to be product of a destination branding process.
Therefore, destination branding process should start with the definition of potential target
groups. Target groups, beside tourists, include a variety of tourism stakeholders within a
destination which are all contributing to the creation of successful tourism destination product.
This is important in the context of the destination brand positioning and creation of brand
values. Selected attributes should be those that are most appealing to selected market segments.
Second phase is destination competition analysis which is a phase of destination branding
process aimed at analyzing destination market position in relation to the main competitors.
Third phase includes a SWOT analysis which should be developed for every tourism
destination, regardless of whether a destination is implementing a branding process or not, since
it represents an important analytical tool within the destination management framework. After
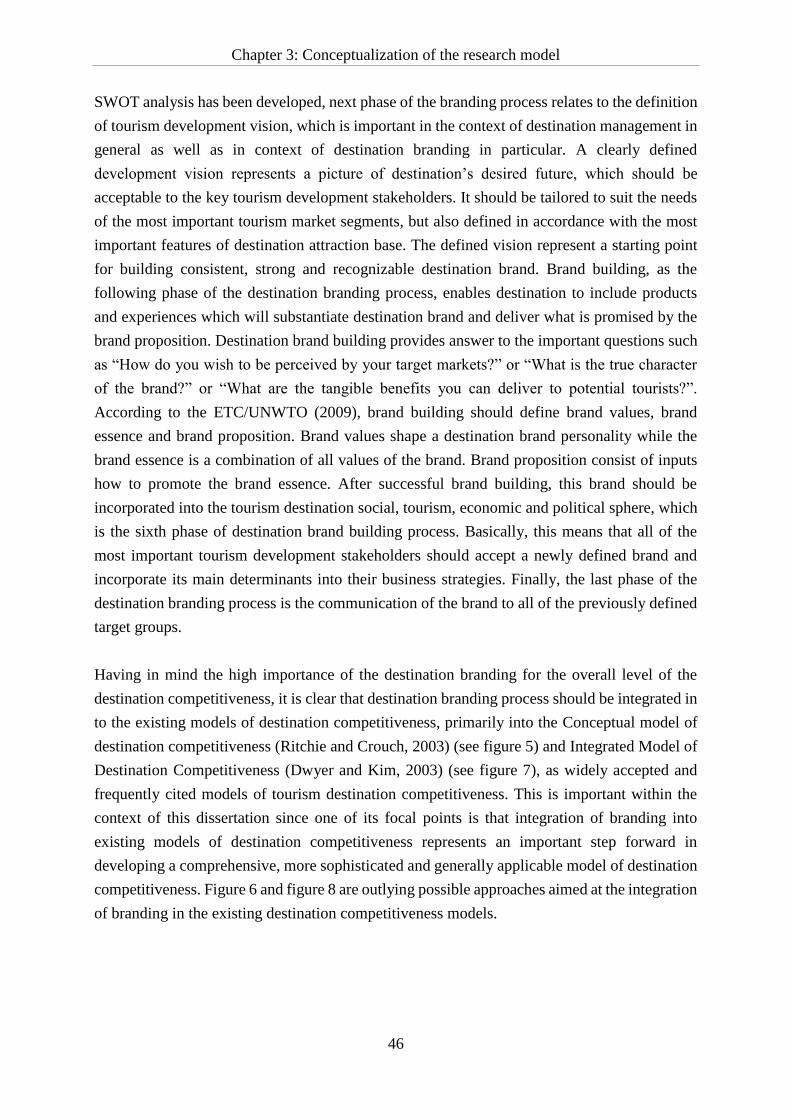
Chapter 3: Conceptualization of the research model
46
SWOT analysis has been developed, next phase of the branding process relates to the definition
of tourism development vision, which is important in the context of destination management in
general as well as in context of destination branding in particular. A clearly defined
development vision represents a picture of destination’s desired future, which should be
acceptable to the key tourism development stakeholders. It should be tailored to suit the needs
of the most important tourism market segments, but also defined in accordance with the most
important features of destination attraction base. The defined vision represent a starting point
for building consistent, strong and recognizable destination brand. Brand building, as the
following phase of the destination branding process, enables destination to include products
and experiences which will substantiate destination brand and deliver what is promised by the
brand proposition. Destination brand building provides answer to the important questions such
as “How do you wish to be perceived by your target markets?” or “What is the true character
of the brand?” or “What are the tangible benefits you can deliver to potential tourists?”.
According to the ETC/UNWTO (2009), brand building should define brand values, brand
essence and brand proposition. Brand values shape a destination brand personality while the
brand essence is a combination of all values of the brand. Brand proposition consist of inputs
how to promote the brand essence. After successful brand building, this brand should be
incorporated into the tourism destination social, tourism, economic and political sphere, which
is the sixth phase of destination brand building process. Basically, this means that all of the
most important tourism development stakeholders should accept a newly defined brand and
incorporate its main determinants into their business strategies. Finally, the last phase of the
destination branding process is the communication of the brand to all of the previously defined
target groups.
Having in mind the high importance of the destination branding for the overall level of the
destination competitiveness, it is clear that destination branding process should be integrated in
to the existing models of destination competitiveness, primarily into the Conceptual model of
destination competitiveness (Ritchie and Crouch, 2003) (see figure 5) and Integrated Model of
Destination Competitiveness (Dwyer and Kim, 2003) (see figure 7), as widely accepted and
frequently cited models of tourism destination competitiveness. This is important within the
context of this dissertation since one of its focal points is that integration of branding into
existing models of destination competitiveness represents an important step forward in
developing a comprehensive, more sophisticated and generally applicable model of destination
competitiveness. Figure 6 and figure 8 are outlying possible approaches aimed at the integration
of branding in the existing destination competitiveness models.
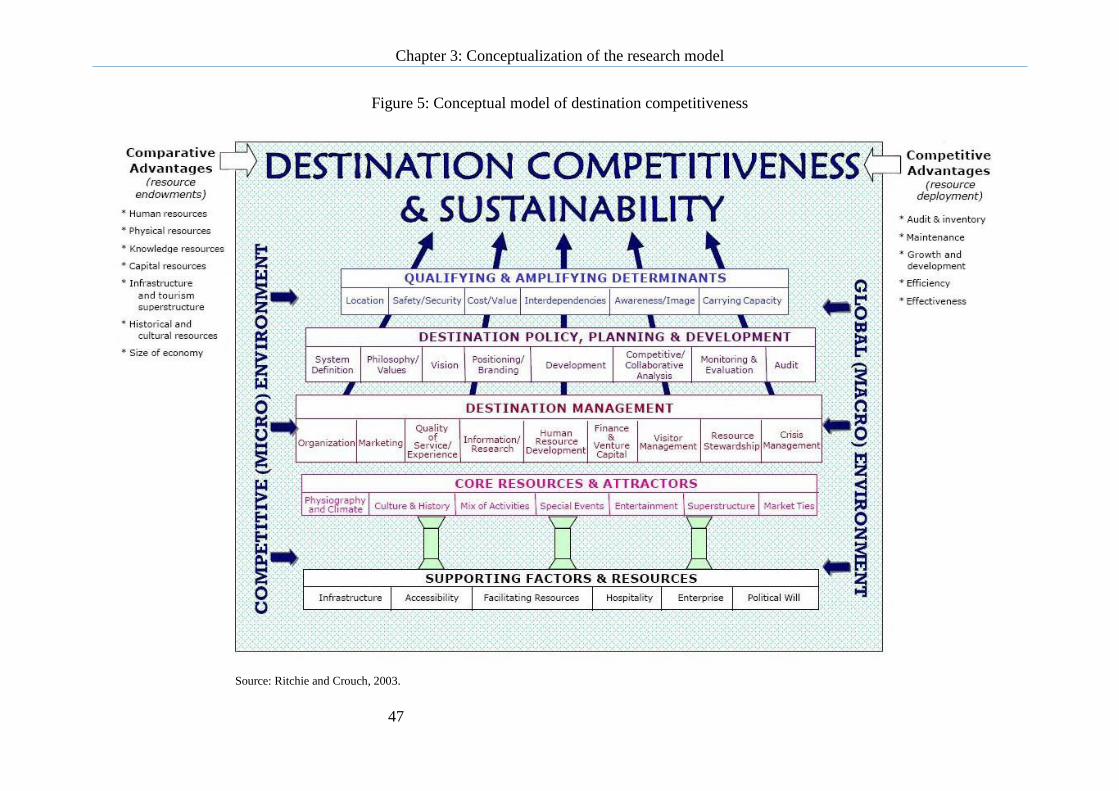
Chapter 3: Conceptualization of the research model
47
Figure 5: Conceptual model of destination competitiveness
Source: Ritchie and Crouch, 2003.
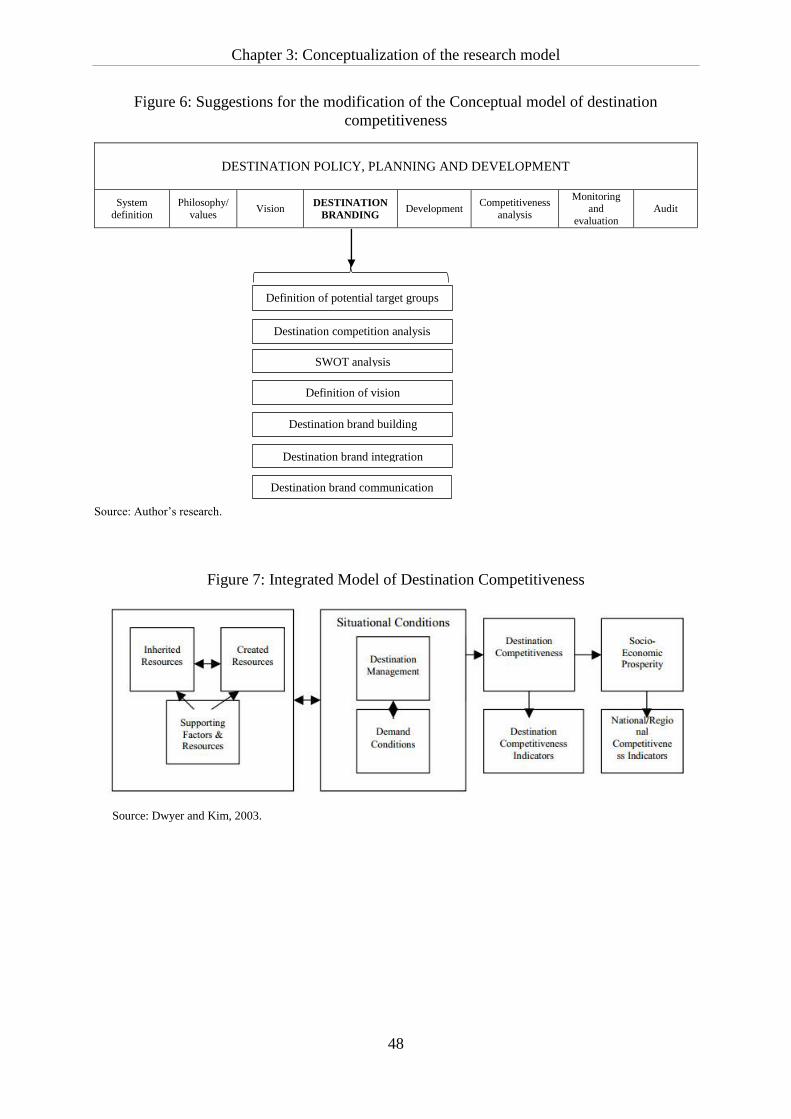
Chapter 3: Conceptualization of the research model
48
Figure 6: Suggestions for the modification of the Conceptual model of destination
competitiveness
DESTINATION POLICY, PLANNING AND DEVELOPMENT
System
definition
Philosophy/
values Vision
DESTINATION
BRANDING Development
Competitiveness
analysis
Monitoring and
evaluation
Audit
Source: Author’s research.
Figure 7: Integrated Model of Destination Competitiveness
Source: Dwyer and Kim, 2003.
Destination competition analysis
SWOT analysis
Definition of vision
Destination brand building
Destination brand integration
Destination brand communication
Definition of potential target groups
d
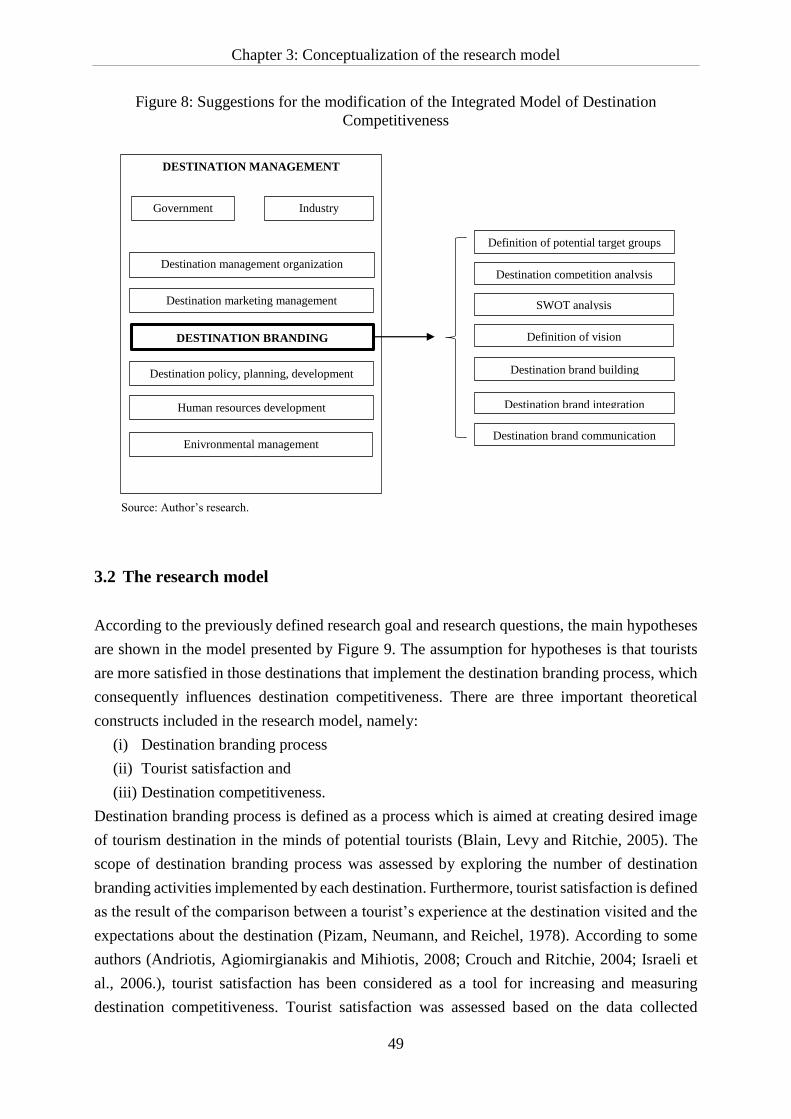
Chapter 3: Conceptualization of the research model
49
Figure 8: Suggestions for the modification of the Integrated Model of Destination
Competitiveness
Source: Author’s research.
3.2 The research model
According to the previously defined research goal and research questions, the main hypotheses
are shown in the model presented by Figure 9. The assumption for hypotheses is that tourists
are more satisfied in those destinations that implement the destination branding process, which
consequently influences destination competitiveness. There are three important theoretical
constructs included in the research model, namely:
(i) Destination branding process
(ii) Tourist satisfaction and
(iii) Destination competitiveness.
Destination branding process is defined as a process which is aimed at creating desired image
of tourism destination in the minds of potential tourists (Blain, Levy and Ritchie, 2005). The
scope of destination branding process was assessed by exploring the number of destination
branding activities implemented by each destination. Furthermore, tourist satisfaction is defined
as the result of the comparison between a tourist’s experience at the destination visited and the
expectations about the destination (Pizam, Neumann, and Reichel, 1978). According to some
authors (Andriotis, Agiomirgianakis and Mihiotis, 2008; Crouch and Ritchie, 2004; Israeli et
al., 2006.), tourist satisfaction has been considered as a tool for increasing and measuring
destination competitiveness. Tourist satisfaction was assessed based on the data collected
Definition of vision
DESTINATION MANAGEMENT
Government Industry
Destination management organization
Destination marketing management
DESTINATION BRANDING
Destination policy, planning, development
Human resources development
Enivronmental management
Definition of potential target groups
Destination competition analysis
SWOT analysis
Destination brand building
Destination brand integration
Destination brand communication
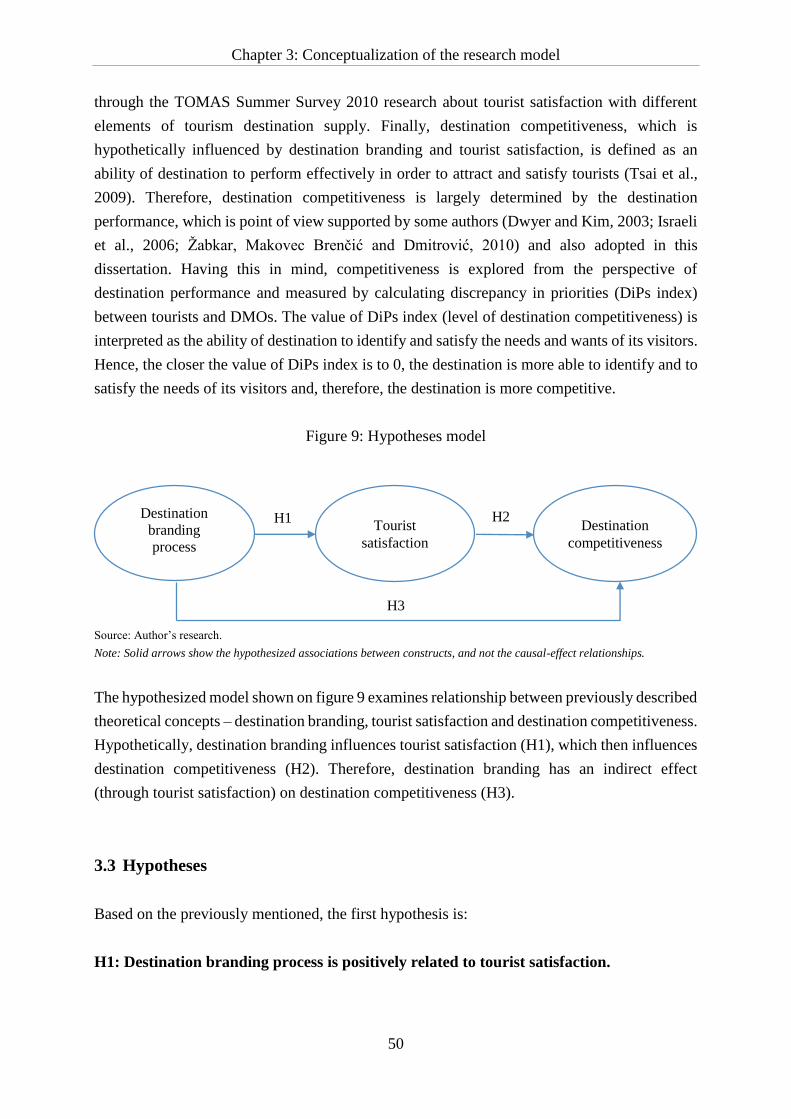
Chapter 3: Conceptualization of the research model
50
through the TOMAS Summer Survey 2010 research about tourist satisfaction with different
elements of tourism destination supply. Finally, destination competitiveness, which is
hypothetically influenced by destination branding and tourist satisfaction, is defined as an
ability of destination to perform effectively in order to attract and satisfy tourists (Tsai et al.,
2009). Therefore, destination competitiveness is largely determined by the destination
performance, which is point of view supported by some authors (Dwyer and Kim, 2003; Israeli
et al., 2006; Žabkar, Makovec Brenčić and Dmitrović, 2010) and also adopted in this
dissertation. Having this in mind, competitiveness is explored from the perspective of
destination performance and measured by calculating discrepancy in priorities (DiPs index)
between tourists and DMOs. The value of DiPs index (level of destination competitiveness) is
interpreted as the ability of destination to identify and satisfy the needs and wants of its visitors.
Hence, the closer the value of DiPs index is to 0, the destination is more able to identify and to
satisfy the needs of its visitors and, therefore, the destination is more competitive.
Figure 9: Hypotheses model
Source: Author’s research.
Note: Solid arrows show the hypothesized associations between constructs, and not the causal-effect relationships.
The hypothesized model shown on figure 9 examines relationship between previously described
theoretical concepts – destination branding, tourist satisfaction and destination competitiveness.
Hypothetically, destination branding influences tourist satisfaction (H1), which then influences
destination competitiveness (H2). Therefore, destination branding has an indirect effect
(through tourist satisfaction) on destination competitiveness (H3).
3.3 Hypotheses
Based on the previously mentioned, the first hypothesis is:
H1: Destination branding process is positively related to tourist satisfaction.
Tourist
satisfaction
Destination
competitiveness
Destination
branding
process
H2 H1
H3
Chapter 3: Conceptualization of the research model
51
The first hypothesis is tested with few auxiliary hypotheses, which are related to destination
branding process, and are defined on the basis of destination branding literature (Kotler et al.
1993; Paliaga, 2007; ETC/UNWTO, 2009):
H1a: Destination branding process is positively related to tourist satisfaction with cultural
beauties.
H1b: Destination branding process is positively related to tourist satisfaction with natural
beauties.
H1c: Destination branding process is positively related to tourist satisfaction with destination
picturesqueness.
H1d: Destination branding process is positively related to tourist satisfaction with variety of
entertainment opportunities.
H1e: Destination branding process is positively related to tourist satisfaction with quality of
accommodation.
H1f: Destination branding process is positively related to tourist satisfaction with quality of
gastronomic offer.
H1g: Destination branding process is positively related to tourist satisfaction with variety of
sport activities.
H1h: Destination branding process is positively related to tourist satisfaction with value for
money.
H1i: Destination branding process is positively related to tourist satisfaction with personal
safety.
H1j: Destination branding process is positively related to tourist satisfaction with hospitality
of residents.
H1k: Destination branding process is positively related to tourist satisfaction with destination
accessibility.
H1l: Destination branding process is positively related to tourist satisfaction with shopping
opportunities.
The second hypothesis is:
H2: Tourist satisfaction is positively related to destination competitiveness.
Auxiliary hypotheses are based on twelve elements of destination offer (TOMAS Summer
Survey, 2010). Both, satisfaction and importance of these elements for visiting destination, were
measured.
H2a: Tourist satisfaction with cultural heritage is positively related to destination
competitiveness.
Chapter 3: Conceptualization of the research model
52
H2b: Tourist satisfaction with natural beauties is positively related to destination
competitiveness.
H2c: Tourist satisfaction with destination picturesqueness is positively related to destination
competitiveness.
H2d: Tourist satisfaction with variety of entertainment opportunities is positively related to
destination competitiveness.
H2e: Tourist satisfaction with quality of accommodation is positively related to destination
competitiveness.
H2f: Tourist satisfaction with quality of gastronomic offer is positively related to destination
competitiveness.
H2g: Tourist satisfaction with wealth of sport activities is positively related to destination
competitiveness.
H2h: Tourist satisfaction with value for money is positively related to destination
competitiveness.
H2i: Tourist satisfaction with personal safety is positively related to destination
competitiveness.
H2j: Tourist satisfaction with hospitality of residents is positively related to destination
competitiveness.
H2k: Tourist satisfaction with accessibility of destination is positively related to destination
competitiveness.
H2l: Tourist satisfaction with shopping opportunities is positively related to destination
competitiveness.
Third hypothesis is:
H3: Destination branding process is positively related to destination competitiveness.
Auxiliary hypotheses are based on destination branding process elements:
H3a: Potential target groups’ definition is positively related to destination competitiveness.
H3b: Destination competition analysis is positively related to destination competitiveness.
H3c: SWOT analysis is positively related to destination competitiveness.
H3d: Definition of vision is positively related to destination competitiveness.
H3e: Destination brand building is positively related to destination competitiveness.
H3f: Destination brand integration is positively related to destination competitiveness.
H3g: Destination brand communication is positively related to destination competitiveness.
Chapter 4: Research methodology
53
4 RESEARCH METHODOLOGY
Two basic research methods were used for the purposes of the dissertation – desk research and
exploratory research, both explained in more detail in the following text.
4.1 Desk research
The desk research included an overview of current literature in destination competitiveness and
destination branding field, as well as the secondary data analysis. Various scientific and
professional articles covering different aspects of destination competitiveness and destination
branding were analyzed. Some of the journals most commonly used for compiling literature
review include following:
• Acta Turistica,
• Annals of Tourism Research,
• Current Issues in Tourism,
• International Journal of Contemporary Hospitality Management,
• Journal of Brand Management,
• Journal of Hospitality and Tourism Management,
• Journal of Hospitality and Tourism Technology,
• Journal of Travel Research,
• Journal of Vacation Marketing,
• Place Branding and Public Diplomacy,
Tourism Economics
• Tourism Management,
• Tourism Review, and
• Tourism - An International Interdisciplinary Journal.
Apart from the mentioned scientific journals, various books and textbooks covering topics
related to tourism destination management, destination marketing and destination branding
were also used for the literature review, in order to define the following:
• Research goal and research questions,
• Research hypotheses,
• Research methods, and
• Methods of research results interpretation and dissemination.
Chapter 4: Research methodology
54
Secondary data analysis included data collected through TOMAS Summer Survey 2010 on
attitudes and expenditures of tourists in Croatia’s seaside destinations, conducted by the
Institute for Tourism, Zagreb. The survey was conducted on a sample of 4,973 respondents
interviewed in 85 seaside destinations in Croatia during the peak tourism season, from mid-
June to the end of September of 2010. This dissertation utilized only a smaller part of the data
set collected for the abovementioned survey. In particular, the data on tourist satisfaction with
different elements of tourism destination supply and the data on the importance (influence) of
different elements of tourism destination supply for the destination choice were used. Tourist
satisfaction was measured on a five-point Likert scale (1=very poor and 5=excellent) and
importance for destination choice was measured on a six-point Likert scale (1 = totally
irrelevant and 6 = extremely important).
TOMAS Summer Survey is a longitudinal survey periodically conducted by the Institute for
Tourism, Zagreb (since 1987) which collects data from domestic and foreign tourists who are
close to the end of their stay in Croatia’s coastal destinations. The main objectives of the survey
are: (i) to determine tourism market segmentation, (ii) to identify major strengths and
weaknesses of tourism supply in Croatia’s coastal destinations, (iii) to determine characteristics
of tourism expenditures and (iv) to monitor trends of inbound and outbound tourism demand.
The instrument of data collection was a structured questionnaire (printed on a single sheet of
A3 paper size) available in twelve languages: Croatian, German, English, Italian, French,
Spanish, Slovenian, Czech, Slovak, Hungarian, Polish and Russian. The majority of questions
were closed-ended questions with predefined answers. The exceptions were questions about the
age of respondents, the number of accompanying persons, the length of stay on the journey and
in the destination, and the questions concerning respondent’s travel expenditures, which were
open-ended questions (Marušić, Čorak, Sever and Ivandić, 2011). Specifically, the questions
utilized in this study were questions labelled as D1 and D3, formulated as follows:
D1: “Please, indicate how satisfied you are with tourism product and services in the place
where you are staying?”
D3: “How important were the following aspects in your decision to visit this destination?”
The questions consist of 27 and 14 elements of tourism destination supply, out of which 12
elements are being used in this research. The used elements were suitable for the research scope.
The method of data collection was a personal interview conducted by the specialized market
research agency, whose interviewers had previously been specially trained by experts from the
Institute for Tourism. Additionally, the Institute was also responsible for the overall
prearrangement of the field work, which includes: (i) definition of the questionnaire content,
(ii) questionnaire design and printing, (iii) preparation of instructions for the interviewers, (iv)
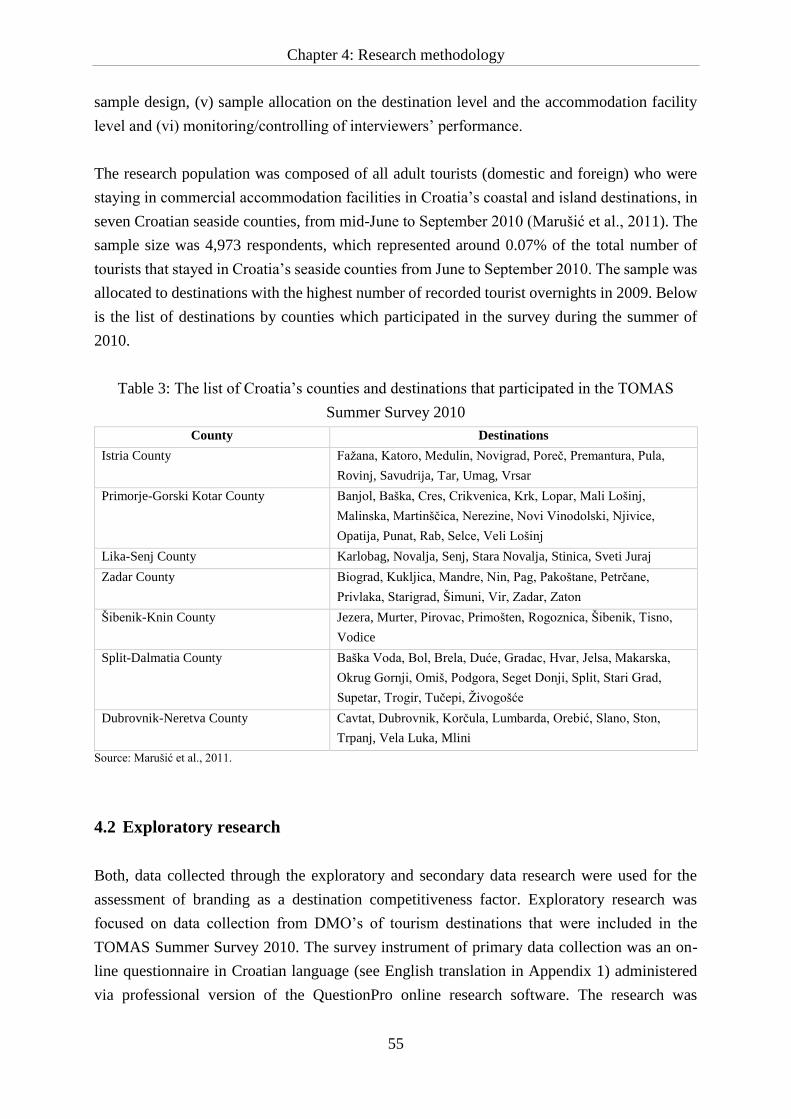
Chapter 4: Research methodology
55
sample design, (v) sample allocation on the destination level and the accommodation facility
level and (vi) monitoring/controlling of interviewers’ performance.
The research population was composed of all adult tourists (domestic and foreign) who were
staying in commercial accommodation facilities in Croatia’s coastal and island destinations, in
seven Croatian seaside counties, from mid-June to September 2010 (Marušić et al., 2011). The
sample size was 4,973 respondents, which represented around 0.07% of the total number of
tourists that stayed in Croatia’s seaside counties from June to September 2010. The sample was
allocated to destinations with the highest number of recorded tourist overnights in 2009. Below
is the list of destinations by counties which participated in the survey during the summer of
2010.
Table 3: The list of Croatia’s counties and destinations that participated in the TOMAS
Summer Survey 2010
County Destinations
Istria County Fažana, Katoro, Medulin, Novigrad, Poreč, Premantura, Pula,
Rovinj, Savudrija, Tar, Umag, Vrsar
Primorje-Gorski Kotar County Banjol, Baška, Cres, Crikvenica, Krk, Lopar, Mali Lošinj,
Malinska, Martinščica, Nerezine, Novi Vinodolski, Njivice,
Opatija, Punat, Rab, Selce, Veli Lošinj
Lika-Senj County Karlobag, Novalja, Senj, Stara Novalja, Stinica, Sveti Juraj
Zadar County Biograd, Kukljica, Mandre, Nin, Pag, Pakoštane, Petrčane,
Privlaka, Starigrad, Šimuni, Vir, Zadar, Zaton
Šibenik-Knin County Jezera, Murter, Pirovac, Primošten, Rogoznica, Šibenik, Tisno,
Vodice
Split-Dalmatia County Baška Voda, Bol, Brela, Duće, Gradac, Hvar, Jelsa, Makarska,
Okrug Gornji, Omiš, Podgora, Seget Donji, Split, Stari Grad,
Supetar, Trogir, Tučepi, Živogošće
Dubrovnik-Neretva County Cavtat, Dubrovnik, Korčula, Lumbarda, Orebić, Slano, Ston,
Trpanj, Vela Luka, Mlini
Source: Marušić et al., 2011.
4.2 Exploratory research
Both, data collected through the exploratory and secondary data research were used for the
assessment of branding as a destination competitiveness factor. Exploratory research was
focused on data collection from DMO’s of tourism destinations that were included in the
TOMAS Summer Survey 2010. The survey instrument of primary data collection was an on-
line questionnaire in Croatian language (see English translation in Appendix 1) administered
via professional version of the QuestionPro online research software. The research was
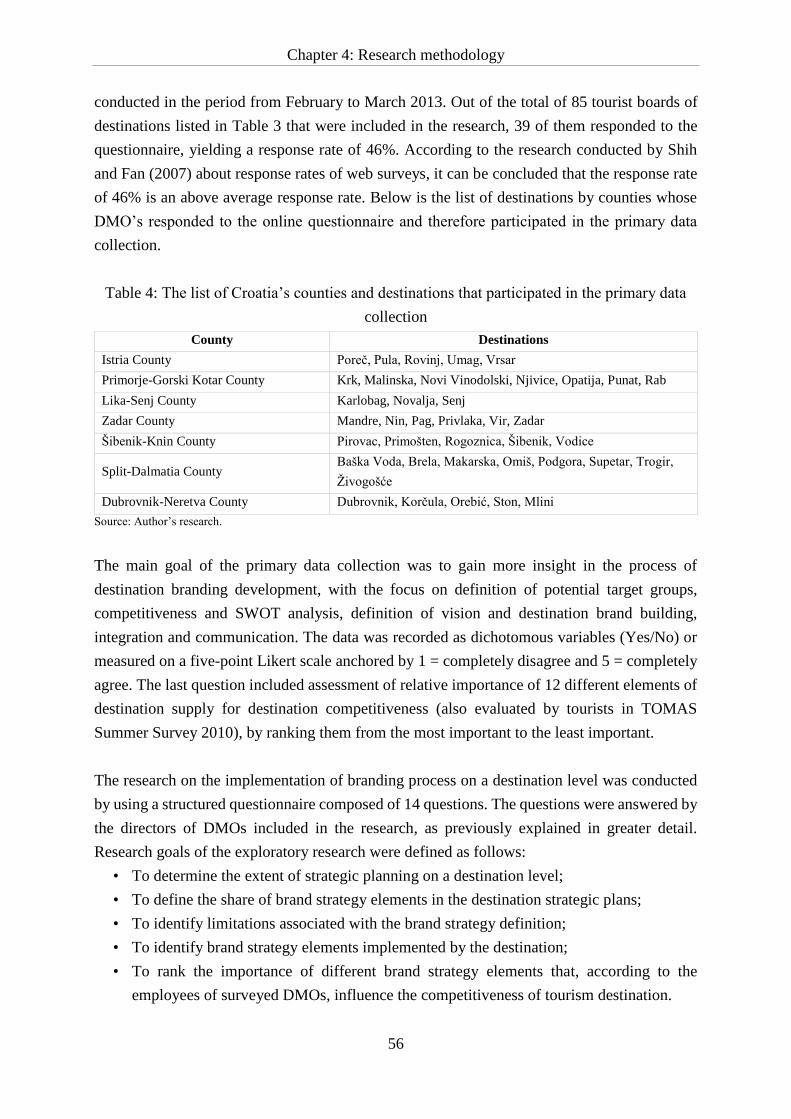
Chapter 4: Research methodology
56
conducted in the period from February to March 2013. Out of the total of 85 tourist boards of
destinations listed in Table 3 that were included in the research, 39 of them responded to the
questionnaire, yielding a response rate of 46%. According to the research conducted by Shih
and Fan (2007) about response rates of web surveys, it can be concluded that the response rate
of 46% is an above average response rate. Below is the list of destinations by counties whose
DMO’s responded to the online questionnaire and therefore participated in the primary data
collection.
Table 4: The list of Croatia’s counties and destinations that participated in the primary data
collection
County Destinations
Istria County Poreč, Pula, Rovinj, Umag, Vrsar
Primorje-Gorski Kotar County Krk, Malinska, Novi Vinodolski, Njivice, Opatija, Punat, Rab
Lika-Senj County Karlobag, Novalja, Senj
Zadar County Mandre, Nin, Pag, Privlaka, Vir, Zadar
Šibenik-Knin County Pirovac, Primošten, Rogoznica, Šibenik, Vodice
Split-Dalmatia County Baška Voda, Brela, Makarska, Omiš, Podgora, Supetar, Trogir,
Živogošće
Dubrovnik-Neretva County Dubrovnik, Korčula, Orebić, Ston, Mlini
Source: Author’s research.
The main goal of the primary data collection was to gain more insight in the process of
destination branding development, with the focus on definition of potential target groups,
competitiveness and SWOT analysis, definition of vision and destination brand building,
integration and communication. The data was recorded as dichotomous variables (Yes/No) or
measured on a five-point Likert scale anchored by 1 = completely disagree and 5 = completely
agree. The last question included assessment of relative importance of 12 different elements of
destination supply for destination competitiveness (also evaluated by tourists in TOMAS
Summer Survey 2010), by ranking them from the most important to the least important.
The research on the implementation of branding process on a destination level was conducted
by using a structured questionnaire composed of 14 questions. The questions were answered by
the directors of DMOs included in the research, as previously explained in greater detail.
Research goals of the exploratory research were defined as follows:
• To determine the extent of strategic planning on a destination level;
• To define the share of brand strategy elements in the destination strategic plans;
• To identify limitations associated with the brand strategy definition;
• To identify brand strategy elements implemented by the destination;
• To rank the importance of different brand strategy elements that, according to the
employees of surveyed DMOs, influence the competitiveness of tourism destination.
Chapter 4: Research methodology
57
The questionnaire used for exploratory research can be found in Appendix 1 of this dissertation.
The methods of exploratory research included descriptive statistics with frequency analysis of
all variables included in the branding process. Relative importance of different elements of
destination supply was compared between DMOs (assessed in primary research) and tourists
(assessed in TOMAS Summer Survey 2010) and formed a basis for evaluating DMOs
performance. It is important to emphasize that tourist boards in Croatia have the role that is
commonly performed by destination management organization (DMO), therefore the term
DMO is used onwards in this chapter. A Discrepancy in Priorities index (DiPs) index was
created in order to group destinations with above average (median) and below average (equal
or below median) compatibility of priorities. Median was used as a measure of central tendency
as distribution of values of DiPs index was not normal. Normality was assessed by Shapiro-
Wilk test and Normal probability plot. Box plots were used to compare distributions of DiPs
index between destinations with different values (i.e. condition) of branding process elements.
Furthermore, the relationship between destination branding and DMOs performance was tested
by Chi-square test (for dichotomous variables) and Wilcoxon Rank Sum test (for ordinal
variables, i.e. those measured on a Likert scale). The magnitude of relationship, besides
statistical significance, was also evaluated by the effect size, which adjusts test statistic by
sample size and thus represents a robust comparative measure. Phi coefficient was used as a
measure of effect size for Chi-square test and Cohen’s r for Wilcoxon Rank Sum test. Absolute
values of these coefficients above 0.5 indicate a high association between variables, from 0.3
to 0.5 a moderate association, from 0.1 to 0.3 a low association and below 0.1 no association
(Cohen, 1988; Crewson, 2006). The multivariate effect of branding process elements on DMOs
performance was analyzed by logistic regression. Univariate logistic regression analysis was
conducted for each branding process indicator, with p < 0.25 being the criterion for acceptance
in the multivariate model. The main problem in defining a multivariate model is choosing from
a large set of covariates that should be included in the best model. This decision is usually based
on the statistical significance. A p-value of 0.25 from univariate analysis is often used as a
threshold value for initial selection of variables into a multivariate model, where any variable
with a p-value below 0.25 is selected (Hosmer and Lemeshow, 2000; Bursac, Gauss, Williams
and Homser, 2008). More traditional significance levels such as 0.05 can fail in identifying all
important variables in multivariate analysis (Bursac et al., 2008). Collinearity was checked with
a matrix of correlations, using the Spearman rank correlation coefficient between independent
variables. A conservative strategy was adopted, with r ≥ 0.4 as the criterion for
multicollinearity. In the case of collinearity, the variable with the largest effect on the outcome
was retained for model fitting.
Chapter 4: Research methodology
58
To evaluate the effect of DMOs performance on tourist satisfaction, an importance-performance
analysis (IPA) was applied. Importance-performance analysis (IPA) is a popular research
framework as well as intuitive and low-cost analytical tool that is frequently used to analyze
priorities and detect possible areas for improvements in complex and multi-attribute
environments (Tyrrell and Okrant, 2004; Krešić, Mikulić and Miličević, 2013). Since it was
originally developed and introduced by Martilla and James (1977) it was regularly applied in
many areas of research, especially for the research of customer satisfaction in tourism and
hospitality. The underlying idea of IPA methodology is to measure stated importance and stated
performance of different attributes studied (i.e. elements of tourism destination supply) and to
plot those values against each other on a two dimensional chart (the importance on the “y-axis”
and the performance on the “x-axis”), producing an IPA matrix with four quadrants, wherein
the cut points (thresholds) are being set to arithmetic means of measured attribute importance
and measured attribute performance. Each of the resulting IPA quadrants have different
managerial implications, depending on the position of specific attribute across the matrix.
Quadrant A is a quadrant with high importance and low performance, therefore it is known as
the “concentrate here” quadrant. Quadrant B is a quadrant with high importance and high
performance, therefore it is known as the “keep up the good work” quadrant. Quadrant C is a
quadrant with low importance and low performance, therefore known as the “low priority”
quadrant. Finally, quadrant D is a quadrant with low importance and high performance, known
as the “possible overkill” quadrant. Even though traditional IPA methodology has suffered
much criticism throughout the years, mostly relating to operationalization of attribute
importance (i.e. stated vs. derived importance, see Mikulić and Prebežac, 2012), due to its
simplicity and wide applicability, it has remained one of the most popular analytical techniques
in the research area of tourism.
To enable proper analysis and interpretation of differences in satisfaction and importance
scores, as the latter were measured on a different scale, importance scores were rescaled to a
five-point scale prior to analysis by using linear transformation technique. IPA plot was divided
into quadrants with the cut points placed at overall satisfaction and importance means.
Furthermore, relationship between DMOs performance and proportion of elements in each
quadrant was tested by Chi-square test. As contingency table had more than four cells, Cramer’s
V was used as a measure of effect size instead of Phi coefficient (the same interpretation) to
adjust the Chi-square statistic by both sample size and number of dimensions.
Besides IPA, relationship between DMOs performance and tourist satisfaction was assessed by
comparison of mean differences in tourist satisfaction and importance of different destination
attributes between destinations with above average and (below) average DMO’s performance.
Inspection of the data indicated that assumptions of normality and variance homogeneity were
met. Sample size was 2,977 respondents and included respondents from those destinations
Chapter 4: Research methodology
59
whose DMOs were involved in primary data collection regarding the destination branding
process. Due to the large sample size (n=2,977), increasing sensitivity of normality tests with
sample size, normality of data was assessed graphically, by examining Normal Probability plot,
and by examining data skewness and kurtosis. Also, the Central Limit Theorem could be
applied. Heteroscedasticity was tested by Box-Cox test and indicated a homogenous variance.
Due to the clustered data (multiple observations from the same destination), statistical
assumption about independent observations was violated. Not accounting for within cluster
correlation would lead to biased standard errors of model parameters, usually underestimated,
and artificially low p-values. To account for this correlation, Generalized Estimating Equations
(GEE) model was applied, an extension of the Generalized Linear Models. Correlation within
clusters was assumed exchangeable, i.e. the correlation between any two observations from the
same cluster was assumed to be the same. Thereby, normal distribution with identity link
function and exchangeable correlation structure were used as a part of GEE model settings.
Presented results included means, standard errors and 95% confidence intervals and p-values.
The significance level was set at 0.05. Taking into account primary research design, the nature
of the test, the level of statistical significance (0.05) and aimed statistical power of 80%, the
obtained sample size (n=39) was sufficient to reliably detect large effect sizes in both Chi-
square and Wilcoxon Rank Sum tests. Due to a larger sample size of secondary data (TOMAS
Summer Survey 2010), tests performed on this data were more powerful and could reliably
detect even small effect sizes. The analysis was performed using SAS system version 8.2 (SAS
Institute Inc., North Carolina, USA) and G*Power software (Heinrich-Heine-University
Düsseldorf, Düsseldorf, Germany).
On the other hand, the exploratory research was focused on data collection from Croatia’s
DMOs in coastal destinations (n=85; the same destinations as in TOMAS Summer Survey
2010) on destination branding process development, more specifically on potential target
groups’ definition, competitiveness and SWOT analysis, definition of vision and destination
brand building, integration and communication. As previously mentioned, an online
questionnaire was used as a survey instrument.
The results obtained served to confirm or reject previously defined research hypotheses, and
are presented and analyzed in more detail in Chapter 4 of the dissertation.
4.3 Study setting – Croatian seaside destinations
As mentioned earlier, the area frame of the research covers seven Croatian seaside counties
which generated more than 95% of the total number of officially recorded tourist overnights in
Croatia during 2013. Overall, there were 39 destinations that participated in the research (listed
Chapter 4: Research methodology
60
in Table 4) and those destinations generated slightly less than 50% of the total number of
officially recorded tourist overnights in Croatia during 2013. The largest number of destinations
that participated in the research was from the Split-Dalmatia County (8 destinations) and
Primorje-Gorski Kotar County (7 destinations), while the lowest number of destinations was
from Lika-Senj County (3 destinations). In relative terms, analyzed destination from Istria
County (5 destinations) and Primorje-Gorski Kotar County (7 destinations) accounted for the
largest share of the total number of officially recorded overnight in Croatia in 2013, 15% and
8.3% respectively. At the other hand, analyzed destinations from Lika-Senj County accounted
for only 2.5% of the officially recorded number of overnights in Croatia in 2013. The following
text provides an overview of the most important features for each of the analyzed counties,
including geographical features as well as quantitative and qualitative characteristics of tourism
demand.
4.3.1 Istria County
Istria County is the northernmost seaside county in Croatia, which is covering most of the Istria
peninsula. According to 2011 census, population of Istria County amounted to 208.4 thousands
which represents around 4.65% of the population of the Republic of Croatia. It covers area of
2,820 km2 (5% of the total area of the Republic of Croatia) and population density is 74
inhabitants per square kilometer. The length of coastline in Istria County is 539 km and can be
characterized as moderately indented.
Istria County is, economically as well as touristically, the most developed region of Croatia. In
2013, there were around 19.4 million of tourist overnights recorded in Istria County, which is
slightly less than one third (30%) of the total number of officially recorded overnights in Croatia
in 2013. The most important tourism generating markets for Istria County in 2013 were
Germany (32% of overnights), Austria (12% of overnights) and Slovenia (11% of overnights).
During 2013, the average length of stay in Istria County was 6.5 days. Most visited types of
accommodation facilities in Istria County in 2013 were camps (44% of overnights), hotels (22%
of overnights) and private accommodation (17% of overnights).Tourism demand of Istria
County can be considered as highly seasonal, since around 75% of the total number of
overnights is recorded in summer period (June-August).
According to the results of TOMAS Summer 2010 research on attitudes and expenditures of
tourist in Croatia, the average tourist visiting Istria County is middle aged (30-49 years), comes
with family members, has higher level of education with an average monthly household income
between 1,500 and 3,000 EUR (57%). The most important motivation for tourist visiting Istria
County is rest and relaxation (74.1%), entertainment (52.9%) and gastronomy (25.9%). The
Chapter 4: Research methodology
61
most important factors for destination choice among tourist visiting Istria County are
friendliness (61.6%), acceptable prices (59.3%), beauty of nature (58.9%) and quality of
restaurants (58.8%). Average daily expenditure of tourists visiting Istria County is 66.63 EUR
which is slightly above national average, which is 58.00 EUR.
4.3.2 Primorje-Gorski Kotar County
Primorje-Gorski Kotar County is located in the north-western part of Croatia and it is bordering
with the Republic of Slovenia in the north, with Karlovac County and Lika-Senj County in the
east and with the Zadar County in the south-east. According to 2011 census, the population of
Primorje-Gorski Kotar County was 296.1 thousands, which represents around 7% of the
population of the Republic of Croatia. Its area size is 3,582 km2 (6.3% of the total area of the
Republic of Croatia) and population density is 83 inhabitants per square kilometer. The length
if coastline in Primorje-Gorski Kotar County is 1,065 km. It is characterized by extremely
diversified landscape, including mountains, coast and islands.
Primorje-Gorski Kotar County is, alongside Istria County, one of the economically as well as
touristically, most developed regions of Croatia. According to the data available from Croatian
Bureau of Statistics, Primorje-Gorski Kotar County recorded 12.3 millions of tourist overnights
and 2.4 millions of tourist arrivals in 2013, which is around 19% of the total number of officially
recorded overnights and arrivals in Croatia during 2013. The most important tourism generating
countries for Primorje-Gorski Kotar County were Germany (27.8% of overnights), Slovenia
(13.7% of overnights) and Austria (10.9% of overnights). During 2013, the average length of
stay in Primorje-Gorski Kotar County was 5.2 days. Most visited types of accommodation
facilities in Primorje-Gorski Kotar County in 2013 were private accommodation facilities,
camps and hotels, with 35.8%, 26.8% and 24.7% of overnights, respectively.
According to the results of TOMAS Summer 2010 research on attitudes and expenditures of
tourist in Croatia, the average tourist visiting Primorje-Gorski Kotar County is middle aged (30-
49 years), comes mostly with family members (44%) or with partner (41%), has middle (46%)
or higher level of education (54%), with an average monthly household income between 1,500
and 3,000 EUR (60%). The most important motivation for tourist visiting Primorje-Gorski
Kotar County is rest and relaxation (78.6%), followed by entertainment (54.4%) and new
experiences (36.3%). The most important factors for destination choice among tourist visiting
Primorje-Gorski Kotar County are personal safety (81.6%), acceptable prices (72.3%),
friendliness (64.4%) and image of the country (58.5%). Average daily expenditure of tourists
visiting Primorje-Gorski Kotar County is 56.20 EUR, which is slightly below national average
(58.00 EUR) and well below the average of the neighboring Istria County (66.63 EUR).
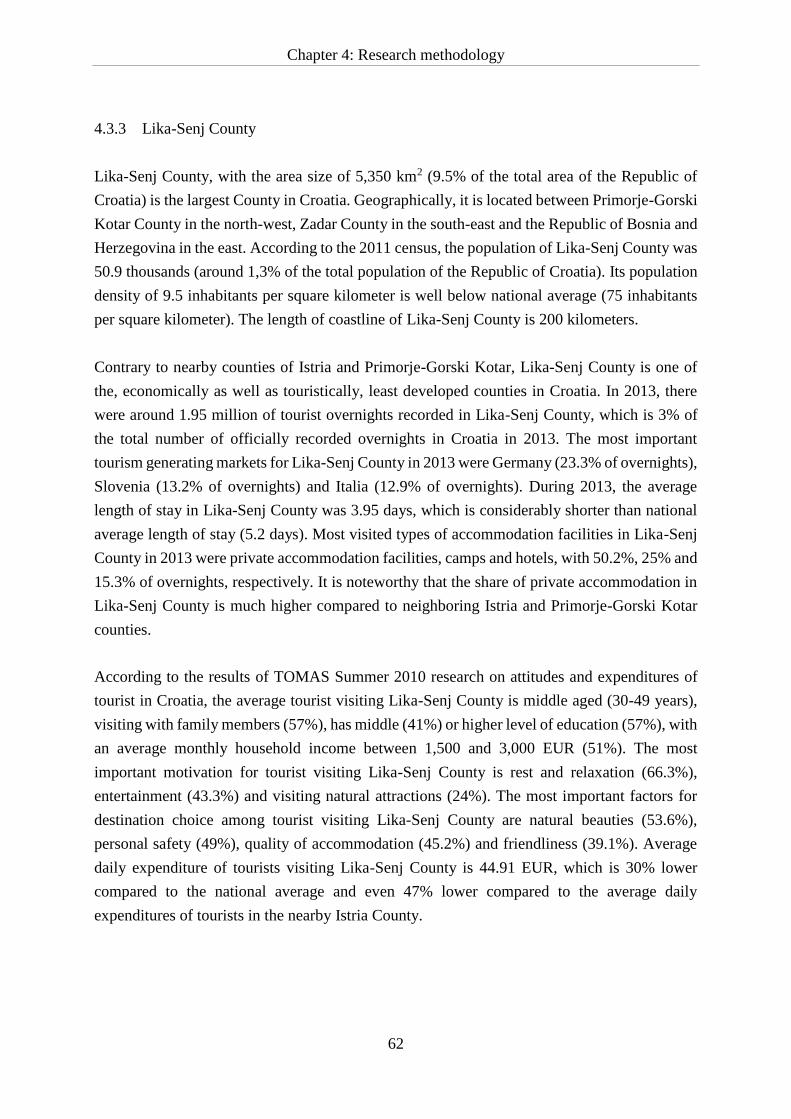
Chapter 4: Research methodology
62
4.3.3 Lika-Senj County
Lika-Senj County, with the area size of 5,350 km2 (9.5% of the total area of the Republic of
Croatia) is the largest County in Croatia. Geographically, it is located between Primorje-Gorski
Kotar County in the north-west, Zadar County in the south-east and the Republic of Bosnia and
Herzegovina in the east. According to the 2011 census, the population of Lika-Senj County was
50.9 thousands (around 1,3% of the total population of the Republic of Croatia). Its population
density of 9.5 inhabitants per square kilometer is well below national average (75 inhabitants
per square kilometer). The length of coastline of Lika-Senj County is 200 kilometers.
Contrary to nearby counties of Istria and Primorje-Gorski Kotar, Lika-Senj County is one of
the, economically as well as touristically, least developed counties in Croatia. In 2013, there
were around 1.95 million of tourist overnights recorded in Lika-Senj County, which is 3% of
the total number of officially recorded overnights in Croatia in 2013. The most important
tourism generating markets for Lika-Senj County in 2013 were Germany (23.3% of overnights),
Slovenia (13.2% of overnights) and Italia (12.9% of overnights). During 2013, the average
length of stay in Lika-Senj County was 3.95 days, which is considerably shorter than national
average length of stay (5.2 days). Most visited types of accommodation facilities in Lika-Senj
County in 2013 were private accommodation facilities, camps and hotels, with 50.2%, 25% and
15.3% of overnights, respectively. It is noteworthy that the share of private accommodation in
Lika-Senj County is much higher compared to neighboring Istria and Primorje-Gorski Kotar
counties.
According to the results of TOMAS Summer 2010 research on attitudes and expenditures of
tourist in Croatia, the average tourist visiting Lika-Senj County is middle aged (30-49 years),
visiting with family members (57%), has middle (41%) or higher level of education (57%), with
an average monthly household income between 1,500 and 3,000 EUR (51%). The most
important motivation for tourist visiting Lika-Senj County is rest and relaxation (66.3%),
entertainment (43.3%) and visiting natural attractions (24%). The most important factors for
destination choice among tourist visiting Lika-Senj County are natural beauties (53.6%),
personal safety (49%), quality of accommodation (45.2%) and friendliness (39.1%). Average
daily expenditure of tourists visiting Lika-Senj County is 44.91 EUR, which is 30% lower
compared to the national average and even 47% lower compared to the average daily
expenditures of tourists in the nearby Istria County.
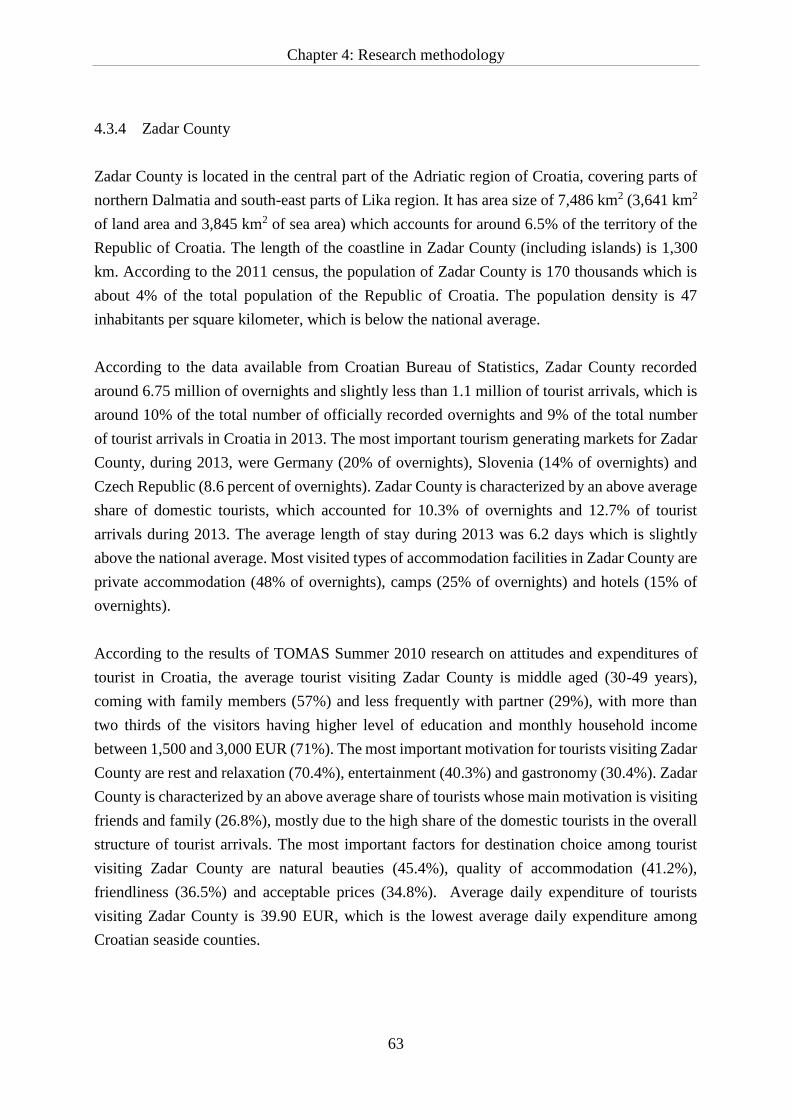
Chapter 4: Research methodology
63
4.3.4 Zadar County
Zadar County is located in the central part of the Adriatic region of Croatia, covering parts of
northern Dalmatia and south-east parts of Lika region. It has area size of 7,486 km2 (3,641 km2
of land area and 3,845 km2 of sea area) which accounts for around 6.5% of the territory of the
Republic of Croatia. The length of the coastline in Zadar County (including islands) is 1,300
km. According to the 2011 census, the population of Zadar County is 170 thousands which is
about 4% of the total population of the Republic of Croatia. The population density is 47
inhabitants per square kilometer, which is below the national average.
According to the data available from Croatian Bureau of Statistics, Zadar County recorded
around 6.75 million of overnights and slightly less than 1.1 million of tourist arrivals, which is
around 10% of the total number of officially recorded overnights and 9% of the total number
of tourist arrivals in Croatia in 2013. The most important tourism generating markets for Zadar
County, during 2013, were Germany (20% of overnights), Slovenia (14% of overnights) and
Czech Republic (8.6 percent of overnights). Zadar County is characterized by an above average
share of domestic tourists, which accounted for 10.3% of overnights and 12.7% of tourist
arrivals during 2013. The average length of stay during 2013 was 6.2 days which is slightly
above the national average. Most visited types of accommodation facilities in Zadar County are
private accommodation (48% of overnights), camps (25% of overnights) and hotels (15% of
overnights).
According to the results of TOMAS Summer 2010 research on attitudes and expenditures of
tourist in Croatia, the average tourist visiting Zadar County is middle aged (30-49 years),
coming with family members (57%) and less frequently with partner (29%), with more than
two thirds of the visitors having higher level of education and monthly household income
between 1,500 and 3,000 EUR (71%). The most important motivation for tourists visiting Zadar
County are rest and relaxation (70.4%), entertainment (40.3%) and gastronomy (30.4%). Zadar
County is characterized by an above average share of tourists whose main motivation is visiting
friends and family (26.8%), mostly due to the high share of the domestic tourists in the overall
structure of tourist arrivals. The most important factors for destination choice among tourist
visiting Zadar County are natural beauties (45.4%), quality of accommodation (41.2%),
friendliness (36.5%) and acceptable prices (34.8%). Average daily expenditure of tourists
visiting Zadar County is 39.90 EUR, which is the lowest average daily expenditure among
Croatian seaside counties.
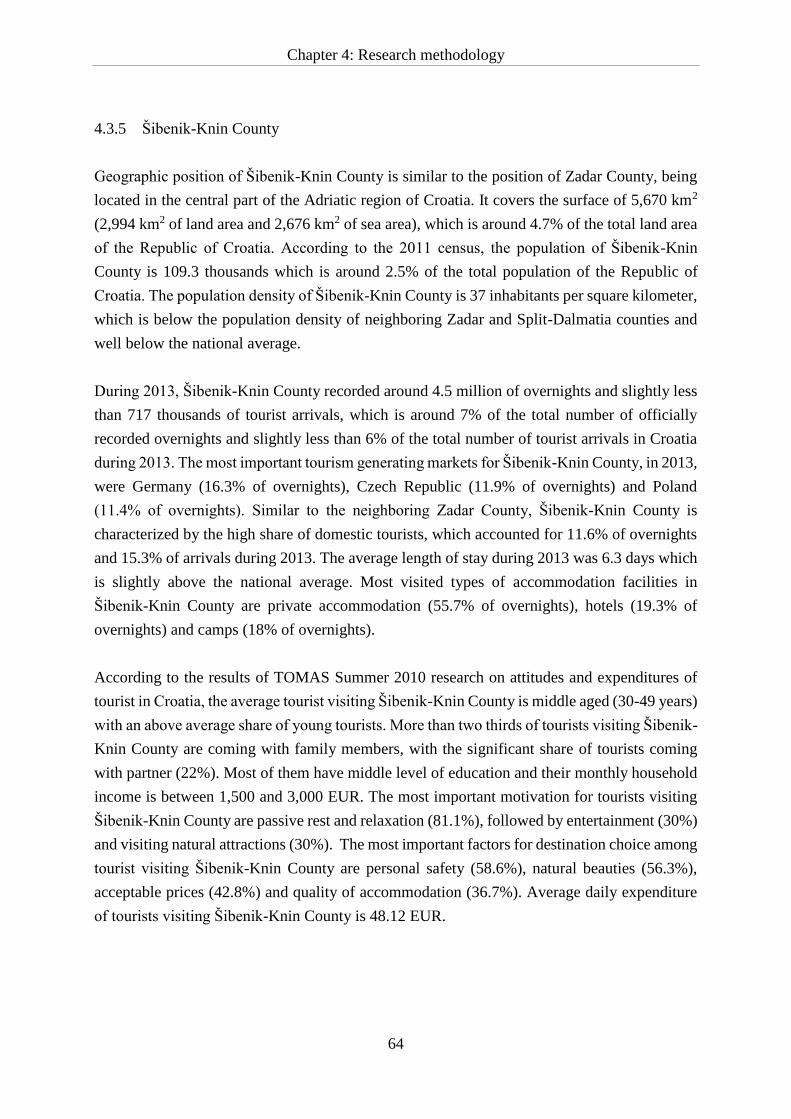
Chapter 4: Research methodology
64
4.3.5 Šibenik-Knin County
Geographic position of Šibenik-Knin County is similar to the position of Zadar County, being
located in the central part of the Adriatic region of Croatia. It covers the surface of 5,670 km2
(2,994 km2 of land area and 2,676 km2 of sea area), which is around 4.7% of the total land area
of the Republic of Croatia. According to the 2011 census, the population of Šibenik-Knin
County is 109.3 thousands which is around 2.5% of the total population of the Republic of
Croatia. The population density of Šibenik-Knin County is 37 inhabitants per square kilometer,
which is below the population density of neighboring Zadar and Split-Dalmatia counties and
well below the national average.
During 2013, Šibenik-Knin County recorded around 4.5 million of overnights and slightly less
than 717 thousands of tourist arrivals, which is around 7% of the total number of officially
recorded overnights and slightly less than 6% of the total number of tourist arrivals in Croatia
during 2013. The most important tourism generating markets for Šibenik-Knin County, in 2013,
were Germany (16.3% of overnights), Czech Republic (11.9% of overnights) and Poland
(11.4% of overnights). Similar to the neighboring Zadar County, Šibenik-Knin County is
characterized by the high share of domestic tourists, which accounted for 11.6% of overnights
and 15.3% of arrivals during 2013. The average length of stay during 2013 was 6.3 days which
is slightly above the national average. Most visited types of accommodation facilities in
Šibenik-Knin County are private accommodation (55.7% of overnights), hotels (19.3% of
overnights) and camps (18% of overnights).
According to the results of TOMAS Summer 2010 research on attitudes and expenditures of
tourist in Croatia, the average tourist visiting Šibenik-Knin County is middle aged (30-49 years)
with an above average share of young tourists. More than two thirds of tourists visiting Šibenik-
Knin County are coming with family members, with the significant share of tourists coming
with partner (22%). Most of them have middle level of education and their monthly household
income is between 1,500 and 3,000 EUR. The most important motivation for tourists visiting
Šibenik-Knin County are passive rest and relaxation (81.1%), followed by entertainment (30%)
and visiting natural attractions (30%). The most important factors for destination choice among
tourist visiting Šibenik-Knin County are personal safety (58.6%), natural beauties (56.3%),
acceptable prices (42.8%) and quality of accommodation (36.7%). Average daily expenditure
of tourists visiting Šibenik-Knin County is 48.12 EUR.
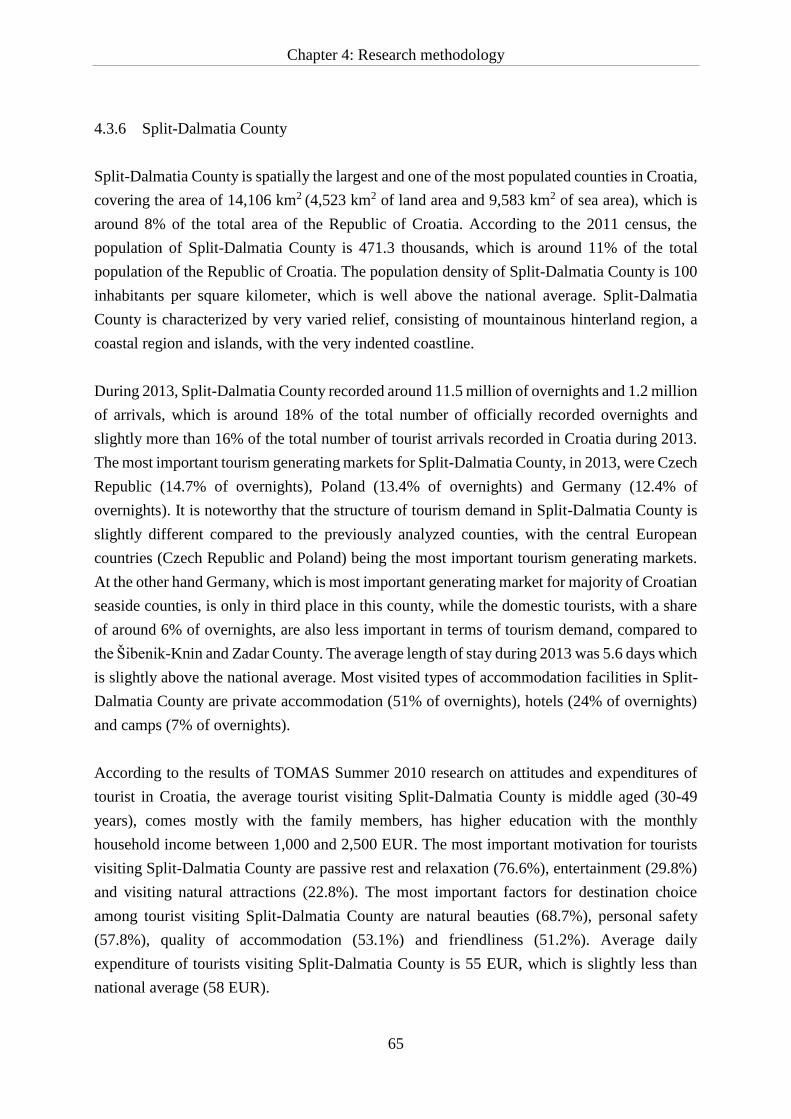
Chapter 4: Research methodology
65
4.3.6 Split-Dalmatia County
Split-Dalmatia County is spatially the largest and one of the most populated counties in Croatia,
covering the area of 14,106 km2 (4,523 km2 of land area and 9,583 km2 of sea area), which is
around 8% of the total area of the Republic of Croatia. According to the 2011 census, the
population of Split-Dalmatia County is 471.3 thousands, which is around 11% of the total
population of the Republic of Croatia. The population density of Split-Dalmatia County is 100
inhabitants per square kilometer, which is well above the national average. Split-Dalmatia
County is characterized by very varied relief, consisting of mountainous hinterland region, a
coastal region and islands, with the very indented coastline.
During 2013, Split-Dalmatia County recorded around 11.5 million of overnights and 1.2 million
of arrivals, which is around 18% of the total number of officially recorded overnights and
slightly more than 16% of the total number of tourist arrivals recorded in Croatia during 2013.
The most important tourism generating markets for Split-Dalmatia County, in 2013, were Czech
Republic (14.7% of overnights), Poland (13.4% of overnights) and Germany (12.4% of
overnights). It is noteworthy that the structure of tourism demand in Split-Dalmatia County is
slightly different compared to the previously analyzed counties, with the central European
countries (Czech Republic and Poland) being the most important tourism generating markets.
At the other hand Germany, which is most important generating market for majority of Croatian
seaside counties, is only in third place in this county, while the domestic tourists, with a share
of around 6% of overnights, are also less important in terms of tourism demand, compared to
the Šibenik-Knin and Zadar County. The average length of stay during 2013 was 5.6 days which
is slightly above the national average. Most visited types of accommodation facilities in Split-
Dalmatia County are private accommodation (51% of overnights), hotels (24% of overnights)
and camps (7% of overnights).
According to the results of TOMAS Summer 2010 research on attitudes and expenditures of
tourist in Croatia, the average tourist visiting Split-Dalmatia County is middle aged (30-49
years), comes mostly with the family members, has higher education with the monthly
household income between 1,000 and 2,500 EUR. The most important motivation for tourists
visiting Split-Dalmatia County are passive rest and relaxation (76.6%), entertainment (29.8%)
and visiting natural attractions (22.8%). The most important factors for destination choice
among tourist visiting Split-Dalmatia County are natural beauties (68.7%), personal safety
(57.8%), quality of accommodation (53.1%) and friendliness (51.2%). Average daily
expenditure of tourists visiting Split-Dalmatia County is 55 EUR, which is slightly less than
national average (58 EUR).
Chapter 4: Research methodology
66
4.3.7 Dubrovnik-Neretva County
Dubrovnik-Neretva County is the southernmost county in Croatia, with the area size of 9,272
km2 (1,782 km2 of land area and 7,482 km2 of sea area) which is around 3% of the total land
area of the Republic of Croatia. According to the 2011 census, the population of Dubrovnik-
Neretva County is 122.9 thousands, which is around 2.6% of the total population of Croatia.
The population density of Dubrovnik-Neretva County is 69 inhabitants per square kilometer,
which is slightly below the national average. Dubrovnik-Neretva County is characterized by
the territorial discontinuity, since its territory is divided by the 20 km long coastline of Bosnia
and Herzegovina.
During 2013, Dubrovnik-Neretva County recorded 5.6 million of overnights and 1.3 million of
arrivals, which is around 8.7% of overnights and 10% of the total number of tourist arrivals
recorded in Croatia during 2013. The most important tourism generating markets for
Dubrovnik-Neretva County, in 2013, were United Kingdom (14% of overnights), Germany
(10% of overnights) and Poland (8% of overnights). Generally speaking, Dubrovnik-Neretva
County receives the highest share of tourists originating from long-haul markets compared to
other Croatian seaside counties. This is mostly due to the fact that this county is spatially farthest
from the most important tourism generating markets (central and western European countries)
and a large share of tourists in Dubrovnik-Neretva County is arriving by plane. The average
length of stay during 2013 was 4.5 days which is well below the national average. Most visited
types of accommodation facilities in Dubrovnik-Neretva County are hotels (50% of overnights)
and private accommodation (35% of overnights).
According to the results of TOMAS Summer 2010 research on attitudes and expenditures of
tourist in Croatia, the average tourist visiting Dubrovnik-Neretva County is middle aged (30-
49 years) with an above average share of tourists with high level of education. Dubrovnik-
Neretva County is also characterized by an above average share of tourists with the monthly
household income above 3,500 EUR and by the below average share of tourists coming with
family members. The most important motivation for tourists visiting Dubrovnik-Neretva
County are passive rest and relaxation (71.9%) followed by visiting natural attractions (35%)
and entertainment and new experiences (32.6%). The most important factors for destination
choice among tourist visiting Dubrovnik-Neretva County are natural beauties (84.6%), quality
of accommodation (72.5%), acceptable prices (70.9%) and quality of restaurants (70.7%).
Average daily expenditure of tourists visiting Split-Dalmatia County is 89.80 EUR, which is
55% above the national average. Finally, it is noteworthy that Dubrovnik-Neretva County has
the highest level of average daily expenditure among all Croatian seaside counties.
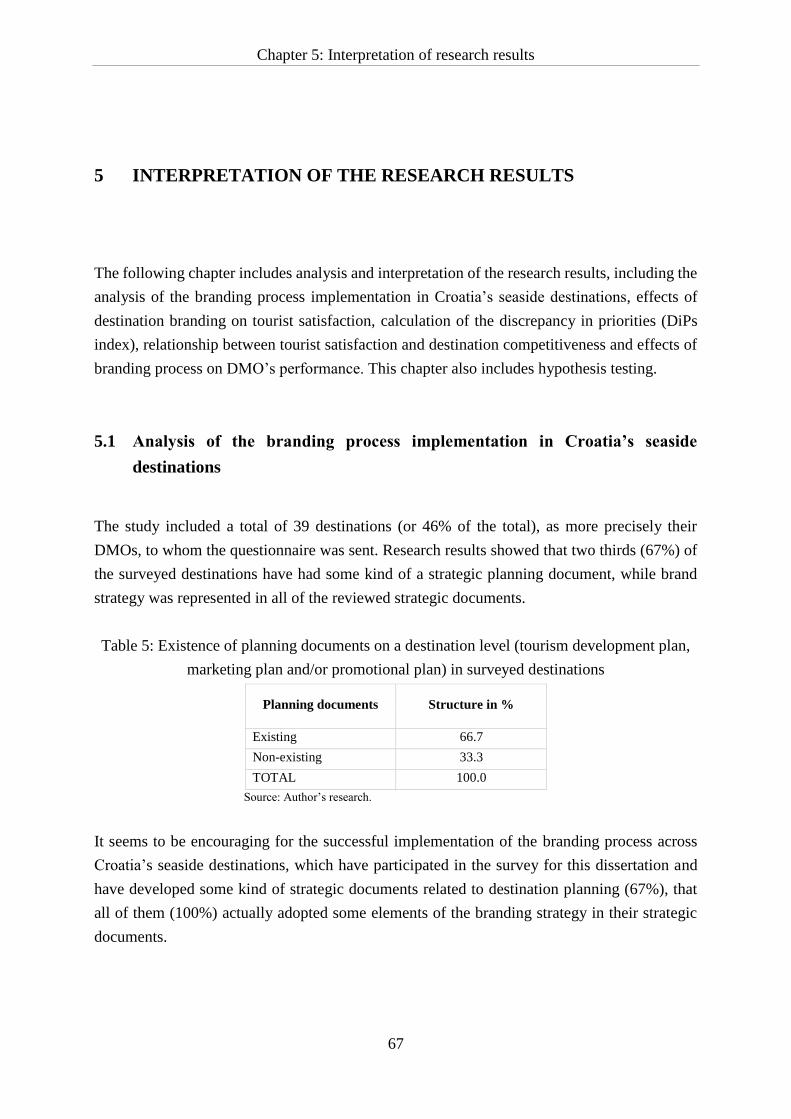
Chapter 5: Interpretation of research results
67
5 INTERPRETATION OF THE RESEARCH RESULTS
The following chapter includes analysis and interpretation of the research results, including the
analysis of the branding process implementation in Croatia’s seaside destinations, effects of
destination branding on tourist satisfaction, calculation of the discrepancy in priorities (DiPs
index), relationship between tourist satisfaction and destination competitiveness and effects of
branding process on DMO’s performance. This chapter also includes hypothesis testing.
5.1 Analysis of the branding process implementation in Croatia’s seaside
destinations
The study included a total of 39 destinations (or 46% of the total), as more precisely their
DMOs, to whom the questionnaire was sent. Research results showed that two thirds (67%) of
the surveyed destinations have had some kind of a strategic planning document, while brand
strategy was represented in all of the reviewed strategic documents.
Table 5: Existence of planning documents on a destination level (tourism development plan,
marketing plan and/or promotional plan) in surveyed destinations
Planning documents Structure in %
Existing 66.7
Non-existing 33.3
TOTAL 100.0
Source: Author’s research.
It seems to be encouraging for the successful implementation of the branding process across
Croatia’s seaside destinations, which have participated in the survey for this dissertation and
have developed some kind of strategic documents related to destination planning (67%), that
all of them (100%) actually adopted some elements of the branding strategy in their strategic
documents.
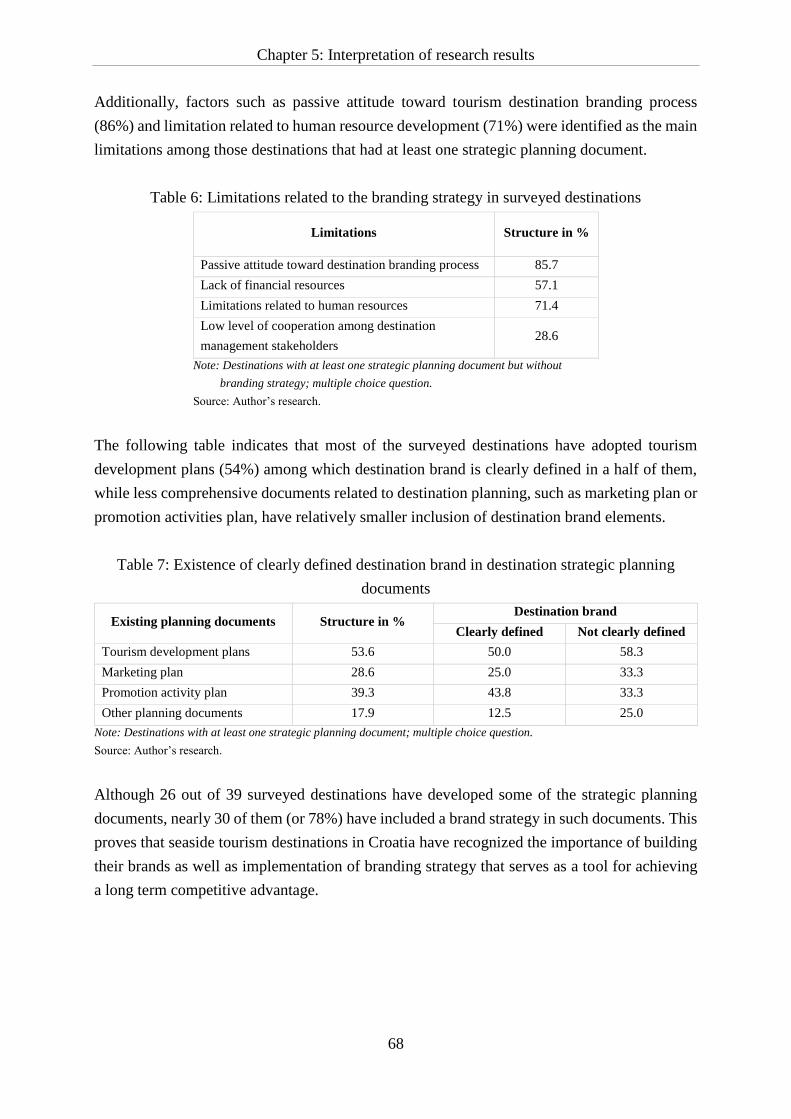
Chapter 5: Interpretation of research results
68
Additionally, factors such as passive attitude toward tourism destination branding process
(86%) and limitation related to human resource development (71%) were identified as the main
limitations among those destinations that had at least one strategic planning document.
Table 6: Limitations related to the branding strategy in surveyed destinations
Limitations Structure in %
Passive attitude toward destination branding process 85.7
Lack of financial resources 57.1
Limitations related to human resources 71.4
Low level of cooperation among destination
management stakeholders 28.6
Note: Destinations with at least one strategic planning document but without
branding strategy; multiple choice question.
Source: Author’s research.
The following table indicates that most of the surveyed destinations have adopted tourism
development plans (54%) among which destination brand is clearly defined in a half of them,
while less comprehensive documents related to destination planning, such as marketing plan or
promotion activities plan, have relatively smaller inclusion of destination brand elements.
Table 7: Existence of clearly defined destination brand in destination strategic planning
documents
Existing planning documents Structure in % Destination brand
Clearly defined Not clearly defined
Tourism development plans 53.6 50.0 58.3
Marketing plan 28.6 25.0 33.3
Promotion activity plan 39.3 43.8 33.3
Other planning documents 17.9 12.5 25.0
Note: Destinations with at least one strategic planning document; multiple choice question. Source: Author’s research.
Although 26 out of 39 surveyed destinations have developed some of the strategic planning
documents, nearly 30 of them (or 78%) have included a brand strategy in such documents. This
proves that seaside tourism destinations in Croatia have recognized the importance of building
their brands as well as implementation of branding strategy that serves as a tool for achieving
a long term competitive advantage.
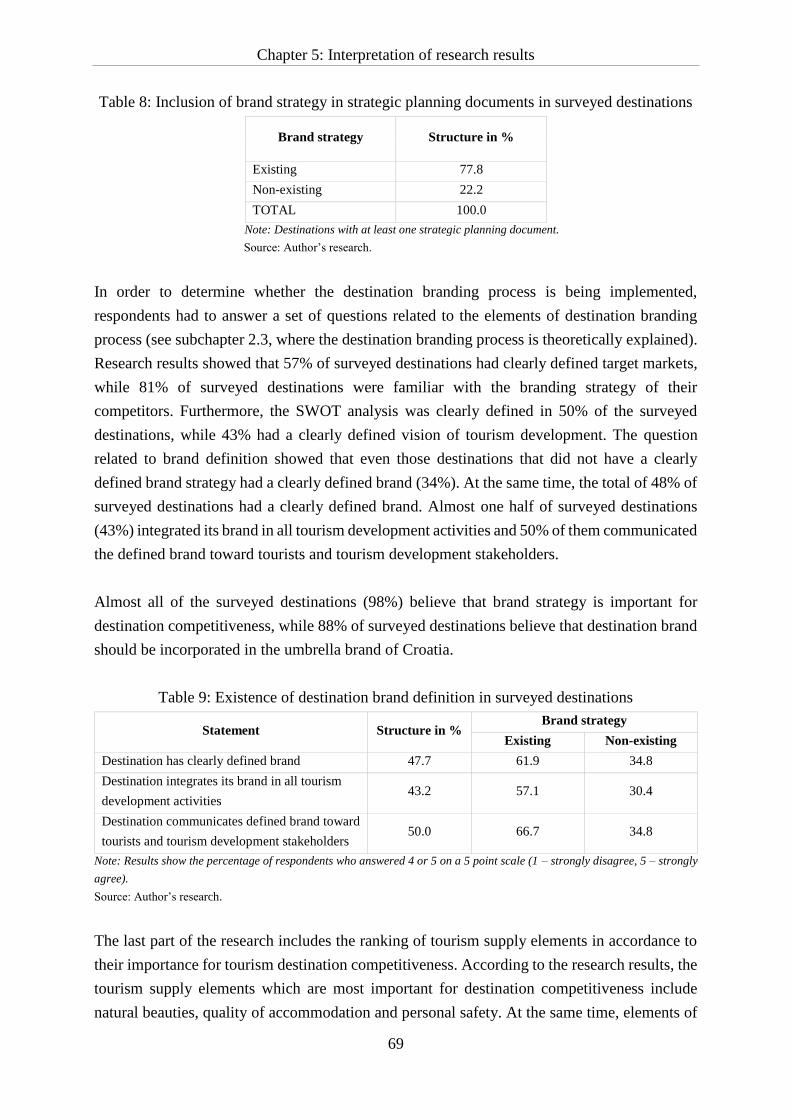
Chapter 5: Interpretation of research results
69
Table 8: Inclusion of brand strategy in strategic planning documents in surveyed destinations
Brand strategy Structure in %
Existing 77.8
Non-existing 22.2
TOTAL 100.0
Note: Destinations with at least one strategic planning document. Source: Author’s research.
In order to determine whether the destination branding process is being implemented,
respondents had to answer a set of questions related to the elements of destination branding
process (see subchapter 2.3, where the destination branding process is theoretically explained).
Research results showed that 57% of surveyed destinations had clearly defined target markets,
while 81% of surveyed destinations were familiar with the branding strategy of their
competitors. Furthermore, the SWOT analysis was clearly defined in 50% of the surveyed
destinations, while 43% had a clearly defined vision of tourism development. The question
related to brand definition showed that even those destinations that did not have a clearly
defined brand strategy had a clearly defined brand (34%). At the same time, the total of 48% of
surveyed destinations had a clearly defined brand. Almost one half of surveyed destinations
(43%) integrated its brand in all tourism development activities and 50% of them communicated
the defined brand toward tourists and tourism development stakeholders.
Almost all of the surveyed destinations (98%) believe that brand strategy is important for
destination competitiveness, while 88% of surveyed destinations believe that destination brand
should be incorporated in the umbrella brand of Croatia.
Table 9: Existence of destination brand definition in surveyed destinations
Statement Structure in % Brand strategy
Existing Non-existing
Destination has clearly defined brand 47.7 61.9 34.8
Destination integrates its brand in all tourism
development activities 43.2 57.1 30.4
Destination communicates defined brand toward
tourists and tourism development stakeholders 50.0 66.7 34.8
Note: Results show the percentage of respondents who answered 4 or 5 on a 5 point scale (1 – strongly disagree, 5 – strongly
agree).
Source: Author’s research.
The last part of the research includes the ranking of tourism supply elements in accordance to
their importance for tourism destination competitiveness. According to the research results, the
tourism supply elements which are most important for destination competitiveness include
natural beauties, quality of accommodation and personal safety. At the same time, elements of
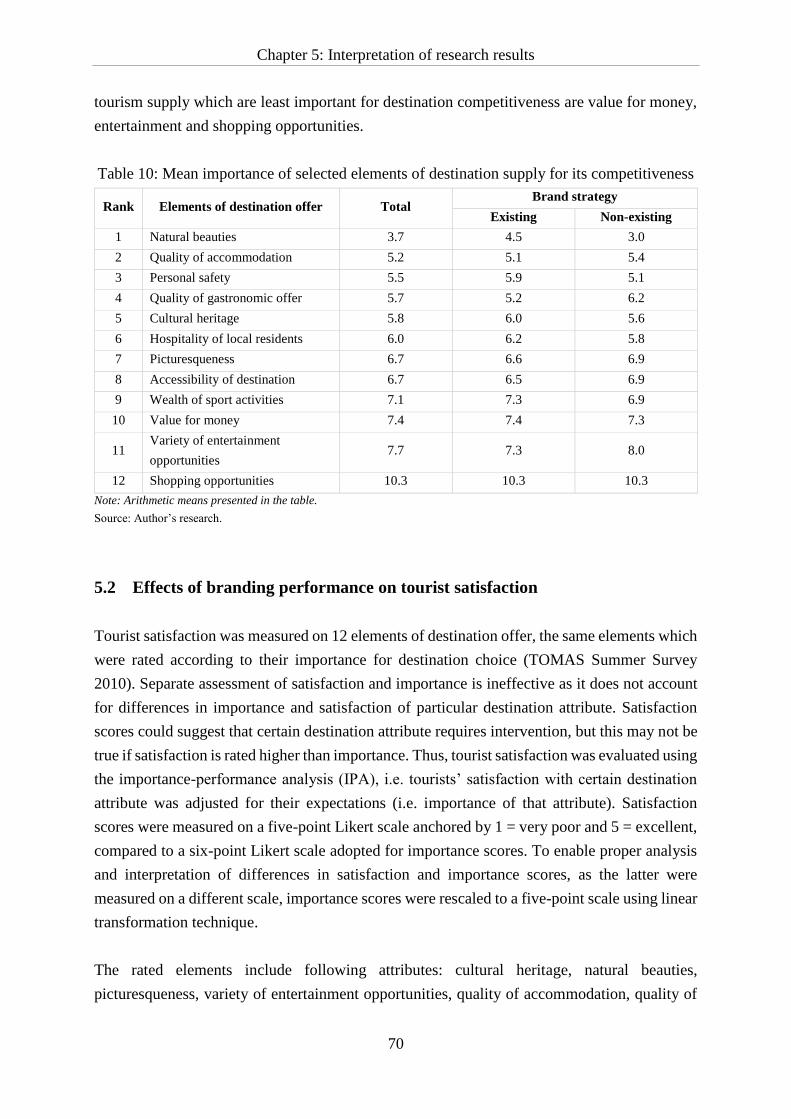
Chapter 5: Interpretation of research results
70
tourism supply which are least important for destination competitiveness are value for money,
entertainment and shopping opportunities.
Table 10: Mean importance of selected elements of destination supply for its competitiveness
Rank Elements of destination offer Total Brand strategy
Existing Non-existing
1 Natural beauties 3.7 4.5 3.0
2 Quality of accommodation 5.2 5.1 5.4
3 Personal safety 5.5 5.9 5.1
4 Quality of gastronomic offer 5.7 5.2 6.2
5 Cultural heritage 5.8 6.0 5.6
6 Hospitality of local residents 6.0 6.2 5.8
7 Picturesqueness 6.7 6.6 6.9
8 Accessibility of destination 6.7 6.5 6.9
9 Wealth of sport activities 7.1 7.3 6.9
10 Value for money 7.4 7.4 7.3
11 Variety of entertainment
opportunities 7.7 7.3 8.0
12 Shopping opportunities 10.3 10.3 10.3
Note: Arithmetic means presented in the table.
Source: Author’s research.
5.2 Effects of branding performance on tourist satisfaction
Tourist satisfaction was measured on 12 elements of destination offer, the same elements which
were rated according to their importance for destination choice (TOMAS Summer Survey
2010). Separate assessment of satisfaction and importance is ineffective as it does not account
for differences in importance and satisfaction of particular destination attribute. Satisfaction
scores could suggest that certain destination attribute requires intervention, but this may not be
true if satisfaction is rated higher than importance. Thus, tourist satisfaction was evaluated using
the importance-performance analysis (IPA), i.e. tourists’ satisfaction with certain destination
attribute was adjusted for their expectations (i.e. importance of that attribute). Satisfaction
scores were measured on a five-point Likert scale anchored by 1 = very poor and 5 = excellent,
compared to a six-point Likert scale adopted for importance scores. To enable proper analysis
and interpretation of differences in satisfaction and importance scores, as the latter were
measured on a different scale, importance scores were rescaled to a five-point scale using linear
transformation technique.
The rated elements include following attributes: cultural heritage, natural beauties,
picturesqueness, variety of entertainment opportunities, quality of accommodation, quality of
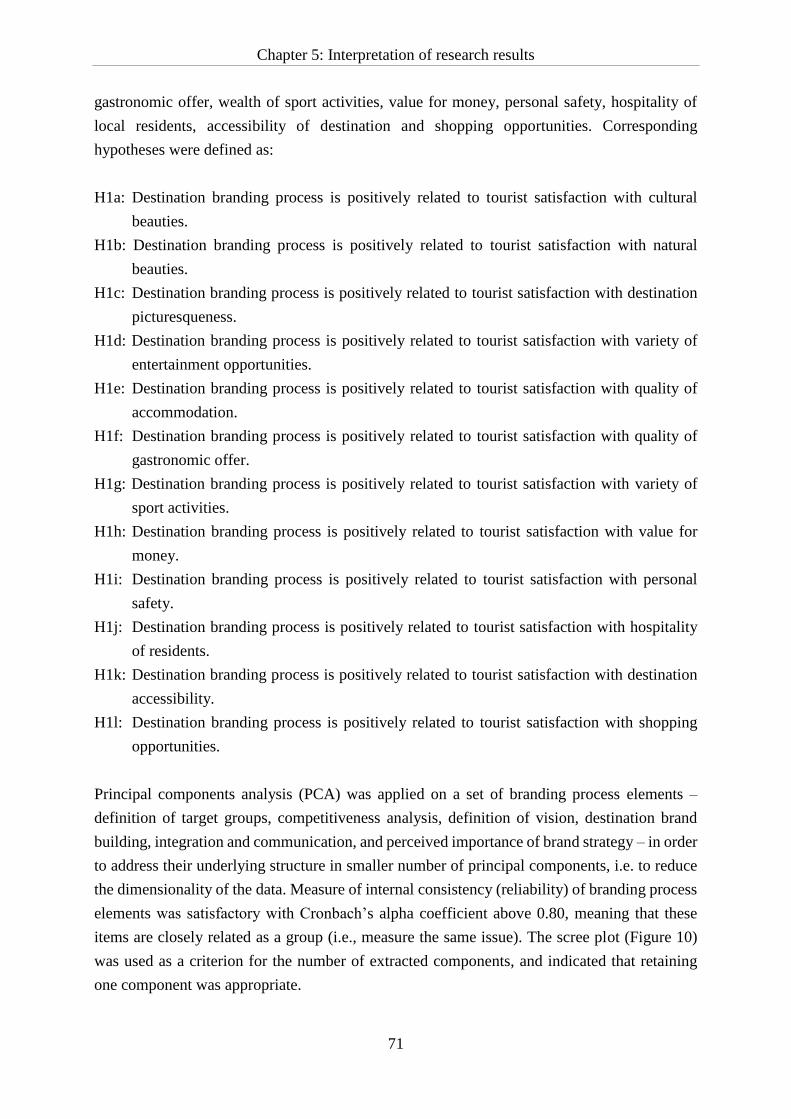
Chapter 5: Interpretation of research results
71
gastronomic offer, wealth of sport activities, value for money, personal safety, hospitality of
local residents, accessibility of destination and shopping opportunities. Corresponding
hypotheses were defined as:
H1a: Destination branding process is positively related to tourist satisfaction with cultural
beauties.
H1b: Destination branding process is positively related to tourist satisfaction with natural
beauties.
H1c: Destination branding process is positively related to tourist satisfaction with destination
picturesqueness.
H1d: Destination branding process is positively related to tourist satisfaction with variety of
entertainment opportunities.
H1e: Destination branding process is positively related to tourist satisfaction with quality of
accommodation.
H1f: Destination branding process is positively related to tourist satisfaction with quality of
gastronomic offer.
H1g: Destination branding process is positively related to tourist satisfaction with variety of
sport activities.
H1h: Destination branding process is positively related to tourist satisfaction with value for
money.
H1i: Destination branding process is positively related to tourist satisfaction with personal
safety.
H1j: Destination branding process is positively related to tourist satisfaction with hospitality
of residents.
H1k: Destination branding process is positively related to tourist satisfaction with destination
accessibility.
H1l: Destination branding process is positively related to tourist satisfaction with shopping
opportunities.
Principal components analysis (PCA) was applied on a set of branding process elements –
definition of target groups, competitiveness analysis, definition of vision, destination brand
building, integration and communication, and perceived importance of brand strategy – in order
to address their underlying structure in smaller number of principal components, i.e. to reduce
the dimensionality of the data. Measure of internal consistency (reliability) of branding process
elements was satisfactory with Cronbach’s alpha coefficient above 0.80, meaning that these
items are closely related as a group (i.e., measure the same issue). The scree plot (Figure 10)
was used as a criterion for the number of extracted components, and indicated that retaining
one component was appropriate.
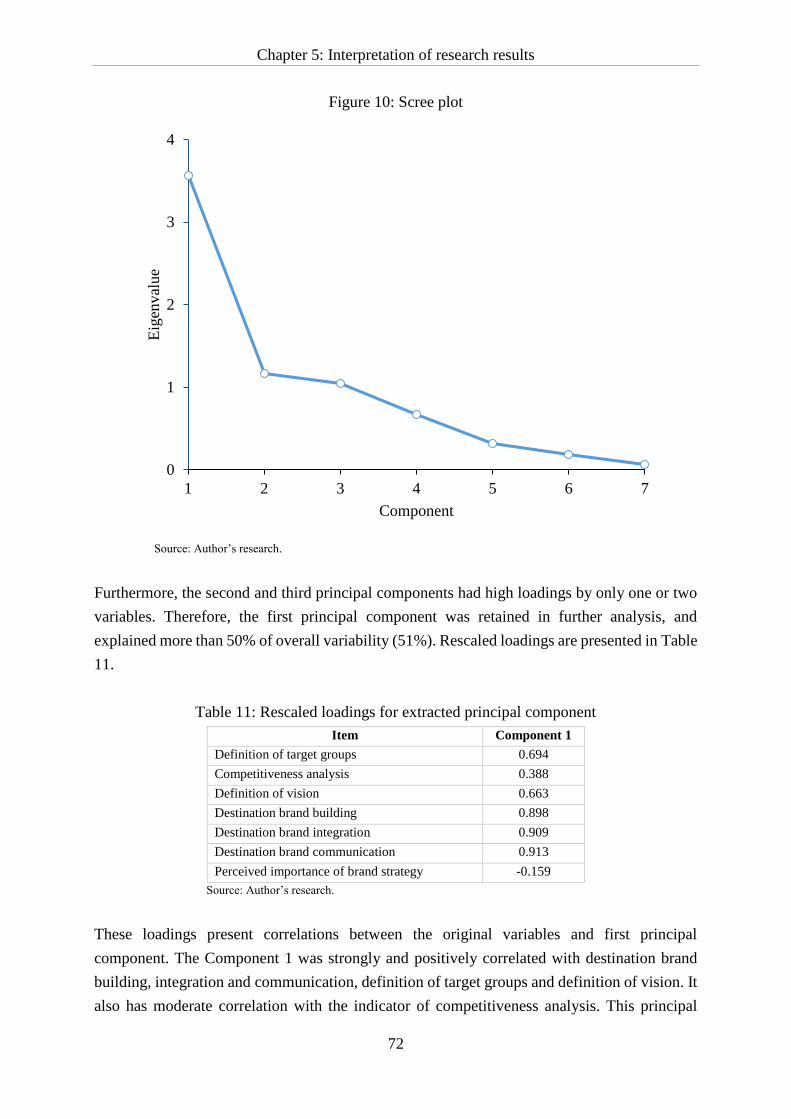
Chapter 5: Interpretation of research results
72
Figure 10: Scree plot
Source: Author’s research.
Furthermore, the second and third principal components had high loadings by only one or two
variables. Therefore, the first principal component was retained in further analysis, and
explained more than 50% of overall variability (51%). Rescaled loadings are presented in Table
11.
Table 11: Rescaled loadings for extracted principal component
Item Component 1
Definition of target groups 0.694
Competitiveness analysis 0.388
Definition of vision 0.663
Destination brand building 0.898
Destination brand integration 0.909
Destination brand communication 0.913
Perceived importance of brand strategy -0.159
Source: Author’s research.
These loadings present correlations between the original variables and first principal
component. The Component 1 was strongly and positively correlated with destination brand
building, integration and communication, definition of target groups and definition of vision. It
also has moderate correlation with the indicator of competitiveness analysis. This principal
0
1
2
3
4
1 2 3 4 5 6 7
Eig
enval
ue
Component
Chapter 5: Interpretation of research results
73
component is linear combination of measured variables or branding process elements, and it
explained more than 80% of variability in destination brand building (81%), destination brand
integration (83%) and destination brand communication (83%), and almost 50% of variability
in definition of target groups (48%) and definition of vision (44%). This principal component
will form an index of branding development measured by above elements of branding, which
was labeled as BiPs index. Higher score of the BiPs index, i.e. higher values of the first principal
component, indicate that destination has more developed branding process measured by
increase in the perceived performance of branding elements – destination brand building,
integration and communication, definition of target groups, definition of vision and
competitiveness analysis.
Effect of BiPs index (or level of development of destination branding process) on tourist
satisfaction was assessed by IPA analysis, including a Chi-square test, and by GEE model, to
account for correlation arising from clustered data when assessing satisfaction with individual
elements of tourism destination supply.
5.3 Effect of BiPs on tourist satisfaction
The results of IPA are presented in Figure 11, combining tourism destination supply importance
and performance measures into a two-dimensional grid. Tourists indicated the importance of
12 different destination attributes on the destination choice and their mean importance was
contrasted to the mean satisfaction with these elements at a destination-specific level.
The mean importance and satisfaction scores were calculated for each destination attribute in
each destination (n=39), making a total of 468 dots classified into two groups – attributes of
destinations with above average value of BiPs (i.e. greater branding process performance; blue
color) and attributes of destinations with below average value of BiPs (i.e. lower branding
process performance; orange color). A cut point dividing the grid into quadrants was placed at
the overall satisfaction and importance means. Quadrant III represents the area of low
importance and low satisfaction, the so-called “Low priority” area. Elements in quadrant IV
have low importance, but offer high satisfaction (this is the area of “Possible overkill”), while
in quadrant II both importance and satisfaction are high (“Keep up the good work” area). The
most delicate is the I quadrant with elements offering low satisfaction, but of high importance
for tourists’ experience (“Concentrate here” area).
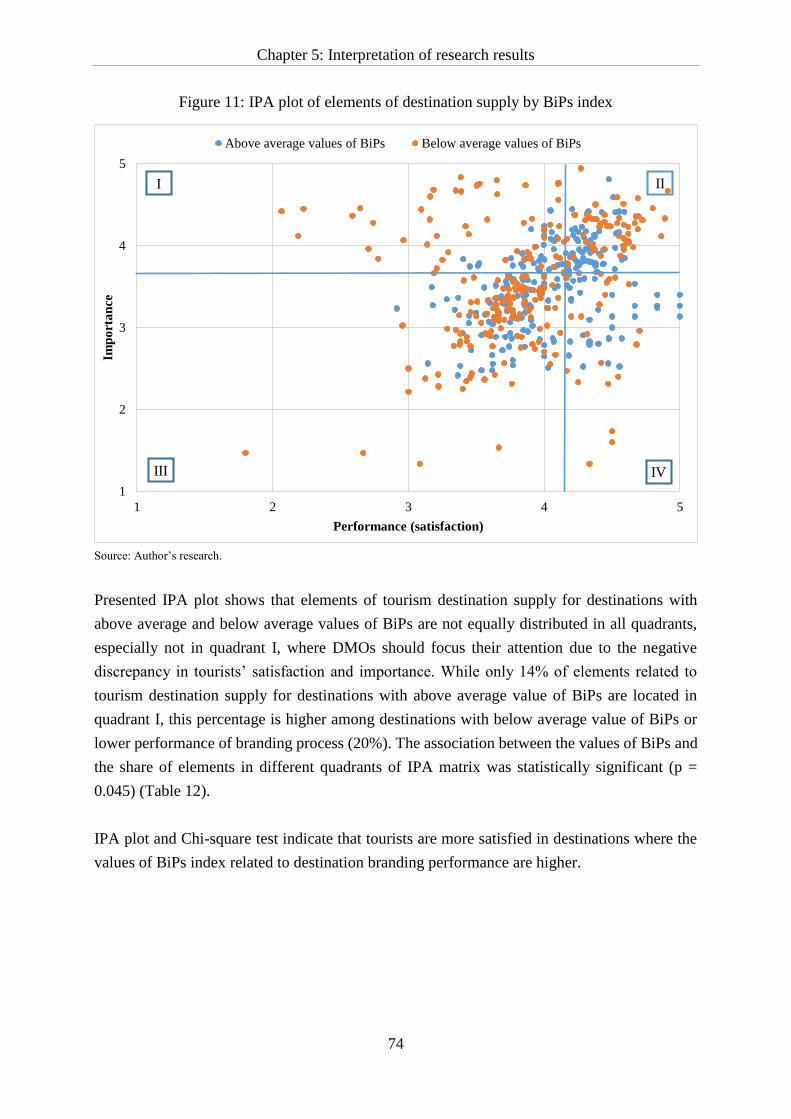
Chapter 5: Interpretation of research results
74
Figure 11: IPA plot of elements of destination supply by BiPs index
Source: Author’s research.
Presented IPA plot shows that elements of tourism destination supply for destinations with
above average and below average values of BiPs are not equally distributed in all quadrants,
especially not in quadrant I, where DMOs should focus their attention due to the negative
discrepancy in tourists’ satisfaction and importance. While only 14% of elements related to
tourism destination supply for destinations with above average value of BiPs are located in
quadrant I, this percentage is higher among destinations with below average value of BiPs or
lower performance of branding process (20%). The association between the values of BiPs and
the share of elements in different quadrants of IPA matrix was statistically significant (p =
0.045) (Table 12).
IPA plot and Chi-square test indicate that tourists are more satisfied in destinations where the
values of BiPs index related to destination branding performance are higher.
1
2
3
4
5
1 2 3 4 5
Imp
ort
an
ce
Performance (satisfaction)
Above average values of BiPs Below average values of BiPs
IVIII
I II
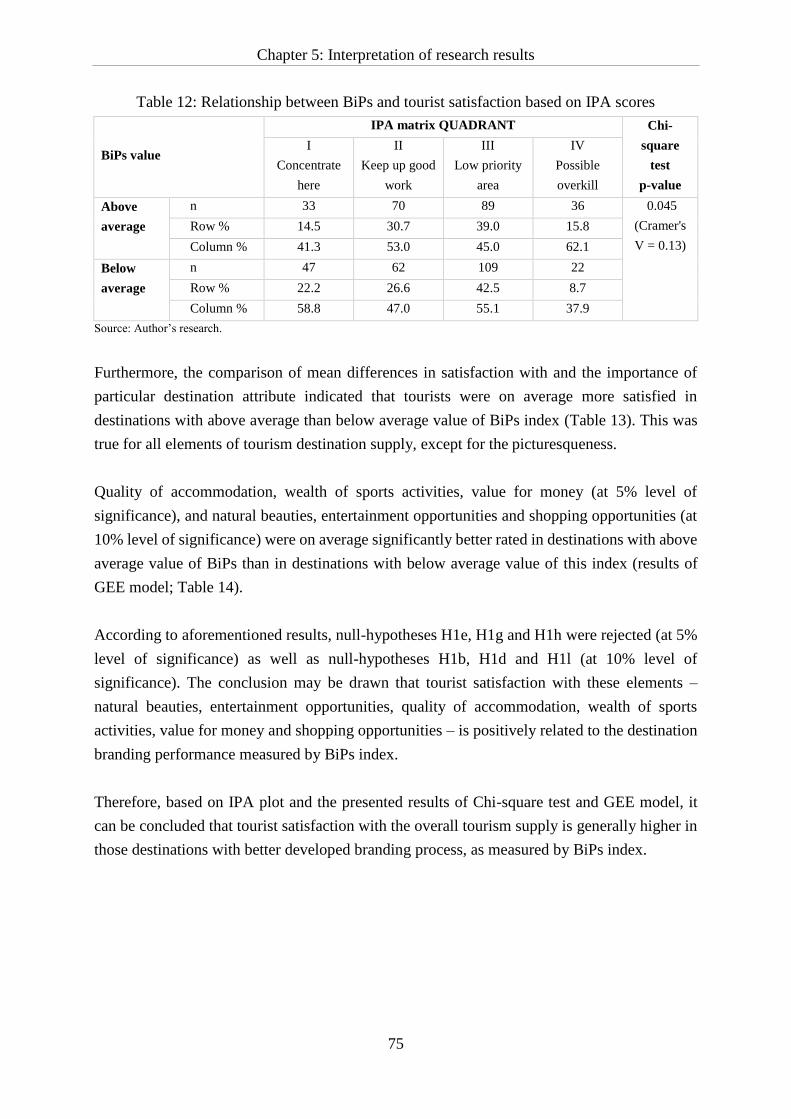
Chapter 5: Interpretation of research results
75
Table 12: Relationship between BiPs and tourist satisfaction based on IPA scores
BiPs value
IPA matrix QUADRANT Chi-
square
test
p-value
I
Concentrate
here
II
Keep up good
work
III
Low priority
area
IV
Possible
overkill
Above
average
n 33 70 89 36 0.045
(Cramer's
V = 0.13)
Row % 14.5 30.7 39.0 15.8
Column % 41.3 53.0 45.0 62.1
Below
average
n 47 62 109 22
Row % 22.2 26.6 42.5 8.7
Column % 58.8 47.0 55.1 37.9
Source: Author’s research.
Furthermore, the comparison of mean differences in satisfaction with and the importance of
particular destination attribute indicated that tourists were on average more satisfied in
destinations with above average than below average value of BiPs index (Table 13). This was
true for all elements of tourism destination supply, except for the picturesqueness.
Quality of accommodation, wealth of sports activities, value for money (at 5% level of
significance), and natural beauties, entertainment opportunities and shopping opportunities (at
10% level of significance) were on average significantly better rated in destinations with above
average value of BiPs than in destinations with below average value of this index (results of
GEE model; Table 14).
According to aforementioned results, null-hypotheses H1e, H1g and H1h were rejected (at 5%
level of significance) as well as null-hypotheses H1b, H1d and H1l (at 10% level of
significance). The conclusion may be drawn that tourist satisfaction with these elements –
natural beauties, entertainment opportunities, quality of accommodation, wealth of sports
activities, value for money and shopping opportunities – is positively related to the destination
branding performance measured by BiPs index.
Therefore, based on IPA plot and the presented results of Chi-square test and GEE model, it
can be concluded that tourist satisfaction with the overall tourism supply is generally higher in
those destinations with better developed branding process, as measured by BiPs index.
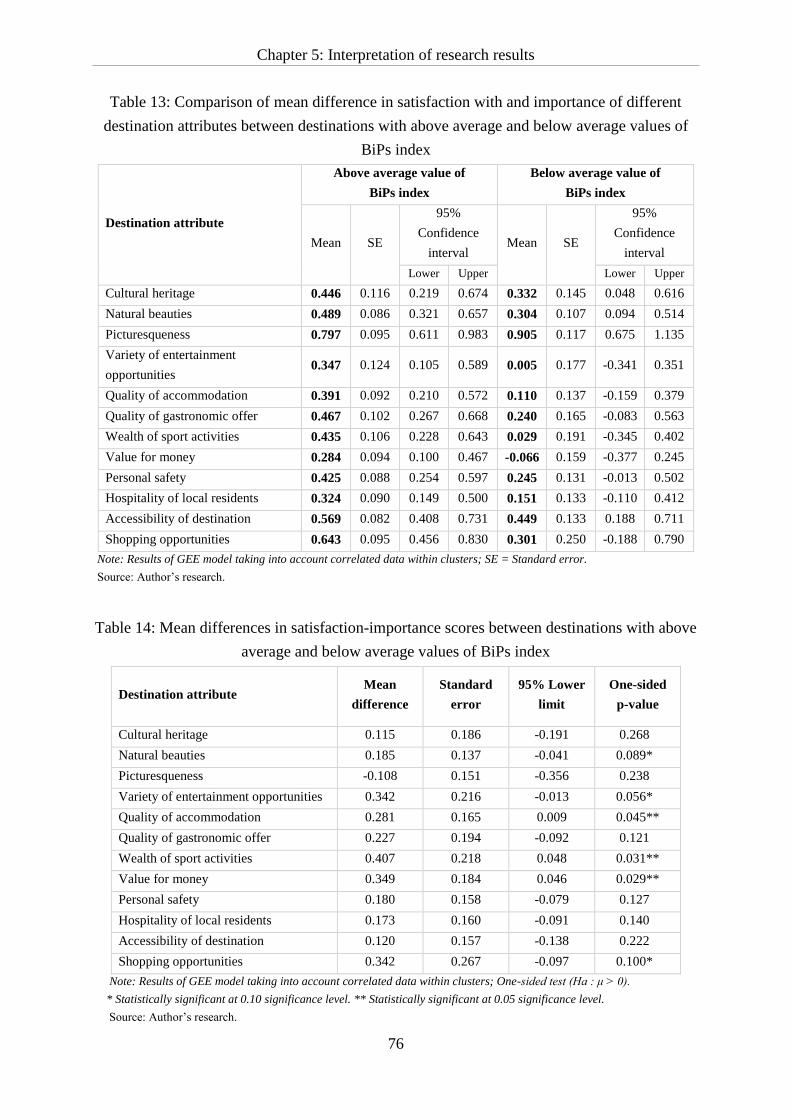
Chapter 5: Interpretation of research results
76
Table 13: Comparison of mean difference in satisfaction with and importance of different
destination attributes between destinations with above average and below average values of
BiPs index
Destination attribute
Above average value of
BiPs index
Below average value of
BiPs index
Mean SE
95%
Confidence
interval Mean SE
95%
Confidence
interval
Lower Upper Lower Upper
Cultural heritage 0.446 0.116 0.219 0.674 0.332 0.145 0.048 0.616
Natural beauties 0.489 0.086 0.321 0.657 0.304 0.107 0.094 0.514
Picturesqueness 0.797 0.095 0.611 0.983 0.905 0.117 0.675 1.135
Variety of entertainment
opportunities 0.347 0.124 0.105 0.589 0.005 0.177 -0.341 0.351
Quality of accommodation 0.391 0.092 0.210 0.572 0.110 0.137 -0.159 0.379
Quality of gastronomic offer 0.467 0.102 0.267 0.668 0.240 0.165 -0.083 0.563
Wealth of sport activities 0.435 0.106 0.228 0.643 0.029 0.191 -0.345 0.402
Value for money 0.284 0.094 0.100 0.467 -0.066 0.159 -0.377 0.245
Personal safety 0.425 0.088 0.254 0.597 0.245 0.131 -0.013 0.502
Hospitality of local residents 0.324 0.090 0.149 0.500 0.151 0.133 -0.110 0.412
Accessibility of destination 0.569 0.082 0.408 0.731 0.449 0.133 0.188 0.711
Shopping opportunities 0.643 0.095 0.456 0.830 0.301 0.250 -0.188 0.790
Note: Results of GEE model taking into account correlated data within clusters; SE = Standard error.
Source: Author’s research.
Table 14: Mean differences in satisfaction-importance scores between destinations with above
average and below average values of BiPs index
Destination attribute Mean
difference
Standard
error
95% Lower
limit
One-sided
p-value
Cultural heritage 0.115 0.186 -0.191 0.268*
Natural beauties 0.185 0.137 -0.041 0.089**
Picturesqueness -0.108 0.151 -0.356 0.238*
Variety of entertainment opportunities 0.342 0.216 -0.013 0.056**
Quality of accommodation 0.281 0.165 0.009 0.045**
Quality of gastronomic offer 0.227 0.194 -0.092 0.121*
Wealth of sport activities 0.407 0.218 0.048 0.031**
Value for money 0.349 0.184 0.046 0.029**
Personal safety 0.180 0.158 -0.079 0.127*
Hospitality of local residents 0.173 0.160 -0.091 0.140*
Accessibility of destination 0.120 0.157 -0.138 0.222*
Shopping opportunities 0.342 0.267 -0.097 0.100**
Note: Results of GEE model taking into account correlated data within clusters; One-sided test (Ha : μ > 0).
* Statistically significant at 0.10 significance level. ** Statistically significant at 0.05 significance level.
Source: Author’s research.
Chapter 5: Interpretation of research results
77
5.4 Discrepancy in priorities index
Comparison of relative importance of certain element of tourism supply on destination appeal
between tourists and DMOs was performed by calculating the Discrepancy in Priorities (DiPs)
index. This index represents the weighted difference in the order of importance of selected
tourism supply elements between these two groups, and the calculation of its value includes the
following steps:
• Ranking the elements of tourism supply by their importance to tourists (TOMAS Summer
Survey 2010)
Tourists rated the influence of the main elements of tourism supply (12 in total) on
destination appeal on a six-point Likert scale (scores ranging from 1 – no influence on
destination choice to 6 – extremely important in choosing a destination). The rank of an
element, at destination-specific level, was calculated by ranking the mean importance of
each element based on scores of all tourists in a certain destination and by assigning the
highest rank (1) to the most important element (i.e. element with the highest mean
importance score), (2) to the next most important element, etc.
• Obtaining relative importance (i.e. ranks) of the same elements of tourism supply from
DMOs (Exploratory research)
The same methodology was used for this step.
• Comparisons of ranks
Rankings of elements on the demand side, obtained by surveying tourists, were compared
to rankings of the same elements on the supply side, obtained by surveying DMOs.
Consequently, the differences in rankings were calculated.
• Weighting the differences in ranks
Differences in the ranks were weighted with the mean importance of that element to
tourists, so the discrepancy in element with the highest influence on tourists’ destination
choice had the highest influence on DiPs index. Thereby, if the mean value of the most
important element of destination’s tourism supply was 5.3 and of the least important
element 2.9, the same absolute discrepancy in ranks of those elements between tourists
and DMOs had different influence on DiPs index – the influence of the most important
element was approximately 1.8 (5.3/2.9) times larger.
• Calculation of DiPs index
Finally, the sum of weighted differences in ranks gave the value of DiPs index. Maximum
value of index (0) presents no discrepancy in priorities between tourists and DMO, while
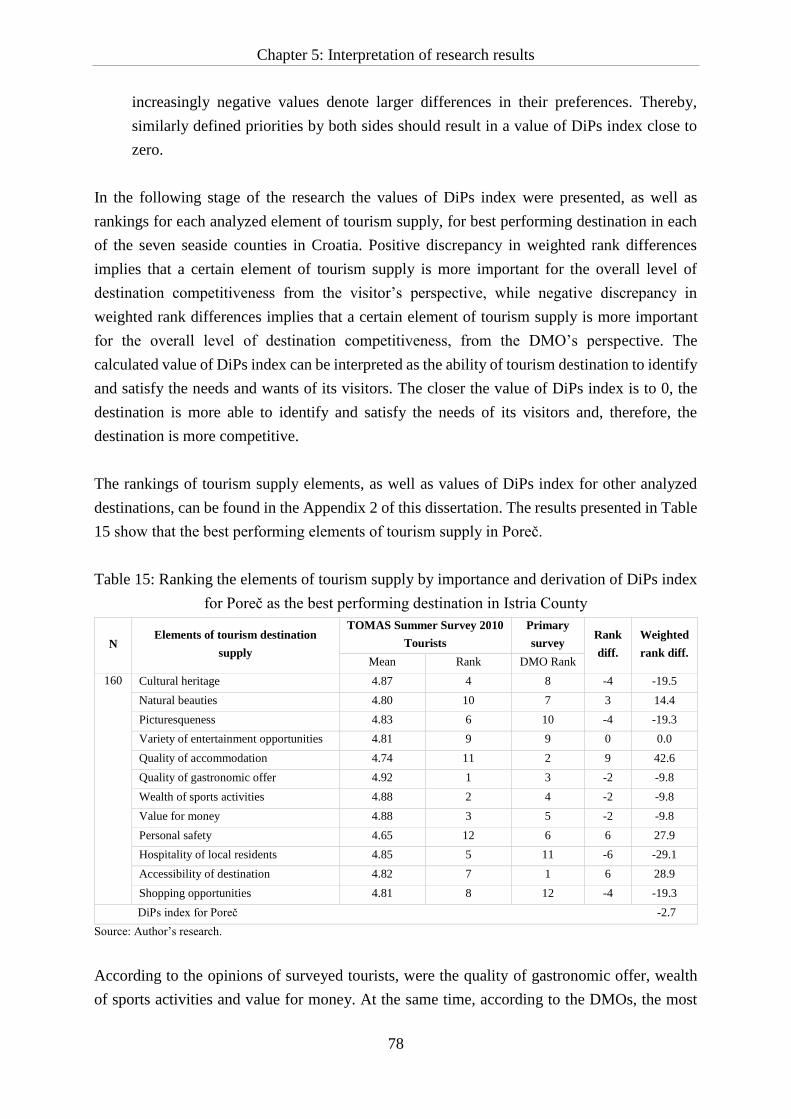
Chapter 5: Interpretation of research results
78
increasingly negative values denote larger differences in their preferences. Thereby,
similarly defined priorities by both sides should result in a value of DiPs index close to
zero.
In the following stage of the research the values of DiPs index were presented, as well as
rankings for each analyzed element of tourism supply, for best performing destination in each
of the seven seaside counties in Croatia. Positive discrepancy in weighted rank differences
implies that a certain element of tourism supply is more important for the overall level of
destination competitiveness from the visitor’s perspective, while negative discrepancy in
weighted rank differences implies that a certain element of tourism supply is more important
for the overall level of destination competitiveness, from the DMO’s perspective. The
calculated value of DiPs index can be interpreted as the ability of tourism destination to identify
and satisfy the needs and wants of its visitors. The closer the value of DiPs index is to 0, the
destination is more able to identify and satisfy the needs of its visitors and, therefore, the
destination is more competitive.
The rankings of tourism supply elements, as well as values of DiPs index for other analyzed
destinations, can be found in the Appendix 2 of this dissertation. The results presented in Table
15 show that the best performing elements of tourism supply in Poreč.
Table 15: Ranking the elements of tourism supply by importance and derivation of DiPs index
for Poreč as the best performing destination in Istria County
N Elements of tourism destination
supply
TOMAS Summer Survey 2010
Tourists
Primary
survey Rank
diff.
Weighted
rank diff. Mean Rank DMO Rank
160 Cultural heritage 4.87 4 8 -4 -19.5
Natural beauties 4.80 10 7 3 14.4
Picturesqueness 4.83 6 10 -4 -19.3
Variety of entertainment opportunities 4.81 9 9 0 0.0
Quality of accommodation 4.74 11 2 9 42.6
Quality of gastronomic offer 4.92 1 3 -2 -9.8
Wealth of sports activities 4.88 2 4 -2 -9.8
Value for money 4.88 3 5 -2 -9.8
Personal safety 4.65 12 6 6 27.9
Hospitality of local residents 4.85 5 11 -6 -29.1
Accessibility of destination 4.82 7 1 6 28.9
Shopping opportunities 4.81 8 12 -4 -19.3
DiPs index for Poreč -2.7
Source: Author’s research.
According to the opinions of surveyed tourists, were the quality of gastronomic offer, wealth
of sports activities and value for money. At the same time, according to the DMOs, the most
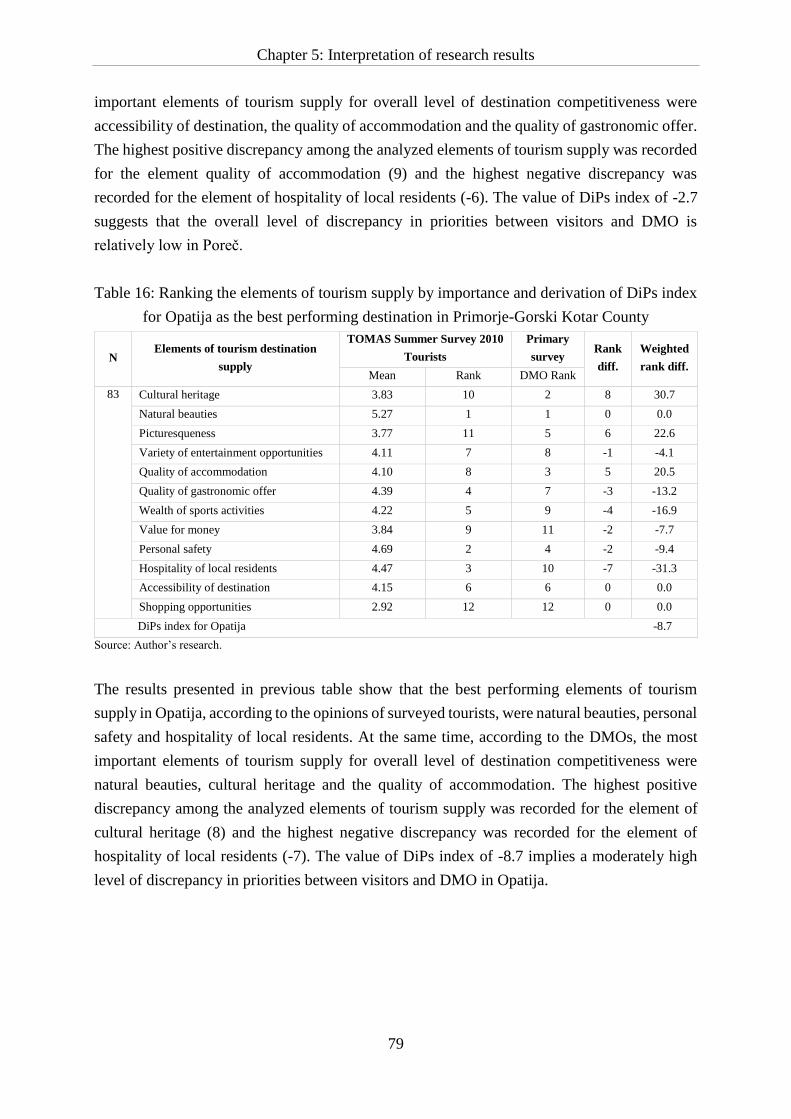
Chapter 5: Interpretation of research results
79
important elements of tourism supply for overall level of destination competitiveness were
accessibility of destination, the quality of accommodation and the quality of gastronomic offer.
The highest positive discrepancy among the analyzed elements of tourism supply was recorded
for the element quality of accommodation (9) and the highest negative discrepancy was
recorded for the element of hospitality of local residents (-6). The value of DiPs index of -2.7
suggests that the overall level of discrepancy in priorities between visitors and DMO is
relatively low in Poreč.
Table 16: Ranking the elements of tourism supply by importance and derivation of DiPs index
for Opatija as the best performing destination in Primorje-Gorski Kotar County
N Elements of tourism destination
supply
TOMAS Summer Survey 2010
Tourists
Primary
survey Rank
diff.
Weighted
rank diff. Mean Rank DMO Rank
83 Cultural heritage 3.83 10 2 8 30.7
Natural beauties 5.27 1 1 0 0.0
Picturesqueness 3.77 11 5 6 22.6
Variety of entertainment opportunities 4.11 7 8 -1 -4.1
Quality of accommodation 4.10 8 3 5 20.5
Quality of gastronomic offer 4.39 4 7 -3 -13.2
Wealth of sports activities 4.22 5 9 -4 -16.9
Value for money 3.84 9 11 -2 -7.7
Personal safety 4.69 2 4 -2 -9.4
Hospitality of local residents 4.47 3 10 -7 -31.3
Accessibility of destination 4.15 6 6 0 0.0
Shopping opportunities 2.92 12 12 0 0.0
DiPs index for Opatija -8.7
Source: Author’s research.
The results presented in previous table show that the best performing elements of tourism
supply in Opatija, according to the opinions of surveyed tourists, were natural beauties, personal
safety and hospitality of local residents. At the same time, according to the DMOs, the most
important elements of tourism supply for overall level of destination competitiveness were
natural beauties, cultural heritage and the quality of accommodation. The highest positive
discrepancy among the analyzed elements of tourism supply was recorded for the element of
cultural heritage (8) and the highest negative discrepancy was recorded for the element of
hospitality of local residents (-7). The value of DiPs index of -8.7 implies a moderately high
level of discrepancy in priorities between visitors and DMO in Opatija.
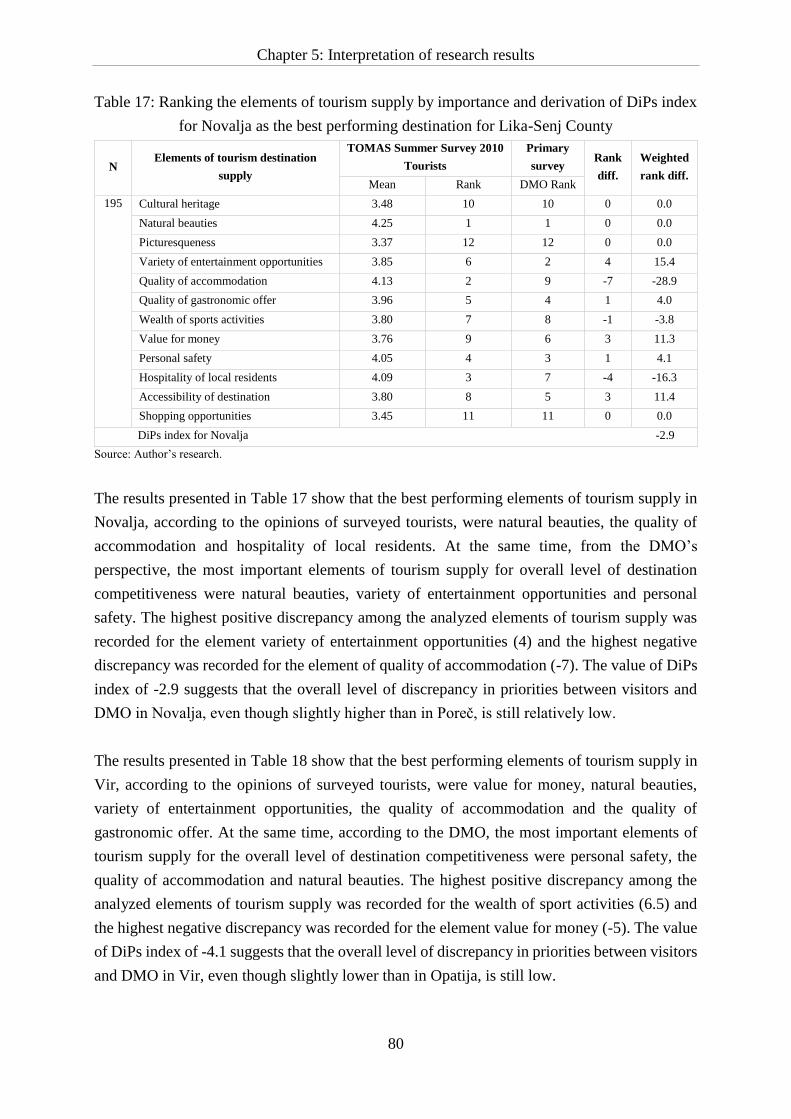
Chapter 5: Interpretation of research results
80
Table 17: Ranking the elements of tourism supply by importance and derivation of DiPs index
for Novalja as the best performing destination for Lika-Senj County
N Elements of tourism destination
supply
TOMAS Summer Survey 2010
Tourists
Primary
survey Rank
diff.
Weighted
rank diff. Mean Rank DMO Rank
195 Cultural heritage 3.48 10 10 0 0.0
Natural beauties 4.25 1 1 0 0.0
Picturesqueness 3.37 12 12 0 0.0
Variety of entertainment opportunities 3.85 6 2 4 15.4
Quality of accommodation 4.13 2 9 -7 -28.9
Quality of gastronomic offer 3.96 5 4 1 4.0
Wealth of sports activities 3.80 7 8 -1 -3.8
Value for money 3.76 9 6 3 11.3
Personal safety 4.05 4 3 1 4.1
Hospitality of local residents 4.09 3 7 -4 -16.3
Accessibility of destination 3.80 8 5 3 11.4
Shopping opportunities 3.45 11 11 0 0.0
DiPs index for Novalja -2.9
Source: Author’s research.
The results presented in Table 17 show that the best performing elements of tourism supply in
Novalja, according to the opinions of surveyed tourists, were natural beauties, the quality of
accommodation and hospitality of local residents. At the same time, from the DMO’s
perspective, the most important elements of tourism supply for overall level of destination
competitiveness were natural beauties, variety of entertainment opportunities and personal
safety. The highest positive discrepancy among the analyzed elements of tourism supply was
recorded for the element variety of entertainment opportunities (4) and the highest negative
discrepancy was recorded for the element of quality of accommodation (-7). The value of DiPs
index of -2.9 suggests that the overall level of discrepancy in priorities between visitors and
DMO in Novalja, even though slightly higher than in Poreč, is still relatively low.
The results presented in Table 18 show that the best performing elements of tourism supply in
Vir, according to the opinions of surveyed tourists, were value for money, natural beauties,
variety of entertainment opportunities, the quality of accommodation and the quality of
gastronomic offer. At the same time, according to the DMO, the most important elements of
tourism supply for the overall level of destination competitiveness were personal safety, the
quality of accommodation and natural beauties. The highest positive discrepancy among the
analyzed elements of tourism supply was recorded for the wealth of sport activities (6.5) and
the highest negative discrepancy was recorded for the element value for money (-5). The value
of DiPs index of -4.1 suggests that the overall level of discrepancy in priorities between visitors
and DMO in Vir, even though slightly lower than in Opatija, is still low.
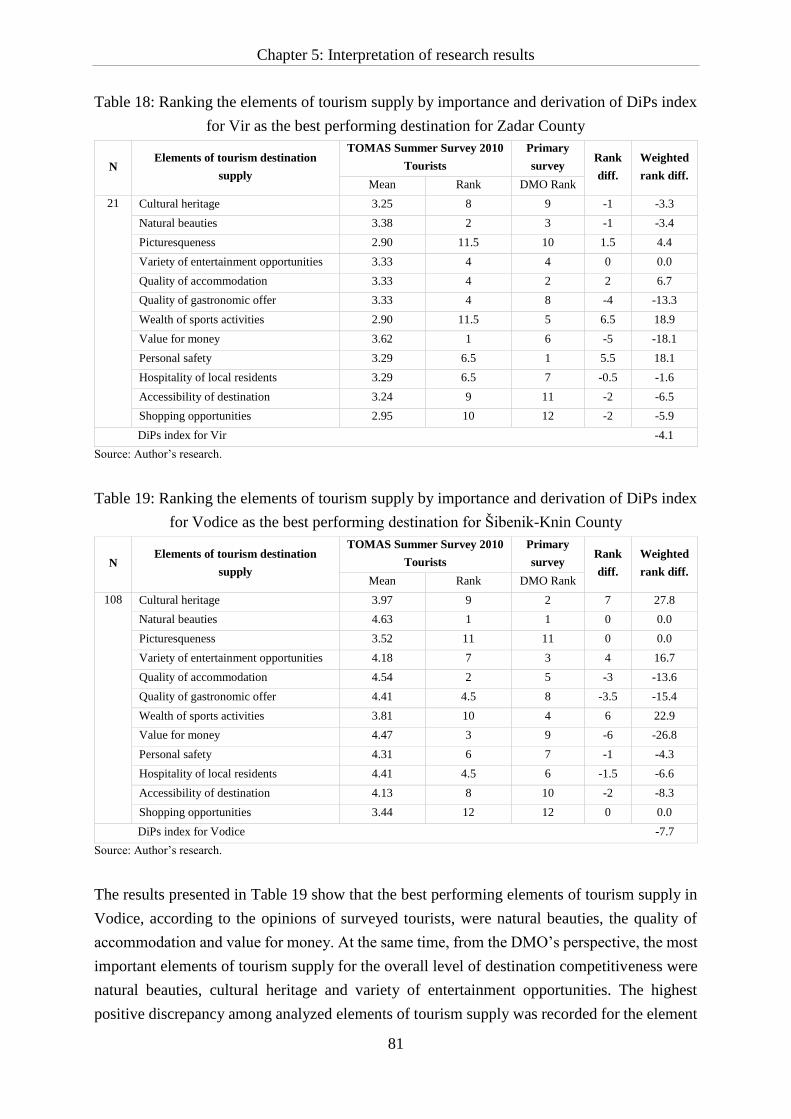
Chapter 5: Interpretation of research results
81
Table 18: Ranking the elements of tourism supply by importance and derivation of DiPs index
for Vir as the best performing destination for Zadar County
N Elements of tourism destination
supply
TOMAS Summer Survey 2010
Tourists
Primary
survey Rank
diff.
Weighted
rank diff. Mean Rank DMO Rank
21 Cultural heritage 3.25 8 9 -1 -3.3
Natural beauties 3.38 2 3 -1 -3.4
Picturesqueness 2.90 11.5 10 1.5 4.4
Variety of entertainment opportunities 3.33 4 4 0 0.0
Quality of accommodation 3.33 4 2 2 6.7
Quality of gastronomic offer 3.33 4 8 -4 -13.3
Wealth of sports activities 2.90 11.5 5 6.5 18.9
Value for money 3.62 1 6 -5 -18.1
Personal safety 3.29 6.5 1 5.5 18.1
Hospitality of local residents 3.29 6.5 7 -0.5 -1.6
Accessibility of destination 3.24 9 11 -2 -6.5
Shopping opportunities 2.95 10 12 -2 -5.9
DiPs index for Vir -4.1
Source: Author’s research.
Table 19: Ranking the elements of tourism supply by importance and derivation of DiPs index
for Vodice as the best performing destination for Šibenik-Knin County
N Elements of tourism destination
supply
TOMAS Summer Survey 2010
Tourists
Primary
survey Rank
diff.
Weighted
rank diff. Mean Rank DMO Rank
108 Cultural heritage 3.97 9 2 7 27.8
Natural beauties 4.63 1 1 0 0.0
Picturesqueness 3.52 11 11 0 0.0
Variety of entertainment opportunities 4.18 7 3 4 16.7
Quality of accommodation 4.54 2 5 -3 -13.6
Quality of gastronomic offer 4.41 4.5 8 -3.5 -15.4
Wealth of sports activities 3.81 10 4 6 22.9
Value for money 4.47 3 9 -6 -26.8
Personal safety 4.31 6 7 -1 -4.3
Hospitality of local residents 4.41 4.5 6 -1.5 -6.6
Accessibility of destination 4.13 8 10 -2 -8.3
Shopping opportunities 3.44 12 12 0 0.0
DiPs index for Vodice -7.7
Source: Author’s research.
The results presented in Table 19 show that the best performing elements of tourism supply in
Vodice, according to the opinions of surveyed tourists, were natural beauties, the quality of
accommodation and value for money. At the same time, from the DMO’s perspective, the most
important elements of tourism supply for the overall level of destination competitiveness were
natural beauties, cultural heritage and variety of entertainment opportunities. The highest
positive discrepancy among analyzed elements of tourism supply was recorded for the element
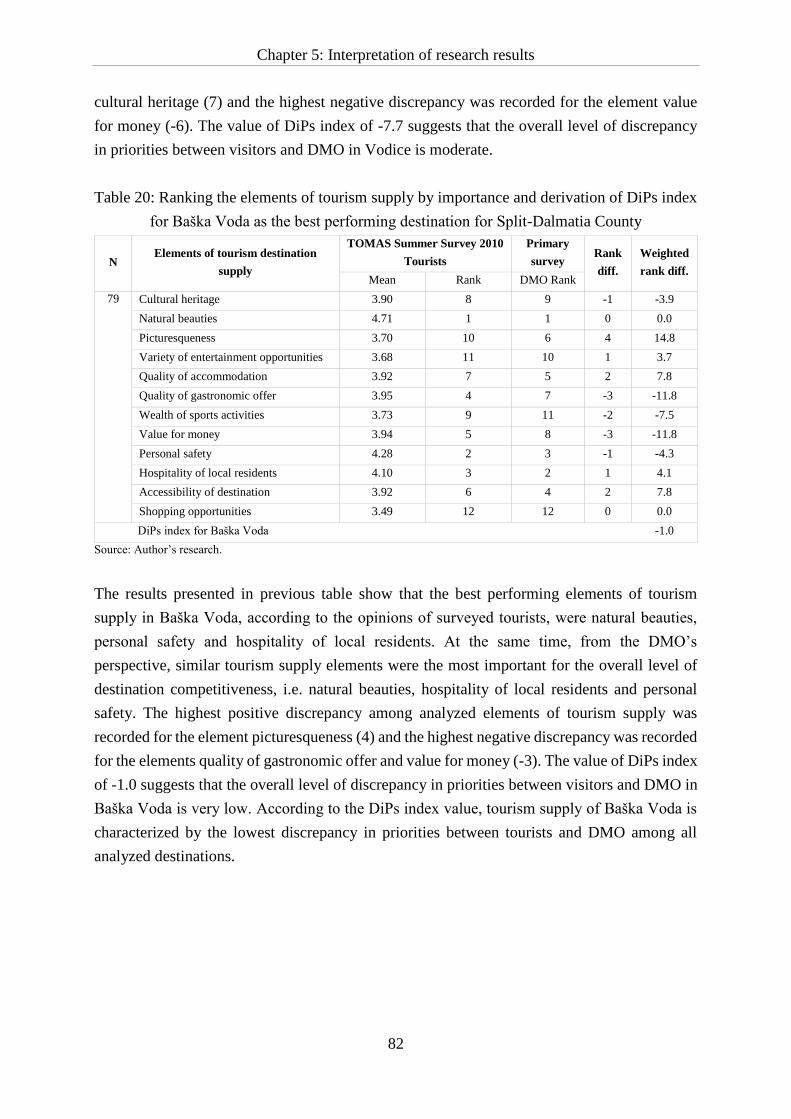
Chapter 5: Interpretation of research results
82
cultural heritage (7) and the highest negative discrepancy was recorded for the element value
for money (-6). The value of DiPs index of -7.7 suggests that the overall level of discrepancy
in priorities between visitors and DMO in Vodice is moderate.
Table 20: Ranking the elements of tourism supply by importance and derivation of DiPs index
for Baška Voda as the best performing destination for Split-Dalmatia County
N Elements of tourism destination
supply
TOMAS Summer Survey 2010
Tourists
Primary
survey Rank
diff.
Weighted
rank diff. Mean Rank DMO Rank
79 Cultural heritage 3.90 8 9 -1 -3.9
Natural beauties 4.71 1 1 0 0.0
Picturesqueness 3.70 10 6 4 14.8
Variety of entertainment opportunities 3.68 11 10 1 3.7
Quality of accommodation 3.92 7 5 2 7.8
Quality of gastronomic offer 3.95 4 7 -3 -11.8
Wealth of sports activities 3.73 9 11 -2 -7.5
Value for money 3.94 5 8 -3 -11.8
Personal safety 4.28 2 3 -1 -4.3
Hospitality of local residents 4.10 3 2 1 4.1
Accessibility of destination 3.92 6 4 2 7.8
Shopping opportunities 3.49 12 12 0 0.0
DiPs index for Baška Voda -1.0
Source: Author’s research.
The results presented in previous table show that the best performing elements of tourism
supply in Baška Voda, according to the opinions of surveyed tourists, were natural beauties,
personal safety and hospitality of local residents. At the same time, from the DMO’s
perspective, similar tourism supply elements were the most important for the overall level of
destination competitiveness, i.e. natural beauties, hospitality of local residents and personal
safety. The highest positive discrepancy among analyzed elements of tourism supply was
recorded for the element picturesqueness (4) and the highest negative discrepancy was recorded
for the elements quality of gastronomic offer and value for money (-3). The value of DiPs index
of -1.0 suggests that the overall level of discrepancy in priorities between visitors and DMO in
Baška Voda is very low. According to the DiPs index value, tourism supply of Baška Voda is
characterized by the lowest discrepancy in priorities between tourists and DMO among all
analyzed destinations.
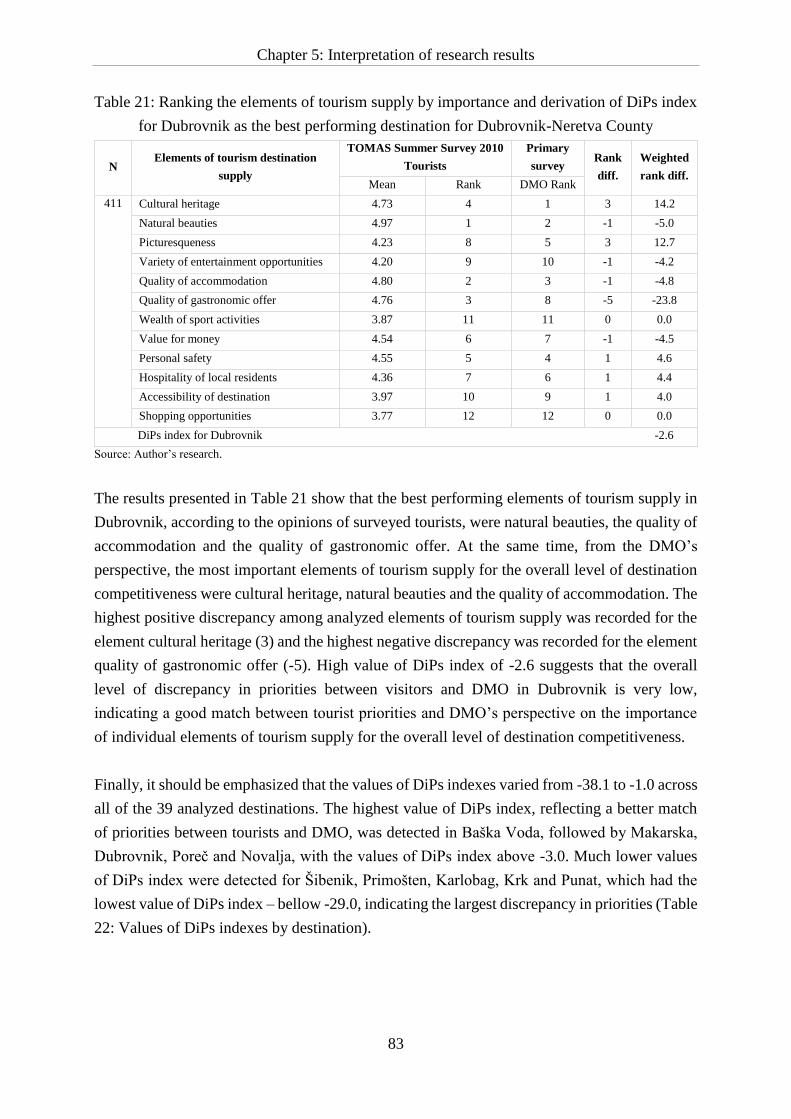
Chapter 5: Interpretation of research results
83
Table 21: Ranking the elements of tourism supply by importance and derivation of DiPs index
for Dubrovnik as the best performing destination for Dubrovnik-Neretva County
N Elements of tourism destination
supply
TOMAS Summer Survey 2010
Tourists
Primary
survey Rank
diff.
Weighted
rank diff. Mean Rank DMO Rank
411 Cultural heritage 4.73 4 1 3 14.2
Natural beauties 4.97 1 2 -1 -5.0
Picturesqueness 4.23 8 5 3 12.7
Variety of entertainment opportunities 4.20 9 10 -1 -4.2
Quality of accommodation 4.80 2 3 -1 -4.8
Quality of gastronomic offer 4.76 3 8 -5 -23.8
Wealth of sport activities 3.87 11 11 0 0.0
Value for money 4.54 6 7 -1 -4.5
Personal safety 4.55 5 4 1 4.6
Hospitality of local residents 4.36 7 6 1 4.4
Accessibility of destination 3.97 10 9 1 4.0
Shopping opportunities 3.77 12 12 0 0.0
DiPs index for Dubrovnik -2.6
Source: Author’s research.
The results presented in Table 21 show that the best performing elements of tourism supply in
Dubrovnik, according to the opinions of surveyed tourists, were natural beauties, the quality of
accommodation and the quality of gastronomic offer. At the same time, from the DMO’s
perspective, the most important elements of tourism supply for the overall level of destination
competitiveness were cultural heritage, natural beauties and the quality of accommodation. The
highest positive discrepancy among analyzed elements of tourism supply was recorded for the
element cultural heritage (3) and the highest negative discrepancy was recorded for the element
quality of gastronomic offer (-5). High value of DiPs index of -2.6 suggests that the overall
level of discrepancy in priorities between visitors and DMO in Dubrovnik is very low,
indicating a good match between tourist priorities and DMO’s perspective on the importance
of individual elements of tourism supply for the overall level of destination competitiveness.
Finally, it should be emphasized that the values of DiPs indexes varied from -38.1 to -1.0 across
all of the 39 analyzed destinations. The highest value of DiPs index, reflecting a better match
of priorities between tourists and DMO, was detected in Baška Voda, followed by Makarska,
Dubrovnik, Poreč and Novalja, with the values of DiPs index above -3.0. Much lower values
of DiPs index were detected for Šibenik, Primošten, Karlobag, Krk and Punat, which had the
lowest value of DiPs index – bellow -29.0, indicating the largest discrepancy in priorities (Table
22: Values of DiPs indexes by destination).
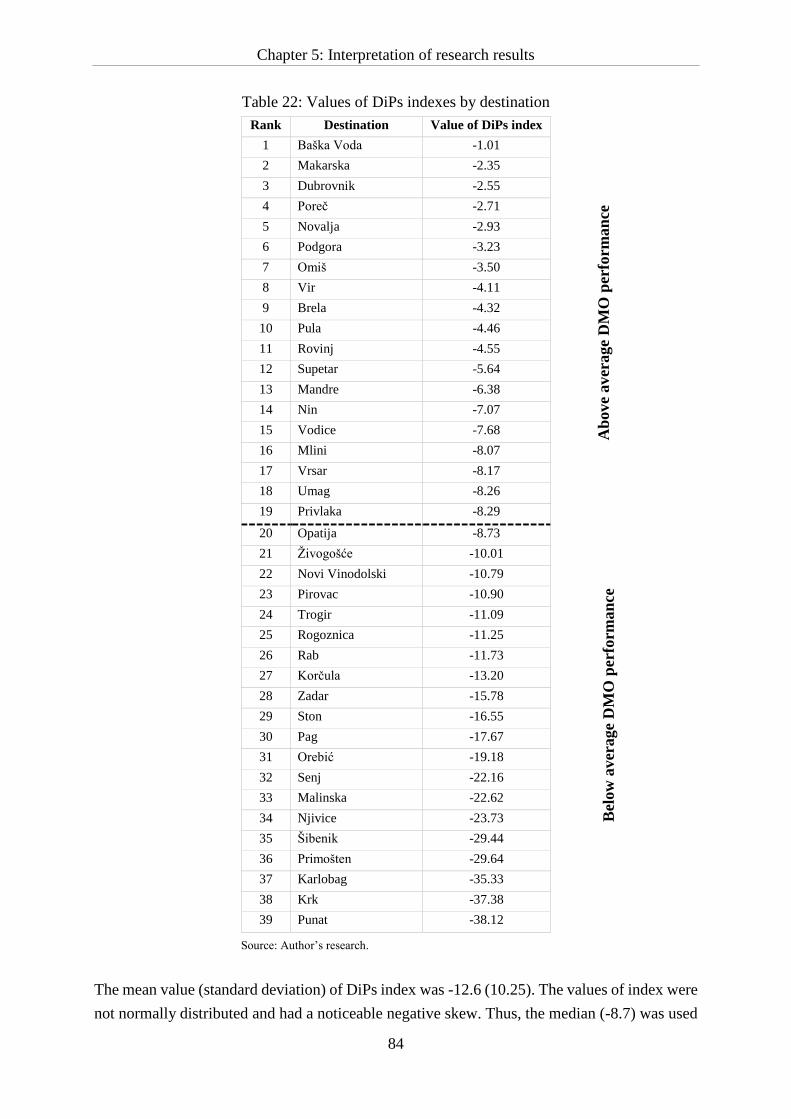
Chapter 5: Interpretation of research results
84
Table 22: Values of DiPs indexes by destination
Source: Author’s research.
The mean value (standard deviation) of DiPs index was -12.6 (10.25). The values of index were
not normally distributed and had a noticeable negative skew. Thus, the median (-8.7) was used
Rank Destination Value of DiPs index
1 Baška Voda -1.01
2 Makarska -2.35
3 Dubrovnik -2.55
4 Poreč -2.71
5 Novalja -2.93
6 Podgora -3.23
7 Omiš -3.50
8 Vir -4.11
9 Brela -4.32
10 Pula -4.46
11 Rovinj -4.55
12 Supetar -5.64
13 Mandre -6.38
14 Nin -7.07
15 Vodice -7.68
16 Mlini -8.07
17 Vrsar -8.17
18 Umag -8.26
19 Privlaka -8.29
20 Opatija -8.73
21 Živogošće -10.01
22 Novi Vinodolski -10.79
23 Pirovac -10.90
24 Trogir -11.09
25 Rogoznica -11.25
26 Rab -11.73
27 Korčula -13.20
28 Zadar -15.78
29 Ston -16.55
30 Pag -17.67
31 Orebić -19.18
32 Senj -22.16
33 Malinska -22.62
34 Njivice -23.73
35 Šibenik -29.44
36 Primošten -29.64
37 Karlobag -35.33
38 Krk -37.38
39 Punat -38.12
Ab
ove
aver
age
DM
O p
erfo
rman
ce
Bel
ow
aver
age
DM
O p
erf
orm
an
ce
Chapter 5: Interpretation of research results
85
as a measure of central tendency. According to above/below median values, destinations were
divided into two groups:
Above average DMO’s performance – destinations with the value of DiPs index above
median (> -8.7), denoting high compatibility of priorities, and
Below average DMO’s performance – destinations with the value of DiPs index equal
to or below median (≤ -8.7), denoting large discrepancy in priorities.
5.5 Relationship between tourist satisfaction and destination competitiveness
Tourist satisfaction was measured in 12 elements of tourism destination supply, the same
elements which were rated according to their importance for destination choice (TOMAS
Summer Survey 2010). A separate assessment of satisfaction and importance is ineffective, as
it does not account for differences in importance and satisfaction of particular destination
attribute. Satisfaction scores could suggest that certain destination attribute requires
intervention, but this may not be true if satisfaction is rated higher than importance. Thus, tourist
satisfaction was evaluated by utilizing the importance-performance analysis (IPA), i.e. tourists
satisfaction with certain destination attribute was adjusted for their expectations (i.e. importance
of that attribute). Satisfaction scores were measured on a five-point Likert scale anchored by 1
= very poor and 5 = excellent, compared to a six-point Likert scale adopted for importance
scores. To enable proper analysis and interpretation of differences in satisfaction and
importance scores, as the latter were measured on a different scale, importance scores were
rescaled to a five-point scale using a linear transformation technique.
The rated elements include the following attributes: cultural heritage, natural beauties,
picturesqueness, variety of entertainment opportunities, quality of accommodation, quality of
gastronomic offer, wealth of sports activities, value for money, personal safety, hospitality of
local residents, accessibility of destination and shopping opportunities. Corresponding null-
hypotheses were defined as:
H2a: Tourist satisfaction with cultural heritage is positively related to destination
competitiveness.
H2b: Tourist satisfaction with natural beauties is positively related to destination
competitiveness.
H2c: Tourist satisfaction with destination picturesqueness is positively related to destination
competitiveness.
H2d: Tourist satisfaction with variety of entertainment opportunities is positively related to
destination competitiveness.
H2e: Tourist satisfaction with quality of accommodation is positively related to destination
competitiveness.
Chapter 5: Interpretation of research results
86
H2f: Tourist satisfaction with quality of gastronomic offer is positively related to destination
competitiveness.
H2g: Tourist satisfaction with wealth of sport activities is positively related to destination
competitiveness.
H2h: Tourist satisfaction with value for money is positively related to destination
competitiveness.
H2i: Tourist satisfaction with personal safety is positively related to destination
competitiveness.
H2j: Tourist satisfaction with hospitality of residents is positively related to destination
competitiveness.
H2k: Tourist satisfaction with accessibility of destination is positively related to destination
competitiveness.
H2l: Tourist satisfaction with shopping opportunities is positively related to destination
competitiveness.
Effects of DMO’s performance on tourist satisfaction were assessed by IPA analysis, including
a Chi-square test, and by GEE model, to account for correlation arising from clustered data
when assessing satisfaction with individual elements of tourism destination supply. The results
of IPA are presented in Figure 12, combining tourism destination supply importance and
performance measures into a two-dimensional grid. Tourists indicated the importance of 12
different destination attributes on the destination choice and their mean importance was
contrasted to the mean satisfaction with these elements at a destination-specific level.
As in previously presented IPA analyzes, the mean importance and satisfaction scores were
calculated for each destination attribute in each destination (n=39), making a total of 468 dots
classified into two groups – attributes of destinations with above average DMO’s performance
(i.e. higher compatibility of priorities; blue color) and attributes of destinations with below
average DMO’s performance (i.e. larger discrepancy in priorities; orange color). A cut point
dividing the grid into quadrants was placed at the overall satisfaction and importance means.
Quadrant III represents the area of low importance and low satisfaction, the so-called “Low
priority” area. Elements in quadrant IV have low importance, but offer high satisfaction (this is
the area of “Possible overkill”), while in quadrant II both importance and satisfaction are high
(“Keep up the good work” area). The most delicate is the quadrant I with elements offering low
satisfaction, but of high importance for tourists’ experience (“Concentrate here” area). IPA plot
presented by Figure 12 shows that elements of tourism destination supply with above average
and below average DMO’s performance are not equally distributed in all quadrants, especially
not in quadrant I, where DMOs should focus their attention due to the negative discrepancy in
tourists’ satisfaction and importance. While only 7% of elements related to tourism destination
supply with above average DMO’s performance are located in quadrant I, this percentage is
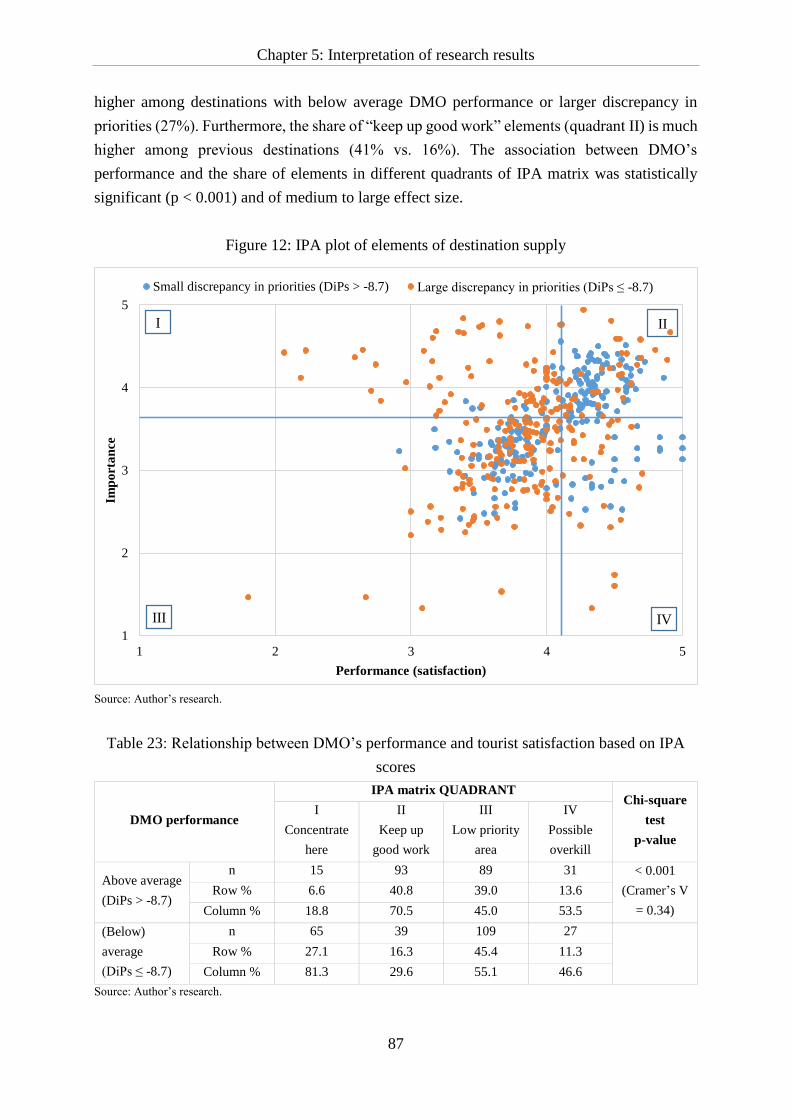
Chapter 5: Interpretation of research results
87
higher among destinations with below average DMO performance or larger discrepancy in
priorities (27%). Furthermore, the share of “keep up good work” elements (quadrant II) is much
higher among previous destinations (41% vs. 16%). The association between DMO’s
performance and the share of elements in different quadrants of IPA matrix was statistically
significant (p < 0.001) and of medium to large effect size.
Figure 12: IPA plot of elements of destination supply
Source: Author’s research.
Table 23: Relationship between DMO’s performance and tourist satisfaction based on IPA
scores
DMO performance
IPA matrix QUADRANT Chi-square
test
p-value
I
Concentrate
here
II
Keep up
good work
III
Low priority
area
IV
Possible
overkill
Above average
(DiPs > -8.7)
n 15 93 89 31 < 0.001
(Cramer’s V
= 0.34)
Row % 6.6 40.8 39.0 13.6
Column % 18.8 70.5 45.0 53.5
(Below)
average
(DiPs ≤ -8.7)
n 65 39 109 27
Row % 27.1 16.3 45.4 11.3
Column % 81.3 29.6 55.1 46.6
Source: Author’s research.
1
2
3
4
5
1 2 3 4 5
Imp
ort
an
ce
Performance (satisfaction)
Small discrepancy in priorities (DiPs > -8.7) Large discrepancy in priorities (DiPs ≤ -8.7)
I
III IV
II
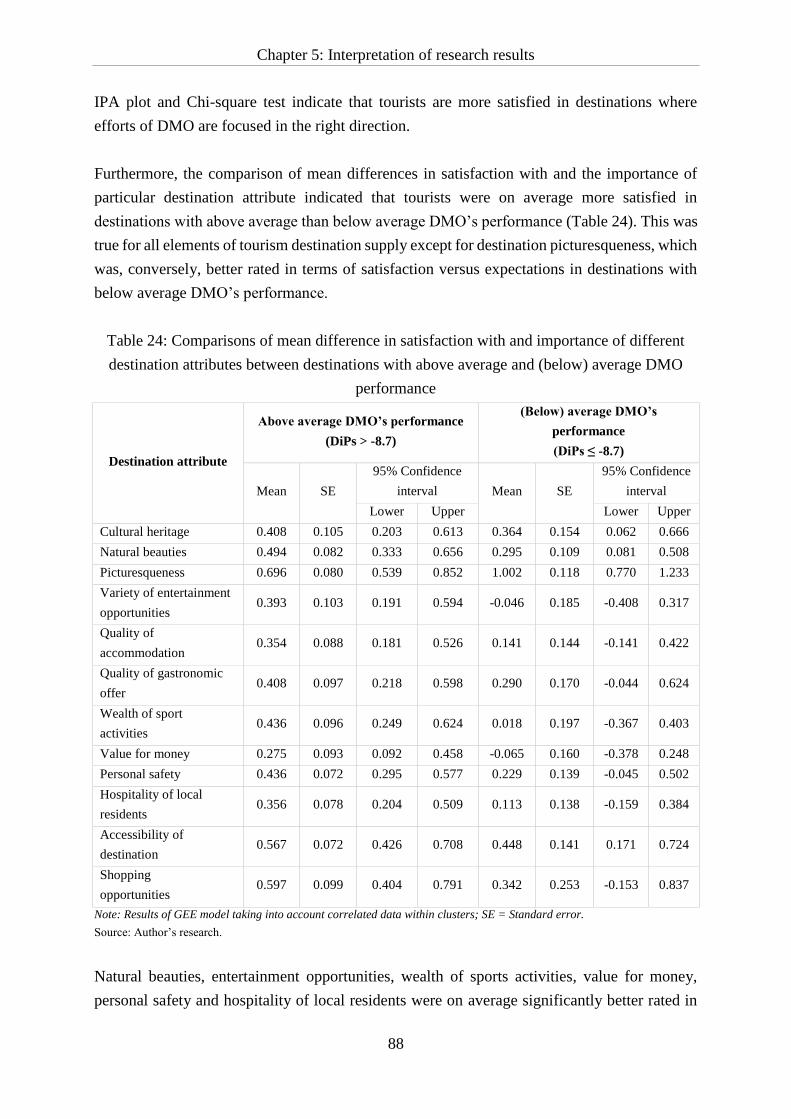
Chapter 5: Interpretation of research results
88
IPA plot and Chi-square test indicate that tourists are more satisfied in destinations where
efforts of DMO are focused in the right direction.
Furthermore, the comparison of mean differences in satisfaction with and the importance of
particular destination attribute indicated that tourists were on average more satisfied in
destinations with above average than below average DMO’s performance (Table 24). This was
true for all elements of tourism destination supply except for destination picturesqueness, which
was, conversely, better rated in terms of satisfaction versus expectations in destinations with
below average DMO’s performance.
Table 24: Comparisons of mean difference in satisfaction with and importance of different
destination attributes between destinations with above average and (below) average DMO
performance
Destination attribute
Above average DMO’s performance
(DiPs > -8.7)
(Below) average DMO’s
performance
(DiPs ≤ -8.7)
Mean SE
95% Confidence
interval Mean SE
95% Confidence
interval
Lower Upper Lower Upper
Cultural heritage 0.408 0.105 0.203 0.613 0.364 0.154 0.062 0.666
Natural beauties 0.494 0.082 0.333 0.656 0.295 0.109 0.081 0.508
Picturesqueness 0.696 0.080 0.539 0.852 1.002 0.118 0.770 1.233
Variety of entertainment
opportunities 0.393 0.103 0.191 0.594 -0.046 0.185 -0.408 0.317
Quality of
accommodation 0.354 0.088 0.181 0.526 0.141 0.144 -0.141 0.422
Quality of gastronomic
offer 0.408 0.097 0.218 0.598 0.290 0.170 -0.044 0.624
Wealth of sport
activities 0.436 0.096 0.249 0.624 0.018 0.197 -0.367 0.403
Value for money 0.275 0.093 0.092 0.458 -0.065 0.160 -0.378 0.248
Personal safety 0.436 0.072 0.295 0.577 0.229 0.139 -0.045 0.502
Hospitality of local
residents 0.356 0.078 0.204 0.509 0.113 0.138 -0.159 0.384
Accessibility of
destination 0.567 0.072 0.426 0.708 0.448 0.141 0.171 0.724
Shopping
opportunities 0.597 0.099 0.404 0.791 0.342 0.253 -0.153 0.837
Note: Results of GEE model taking into account correlated data within clusters; SE = Standard error.
Source: Author’s research.
Natural beauties, entertainment opportunities, wealth of sports activities, value for money,
personal safety and hospitality of local residents were on average significantly better rated in
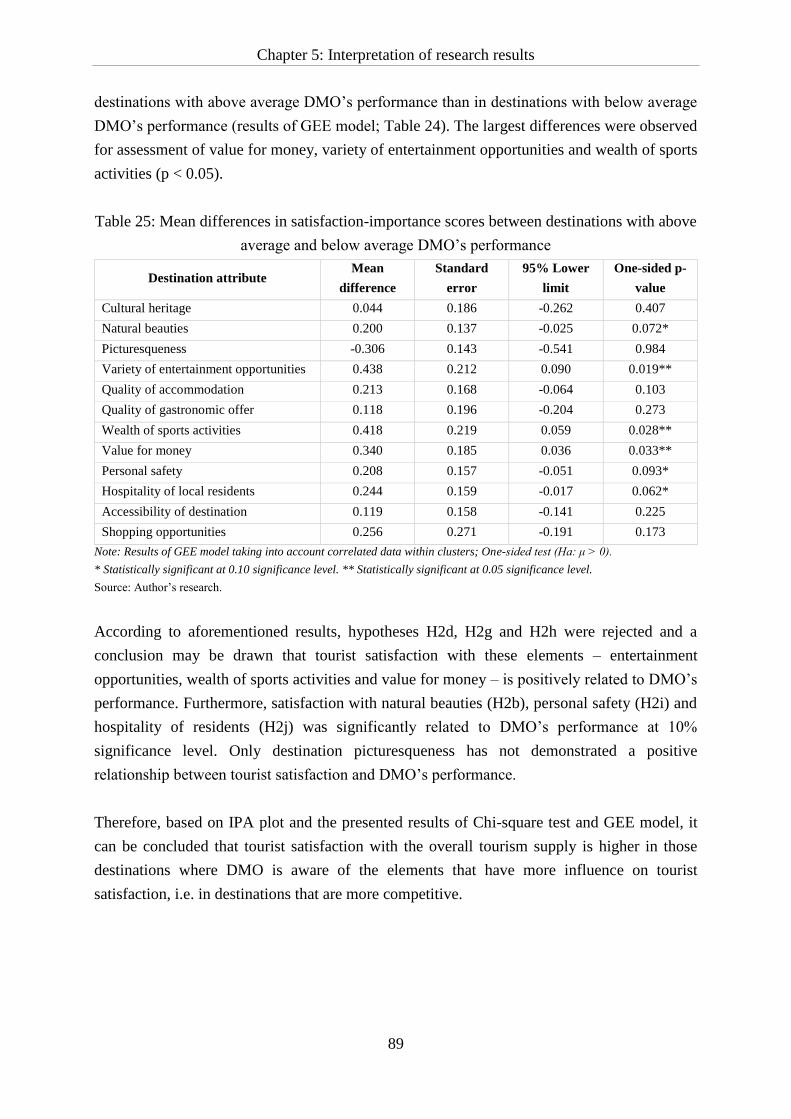
Chapter 5: Interpretation of research results
89
destinations with above average DMO’s performance than in destinations with below average
DMO’s performance (results of GEE model; Table 24). The largest differences were observed
for assessment of value for money, variety of entertainment opportunities and wealth of sports
activities (p < 0.05).
Table 25: Mean differences in satisfaction-importance scores between destinations with above
average and below average DMO’s performance
Destination attribute Mean
difference
Standard
error
95% Lower
limit
One-sided p-
value
Cultural heritage 0.044 0.186 -0.262 0.407
Natural beauties 0.200 0.137 -0.025 0.072*
Picturesqueness -0.306 0.143 -0.541 0.984
Variety of entertainment opportunities 0.438 0.212 0.090 0.019**
Quality of accommodation 0.213 0.168 -0.064 0.103
Quality of gastronomic offer 0.118 0.196 -0.204 0.273
Wealth of sports activities 0.418 0.219 0.059 0.028**
Value for money 0.340 0.185 0.036 0.033**
Personal safety 0.208 0.157 -0.051 0.093*
Hospitality of local residents 0.244 0.159 -0.017 0.062*
Accessibility of destination 0.119 0.158 -0.141 0.225
Shopping opportunities 0.256 0.271 -0.191 0.173
Note: Results of GEE model taking into account correlated data within clusters; One-sided test (Ha: μ > 0).
* Statistically significant at 0.10 significance level. ** Statistically significant at 0.05 significance level.
Source: Author’s research.
According to aforementioned results, hypotheses H2d, H2g and H2h were rejected and a
conclusion may be drawn that tourist satisfaction with these elements – entertainment
opportunities, wealth of sports activities and value for money – is positively related to DMO’s
performance. Furthermore, satisfaction with natural beauties (H2b), personal safety (H2i) and
hospitality of residents (H2j) was significantly related to DMO’s performance at 10%
significance level. Only destination picturesqueness has not demonstrated a positive
relationship between tourist satisfaction and DMO’s performance.
Therefore, based on IPA plot and the presented results of Chi-square test and GEE model, it
can be concluded that tourist satisfaction with the overall tourism supply is higher in those
destinations where DMO is aware of the elements that have more influence on tourist
satisfaction, i.e. in destinations that are more competitive.
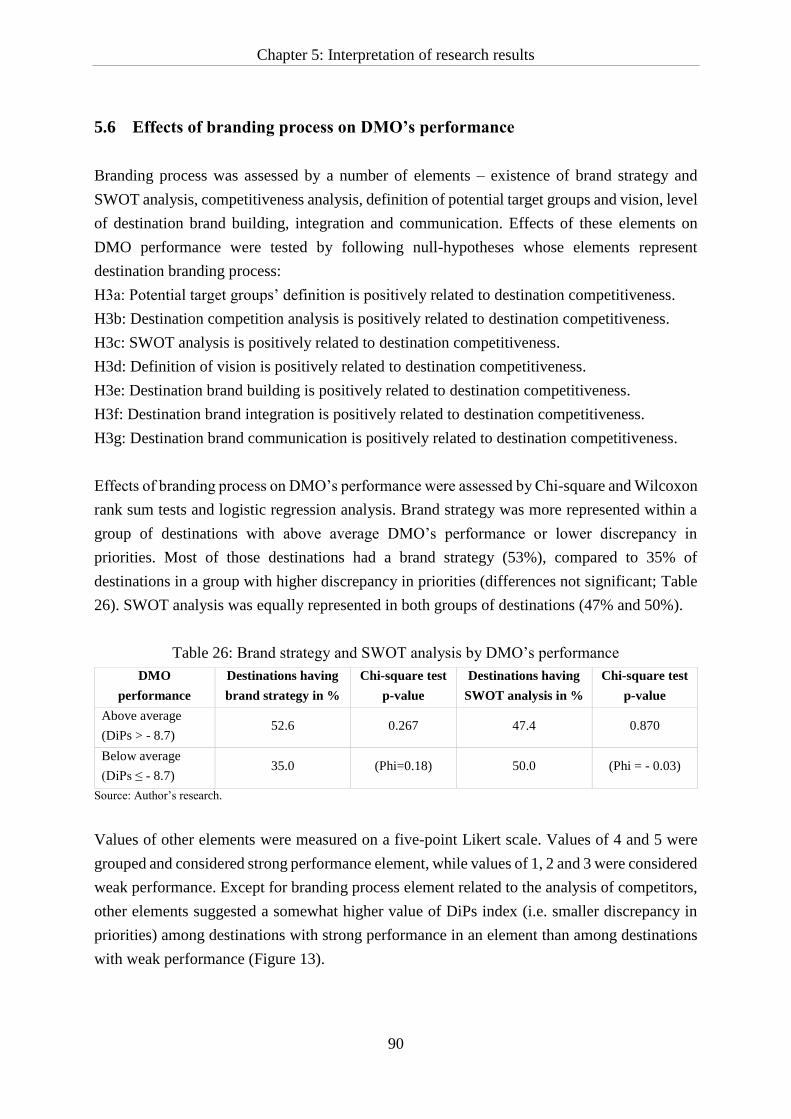
Chapter 5: Interpretation of research results
90
5.6 Effects of branding process on DMO’s performance
Branding process was assessed by a number of elements – existence of brand strategy and
SWOT analysis, competitiveness analysis, definition of potential target groups and vision, level
of destination brand building, integration and communication. Effects of these elements on
DMO performance were tested by following null-hypotheses whose elements represent
destination branding process:
H3a: Potential target groups’ definition is positively related to destination competitiveness.
H3b: Destination competition analysis is positively related to destination competitiveness.
H3c: SWOT analysis is positively related to destination competitiveness.
H3d: Definition of vision is positively related to destination competitiveness.
H3e: Destination brand building is positively related to destination competitiveness.
H3f: Destination brand integration is positively related to destination competitiveness.
H3g: Destination brand communication is positively related to destination competitiveness.
Effects of branding process on DMO’s performance were assessed by Chi-square and Wilcoxon
rank sum tests and logistic regression analysis. Brand strategy was more represented within a
group of destinations with above average DMO’s performance or lower discrepancy in
priorities. Most of those destinations had a brand strategy (53%), compared to 35% of
destinations in a group with higher discrepancy in priorities (differences not significant; Table
26). SWOT analysis was equally represented in both groups of destinations (47% and 50%).
Table 26: Brand strategy and SWOT analysis by DMO’s performance
DMO
performance
Destinations having
brand strategy in %
Chi-square test
p-value
Destinations having
SWOT analysis in %
Chi-square test
p-value
Above average
(DiPs > - 8.7) 52.6 0.267 47.4 0.870
Below average
(DiPs ≤ - 8.7) 35.0 (Phi=0.18) 50.0 (Phi = - 0.03)
Source: Author’s research.
Values of other elements were measured on a five-point Likert scale. Values of 4 and 5 were
grouped and considered strong performance element, while values of 1, 2 and 3 were considered
weak performance. Except for branding process element related to the analysis of competitors,
other elements suggested a somewhat higher value of DiPs index (i.e. smaller discrepancy in
priorities) among destinations with strong performance in an element than among destinations
with weak performance (Figure 13).
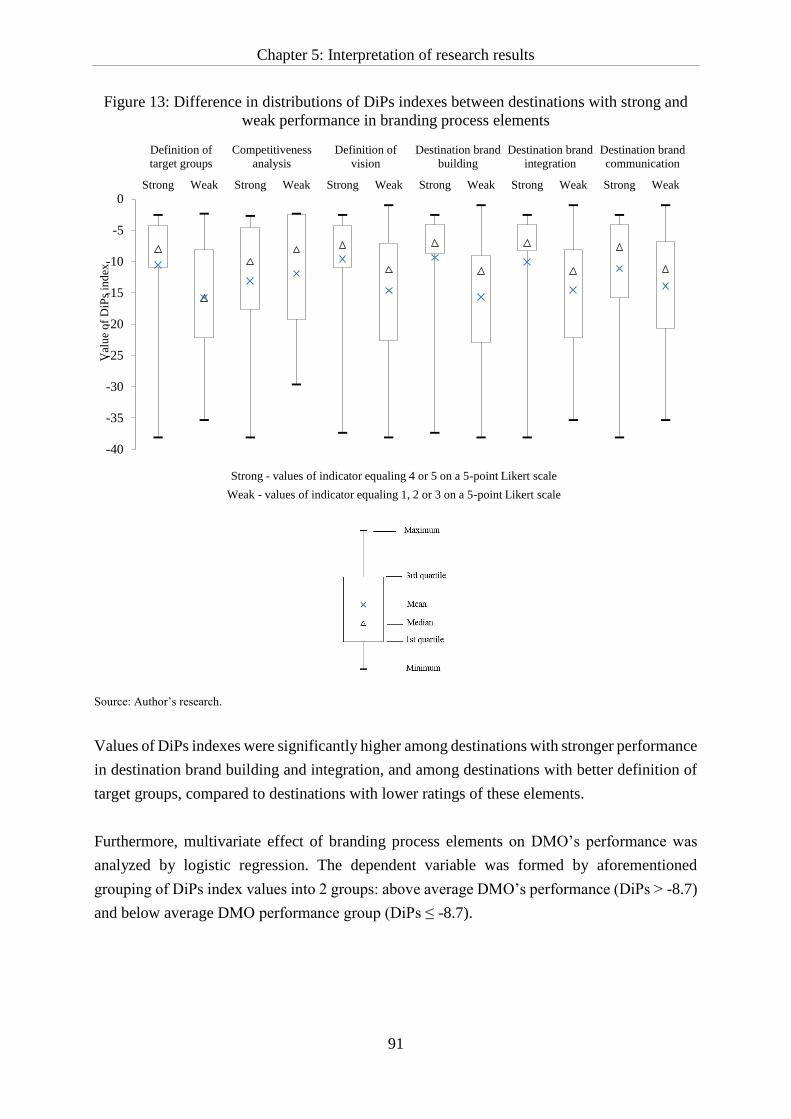
Chapter 5: Interpretation of research results
91
Figure 13: Difference in distributions of DiPs indexes between destinations with strong and
weak performance in branding process elements
Source: Author’s research.
Values of DiPs indexes were significantly higher among destinations with stronger performance
in destination brand building and integration, and among destinations with better definition of
target groups, compared to destinations with lower ratings of these elements.
Furthermore, multivariate effect of branding process elements on DMO’s performance was
analyzed by logistic regression. The dependent variable was formed by aforementioned
grouping of DiPs index values into 2 groups: above average DMO’s performance (DiPs > -8.7)
and below average DMO performance group (DiPs ≤ -8.7).
-40
-35
-30
-25
-20
-15
-10
-5
0Strong Weak Strong Weak Strong Weak Strong Weak Strong Weak Strong Weak
Definition of
target groups
Competitiveness
analysis
Definition of
vision
Destination brand
building
Destination brand
integration
Destination brand
communication
Val
ue
of
DiP
s in
dex
Strong - values of indicator equaling 4 or 5 on a 5-point Likert scale
Weak - values of indicator equaling 1, 2 or 3 on a 5-point Likert scale
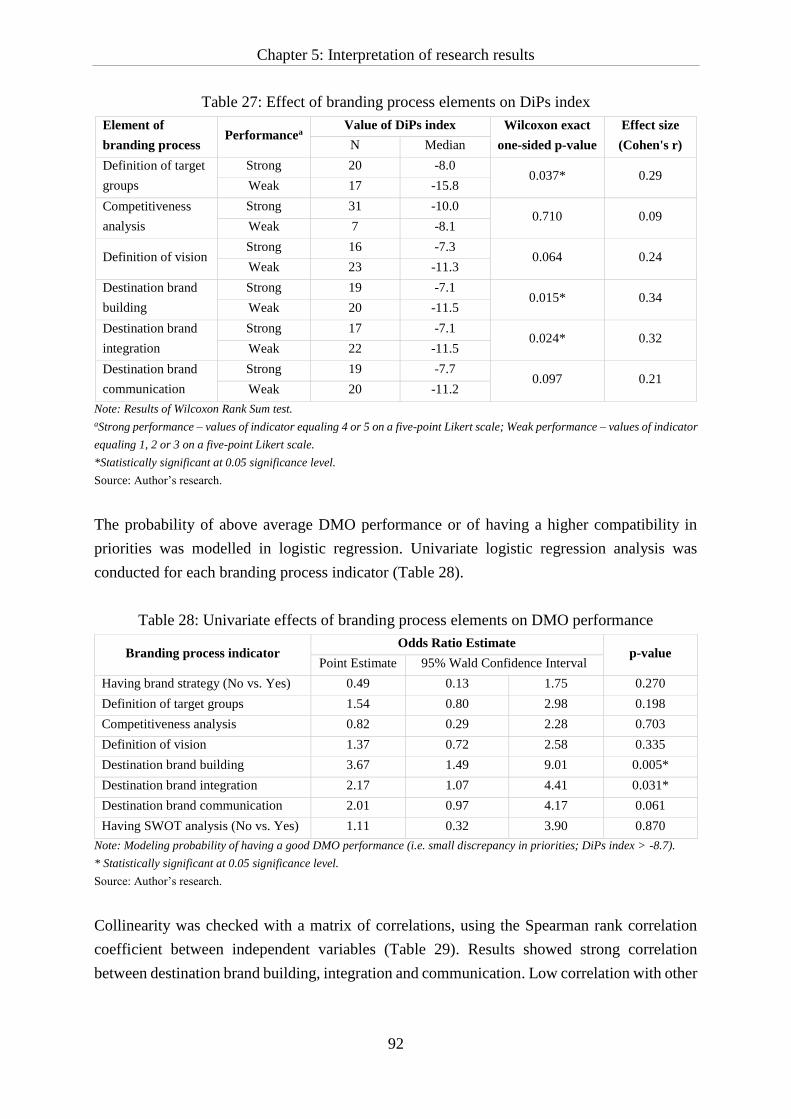
Chapter 5: Interpretation of research results
92
Table 27: Effect of branding process elements on DiPs index
Element of
branding process Performancea
Value of DiPs index Wilcoxon exact
one-sided p-value
Effect size
(Cohen's r) N Median
Definition of target
groups
Strong 20 -8.0 0.037* 0.29
Weak 17 -15.8
Competitiveness
analysis
Strong 31 -10.0 0.710 0.09
Weak 7 -8.1
Definition of vision Strong 16 -7.3
0.064 0.24 Weak 23 -11.3
Destination brand
building
Strong 19 -7.1 0.015* 0.34
Weak 20 -11.5
Destination brand
integration
Strong 17 -7.1 0.024* 0.32
Weak 22 -11.5
Destination brand
communication
Strong 19 -7.7 0.097 0.21
Weak 20 -11.2
Note: Results of Wilcoxon Rank Sum test.
aStrong performance – values of indicator equaling 4 or 5 on a five-point Likert scale; Weak performance – values of indicator
equaling 1, 2 or 3 on a five-point Likert scale.
*Statistically significant at 0.05 significance level.
Source: Author’s research.
The probability of above average DMO performance or of having a higher compatibility in
priorities was modelled in logistic regression. Univariate logistic regression analysis was
conducted for each branding process indicator (Table 28).
Table 28: Univariate effects of branding process elements on DMO performance
Branding process indicator Odds Ratio Estimate
p-value Point Estimate 95% Wald Confidence Interval
Having brand strategy (No vs. Yes) 0.49 0.13 1.75 0.270
Definition of target groups 1.54 0.80 2.98 0.198
Competitiveness analysis 0.82 0.29 2.28 0.703
Definition of vision 1.37 0.72 2.58 0.335
Destination brand building 3.67 1.49 9.01 0.005*
Destination brand integration 2.17 1.07 4.41 0.031*
Destination brand communication 2.01 0.97 4.17 0.061
Having SWOT analysis (No vs. Yes) 1.11 0.32 3.90 0.870
Note: Modeling probability of having a good DMO performance (i.e. small discrepancy in priorities; DiPs index > -8.7).
* Statistically significant at 0.05 significance level.
Source: Author’s research.
Collinearity was checked with a matrix of correlations, using the Spearman rank correlation
coefficient between independent variables (Table 29). Results showed strong correlation
between destination brand building, integration and communication. Low correlation with other
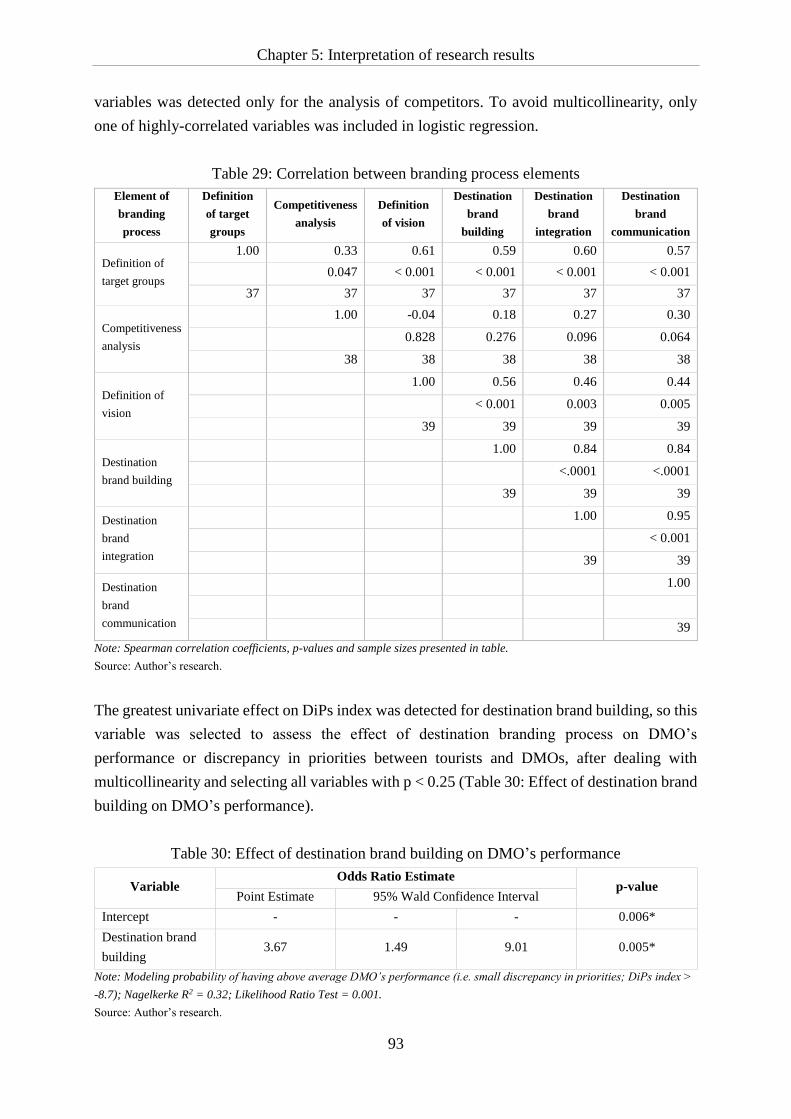
Chapter 5: Interpretation of research results
93
variables was detected only for the analysis of competitors. To avoid multicollinearity, only
one of highly-correlated variables was included in logistic regression.
Table 29: Correlation between branding process elements
Element of
branding
process
Definition
of target
groups
Competitiveness
analysis
Definition
of vision
Destination
brand
building
Destination
brand
integration
Destination
brand
communication
Definition of
target groups
1.00 0.33 0.61 0.59 0.60 0.57
0.047 < 0.001 < 0.001 < 0.001 < 0.001
37 37 37 37 37 37
Competitiveness
analysis
1.00 -0.04 0.18 0.27 0.30
0.828 0.276 0.096 0.064
38 38 38 38 38
Definition of
vision
1.00 0.56 0.46 0.44
< 0.001 0.003 0.005
39 39 39 39
Destination
brand building
1.00 0.84 0.84
<.0001 <.0001
39 39 39
Destination
brand
integration
1.00 0.95
< 0.001
39 39
Destination
brand
communication
1.00
39
Note: Spearman correlation coefficients, p-values and sample sizes presented in table.
Source: Author’s research.
The greatest univariate effect on DiPs index was detected for destination brand building, so this
variable was selected to assess the effect of destination branding process on DMO’s
performance or discrepancy in priorities between tourists and DMOs, after dealing with
multicollinearity and selecting all variables with p < 0.25 (Table 30: Effect of destination brand
building on DMO’s performance).
Table 30: Effect of destination brand building on DMO’s performance
Variable Odds Ratio Estimate
p-value Point Estimate 95% Wald Confidence Interval
Intercept - - - 0.006*
Destination brand
building 3.67 1.49 9.01 0.005*
Note: Modeling probability of having above average DMO’s performance (i.e. small discrepancy in priorities; DiPs index >
-8.7); Nagelkerke R2 = 0.32; Likelihood Ratio Test = 0.001.
Source: Author’s research.
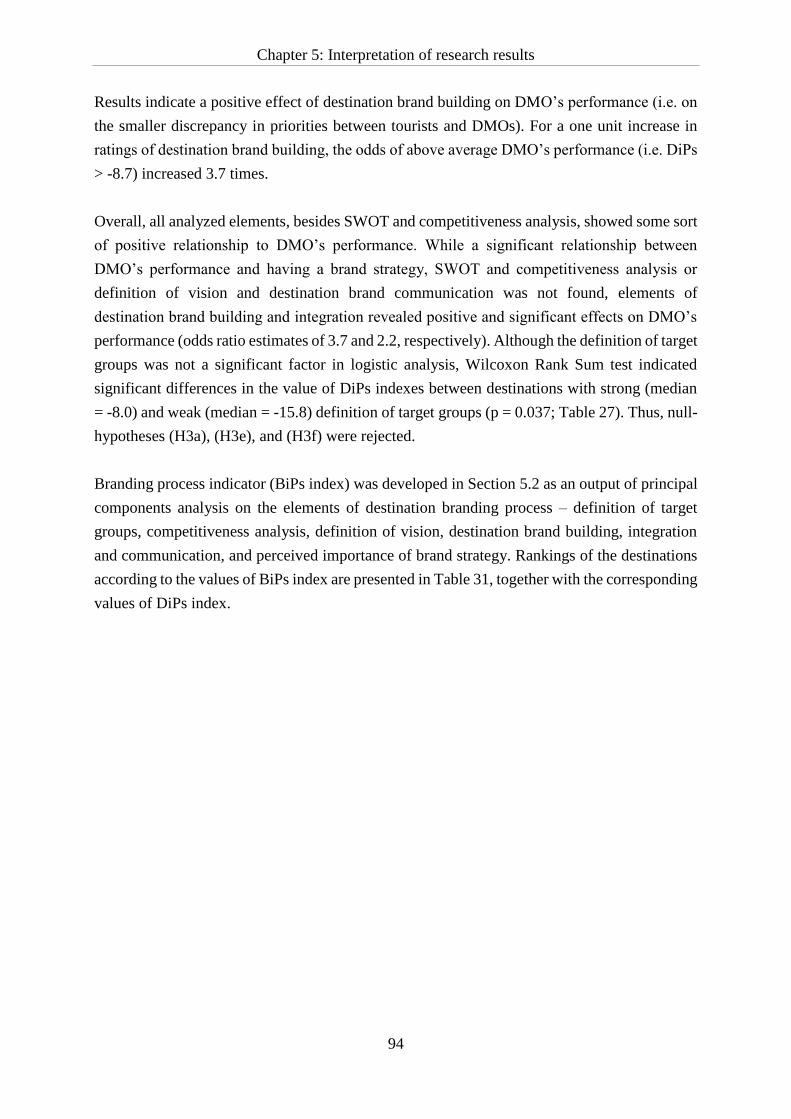
Chapter 5: Interpretation of research results
94
Results indicate a positive effect of destination brand building on DMO’s performance (i.e. on
the smaller discrepancy in priorities between tourists and DMOs). For a one unit increase in
ratings of destination brand building, the odds of above average DMO’s performance (i.e. DiPs
> -8.7) increased 3.7 times.
Overall, all analyzed elements, besides SWOT and competitiveness analysis, showed some sort
of positive relationship to DMO’s performance. While a significant relationship between
DMO’s performance and having a brand strategy, SWOT and competitiveness analysis or
definition of vision and destination brand communication was not found, elements of
destination brand building and integration revealed positive and significant effects on DMO’s
performance (odds ratio estimates of 3.7 and 2.2, respectively). Although the definition of target
groups was not a significant factor in logistic analysis, Wilcoxon Rank Sum test indicated
significant differences in the value of DiPs indexes between destinations with strong (median
= -8.0) and weak (median = -15.8) definition of target groups (p = 0.037; Table 27). Thus, null-
hypotheses (H3a), (H3e), and (H3f) were rejected.
Branding process indicator (BiPs index) was developed in Section 5.2 as an output of principal
components analysis on the elements of destination branding process – definition of target
groups, competitiveness analysis, definition of vision, destination brand building, integration
and communication, and perceived importance of brand strategy. Rankings of the destinations
according to the values of BiPs index are presented in Table 31, together with the corresponding
values of DiPs index.
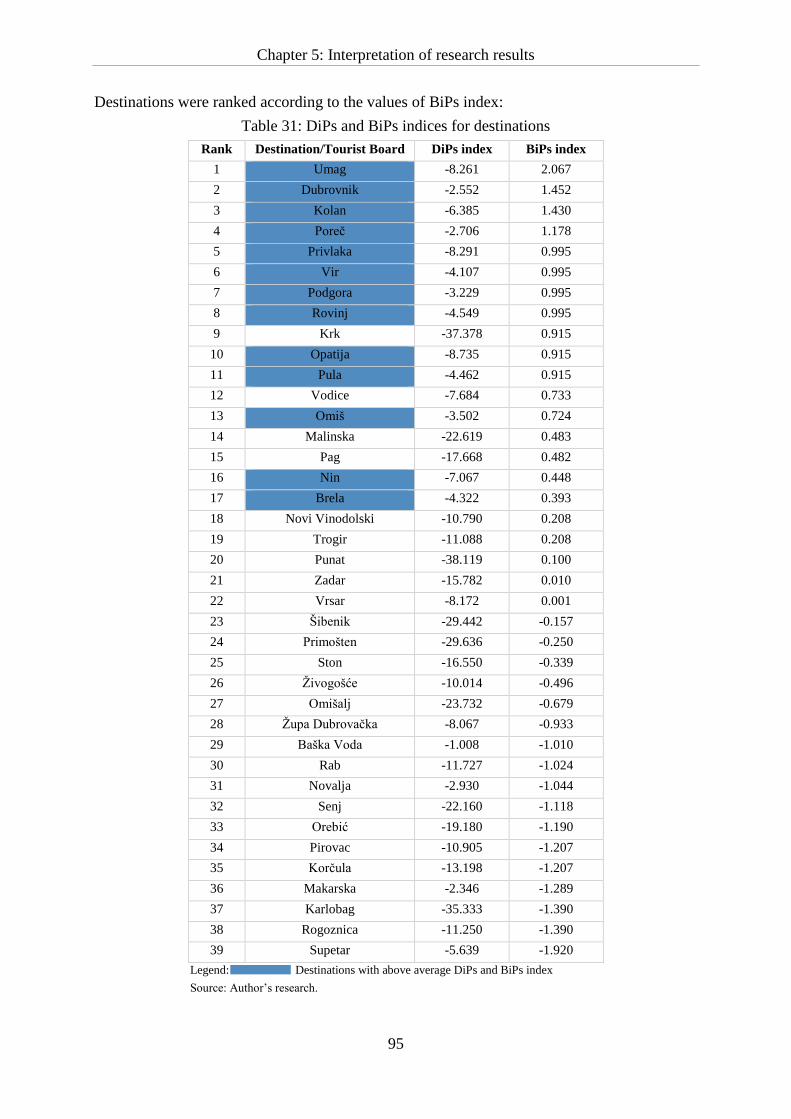
Chapter 5: Interpretation of research results
95
Destinations were ranked according to the values of BiPs index:
Table 31: DiPs and BiPs indices for destinations
Rank Destination/Tourist Board DiPs index BiPs index
1 Umag -8.261 2.067
2 Dubrovnik -2.552 1.452
3 Kolan -6.385 1.430
4 Poreč -2.706 1.178
5 Privlaka -8.291 0.995
6 Vir -4.107 0.995
7 Podgora -3.229 0.995
8 Rovinj -4.549 0.995
9 Krk -37.378 0.915
10 Opatija -8.735 0.915
11 Pula -4.462 0.915
12 Vodice -7.684 0.733
13 Omiš -3.502 0.724
14 Malinska -22.619 0.483
15 Pag -17.668 0.482
16 Nin -7.067 0.448
17 Brela -4.322 0.393
18 Novi Vinodolski -10.790 0.208
19 Trogir -11.088 0.208
20 Punat -38.119 0.100
21 Zadar -15.782 0.010
22 Vrsar -8.172 0.001
23 Šibenik -29.442 -0.157
24 Primošten -29.636 -0.250
25 Ston -16.550 -0.339
26 Živogošće -10.014 -0.496
27 Omišalj -23.732 -0.679
28 Župa Dubrovačka -8.067 -0.933
29 Baška Voda -1.008 -1.010
30 Rab -11.727 -1.024
31 Novalja -2.930 -1.044
32 Senj -22.160 -1.118
33 Orebić -19.180 -1.190
34 Pirovac -10.905 -1.207
35 Korčula -13.198 -1.207
36 Makarska -2.346 -1.289
37 Karlobag -35.333 -1.390
38 Rogoznica -11.250 -1.390
39 Supetar -5.639 -1.920
Legend: Destinations with above average DiPs and BiPs index
Source: Author’s research.
Chapter 5: Interpretation of research results
96
Correlation between values of DiPs and BiPs indices, measured by Spearman’s correlation
coefficient, was marginally significant (p = 0.059) and positive (r = 0.305). The values of BiPs
index were compared between destinations with above-average values of DiPs index (DiPs > -
8.7) and below-average values of DiPs index (DiPs ≤ -8.7). The independent t-test was used for
comparison.
Table 32: Comparison of average values of BiPs index between destinations with above
average and below average values of DiPs index (results of t-test)
DiPs index BiPs index
Mean Standard deviation p-value
Above average 0.375 1.098 0.020
Below average -0.356 0.764
Source: Author’s research.
Results of t-test reveal that the BiPs index is on average higher in destinations with above-
average compatibility of priorities between tourists and DMO than in destinations with below-
average compatibility in these priorities (p = 0.020). Average value of BiPs index was 0.375
for the former and -0.356 for the latter destinations.
Finally, with respect to all of the previously presented and interpreted research results, it can be
concluded that DMO’s performance is positively related to destination branding process.
Chapter 6: Conclusion
97
6 CONCLUSION
The concluding chapter includes summary of the findings, explanation of the scientific and
professional contribution, and methodological limitations and recommendations for the further
research.
6.1 Summary of the findings
The main objective of this dissertation was to investigate whether destination branding, as a
relatively novel concept in tourism theory and practice, is a factor influencing destination
competitiveness. This line of thought is based upon the premise that one of the important
sources of destination competitive advantage is its market uniqueness and visibility, which can
be achieved through the destination branding process.
Even though different determinants and attributes of destination competitiveness and
destination branding have been well studied and meticulously documented throughout the
tourism research literature, a comprehensive and generally accepted theoretical framework,
connecting the notions of destination branding and destination competitiveness, has still not
been developed. As determined by the literature review, there is a lack of knowledge and
understanding about the role that destination branding plays in the process of achieving tourism
destination competitiveness and this represents an important research gap which is partially
addressed by this dissertation. In order to shed some additional light on the complex relationship
between destination branding and destination competitiveness, selected Croatia’s seaside
tourism destinations are used as a case study, which is closely described in the text below.
Even though there is no clearly defined relationship between destination competitiveness and
destination branding, destination branding is nevertheless partially mentioned in the two most
known destination competitiveness models – a General model of destination competitiveness
proposed by Ritchie and Crouch (2003) and the Integrated Model of Destination
Competitiveness proposed by Dwyer and Kim (2003). According to Ritchie and Crouch’s
model, positioning/branding is a part of destination policy, planning and development
dimension, while Dwyer and Kim recognized destination positioning and clarity of destination
Chapter 6: Conclusion
98
image as variables that influence destination competitiveness, but they don’t discuss destination
branding process explicitly.
Two basic research methods were used for the purposes of discussion and hypotheses testing in
this dissertation – desk research and exploratory research. The desk research included an
overview of current literature covering various scientific and professional articles in destination
competitiveness and destination branding fields, and secondary data analysis. Secondary data
analysis included data collected for TOMAS Summer Survey 2010 on attitudes and expenditure
of tourists in Croatia’s seaside destinations, conducted by the Institute for Tourism, Zagreb.
The survey was conducted on a sample of 4,973 respondents interviewed in 85 seaside
destinations in Croatia during the peak tourism season, from mid-June until end of September
of 2010. Both, data collected through the exploratory research, as well as secondary data were
used for the assessment of the importance of branding as a destination competitiveness factor.
Exploratory research was focused on data collection from DMO’s of tourism destinations that
were included in the TOMAS Summer Survey 2010. The survey instrument of primary data
collection was an on-line questionnaire. The main goal of the primary data collection was to
gain more insight in the process of destination branding development.
Three out of the four initially formulated research questions were answered based on the data
collected through the literature review. Those questions are: (i) “What are destination
competitiveness factors and models?”, (ii) “How is destination competitiveness measured?” and
(iii) “What is destination branding?”. Answer to the fourth research question is provided by the
results obtained by the statistical analysis of the data collected through the exploratory research.
This question is: “Are those tourism destinations which implement destination branding more
competitive than those which don’t?”. The research included total of 39 destinations or 46% of
all destinations’ to whom the questionnaire was sent. Research results showed that two thirds
(67%) of the surveyed destinations had some kind of a strategic planning document, while brand
strategy was represented in all of the destinations that had some kind of strategic documents.
In order to examine hypothesis H1: Destination branding process is positively related to tourist
satisfaction, 12 auxiliary hypotheses were used (H1a-H1l). Principal components analysis
(PCA) was applied on a set of branding process elements – definition of target groups,
competitiveness analysis, definition of vision, destination brand building, integration and
communication, and perceived importance of brand strategy – in order to address their
underlying structure in smaller number of principal components, i.e. to reduce the
dimensionality of the data. IPA analysis, including a Chi-square test, and GEE model was
applied to assess the effects of destination branding process on tourist satisfaction. According
to the research results, it can be concluded that tourist satisfaction with the overall tourism
supply is higher in those destinations with better developed marketing strategy and brand
Chapter 6: Conclusion
99
definition. Therefore, the analysis of the effects of branding process on tourist satisfaction,
measured by assessing the relationship of three branding process factors on 12 elements of
destination supply (12 auxiliary hypotheses), shows that tourist satisfaction with the overall
tourism supply is higher in those destinations with better branding performance, as measured
by BiPs index, which confirms the hypothesis H1.
In order to examine hypothesis H2: Tourist satisfaction is positively related to destination
competitiveness, 12 auxiliary hypotheses were used (H2a-H2l). Tourist satisfaction was
evaluated by utilizing the importance-performance analysis (IPA), i.e. tourists satisfaction
(performance) with certain destination attribute was compared to their expectations (i.e.
importance of that attribute). At the other hand, destination competitiveness (measured by
DMO’s performance) was determined by calculating discrepancy in priorities (DiPs) index,
which can be interpreted as the ability of tourism destination to identify and satisfy the needs
and wants of its visitors. The closer the value of DiPs index is to 0, the destination is more able
to identify and satisfy the needs of its visitors and, therefore, the destination is better performing
i.e. more competitive. Based on the IPA plot and the results obtained by Chi-square test and
GEE model it was concluded that tourist satisfaction with the overall tourism supply is higher
in those destinations with smaller values of DiPs index. In other words, destinations with higher
level of tourism satisfaction will be better performing and, hence, more competitive, which
confirms hypothesis H2.
Finally, in order to examine hypothesis H3: Destination branding process is positively related
to destination competitiveness, 7 auxiliary hypotheses were used (H3a-H3g). The effects of
branding process elements on destination competitiveness (measured by DMO’s performance)
were tested. All analyzed branding process elements (besides SWOT and competitiveness
analysis) showed some sort of positive relationship to DMO’s performance. While a significant
relationship between DMO’s performance and having a brand strategy, SWOT and
competitiveness analysis or definition of vision and destination brand communication was not
found, elements of destination brand building and integration revealed positive and significant
effects on DMO’s performance. In order to aggregate destination branding activities into single,
composite indicator, a branding process indicator (BiPs index) was developed. BiPs index
represents a weighted average of all the factors included in the destination branding process.
Weights were determined based on relative importance of these factors on destination
competitiveness measured as a DiPs index. Correlation coefficient between values of DiPs and
BiPs indices, measured by Spearman’s correlation coefficient, was significant (p = 0.059) and
positive (r = 0.305). Therefore, it can be concluded that destination with better branding will
have better performance and be more competitive, which confirms hypothesis H3.
Chapter 6: Conclusion
100
6.2 Scientific and managerial contributions
According to the research results, it is determined that destination branding significantly
influences the level of destination competitiveness. Therefore, the extension of existing models
of destination competitiveness with the use of destination branding process is considered to be
an important step forward in filling the theoretical gap between the fields of destination
branding and competitiveness. Keeping in mind the increasing number of tourism destinations
with similar tourism resource base and promotion efforts, trying to attract the same market
segments, it becomes evident that a clear definition of major brand determinant will become an
imperative for maintaining destinations competitive in the future. Visitors frequently ask
themselves why they would choose one destination over another if they all have similar tourism
product as well as other elements of marketing mix (price, place and promotion). It is therefore,
a brand of tourism destination itself that should create an emotional link between destination
and potential visitors, and evoke a “sense of a destination” leading to executive decision of
selecting that particular destination.
In order to achieve high level of overall destination competitiveness by the implementing a
branding strategy, destination should go through all phases of the destination branding process.
Having in mind the high importance of the destination branding for the overall level of the
destination competitiveness, it is clear that destination branding process should be integrated in
to the existing models of destination competitiveness, primarily into the Integrated Model of
Destination Competitiveness (Dwyer and Kim, 2003) and the Conceptual model of destination
competitiveness (Ritchie and Crouch, 2003), two widely accepted and most frequently cited
models of tourism destination competitiveness. This aspect is important within the context of
the scientific contribution of this dissertation since one of its focal points is to provide an
empirical evidence that supports the integration of branding process, with two previously
mentioned models of destination competitiveness. This theoretical advancement could
represent an important step forward in developing a more comprehensive, sophisticated and
efficient model of destination competitiveness.
The expected managerial contribution of the dissertation stems from the fact that the research
results should be useful to destination management experts when making long term, strategic
decisions related to tourism destination development. The improved model of destination
competitiveness should help them to stay focused on those elements of destination branding
process that could enable them to remain competitive in the market. Additionally, survey
instrument developed for the exploratory research of this dissertation could be useful
managerial tool for any destination in checking whether all elements of destination branding
process have been correctly identified, discussed and implemented.
Chapter 6: Conclusion
101
6.3 Methodological limitations and recommendations for the further research
As an exploratory study in the field of tourism destination branding, the research conducted for
this dissertation had some inherent limitations that must be addressed. First, the sample
regarding tourism demand cannot be considered as up-to-date (the last TOMAS Summer
Survey in Croatia was conducted in 2010) and thus can only be approximately used for the
research in present times. Having in mind that TOMAS Summer Survey is rather complex
survey that requires extensive financial, temporal and human resources, this limitation could be
properly addressed within the scope of this dissertation. Secondly, even though the sample of
surveyed DMOs is rather large (39 out of 85), obtained results can be considered as insufficient
to be generalized beyond the sample size, especially when applied on tourism destinations out
of Croatia’s seaside region. A third limitation of this research is in its focus on a single-country
case study, which seems to be a common limitation for the majority of doctoral theses in this
field of research, especially due to the previously mentioned scarce resources. In spite of the
fact that research has been conducted only for Croatia, it must be noted that Croatia: (i) has over
a century and a half long tradition in tourism development; (ii) has well developed and
organized system of DMOs; (iii) has developed a reliable and internationally comparable
tourism statistics; and (iv) according to the UNWTO, participates with notable shares of 1% in
global and 2% in European number of total tourist arrivals, which all indicate the accuracy of
the country selected for case study. Although data used in this research have some limitations,
they can be considered reliable for theoretical advancements in measuring tourism destination
competitiveness and hypotheses testing towards drawing final conclusions. Finally, forth
limitation of this research are selected elements of tourist satisfaction. They are based on twelve
elements of tourism offer (TOMAS Summer Survey, 2010) on which satisfaction and
importance of these elements for visiting destination, were measured.
The empirical research related to linking concepts of destination branding with tourism
destination competitiveness, which was the focal point in this dissertation, has revealed an
emerging multidimensional structure of tourism destination competitiveness matrix. On the
other hand, tourism destination branding has been widely recognized and accepted as one of
the key aspects of keeping tourism destination competitive on the market. For that reason, it is
not surprising that tourism destination competitiveness and destination branding have become
increasingly important research areas for both scientists and professionals who strive to find the
most efficient model of tourism destination planning and management. Therefore, there are
some recommendations for the future research in this particular area. In order to improve the
result’s external validity, further research should test hypotheses, assessments and conclusions
from this research on larger and more diversified samples, which should include other regions
and countries. On account of interpreted empirical evidence provided in this dissertation on

Chapter 6: Conclusion
102
positive relationship between destination branding and destination competitiveness, future
research should discover other key elements and aspects that will strengthen the position of
destination branding concept in the body of knowledge related to modeling tourism destination
competitiveness.
Bibliography
103
BIBLIOGRAPHY
Ahmed, Z. (1991). The influence of the components of a state’s tourist image on product
positioning strategy. Tourism Management, 12(4), 331-340.
Ahmed, Z., and Krohn, F. B. (1990). Reversing the United States declining competitiveness in
the marketing of international tourism: A perspective of future policy. Journal of Travel
Research, 29(2), 23-29.
American Marketing Association – AMA (2014). Online dictionary. Retrieved from
https://www.ama.org/resources/Pages/Dictionary.aspx?dLetter=B, 1/2014.
Andriotis, K., Agiomirgianakis, G., and Mihiotis, Α. (2008). Measuring tourist satisfaction: A
factor-cluster segmentation approach. Journal of Vacation Marketing, 14(3), 221-235.
Anholt, S. (2007). Competitive Identity, The New Brand Management for Nations, Cities and
Regions. New York: Palgrave Macmillan.
Anholt, S. (2008). Place branding: is it marketing, or it isn’t it? Place Branding and Public
Diplomacy, 4(1), 1-6.
Armenski, T., Gomezelj, D. O., Djurdjev, B., Ćurčić, N., and Dragin, A. (2012). Tourism
destination competitiveness - between two flags. Economic research, 25(2), 485-502.
Balmer, J. M. (2001). Corporate identity, corporate branding and corporate marketing: Seeing
through the fog. European Journal of Marketing (35), 248-291.
Baloglu, S. (1997). The relationship between destination images and sociodemographic and trip
characteristics of international travelers. Journal of Vacation Marketing 3(3), 221-233.
Baloglu, S., and Mangaloglu, M. (2001). Tourism destination images of Turkey, Egypt, Greece,
and Italy as perceived by US-based tour operators and travel agents. Tourism
Management, 22, 1-9.
Bartoluci, M. (2013). Upravljanje razvojem turizma i poduzetništva. Zagreb: Školska knjiga.
Beerli, A., and Martin, J. D. (2004). Factors influencing destination image. Annals of Tourism
Research, 31(3), 657-681.
Belch, G. E., and Belch, M. A. (2007). Advertising and Promotion - An Integrated Marketing
and Communications Perspective. New York: The McGraw-Hill Companies.
Blain, C., Levy, S., and Ritchie, J. B. (2005). Destination branding: Insights and practices from
destination management organizations. Journal of Travel Research, 43(4), 328-338.
Bibliography
104
Boltho, A. (1996). The assessment: International competitiveness. Oxford Review of
Economics Policy, 12(3), 1-16.
Boo, S., Busser, J., and Baloglu, S. (2009). A model of customer-based brand equity and its
application to multiple destinations. Tourism Management, 30(2), 219-231.
Boranić-Živoder, S., Tomljenović, R., and Čorak, S. (2011). Suradnja interesnih skupina u
turističkim destinacijama. In S. Čorak ed., Izazovi upravljanja turizmom, 15-32. Zagreb:
Institut za turizam.
Bordas, E. (1994). Competitiveness of tourist destination in long distance markets. Tourism
Review, 49(3), 3-9.
Bowen, J., and Ford, R. (2004). What experts say about managing hospitality service delivery
systems. International Journal of Contemporary Hospitality Management, 16(7), 394-
401.
Buhalis, D. (2000). Marketing the competitive destination of the future. Tourism Management,
21(1), 97-116.
Bursac, Z., Gauss, C. H., Williams, D. K., and Hosmer D. W. (2008). Purposeful selection of
variables in logistic regression. Source Code for Biology and Medicine, doi:
10.1186/1751-0473-3-17.
Cai, L. A. (2002). Cooperative branding for rural destinations. Annals of Tourism Research,
29(3), 720-742.
Cho, D., Moon, H., and Kim, M. (2008). Characterizing international competitiveness in
international business research: A MASI approach to national competitiveness. Research
in International Business and Finance, 22, 175-192.
Chon, K. (1989). Understanding recreational travelers’ motivation, attitude and satisfaction.
The Tourist Review, 44(1), 3–7.
Cracolici, M. F., Nijkamp, P., and Rietveld, P. (2008). Assessment of tourism competitiveness
by analysing destination efficiency. Tourism Economics, 14(2), 325-342.
Croatian Competition Agency – CCA (2014). Retrieved from http://www.aztn.hr/.
Croatian National Tourism Board – CNTB (2008). Marketing plan for 2008. Retrieved from
http://business.croatia.hr/Documents, 2/2014.
Croatian National Tourism Board – CNTB (2014a). Strategic marketing plan for Croatian
tourism 2014-2020. Retrieved from http://business.croatia.hr/Documents, 2/2014.
Croatian National Tourism Board – CNTB (2014b). Internal notes.
Cohen, J. (1988). Statistical Power Analysis for the Behavioral Sciences. New Jersey: Lawrence
Erlbaum Associates Inc.
Bibliography
105
Cooper, C., Fletcher, J., Fyall, A., Gilbert, D., and Wanhill, S. (2008). Tourism: Principles and
Practice 43rd edition. London: Saffron House.
Crewson, P. (2006). Applied Statistics Handbook. AcaStat Software.
Croatian Bureau of Statistics – CBS (2013). Statistical Yearbook of the Republic of Croatia.
Retrieved from http://www.dzs.hr/default_e.htm, 2/2014.
Croatian National Bank – CNB (2014). Bulletin. Retrieved from
http://www.hnb.hr/publikac/hpublikac.htm, 2/2014.
Crouch, G. I. (2011). Destination competitiveness: An analysis of determinant attributes.
Journal of Travel Research, 50(1), 27-45.
Crouch, G. I., and Ritchie, J. B. (1999). Tourism, competitiveness, and societal prosperity.
Journal of Business Research, 44(3), 137-152.
Crouch, G. I., and Ritchie, J. B. (2004). Application of the audit concept for destination
diagnosis. In S. Weber, and R. Tomljenović, Reinventing a Tourism Destination eds., 7-
25. Zagreb: Institute for Tourism.
Čavlek, N., Bartoluci, M., Prebežac, D., and Kesar, O. (2011). Turizam – ekonomske osnove i
organizacijski sustav. Zagreb: Školska knjiga.
Čižmar, S., and Weber, S. (2000). Marketing effectiveness of the hotel industry in Croatia.
International Journal of Hospitality Management, 19(3), 227-240.
Čomić, Đ. (1988). Koncept polarizovane turističke regije i ventralnog turističkog mesta.
Turizam: međunarodni znanstveno-stručni časopis, 36(5), 119-125.
Čorak, S. (2006). The Modification of the Tourism Area Life Cycle for (Re)inventing a
Destination: The Case of the Opatija Riviera, Croatia. In R. W. Butler, The Tourism Area
Life Cycle Vol.1: Applications and Modifications, 271-286. Clevedon: Channel View
Publications.
Dimanche, F., and Moody, M. (1998). Perceptions of destination image: A study of Latin
American intermediary travel buyers. Tourism Analysis, 3(3-4), 173-180.
Dmitrović, T., and Žabkar, V. (2010). Assessing tourism supply quality using formative
indicators: implications for destination management. Tourism Economics, 16(2), 405-
425.
Dragičević, M. (2012). Konkurentnost – Projekt za Hrvatsku. Zagreb: Školska knjiga.
Dragičević, V., Jovičić, D., Blešić, I., Stankov, U., and Bošković, D. (2012). Business tourism
destination competitiveness: A case of Vojvodina province (Serbia). Economic Research,
25(2), 311-332.
Dulčić, A. (2001). Upravljanje razvojem turizma. Zagreb: Mate d.o.o.
Bibliography
106
Dwyer, L., and Kim, C. (2003). Destination competitiveness: Determinants and indicators.
Current Issues in Tourism, 6(5), 369-414.
Dwyer, L., Forsyth, P., and Rao, P. (1999). Tourism price competitiveness and journey purpose.
Tourism - An International Interdisciplinary Journal, 47(4), 283-299.
Dwyer, L., Knežević Cvelbar, L. Edwards, D., and Mihalič, T. (2012). Fashioning a destination
tourism future: The case of Slovenia. Tourism Management, 33(2), 305-316.
Dwyer, L., Knežević Cvelbar, L. Koman, M., and Mihalič, T. (2013). An Empirical Test of the
Integrated Model of Destination Competitiveness. Proceedings of the International
Association for Tourism Economics (IATE) 2013, Ljubljana, 1st-4th July, 2013, 204-222.
Faculty of Economics: University of Ljubljana.
Dwyer, L., Dragičević, V., Armenski, T., Mihalič, T., and Knežević Cvelbar, L. (2014).
Achieving destination competitiveness: an importance–performance analysis of Serbia.
Current Issues in Tourism, doi: 10.1080/13683500.2014.944487, 1-28.
Ekinci, Y., (2003). From destination image to destination branding: An emerging area of
research. E-Review of Tourism Research, 1(2), 21-24.
Elliot, S., Papadopoulos, N., and Kim, S. S. (2011). An integrative model of place image
exploring relationships between destination, product, and country images. Journal of
Travel Research, 50(5), 520-534.
Enright, M. J., and Newton, J. (2004). Tourism destination competitiveness: a quantitative
approach. Tourism Management, 25(6), 777-788.
ETC/UNWTO (2009). Handbook on Tourism Destination Branding. Madrid: UNWTO.
Federal Ministry of Tourism and Environment (2014). Internal note.
Fill, C. (2006). Simply Marketing Communications. Edinburgh Gate: Pearson Education
Limited.
Garcia, J. A., Gomez, M., and Molina, A. (2012). A destination-branding model: An empirical
analysis based on stakeholders. Tourism Management, 33(3), 646-661.
Garelli, S. (2006). Top Class Competitors: How Nations, Firms and Individuals Succeed in the
New World of Competitiveness. New York: John Wiley and Sons Ltd.
Gatti, P. (2013). Tourism, welfare and income distribution: the case of Croatia. Tourism - An
international interdisciplinary journal, 61(1), 53-71.
Go, F. M., and Govers, R. (2000). Integrated quality management for tourist destinations: A
European perspective on achieving competitiveness. Tourism Management, 21(1), 79-88.
Goeldner, C. R., and Ritchie, J. B. (2003). Tourism: Principles, Practices, Philosophies. New
York: John Wiley and Sons.
Bibliography
107
Gooroochurn, N., and Sugiyarto, G. (2005). Competitiveness indicators in the travel and
tourism industry. Tourism economics, 11(1), 25-43.
Govers, R. (2011). From place marketing to place branding and back. Place Branding and
Public Diplomacy, 7(4), 227-231.
Govers, R., Go, F.M., and Kumar, K. (2007). Virtual destination image: A new measurement
approach. Annals of Tourism Research, 34(4), 977-997.
Green, S. (2005). Defining West London - A case study of the initial stages of a strategic place
branding exercise. CoDesign, 1(4), 227-287.
Gunn, C. A. (1972). Vacationscape: designing tourist regions. Austin: Bureau of Business
Research, University of Texas.
Harris, R., and Leiper, N. (1995). Sustainable Tourism: An Australian Perspective. Oxford:
Butterworth-Heinemann.
Heath, E. (2003). Towards a model to enhance destination competitiveness: A South African
perspective. Journal of Hospitality and Tourism Management, 10(2), 124-141.
Hitrec, T. (1995). Turistička destinacija – pojam, razvitak, koncept. Turizam (3-4), 43-51.
Holt, D. B. (2004). How Brands Become Icons. Boston: Harvard Business School Press.
Hosmer, D. W., and Lemeshow, S. (2000). Applied Logistic Regression. New York: John
Wiley and Sons Inc.
Huggins, R. (2000). An index of competitiveness in the UK: Local, regional and global analysis.
In L. Lloyd-Reason, and S. Wall, eds. Dimension of Competitiveness: Issues and policies.
Cheltenham, UK: Edward Elgar Publishing Limited.
ICOLD (2003). World Register of Dams. Retrieved from http://www.icold-cigb.org, 12/2013.
IMD (2014). Fundamentals of Competitiveness. Retrieved from
http://www.imd.org/wcc/fundamentals-of-competitiveness/#tab=2, 2/2014.
Institute for Tourism (2011). Internal notes.
IPK International (2013). ITB World Travel Trends Report 2013/2014. München: IPK
International.
Israeli, A. A., Barkan, R., and Fleishman, M. (2006). An exploratory approach to evaluating
performance measures: The managers perspective. The Services Industries Journal, 26(8),
861-872.
Jafari, J. (2000). Encyclopedia of Tourism. London: Routledge.
Jovičić, Ž., Jovičić, D., and Ivanović, V. (2005). Osnove turizma - Integralno fenomenološki
pristup. Beograd: Turistička štampa.
Bibliography
108
Konecnik, M., and Gartner, W. C. (2007). Customer-based Brand Equity for a Destination.
Annals of Tourism Research, 34(2), 400-421.
Konecnik, M. and Go, F. (2008). Tourism Destination Brand Identity: The Case of Slovenia.
Journal of Brand Management, 15(3), 177-189.
Kotler, P. (2004). Where is place branding heading? Place branding, 1(1), 12-35.
Kotler, P., Bowen, J. T., and Makens, J. C. (2006a). Marketing for Hospitality and Tourism.
New Jersey: Pearson Education.
Kotler, P., Wong, V., Saunders, J., and Armstrong, G. (2006b). Osnove marketinga. Zagreb:
MATE d.o.o.
Kotler, P., and Keller, K. (2012). Marketing Management (14th Edition). Prentice Hall: New
Jersey.
Kotler, P., and Keller, K. L. (2009). Upravljanje marketingom. Zagreb: MATE d.o.o.
Kotler, P., and Lee, N. (2007). Marketing u javnom sektoru. Zagreb: MATE d.o.o.
Kotler, P., Haider, D. H., and Rein, I. (1993). Marketing Places: Attracting Investment,
Industry, and Tourism to Cities, States, and Nations. New York: The Free Press.
Kozak, M., and Rimmington, M. (1999). Measuring tourist destination competitiveness:
conceptual considerations and empirical findings. International Journal of Hospitality
Management, 18(3), 273-283.
Kozak, M. (2002). Destination benchmarking. Annals of Tourism Research, 29(2), 497-519.
Kranjčević, J. (2012). Bosna i Hercegovina na Jadranskoj izložbi u Beču 1913. Treći kongres
geografa Bosne i Hercegovine. Sarajevo: Geografsko društvo u Federaciji Bosne i
Hercegovine.
Krešić, D., and Prebežac, D. (2011). Index of destination attractiveness as a tool for destination
attractiveness assessment. Tourism - n International Interdisciplinary Journal, 59(4), 497-
517.
Krešić, D., Mikulić, J., and Miličević, K. (2013). The factor structure of tourist satisfaction at
pilgrimage destination: The case of Medjugorje. International Journal of Tourism
Research, 15(5), 484-494.
Krešić, D. (2009). Mjerenje intenziteta destinacijske atraktivnosti u turizmu primjenom indeksa
destinacijske atraktivnosti (IDA), doktorska disertacija. Zagreb: Ekonomski fakultet.
Kunst, I. (2009). Ocjena konkurentnosti turističke destinacije - specifičnosti i ograničenja. Acta
Turistica, 21(2), 129-159.
Kušen, E. (2002). Turistička atrakcijska osnova. Zagreb: Institut za turizam.
Bibliography
109
Kušen, E. (2010). A system of tourism attractions. Tourism: An International Interdisciplinary
Journal, 58(4), 409-424.
Kušen, E. (2013). Personal note.
Lazer, W., and Layton, R. A. (1999). Contemporary Hospitality Marketing. Michigan:
American Hotel and Lodging Educational Institute.
Lee, J., and Back, K. (2010). Reexamination of attendee-based brand equity. Tourism
Management, 31(3), 395-401.
Li, D., and Liu, J. (2012). Dynamic capabilities, environmental dynamism and competitive
advantage: Evidence from China. Journal of Business Research, 67(1), 2793–2799.
Magaš, D., and Meler, M. (2013). Creation of networks vs. National tourism organization -
Croatian Experience. International Proceedings of Economic Development and Research,
59(27), 131-135.
Magzan, M., and Miličević, K. (2012). Integrirane marketinške komunikacije kao strategija za
održavanje tržišne dominacije i rasta profitabilnog poslovanja. In M. Martinović ed.,
Marketing u Hrvatskoj, 55 poslovnih slučajeva, 209-222. Zagreb: Mate d.o.o.
Man, T. W., Lau, T., and Chan, K. F. (2002). The competitiveness of small and medium
enterprises: A conceptualization with focus on entrepreneurial competencies. Journal of
Business Venturing, 17(2), 123-142.
Marković, S., and Marković, Z. (1972). Ekonomika turizma. Zagreb: Školska knjiga.
Martilla, J., and James, J. (1977). Importance-Performance Analysis. Journal of marketing,
41(1), 77-79.
Marušić, Z., Čorak , S., Sever, I., and Ivandić, N. (2011). Stavovi i potrošnja turista u Hrvatskoj
– TOMAS LJETO 2010. Zagreb: Institut za turizam.
Marzano, G., and Scott, N. (2009). Power in destination branding. Annals of Tourism Research,
36(2), 247-267.
Medlik, S. (2003). Dictionary of Travel, Tourism and Hospitality. Oxford: Butterworth-
Heinemann.
Merriam-Webster Online Dictionary. (28. 04 2014). Benchmark. Retrieved from Merriam-
Webster Online Dictionary: http://www.merriam-webster.com/dictionary/benchmark.
Merriam-Webster Online Dictionary. (20. 3 2014). Competition. Retrieved from Merriam-
Webster Online Dictionary: http://www.merriam-webster.com/dictionary/competition.
Michael, I., Miličević, K., and Krešić, D. (2014). Preparing for Tomorrow: Analyzing Tourism
Demand from GCC countries to Croatia. Proceedings of the International conference on
tourism milestones. Sharjah, UAE, 31.03.-02.04.2014.: Skyline University College.
Bibliography
110
Mihalič, T. (2000). Environmental management of a tourist destination: A factor of tourism
competitiveness. Tourism Management, 22(1), 65-78.
Mihalič, T. (2008). Ekonomski vidiki. Ljubljana: Ekonomska fakulteta, Univerza v Ljubljani.
Mikulić, J., and Prebežac, D. (2012). Accounting for dynamics in attribute-importance and for
competitor performance to enhance reliability of BPNN-based importance-performance
analysis. Expert Systems with Application, 39(5), 5144-5153.
Miličević, K., Skoko, B., and Krešić, D. (2012). The power of tourism in creating a national
brand: Case of Croatia. Proceedings of the 4th Destination and branding conference, 5.-
7. 12. 2012., Cardiff, UK. Cardiff: Welsh Centre for Tourism Research.
Morgan, N. J., and Pritchard, A. (2005). Promoting niche tourism destination brands: Case
studies of New Zealand and Wales. Journal of Promotion Management, 12(1), 17-33.
Morgan, N., and Pritchard, A. (1999). Building destinations brands. The case of Wales and
Australia. Journal of Brand Management, 7(2), 103-118.
Morgan, N., Pritchard, A., and Pride, R. (2004). Destination Branding: Creating the Unique
Destination Proposition. Oxford: Elsevier Butterworth-Heinemann.
Nebenzahl, I. (2004). Where is place branding heading? Place branding, 1(1), 12-35.
Official Gazete (2008). Zakon o turističkim zajednicama i promicanju hrvatskog turizam.
Retrieved from http://narodne-novine.nn.hr/clanci/sluzbeni/2008_12_152_4142.html.
Omerzel Gomezelj, D., and Mihalič, T. (2008). Destination competitiveness – Applying
different models, the case of Slovenia. Tourism Management, 29(2), 294-307.
Oppermann, M. (2000). Tourism destination loyalty. Journal of Travel Research, 39(1), 78-84.
Ozretić Došen, Đ., Vranešević, T., and Prebežac, D. (1998). The importance of branding in the
development of marketing strategy of Croatia as tourist destination. Acta Turistica, 10(2),
110-127.
Paliaga, M. (2007). Branding i konkurentnost gradova. Rovinj: Samostalna naklada.
Papadakis, M. (1994). Did (or does) the United States have a competitiveness crisis? Journal of
Policy Analysis and Management, 13(1), 1-20.
Papadopoulos, N. (2004). Place branding: Evolution, meaning and implications. Place
Branding, 1(1), 36-49.
Park, A., and Petric, J. F. (2006). Destinations’ perspectives of branding. Annals of Tourism
Research, 33(1), 262-265.
Parkerson, B., and Saunders, J. (2004). City branding: Can goods and services branding models
be used to brand cities? Place Branding, 1(3), 242-264.
Bibliography
111
Perdue, R. R. (2000). Destination images and consumer confidence in destination attribute
ratings. Tourism Analysis 2(5), 77-81.
Pike, S. (2009). Destination brand positions of a competitive set of near-home destinations.
Tourism Management, 30(6), 857-886.
Porter, M. (1990). The competitive advantage of nations. New York: The Free Press.
Prebensen, N. K. (2007). Exploring tourists’ images of a distant destination. Tourism
Management, 28(3), 747-756.
Qu, H., Kim, L., and Im, H. H. (2011). A model of destination branding: Integrating the
concepts of the branding and destination image. Tourism Management, 32(3), 465-476.
Rainisto, S. (2004). Opinion pieces: Where is place branding heading. Place Branding, 1(1),
12-35.
Ritchie, B. J., and Ritchie, R. J. (1998). The branding of tourism destinations: Past achievements
and future challenges. Proceedings of the 1998 annual AIEST congress: Destination
Marketing - Scopes and limitations (str. 89-116). Marrakech, Morocco: AIEST.
Ritchie, J. B., and Crouch, G. I. (2003). The Competitive Destination - A Sustainable Tourism
Perspective. Cambridge: CABI Publishing.
Saraniemi, S. (2009). Destination branding in a country context: a case study of Finland in
British market, doctoral dissertation. Joensuu: University of Joensuu.
Schultz, M., and Hatch, M. J. (2003). The cycles of corporate branding: The case of LEGO
Company. California Management Review, 469(1), 6-27.
Shih, T., and Fan, X. (2007). Response rates and mode preferences in web-mail mixed-mode
surveys: A meta-analysis. International Journal of Internet Science, 2(1), 59-82.
Skoko, B. (2010). Hrvatska i susjedi – kako Hrvatsku doživljavaju u Bosni i Hercegovini, Crnoj
Gori, Makedoniji, Sloveniji i Srbiji. Zagreb: AMG.
Stock, F. (2009). Identity, image and brand: A conceptual framework. Place Branding and
Public Diplomacy, 5(2), 118-125.
Šutalo, I., Ivandić, N., and Marušić, Z. (2011). Ukupan doprinos turizma gospodarstvu
Hrvatske: Input-output model i satelitski račun turizma. Ekonomski pregled, 62(5-6),
267-285.
Tasci, A. A., Gartner, W. C., and Cavusgil, S. T. (2007). Measurement of destination brand bias
using a quasi-experimental design. Tourism Management, 12(4), 1529-1540.
Tefertiller, K. R., and Ward, R. W. (1995). Revealed comparative production advantage:
Implications for competitiveness in Florida’s vegetable industry. Agribusiness, 11(2),
105-115.
Bibliography
112
Telišman Košuta, N. (2011). Brendiranje turističke destinacije. In S. Čorak, Izazovi upravljanja
turizmom, ed., 57-68. Zagreb: Institut za turizam.
Tsai, H., Song, H., and Wong, K. F. (2009). Tourism and hotel competitiveness research.
Journal of Travel and Tourism Marketing, 26(5-6), 552-546.
Tyrrell, T., and Okrant, J. (2004). Importance-performance analysis: Some recommendations
from an economic planning perspective. Tourism Analysis, 9(2), 63-76.
UNWTO (2007). A Practical Guide to Tourism Destination Management. Madrid: World
Tourism Organization.
Uysal, M., Chen, J., and Williams, D. (2000). Increasing state market share through a regional
positioning. Tourism Management, 21(1), 89-96.
Vengesayi, S. (2003). A Conceptual Model of Tourism Destination Competitiveness and
Attractiveness. Proceedings of the ANZMAC 2003 Conference, (str. 637-647). Adelaide.
Vranešević, T. (2007). Upravljanje markama. Zagreb: Accent.
Vrdoljak Raguž, I., Jelenc, L., and Podrug, N. (2013). Izvori konkurentske prednosti u 21.
stoljeću. Dubrovnik: Odjel za ekonomiju i poslovnu ekonomiju, Sveučilište u
Dubrovniku.
Vukonić, B. (1995). Smisao i objašnjenje pojma turistička destinacija. Turizam: znanstveno-
stručni časopis, 43(3-4), 66-71.
Vukonić, B., and Čavlek, N. (2001). Rječnik turizma. Zagreb: Masmedia.
Weber, S., and Mikačić, V. (2004). Osnove turizma. Zagreb: Školska knjiga.
Williams, A. M., and Hall, M. (2000). Tourism and migration: New relationships between
production and consumption. Tourism Geographies: An International Journal of Tourism
Space, Place and Environment, 2(1), 5-27.
World Economic Forum – WEF (2013). The Global Competitiveness Report 2013-14. Geneva:
World Economic Forum.
World Travel and Tourism Council – WTTC (2013). Travel and Tourism Economic Impact
2013 - World. London: WTTC.
Zenker, S., and Braun, E. (2010). The place brand center – A conceptual approach for place
branding and place brand management. Proceedings of the 39th European Marketing
Academy Conference, 1st-4th June. Copenhagen, Denmark.
Zenker, S., and Martin, N. (2011). Measuring success in place marketing and branding. Place
Branding and Public Diplomacy, 7(1), 32-41.

Bibliography
113
Zoroja, J. (2013). Utjecaj informacijsko-komunikacijskih tehnologija na konkurentnost zemalja
Europske Unije, doktorska disertacija. Zagreb: Ekonomski fakultet.
Žabkar, V., Makovec Brenčić, M., and Dmitrović, T. (2010). Modelling perceived quality,
visitor satisfaction and behavioural intensions at the destination level. Tourism
Management, 31(2010), 537-546.


APPENDICES

i
LIST OF APPENDICES
Appendix A: Questionnaire - The influence of branding on the tourism destination
competitiveness…………………..…………………………………………...1
Appendix B: Ranking the elements of destination supply by importance and derivation of DiPs
index by destination……………………………………………………………...5
Appendix C: Summary in Slovenian language/Daljši Povzetek disertacije v slovenskem
jeziku.........................................................................................................................................25

1
Appendix A: Questionnaire - The influence of branding on the tourism destination
competitiveness
Dear Sir/Madam,
I would kindly ask you to take 5-7 minutes of your time and fill out the questionnaire about
tourism destination branding. The answers will be used solely for the purpose of doctoral
dissertation research, which investigates the influence of branding on tourism destination
competitiveness. If you have any questions or unclarities regarding the survey, please send an
e-mail on the following address: [email protected].
Thank you for your help and cooperation!
Katarina Miličević, MBA
Expert Associate
Institute for Tourism
www.iztzg.hr
*Remark: Tourism destination branding can be defined as the process which is aimed at achieving a desired image
of tourism destination in the minds of potential tourists. Destination branding process includes: definition of target
markets, analysis of competitors, SWOT analysis, definition of tourism destination development vision, definition
of destination brand, i.e. what the brand should represent, integration of brand in all tourism development activities
and communicating the brand towards consumers (tourists) as well as towards the tourism development
stakeholders.
Please enter your tourist board name:
1. Does your destination have tourism development plan, marketing plan or plan of promotional
activities? (Check the appropriate answer)
1. Yes, we do have the specified planning documents.
2. No, we do not have any of the specified planning documents. (Go to question 5)
2. Please mark all of the planning documents that exist for your destination. (Multiple choice
possible)
1. Tourism development plan
2. Marketing plan
3. Plan of promotional activities
4. Other:
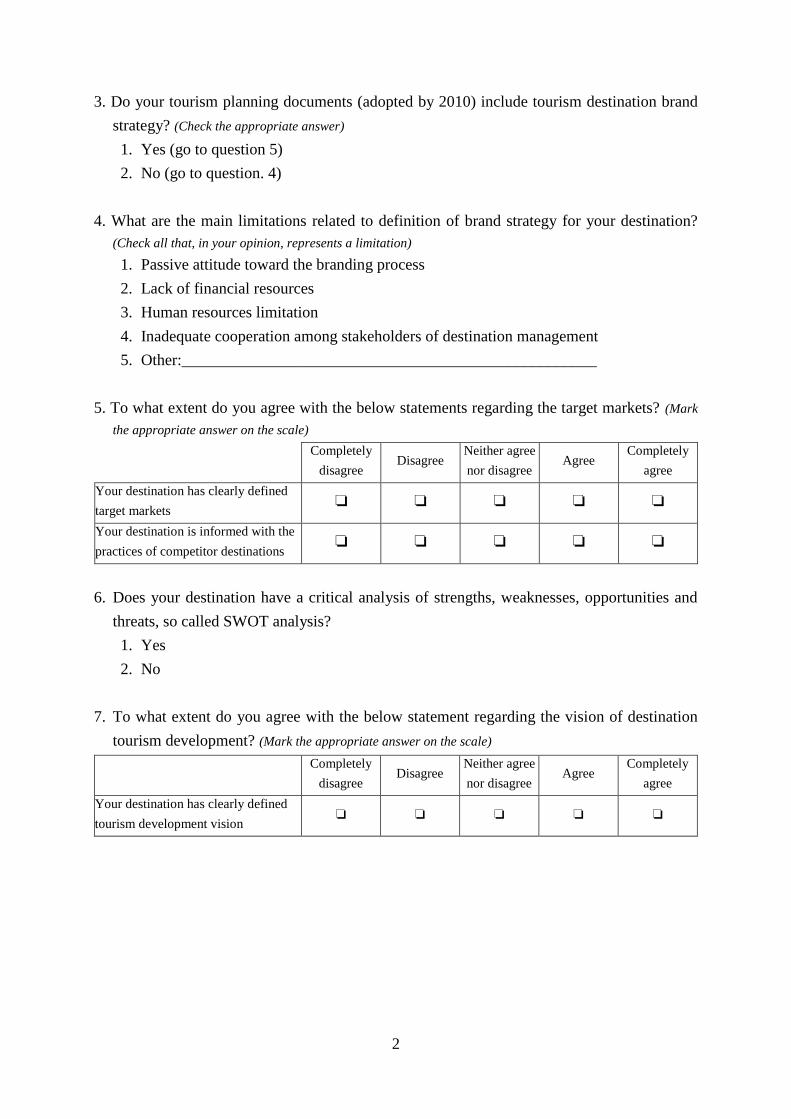
2
3. Do your tourism planning documents (adopted by 2010) include tourism destination brand
strategy? (Check the appropriate answer)
1. Yes (go to question 5)
2. No (go to question. 4)
4. What are the main limitations related to definition of brand strategy for your destination?
(Check all that, in your opinion, represents a limitation)
1. Passive attitude toward the branding process
2. Lack of financial resources
3. Human resources limitation
4. Inadequate cooperation among stakeholders of destination management
5. Other:____________________________________________________
5. To what extent do you agree with the below statements regarding the target markets? (Mark
the appropriate answer on the scale)
Completely
disagree Disagree
Neither agree
nor disagree Agree
Completely
agree
Your destination has clearly defined
target markets ❏ ❏ ❏ ❏ ❏
Your destination is informed with the
practices of competitor destinations ❏ ❏ ❏ ❏ ❏
6. Does your destination have a critical analysis of strengths, weaknesses, opportunities and
threats, so called SWOT analysis?
1. Yes
2. No
7. To what extent do you agree with the below statement regarding the vision of destination
tourism development? (Mark the appropriate answer on the scale)
Completely
disagree Disagree
Neither agree
nor disagree Agree
Completely
agree
Your destination has clearly defined
tourism development vision ❏ ❏ ❏ ❏ ❏
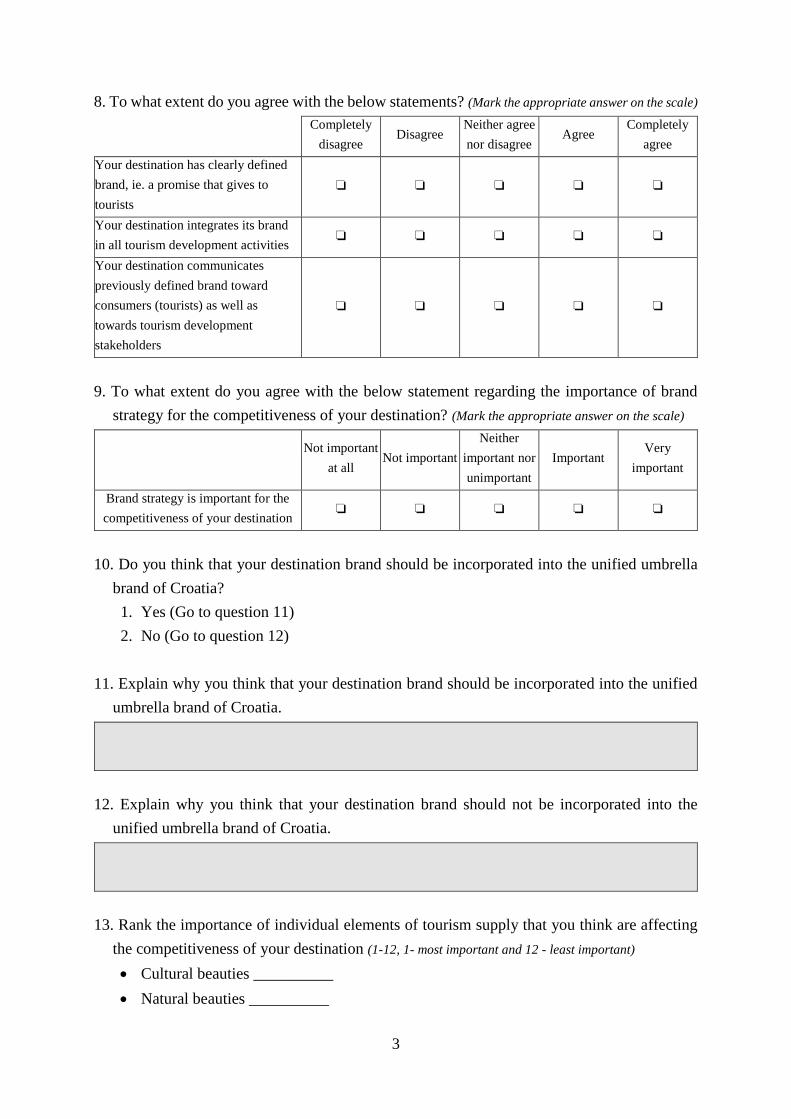
3
8. To what extent do you agree with the below statements? (Mark the appropriate answer on the scale)
Completely
disagree Disagree
Neither agree
nor disagree Agree
Completely
agree
Your destination has clearly defined
brand, ie. a promise that gives to
tourists
❏ ❏ ❏ ❏ ❏
Your destination integrates its brand
in all tourism development activities ❏ ❏ ❏ ❏ ❏
Your destination communicates
previously defined brand toward
consumers (tourists) as well as
towards tourism development
stakeholders
❏ ❏ ❏ ❏ ❏
9. To what extent do you agree with the below statement regarding the importance of brand
strategy for the competitiveness of your destination? (Mark the appropriate answer on the scale)
Not important
at all Not important
Neither
important nor
unimportant
Important Very
important
Brand strategy is important for the
competitiveness of your destination ❏ ❏ ❏ ❏ ❏
10. Do you think that your destination brand should be incorporated into the unified umbrella
brand of Croatia?
1. Yes (Go to question 11)
2. No (Go to question 12)
11. Explain why you think that your destination brand should be incorporated into the unified
umbrella brand of Croatia.
12. Explain why you think that your destination brand should not be incorporated into the
unified umbrella brand of Croatia.
13. Rank the importance of individual elements of tourism supply that you think are affecting
the competitiveness of your destination (1-12, 1- most important and 12 - least important)
Cultural beauties __________
Natural beauties __________
4
Picturesqueness__________
Variety of entertainment opportunities__________
Quality of accommodation__________
Quality of gastronomic offer__________
Wealth of sport activities__________
Value for money__________
Personal safety__________
Hospitality of local residents__________
Accessibility of destination__________
Shopping opportunities__________
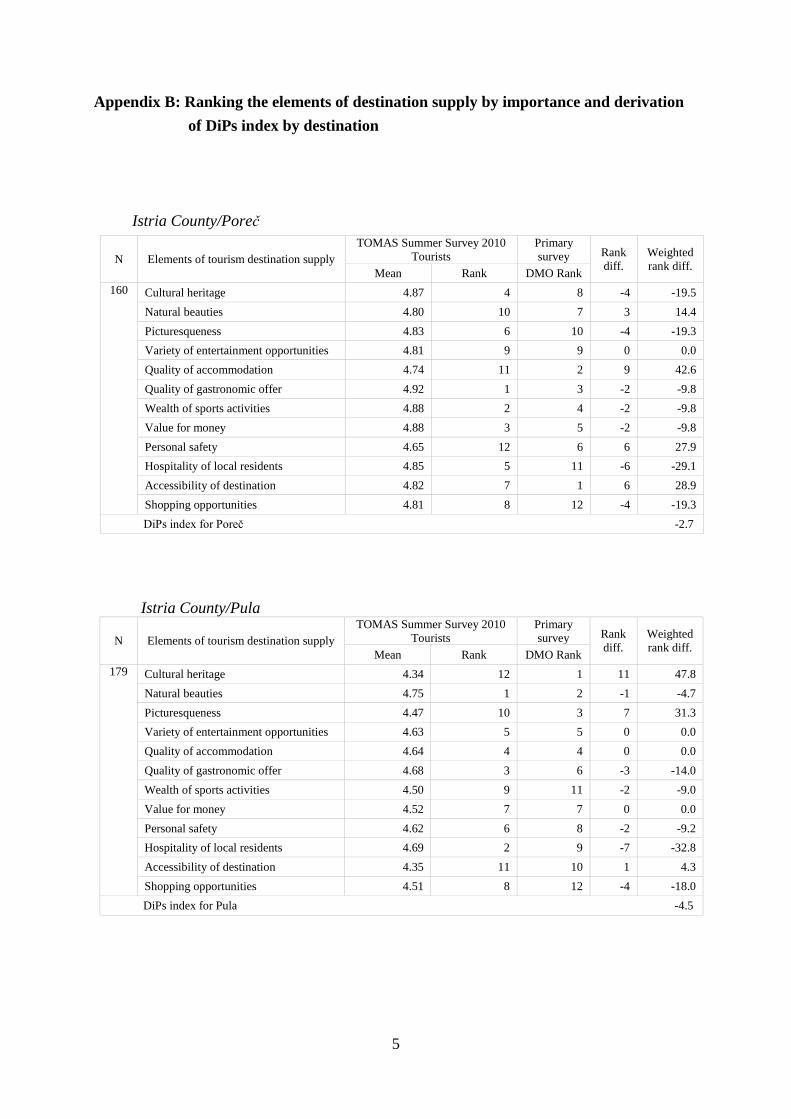
5
Appendix B: Ranking the elements of destination supply by importance and derivation
of DiPs index by destination
Istria County/Poreč
N Elements of tourism destination supply TOMAS Summer Survey 2010
Tourists Primary
survey Rank
diff. Weighted
rank diff. Mean Rank DMO Rank
160 Cultural heritage 4.87 4 8 -4 -19.5
Natural beauties 4.80 10 7 3 14.4
Picturesqueness 4.83 6 10 -4 -19.3
Variety of entertainment opportunities 4.81 9 9 0 0.0
Quality of accommodation 4.74 11 2 9 42.6
Quality of gastronomic offer 4.92 1 3 -2 -9.8
Wealth of sports activities 4.88 2 4 -2 -9.8
Value for money 4.88 3 5 -2 -9.8
Personal safety 4.65 12 6 6 27.9
Hospitality of local residents 4.85 5 11 -6 -29.1
Accessibility of destination 4.82 7 1 6 28.9
Shopping opportunities 4.81 8 12 -4 -19.3
DiPs index for Poreč -2.7
Istria County/Pula
N Elements of tourism destination supply TOMAS Summer Survey 2010
Tourists Primary
survey Rank
diff. Weighted
rank diff. Mean Rank DMO Rank
179 Cultural heritage 4.34 12 1 11 47.8
Natural beauties 4.75 1 2 -1 -4.7
Picturesqueness 4.47 10 3 7 31.3
Variety of entertainment opportunities 4.63 5 5 0 0.0
Quality of accommodation 4.64 4 4 0 0.0
Quality of gastronomic offer 4.68 3 6 -3 -14.0
Wealth of sports activities 4.50 9 11 -2 -9.0
Value for money 4.52 7 7 0 0.0
Personal safety 4.62 6 8 -2 -9.2
Hospitality of local residents 4.69 2 9 -7 -32.8
Accessibility of destination 4.35 11 10 1 4.3
Shopping opportunities 4.51 8 12 -4 -18.0
DiPs index for Pula -4.5
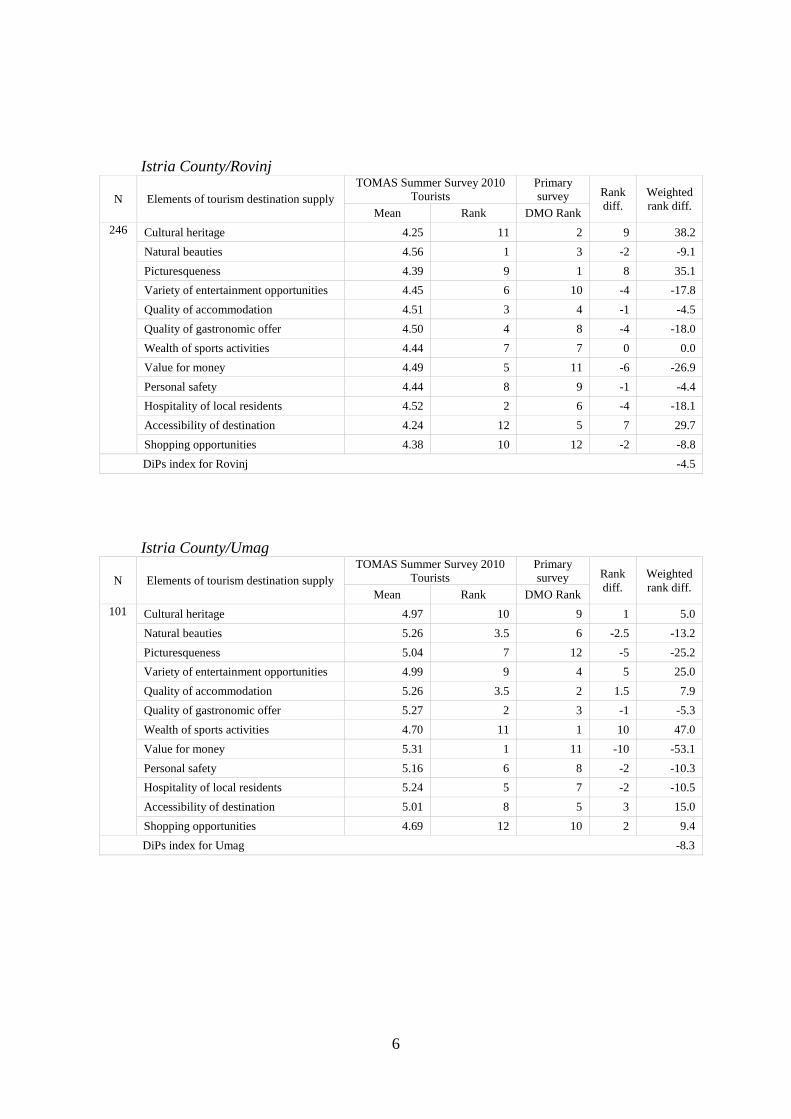
6
Istria County/Rovinj
N Elements of tourism destination supply TOMAS Summer Survey 2010
Tourists Primary
survey Rank
diff. Weighted
rank diff. Mean Rank DMO Rank
246 Cultural heritage 4.25 11 2 9 38.2
Natural beauties 4.56 1 3 -2 -9.1
Picturesqueness 4.39 9 1 8 35.1
Variety of entertainment opportunities 4.45 6 10 -4 -17.8
Quality of accommodation 4.51 3 4 -1 -4.5
Quality of gastronomic offer 4.50 4 8 -4 -18.0
Wealth of sports activities 4.44 7 7 0 0.0
Value for money 4.49 5 11 -6 -26.9
Personal safety 4.44 8 9 -1 -4.4
Hospitality of local residents 4.52 2 6 -4 -18.1
Accessibility of destination 4.24 12 5 7 29.7
Shopping opportunities 4.38 10 12 -2 -8.8
DiPs index for Rovinj -4.5
Istria County/Umag
N Elements of tourism destination supply TOMAS Summer Survey 2010
Tourists Primary
survey Rank
diff. Weighted
rank diff. Mean Rank DMO Rank
101 Cultural heritage 4.97 10 9 1 5.0
Natural beauties 5.26 3.5 6 -2.5 -13.2
Picturesqueness 5.04 7 12 -5 -25.2
Variety of entertainment opportunities 4.99 9 4 5 25.0
Quality of accommodation 5.26 3.5 2 1.5 7.9
Quality of gastronomic offer 5.27 2 3 -1 -5.3
Wealth of sports activities 4.70 11 1 10 47.0
Value for money 5.31 1 11 -10 -53.1
Personal safety 5.16 6 8 -2 -10.3
Hospitality of local residents 5.24 5 7 -2 -10.5
Accessibility of destination 5.01 8 5 3 15.0
Shopping opportunities 4.69 12 10 2 9.4
DiPs index for Umag -8.3
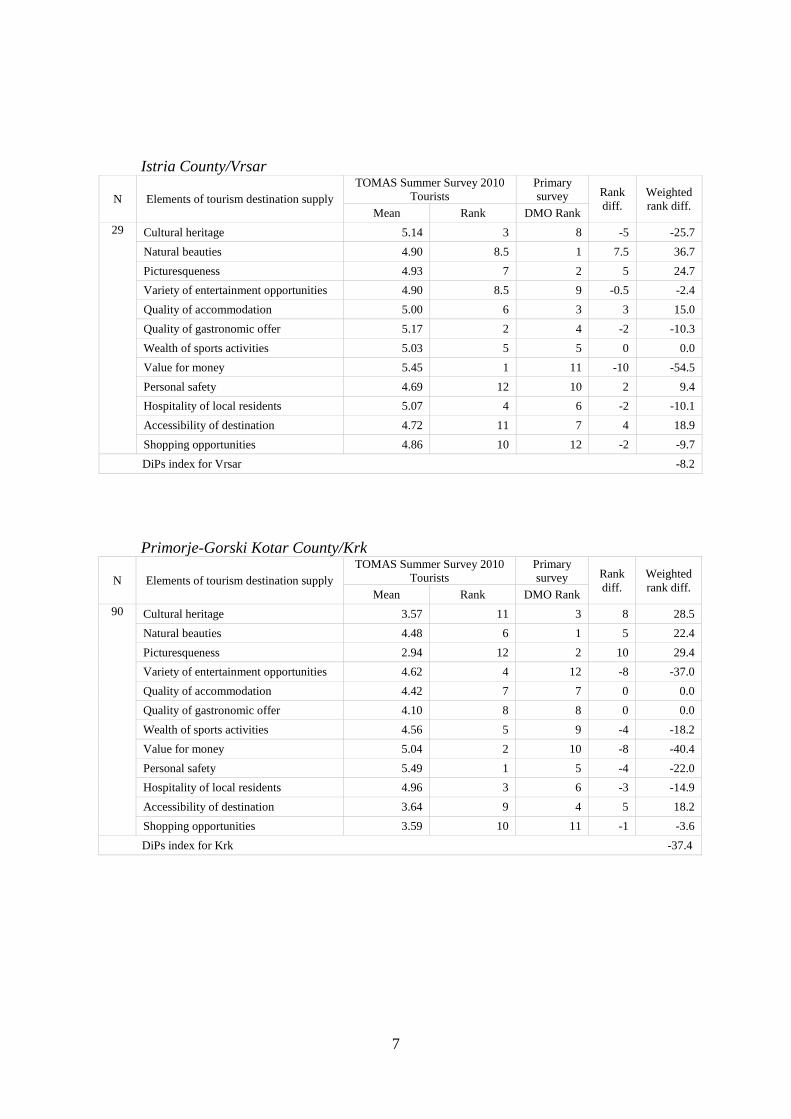
7
Istria County/Vrsar
N Elements of tourism destination supply TOMAS Summer Survey 2010
Tourists Primary
survey Rank
diff. Weighted
rank diff. Mean Rank DMO Rank
29 Cultural heritage 5.14 3 8 -5 -25.7
Natural beauties 4.90 8.5 1 7.5 36.7
Picturesqueness 4.93 7 2 5 24.7
Variety of entertainment opportunities 4.90 8.5 9 -0.5 -2.4
Quality of accommodation 5.00 6 3 3 15.0
Quality of gastronomic offer 5.17 2 4 -2 -10.3
Wealth of sports activities 5.03 5 5 0 0.0
Value for money 5.45 1 11 -10 -54.5
Personal safety 4.69 12 10 2 9.4
Hospitality of local residents 5.07 4 6 -2 -10.1
Accessibility of destination 4.72 11 7 4 18.9
Shopping opportunities 4.86 10 12 -2 -9.7
DiPs index for Vrsar -8.2
Primorje-Gorski Kotar County/Krk
N Elements of tourism destination supply TOMAS Summer Survey 2010
Tourists Primary
survey Rank
diff. Weighted
rank diff. Mean Rank DMO Rank
90 Cultural heritage 3.57 11 3 8 28.5
Natural beauties 4.48 6 1 5 22.4
Picturesqueness 2.94 12 2 10 29.4
Variety of entertainment opportunities 4.62 4 12 -8 -37.0
Quality of accommodation 4.42 7 7 0 0.0
Quality of gastronomic offer 4.10 8 8 0 0.0
Wealth of sports activities 4.56 5 9 -4 -18.2
Value for money 5.04 2 10 -8 -40.4
Personal safety 5.49 1 5 -4 -22.0
Hospitality of local residents 4.96 3 6 -3 -14.9
Accessibility of destination 3.64 9 4 5 18.2
Shopping opportunities 3.59 10 11 -1 -3.6
DiPs index for Krk -37.4
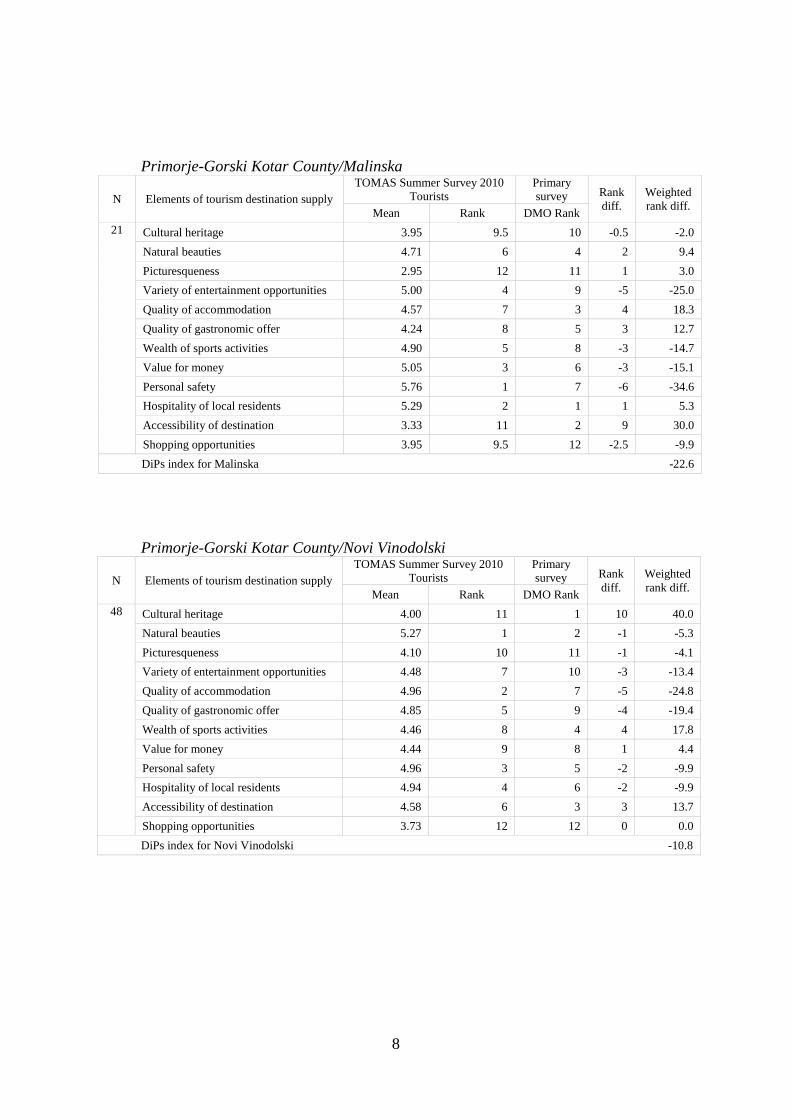
8
Primorje-Gorski Kotar County/Malinska
N Elements of tourism destination supply TOMAS Summer Survey 2010
Tourists Primary
survey Rank
diff. Weighted
rank diff. Mean Rank DMO Rank
21 Cultural heritage 3.95 9.5 10 -0.5 -2.0
Natural beauties 4.71 6 4 2 9.4
Picturesqueness 2.95 12 11 1 3.0
Variety of entertainment opportunities 5.00 4 9 -5 -25.0
Quality of accommodation 4.57 7 3 4 18.3
Quality of gastronomic offer 4.24 8 5 3 12.7
Wealth of sports activities 4.90 5 8 -3 -14.7
Value for money 5.05 3 6 -3 -15.1
Personal safety 5.76 1 7 -6 -34.6
Hospitality of local residents 5.29 2 1 1 5.3
Accessibility of destination 3.33 11 2 9 30.0
Shopping opportunities 3.95 9.5 12 -2.5 -9.9
DiPs index for Malinska -22.6
Primorje-Gorski Kotar County/Novi Vinodolski
N Elements of tourism destination supply TOMAS Summer Survey 2010
Tourists Primary
survey Rank
diff. Weighted
rank diff. Mean Rank DMO Rank
48 Cultural heritage 4.00 11 1 10 40.0
Natural beauties 5.27 1 2 -1 -5.3
Picturesqueness 4.10 10 11 -1 -4.1
Variety of entertainment opportunities 4.48 7 10 -3 -13.4
Quality of accommodation 4.96 2 7 -5 -24.8
Quality of gastronomic offer 4.85 5 9 -4 -19.4
Wealth of sports activities 4.46 8 4 4 17.8
Value for money 4.44 9 8 1 4.4
Personal safety 4.96 3 5 -2 -9.9
Hospitality of local residents 4.94 4 6 -2 -9.9
Accessibility of destination 4.58 6 3 3 13.7
Shopping opportunities 3.73 12 12 0 0.0
DiPs index for Novi Vinodolski -10.8
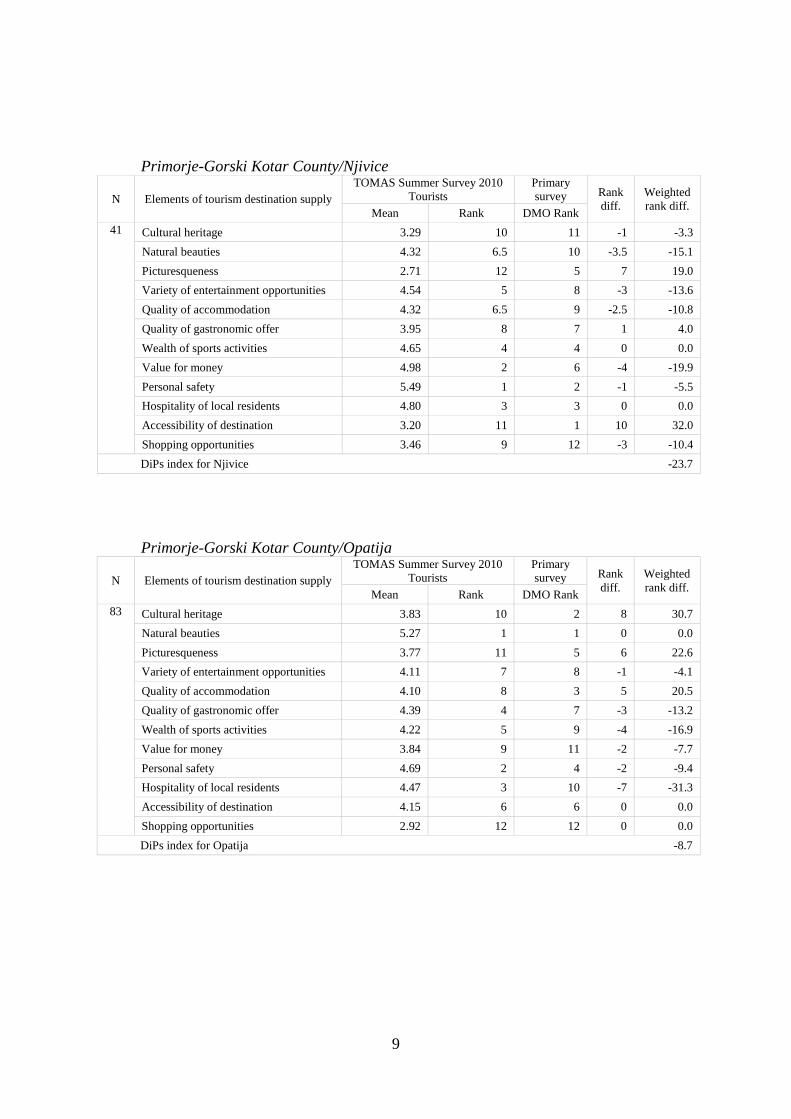
9
Primorje-Gorski Kotar County/Njivice
N Elements of tourism destination supply TOMAS Summer Survey 2010
Tourists Primary
survey Rank
diff. Weighted
rank diff. Mean Rank DMO Rank
41 Cultural heritage 3.29 10 11 -1 -3.3
Natural beauties 4.32 6.5 10 -3.5 -15.1
Picturesqueness 2.71 12 5 7 19.0
Variety of entertainment opportunities 4.54 5 8 -3 -13.6
Quality of accommodation 4.32 6.5 9 -2.5 -10.8
Quality of gastronomic offer 3.95 8 7 1 4.0
Wealth of sports activities 4.65 4 4 0 0.0
Value for money 4.98 2 6 -4 -19.9
Personal safety 5.49 1 2 -1 -5.5
Hospitality of local residents 4.80 3 3 0 0.0
Accessibility of destination 3.20 11 1 10 32.0
Shopping opportunities 3.46 9 12 -3 -10.4
DiPs index for Njivice -23.7
Primorje-Gorski Kotar County/Opatija
N Elements of tourism destination supply TOMAS Summer Survey 2010
Tourists Primary
survey Rank
diff. Weighted
rank diff. Mean Rank DMO Rank
83 Cultural heritage 3.83 10 2 8 30.7
Natural beauties 5.27 1 1 0 0.0
Picturesqueness 3.77 11 5 6 22.6
Variety of entertainment opportunities 4.11 7 8 -1 -4.1
Quality of accommodation 4.10 8 3 5 20.5
Quality of gastronomic offer 4.39 4 7 -3 -13.2
Wealth of sports activities 4.22 5 9 -4 -16.9
Value for money 3.84 9 11 -2 -7.7
Personal safety 4.69 2 4 -2 -9.4
Hospitality of local residents 4.47 3 10 -7 -31.3
Accessibility of destination 4.15 6 6 0 0.0
Shopping opportunities 2.92 12 12 0 0.0
DiPs index for Opatija -8.7
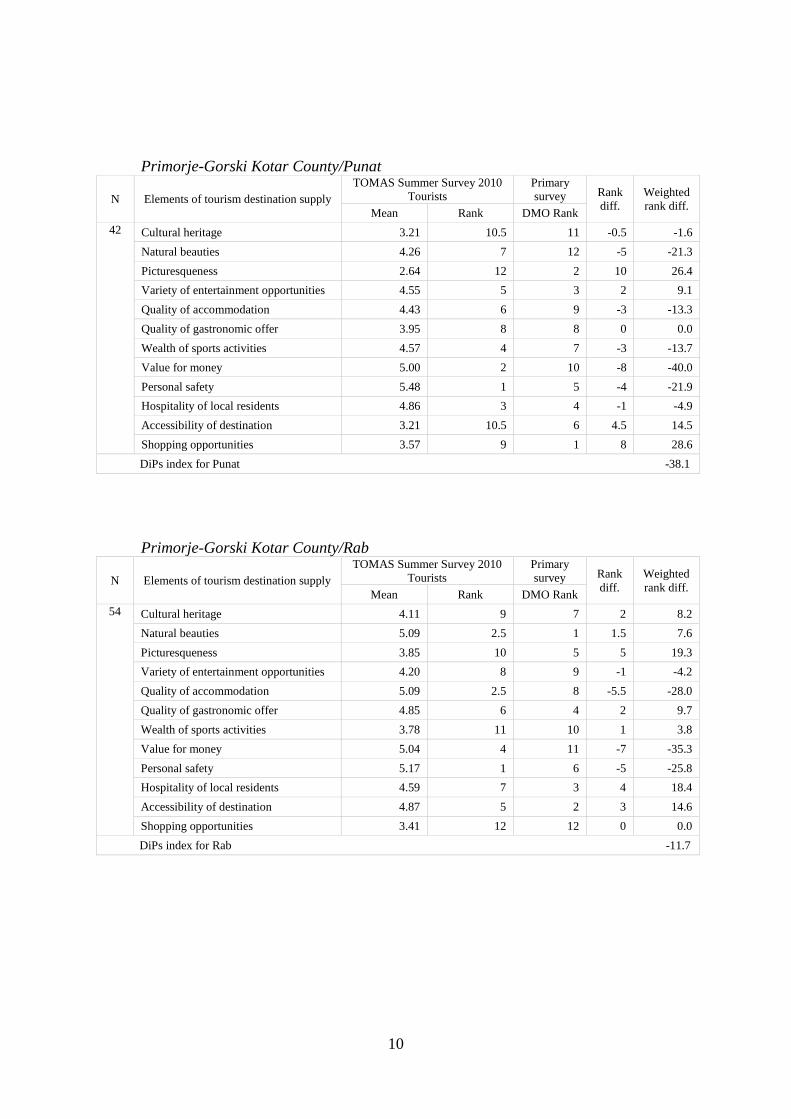
10
Primorje-Gorski Kotar County/Punat
N Elements of tourism destination supply TOMAS Summer Survey 2010
Tourists Primary
survey Rank
diff. Weighted
rank diff. Mean Rank DMO Rank
42 Cultural heritage 3.21 10.5 11 -0.5 -1.6
Natural beauties 4.26 7 12 -5 -21.3
Picturesqueness 2.64 12 2 10 26.4
Variety of entertainment opportunities 4.55 5 3 2 9.1
Quality of accommodation 4.43 6 9 -3 -13.3
Quality of gastronomic offer 3.95 8 8 0 0.0
Wealth of sports activities 4.57 4 7 -3 -13.7
Value for money 5.00 2 10 -8 -40.0
Personal safety 5.48 1 5 -4 -21.9
Hospitality of local residents 4.86 3 4 -1 -4.9
Accessibility of destination 3.21 10.5 6 4.5 14.5
Shopping opportunities 3.57 9 1 8 28.6
DiPs index for Punat -38.1
Primorje-Gorski Kotar County/Rab
N Elements of tourism destination supply TOMAS Summer Survey 2010
Tourists Primary
survey Rank
diff. Weighted
rank diff. Mean Rank DMO Rank
54 Cultural heritage 4.11 9 7 2 8.2
Natural beauties 5.09 2.5 1 1.5 7.6
Picturesqueness 3.85 10 5 5 19.3
Variety of entertainment opportunities 4.20 8 9 -1 -4.2
Quality of accommodation 5.09 2.5 8 -5.5 -28.0
Quality of gastronomic offer 4.85 6 4 2 9.7
Wealth of sports activities 3.78 11 10 1 3.8
Value for money 5.04 4 11 -7 -35.3
Personal safety 5.17 1 6 -5 -25.8
Hospitality of local residents 4.59 7 3 4 18.4
Accessibility of destination 4.87 5 2 3 14.6
Shopping opportunities 3.41 12 12 0 0.0
DiPs index for Rab -11.7
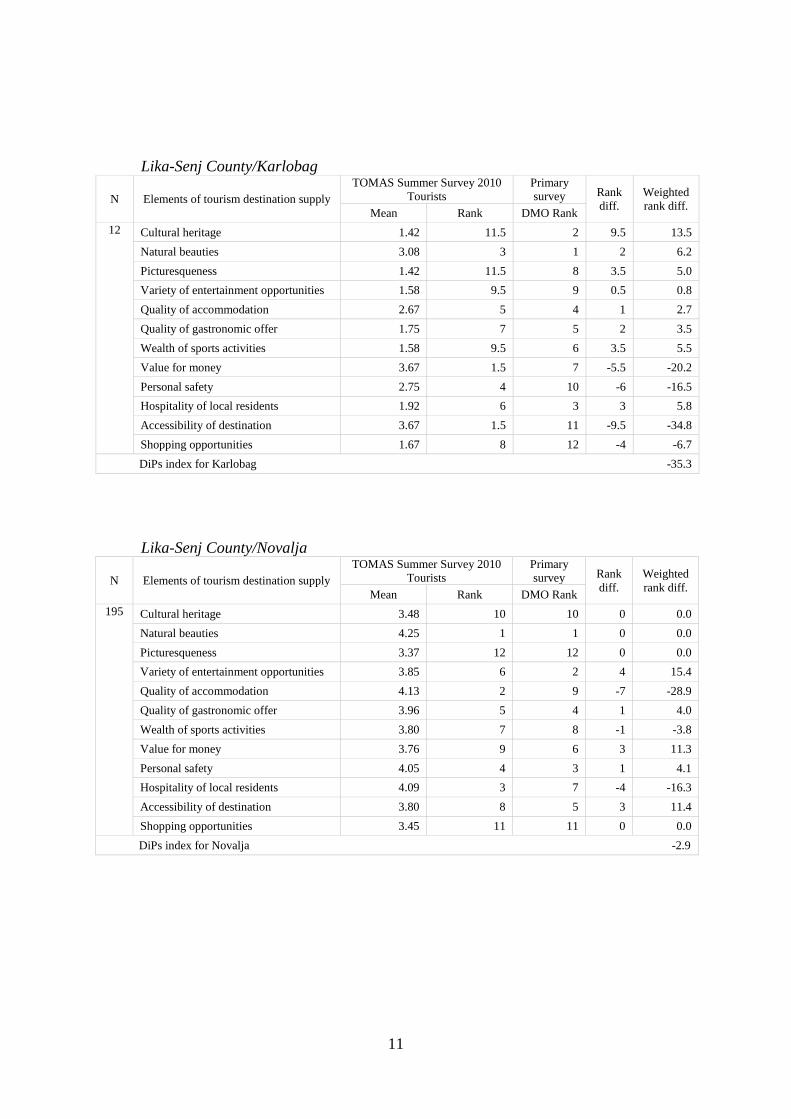
11
Lika-Senj County/Karlobag
N Elements of tourism destination supply TOMAS Summer Survey 2010
Tourists Primary
survey Rank
diff. Weighted
rank diff. Mean Rank DMO Rank
12 Cultural heritage 1.42 11.5 2 9.5 13.5
Natural beauties 3.08 3 1 2 6.2
Picturesqueness 1.42 11.5 8 3.5 5.0
Variety of entertainment opportunities 1.58 9.5 9 0.5 0.8
Quality of accommodation 2.67 5 4 1 2.7
Quality of gastronomic offer 1.75 7 5 2 3.5
Wealth of sports activities 1.58 9.5 6 3.5 5.5
Value for money 3.67 1.5 7 -5.5 -20.2
Personal safety 2.75 4 10 -6 -16.5
Hospitality of local residents 1.92 6 3 3 5.8
Accessibility of destination 3.67 1.5 11 -9.5 -34.8
Shopping opportunities 1.67 8 12 -4 -6.7
DiPs index for Karlobag -35.3
Lika-Senj County/Novalja
N Elements of tourism destination supply TOMAS Summer Survey 2010
Tourists Primary
survey Rank
diff. Weighted
rank diff. Mean Rank DMO Rank
195 Cultural heritage 3.48 10 10 0 0.0
Natural beauties 4.25 1 1 0 0.0
Picturesqueness 3.37 12 12 0 0.0
Variety of entertainment opportunities 3.85 6 2 4 15.4
Quality of accommodation 4.13 2 9 -7 -28.9
Quality of gastronomic offer 3.96 5 4 1 4.0
Wealth of sports activities 3.80 7 8 -1 -3.8
Value for money 3.76 9 6 3 11.3
Personal safety 4.05 4 3 1 4.1
Hospitality of local residents 4.09 3 7 -4 -16.3
Accessibility of destination 3.80 8 5 3 11.4
Shopping opportunities 3.45 11 11 0 0.0
DiPs index for Novalja -2.9
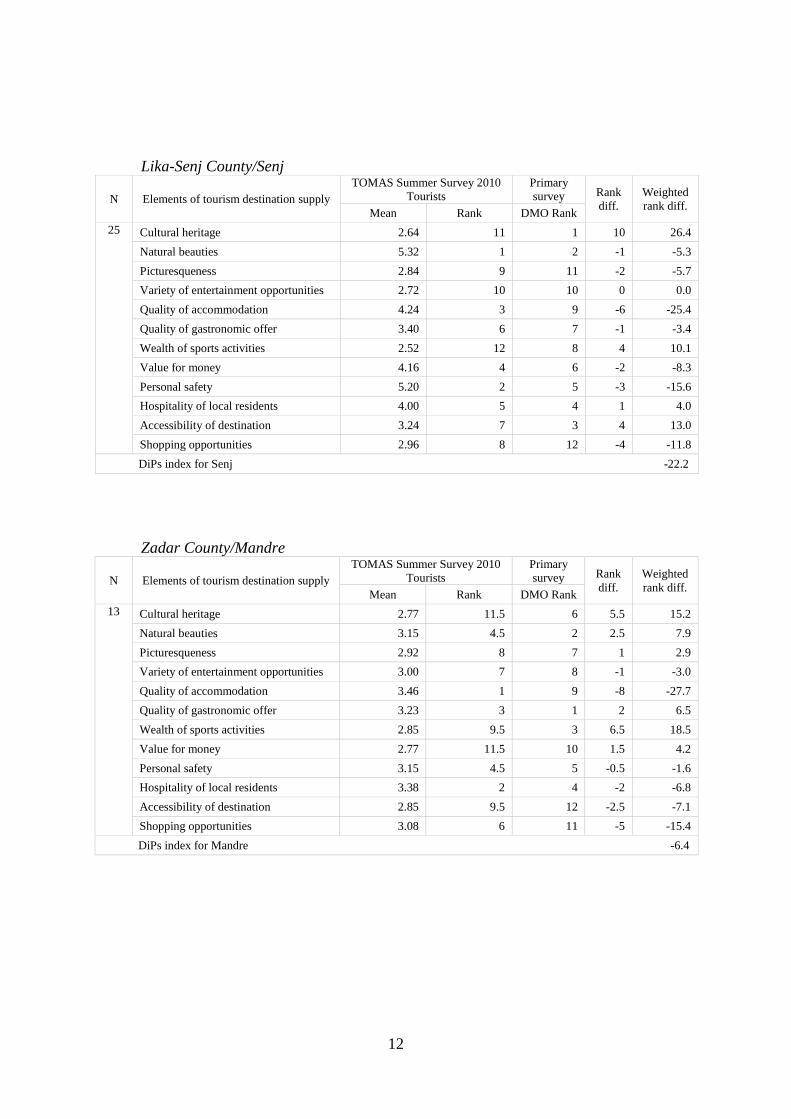
12
Lika-Senj County/Senj
N Elements of tourism destination supply TOMAS Summer Survey 2010
Tourists Primary
survey Rank
diff. Weighted
rank diff. Mean Rank DMO Rank
25 Cultural heritage 2.64 11 1 10 26.4
Natural beauties 5.32 1 2 -1 -5.3
Picturesqueness 2.84 9 11 -2 -5.7
Variety of entertainment opportunities 2.72 10 10 0 0.0
Quality of accommodation 4.24 3 9 -6 -25.4
Quality of gastronomic offer 3.40 6 7 -1 -3.4
Wealth of sports activities 2.52 12 8 4 10.1
Value for money 4.16 4 6 -2 -8.3
Personal safety 5.20 2 5 -3 -15.6
Hospitality of local residents 4.00 5 4 1 4.0
Accessibility of destination 3.24 7 3 4 13.0
Shopping opportunities 2.96 8 12 -4 -11.8
DiPs index for Senj -22.2
Zadar County/Mandre
N Elements of tourism destination supply TOMAS Summer Survey 2010
Tourists Primary
survey Rank
diff. Weighted
rank diff. Mean Rank DMO Rank
13 Cultural heritage 2.77 11.5 6 5.5 15.2
Natural beauties 3.15 4.5 2 2.5 7.9
Picturesqueness 2.92 8 7 1 2.9
Variety of entertainment opportunities 3.00 7 8 -1 -3.0
Quality of accommodation 3.46 1 9 -8 -27.7
Quality of gastronomic offer 3.23 3 1 2 6.5
Wealth of sports activities 2.85 9.5 3 6.5 18.5
Value for money 2.77 11.5 10 1.5 4.2
Personal safety 3.15 4.5 5 -0.5 -1.6
Hospitality of local residents 3.38 2 4 -2 -6.8
Accessibility of destination 2.85 9.5 12 -2.5 -7.1
Shopping opportunities 3.08 6 11 -5 -15.4
DiPs index for Mandre -6.4
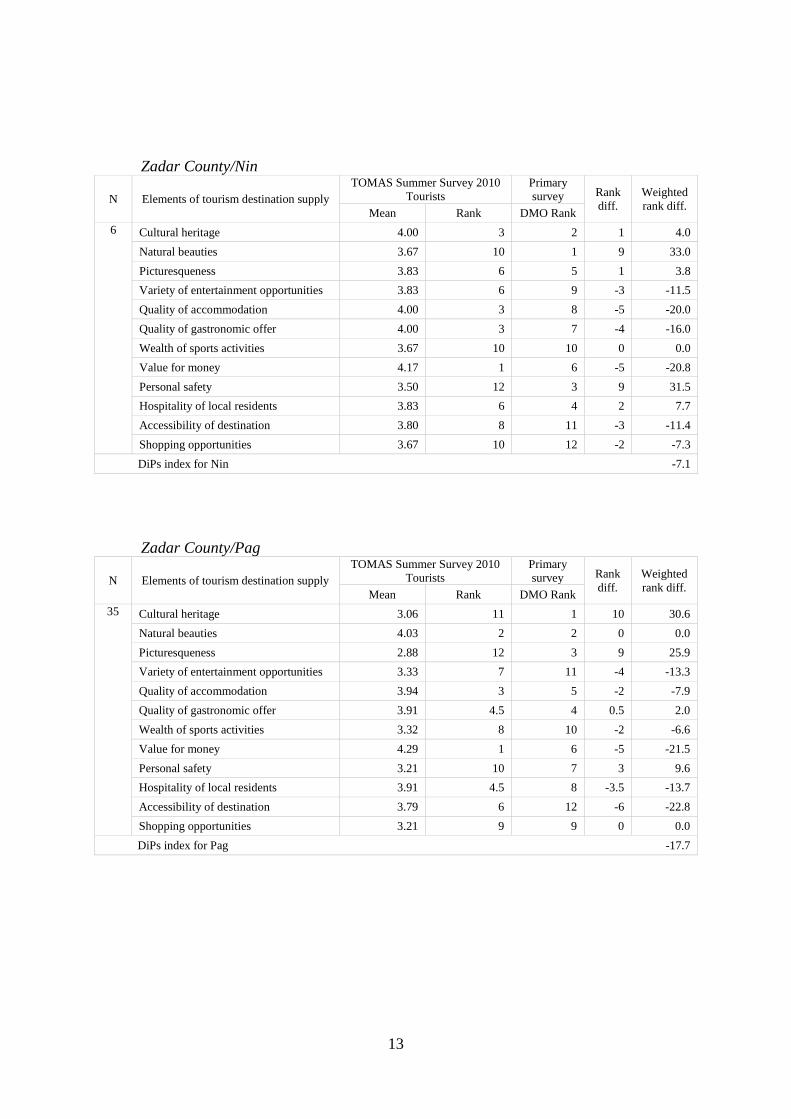
13
Zadar County/Nin
N Elements of tourism destination supply TOMAS Summer Survey 2010
Tourists Primary
survey Rank
diff. Weighted
rank diff. Mean Rank DMO Rank
6 Cultural heritage 4.00 3 2 1 4.0
Natural beauties 3.67 10 1 9 33.0
Picturesqueness 3.83 6 5 1 3.8
Variety of entertainment opportunities 3.83 6 9 -3 -11.5
Quality of accommodation 4.00 3 8 -5 -20.0
Quality of gastronomic offer 4.00 3 7 -4 -16.0
Wealth of sports activities 3.67 10 10 0 0.0
Value for money 4.17 1 6 -5 -20.8
Personal safety 3.50 12 3 9 31.5
Hospitality of local residents 3.83 6 4 2 7.7
Accessibility of destination 3.80 8 11 -3 -11.4
Shopping opportunities 3.67 10 12 -2 -7.3
DiPs index for Nin -7.1
Zadar County/Pag
N Elements of tourism destination supply TOMAS Summer Survey 2010
Tourists Primary
survey Rank
diff. Weighted
rank diff. Mean Rank DMO Rank
35 Cultural heritage 3.06 11 1 10 30.6
Natural beauties 4.03 2 2 0 0.0
Picturesqueness 2.88 12 3 9 25.9
Variety of entertainment opportunities 3.33 7 11 -4 -13.3
Quality of accommodation 3.94 3 5 -2 -7.9
Quality of gastronomic offer 3.91 4.5 4 0.5 2.0
Wealth of sports activities 3.32 8 10 -2 -6.6
Value for money 4.29 1 6 -5 -21.5
Personal safety 3.21 10 7 3 9.6
Hospitality of local residents 3.91 4.5 8 -3.5 -13.7
Accessibility of destination 3.79 6 12 -6 -22.8
Shopping opportunities 3.21 9 9 0 0.0
DiPs index for Pag -17.7
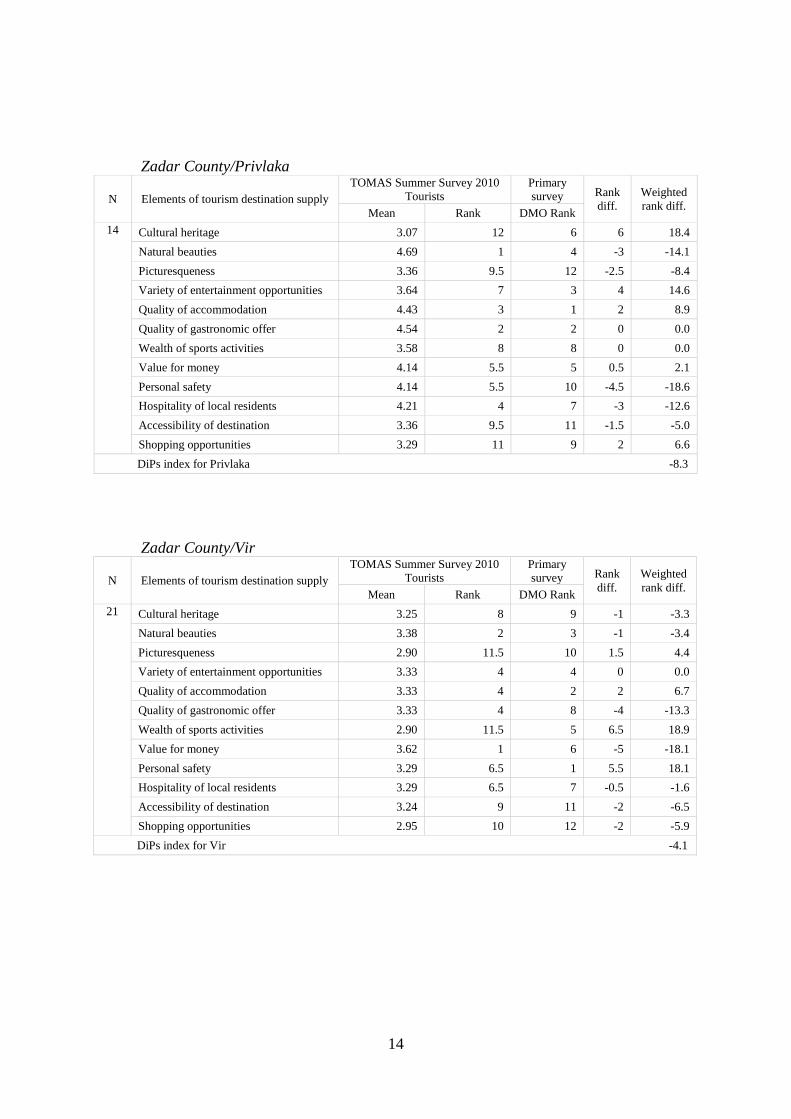
14
Zadar County/Privlaka
N Elements of tourism destination supply TOMAS Summer Survey 2010
Tourists Primary
survey Rank
diff. Weighted
rank diff. Mean Rank DMO Rank
14 Cultural heritage 3.07 12 6 6 18.4
Natural beauties 4.69 1 4 -3 -14.1
Picturesqueness 3.36 9.5 12 -2.5 -8.4
Variety of entertainment opportunities 3.64 7 3 4 14.6
Quality of accommodation 4.43 3 1 2 8.9
Quality of gastronomic offer 4.54 2 2 0 0.0
Wealth of sports activities 3.58 8 8 0 0.0
Value for money 4.14 5.5 5 0.5 2.1
Personal safety 4.14 5.5 10 -4.5 -18.6
Hospitality of local residents 4.21 4 7 -3 -12.6
Accessibility of destination 3.36 9.5 11 -1.5 -5.0
Shopping opportunities 3.29 11 9 2 6.6
DiPs index for Privlaka -8.3
Zadar County/Vir
N Elements of tourism destination supply TOMAS Summer Survey 2010
Tourists Primary
survey Rank
diff. Weighted
rank diff. Mean Rank DMO Rank
21 Cultural heritage 3.25 8 9 -1 -3.3
Natural beauties 3.38 2 3 -1 -3.4
Picturesqueness 2.90 11.5 10 1.5 4.4
Variety of entertainment opportunities 3.33 4 4 0 0.0
Quality of accommodation 3.33 4 2 2 6.7
Quality of gastronomic offer 3.33 4 8 -4 -13.3
Wealth of sports activities 2.90 11.5 5 6.5 18.9
Value for money 3.62 1 6 -5 -18.1
Personal safety 3.29 6.5 1 5.5 18.1
Hospitality of local residents 3.29 6.5 7 -0.5 -1.6
Accessibility of destination 3.24 9 11 -2 -6.5
Shopping opportunities 2.95 10 12 -2 -5.9
DiPs index for Vir -4.1

15
Zadar County/Zadar
N Elements of tourism destination supply TOMAS Summer Survey 2010
Tourists Primary
survey Rank
diff. Weighted
rank diff. Mean Rank DMO Rank
69 Cultural heritage 2.96 11 1 10 29.6
Natural beauties 4.48 1 2 -1 -4.5
Picturesqueness 2.94 12 6 6 17.7
Variety of entertainment opportunities 3.48 6 7 -1 -3.5
Quality of accommodation 4.17 2 4 -2 -8.3
Quality of gastronomic offer 4.14 3 5 -2 -8.3
Wealth of sports activities 3.18 9 12 -3 -9.5
Value for money 3.25 8 11 -3 -9.7
Personal safety 3.64 5 9 -4 -14.6
Hospitality of local residents 4.09 4 10 -6 -24.5
Accessibility of destination 3.42 7 3 4 13.7
Shopping opportunities 3.13 10 8 2 6.3
DiPs index for Zadar -15.8
Šibenik-Knin County/Pirovac
N Elements of tourism destination supply TOMAS Summer Survey 2010
Tourists Primary
survey Rank
diff. Weighted
rank diff. Mean Rank DMO Rank
15 Cultural heritage 3.36 9 5 4 13.4
Natural beauties 4.27 3.5 6 -2.5 -10.7
Picturesqueness 2.80 10 11 -1 -2.8
Variety of entertainment opportunities 3.87 7 8 -1 -3.9
Quality of accommodation 3.93 6 3 3 11.8
Quality of gastronomic offer 3.60 8 4 4 14.4
Wealth of sports activities 2.73 11 7 4 10.9
Value for money 4.27 3.5 10 -6.5 -27.7
Personal safety 4.67 1 2 -1 -4.7
Hospitality of local residents 4.07 5 9 -4 -16.3
Accessibility of destination 4.53 2 1 1 4.5
Shopping opportunities 2.60 12 12 0 0.0
DiPs index for Pirovac -10.9
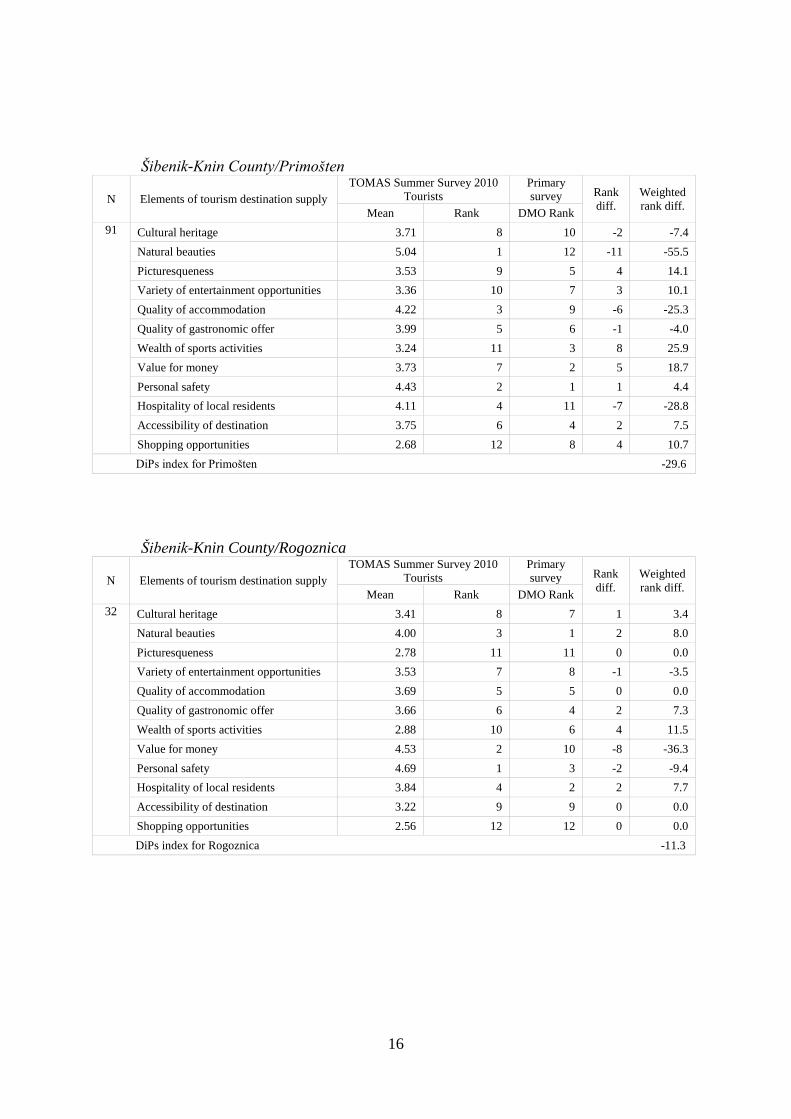
16
Šibenik-Knin County/Primošten
N Elements of tourism destination supply TOMAS Summer Survey 2010
Tourists Primary
survey Rank
diff. Weighted
rank diff. Mean Rank DMO Rank
91 Cultural heritage 3.71 8 10 -2 -7.4
Natural beauties 5.04 1 12 -11 -55.5
Picturesqueness 3.53 9 5 4 14.1
Variety of entertainment opportunities 3.36 10 7 3 10.1
Quality of accommodation 4.22 3 9 -6 -25.3
Quality of gastronomic offer 3.99 5 6 -1 -4.0
Wealth of sports activities 3.24 11 3 8 25.9
Value for money 3.73 7 2 5 18.7
Personal safety 4.43 2 1 1 4.4
Hospitality of local residents 4.11 4 11 -7 -28.8
Accessibility of destination 3.75 6 4 2 7.5
Shopping opportunities 2.68 12 8 4 10.7
DiPs index for Primošten -29.6
Šibenik-Knin County/Rogoznica
N Elements of tourism destination supply TOMAS Summer Survey 2010
Tourists Primary
survey Rank
diff. Weighted
rank diff. Mean Rank DMO Rank
32 Cultural heritage 3.41 8 7 1 3.4
Natural beauties 4.00 3 1 2 8.0
Picturesqueness 2.78 11 11 0 0.0
Variety of entertainment opportunities 3.53 7 8 -1 -3.5
Quality of accommodation 3.69 5 5 0 0.0
Quality of gastronomic offer 3.66 6 4 2 7.3
Wealth of sports activities 2.88 10 6 4 11.5
Value for money 4.53 2 10 -8 -36.3
Personal safety 4.69 1 3 -2 -9.4
Hospitality of local residents 3.84 4 2 2 7.7
Accessibility of destination 3.22 9 9 0 0.0
Shopping opportunities 2.56 12 12 0 0.0
DiPs index for Rogoznica -11.3

17
Šibenik-Knin County/Šibenik
N Elements of tourism destination supply TOMAS Summer Survey 2010
Tourists Primary
survey Rank
diff. Weighted
rank diff. Mean Rank DMO Rank
104 Cultural heritage 3.64 9 12 -3 -10.9
Natural beauties 4.58 1 11 -10 -45.8
Picturesqueness 3.28 11 1 10 32.8
Variety of entertainment opportunities 3.66 8 2 6 22.0
Quality of accommodation 4.22 3 6 -3 -12.7
Quality of gastronomic offer 4.05 4 5 -1 -4.0
Wealth of sports activities 3.37 10 7 3 10.1
Value for money 3.88 6 4 2 7.8
Personal safety 4.34 2 9 -7 -30.4
Hospitality of local residents 3.89 5 10 -5 -19.5
Accessibility of destination 3.87 7 8 -1 -3.9
Shopping opportunities 2.78 12 3 9 25.0
DiPs index Šibenik -29.4
Šibenik-Knin County/Vodice
N Elements of tourism destination supply TOMAS Summer Survey 2010
Tourists Primary
survey Rank
diff. Weighted
rank diff. Mean Rank DMO Rank
108 Cultural heritage 3.97 9 2 7 27.8
Natural beauties 4.63 1 1 0 0.0
Picturesqueness 3.52 11 11 0 0.0
Variety of entertainment opportunities 4.18 7 3 4 16.7
Quality of accommodation 4.54 2 5 -3 -13.6
Quality of gastronomic offer 4.41 4.5 8 -3.5 -15.4
Wealth of sports activities 3.81 10 4 6 22.9
Value for money 4.47 3 9 -6 -26.8
Personal safety 4.31 6 7 -1 -4.3
Hospitality of local residents 4.41 4.5 6 -1.5 -6.6
Accessibility of destination 4.13 8 10 -2 -8.3
Shopping opportunities 3.44 12 12 0 0.0
DiPs index for Vodice -7.7
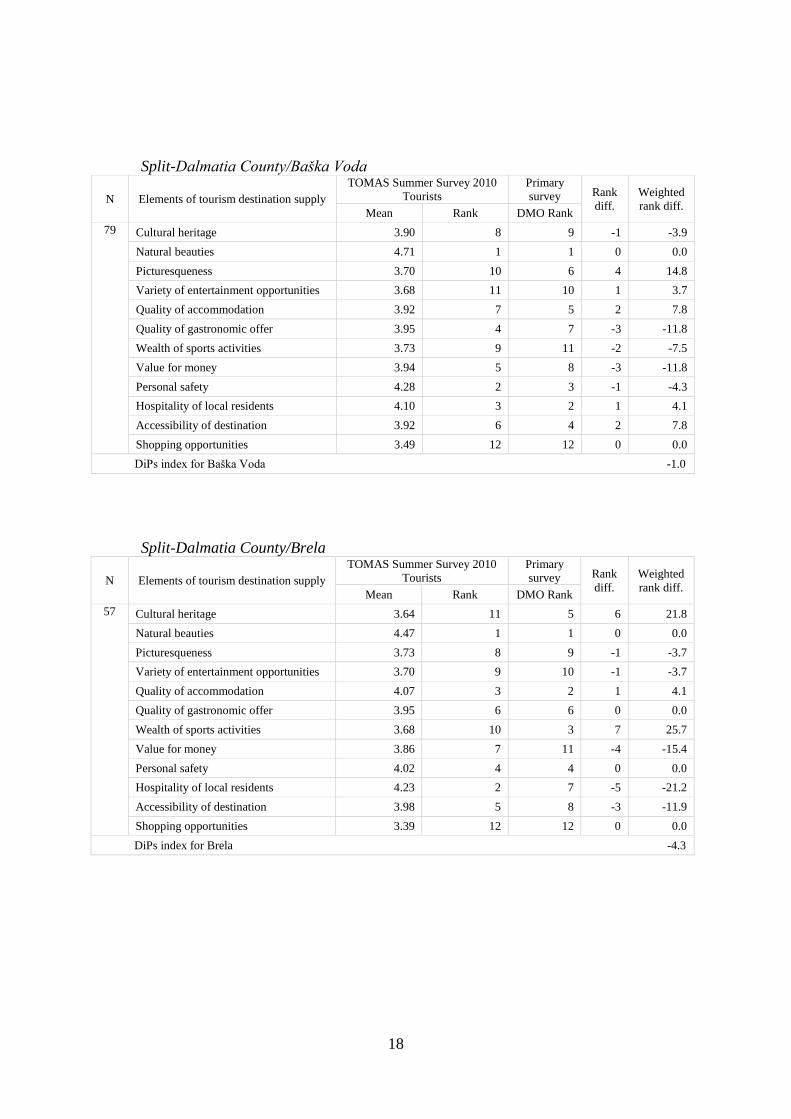
18
Split-Dalmatia County/Baška Voda
N Elements of tourism destination supply TOMAS Summer Survey 2010
Tourists Primary
survey Rank
diff. Weighted
rank diff. Mean Rank DMO Rank
79 Cultural heritage 3.90 8 9 -1 -3.9
Natural beauties 4.71 1 1 0 0.0
Picturesqueness 3.70 10 6 4 14.8
Variety of entertainment opportunities 3.68 11 10 1 3.7
Quality of accommodation 3.92 7 5 2 7.8
Quality of gastronomic offer 3.95 4 7 -3 -11.8
Wealth of sports activities 3.73 9 11 -2 -7.5
Value for money 3.94 5 8 -3 -11.8
Personal safety 4.28 2 3 -1 -4.3
Hospitality of local residents 4.10 3 2 1 4.1
Accessibility of destination 3.92 6 4 2 7.8
Shopping opportunities 3.49 12 12 0 0.0
DiPs index for Baška Voda -1.0
Split-Dalmatia County/Brela
N Elements of tourism destination supply TOMAS Summer Survey 2010
Tourists Primary
survey Rank
diff. Weighted
rank diff. Mean Rank DMO Rank
57 Cultural heritage 3.64 11 5 6 21.8
Natural beauties 4.47 1 1 0 0.0
Picturesqueness 3.73 8 9 -1 -3.7
Variety of entertainment opportunities 3.70 9 10 -1 -3.7
Quality of accommodation 4.07 3 2 1 4.1
Quality of gastronomic offer 3.95 6 6 0 0.0
Wealth of sports activities 3.68 10 3 7 25.7
Value for money 3.86 7 11 -4 -15.4
Personal safety 4.02 4 4 0 0.0
Hospitality of local residents 4.23 2 7 -5 -21.2
Accessibility of destination 3.98 5 8 -3 -11.9
Shopping opportunities 3.39 12 12 0 0.0
DiPs index for Brela -4.3
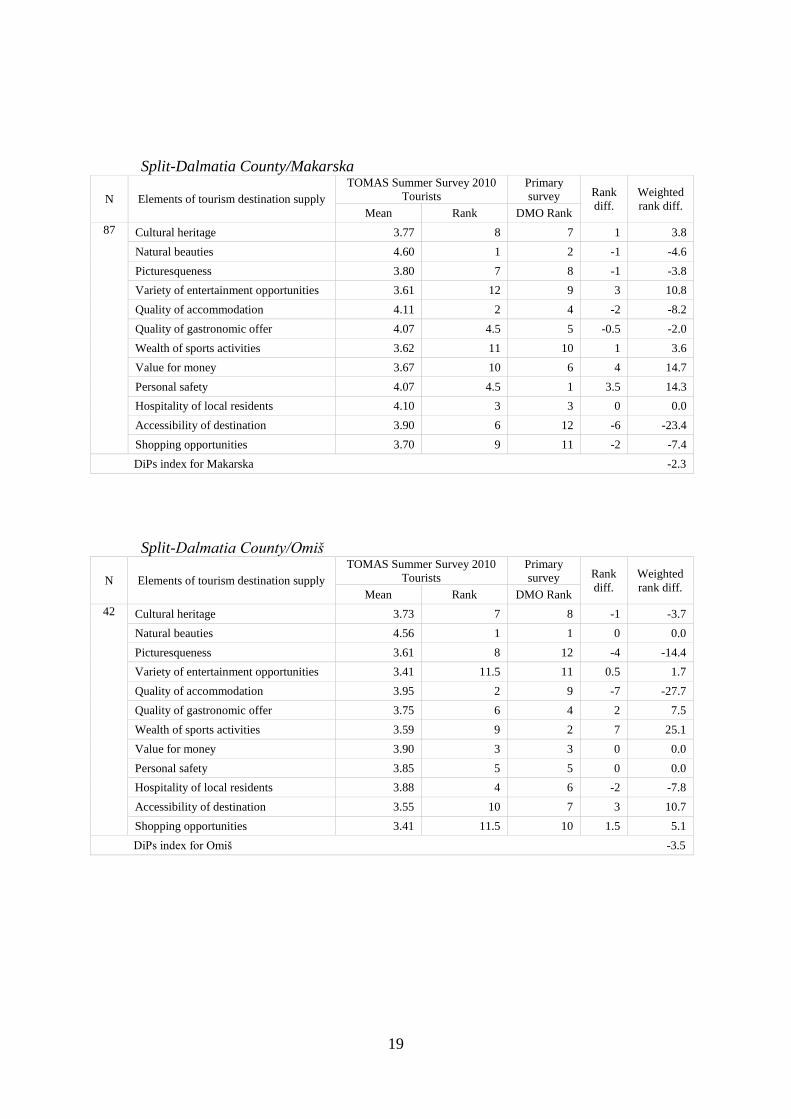
19
Split-Dalmatia County/Makarska
N Elements of tourism destination supply TOMAS Summer Survey 2010
Tourists Primary
survey Rank
diff. Weighted
rank diff. Mean Rank DMO Rank
87 Cultural heritage 3.77 8 7 1 3.8
Natural beauties 4.60 1 2 -1 -4.6
Picturesqueness 3.80 7 8 -1 -3.8
Variety of entertainment opportunities 3.61 12 9 3 10.8
Quality of accommodation 4.11 2 4 -2 -8.2
Quality of gastronomic offer 4.07 4.5 5 -0.5 -2.0
Wealth of sports activities 3.62 11 10 1 3.6
Value for money 3.67 10 6 4 14.7
Personal safety 4.07 4.5 1 3.5 14.3
Hospitality of local residents 4.10 3 3 0 0.0
Accessibility of destination 3.90 6 12 -6 -23.4
Shopping opportunities 3.70 9 11 -2 -7.4
DiPs index for Makarska -2.3
Split-Dalmatia County/Omiš
N Elements of tourism destination supply TOMAS Summer Survey 2010
Tourists Primary
survey Rank
diff. Weighted
rank diff. Mean Rank DMO Rank
42 Cultural heritage 3.73 7 8 -1 -3.7
Natural beauties 4.56 1 1 0 0.0
Picturesqueness 3.61 8 12 -4 -14.4
Variety of entertainment opportunities 3.41 11.5 11 0.5 1.7
Quality of accommodation 3.95 2 9 -7 -27.7
Quality of gastronomic offer 3.75 6 4 2 7.5
Wealth of sports activities 3.59 9 2 7 25.1
Value for money 3.90 3 3 0 0.0
Personal safety 3.85 5 5 0 0.0
Hospitality of local residents 3.88 4 6 -2 -7.8
Accessibility of destination 3.55 10 7 3 10.7
Shopping opportunities 3.41 11.5 10 1.5 5.1
DiPs index for Omiš -3.5
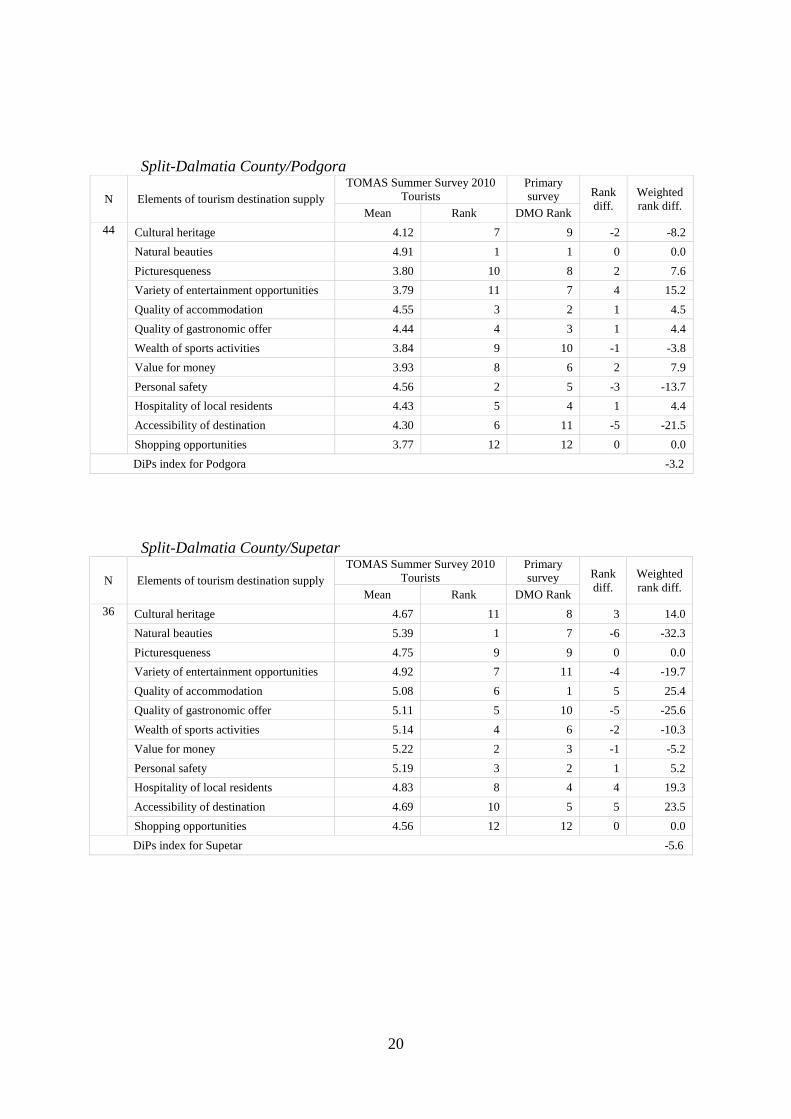
20
Split-Dalmatia County/Podgora
N Elements of tourism destination supply TOMAS Summer Survey 2010
Tourists Primary
survey Rank
diff. Weighted
rank diff. Mean Rank DMO Rank
44 Cultural heritage 4.12 7 9 -2 -8.2
Natural beauties 4.91 1 1 0 0.0
Picturesqueness 3.80 10 8 2 7.6
Variety of entertainment opportunities 3.79 11 7 4 15.2
Quality of accommodation 4.55 3 2 1 4.5
Quality of gastronomic offer 4.44 4 3 1 4.4
Wealth of sports activities 3.84 9 10 -1 -3.8
Value for money 3.93 8 6 2 7.9
Personal safety 4.56 2 5 -3 -13.7
Hospitality of local residents 4.43 5 4 1 4.4
Accessibility of destination 4.30 6 11 -5 -21.5
Shopping opportunities 3.77 12 12 0 0.0
DiPs index for Podgora -3.2
Split-Dalmatia County/Supetar
N Elements of tourism destination supply TOMAS Summer Survey 2010
Tourists Primary
survey Rank
diff. Weighted
rank diff. Mean Rank DMO Rank
36 Cultural heritage 4.67 11 8 3 14.0
Natural beauties 5.39 1 7 -6 -32.3
Picturesqueness 4.75 9 9 0 0.0
Variety of entertainment opportunities 4.92 7 11 -4 -19.7
Quality of accommodation 5.08 6 1 5 25.4
Quality of gastronomic offer 5.11 5 10 -5 -25.6
Wealth of sports activities 5.14 4 6 -2 -10.3
Value for money 5.22 2 3 -1 -5.2
Personal safety 5.19 3 2 1 5.2
Hospitality of local residents 4.83 8 4 4 19.3
Accessibility of destination 4.69 10 5 5 23.5
Shopping opportunities 4.56 12 12 0 0.0
DiPs index for Supetar -5.6
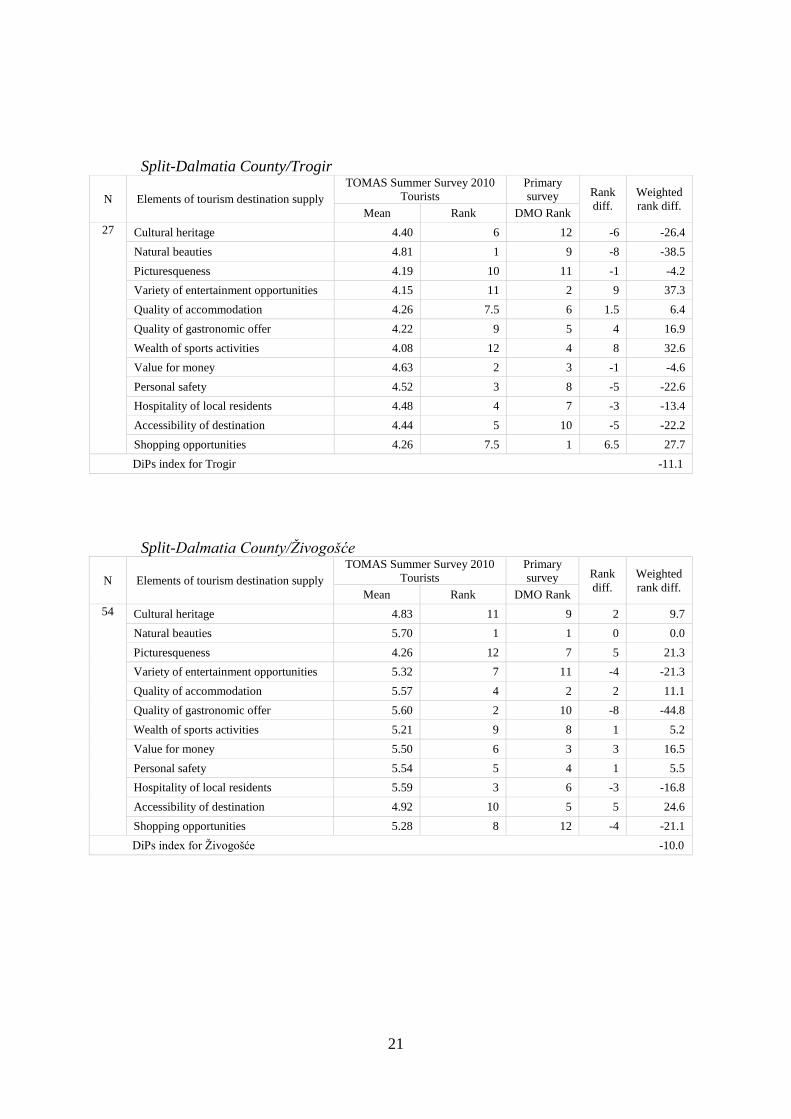
21
Split-Dalmatia County/Trogir
N Elements of tourism destination supply TOMAS Summer Survey 2010
Tourists Primary
survey Rank
diff. Weighted
rank diff. Mean Rank DMO Rank
27 Cultural heritage 4.40 6 12 -6 -26.4
Natural beauties 4.81 1 9 -8 -38.5
Picturesqueness 4.19 10 11 -1 -4.2
Variety of entertainment opportunities 4.15 11 2 9 37.3
Quality of accommodation 4.26 7.5 6 1.5 6.4
Quality of gastronomic offer 4.22 9 5 4 16.9
Wealth of sports activities 4.08 12 4 8 32.6
Value for money 4.63 2 3 -1 -4.6
Personal safety 4.52 3 8 -5 -22.6
Hospitality of local residents 4.48 4 7 -3 -13.4
Accessibility of destination 4.44 5 10 -5 -22.2
Shopping opportunities 4.26 7.5 1 6.5 27.7
DiPs index for Trogir -11.1
Split-Dalmatia County/Živogošće
N Elements of tourism destination supply TOMAS Summer Survey 2010
Tourists Primary
survey Rank
diff. Weighted
rank diff. Mean Rank DMO Rank
54 Cultural heritage 4.83 11 9 2 9.7
Natural beauties 5.70 1 1 0 0.0
Picturesqueness 4.26 12 7 5 21.3
Variety of entertainment opportunities 5.32 7 11 -4 -21.3
Quality of accommodation 5.57 4 2 2 11.1
Quality of gastronomic offer 5.60 2 10 -8 -44.8
Wealth of sports activities 5.21 9 8 1 5.2
Value for money 5.50 6 3 3 16.5
Personal safety 5.54 5 4 1 5.5
Hospitality of local residents 5.59 3 6 -3 -16.8
Accessibility of destination 4.92 10 5 5 24.6
Shopping opportunities 5.28 8 12 -4 -21.1
DiPs index for Živogošće -10.0
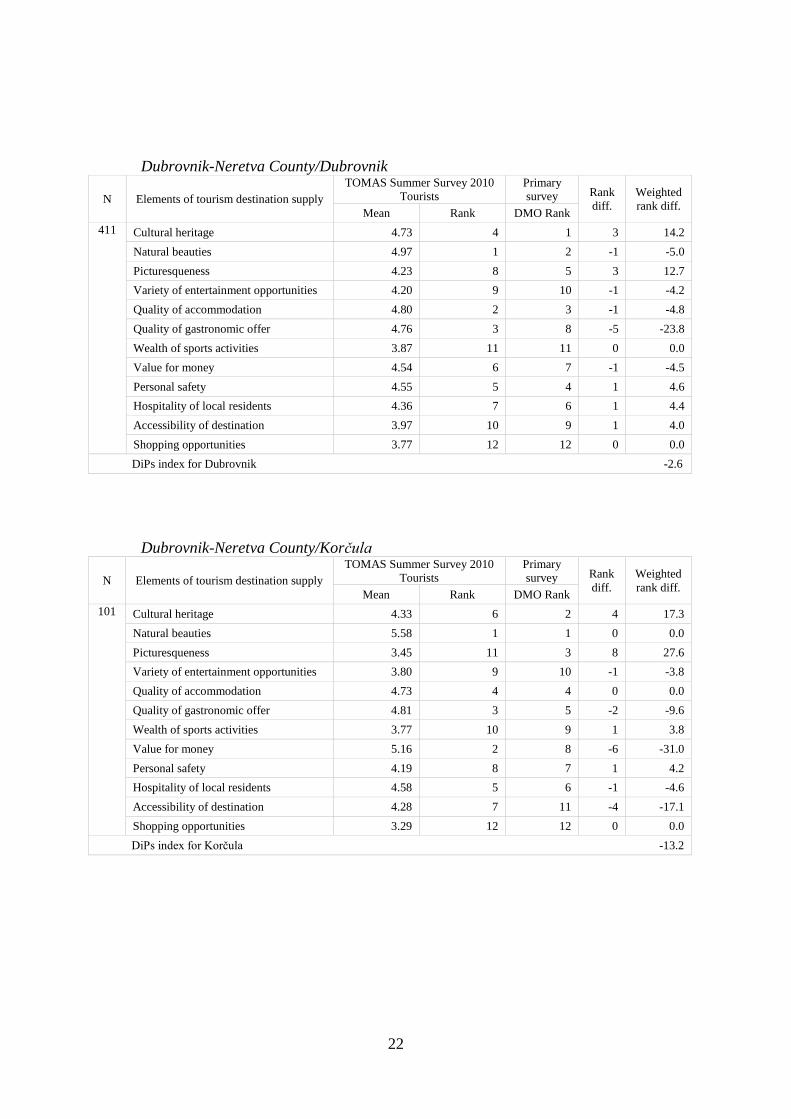
22
Dubrovnik-Neretva County/Dubrovnik
N Elements of tourism destination supply TOMAS Summer Survey 2010
Tourists Primary
survey Rank
diff. Weighted
rank diff. Mean Rank DMO Rank
411 Cultural heritage 4.73 4 1 3 14.2
Natural beauties 4.97 1 2 -1 -5.0
Picturesqueness 4.23 8 5 3 12.7
Variety of entertainment opportunities 4.20 9 10 -1 -4.2
Quality of accommodation 4.80 2 3 -1 -4.8
Quality of gastronomic offer 4.76 3 8 -5 -23.8
Wealth of sports activities 3.87 11 11 0 0.0
Value for money 4.54 6 7 -1 -4.5
Personal safety 4.55 5 4 1 4.6
Hospitality of local residents 4.36 7 6 1 4.4
Accessibility of destination 3.97 10 9 1 4.0
Shopping opportunities 3.77 12 12 0 0.0
DiPs index for Dubrovnik -2.6
Dubrovnik-Neretva County/Korčula
N Elements of tourism destination supply TOMAS Summer Survey 2010
Tourists Primary
survey Rank
diff. Weighted
rank diff. Mean Rank DMO Rank
101 Cultural heritage 4.33 6 2 4 17.3
Natural beauties 5.58 1 1 0 0.0
Picturesqueness 3.45 11 3 8 27.6
Variety of entertainment opportunities 3.80 9 10 -1 -3.8
Quality of accommodation 4.73 4 4 0 0.0
Quality of gastronomic offer 4.81 3 5 -2 -9.6
Wealth of sports activities 3.77 10 9 1 3.8
Value for money 5.16 2 8 -6 -31.0
Personal safety 4.19 8 7 1 4.2
Hospitality of local residents 4.58 5 6 -1 -4.6
Accessibility of destination 4.28 7 11 -4 -17.1
Shopping opportunities 3.29 12 12 0 0.0
DiPs index for Korčula -13.2
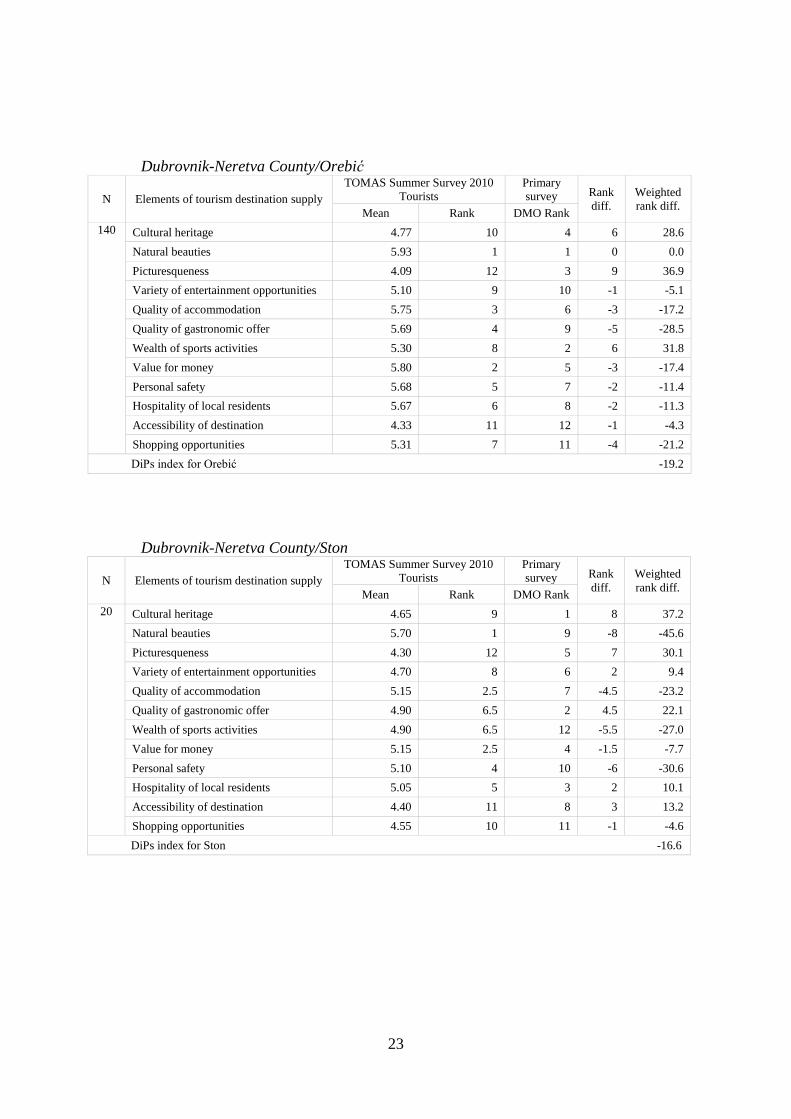
23
Dubrovnik-Neretva County/Orebić
N Elements of tourism destination supply TOMAS Summer Survey 2010
Tourists Primary
survey Rank
diff. Weighted
rank diff. Mean Rank DMO Rank
140 Cultural heritage 4.77 10 4 6 28.6
Natural beauties 5.93 1 1 0 0.0
Picturesqueness 4.09 12 3 9 36.9
Variety of entertainment opportunities 5.10 9 10 -1 -5.1
Quality of accommodation 5.75 3 6 -3 -17.2
Quality of gastronomic offer 5.69 4 9 -5 -28.5
Wealth of sports activities 5.30 8 2 6 31.8
Value for money 5.80 2 5 -3 -17.4
Personal safety 5.68 5 7 -2 -11.4
Hospitality of local residents 5.67 6 8 -2 -11.3
Accessibility of destination 4.33 11 12 -1 -4.3
Shopping opportunities 5.31 7 11 -4 -21.2
DiPs index for Orebić -19.2
Dubrovnik-Neretva County/Ston
N Elements of tourism destination supply TOMAS Summer Survey 2010
Tourists Primary
survey Rank
diff. Weighted
rank diff. Mean Rank DMO Rank
20 Cultural heritage 4.65 9 1 8 37.2
Natural beauties 5.70 1 9 -8 -45.6
Picturesqueness 4.30 12 5 7 30.1
Variety of entertainment opportunities 4.70 8 6 2 9.4
Quality of accommodation 5.15 2.5 7 -4.5 -23.2
Quality of gastronomic offer 4.90 6.5 2 4.5 22.1
Wealth of sports activities 4.90 6.5 12 -5.5 -27.0
Value for money 5.15 2.5 4 -1.5 -7.7
Personal safety 5.10 4 10 -6 -30.6
Hospitality of local residents 5.05 5 3 2 10.1
Accessibility of destination 4.40 11 8 3 13.2
Shopping opportunities 4.55 10 11 -1 -4.6
DiPs index for Ston -16.6
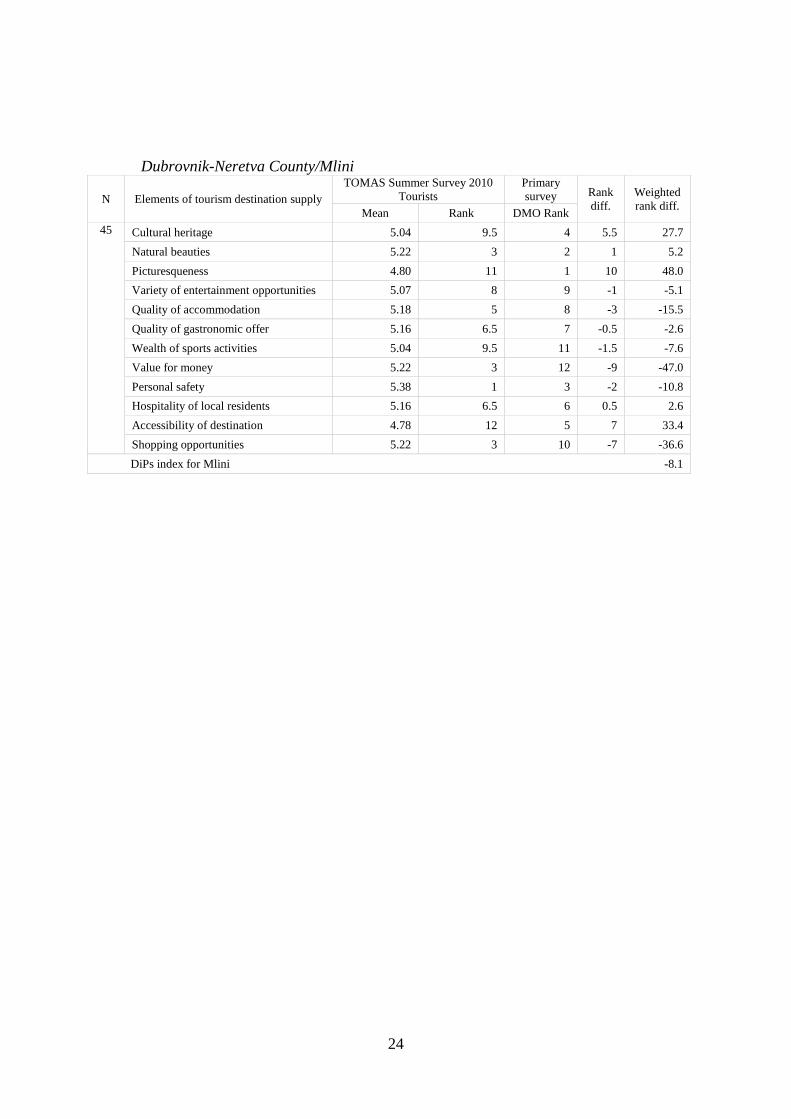
24
Dubrovnik-Neretva County/Mlini
N Elements of tourism destination supply TOMAS Summer Survey 2010
Tourists Primary
survey Rank
diff. Weighted
rank diff. Mean Rank DMO Rank
45 Cultural heritage 5.04 9.5 4 5.5 27.7
Natural beauties 5.22 3 2 1 5.2
Picturesqueness 4.80 11 1 10 48.0
Variety of entertainment opportunities 5.07 8 9 -1 -5.1
Quality of accommodation 5.18 5 8 -3 -15.5
Quality of gastronomic offer 5.16 6.5 7 -0.5 -2.6
Wealth of sports activities 5.04 9.5 11 -1.5 -7.6
Value for money 5.22 3 12 -9 -47.0
Personal safety 5.38 1 3 -2 -10.8
Hospitality of local residents 5.16 6.5 6 0.5 2.6
Accessibility of destination 4.78 12 5 7 33.4
Shopping opportunities 5.22 3 10 -7 -36.6
DiPs index for Mlini -8.1
25
Appendix C: Summary in Slovenian language/Daljši Povzetek disertacije v slovenskem
jeziku
Predstavitev
Potovanja in turizem sodi med najhitreje rastoče industrije na svetu, ki bistveno prispevajo k
zaposlovanju, in povečevanju bruto domačega proizvoda (BDP), zlasti manjših in manj razvitih
držav, kot je Hrvaška. Po razpoložljivih podatkih Svetovnega potovalnega in turističnega sveta
(WTTC, 2013), je bilo celotnega prispevka s področja potovanj in turizma v svetovnem BDP
6.630,4 milijarde USD v letu 2012 (9,3% vseh objav). Ta delež se bo po napovedih povečal za
4,4% letno v naslednjih desetih letih. Poleg tega so v letu 2012 potovanja in turizem, neposredno
in posredno (vključno z delovnimi mesti, ki jih podpirajo v povezanih panogah), ustvarile
približno 261.400.000 delovnih mest. To predstavlja 8,7% vseh delovnih mest, ki naj bi bila
ustvarjena do leta 2023 (WTTC, 2013 ). Vetu 2012 je turizem je ustvaril približno 1.243 milijard
USD dobičkov (ali 3,4 milijona USD na dan), kar predstavlja 5,4% celotnega izvoza v letu 2012
(WTTC, 2013). Po podatkih WTTC (2013), se pričakuje da bodo potovanja in turizem povečala
prihodke iz uvoza za 4,2% letno do leta 2023. Poudariti je treba tudi, da so glede na podatke
WTTC, potovanja in naložbe povezane s turizmom znašale 764.700.000.000 USD v letu 2012
(4,7% celotnih investicij), ki se bodo predvidoma povečale za 5,3% na leto v naslednjih desetih
letih (do leta 2023).
Turizem je za hrvaško gospodarstvo izjemnega pomena. Po podatkih hrvaškega urada za
statistiko (DZS, 2014), je Hrvaška je zabeležila 12,4 milijona prihodov turistov in 64.800.000
turističnih nočitev v letu 2013. Pri tem so mednarodni turistični prihodki dosegli 7,2 milijarde
EUR v letu 2013 (HNB, 2014). Neposredni prispevek turizma na hrvaški BDP je ocenjen
približno 8,3% (Gatti, 2013), medtem ko je njegov neposredni in posredni prispevek okoli
14,7% (Šutalo, Ivandić in Marušić, 2011). Poleg tega je turizem dejavnost ki ima močan in
pozitiven vpliv na celotno zaposlenost, saj turizem ustvari okoli 7% vseh zaposlitev v Hrvaški.
Po indeksu TTCI hrvaški turizem zaseda 35. mesto med 140 analiziranimi državami v letu 2013
kar predstalja relativno visok nivo konkurenčnosti (WEF, 2013).
Glede na velik gospodarski prispevek turizma za gospodarstvo, ni presenetljivo da turistični trg
postaja vse bolj zasičen in zelo konkurenčno okolje za posamezne turistične destinacije. Da bi
ohranile konkurenčnost ter dolgoročni tržni položaj na globalnem turističnem trgu so destinacije
pod izjemnim pritiskom pomlajevanja Povedano drugače, destinacija mora biti privlačna,
inovativna, drugačna in izvirna. Konkurenčnost destinacij in njeni glavni dejavniki so tako v
središču raziskovanja na področju turizma in potovanja. Raziskovalci v turizmu nenehno
razvijajo in izboljšujejo modele konkurenčnosti destinacije, z širjenjem obsega raziskav in
znanstvene literature. Eden od glavnih ciljev te disertacije tako raziskati relativno nedavni
26
koncept destinacijskega trženja blagovne znamke in njen vpliv na turistično konkurenčnost
destinacij. Temeljno teoretično izhodišče disertacije je, da je destinacijsko znamčenje eden
izmed ključnih dejavnikov za doseganje konkurenčnosti destinacije. Vendar ta izhodišča še
vedno niso splošno sprejeta v turistični literaturi, ki izhajaja iz dejstva, da destinacijsko
znamčenje še vedno ni sestavni del najbolj splošno sprejetih modelov konkurenčnosti destinacij
(Dwyer in Kim, 2003; Gooroochurn in Sugiyarto, 2005; Heath, 2003; Ritchie in Crouch, 2003).
Raziskava v tej disertaciji je namenjena analizi in raziskovanju tegapomembnega vprašanja
povezanega s trženjem hrvaških obmorskih destinacij. Hrvaška, kot državana zelo
konkurenčnem sredozemskega turističnem trgu, mora izboljšati celo vrsto dejavnikov, ki
vplivajo na njeno konkurenčnost. To vključuje opredelitev vloge destinacijskih blagovnih
znamk v procesu doseganja ciljne konkurenčnosti in posledično razvoj blagovne znamke, ki bi
jasno sporočile glavne konkurenčne prednosti Hrvaške na globalnem turističnem trgu.
Utemeljitev za raziskave
Globalno turistično tržište postaja vse bolj konkurenčno okolje za turistične destinacije in
destinacije so pod izjemnim pritiskom da bi postale edinstvene, prepoznavne in ostale
konkurenčne (Krešić in Prebežac, 2011). Zato ne preseneča da se povečuje interes in zanimanje
za konkurenčnost v turizmu, tako na ravni destinacijekot tudi na ravni hotelske industrije.
Ritchie in Crouch (2003, str. 1) kot najbolj uveljavljena raziskovalca konkurenčnosti destinacije
na svetu navajata, da je destinacijska konkurenčnost „izraz širšega pojava nove gospodarske
konkurenčnosti in tudi širši fenomen človeške konkurenčnosti v družbenih, tehnoloških,
kulturnih in političnih sferah“. Poleg tega, Dwyer in Kim (2003) poudarjajo, da je cilj
konkurenčnosti vezan na uspešnost cilja, ki mora biti bolj uspešen kot njihovi konkurenti v
vidikov popolne turistične izkušnje. Da bi destinacije bile konkurenčne na globalnem
turističnem trgu, morajo biti inovativne, razlikovalne in nenehno iskati nove vire konkurenčnih
prednosti.
Med pomembne vire konkurenčne prednosti destinacij spadajo njegova tržna edinstvenost in
prepoznavnost, ki jo je mogoče doseči s procesom blagovnega znamčenja destinacij. Vendar,
čeprav so različni dejavniki in atributi konkurenčnosti destinacije in destinacijskega trženja
blagovne znamke dobro raziskani in natančno dokumentirani v, pa celovit in splošno sprejet
teoretični okvir ki povezuje pojme destinacijske blagovne znamke in konkurenčnosti destinacije
še vedno ni bil določen. Zato je mogoče ugotoviti potrebo po znanju in razumevanju vloge
znamčenja destinacij v procesu doseganja turistične konkurenčnosti destinacij, kar predstavlja
pomembno raziskovalno vrzel, ki se je delno obravnavala v tisti disertaciji. Da bi pojasnili
kompleksni odnos med ciljnim trženjem blagovne znamke in konkurenčnosti destinacije, so
bile kot študije primera uporabljene izbrane Hrvaške obmorske turistične destinacije.
27
Raziskovalni problem
Na podlagi predhodnje navedenih izhodišč, je glavni cilj tega dela raziskati ali je destinacijsko
znamčenje dejavnik, ki vpliva na ciljno konkurenčnost in raziskati vlogo destinacije blagovne
znamke v procesu doseganja konkurenčnosti turistične destinacije, kot relativno novega
koncepta v teoriji in praksi turizma.
V zadnjih tridesetih letih je znamčenje postalo zelo pomemben trženjski pristop, ki zahteva
sodelovanje široke palete deležnikov, da bi dosegli uspešen izid (Green, 2005). Na drugi strani
pa je izbira blagovne znamke še vedno relativno nov raziskovalni prostor, ki je podrobneje
opisano v podpoglavju 2.2 disertacije. Čeprav je pomen destinacijskega znamčenja pomemben
dejavnik v literaturi, je večina raziskav osredotoča samo na destinacijske slike in identitete
(Ahmed, 1991; Baloglu, 1997; Baloglu in Mangaloglu, 2001, Beerli in Martin, 2004; Dimanche
in Moody, 1998 ; Elliot, Papadopoulos in Kim, 2011; Govers, Go in Kumar, 2007; Konečnik
in Go, 2008; Perdue, 2000; Prebensen, 2007; Stock, 2009; Uysal, Chen in Williams, 2000), ki
je pravzaprav produkt destinacijskega znamčenja. Morgan, Pritchard in Pride (2004) so
poudarili, da je blagovna znamka postala eden od ključnih dejavnikov uspeha destinacij, skupaj
s proizvodi in ceno. Kotler, Bowen in Makens (2006a) prav tako trdijo da so izdelki in blagovne
znamke izjemno pomembne za uspeh destinacij, saj jih je mogoče uporabiti kot orodje za
komunikacijo edinstvene identitete. Zenker in Braun (2010) gledajo na znamko destinacij kot
na „kolaž“ združenj v mislih potrošnika, ki temelji na vizualno, verbalno in vedenjskega
izražanja mestu. Pregled literature je pokazal nekatere druge perspektive v znamčenju
destinacij, kot je uporabniško-temelječa vrednost (Boo, Busser in Baloglu, 2009; Konečnik in
Gartner, 2007), in zvestobo znamke (Oppermann 2000), oba pomembna za merjenje znamke
destinacij.
Po Anholt (2008), blagovna znamka države in destinacije ne bi smeli oblikovati kot v primeru
izdelkov, zaradi njihove kompleksnosti. Vendar, je proces znamčenja destinacij zelo podoben
procesu znamčenja izdelkov, vendar je znamčenje destinacij bolj zapleten proces zaradi
različnih deležnikov, ki sodelujejo v procesu. Proces destinacijskega znamčenja zagotovo
omogoča boljše delovanje destinacije, enako kot močna blagovna znamka, vodi omogoča
konkurenčne prednosti (Lee in Back, 2010). Vendar pa razmerje med konkurenčnostjo
destinacij in njihove blagovne znamke še vedno ni jasno in je samo delno omenjeno v dveh
najbolj znanih modelih destinacijske konkurenčnosti – splošen model konkurenčnosti
destinacije, ki ga so predlagali Ritchie in Crouch (2003) in celoviti model destinacijske
konkurenčnosti, ki so ga predlagali Dwyer in Kim (2003). V modelu Ritchie and Crouch, je
pozicioniranje / znamčenje del destinacijske politike, načrtovanja in razvojne dimenzije,
medtem ko sta Dwyer in Kim destinacijski položaj in jasnost destinacijske slike priznala kot
28
spremenljivke ki vplivajo na destinacijsko konkurenčnost, vendar izrecno ne opredelita
destincijskega znamčenja.
Pike (2009) je prepoznal tri glavne potencialne raziskovalne vrzel v področju blagovne znamke:
1. Razvoj identitete destinacijske blagovne znamke,
2. Pozicioniranej destinacijskoblagovne znamke, in
3. Merjenje in sledenje kapitala destinacijsko blagovne znamke.
Nekatera vprašanja ki jih potrebno raziskati, so povezana z boljšim razumevanjem odločanja o
znamčenju destinacij, poenotenja krovnih strategij blagovne znamke, ustrezno pozicioniranje
blagovne znamke, vloge upravljanja odnosov s strankami (CRM) za destinacijsko lojalnost,
sloganov blagovne znamke in učinkovitosti logotipov, in merjenje uspešnosti blagovne znamke
destinacij. Zenker in Martin (2011) poudarjata, da je glede na prakso destinacijskega trženja
področje destincijskega znamčenja še vedno omejeno glede možnih pristopov merjenje
uspešnosti destinacije. Avtorja navajata, da se merjenje uspešnosti destinacij pogosto ne izvaja
redno. Tržniki običajno omejijo svoje podatke na ključne kazalnikov (kot je prenočitev turistov
ali medijski povzetki) zaradi visokih stroškov povezanih z bolj celovitimi metodami. Vprašanja
učinkovitosti in uspešnosti trženja destinacije ter njihov vpliv na konkurenčnost destinacij tako
ostajajo neodgovorjena.
Destinacijsko znamčenje kot dejavnik konkurenčnosti destinacij v literaturi ni empirično
dokazano, zato lahko destinacijsko znamčenje in učinkovitost opredelimo kot glavna vrzel v
pregledu raziskovalne literature. Destinacijsko znamčenje zahteva podrobnejšo obravnavo,
medtem ko je potrebno modele destinacijske konkurenčnosti razširiti ter vključiti blagovno
znamko kot dejavnik konkurenčnosti turistične destinacije.
Raziskovalni cilj in vprašanja
Glede na že omenjeno je jasno, da na je znamčenje destinacije pomemben dejavnik
konkurenčnosti destinacij, vendar pa je še vedno omejeno razumevanje kako blagovna znamka
destinacije vpliva na splošno raven konkurenčnosti destinacije. Zaradi tega glavna raziskovalna
vprašanja izhajajo iz predhodnje opisane raziskovalne vrzeli v zvezi z odnosom med pojmom
destinacijske znamke in konkurenčnosti. Cilj te disertacije je podati odgovore na naslednja
raziskovalna vprašanja:
RQ1: Kaj so dejavniki in modeli konkurenčnosti destinacij?
RQ1A: To raziskovalno vprašanje bomo odgovorili v obliki pregleda literature.
RQ2: Kako lahko izmerimo destinacijsko konkurenčnost?
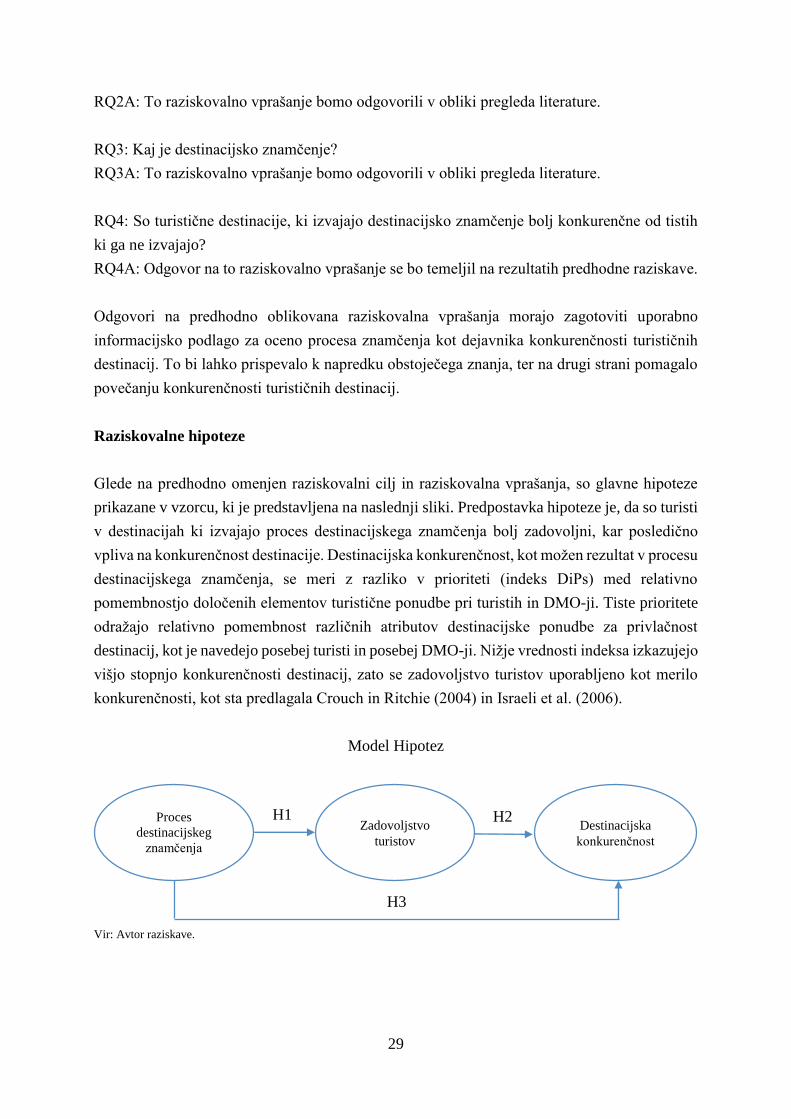
29
RQ2A: To raziskovalno vprašanje bomo odgovorili v obliki pregleda literature.
RQ3: Kaj je destinacijsko znamčenje?
RQ3A: To raziskovalno vprašanje bomo odgovorili v obliki pregleda literature.
RQ4: So turistične destinacije, ki izvajajo destinacijsko znamčenje bolj konkurenčne od tistih
ki ga ne izvajajo?
RQ4A: Odgovor na to raziskovalno vprašanje se bo temeljil na rezultatih predhodne raziskave.
Odgovori na predhodno oblikovana raziskovalna vprašanja morajo zagotoviti uporabno
informacijsko podlago za oceno procesa znamčenja kot dejavnika konkurenčnosti turističnih
destinacij. To bi lahko prispevalo k napredku obstoječega znanja, ter na drugi strani pomagalo
povečanju konkurenčnosti turističnih destinacij.
Raziskovalne hipoteze
Glede na predhodno omenjen raziskovalni cilj in raziskovalna vprašanja, so glavne hipoteze
prikazane v vzorcu, ki je predstavljena na naslednji sliki. Predpostavka hipoteze je, da so turisti
v destinacijah ki izvajajo proces destinacijskega znamčenja bolj zadovoljni, kar posledično
vpliva na konkurenčnost destinacije. Destinacijska konkurenčnost, kot možen rezultat v procesu
destinacijskega znamčenja, se meri z razliko v prioriteti (indeks DiPs) med relativno
pomembnostjo določenih elementov turistične ponudbe pri turistih in DMO-ji. Tiste prioritete
odražajo relativno pomembnost različnih atributov destinacijske ponudbe za privlačnost
destinacij, kot je navedejo posebej turisti in posebej DMO-ji. Nižje vrednosti indeksa izkazujejo
višjo stopnjo konkurenčnosti destinacij, zato se zadovoljstvo turistov uporabljeno kot merilo
konkurenčnosti, kot sta predlagala Crouch in Ritchie (2004) in Israeli et al. (2006).
Model Hipotez
Vir: Avtor raziskave.
H1 H2 Destinacijska
konkurenčnost
Proces
destinacijskeg
znamčenja
Zadovoljstvo
turistov
H3
30
Glede na prej omenjeno so tri glavne hipoteze:
H1: Proces destinacijskega znamčenja je pozitivno povezan z zadovoljstvom turistov.
H2: Zadovoljstvo turistov je pozitivno povezana z destinacija konkurenčnost.
H3: Proces destinacijskega znamčnja je pozitivno povezan z destinacija konkurenčnost.
Raziskovalna metodologija
Uporabljene sta bile dve osnovni raziskovalni metodi – pregledna raziskava in preiskovalna
raziskava.
„Pregledna“ raziskava je vključevala pregled trenutne literature v področju ciljne
konkurenčnosti in destinacijskega znamčenja, kot tudi sekundarno analizo podatkov.
Analizirani so bili različni znanstveni in strokovni članki, ki pokrivajo različne vidike
konkurenčnosti destinacije in blagovno znamko destinaciej. Revije ki so se najpogosteje
uporabljale kot vir za izdelavo pregleda literature:
• Acta Turistica,
• Annals of Tourism Research,
• Current Issues in Tourism,
• International Journal of Contemporary Hospitality Management,
• Journal of Brand Management,
• Journal of Hospitality and Tourism Management,
• Journal of Hospitality and Tourism Technology,
• Journal of Travel Research,
• Journal of Vacation Marketing,
• Place Branding and Public Diplomacy,
• Tourism Economics
• Tourism Management,
• Tourism Review, and
• Tourism - An International Interdisciplinary Journal.
Poleg omenjenih znanstvenih revij, so bili uporabljeni tudi različne knjig in učbeniki, ki
pokrivajo teme povezane s destinacijskim upravljanjem v turizmu, destinacijskim trženjem ter
trženjem destinacijske blagovne znamke, za oblikovanje:
Raziskovalnih ciljev in raziskovalnih vprašanj,
Raziskovalnih hipotez,
Raziskovalnih metodologij in
Metodame interpretacij in podajanja raziskovalnih rezultatov.
31
Sekundarna analiza podatkov vključuje podatke zbrane v TOMAS, poletni anketi o stališčih in
izdatkih turistov v hrvaških obmorskih destinacij (Institut za turizam, Zagreb, 2010). Raziskava
je bila izvedena na vzorcu od 4.973 anketirancev vprašanih v 85 obmorskih destinacij na
Hrvaškem, na vrhuncu turistične sezone, od sredine Junija do konca Septembra leta 2010. Ta
disertacija je izkoristila del tehpodatkov. Zlasti so bili uporabljeni podatki o turističnem
zadovoljstvu z različnimi elementi turistične ponudbe destinacij in podatki o pomenu (vplivu)
posameznih elementov turistične ponudbe na izbir destinacij. Zadovoljstvo turistov je merjeno
na petstopenjski Likertovi lestvici (1 = zelo slabo in 5 = odlično), medtem ko je bil pomen
izbora destinacij izmerjen na šeststopenjski Likertovi lestvici (1 = popolnoma nepomembno in
6 = zelo pomembno).
Podatki zbrani s pomočjo primarne kot sekundarne raziskave so bili uporabljeni za oceno
znamčenja kot dejavnika konkurenčnosti destinacij. Predhodna raziskava se je osredotočila na
zbiranje podatkov iz DMO-jev turističnih destinacij, ki so bile vključene v raziskavo TOMAS
Summer Survey 2010. Orodje primarnega zbiranja podatkov je bil spletni vprašalnik v
hrvaškem jeziku (glej angleški prevod v Dodatku 1), distribuiran s pomočjo raziskovalnega
orodja QuestionPro. Raziskava je bila izvedena v obdobju od Februarja do Marca 2013. Od
skupno 85 turističnih destinacij, navedenih v tabeli 3, jih je 39 odgovorila na vprašalnik, z
stopnjo odzivnosti 46%. Glede na ugotovitve Shih in Fan (2007) o okvirnih odzivnostih spletnih
anket, je mogoče sklepati da je stopnja odziva 46% nad povprečno stopnja odziva.
Glavni cilj zbiranja primarnih podatkov je bil pridobiti boljši vpogled v proces razvoja
destinacijskega znamčenja, s poudarkom na opredelitvi potencialnih ciljnih skupin,
konkurenčnost in SWOT analiza, opredelitev vizije in vzpostavitec blagovne znamke destinacij,
ter integracijo in komunikacijo. Podatki so zbrani kot dihotomne spremenljivke (Da / Ne) ali
merjeni na petstopenjski Likertovi lestvici (1 = popolnoma se ne strinjam in 5 = popolnoma se
strinjam). Zadnje vprašanje je vključilo oceno relativnega pomena 12 različnih elementov
ponudbe destinacij za konkurenčnost destinacije (ovrednoteno tudi od turisti v TOMAS
Summer Survey 2010), ki so ocenjene v razponu od najpomembnejše do najmanj pomembne.
Glavne ugotovitve raziskave
Glavni cilj raziskave je bilo raziskati, ali destinacijsko znamčenje kot relativno nov koncept v
teoriji in praksi turizma, vpliva na konkurenčnosti destinacij. Ta smer razmišljanja temelji na
predpostavki, da je eden od pomembnih virov konkurenčne prednosti destinacij njena tržna
edinstvenost in prepoznavnost, ki jo je mogoče doseči s procesom znamčenja destinacij.
Čeprav so bili različni dejavniki in atributi konkurenčnosti destinacije in znamčenja destinacije
natančno raziskani in dokumentirani v celotni turistični literaturi, celovit in splošno sprejet
32
teoretski okvir ki bi povezal pojme blagovne znamke destinacij in konkurenčnosti destinacij,
klub temu še vedno ni bil razvit. Kot je ugotovljeno v pregledu literature, je pomanjkanje znanja
in razumevanja o vlogi ki jo ima blagovna znamka destinacijske v procesu doseganja
konkurenčnost destinacije. To predstavlja pomembno raziskovalno vrzel, ki je bila predmet
raziskovanja v disertaciji. Da smo pridobili dodaten upgled v razumevanje kompleksnega
odnosa med trženjem blagovne znamke destinacije in konkurenčnostjo destinacije, smo
uporabili izbrane Hrvaške obmorske turistične destinacije kot študijo primera.
Čeprav odnos med konkurenčnostjo destinacij in destinacijskim znamčenjem ni jasno opisan,
je vseeno delno omenjen v dveh najbolj znanih modelih destinacijske konkurenčnosti – splošni
model konkurenčnosti destinacije, ki so ga predlagali Ritchie in Crouch (2003) in v celovitem
modelu destinacijske konkurenčnost ki so ga predlagali Dwyer in Kim (2003). V Ritchie in
Crouch modelu je pozicioniranje / znamčenje del destinacijske politike, načrtovanja in razvojne
komponente, medtem ko Dwyer in Kim navajata razpznavnost, pozicioniranje in podobo
destinacije kot dejavnike ki vplivajo na konkurenčnost destinacije, vendar ne navajata
znamčenja destinacij neposredno.
Trije od štirih prvotno oblikovanih raziskovalnih vprašanj so bili analizirani na podlagi
podatkov zbranih s pomočjo pregleda literature. Ta vprašanja so: (i) „Kaj so dejavniki in modeli
konkurenčnosti destinacij?“, (ii) „Kako lahko izmerimo destinacijsko konkurenčnost?“ In (iii)
„Kaj je destinacijsko znamčenje?“. Odgovor na četrto raziskovalno vprašanje je pridobljeno s
statistično analizo podatkov, zbranih s pomočjo predhodne raziskave. To vprašanje je: „ So
turistične destinacije, ki izvajajo destinacijskoznamčenje bolj konkurenčne od tistih ki ga ne
izvajajo?“. V raziskavi je sodelovalo skupno 39 destinacij ali 46% vseh destinacij ki jim je bil
poslan vprašalnik. Rezultati raziskav so pokazali, da imata dve tretjini (67%) anketiranih
destinacijnekakšen strateški dokument načrtovanja, medtem ko je bila strategija znamčenja
zastopana v vseh destinacijah, ki so imeli oblikovan strateški dokument.
Da bi preverili hipotezo H1: Proces destinacijskega znamčenja je pozitivno povezan z
zadovoljstvom turistov, smo uporabili 12 pomožnih hipotez (H1A-H1l). Metoda glavnih
komponent (PCA) je bila uporabljena na skupini ciljnih kazalnikov procesa znamčenja, da bi
obravnavali njihovo temeljno strukturo v manjšem številu dejavnikov. Analiza IPA, vključno s
hi-kvadrat testom, in GEE model so bili uporabljeni, da bi ocenili učinke procesa znamčenja na
zadovoljstvo turistov. Analiza učinkov procesa znamčenja na zadovoljstvo turistov, ki je
merjena z oceno razmerja treh dejavnikov procesa znamčenja na 12 elementiih ponudbe
destinacije (12 pomožnih hipotez), kaže da je turistično zadovoljstvo s ponudbo destinacij višje
v destinacij z boljšim izvajanjem elementov procesa znamčenja, kar potrjuje hipotezo H1.
Da bi preverili hipotezo H2: Zadovoljstvo turistov je pozitivno povezana z destinacija
konkurenčnost, smo uporabili 12 pomožnih hipotez (H2a-H2l). Turistično zadovoljstvo je bilo
33
ocenjeno z uporabo IPA analize, oziroma zadovoljstvo turista z določenimi atributi destinacij
je bila v primerjana z njihovimi pričakovanji (pomembnosti tega atributa). Na drugi strani pa je
bila izračunana razlika v prioriteti (DiPs Indeks) med DMO-jev in turisti, ki ga je mogoče
razlagati kot sposobnost turistične destinacije za prepoznavanje in zadovoljevanje potreb in
želja svojih obiskovalcev. Vrednost indeksa bližje 0 izkazuje večjo sposobnost destinacij pri
prepoznavanju in zadovoljenju potreb svojih obiskovalcev, saj je zaradi tega destinacija
uspešnejša oziroma bolj konkurenčna. Na temelju rezultatov IPA analize s hi-kvadrat testom in
Gee modela je bilo ugotvljeno, da je turistično zadovoljstvo s ponudbo destinacij višja v
destinacijeh z manjšimi vrednostmi DiPs indeksa. Z drugimi besedami, destinacije z višjo
stopnjo zadovoljstva turistov bodo uspešnejše in zato bolj konkurenčne, kar potrjuje hipotezo
H2.
Končno, da bi preučili hipotezo H3: Proces destinacijskega znamčnja je pozitivno povezan z
destinacija konkurenčnost, je bilo uporabljeno sedem pomožnih hipotez (H3a-H3G). Testirani
so bili učinki kazalnikov procesa znamčenja na uspešnost DMO. Vsi analizirani kazalniki
proces znamčenja (poleg SWOT in analize konkurenčnosti) so izkazali pozitiven odnos z
uspešnosti DMO-jev. Da bi se konsolidiralaaktivnost destinacijskega znamčenja v enoten
agregiran kazalnik, je bil osnovan nov kazalnik procesa znamčenja (BiPs indeks). BiPs indeks
uteženopovprečje vseh dejavnikov vključenih v proces znamčenja destinacije. Uteži so bile
določene na podlagi relativnega pomena teh dejavnikov na ciljno konkurenčnost, merjena kot
DIPS indeks. Koeficient korelacije med vrednostmi DiPs indeksa in mejnih prehodov indeksov,
merjeno s Spearmanovim korelacijskim koeficientom je bila značilna (p = 0,011) in pozitivna
(r = 0,403). Zato je mogoče sklepati, da bo imela destinacija z boljšim znamčenjem boljšo
zmogljivost in bila bolj konkurenčna, kar potrjuje hipotezo H3.
Znanstven prispevek in prispevek k vodenju
Glede na rezultate raziskave, je bilo ugotovljeno da znamčenje destinacij pomembno vpliva na
stopnjo konkurenčnosti destinacij. Zato upoštevamo da je pomemben napredek pri razvoju
teorije področju destinacijske blagovne znamke in konkurenčnosti razširitev obstoječih
modelov konkurenčnosti destinacije z procesom znamčenja destinacij. Ob upoštevanju večanja
števila turističnih destinacij s podobnimi vir ponudbe, promocijskimi cilji, terenakeimi tržne
segmente, postane jasno, da bo jasna opredelitev glavnih blagovne znamke destinacije postala
nujno potrebna za ohranjanje konkurenčnosti v prihodnosti. Obiskovalci se pogosto sprašujejo,
zakaj bi izbrali en cilj namesto drugega, če vsi imajo podoben turistični produkt kot tudi druge
elemente trženjskega spleta (cena, kraj in promocija). Zato je znamka turistične destinacije
element ki naj bi ustvaril čustveno vez med destinacijo in potencialnim obiskovalcem in
prebudil „občutek destinacije“, ki vodi k končni izbiri te določene destinacije.
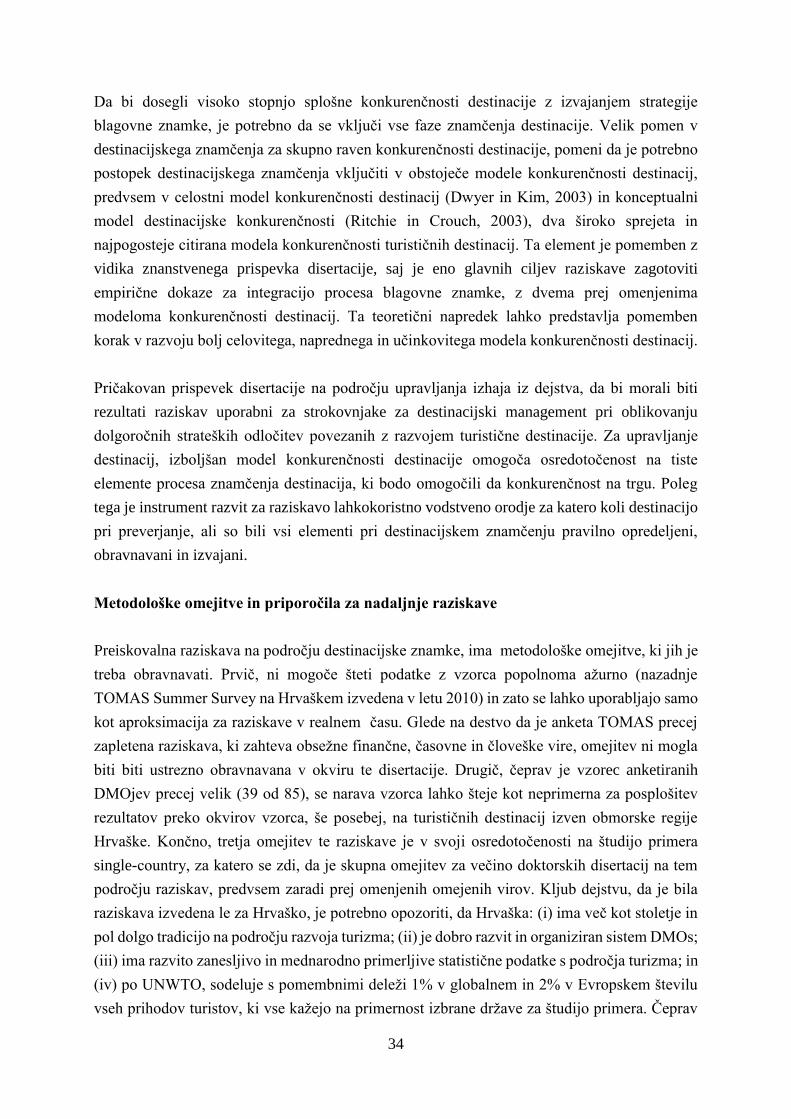
34
Da bi dosegli visoko stopnjo splošne konkurenčnosti destinacije z izvajanjem strategije
blagovne znamke, je potrebno da se vključi vse faze znamčenja destinacije. Velik pomen v
destinacijskega znamčenja za skupno raven konkurenčnosti destinacije, pomeni da je potrebno
postopek destinacijskega znamčenja vključiti v obstoječe modele konkurenčnosti destinacij,
predvsem v celostni model konkurenčnosti destinacij (Dwyer in Kim, 2003) in konceptualni
model destinacijske konkurenčnosti (Ritchie in Crouch, 2003), dva široko sprejeta in
najpogosteje citirana modela konkurenčnosti turističnih destinacij. Ta element je pomemben z
vidika znanstvenega prispevka disertacije, saj je eno glavnih ciljev raziskave zagotoviti
empirične dokaze za integracijo procesa blagovne znamke, z dvema prej omenjenima
modeloma konkurenčnosti destinacij. Ta teoretični napredek lahko predstavlja pomemben
korak v razvoju bolj celovitega, naprednega in učinkovitega modela konkurenčnosti destinacij.
Pričakovan prispevek disertacije na področju upravljanja izhaja iz dejstva, da bi morali biti
rezultati raziskav uporabni za strokovnjake za destinacijski management pri oblikovanju
dolgoročnih strateških odločitev povezanih z razvojem turistične destinacije. Za upravljanje
destinacij, izboljšan model konkurenčnosti destinacije omogoča osredotočenost na tiste
elemente procesa znamčenja destinacija, ki bodo omogočili da konkurenčnost na trgu. Poleg
tega je instrument razvit za raziskavo lahkokoristno vodstveno orodje za katero koli destinacijo
pri preverjanje, ali so bili vsi elementi pri destinacijskem znamčenju pravilno opredeljeni,
obravnavani in izvajani.
Metodološke omejitve in priporočila za nadaljnje raziskave
Preiskovalna raziskava na področju destinacijske znamke, ima metodološke omejitve, ki jih je
treba obravnavati. Prvič, ni mogoče šteti podatke z vzorca popolnoma ažurno (nazadnje
TOMAS Summer Survey na Hrvaškem izvedena v letu 2010) in zato se lahko uporabljajo samo
kot aproksimacija za raziskave v realnem času. Glede na destvo da je anketa TOMAS precej
zapletena raziskava, ki zahteva obsežne finančne, časovne in človeške vire, omejitev ni mogla
biti biti ustrezno obravnavana v okviru te disertacije. Drugič, čeprav je vzorec anketiranih
DMOjev precej velik (39 od 85), se narava vzorca lahko šteje kot neprimerna za posplošitev
rezultatov preko okvirov vzorca, še posebej, na turističnih destinacij izven obmorske regije
Hrvaške. Končno, tretja omejitev te raziskave je v svoji osredotočenosti na študijo primera
single-country, za katero se zdi, da je skupna omejitev za večino doktorskih disertacij na tem
področju raziskav, predvsem zaradi prej omenjenih omejenih virov. Kljub dejstvu, da je bila
raziskava izvedena le za Hrvaško, je potrebno opozoriti, da Hrvaška: (i) ima več kot stoletje in
pol dolgo tradicijo na področju razvoja turizma; (ii) je dobro razvit in organiziran sistem DMOs;
(iii) ima razvito zanesljivo in mednarodno primerljive statistične podatke s področja turizma; in
(iv) po UNWTO, sodeluje s pomembnimi deleži 1% v globalnem in 2% v Evropskem številu
vseh prihodov turistov, ki vse kažejo na primernost izbrane države za študijo primera. Čeprav

35
imajo podatki uporabljeni v tej raziskavi nekatere omejitve, se lahko štejejo za zanesljive in
primerne za teoretični razvoj pri merjenju konkurenčnosti turistične destinacije in preizkušanje
domnev za oblikovanje končnih skleov.
Empirična raziskava na področju povezovanja konceptov znamčenja destinacij s
konkurenčnostjo turističnih destinacij, ki je bila osrednja tema v tej disertaciji, je pokazala
večdimenzionalno strukturo matrike konkurenčnosti turistične destinacije. Po drugi strani, je
znamčenje turistične destinacije splošno priznano in sprejeto kot eden od ključnih vidikov
vodenja turistične konkurenčnosti destinacije na trgu. Zaradi tega ni presenetljivo, da so
konkurenčnost turistične destinacije in znamčenje destinacije vedno bolj pomembna
raziskovalna področja znanstvenikov in strokovnjakov, ki si prizadevajo da bi našli najbolj
učinkovit model načrtovanja in upravljanja turistične destinacije. Zato obstajajo priporočila za
nadaljnje raziskave na tem področju. Da bi izboljšali zunanjo veljavnost rezultata, bi bilo
potrebno preveriti rezultate, ocene in sklepe iz te raziskave na večjih in bolj raznolikih vzorcih,
ki bi moral vključevati tudi druge regije in države. Na podlagi empiričnih rezultatov v tej
disertaciji, ki potrjuje pozitiven odnos med znamčenjem destinacije in konkurenčnostjo
destinacije, lahko prihodnje raziskave razisščejo preostale ključne elemente in vidike, ki bodo
okrepile položaj pojma destinacijsko znamčenje v literaturi znanja o modeliranju
konkurenčnosti turističnih destinacij.