Embed Size (px)
Citation preview
Destination 8: The Pleiades
1. A Place Without Night
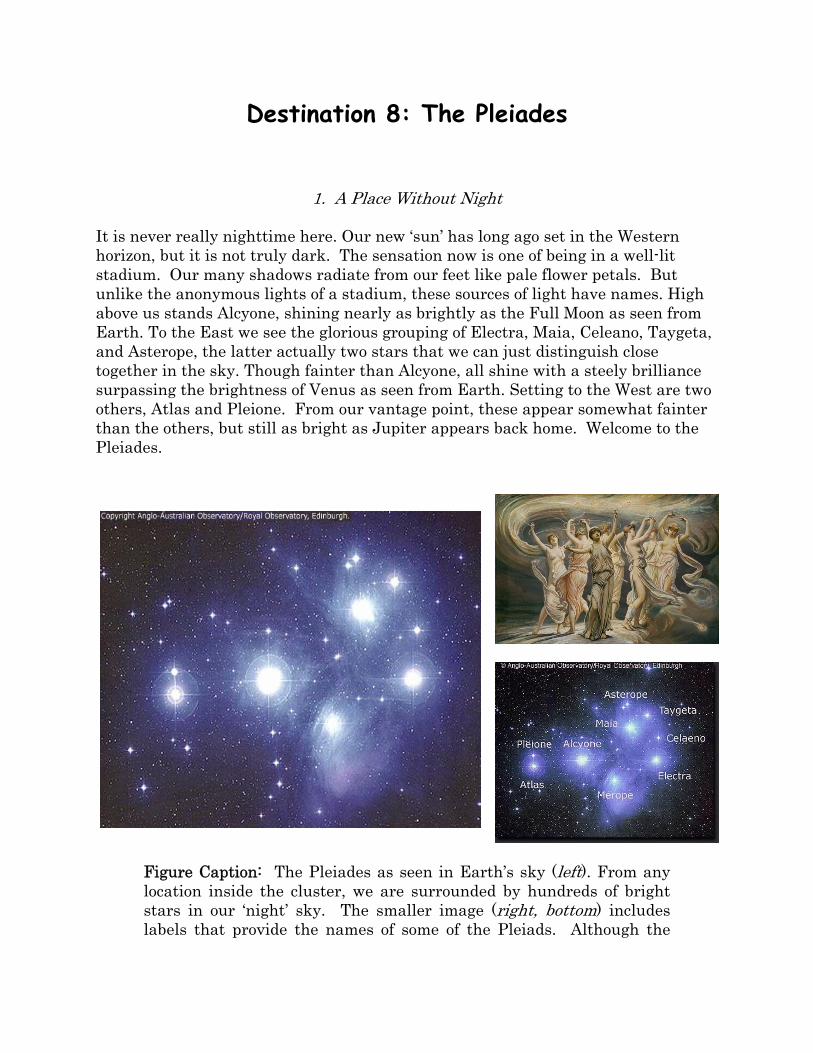
It is never really nighttime here. Our new ‘sun’ has long ago set in the Western horizon, but it is not truly dark. The sensation now is one of being in a well-lit stadium. Our many shadows radiate from our feet like pale flower petals. But unlike the anonymous lights of a stadium, these sources of light have names. High above us stands Alcyone, shining nearly as brightly as the Full Moon as seen from Earth. To the East we see the glorious grouping of Electra, Maia, Celeano, Taygeta, and Asterope, the latter actually two stars that we can just distinguish close together in the sky. Though fainter than Alcyone, all shine with a steely brilliance surpassing the brightness of Venus as seen from Earth. Setting to the West are two others, Atlas and Pleione. From our vantage point, these appear somewhat fainter than the others, but still as bright as Jupiter appears back home. Welcome to the Pleiades.
Figure Caption: The Pleiades as seen in Earth’s sky (left). From any location inside the cluster, we are surrounded by hundreds of bright stars in our ‘night’ sky. The smaller image (right, bottom) includes labels that provide the names of some of the Pleiads. Although the
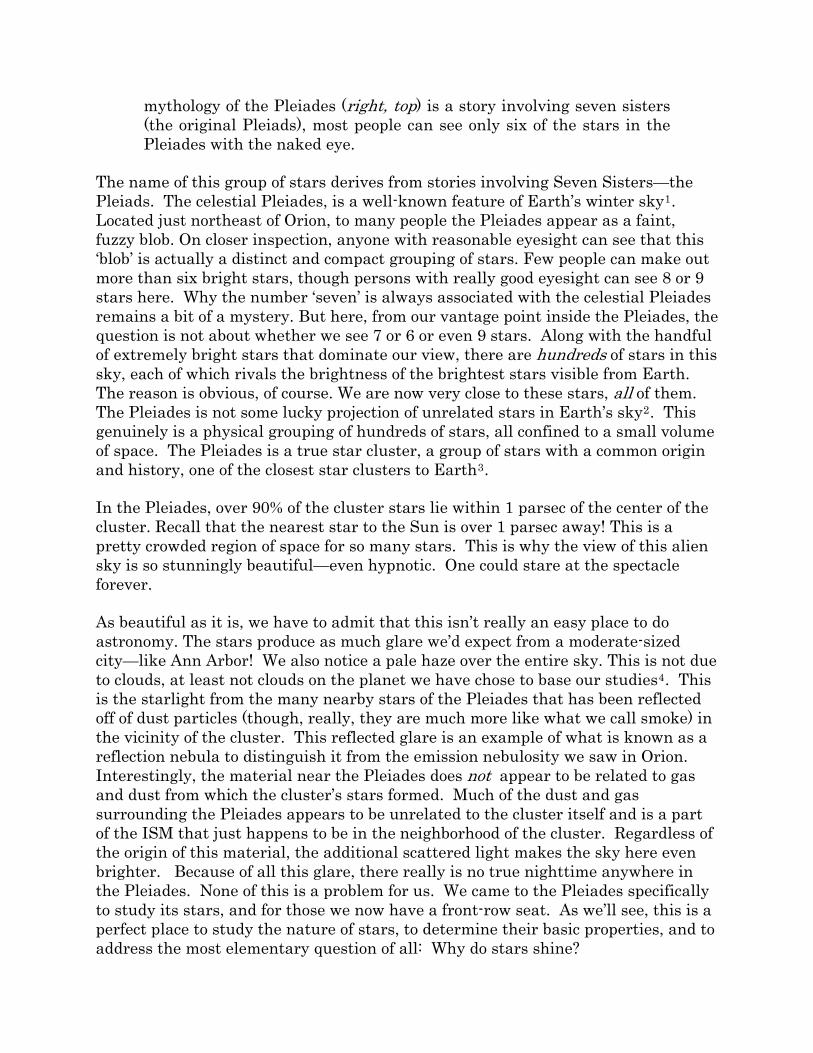
mythology of the Pleiades (right, top) is a story involving seven sisters (the original Pleiads), most people can see only six of the stars in the Pleiades with the naked eye.
The name of this group of stars derives from stories involving Seven Sisters—the Pleiads. The celestial Pleiades, is a well-known feature of Earth’s winter sky1. Located just northeast of Orion, to many people the Pleiades appear as a faint, fuzzy blob. On closer inspection, anyone with reasonable eyesight can see that this ‘blob’ is actually a distinct and compact grouping of stars. Few people can make out more than six bright stars, though persons with really good eyesight can see 8 or 9 stars here. Why the number ‘seven’ is always associated with the celestial Pleiades remains a bit of a mystery. But here, from our vantage point inside the Pleiades, the question is not about whether we see 7 or 6 or even 9 stars. Along with the handful of extremely bright stars that dominate our view, there are hundreds of stars in this sky, each of which rivals the brightness of the brightest stars visible from Earth. The reason is obvious, of course. We are now very close to these stars, all of them. The Pleiades is not some lucky projection of unrelated stars in Earth’s sky2. This genuinely is a physical grouping of hundreds of stars, all confined to a small volume of space. The Pleiades is a true star cluster, a group of stars with a common origin and history, one of the closest star clusters to Earth3.
In the Pleiades, over 90% of the cluster stars lie within 1 parsec of the center of the cluster. Recall that the nearest star to the Sun is over 1 parsec away! This is a pretty crowded region of space for so many stars. This is why the view of this alien sky is so stunningly beautiful—even hypnotic. One could stare at the spectacle forever.
As beautiful as it is, we have to admit that this isn’t really an easy place to do astronomy. The stars produce as much glare we’d expect from a moderate-sized city—like Ann Arbor! We also notice a pale haze over the entire sky. This is not due to clouds, at least not clouds on the planet we have chose to base our studies4. This is the starlight from the many nearby stars of the Pleiades that has been reflected off of dust particles (though, really, they are much more like what we call smoke) in the vicinity of the cluster. This reflected glare is an example of what is known as a reflection nebula to distinguish it from the emission nebulosity we saw in Orion. Interestingly, the material near the Pleiades does not appear to be related to gas and dust from which the cluster’s stars formed. Much of the dust and gas surrounding the Pleiades appears to be unrelated to the cluster itself and is a part of the ISM that just happens to be in the neighborhood of the cluster. Regardless of the origin of this material, the additional scattered light makes the sky here even brighter. Because of all this glare, there really is no true nighttime anywhere in the Pleiades. None of this is a problem for us. We came to the Pleiades specifically to study its stars, and for those we now have a front-row seat. As we’ll see, this is a perfect place to study the nature of stars, to determine their basic properties, and to address the most elementary question of all: Why do stars shine?
We have paid a price in humility to get here. From the Pleiades—about 150 pc or about 500 light-years from Earth—the Sun now appears so faint that it is completely invisible to the naked eye. We would now need a good pair of binoculars to see our home star shining weakly through the glare of our new, dazzling neighbors. More than ever before it is starkly clear to us that the Sun is just one star, not even a particularly prominent one, among the myriad around us. Our home has never looked smaller, yet we have only just begun our travels.
2. The Stars of the Pleiades Cluster
The fact that the a cluster like the Pleiades exists at all is perhaps not so surprising. In Orion (Destination 6) we found a strong concentration of star-forming regions—the dark, compact molecular clouds—all confined to a pretty small volume of space. It’s not hard to imagine that those regions and the visible stars in the nebula were in the process of forming a cluster, perhaps one similar to the Pleiades. The very first star we visited beyond the Sun—Alpha Cen (Destination 4)—was a member of a triple system. Even the Sun and 51 Peg have moderately massive companions in the form of planets (Jupiter and 51 Peg b, respectively). For whatever reason, it appears that stars congregate into groups with other stars or relatively massive planets.
As we study the many stars here in the Pleiades, we begin to appreciate that these stars possess some surprising systematic characteristics, some of which we had hints of from our earlier voyages. The brightest Pleiads—including many of the ones named above—are all blue stars. Since we carefully surveyed the cluster on our arrival, we know the individual distances to each star. Combining that information with the observed brightness of each star (their ‘observed flux’ to use the more technical term), we can infer their luminosities as described in Destination 7. When we do this we find that the blue stars are not only generally quite bright in our sky, they are also the most luminous stars of the cluster. At the other extreme we discover that most of the faint stars in the sky are considerably redder in appearance. Again, this is no illusion. When we determine their luminosities we find that these stars generally have very low luminosities. The overall trend is clear. Luminous stars in the Pleiades are blue, while stars with low luminosities are red. We can even measure the colors of the stars by taking the ratio of the brightness of the red and blue light that they emit5. In this way we can more precisely define and compare the colors of different stars.
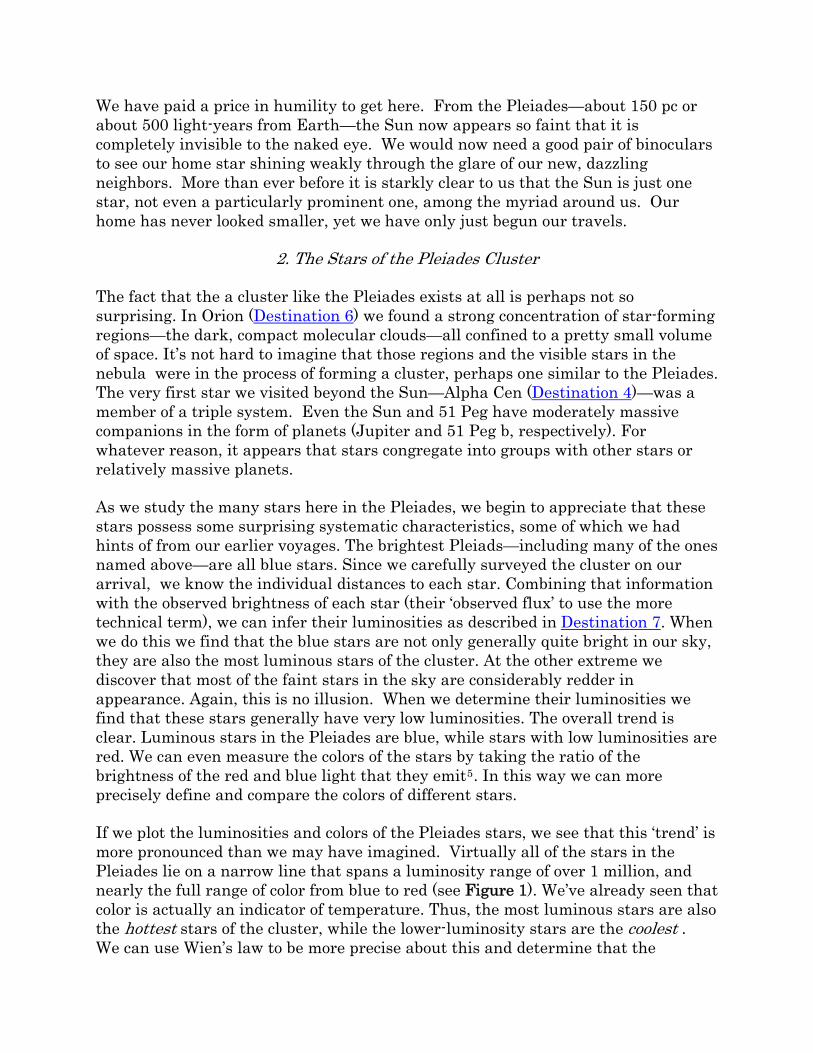
If we plot the luminosities and colors of the Pleiades stars, we see that this ‘trend’ is more pronounced than we may have imagined. Virtually all of the stars in the Pleiades lie on a narrow line that spans a luminosity range of over 1 million, and nearly the full range of color from blue to red (see Figure 1). We’ve already seen that color is actually an indicator of temperature. Thus, the most luminous stars are also the hottest stars of the cluster, while the lower-luminosity stars are the coolest . We can use Wien’s law to be more precise about this and determine that the
temperatures of the stars in the Pleiades range from about 18000 K at the hot end, to well under 2000 K for the ‘coolest’ known stars of the cluster.
Figure 1 Caption: A plot of the luminosities (y-axis) and colors (x-axis) of the stars in the Pleiades. This plot is a variant of the H-R Diagram. Notice that there is a very strong relationship between luminosity (increasing upward) and color (redder to the right). The main sequence seen here is known as the, uh, ‘Main Sequence’ and is where most stars spend most of their lives. The specific axes shown in this diagram are in technical astronomical units. The key point is that the stars in the cluster exhibit a range of over a factor of one million in luminosity, and over a factor of ten in temperature.
This very simple plot of the luminosities and colors of stars is so important that was named after the two astronomers who first used it: Enjar Hertzsprung and Henry Norris Russell. Consequently, this plot is often referred to as the H-R Diagram. The clear sequence of stars in the H-R Diagram also has a name: the ‘Main Sequence’. Not too imaginative but at least it is pretty accurately descriptive. We will discover that about 90% of all stars anywhere can be found on the Main Sequence at any given time. For example, the Sun’s luminosity and color place it solidly on the Main Sequence. And it has been on the Main Sequence for a very long time; it will remain on the Main Sequence for a long time to come6.
The H-R Diagram turns out to be one of the most useful tools in understanding stars, and we’ll return to it many times as we try to understand the stellar properties at future destinations. However, we can start to appreciate its usefulness
by noting that we can use the H-R Diagram to figure out how big stars are. To understand this rather odd claim, recall that the total luminosity of a star is related to its size—more specifically, its surface area—and to its surface flux through the relation
L = Area Surface Flux .
For spherical stars (and we are very well justified in assuming that most stars are mostly spherical in shape), we know that the surface area equals 4 , so that part’s easy. But what about the surface flux? In general, this term is hard to calculate using the techniques we’ve discuss so far. And since it is impossible to stand on the ‘surface’ of any star, it is essentially impossible to measure the surface flux directly.
But we can make another crucial assumption that helps us estimate the surface flux pretty precisely. Remember that we’ve already noted that it is safe to use Wien’s law (from Destination 6) to estimate the temperatures of stars based on the wavelength where the peak radiation is emitted in their spectrum. Stars with spectra that peak in the blue are hotter than stars whose spectra peak at redder wavelengths. This is a bit of a cheat, since, strictly speaking, Wien’s law applies to thermal emission sources. We’ve already seen that stars do not emit radiation in exactly the same way as thermal sources, but our assumption here is to pretend that they do. It turns out that for most stars, their continuous spectra actually do mimic the spectrum of thermal source reasonably well. This suggests that we can treat them as if they were true thermal sources and not be too far wrong. We can then take advantage of a fundamental property of thermal sources—Planck’s Law—that we discovered in Destination 6. That is, the surface flux of a thermal source is given by the remarkably simple relation
.
If this can truly be applied to stars—and it really generally is not at all a bad approximation—then we can comb us relations to calculate a star’s luminosity as
ine these vario
4 .
What’s great about this is that when we plot a star in the H-R Diagram we must know its luminosity and temperature. But if we know these, this equation tells us that we also know the radius of the star! We can see this most clearly by rearranging the terms in the last equation to so for the star’s radius to get lve
4
/
.
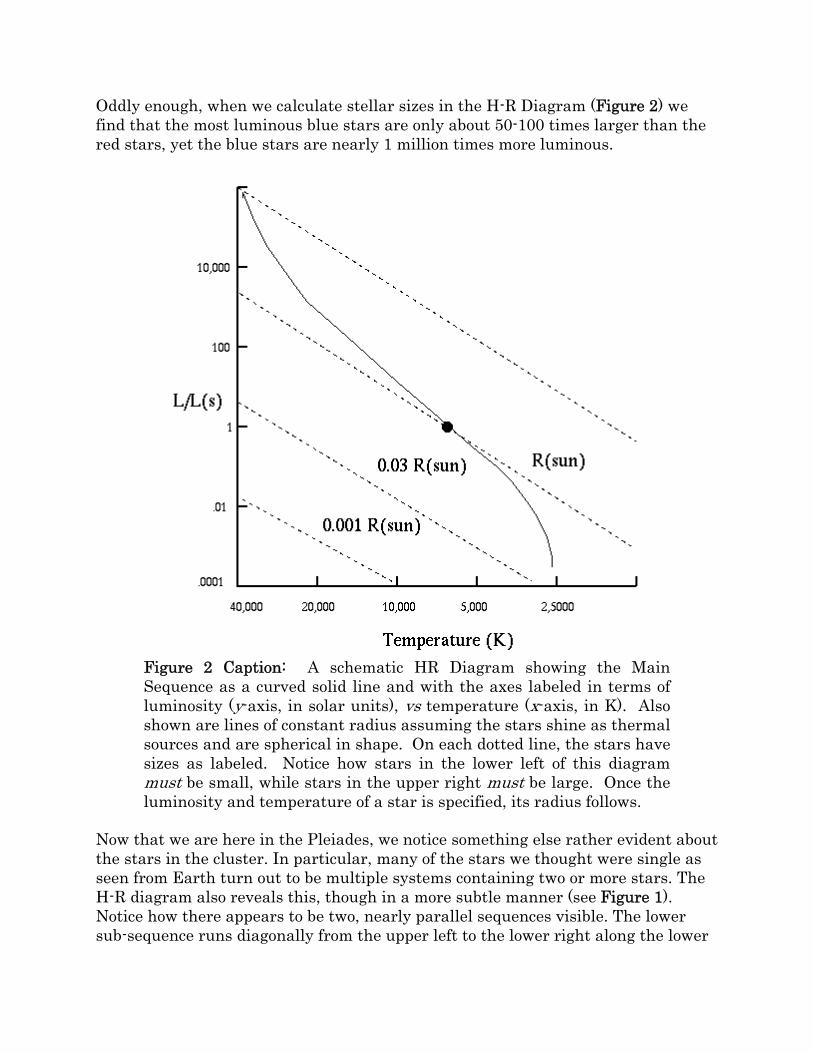
Oddly enough, when we calculate stellar sizes in the H-R Diagram (Figure 2) we find that the most luminous blue stars are only about 50-100 times larger than the red stars, yet the blue stars are nearly 1 million times more luminous.
Figure 2 Caption: A schematic HR Diagram showing the Main Sequence as a curved solid line and with the axes labeled in terms of luminosity (y-axis, in solar units), vs temperature (x-axis, in K). Also shown are lines of constant radius assuming the stars shine as thermal sources and are spherical in shape. On each dotted line, the stars have sizes as labeled. Notice how stars in the lower left of this diagram must be small, while stars in the upper right must be large. Once the luminosity and temperature of a star is specified, its radius follows.
Now that we are here in the Pleiades, we notice something else rather evident about the stars in the cluster. In particular, many of the stars we thought were single as seen from Earth turn out to be multiple systems containing two or more stars. The H-R diagram also reveals this, though in a more subtle manner (see Figure 1). Notice how there appears to be two, nearly parallel sequences visible. The lower sub-sequence runs diagonally from the upper left to the lower right along the lower
edge of the points that define the Main Sequence. But above this is a less distinct, parallel line of points. These points represent stars that are actually the combination of the light of two or more stars. From the number we see in the H-R diagram, binary stars must be relatively common. We also note that the spectra of other stars reveal evidence that two or more stars are present, either through the appearance of two distinct spectra mixed together, or because the Doppler effect causes the spectra to shift back and forth with time. Stars that appear single to the eye but reveal the fact that they are binaries through their spectra, are known as ‘spectroscopic binaries’. In other cases, we again may see only a single star, but the brightness periodically dips on a very regular basis. In these cases, two stars are again present and they occasionally pass in front of one another. These are known as ‘eclipsing binaries’ because the light varies due to these star-star eclipses7. Nearly all eclipsing binaries are known also to be spectroscopic binaries, but most spectroscopic binaries are not eclipsing systems. It takes some luck—you have to be in the right place relative to the orbit of the binary stars—to see an eclipse, while you can see a spectroscopic binary from a much wider range of viewing positions.
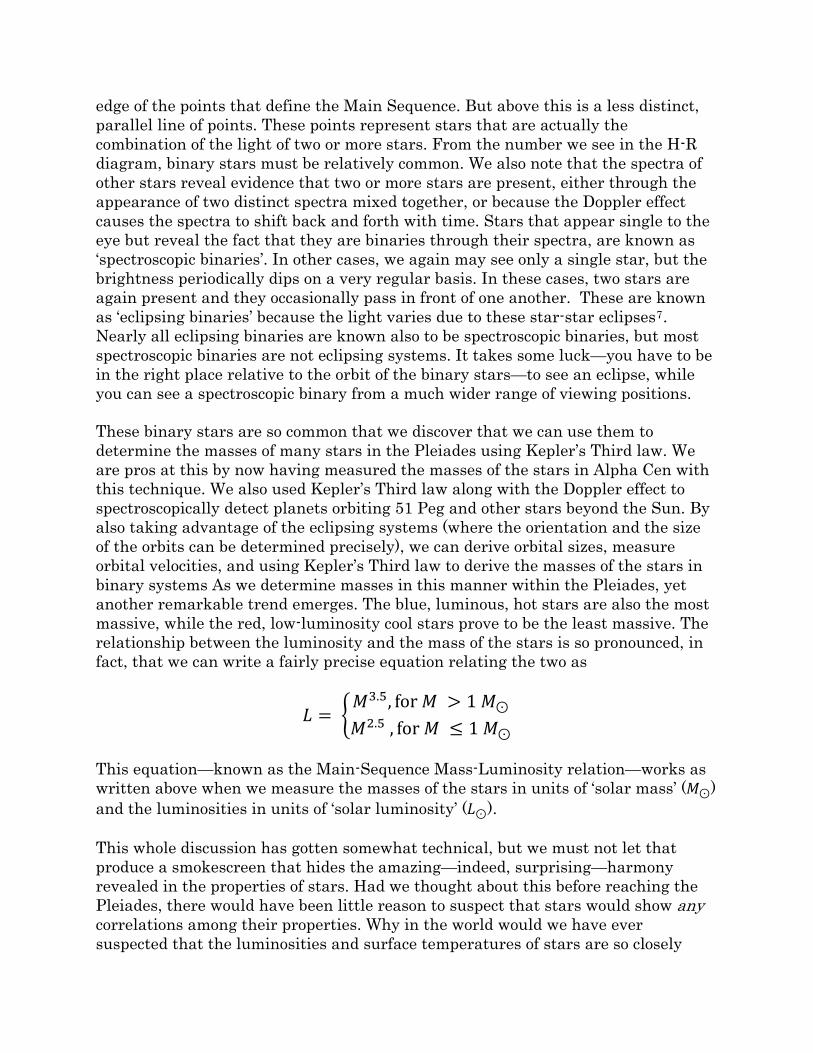
These binary stars are so common that we discover that we can use them to determine the masses of many stars in the Pleiades using Kepler’s Third law. We are pros at this by now having measured the masses of the stars in Alpha Cen with this technique. We also used Kepler’s Third law along with the Doppler effect to spectroscopically detect planets orbiting 51 Peg and other stars beyond the Sun. By also taking advantage of the eclipsing systems (where the orientation and the size of the orbits can be determined precisely), we can derive orbital sizes, measure orbital velocities, and using Kepler’s Third law to derive the masses of the stars in binary systems As we determine masses in this manner within the Pleiades, yet another remarkable trend emerges. The blue, luminous, hot stars are also the most massive, while the red, low-luminosity cool stars prove to be the least massive. The relationship between the luminosity and the mass of the stars is so pronounced, in fact, that we can write a fairly precise equation relating the two as
. , for 1 . , for 1
This equation—known as the Main-Sequence Mass-Luminosity relation—works as written above when we measure the masses of the stars in units of ‘solar mass’ ( ) and the luminosities in units of ‘solar luminosity’ ( ).
This whole discussion has gotten somewhat technical, but we must not let that produce a smokescreen that hides the amazing—indeed, surprising—harmony revealed in the properties of stars. Had we thought about this before reaching the Pleiades, there would have been little reason to suspect that stars would show any correlations among their properties. Why in the world would we have ever suspected that the luminosities and surface temperatures of stars are so closely
related that they define the Main Sequence that we see in the H-R Diagram? How could we have guessed that the masses of stars would vary smoothly from one end of the Main Sequence to the other? In fact, we could not have reasonably guessed this ahead of time. Nor could astronomers. Prior to the 1910’s, no one was able to foresee the intimate relationships between the basic properties of stars. Even when Hertzsprung and Russell opened the door, there was no way then to know what it all meant. But it did clearly say one thing that we too need to appreciate. The stellar characteristics we’ve discussed so far—luminosity, radius, surface temperature, and mass—are all closely coupled to one another, but one of these is likely to be the most influential parameter in determining the overall properties of an individual star. We’ll return to this issue a bit later on.
3. The Spectra of the Stars of the Pleiades Cluster
One of the benefits of spectroscopic observations of stars became particularly apparent when we visited 51 Peg and when we measured the masses of stars in the Pleiades. By measuring the changes in the wavelengths of absorption or emission lines in a star's spectrum, we could use the Doppler effect to infer the presence of a planet and estimate the masses of the planets or of the individual stars of a binary system. In this way we established that 51 Peg had a planet before we had even arrived to the system, and we determined the Main-Sequence Mass-Luminosity Relation. The key was to identify the absorption lines in the stellar spectra and then to patiently measure how those lines change their wavelength due to the Doppler effect over time. But why are these absorption lines present in stellar spectra in the first place? We've already seen how electron transitions within the relatively simple Hydrogen (H) atom can explain the presence of emission lines in the spectrum of the Orion Nebula. Can H tell us something useful about the nature of absorption lines seen in the spectra of stars? Keep in mind that H is a particularly useful choice for this purpose not only for its simplicity, but because we have already determined that it is the most common element in the interstellar medium (ISM). Since we know that stars form from the ISM, it stands to follow that stars probably contain a lot of H as well. So what do we observe that H absorption lines do in stellar spectra?
As expected, some of the Pleiades stars do indeed show very strong H absorption lines in their spectra. These lines are found at exactly the same wavelengths where we saw emission lines in the spectrum of the Orion Nebula and at the same wavelengths that we see Hydrogen emit in laboratories back on Earth. However, whereas the Hydrogen emission lines represent an enhancement of the brightness in the Orion spectrum at the wavelengths of the lines, absorption lines in the spectra of Pleiades stars are seen as deficiencies in the brightness of the light at the same wavelengths. Between the absorption lines, the spectrum very closely resembles the continuous spectrum typical of a thermal source. This helps explain why Wien's law works so well for stars and why the surface flux of a star is very similar to that of a thermal source: Most stars have very nearly continuous spectra, interrupted at certain wavelengths by absorption lines.
What’s strange is how the H absoprtion lines behave as we observe the spectra of other Pleiades stars:
The hottest stars in the cluster show little or almost no H lines in their spectra.
The coolest Pleiades stars likewise exhibit almost no H absorption.
Many of the stars with intermediate temperatures show very strong H absorption. Moreover, all of the stars that do show strong Hydrogen absorption have very nearly the same colors.
All other stars show a steady variation in the strength of the H lines. That is, stars just a bit hotter (bluer) than the stars with the strongest H lines exhibit weaker H absorption lines. The spectra of stars a bit cooler (redder) than these H-strong stars also exhibit weakened though still clearly visible H absorption.
This is really very strange. Up to now, all of the stellar properties have varied systematically along the Main Sequence. Temperature, mass, and luminosity either rise or fall from one end of the sequence to the other. A mathematician would call this ‘monotonic’ behavior. But the strength of the H absorption lines are decidedly not monotonic. These lines peak in stars with intermediate temperatures, luminosities and masses8, while stars located at the extreme ends of the Main Sequence—hot and high luminosity, or cool and low-luminosity—have spectra in which the H lines are virtually invisible.
We can see specific examples of this among the Pleiades stars we can see now above the horizon of this alien planet. To the East, we see Asterope 2; its spectrum is dominated by H absorption lines. But it is not the most luminous nor the hottest star in the cluster. That distinction belongs to Alcyone. Like Asterope 2, its spectrum shows clear H absorption lines, but these are significantly weaker than the Hydrogen lines seen in Asterope 2. One of the fainter red stars of the cluster—its name is HZ 1306—shines like a ruby in our sky. It is not bright like the blue Pleiades members, but it is clearly visible to the unaided eye from our location inside the cluster. Its spectrum contains a great many absorption lines—so many that it becomes harder to see the continuous spectrum—but the lines of H, though visible, are now noticeably weak. Can we explain the way the H absoprtion lines behave in these stars?
The secret is in the structure of the atoms that create the absorption lines. Recall from our investigations in the Orion Nebula that such lines are formed when an electron ‘jumps’ from one energy level to another. Recall also that these energy levels correspond to very specific electron orbits or spin states in the Hydrogen atom (this is true of all atoms, in fact, but Hydrogen is by far the easiest to understand). In the case of an emission line, the ‘jump’ is from a higher to lower energy level within the atom, and the excess energy is emitted as a photon which we see as an
emission line. But if the electron in a H atom is elevated to a larger, more energetic orbit, it must absorb energy. This energy may come from a collision with other atoms, or it may come from a photon of light that has a wavelength that precisely corresponds to the energy difference between the two orbits9. If the radiation is the source of the energy, then a photon is ‘lost’ to the radiation field and an observer far away will see that an absorption line is produced.
But what if there are very few or no photons around that can elevate the electron in a Hydrogen atom from the smallest orbit to even the next largest orbit? In this case all of the Hydrogen atoms remain in the so-called ‘ground’ state and no absorption lines are created! You can throw as many photons as you want at the atom, but if none are individually energetic enough, there will be no excitation of the atom, no absorption10. What about the other extreme? Imagine now that there are many photons interacting with an atom and that the photons are so energetic that they not only can excite the electron within a Hydrogen atom, but they supply sufficient energy to ionize the electron, stripping it completely from the atom. If the electrons have little or no chance of recombining with the bare H nucleus - perhaps because the density of the gas is low, or the number of energetic photons is very large - you would again see no absorption lines because the H atoms have no bound electrons. Between these extremes, conditions exist where there are a healthy number of photons that can excite the Hydrogen atoms but that do not ionize the atoms completely. Under these circumstances, these intermediate-energy photons will be efficiently absorbed by the H atoms. Wien's law tells us that hot thermal sources produce lots of energetic photons, photons that mostly ionize H. At the other extreme, cool thermal sources produce very few photons that can even excite H atoms. But intermediate-temperature thermal sources are ‘just right’, able to produce many photons that excite but do not ionize H, photons that can be absorbed by the Hydrogen atoms. It is therefore temperature that dictates how strong the Hydrogen lines will appear in a star's spectrum.
But not just Hydrogen. All elements and even molecules visible in stellar spectra behave this way. For example, He, by virtue of the two protons in its nucleus, is much harder to excite or ionize than H. This is especially true for once-ionized He; that second electron is very hard to strip off given the strong positive charge of the nucleus. As a result, only very hot stars show neutral He lines, and only the absolute hottest stars—ones with surface temperatures in excess of 30,000 K—show He II lines. Calcium has a lower ionization energy than H. In addition, it is relatively easy to excite its outer electrons (the strong positive nuclear charge from its 20 protons is effectively screened by its many negatively charged electrons). Thus, hot and even intermediate-temperature stars show little Ca absorption since these atoms are highly ionized. But cooler stars—stars like the Sun in fact—have surface temperatures that allow Ca atoms to be excited. Hence such stars have very strong Ca absorption. In very cool stars, the surface temperatures can not only excite a wide range of atoms, but they even allow molecules such as TiO (Titanium
Oxide) to survive. In such stars the complex absorption spectra of these and other molecules become visible. In hotter stars, such molecules are disassociated—sort of the molecular equivalent of being ionized—and hence they cannot exhibit molecular absorption. Again, it is temperature that primarily dictates how the spectra appear, not only for H but for all atoms and molecules.
Now, if you think about this a bit, this should strike you as really rather weird. Our natural intuition is that if a star has strong Calcium absorption lines in its spectrum, it must contain relatively large quantities of Calcium. It seems ‘obvious’. But our discussion of how absorption line strengths vary as the surface temperature of a star changes indicates that our intuition is seriously mistaken in this case. The appearance of stellar spectra depends primarily on a star's temperature because the star’s temperature dictates the typical energy of the photons that are produced to either excite, ionize, or do nothing to the atoms within the star. Surprisingly, the chemical composition of a star has far less effect on the appearance of its spectrum! Of course, if a star hasn’t got a single Hydrogen atom in it, it won’t show any Hydrogen absorption no matter what the temperature. Likewise if it has zero Calcium. But the quantity of H generally has to drop to extraordinarily low levels before one can detect a strong change in the absorption spectrum. The same is true of most other elements. The strength of the absorption lines of a given element (either in its neutral or ionized form) depends primarily on the star’s surface temperature and only secondarily on the quantity of that element in the star. As we will see later on, we can use stellar spectra to determine the abundances of elements in stars by measuring the strength of absorption lines. But to do so we must very precisely determine the star’s temperature or we’d be badly fooled.
If this behavior confuses you, imagine the mystery for astronomers when they first started to record stellar spectra photographically in the late 19th Century. At that time there was no Bohr model to help explain the intimate relation between temperature and stellar spectra. Yet there were literally thousands of spectra that had to be organized in some way. Since the Hydrogen lines are easy to spot in most stellar spectra, it seemed natural to order stellar spectra on the basis of H line strength. Thus, stars of spectra class ‘A’ have the strongest absorption lines, ‘B’ the next strongest, and so on until the letter ‘O’. These stars have the weakest Hydrogen lines in their spectra. Later on, once it was understood that the physical basis for the appearance of these spectra was the temperatures of stars, the classification scheme was changed to reflect this new knowledge. ‘O’ stars turned out to be the bluest of all stars—therefore the hottest—and so they became the first ‘spectral type’ of the new sequence. ‘B’ stars were slightly cooler, and so came second in the sequence. This continued right up to the coolest, reddest stars denoted as class ‘M’. The resulting classification scheme—still in use today—reflects this ordering by temperature, and, mercifully, the omission of some of the redundant spectral types: O, B, A, F, G, K and M. Two new classes—denoted ‘L’ and ‘T’—have been added to the sequence very recently to cover extremely cool stars. Since this is
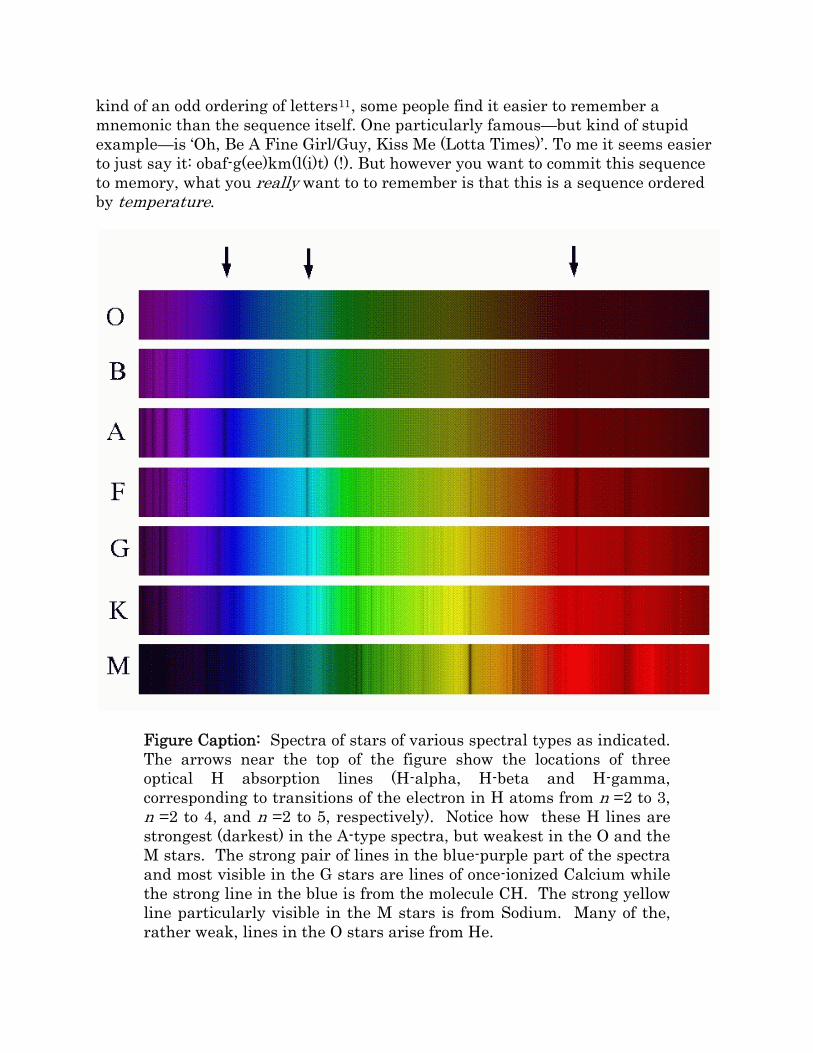
kind of an odd ordering of letters11, some people find it easier to remember a mnemonic than the sequence itself. One particularly famous—but kind of stupid example—is ‘Oh, Be A Fine Girl/Guy, Kiss Me (Lotta Times)’. To me it seems easier to just say it: obaf-g(ee)km(l(i)t) (!). But however you want to commit this sequence to memory, what you really want to to remember is that this is a sequence ordered by temperature.
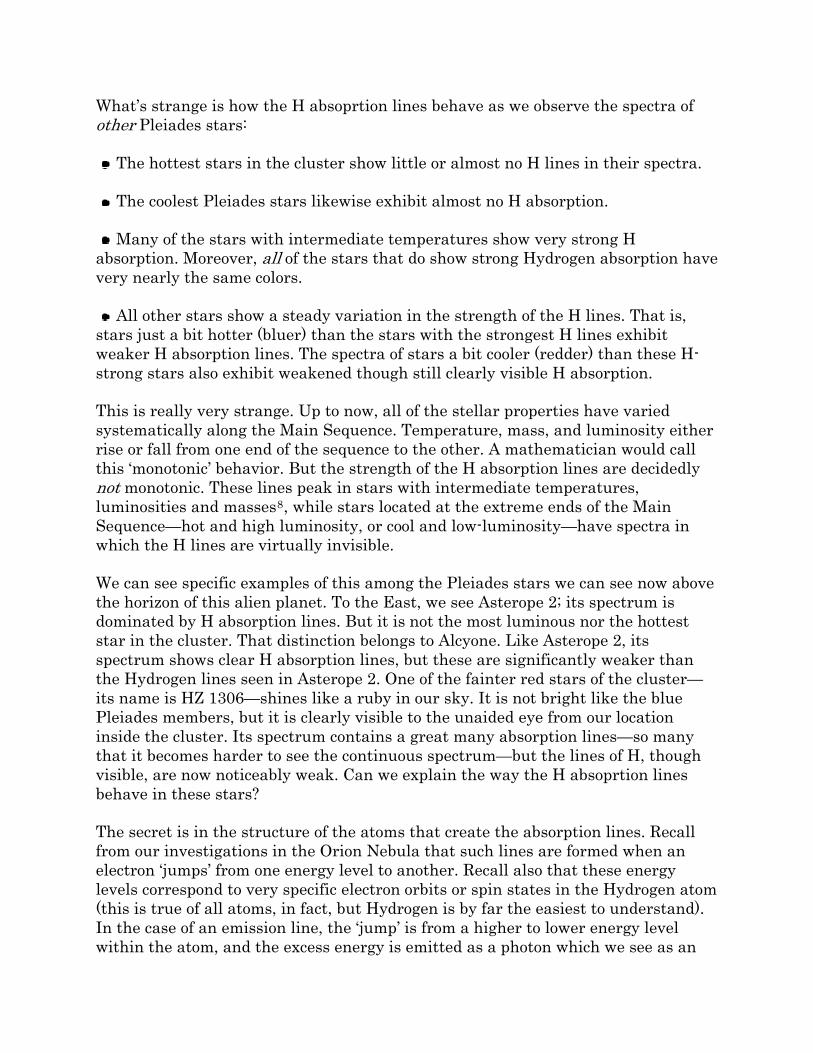
Figure Caption: Spectra of stars of various spectral types as indicated. The arrows near the top of the figure show the locations of three optical H absorption lines (H-alpha, H-beta and H-gamma, corresponding to transitions of the electron in H atoms from n =2 to 3, n =2 to 4, and n =2 to 5, respectively). Notice how these H lines are strongest (darkest) in the A-type spectra, but weakest in the O and the M stars. The strong pair of lines in the blue-purple part of the spectra and most visible in the G stars are lines of once-ionized Calcium while the strong line in the blue is from the molecule CH. The strong yellow line particularly visible in the M stars is from Sodium. Many of the, rather weak, lines in the O stars arise from He.
4. Why Do Stars Shine?
Our efforts to understand the nature of the stars that surround us here in the Pleiades has gotten us quite far. But there are some fundamental puzzles that remain. Why do stars shine as they do? What is their energy source? Why do nearly all stars huddle close together in the Main Sequence?
In our daily experience, getting energy out of something usually involves burning some sort of fuel. The electricity in our homes back on Earth was largely generated by burning fuels such as oil or coal. To do the same thing, the Sun would require about 1027 tons of fuel and a comparable amount of oxidizer for combustion. To generate the observed luminosity of the Sun—which you’ll recall is 3.910 erg/sec or 3.9 10 Watts—we’d need to consume this fuel at a rate that would exhaust the fuel in about 10,000-100,000 years, depending on the fuel efficiency. Unfortunately for this theory, there are many known fossils and even ancient artifacts (of humans or pre-humans) that are much older than this. Since the Sun must be at least as old as the Earth, we can rule out chemical burning as the source of the Sun’s luminosity.
What about gravity? We do not ordinarily think of gravity as a source of energy; yet, oddly enough, we all do know that gravity is a source of energy. How else can we understand the inevitable lack of volunteers to stand under a brick dropped from the top of a building? Or to jump off the building? The energy inherent in gravity can maim and kill. But gravity can be used constructively. For example, one can generate electricity by funneling water from the top surfaces of reservoirs into deep chutes that allows the water to fall under the influence of gravity into turbines located hydroelectric powerhouses at a lower elevation. You get the most energy in this manner by allowing the water to fall over as large a distance as practical. And you'd get even more energy if you could increase the gravitational field by increasing the Earth's mass (not a practical option).
But the Sun is both extremely large and massive. Its potential gravitational energy is enormous. Can we figure out a way to determine if this source can provide its luminosity? Back in the 19th Century, Lord Kelvin12 actually did this for the first time by calculating the how much energy could be extracted simply by using gravity to power the Sun. He first determined the total gravitational energy of the present-day Sun from Newton's theory of gravity. This turns out to be given by the expression / . He then divided this total energy content by the Sun’s luminosity—the rate at which the Sun emits energy, —to derive the time over which the Sun would have to shrink to very small size in order to shine at its observed luminosity
, .
In Lord Kelvin's highly influential opinion, the resulting timescale—about 30 million years—seemed more than long enough to account for the Sun's evolution and the formation of the Earth. But some people dissented. Darwin and a few famous geologists of the era felt that 30 million years was still far too short. Life could not have developed on such a short timescale on Earth, and some rocks appeared to show signs of far greater age. Although Kelvin was able to dodge most criticisms of his concept in his heyday, with time these and other objections became fatal to Kelvin’s idea. The Sun must be vastly older than tens of millions of years since the Earth—and life on Earth—has been around for billions of years. The Sun, and presumably most stars, must use some form of energy other than gravitational energy as its power source13. The 50 years following the demise of Kelvin’s ‘explanation’ for the Sun’s energy source must have been an uncomfortable time for astronomers. They could not answer the most basic of all questions: Why do stars shine?
The first element of the solution came in the early 20th Century from a crucial contribution by Albert Einstein. His f uation amous eq
demonstrated that a tiny amount of matter of mass, , is equivalent to an immense quantity of energy (since the speed of light, , is already a large number, the factor
is huge). The subsequent development of atomic and nuclear weapons brought home the fundamental truth of this equation. What’s less clear is that Einstein’s equation also applies to more mundane cases. Any time energy is generated - be it from chemical, mechanical, gravitational, or nuclear processes - mass is converted into energy in accordance with this simple relation. For most normal situations - burning fuel, explosions, crashing objects together, breaking objects by dropping them from great heights - the amount of mass transformed into energy is so small that we cannot measure it directly. Consequently, we do not normally appreciate the constant conversion of mass into energy that occurs all around us all the time.
The early 20th Century was also a time when the nature of atoms was first being understood in detail. We already spoke of Bohr's contribution to the understanding of emission and absorption lines in atoms. But his work was based on findings that atoms are composed of ultra-compact nuclei containing all the positive charge (in the form of protons) and nearly all the mass (in the form of protons and neutrons) of atoms. As people started to measure the properties of atomic nuclei, they noted some curious features. For example, although Helium (He) atoms contain four nuclear particles—two neutrons and two protons—the mass of these four particles is less than the mass of four Hydrogen atoms—that is, four protons14. For our purposes, we'll call this mass differences Δ . Around 1930, some very clever people realized that if it were possible to merge four Hydrogen atoms into a single Helium atom—and they had some ideas how this might happen—a certain quantity of
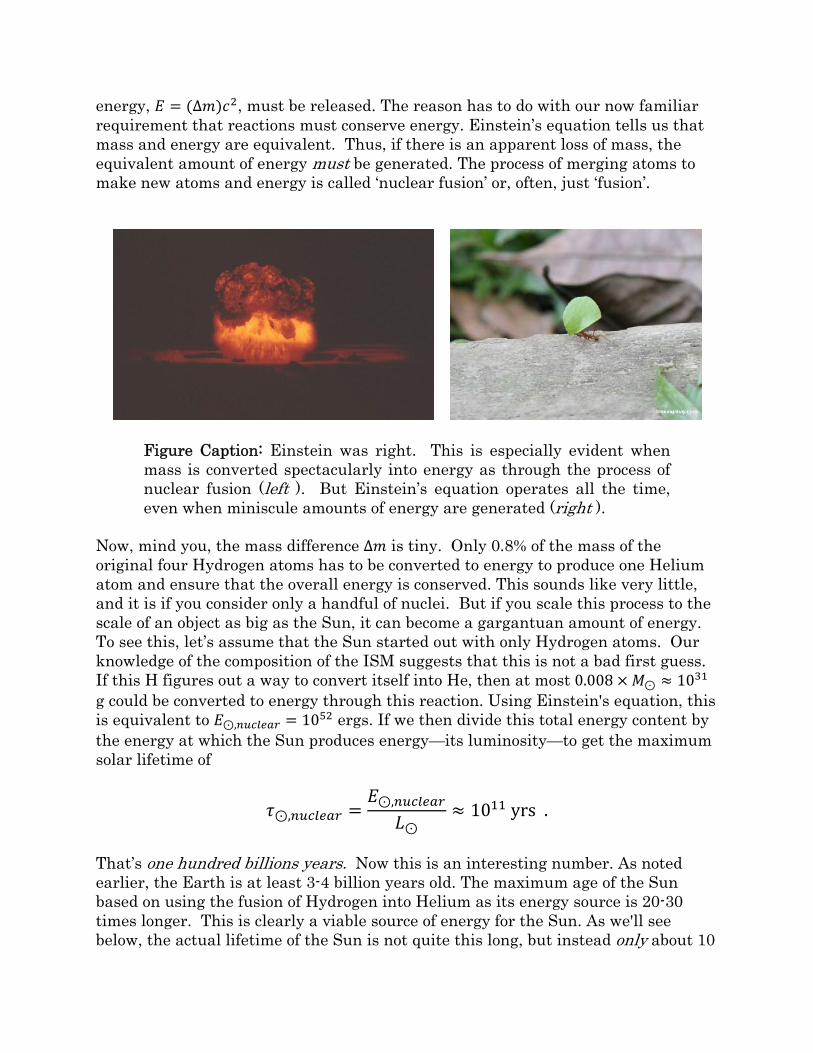
energy, Δ , must be released. The reason has to do with our now familiar requirement that reactions must conserve energy. Einstein’s equation tells us that mass and energy are equivalent. Thus, if there is an apparent loss of mass, the equivalent amount of energy must be generated. The process of merging atoms to make new atoms and energy is called ‘nuclear fusion’ or, often, just ‘fusion’.
Figure Caption: Einstein was right. This is especially evident when mass is converted spectacularly into energy as through the process of nuclear fusion (left ). But Einstein’s equation operates all the time, even when miniscule amounts of energy are generated (right ).
Now, mind you, the mass difference Δ is tiny. Only 0.8% of the mass of the original four Hydrogen atoms has to be converted to energy to produce one Helium atom and ensure that the overall energy is conserved. This sounds like very little, and it is if you consider only a handful of nuclei. But if you scale this process to the scale of an object as big as the Sun, it can become a gargantuan amount of energy. To see this, let’s assume that the Sun started out with only Hydrogen atoms. Our knowledge of the composition of the ISM suggests that this is not a bad first guess. If this H figures out a way to convert itself into He, then at most 0.008 10 g could be converted to energy through this reaction. Using Einstein's equation, this is equivalent to , 10 ergs. If we then divide this total energy content by the energy at which the Sun produces energy—its luminosity—to get the maximum solar lifetime of
,, 10 yrs .
That’s one hundred billions years. Now this is an interesting number. As noted earlier, the Earth is at least 3-4 billion years old. The maximum age of the Sun based on using the fusion of Hydrogen into Helium as its energy source is 20-30 times longer. This is clearly a viable source of energy for the Sun. As we'll see below, the actual lifetime of the Sun is not quite this long, but instead only about 10
billion years. Still plenty of time for the Earth—as well as life on Earth—to reach its present state.
But wait! There is a ‘little’ problem with all this. Just how does one force four Hydrogen atoms to combine to form one Helium atom in the first place? The H nuclei—protons—are positively charged. Particles with the same electrical charge repel. How, then, can protons combine into a single atom? This question raises an even more fundamental one. How do the atoms of any element avoid disintegration given the tight packing of protons in their nuclei? The solution to this riddle comes from the presence of an additional force—the so-called ‘strong nuclear force’—that can attract protons and neutrons towards one another if the particles are extremely close together. In this case, ‘close together’ means separations that are not much larger than the sizes of the neutrons and protons themselves. If two protons—two H atoms—are located significantly further apart than this, their positive electrical charges dominate and the two are indeed strongly repelled from one another just as we would have guessed. But if, somehow, you can squeeze the particles close together enough so that the strong nuclear force can take over, even protons can be made to ‘stick’. If you want to combine H atoms to form bigger atoms, that is, if you want fusion, you have to first overcome this very strong repulsion before the attractive nuclear force can take over. How can this happen?
A simple observation regarding automotive safety provides a clue. Would you rather be involved in a fender-bender where the cars are moving at a few mph relative to one another, or in a head-on collision in which each car is traveling at 100 mph? Assuming you are not suicidal, the answer is obvious and it has implications for nuclear fusion.
If we can somehow get H atoms to collide at sufficiently high speed, they may get close enough so that the attractive strong nuclear force overcomes the repulsive electric force of the protons. We know that high speed is equivalent to high temperatures, but how high a temperature is required? In the case of H fusion, one can calculate the kinetic energy (which, you recall, is given by , for a particle of mass and velocity ) required to overcome the repulsive electric force of another Hydrogen atom. If we can reach or exceed this energy, we may have a decent chance that two H nuclei may fuse. From our discussion of the temperature of particles in the ISM in Destination 5, we know how kinetic energy relates to temperature ( , for a gas of temperature and given the Boltzmann constant, ).
The surface temperature of the Sun—about 5800 K—does not even come close to heating any H nuclei up to the kinetic energy required for fusion. One million degrees K? Still too cool! Temperatures of 15 million degrees K are needed to ensure that enough H nuclei have enough kinetic energy to be able to fuse into He nuclei at a rate that can account for the Sun's luminosity! This is an inconceivably high
temperature. But get used to it. We shall encounter even more extreme temperatures in the centers of other stars and at (future) stages in the lifetime of the Sun. To stress the role of temperature in this process, the ‘fusion’ that occurs in the cores of stars is not merely called ‘nuclear fusion’, but rather ‘thermonuclear fusion’. This nicely descriptive name underscores the key role that high temperatures play for this sort of fusion to occur.
How do stars attain such high central temperatures in the first place? You may recall that in the Orion Nebula stars formed from the collapse of molecular clouds. One immediate and obvious result of this process is that the material in the cloud becomes compressed - due to the gravitation attraction of the mass in the cloud - into a higher-density gas15. The particles of this gas accelerate as they fall towards the cloud center, but as the density increases, they also have more chances of colliding with other particles. This converts their motion into more random motions which we measure as increased temperature. Thus, the collapse of the cloud provides the energy to heat the cloud, especially in the cloud center. This process would continue indefinitely with more and more gravitational energy converted into faster and faster random motions of the gas particles - higher temperatures - in the cloud core. But as the temperature reaches the threshold where Hydrogen fusion can begin, the energy from the fusion reactions can now supply the energy required to keep the gas hot and can actually halt the collapse. For now.
You need to really appreciate is that gravity’s calling all the shots in this game. The mass of the star dictates how rapidly these various steps occur. The most massive stars, for example, collapse most quickly. They also require higher central temperatures to produce high enough random motions of the atomic nuclei within the star's core to produce enough energy from fusion to halt the collapse. Since the rate of energy production from H fusion reactions rises very rapidly as temperature increases, these stars must also produce much more energy—that is, they have much higher luminosities—than lower-mass stars. In the same way, low-mass stars take longer to collapse and their luminosities and central temperatures are lower. This interplay between the mass, the internal temperature, and the luminosity of the star is the fundamental reason that we see a well-defined mass-luminosity relation for Main-Sequence stars. In a more complicated manner, the mass of a star even controls how large it must be. Since this, along with the luminosity, dictates the surface temperature (recall that a star's luminosity is determined by its surface area - that is, size - and its surface temperature), the thermonuclear fusion in the cores of stars represents the underlying reason for the existence of a Main Sequence in the H-R Diagram.
We can see from all this that the mass of a star is the principal parameter that determines nearly all of its overall properties. In other words, if we specify the mass of a star and we verify that the star is on the Main Sequence, we know essentially everything we need to know about it. We can use this information alone to derive
the star’s luminosity, size, surface temperature, core temperature and even its spectral type!
There is a very important implication of this discussion. If the total energy of a star is related to its mass, and the total luminosity is given by the Main-Sequence Mass-Luminosity relation, then we ca , , of mass as n write that the lifetime of a star
// . . , 1/ . . , 1
.
This relation simply states that a star with a total energy reservoir that is proportional to its mass can emit energy at a rate given by its luminosity for a finite time, . One interesting consequence of this relation is that massive stars have significantly shorter lifetimes than less massive stars. It’s true that these massive stars have more H fuel to start with, but they must burn that fuel at a much higher rate to achieve the very high central temperatures they need to halt their collapse. Cars, among other things, behave roughly the same way. Big ones get poorer gas mileage and have less range than small ones despite being able to carry more gas in their larger tanks.
The Sun’s total lifetime can be calculated to be about 10 billion years. From all indications from the Earth, the Moon, and from other bodies of the Solar System, the Sun appears to have lived approximately half this time—about 5 billion years—up to now. This lifetime is significantly less than the 100 billion years we estimated when we first identified fusion as a possible energy source for stars. And for a good reason. Only the H in the core of the Sun is hot enough to fuse into He. This means that only about 10% of the Sun's mass will ultimately be used to produce energy. If we take that into account, the 100 billion year lifetime we estimated earlier is reduced by a factor of 10 to the 10 billion year lifetime we have derived from our more careful consideration of how fusion operates.
What does this all imply about the Pleiades? Since the most massive stars live the shortest time, we can estimate how long the cluster has been around by determining the ages of these stars. The hottest, most luminous, most massive star in the Pleiades is Alcyone. It is definitely on the Main Sequence, and its luminosity is about 1300 times greater than the Sun’s. The Main-Sequence Mass-Luminosity relation tells us that its mass is 1300 . 7.8 . Its lifetime is therefore 7.8 . 0.006 that of Sun, or about 60 million years. Stars more luminous or more massive than Alcyone simply do not exist in the Pleiades today. If they had been present at some earlier time, they would have run out of H by now. They would then go on to do whatever it is that stars do when this occurs. We’ll discuss this process, known as ‘stellar evolution’, at later destinations. But do not miss the important point we can glean here in the Pleiades. By understanding how stars function—how they generate their energy—we can estimate their ages. And, by implication, this
lets us estimate the ages of their planets, or of the star clusters in which they were born. This ability to measure stellar ages is an extraordinarily powerful tool.
Figure Caption: Alas, they never knew the Pleiades. The cluster, and all of its stars, had yet to be born!
The age we derive for the Pleiades—60 million years more or less—is a relatively short time for most stars. Of course it is an inconceivably long timespan for humans. It is wondrous to think that the Pleiades first graced the skies of Earth at a time when the last dinosaurs had just become extinct and the first sophisticated mammals were starting to rise up through the hierarchy of life on our home planet. Dinosaurs never had a chance to look up in their sky—the alien sky of our ancient Earth—and see the Pleiades. The cluster had not yet been born.
Destination 8 Bonus Questions
QUESTION 22: If I double the mass of a star, how does its luminosity, surface temperature, and radius change. Assume that the star remains on the Main Sequence both before and after this transformation. You do not have to provide a quantitative answer to this question, just tell me if the various quantities increase, decrease, or are unchanged in response to the change of mass. Draw a schematic H-R Diagram that indicates where the star was before its change in properties, and where it is located after the change.
QUESTION 23: An ionized Helium atom is nearly identical to a neutral Hydrogen atom except that the nuclear force is greater since there are two protons instead of one. Explain why absorption lines of ionized Helium are seen in the hottest Main Sequence stars only.
QUESTION 24: How long will the faint red Pleiades member HZ1306 live? Assume that this star is on the Main Sequence and has a luminosity of 0.05 that of the Sun. Be sure to use the proper branch of the Mass-Luminosity relation to answer this question. You can also assume that the lifetime of the Sun is 10 billion years.
Destination 8 Footnotes 1 The Pleiades is also frequently referred to as M45. That’s the same ‘M’ that named the Orion Nebula (a.k.a. M42): Charles Messier. We’ll hear a bit more about Messier later (Destination 11), but suffice to say that he was mostly interested in finding comets and he generally included in his catalog only objects that might reasonably mimic the appearance of a comet. The inclusion of the Pleiades in Messier's catalog is somewhat strange in this respect because the cluster is so close and so large that no one would have mistaken it for a comet. Like the Pleiades, M44 is also a bright star cluster—known as the Praesepe—that similarly would never be mistaken as a comet by anyone even vaguely familiar with the sky. Many historians think Messier added these two clusters to reach what he considered to be a nice round number –45—in the first published edition of his catalog. 2 Such lucky groupings of stars are called ‘asterisms’. They are generally not that important since the individual stars that make up an asterism may be very far apart and completely unrelated to one another. From any other vantage point these stars would not necessarily appear close to one another at all. 3 The closest star cluster to Earth is the Hyades. Interestingly, this cluster is quite near the Pleiades in Earth’s sky. Both clusters are in the constellation Taurus, though the Hyades are about 30 pc away, around five times closer than the Pleiades. Not surprisingly, most cultures had ancient myths about the Pleiades that intersected with stories involving the nearby Hyades. In Greek mythology, the two groups had the usual jolly interactions, including political intrigue, murder, illicit affairs and so forth. A veritable celestial soap opera. 4 Come to think of it, we do not even know if this planet has an atmosphere! Heck, we don’t even know if this planet exists!!! But because we do need a base from which to study the Pleiades, this ‘imaginary’ planet about a typical Sun-like star within the Pleiades is perfect for our purposes. 5 One way to do this is to take images of the stars, one through a red filter and one through a blue filter. Red stars will appear comparatively brighter when viewed through the red filter while the opposite will be true of blue stars. If we measure
the fluxes of the stars in the various filters, we can actually measure a numerical ‘color’ value for each star. Generally, astronomers define these ‘color indices’ so that blue stars have more negative values, and red stars more positive values of the indices. 6 We shall soon get more quantitative about stellar lifetimes. But if you are simply dying to know, the Sun has been on the Main Sequence for 5 billion years. It should remain on the Main Sequence for about another 5 billion years so we have plenty of time to pack up if we feel we need to move. 7 We usually think of an eclipse in terms of the Moon passing in front of the Sun (a ‘solar eclipse’) or the Earth passing between the Sun and the Moon (a ‘lunar eclipse’). In each case, the eclipsing object is dark (the Moon or the Earth), and the object that is eclipsed is bright (the Sun). So it is strange to think of two stars eclipsing one another. But the effect is the same. If a star passes in front of another star, the brightness will still dip since you see less of one of the two stars. Unlike a lunar or solar eclipse, however, you do not expect total darkness in the shadow since the thing that is doing the eclipsing also gives off light. 8 Remember, if you specify any of these three, you can figure out the other two for Main Sequence stars. 9 Recall that the energy of the photon is given by / , where and are the frequency and the wavelength of the radiation, respectively. 10 Since you know a lot about the Hydrogen atom now, this should seem pretty obvious. But in fact this was a critical observation that led to the result that earned Einstein his one Nobel Prize. 11 At this point you should roll your eyes, and say something very sarcastic that, au contraire, the sequence OBAFGKM(LT) is one of the most natural anyone could imagine! 12 Yes, the same person for whom the Kelvin temperature scale is named.
13 Probably the simplest and convincing argument against Kelvin's idea would have been if one could actually rule out the contraction of the Sun by direct measurement. Unfortunately, the rate of contraction would be about 0.0002 arcsec/year. The size of the Sun has been measured accurately for the past 200 or so years. If Kelvin were correct, it would now be about 0.04 arcsec smaller than it was at that time. Unfortunately, the precision of the measurements is only 0.5 arcsec or so. To be fair, we cannot yet formally rule out the Sun is contracting at the rate that Kelvin suggested. The age arguments have to suffice for now. 14 Note that we are ignoring the electrons in this discussion. These particles have masses that are about 1/1800th as massive as the individual protons and neutrons that comprise the nuclei. Consequently, we can always safely ignore their contribution to the total atomic mass in calculations such as these. 15 Density is just mass divided by volume. If the cloud does not initially lose much mass, then as it contracts the volume gets smaller. Consequently the density increases. Even if the cloud loses mass as we discussed in Destination 6 and Destination 7, the cores of these clouds increase in density significantly during the collapse process.