Embed Size (px)
Citation preview

DESKTOP TRAILSLet the mouse do the walking!
R.N. WilkinsonThanks to: Tom Swinford
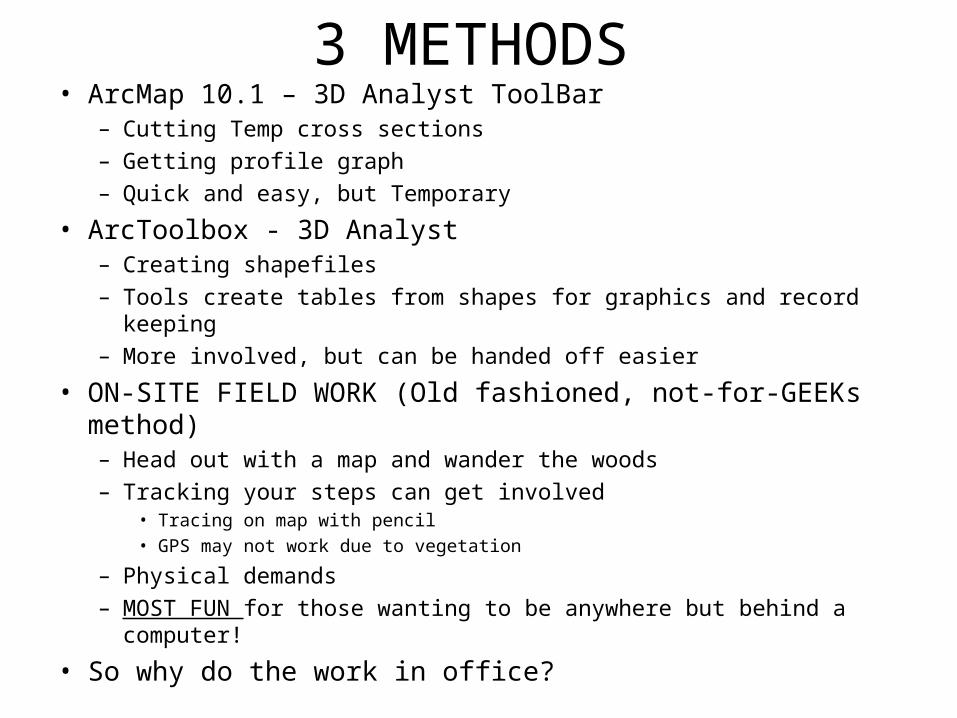
3 METHODS• ArcMap 10.1 – 3D Analyst ToolBar
– Cutting Temp cross sections– Getting profile graph– Quick and easy, but Temporary
• ArcToolbox - 3D Analyst– Creating shapefiles– Tools create tables from shapes for graphics and record keeping– More involved, but can be handed off easier
• ON-SITE FIELD WORK (Old fashioned, not-for-GEEKs method)– Head out with a map and wander the woods– Tracking your steps can get involved
• Tracing on map with pencil• GPS may not work due to vegetation
– Physical demands– MOST FUN for those wanting to be anywhere but behind a computer!
• So why do the work in office?
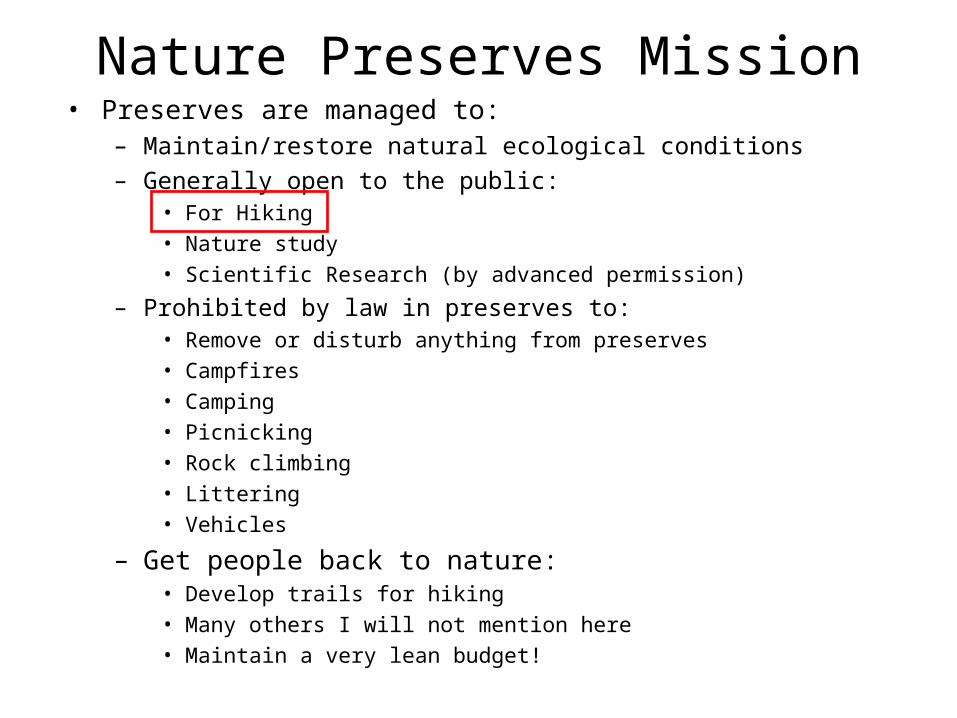
Nature Preserves Mission• Preserves are managed to:
– Maintain/restore natural ecological conditions– Generally open to the public:
• For Hiking• Nature study• Scientific Research (by advanced permission)
– Prohibited by law in preserves to:• Remove or disturb anything from preserves• Campfires• Camping• Picnicking• Rock climbing• Littering• Vehicles
– Get people back to nature:• Develop trails for hiking• Many others I will not mention here• Maintain a very lean budget!
Why design trail using GIS• Most cost effective with new elevation data and technology• Better informed decision that affects:
– Endangered Wildlife– Endangered Plant life– Natural setting/beauty– By allowing you to geo-locate associated data
• Line work verses Cutting trail– Not disturbing natural surroundings for planning– Pre-determine best fit of trail
• Account for:– Trail length– Elevation changes– Ground distances – Areas of concern / Restricted areas
– Only cost is man hours involved.• No travel costs
Data for Research/Design• Ortho Image for area• DEM of area• Existing trails for area• Plan
– What is the trail for?– Restrictions in area?– What difficulty level?– Who is building trail?– Budget constraints?
• Areas of interest– May have to tweak– Add attributes for design
analysis
• Proposed Trail– Line file with Z values– Create: this will be trail legs
you analyze
• Hillshade (see next slide)– Create from DEM– Spatialanalyst>Surface>Hillshade
– *For viewing* – zfactor=1• Can exaggerate by increasing
z factor greater 1
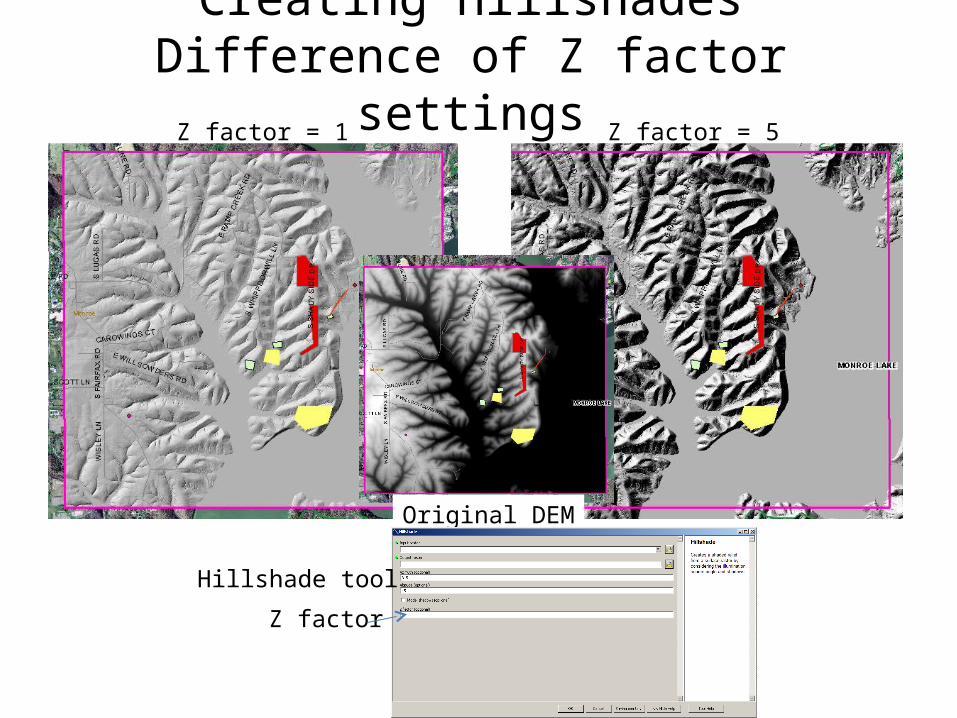
Creating HillshadesDifference of Z factor settings
Z factor = 1 Z factor = 5
Original DEM
Hillshade tool
Z factor
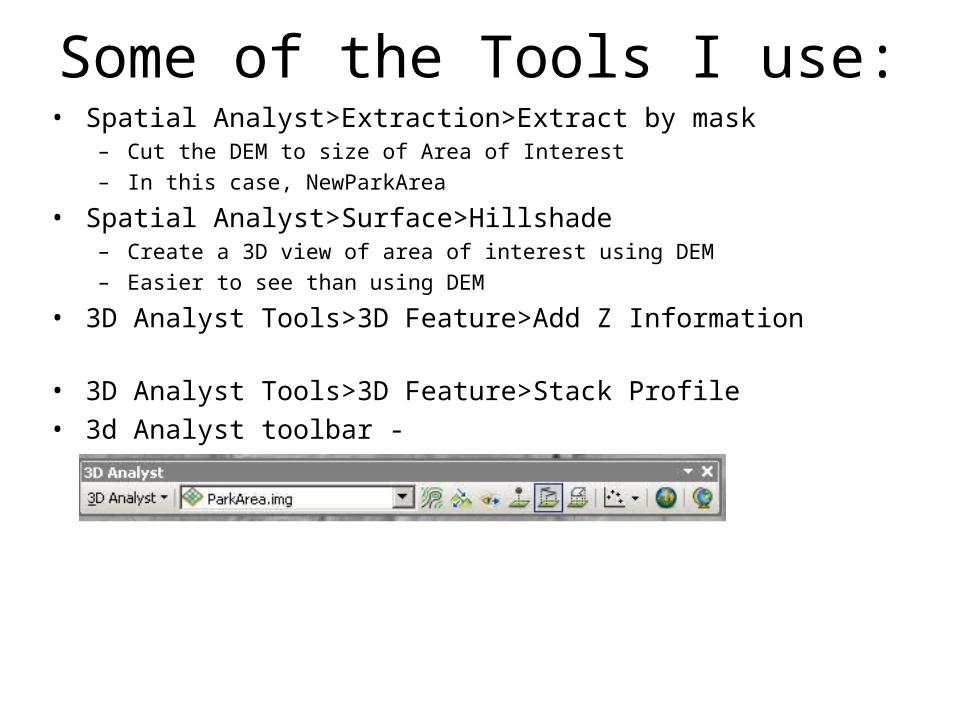
Some of the Tools I use:• Spatial Analyst>Extraction>Extract by mask
– Cut the DEM to size of Area of Interest– In this case, NewParkArea
• Spatial Analyst>Surface>Hillshade– Create a 3D view of area of interest using DEM– Easier to see than using DEM
• 3D Analyst Tools>3D Feature>Add Z Information
• 3D Analyst Tools>3D Feature>Stack Profile• 3d Analyst toolbar -
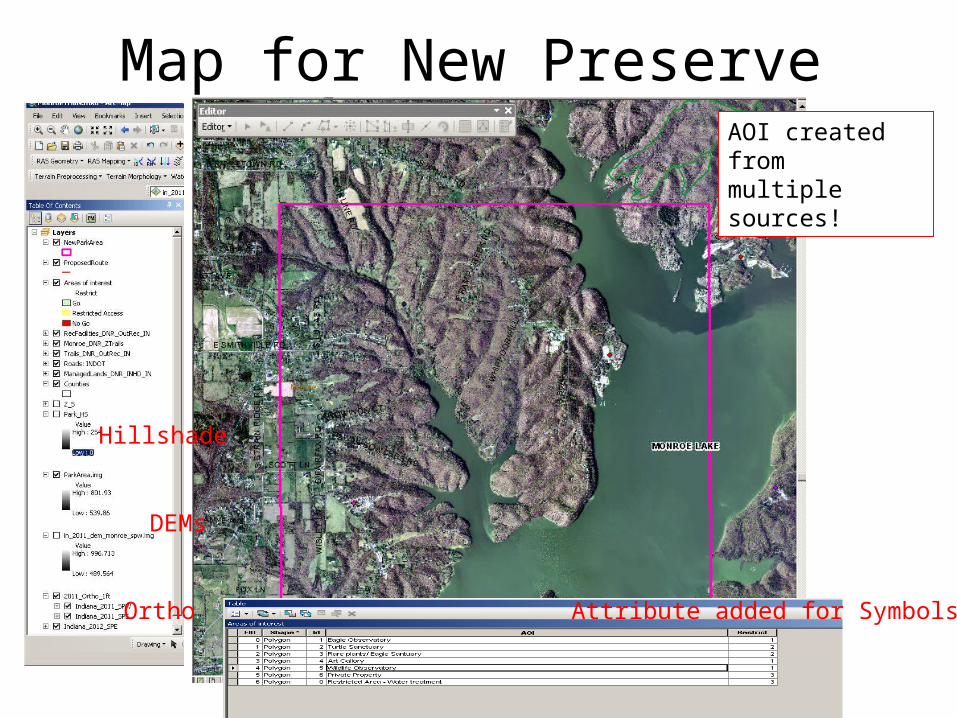
Map for New Preserve
Ortho
DEMs
Hillshade
AOI created frommultiple sources!
Attribute added for Symbols
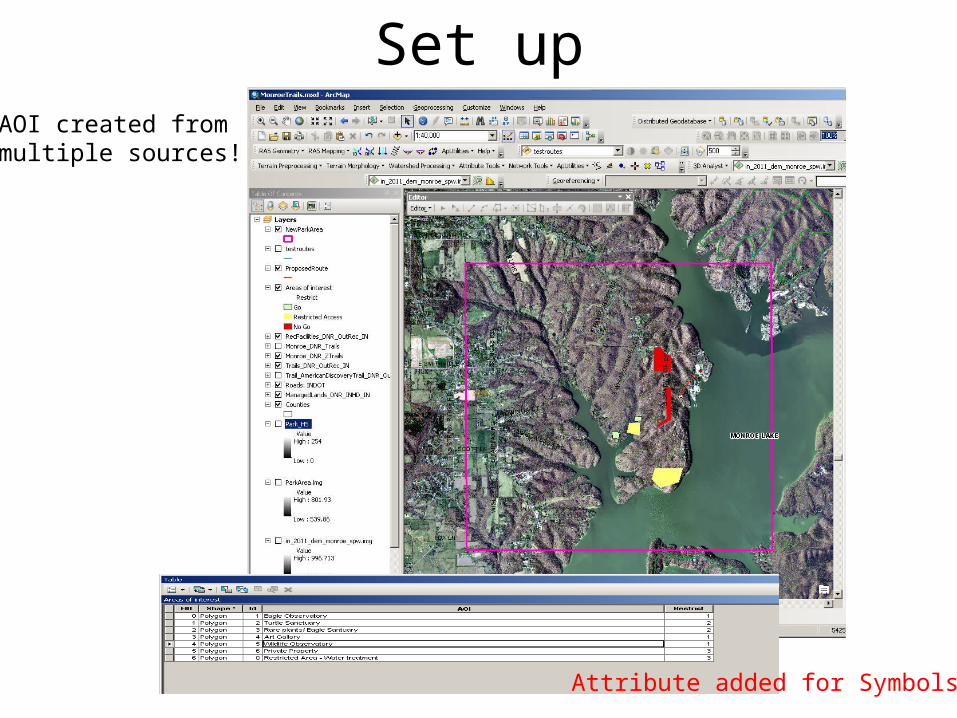
Set up
Attribute added for Symbols
AOI created frommultiple sources!
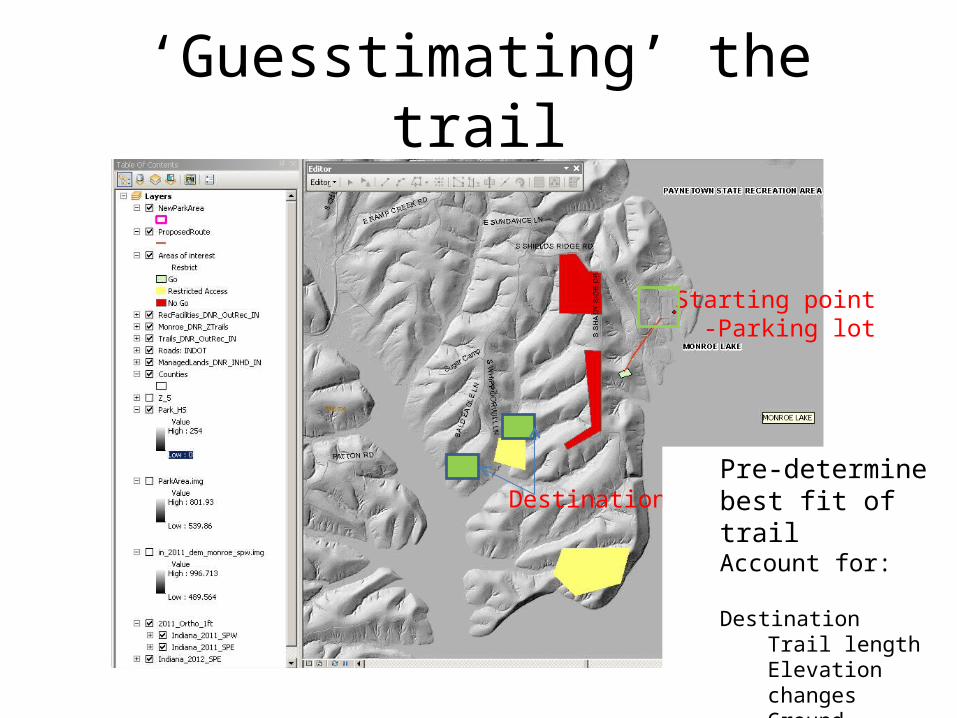
‘Guesstimating’ the trail
DestinationsPre-determine best fit of trailAccount for:
DestinationTrail lengthElevation changesGround distances Areas of concern / Restricted areas
Starting point -Parking lot

Quick Look using 3D Analyst Toolbar•Ensure 3D Analyst extension is on•Open 3D Analyst Toolbar
•1. Set this pull down to your DEM•2. Click on tool “Interpolate Line”•3. Draw line where you want to get cross section (black line from tool)•4. Select from “Point profile tool” drop down, Profile graph:•5. You will get the Profile Graph showing:•X axis – distance of line in METERS!•Y Axis – Elevation in Feet along line
•*NOTE* •*Elevation is in feet because DEM is in feet. Y axis of graph.•*Distance in meters since MAP is in UTM! X axis of graph.
•Analysis of this leg:•Slope of Leg – 8 % or 47/574=.08•Slope along roadway = moderate
•If acceptable, add line to your shapefile as leg 1!
1.Set to DEM2
3
4
Profile Graph Title
Profile Graph Subtitle
160140120100806040200
605
600
595
590
585
580
575
570
You can save this graph by: “save as”
5.
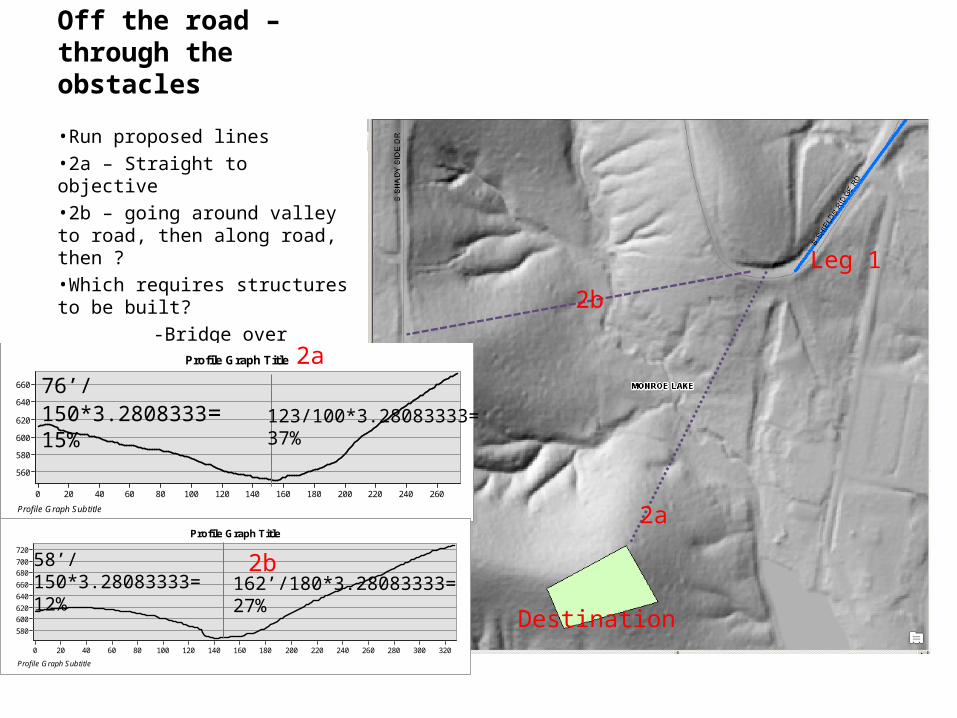
Off the road – through the obstacles
•Run proposed lines•2a – Straight to objective•2b – going around valley to road, then along road, then ?•Which requires structures to be built?
-Bridge over creeks-Stairs
-Switchbacks
Leg 1
Destination
Profile Graph Title
Profile Graph Subtitle
260240220200180160140120100806040200
660
640
620
600
580
560
Profile Graph Title
Profile Graph Subtitle
320300280260240220200180160140120100806040200
720
700
680
660
640
620
600
580
2a
2a
2b
76’/150*3.2808333=15% 123/100*3.28083333=
37%
58’/150*3.28083333=12% 162’/180*3.28083333=
27%
2b

Starting from Parking Areausing 3D Analyst Toolbox
•Need shapefiles to build upon!•Using Stack Profile you get elevation along line at each pixel of DEM•Use established trails
•Using roadway to leave parking area•Starting elevation – 565 ft•End of line – 605 ft•Length of trail leg – 175 meters•*Elevation is in feet because DEM is in feet. Y axis of graph.•*Distance in meters since MAP is in UTM! X axis of graph.•Slope of Leg – 8 % or 47/574=.08•Slope along roadway = moderate
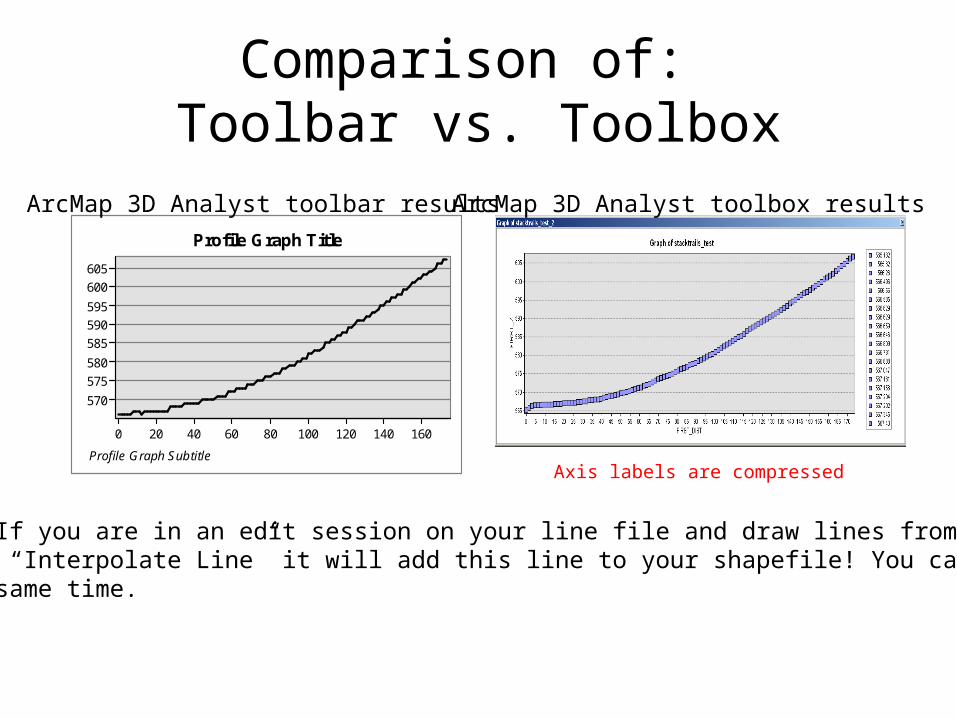
Comparison of: Toolbar vs. Toolbox
Profile Graph Title
Profile Graph Subtitle
160140120100806040200
605
600
595
590
585
580
575
570
ArcMap 3D Analyst toolbar results ArcMap 3D Analyst toolbox results
Note*: If you are in an edit session on your line file and draw lines from the Toolbar “Interpolate Line” it will add this line to your shapefile! You can do bothAt the same time.
Axis labels are compressed