Embed Size (px)
Citation preview
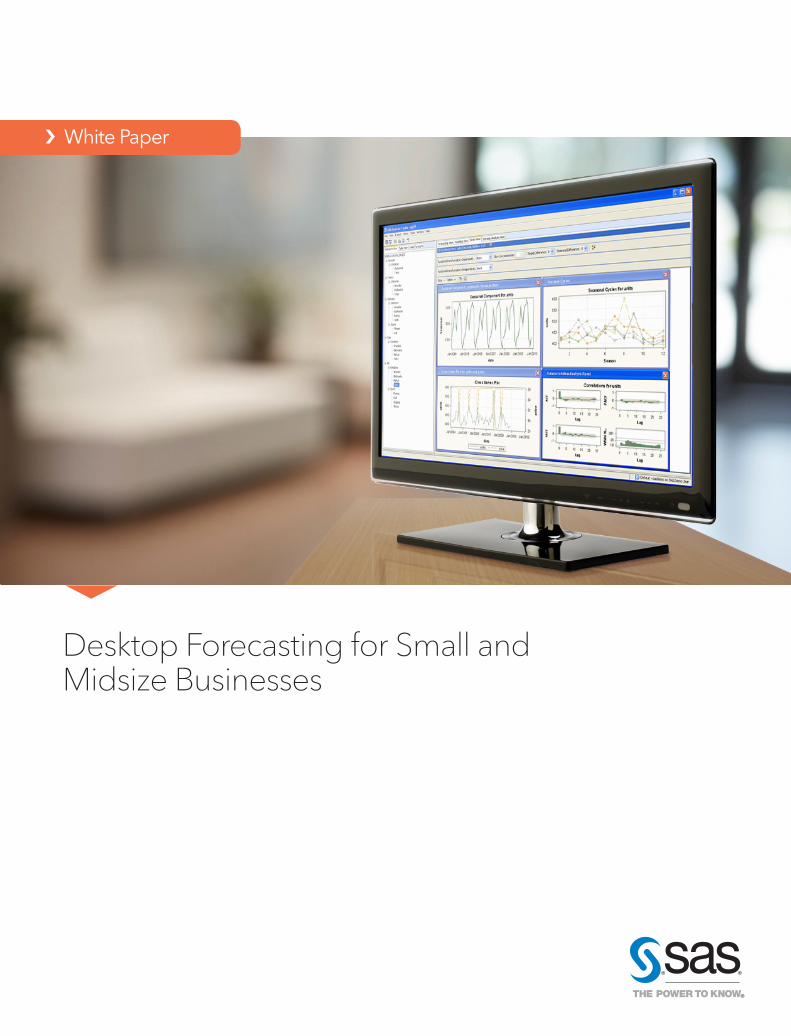
Desktop Forecasting for Small and Midsize Businesses
› White Paper

ContentsIntroduction ...................................................................... 1
Why Forecasting Is Important ...................................... 1
Looking Inside SAS® Forecasting for Desktop .......... 1
Introduction ........................................................................... 1
Overview of SAS® Forecasting for Desktop ................... 2
Creating Forecast Projects ................................................. 2
Forecast Generation ............................................................ 4
Forecasting View .................................................................. 5
Series and Modeling Views ............................................... 7
Scenario Analysis View ....................................................... 8
Exception-Based Forecasting ........................................... 9
Forecast Reports .................................................................. 9
Conclusion ...................................................................... 10
References ...................................................................... 10
SAS White Papers.............................................................. 10
Recommended Reading ............................................. 10
Content for this white paper was provided by Meredith John, SAS Product Manager, and Michael Gilliland, SAS Product Marketing Manager.

1
IntroductionOrganizations depend on statistical forecasting to provide a solid foundation for many important planning and decision-making processes. SAS® Forecasting for Desktop facilitates and speeds the forecasting process by providing a convenient, user-friendly interface to the automatic forecasting capabilities available in SAS.
Because it is largely automated, SAS Forecasting for Desktop addresses the needs of novice forecasters, yet still it meets the requirements of more experienced analysts by providing layers of sophistication that can be accessed as needed.
SAS Forecasting for Desktop enables users to set up forecasting projects, perform automatic forecasting, identify exceptions, override forecasts and construct their own models if desired. Given the scale of many forecasting problems, manually customizing many statistical models may not be feasible. SAS Forecasting for Desktop provides an automated system that selects appropriate models and chooses influential variables that improve the model performance. Forecasts that violate business rules can be flagged for further attention. The system supports hierarchical forecasting processes by providing top-down, middle-out and bottom-up forecast reconciliation.
Why Forecasting Is ImportantIt is beneficial to know the future. When a company knows its sales for next week, next month and next year, it will invest only in the facilities, equipment, materials and staffing it needs. There are huge opportunities to minimize costs and maximize profits when we know what tomorrow will bring – but we don’t. Therefore, we forecast.1
Generating forecasts is a crucial step in many strategic and tactical planning and decision-making processes. For example, future demand for products and services is forecast to support production planning, marketing activities, resource scheduling and financial planning. Much time and effort is spent in the planning process, so improving the reliability of statistical forecasts that feed these processes can result in huge rewards, including greater operational efficiency, reduced expenses and increased profits.
1 Michael Gilliland, “Is Forecasting a Waste of Time?” Supply Chain
Management Review, July/August 2002.
Although forecasting is a key business function, many organizations do not have a dedicated forecasting staff, or they may only have a small team. Therefore, a large degree of automation may be required to complete the forecasting process in the time available during each forecasting and planning cycle. Forecasting tasks typically include generating forecasts based on recent data, reconciling forecasts across a product and organizational hierarchy, identifying and correcting problematic forecasts, adding overrides to the forecasts based on business knowledge or scenario analysis, and publishing the forecasts to other systems or as reports.
Looking Inside SAS® Forecasting for DesktopIn this section we’ll take a detailed look inside SAS Forecasting for Desktop, a powerful and easy-to-use business forecasting solution.
IntroductionSAS Forecasting for Desktop facilitates and speeds the forecasting process by providing a convenient, user-friendly interface to the automatic forecasting capabilities available in SAS.
The wizard-driven graphical user interface (SAS Forecast Studio) included in SAS Forecasting for Desktop enables the novice forecaster to move quickly through the statistical forecasting process to generate forecasts using state-of-the-art methods. Forecasters do not need to know any SAS programming or how to build time series models – the system can be entirely automated.
Although the SAS Forecasting for Desktop user interface is streamlined to enable less-experienced users to generate forecasts easily, it has all the power and sophistication that more advanced analysts expect. SAS Forecasting for Desktop provides a wide array of diagnostic and model-building tools, so that more experienced analysts can benefit from the productivity of the analyst interface.

2
Overview of SAS® Forecasting for Desktop The graphical user interface for SAS Forecasting for Desktop has been designed to speed the work of both novice and advanced analysts:
• ANewProjectWizardwalkstheanalystthroughthestepsofset-ting up and running forecast projects.
•AnEventsdialogboxsimplifiestheadditionofevents–forexample, holidays and promotions – that might influence the forecast.
•AModelBuilderdialogboxguidestheanalystthroughthedevelopment of custom forecasting models, built from scratch or based on models in the model repository.
•Forecast,SeriesandModelViewsgivetheanalystmultiplewaysto work with the forecast results.
• AScenarioAnalysisViewallowstheanalysttocreatewhat-ifscenarios based on the models generated by SAS Forecasting for Desktop.
• Customizedreportscanbereadilygeneratedfromthedatasetscreated by SAS Forecasting for Desktop.
• ForecastscreatedwithSASForecastingforDesktopcanbeexported to a variety of other applications.
Creating Forecast ProjectsSAS Forecasting for Desktop organizes forecasts as projects. A forecasting project may be small, or it may contain up to 1,000 time series. Organizing the forecasts with the supporting information in a project has many advantages:
• Forecastingteammembersareabletohaveindividualprojects,allowing them to work independently.
• Forecastersmaymaintainseparateprojectsforthedifferentac-counts or product lines for which they are responsible.
• Forecastersmaymaintainseparateprojectsforeachforecastingcycle – the Q1 forecast, the Q2 forecast and so on.
The SAS Forecasting for Desktop user interface includes an eight-stepNewProjectWizardtoguideanalystsquicklythroughsetting up a new project or working with existing projects.
Selecting the input data set
Fundamentally, forecasting is the process of detecting patterns over time, and then using those patterns to project into the future. Therefore, all data sets must contain a time variable, such as month or week, or even more granular time buckets. For example, the data set may contain data on units sold per week, or electricity used per hour. If the data is recorded at regular intervals, such as month or day, then it is time series data and is ready to be forecast. On the other hand, if data is collected at irregular intervals, such as raw transaction data from a retail store or call center, then it must be aggregated by time period to create a proper time series. If needed, SAS Forecasting for Desktop performs this aggregation automatically.
TheNewProjectWizardbeginsbypromptingtheanalysttoselect the input data set. SAS Forecasting for Desktop has a limit of 1,000 time series per project. If your organization has more than 1,000 time series to forecast, you would split the work into multiple forecasting projects.
For example, it is common to use separate projects by brand or product category, by geography (e.g., country or sales region) or by individual forecasters.
Defining the forecast hierarchy
Most organizations organize their business in a hierarchical manner and create forecasts in the hierarchy. For example, the forecast for units sold might include the number of individual products (SKUs) at the bottom level, and then aggregated upward by product line, region and finally, an overall total company forecast. See Figure 1. In this case, the forecast hierarchy has four levels: product, product line, region and overall.
Figure 1: Defining a forecasting hierarchy.

3
SAS Forecasting for Desktop produces separate statistical forecasts at each level of a user-specified hierarchy, based on the history at each level.
Because each level of a hierarchy is forecast independently, it is highly unlikely that the statistical forecast at the second level of the hierarchy will equal the sum of the statistical forecasts at the first level, and so on. In this case, the forecasts must be reconciled within the hierarchy, so that the forecasts across the hierarchy levels are consistent (i.e., lowest level forecasts add up tothenextlevelandsoon).TheNewProjectWizardguidestheuser through the selection of an appropriate reconciliation technique: top down, bottom up or middle out.
Figure 2: Example of a forecasting hierarchy.
Assigning variable roles
Variable roles determine how input variables are used within a project. The required time variable is assigned a role of “Time ID.” As noted above, other input variables will determine the forecast’s hierarchical structure.
TheNewProjectWizardstepstheanalystthroughtheassignment of variable roles. The variable to be forecast – “units” in the preceding example – is assigned the role of dependent variable. In hierarchical forecasts, there can be only one dependent variable. Other possible variable roles include:
• Independentvariables–usedaspotentialexplanatoryinputsinthe forecast models.
• Reportingvariables–usedinpresentingtheresultsofthefore-cast.
• Adjustmentvariables–usedtotransformvariablesforforecast-ing (for example, conversion to a common currency).
Figure 3: Defining variable roles.
Defining events
Some models may be improved by the inclusion of events, which are occurrences out of the ordinary that may disturb the underlying time series. Some events are unplanned (such as fires or storms); their impact should be isolated so that it is not propagated in future forecasts. Other events are planned (holidays, promotions and price changes) and may be recurring; their impact should be assessed and included in future forecasts if appropriate.
Events can be added to regression, ARIMAX and unobserved components models (UCM) as event variables (i.e., variables that indicate when something out of the ordinary occurred in the past or will occur again in the future). Once specified, SAS Forecasting for Desktop statistically estimates the impact of the event in the past and uses the estimated impact to calculate future forecasts where the event recurs.
TheNewProjectWizard’sEventManagerguidestheuserthrough selecting, creating, editing, combining or deleting events. SAS Forecasting for Desktop includes a large collection of predefined events (mostly public holidays). In addition, externally generated tables of events can be imported easily into SAS Forecasting for Desktop. To define a custom event within SAS Forecasting for Desktop, the user specifies when the event occurred or will occur, the frequency of recurrence, and the appropriate shape. For example, an event may be very short-lived (such as a power outage or the Olympics) and modeled as a pulse of limited duration, or an event may represent an ongoing change (such as a new law or regulation, or a permanent price change) and thus modeled as a permanent-level shift. Once defined, events may be saved externally for use by other forecasters or in other forecast projects.
4
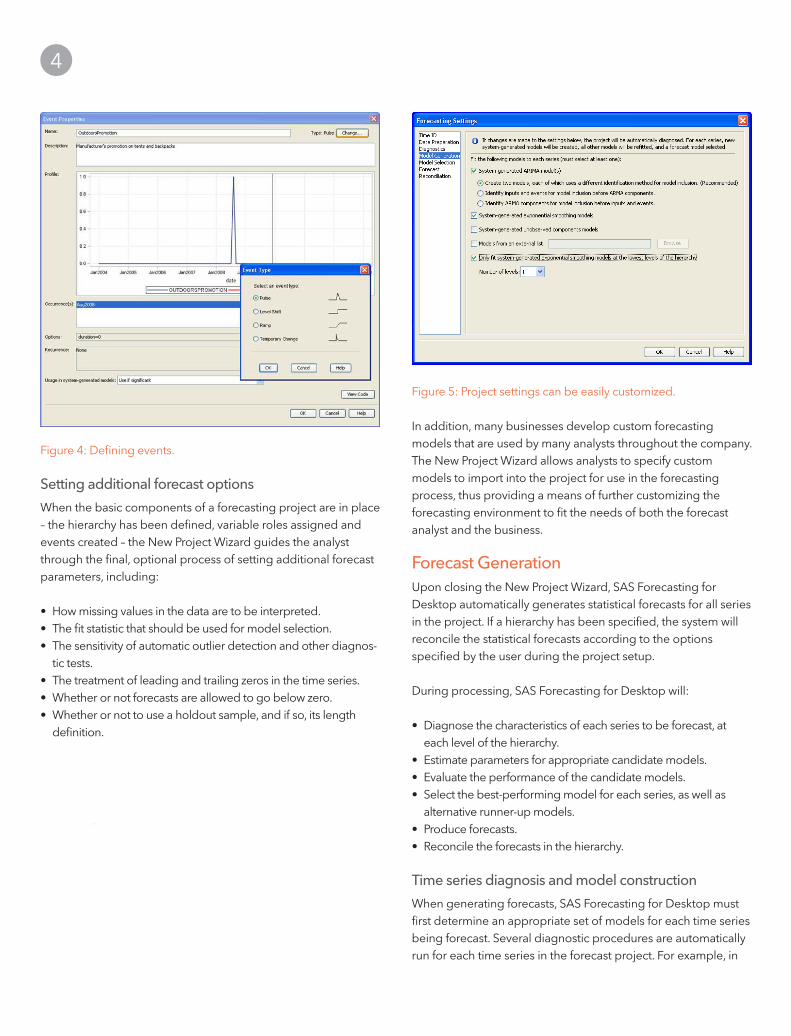
Figure 4: Defining events.
Setting additional forecast options
When the basic components of a forecasting project are in place – the hierarchy has been defined, variable roles assigned and eventscreated–theNewProjectWizardguidestheanalystthrough the final, optional process of setting additional forecast parameters, including:
• Howmissingvaluesinthedataaretobeinterpreted.• Thefitstatisticthatshouldbeusedformodelselection.• Thesensitivityofautomaticoutlierdetectionandotherdiagnos-
tic tests.• Thetreatmentofleadingandtrailingzerosinthetimeseries.• Whetherornotforecastsareallowedtogobelowzero.• Whetherornottouseaholdoutsample,andifso,itslength
definition.
SAS Forecasting for Desktop offers standard default settings for all of these options, simplifying the forecast preparation task for novice analysts and streamlining the process for advanced forecasters.
Figure 5: Project settings can be easily customized.
In addition, many businesses develop custom forecasting models that are used by many analysts throughout the company. TheNewProjectWizardallowsanalyststospecifycustommodels to import into the project for use in the forecasting process, thus providing a means of further customizing the forecasting environment to fit the needs of both the forecast analyst and the business.
Forecast GenerationUponclosingtheNewProjectWizard,SASForecastingforDesktop automatically generates statistical forecasts for all series in the project. If a hierarchy has been specified, the system will reconcile the statistical forecasts according to the options specified by the user during the project setup.
During processing, SAS Forecasting for Desktop will:
• Diagnosethecharacteristicsofeachseriestobeforecast,ateach level of the hierarchy.
• Estimateparametersforappropriatecandidatemodels.• Evaluatetheperformanceofthecandidatemodels.• Selectthebest-performingmodelforeachseries,aswellas
alternative runner-up models.• Produceforecasts.• Reconciletheforecastsinthehierarchy.
Time series diagnosis and model construction
When generating forecasts, SAS Forecasting for Desktop must first determine an appropriate set of models for each time series being forecast. Several diagnostic procedures are automatically run for each time series in the forecast project. For example, in

5
When selecting the best-fitting model, SAS Forecasting for Desktop automatically tests candidate independent variables and events – identified during the forecast setup process – and determines how they should be used in the forecast models. In addition to examining the contemporaneous relationships between independent and dependent variables, lagged and dynamic relationships are explored. If appropriate, variable transformations, lags and transfer function definitions are calculated.
Forecast summary
When the forecast process is complete, the Forecast Summary window provides an overview of important properties of the forecasting project by hierarchy level. The number of series forecast at each level of the hierarchy is given, as is the number of forecast failures (i.e., series that could not be statistically forecast, usually because the series contained too few observations). A bar chart displaying the distribution of fit statistics is shown, as are bar charts giving the distribution of model family and model characteristics (e.g., seasonal model, input variables present and outliers detected).
Figure 6: Forecast model statistics.
Forecasting ViewThe detailed output from a SAS Forecasting for Desktop project is accessed through a set of tabbed views. The first of these, the Forecasting View, displays the results of each time series forecast in a set of panels. The forecast graph panel shows the statistical forecast with 95 percent confidence intervals for each forecast; historical values are plotted, as are the fitted values for the historical time period. The data table shows the historical data, the output of the statistical forecast and the fit statistic. If the model is part of a reconciled hierarchy, the reconciled (adjusted) forecast and fit statistic are displayed. Manual forecast overrides are also shown in the data table. The model details – type of model as well as parameter estimates – are revealed in a pop-up window.
addition to the standard time series decomposition analysis, SAS Forecasting for Desktop tests for intermittency of the dependent variable, as well as the presence of outliers and structural shifts. If a time series is determined to be intermittent – that is, very few nonzero observations in the data – SAS Forecasting for Desktop will attempt to fit a specialized intermittent demand model. Otherwise, SAS Forecasting for Desktop constructs candidate exponential smoothing, ARIMAX and UCM models.
In addition to testing for intermittent dependent variables, SAS Forecasting for Desktop also examines each time series for outliers and shifts, and takes outliers and level shifts into consideration when constructing the forecast models.
SAS Forecasting for Desktop performs many of the same diagnostic tests on independent and event variables as are performed on dependent variables. An important feature of SAS Forecasting for Desktop is its ability to determine whether any of the independent or events variables are dynamically related to the dependent variable, and to specify the model accordingly. For example, when forecasting the demand for a product that exhibits a relationship with both product price and special promotional campaigns, SAS Forecasting for Desktop would detect and specify these separate dynamic relationships in an ARIMAX or UCM forecasting model.
Model selection
When the properties of the time series have been evaluated, SAS Forecasting for Desktop next evaluates a wide range of models, including unobserved components models (UCM), exponential smoothing models (ESM) and autoregressive integrated moving average models (ARIMA and ARIMAX), to determine which model best fits the time series data.
SAS Forecasting for Desktop features more than four dozen model-fit statistics, including scale dependent measures such as MSE (Mean Square Error), measures based on percentage error such as MAPE (Mean Absolute Percentage Error), conventional statistical measures such as AIC (Akaike’s Information Criterion) and many others.
Holdoutsamplescanbespecifiedsothatforecastingmodelsare selected not only by how well they fit the past data, but by how well they are likely to predict the future. If a holdout sample is specified – the preferred practice when enough data is available – the model will be selected based on the goodness-of-fit statistic in the holdout region (out-of-sample fit); otherwise in-sample fit is used to select the model. If a holdout sample was specified, the model parameters are estimated using the full range of data, including the holdout sample.

6
Creating forecast filters
Filters are automatically created for each hierarchy level and a Filter dialog box guides the user through the creation of additional custom filters. For example, a filter can be created to isolate all of the forecasts with a fit statistic value above a specified level, such as MAPE values greater than 5 percent. Filters are the basis of exception-based forecasting. Using filters, the forecast analyst can quickly identify the forecasts that are performing poorly and focus additional modeling attention on those time series. Other types of filters include filters on model properties (for example, model family or inclusion of independent variables), series properties (for example, number of missing values, maximum value or date of first and last observation) and if applicable, reconciled fit statistic.
Figure 9: Forecast filtering.
Entering forecast overrides
Statistical forecast values can be manually overridden by entering new values in the data table; the numbers can be typed in or the override calculator can be used to calculate new values by adjusting the statistical value by a fixed amount or percentage. The override values are shown in the forecast graph, and, after forecast reconciliation, the impacts of the overrides are shown at each level of the forecast hierarchy.
Navigating the forecast hierarchy
Output is generated for every time series in the forecast project, at every hierarchy level. To facilitate navigating through the forecast hierarchy, SAS Forecasting for Desktop provides two navigation modes: tree and table. In the tree form, an expandable view of the forecast hierarchy is show in the navigation panel, the highlighted series is “active” and the corresponding output is shown in the graph and data table. Clicking up and down the hierarchy tree changes the active series and the displayed output.
Figure 7: Forecasting View in tree form.
In the table form, the project series are listed in tabular form and columns for each hierarchy level are shown, as are the statistical and reconciled fit statistics. The table can be sorted by clicking on the column headers. In addition, a drop-down filter selector can be used to subset the displayed forecasts, and filters are automatically generated for each level in the forecast hierarchy.
Figure 8: Forecasting View in table form.
7
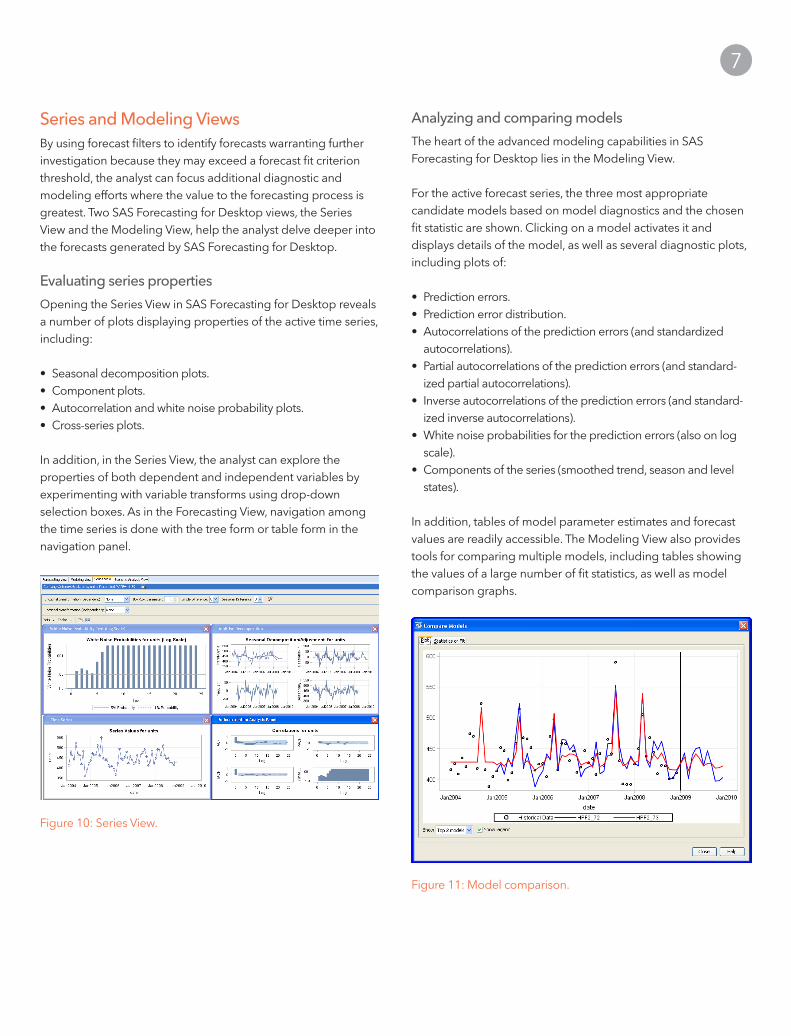
Analyzing and comparing models
The heart of the advanced modeling capabilities in SAS Forecasting for Desktop lies in the Modeling View.
For the active forecast series, the three most appropriate candidate models based on model diagnostics and the chosen fit statistic are shown. Clicking on a model activates it and displays details of the model, as well as several diagnostic plots, including plots of:
• Predictionerrors.• Predictionerrordistribution.• Autocorrelationsofthepredictionerrors(andstandardized
autocorrelations).• Partialautocorrelationsofthepredictionerrors(andstandard-
ized partial autocorrelations).• Inverseautocorrelationsofthepredictionerrors(andstandard-
ized inverse autocorrelations).• Whitenoiseprobabilitiesforthepredictionerrors(alsoonlog
scale).• Componentsoftheseries(smoothedtrend,seasonandlevel
states).
In addition, tables of model parameter estimates and forecast values are readily accessible. The Modeling View also provides tools for comparing multiple models, including tables showing the values of a large number of fit statistics, as well as model comparison graphs.
Figure 11: Model comparison.
Series and Modeling ViewsBy using forecast filters to identify forecasts warranting further investigation because they may exceed a forecast fit criterion threshold, the analyst can focus additional diagnostic and modeling efforts where the value to the forecasting process is greatest. Two SAS Forecasting for Desktop views, the Series View and the Modeling View, help the analyst delve deeper into the forecasts generated by SAS Forecasting for Desktop.
Evaluating series properties
Opening the Series View in SAS Forecasting for Desktop reveals a number of plots displaying properties of the active time series, including:
• Seasonaldecompositionplots.• Componentplots.• Autocorrelationandwhitenoiseprobabilityplots.• Cross-seriesplots.
In addition, in the Series View, the analyst can explore the properties of both dependent and independent variables by experimenting with variable transforms using drop-down selection boxes. As in the Forecasting View, navigation among the time series is done with the tree form or table form in the navigation panel.
Figure 10: Series View.

8
Figure 13: Model repository.
Scenario Analysis ViewForecasters and business analysts are frequently asked to conjectureaboutthefuture:“Howmanymoreunitswillbesoldif the price is lowered by 5 percent?” or “What would the impact of another late-winter blizzard be on production?” The answers to questions such as these can have a direct impact on the final forecast. One approach is to simply guess at the forecast impact by manually entering overrides into the forecast data table in the Forecasting View. A more sophisticated approach, however, is used in the Scenario Analysis View of SAS Forecasting for Desktop, in which the dynamic relationship between input variables and the forecast values, diagnosed and modeled by SAS Forecasting for Desktop, forms the crux of the scenario analysis.
Figure 14: Cross-series plot.
SAS Forecasting for Desktop scenarios are based on models that use independent variables, such as regression, ARIMAX and unobserved components models. Using the Scenario Analysis dialog box, a scenario is built based on a relationship (model) thathasalreadybeenestimatedbytheforecastingengine.Newvalues for the independent variables are entered and the model
Editing and creating models
Within the Modeling View, analysts can copy and edit models that were automatically generated by SAS Forecasting for Desktop, or develop new models from scratch using the Modeling dialog box. From within the Modeling dialog box, users can select a model family and edit model parameters, add independent variables and events to a model, and so on. By using the powerful Modeling dialog box in SAS Forecasting for Desktop, users can create virtually any form of ARIMA, subset and factored ARIMA, unobserved components, exponential smoothing, multiple linear regression, or intermittent demand models. The options offered in the Modeling dialog box vary dynamically with the type of model chosen.
Figure 12: Sample Modeling dialog box for an ARIMA model.
When the model specification is complete, the parameters of the new model are estimated and the model is added to the comparison table of models.
When a model is edited or created, the plots in the Modeling View are automatically updated, enabling users to easily evaluate the new model and compare it to existing models. In addition, models constructed or edited by the user can be added to the project’s custom model repository for future use. In this way, the model repository can become increasingly tailored to the business or forecasting problem over time.

9
All the tools needed to set up business rules and flag potentially problematic forecasts are readily available in SAS Forecasting for Desktop:
• Businessrulesandforecastingcriteriacaneasilybesetupusingthe Filter Generation dialog boxes. For example, the analyst may be happy with all forecasts with a MAPE less than 5 percent but may want to examine forecasts with a MAPE value that exceeds that threshold.
• Usingthefilterdrop-downboxintheListView,thelistoffore-casts requiring additional scrutiny can be generated quickly.
• UsingthetoolsintheForecastingView,forecastscanbemanu-ally adjusted using the forecast override function.
• IntheSeriesView,thepropertiesofthetimeseriesunderlyinga forecast exception can be evaluated, giving insight into the behavior of the forecast.
• ToolsintheModelViewallowtheanalysttocreateoreditfore-cast models to generate, if possible, forecasts that comply with business rules and forecast exceptions.
By following the principles of exception-based forecasting, an analyst can quickly identify the forecasts that are performing poorly and focus additional attention on those time series. The net result of the focused effort stemming from exception-based forecasting is a significant increase in efficiency of the entire forecast process and a shortening of forecast-cycle time.
Forecast ReportsPublished reporting of forecasting results, or additional analysis, can be done with SAS or other software (such as Microsoft Excel). SAS Forecasting for Desktop makes all data relating to a forecasting project available in SAS data sets.
is rerun, generating new forecast values. Multiple scenarios can be run, saved and the results compared. In addition, a scenario’s results can be used as forecast overrides and incorporated in the final reconciliation of the forecasting project.
Figure 15: Overriding forecast based on scenario analysis.
Exception-Based ForecastingWhen faced with forecasts for hundreds or thousands of time series, manually reviewing each forecast may not be feasible – the effort and time required would not be commensurate with the reward. Instead, forecasters and planners turn to exception-based forecasting, in which business rules and forecasting criteria are established and forecasts that meet all the rules and criteria are automatically passed on. The analysts then focus their attention on those forecasts that fail to meet a rule or pass a forecasting criterion. These are the forecast exceptions.
Figure 16: Forecast exceptions.

10
ConclusionSAS Forecasting for Desktop delivers the power of SAS forecasting in an easy-to-use and affordable package. It provides the sophisticated time series diagnostics, model building and automatic forecasting capabilities of SAS to novice forecasters through a user-friendly GUI. Options within the GUI allow advanced users to access the more sophisticated capabilities, if they so desire. Thus, as an extensible and flexible system, SAS Forecasting for Desktop meets the needs of both novice forecasters who need to move through the production forecasting process quickly, as well as more experienced forecast analysts who wish to delve deeply into the forecast model-building process.
References
SAS White PapersTurbo-Charging Spreadsheets: Accessing SAS® Forecast Server from Microsoft Excel
Large-Scale Automatic Forecasting Using Inputs and Calendar Events
What Management Must Know About Forecasting
Worst Practices in Business Forecasting
Forecast Value Added Analysis: Step-by-Step
Recommended ReadingBox, G. E. P, Jenkins, G. M., and Reinsel, G. C. (1994). Time Series Analysis: Forecasting and Control.EnglewoodCliffs,NJ:PrenticeHallInc.
Brocklebank, John C. and Dickey, David A. (2003). SAS® for Forecasting Time Series, Second Edition.
Chatfield, C. (2000). Time Series Forecasting. Boca Raton, FL: Chapman&Hall/CRC.
Gilliland, M. (2010). The Business Forecasting Deal.NewYork:John Wiley & Sons Inc.
Makridakis,S.G.,Wheelwright,S.C.,andHyndman,R.J.(1997).Forecasting: Methods and Applications.NewYork:JohnWiley&Sons Inc.

To contact your local SAS office, please visit: sas.com/offices
SAS and all other SAS Institute Inc. product or service names are registered trademarks or trademarks of SAS Institute Inc. in the USA and other countries. ® indicates USA registration. Other brand and product names are trademarks of their respective companies. Copyright © 2014, SAS Institute Inc. All rights reserved. 106084_S119151.0214