Embed Size (px)
Citation preview
DESIRE Simulation tool to demonstrate data products
for security applications
Federico Letterio, Rui Mestre, Sofia Freitas, Fernando Valcarce, Roberto
Fabrizi, Omar Barrilero, Bruno Perez, Pierre Massip, Thierry Ranchin
To cite this version:
Federico Letterio, Rui Mestre, Sofia Freitas, Fernando Valcarce, Roberto Fabrizi, et al..DESIRE Simulation tool to demonstrate data products for security applications. Work-shop on Simulation for European Space Programmes (SESP), Mar 2015, Noordwijk, Nether-lands. Session 4, Paper #100, 2015, sesp2015 proceedings (http://congrexprojects.com/2015-events/15c06/proceedings). <http://congrexprojects.com/2015-events/15c06/proceedings>.<hal-01161488>
HAL Id: hal-01161488
https://hal-mines-paristech.archives-ouvertes.fr/hal-01161488
Submitted on 8 Jun 2015
HAL is a multi-disciplinary open accessarchive for the deposit and dissemination of sci-entific research documents, whether they are pub-lished or not. The documents may come fromteaching and research institutions in France orabroad, or from public or private research centers.
L’archive ouverte pluridisciplinaire HAL, estdestinee au depot et a la diffusion de documentsscientifiques de niveau recherche, publies ou non,emanant des etablissements d’enseignement et derecherche francais ou etrangers, des laboratoirespublics ou prives.


DESIRE Simulation Tool to Demonstrate Data Products for Security Applications
Workshop on Simulation for European Space Programmes (SESP)
24-26 March 2015
ESA-ESTEC, Noordwijk, The Netherlands
Federico Letterio(1), Rui Mestre(2), Sofia Freitas(2), Fernando Valcarce(3), Roberto Fabrizi(3), Omar Barrilero(3), Bruno Perez(3), Pierre Massip(4), Thierry Ranchin(4)
(1)DEIMOS Space S.L.U., Ronda de Poniente 19, Edificio Fiteni VI, 2-2, 28760 Tres Cantos, Madrid, Spain
Email: [email protected]
(2)DEIMOS Engenharia, Av. D. Joao II, Lt 1.17.01, 10º, Ed. Torre Zen, 1998-023 Lisboa, Portugal Email: [email protected]
Email: [email protected]
(3)ISDEFE, Calle de Beatriz de Bobadilla, 3, 28040 Madrid, Spain Email: [email protected] Email: [email protected]
Email: [email protected] Email: [email protected]
(4) MINES ParisTech / ARMINES, Rue Claude Daunesse - CS 10207, F-06904 Sophia Antipolis Cedex
Email: [email protected] Email: [email protected]
INTRODUCTION A simulation tool has been designed and developed as part of an ESA funded activity called ‘The design and development of a simulation tool to demonstrate data products for security applications (DESIRE)’. This activity is aimed at a simulation tool which demonstrates the added value of including a thermal infrared (TIR) imager within different space-borne architecture options comprising different capabilities i.e. SAR (Synthetic Aperture Radar), optical, AIS etc. Future simulation tool options could also include hyperspectral etc.
The simulator has been developed considering system architects as end users that need to assess the added value of infrared data when they are combined with other data.
The DESIRE Tool development has been based on mission scenarios that address the three priority areas identified in the Copernicus services focused on security e.g. Border security, Maritime Surveillance and Support to European Union External Action. From the user requirements analysis conducted within the study, particular relevant scenarios were identified: Oil Spill Detection, Maritime Ship Surveillance, Industrial Site Monitoring and Urban Heat Islands.
The simulator is composed of an external interface capable of ingesting different input products at different processing levels (from L0 to L2, depending of the data type), a processing chain for each data type to bring the products up to L3, a co-registration module, different data combination and data fusion techniques (in order to generate merged products or maps with information extracted from different products), and a set of modules to customize and validate the data-fusion products depending on the scenario under investigation.
DESIRE has been implemented as a flexible, configurable and modular simulation tool, to be used for existing and firmly planned in-orbit capability and to combine these capabilities with real or synthetic TIR data products to demonstrate the added value of TIR data. DESIRE is based on the simulation framework OpenSF.
The modular design of DESIRE allows the future extension of the simulator functionality with additional processing modules in order to deal with a wider range of scenarios and in-orbit architectures.

USER REQUIREMENTS The DESIRE simulator has as objective to address the priority areas identified in the Copernicus services for security. In order to identify user requirements in this area, a review of the key user needs documentation previously developed in the course of related studies [1], [2], and [3]. Additional documentation from projects in the European Commission context was also reviewed [4], [6]. The user requirements were organized to address the needs to analyse possible scenarios of applicability for the simulator. The scenario analysis results are summarized in Table 1.
Table 1: Scenarios and Associated Requirements [1,6]
Application Processing Level Spatial Resolution
Radiometric Accuracy
Radiometric Resolution
TIR Spectral Resolution Sensors
Border Security 2 (TOA Brightness Temperature)
< 5 m Undefined 0,5 - 1 K 10-12 µm SAR
Maritime surveillance (smuggling, drug trafficking, illegal immigration)
3 (Sea Surface Temperature)
< 10 m Undefined 0,5 - 1 K 10-12 µm Optical, SAR
Maritime safety 3 (Sea Surface Temperature)
< 15 m Undefined 0,5 – 1 K 10-12 µm Optical, SAR
Non EU Maritime Surveillance (Piracy, illegal fishing)
3 (Sea Surface Temperature)
< 15 m Undefined 0,5 – 1 K 10-12 µm Optical, SAR
Monitoring of Volcanoes (ash) 3 (Land Surface Temperature)
1-3 km 1 K 0,5 - 1 K 10-12 µm Optical
Trafficability 3 (Land Surface Temperature)
30 m 1 - 2 K 0,1 - 0,3 K 10-12 µm SAR
Oil Spill Detection/ Monitoring 3 (Sea Surface Temperature)
50 m 1 K 0,1 - 0,5 K 10-12 µm Optical, SAR
Industrial / Power Plant Monitoring 3 (Sea Surface Temperature)
5 - 30 m 1 - 2 K 0,5 - 1 K Spectrometry Optical
Urban Heat Islands 3 (Land Surface Temperature)
< 500 m 1 K 0,1 - 0,3 K Spectrometry Optical
Monitoring of Refugee Camps 2 (TOA Brightness Temperature)
< 10 m Undefined 0,5 - 1 K 10-12 µm Optical, SAR
Treaty Compliance / Non-Proliferation Treaty
3 (Land/Sea Surface Temperature)
5-30 m Undefined 0,5 - 1 K 10-12 µm Optical, SAR
SCENARIOS DEFINITION Starting from the user needs analyses, grouped by scenario, an analysis of security scenarios was performed, identifying four scenarios to be assessed within the simulation tool. The scenario assessment was very broad and, in order to analyze and clearly identify the added value of thermal data in security and surveillance applications, the scenarios have been described in a detailed manner: a list of applications were elaborated and grouped into three subtopics identified under the Copernicus Security set of services: Border security, Maritime Surveillance and Support to European Union External Action. Areas where thermal infrared could potentially add value were investigated. A number of possible scenarios were identified. In order to focus efforts and to select a representative number of scenarios to be implemented within the simulation tool, a scenario ranking methodology using a figure of merit was established. The aim of this figure of merit was to quantify the relevance and extent to which TIR data could add value to the overall information being provided. For establishing the relevance level for implementation of a scenario two indexes were considered: TIR sensitivity and TIR usefulness. The TIR sensitivity measures how applicable the thermal footprint was to the observed phenomena (e.g. it is “0” if there is no response in the TIR bandwidth and “2” if there is a high response); the TIR usefulness measured how the impact of TIR data to fill a knowledge gap for a given phenomena (e.g. “0” if another sensor already gave all the necessary information, “2” if no sensor was able to provide the required information). Table 2 shows the full list of scenarios identified and the relevance figure of merit ranking is reported, summarizing their relevance.
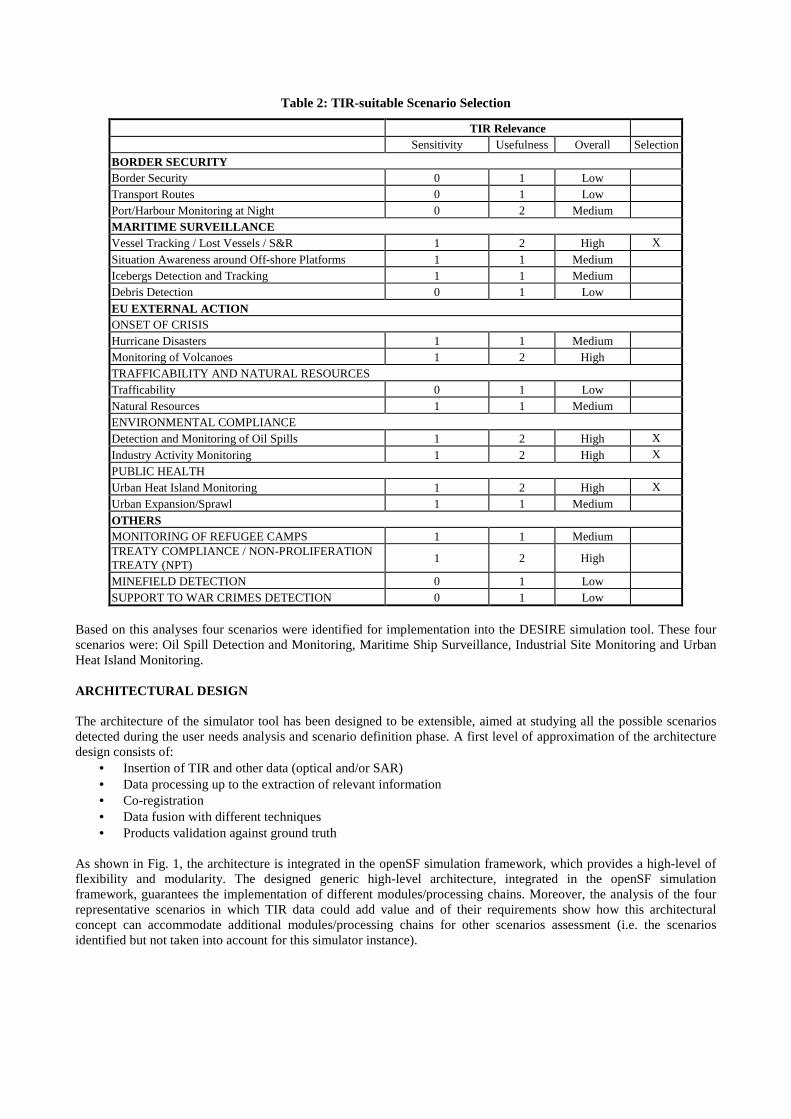
Table 2: TIR-suitable Scenario Selection
TIR Relevance Scenarios Sensitivity Usefulness Overall Selection
BORDER SECURITY Border Security 0 1 Low Transport Routes 0 1 Low Port/Harbour Monitoring at Night 0 2 Medium MARITIME SURVEILLANCE Vessel Tracking / Lost Vessels / S&R 1 2 High X
Situation Awareness around Off-shore Platforms 1 1 Medium Icebergs Detection and Tracking 1 1 Medium Debris Detection 0 1 Low EU EXTERNAL ACTION ONSET OF CRISIS Hurricane Disasters 1 1 Medium Monitoring of Volcanoes 1 2 High TRAFFICABILITY AND NATURAL RESOURCES Trafficability 0 1 Low Natural Resources 1 1 Medium ENVIRONMENTAL COMPLIANCE Detection and Monitoring of Oil Spills 1 2 High X
Industry Activity Monitoring 1 2 High X
PUBLIC HEALTH Urban Heat Island Monitoring 1 2 High X
Urban Expansion/Sprawl 1 1 Medium OTHERS MONITORING OF REFUGEE CAMPS 1 1 Medium TREATY COMPLIANCE / NON-PROLIFERATION TREATY (NPT)
1 2 High
MINEFIELD DETECTION 0 1 Low SUPPORT TO WAR CRIMES DETECTION 0 1 Low
Based on this analyses four scenarios were identified for implementation into the DESIRE simulation tool. These four scenarios were: Oil Spill Detection and Monitoring, Maritime Ship Surveillance, Industrial Site Monitoring and Urban Heat Island Monitoring. ARCHITECTURAL DESIGN The architecture of the simulator tool has been designed to be extensible, aimed at studying all the possible scenarios detected during the user needs analysis and scenario definition phase. A first level of approximation of the architecture design consists of:
• Insertion of TIR and other data (optical and/or SAR) • Data processing up to the extraction of relevant information • Co-registration • Data fusion with different techniques • Products validation against ground truth
As shown in Fig. 1, the architecture is integrated in the openSF simulation framework, which provides a high-level of flexibility and modularity. The designed generic high-level architecture, integrated in the openSF simulation framework, guarantees the implementation of different modules/processing chains. Moreover, the analysis of the four representative scenarios in which TIR data could add value and of their requirements show how this architectural concept can accommodate additional modules/processing chains for other scenarios assessment (i.e. the scenarios identified but not taken into account for this simulator instance).

Data
Ingestion
Data
Processing
Co-registration
Data
Fusion
Technique
Additional Processing
TIR
Ingestion
Product Combination and
Validation
SAR
Ingestion
Optical
Ingestion
Other
Ingestion
TIR
L1/L2/L3
Processing
SAR
L1/L2/L3
Processing
Optical
L1/L2/L3
Processing
Other
L1/L2/L3
Processing
TIR
L1/L2/L3
Processing
TIR
L1/L2/L3
Processing
SAR
L1/L2/L3
Processing
SAR
L1/L2/L3
Processing
Optical
L1/L2/L3
Processing
Optical
L1/L2/L3
Processing
Other
L1/L2/L3
Processing
Other
L1/L2/L3
Processing
Co-registration
Data
Fusion
Technique
Data
Fusion
Technique
Data
Fusion
Technique
Product Combination and
ValidationAdditional Processing (Combination, validation,
visualization, expert system)
Figure 1: DESIRE Generic High-level Architecture
The adopted openSF simulation framework allows the user to set up and perform simulation activities for each one of the proposed scenarios, configuring accordingly the simulation inputs, that can be generically grouped into four main categories:
• Input Data, i.e. the TIR, SAR and/or optical products to be processed by the simulation chains. • Configuration Parameters, i.e. input values that configure the behaviour of the processing modules. • Ancillary Data, i.e. input data needed by the processing modules (not including behaviour configuration) e.g.
geo-location, navigation and calibration data for a given product or GIS information from a data repository. • Ground Truth, i.e. reference data representing the ground truth to be used for validating the results of the
processing chains. Each simulation chain produces different type of outputs, that can be categorized as follows:
• Processed Data, i.e. the data processed up to their highest level foreseen for the given scenario. • Fused Data, i.e. the fused data product foreseen for the given scenario. • Validation Outputs, i.e. the outputs of the products validation against ground truth. • Intermediate Outputs, any output generated by the simulation processing chain.
SIMULATOR CAPABILITIES Scenario 1: Oil Spill Detection and Monitoring. In the Oil Spill Detection processing chain, the identified input data is TIR data and SAR data. Optical data is excluded for oil spill detection due to false alarms and confusions with other features which may result e.g. ocean colour, illumination conditions etc. The TIR chain processes the data in order to obtain a map of oil spill perimeter and thickness estimation, while the SAR chain processes the data in order to obtain a map of oil spill detection confidence level. Then the maps are fused in a unique product bringing information retrieved from both chains (Fig.2). A validation module assesses, at the end of the processing chains, the information extracted from TIR and SAR data against a ground truth (derived from NOAA reports and photointerpretation from High Resolution VIS data), in order to demonstrate the added value of TIR data. Scenario 2: Maritime Ship Surveillance. In the Maritime Ship Surveillance processing chain, the input data can be either TIR, SAR and optical data. In all three processing chains the data are processed in order to produce ship detection maps. Moreover using data fusion techniques, the optical data can be used to increase the TIR spatial resolution in a fused data product, for a better visual interpretation of the TIR product by the user (as TIR data have coarser resolution that optical data). The three detection maps (TIR, SAR and optical) are then combined to generate one overall fused data product (Fig.3), in which the different sensors detections appear. A validation module assesses the detection maps against a ground truth given by AIS data, in order to demonstrate the added value of TIR data. The validation module can also correct vessel trajectories retrieved by AIS data by means of the detections computed by the DESIRE simulator.

TIR Product SAR Product Classified Fused Oil Spill Map
Figure 2: Oil Spill Scenario: Inputs (left and center) and Fused Data Product (right).
TIR Product SAR Product Optical Product
Detection Map Corrected Vessel Trajectory
Figure 3: Maritime Ship Surveillance Scenario: Inputs (above), Fused Data Product (bottom left) and Augmented Trajectory (bottom right)
Scenario 3: Industrial Site Monitoring. In the Industrial Site Monitoring processing chain, the input data can be either TIR, SAR and optical data. In this scenario, the optical data is used to increase the TIR spatial resolution in a fused product, in order to better characterize thermal response of e.g. buildings, to better understand the context of thermal anomalies (e.g. the thermal signature of the effluent, Fig.4). The output is a fused (with ARSIS technique) optical-TIR product over land and a characterized TIR product on the water. In this scenario, the optical data is used to increase the TIR spatial resolution in a fused product, in order to better caracterize thermal response of e.g. buildings, to better understand the context of thermal anomalies.
Moreover the SAR data can be co-registered with TIR and optical data in order to detect changes using visualization tools.
TIR Product SAR Product
Optical Product TIR-optical Fused Product
Figure 4: Industrial Site Monitoring Scenario: Input Data (above and bottom left) and Fused Product (bottom right)
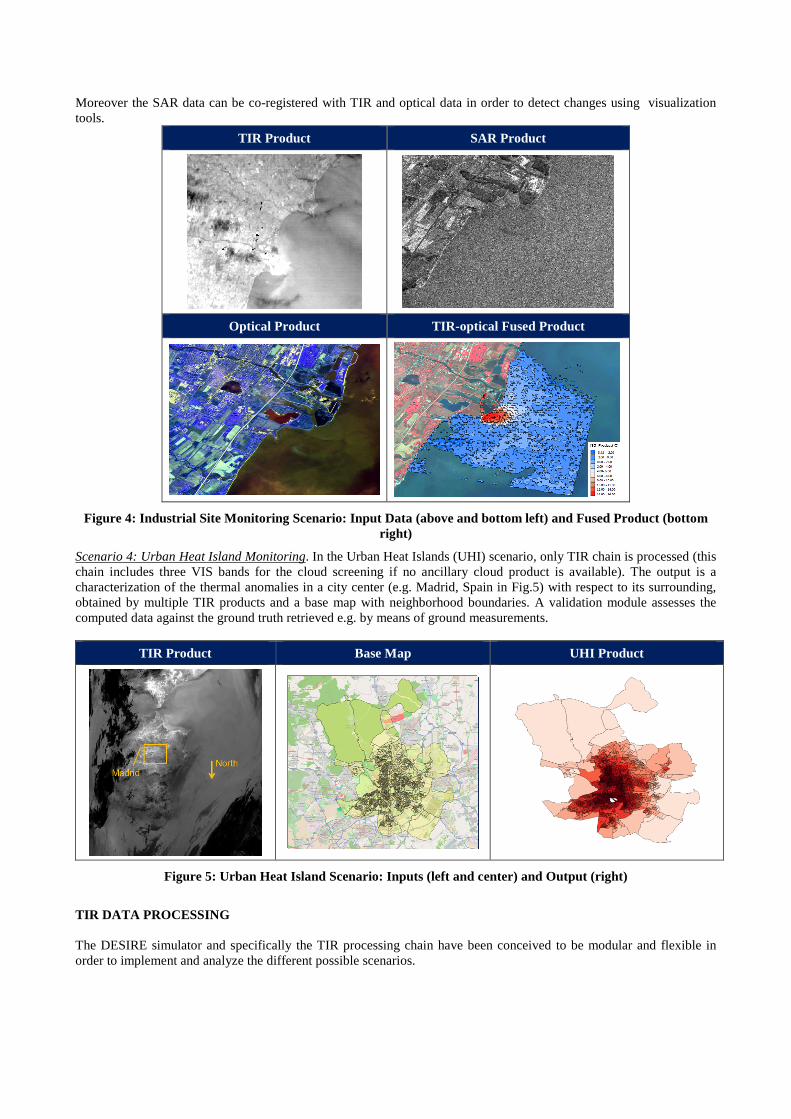
Scenario 4: Urban Heat Island Monitoring. In the Urban Heat Islands (UHI) scenario, only TIR chain is processed (this chain includes three VIS bands for the cloud screening if no ancillary cloud product is available). The output is a characterization of the thermal anomalies in a city center (e.g. Madrid, Spain in Fig.5) with respect to its surrounding, obtained by multiple TIR products and a base map with neighborhood boundaries. A validation module assesses the computed data against the ground truth retrieved e.g. by means of ground measurements.
TIR Product Base Map UHI Product
Figure 5: Urban Heat Island Scenario: Inputs (left and center) and Output (right)
TIR DATA PROCESSING The DESIRE simulator and specifically the TIR processing chain have been conceived to be modular and flexible in order to implement and analyze the different possible scenarios.

The chain is divided in three high-level stages according to the outputs that each module produces:
• Level 1, with ingestion and preprocessing of all the data in order to feed the Level 2 modules. • Level 2, generating the geophysical variables: sea surface temperature and land surface temperature. • Level 3, extracting, classifying, customizing and validating the L2 products. Variables are mapped on uniform
space-time grids, usually with some completeness and consistency. The current simulator implementation is able to ingest the following input data:
• MODIS - MOD02: 15 TIR channels (from band 20 to 36, except band 26). Spatial resolution of 1 km. • ASTER - AST_L1B: 15 bands (3 VNIR up to 15m resolution, 1 NIR, 6 SWIR with 30m, 5 TIR with 90m). • MASTER - MASTERL1B: 50 bands. MASTER is a multispectral airborne instrument.
Some considerations worth highlighting are: • The Data Ingestion module extracts data from the different considered sensors into a standard format to be
seamlessly processed by the TIR processing chain. This allows to introduce new sensors easily. • Generic processing which are scenario non-specific:
o Re-sampling and Region of Interest selection can only be performed upon user request in the specific area of interest, in order to reduce the processing time.
o Masks can be applied to the L1B data if required (i.e. land/sea or cloud mask). A customized land cover for the ingested image can be produced in order to be able to discriminate between rural and urban areas.
o Top Of Atmosphere (TOA) brightness temperatures are computed o Land and sea surface temperatures are computed, thanks to multiple TIR products o Filters, gradients, classifications and/or contextual analysis are applied, depending on the scenario o Results are combined and validated using external data (either ground truth or other chains outputs)
• Re-projection is not performed until the end of the chain to avoid altering radiance values. • Some modules (e.g. co-registration and geolocation/reprojection) are specifically dedicated to allow fusion and
combination with other data sources (e.g. optical/SAR data and/or external ancillary data). DATA FUSION In the DESIRE simulator development, both image fusion (i.e. at pixel level) and object fusion (i.e. of information extracted from different products) concepts have been used. For the fusion of TIR and optical (visible spectral range) images, the ARSIS (Amélioration de la Résolution Spatiale par Injection de Structures, i.e. Improving Spatial Resolution by Structure Injection) concept has been used [1, 2]. The fusion of TIR with visible imagery is evaluated in order to provide a combined product, which enables the resolution of TIR data to be promoted up to the same resolution as visible imagery.
In the Industrial Sites Monitoring scenario, the fused product allows for the discrimination of "active" parts of the industrial site of interest. The difference in temperature due to activities in industrial plants can be revealed by the TIR signatures of infrastructure/buildings within the image. The fusion of TIR and visible data also brings contextual information regarding industrial plant operations.
In the Maritime Ship Surveillance scenario, the difference of temperatures due to activities or due to the solar irradiation being emitted can be revealed by the TIR signature of the ship. In this scenario, the fusion of TIR and visible data will also bring contextual information of interest for a user. For combining the results of the ship detection within different modalities of observation (TIR, Visible and SAR data), an object fusion approach using a weighted majority voting algorithm was applied [9].
For combining maps of oil spill detection in TIR and SAR, the idea of Méaille [10] has been followed. In his work, he combined a set of maps acquired from different approaches for benthic population of sea floor using reliability indexes defined by experts. In the case of the DESIRE simulator, this approach was used for oil spill maps derived from different sensors. REAL DATA TEST CASES AND CONCLUSIONS A simulator tool (DESIRE) has been designed and developed in order to help system designers to assess the added value of TIR data when combined with SAR and optical images. DESIRE has been conceived to address the priority areas identified in the Copernicus services for security and, after a comprehensive analyses of user needs associated with the possible scenarios, four representative scenarios have been selected as case studies to be implemented into the simulation tool (and therefore these scenarios acted as the baseline for the simulator system requirements definition):

Oil Spill Detection and Monitoring, Maritime Ship Surveillance, Industrial Site Monitoring and Urban Heat Island Monitoring. A generic architecture has been designed. Each processing chain comprises low-level modules, in order to maximise the flexibility of the simulator to enable future upgrades and extensions. The openSF simulation framework has been used for managing the simulations. The openSF environment provides built-in capabilities such as custom processing chains editing or default post-execution operations, providing the user with a high level of usability. The TIR processing chains are able to ingest three different data products: MODIS, ASTER and MASTER sensors (some of them are airborne sensors in order to mimic a spaceborne high resolution TIR). Its processing chain has broken down into several modules, for maximising their re-use. The optical and SAR chains have been designed to be more generic (they are not designed for specific products), also allowing an easy ingestion of synthetic data. The data fusion has been addressed using different strategies, depending on the scenario requirements, spanning from image fusion to object fusion. All the scenarios processing ends with customization and validation modules, in order to give to the user an assessment of the TIR added value with respect to the ancillary SAR/optical data. Moreover these modules can be used for validating the simulation results against a ground truth. A validation campaign of the DESIRE simulation tool is planned in the first quarter of 2015. For each scenario, validation cases with real products have been designed and ground truth retrieved from different sources. Some preliminary results can be summarized as follows:
• Oil Spill Detection and Monitoring: the TIR data adds information to SAR observation, giving estimation of the slick thickness and providing addition information regarding the probability of detection.
• Maritime Ship Surveillance: following preliminary analysis, TIR does not seem to be able to increase the detection capability provided by SAR and optical data, nor does it refine the detection of false positives/negatives except under certain conditions (e.g. sun-glint). However, TIR is useful to reduce the revisit time and improve the monitoring of large vessels’ trajectories.
• Industrial Site Monitoring: the TIR data fused with optical ones increase the contextual understanding of the scenario and helps to detect thermal activity within an industrial site with improved accuracy.
• Urban Heat Island Monitoring: the TIR data fused with a base map (shapefile representing urban districts) increases the contextual understanding of the scenario, enabling the detection of urban heat islands within critical population areas of an urban environment.
REFERENCES [1] Gkt038_022_1-1_DL6. Fuego Synthesis Study. [2] “Results of the Studies on the Security Dimension of GMES”, 7th DOSTAG Meeting Paris, 8-9 May 2012. [3] GMS.TN.ASF.005, “The Security dimension of GMES: Final Report”. [4] “User requirements, systems specification and cluster service validation plans”, LIMES-D2100.1, D2100.2,
D3100.1, D3100.2. [5] EC/DG Fisheries and Maritime Affairs/Maritime Policy Task Force, “Integrated Maritime Policy for the EU:
Working Documents on Offshore activities of coastal EU Member States and cross border cooperation”, Nov. 2007.
[6] Frontex, “Eastern Borders Risk Analysis Network”, Annual Overview, 2011. [7] T. Ranchin, B. Aiazzi, L. Alparone, S. Baronti, and L. Wald, “Image fusion - the ARSIS concept and some
successful implementation schemes,” International Journal of Photogrammetry & Remote Sensing, 58:4–18, 2003.
[8] T. Ranchin, and L. Wald, “Fusion of high spatial and spectral resolution images: The ARSIS concept and its implementation,” Photogrammetric Engineering and Remote Sensing, 66(1):49–61, 2000.
[9] J. Kittler, M. Hatef, R.P.W. Duin, and J. Matas, IEEE Transactions on Pattern Analysis and Machine Intelligence, 20(3):226-239, 1998.
[10] R. Méaille, “Several applications of Geographical Information Systems,” Université de Nice Sophia-Antipolis. Retrieved from https://pastel.archives-ouvertes.fr/pastel-00957266, 1988.