Embed Size (px)
Citation preview
DESIGNING'EFFECTIVE'STORE!RELEASE&COVERS'FOR'THE'LONG!TERM%
CONTAINMENT)OF)MINE)WASTE)–!THE$ROLE%OF%VEGETATION%(STAGE%2)#
##Project#summary#report# for# the# investigations#at# the# trial# sites#Mt# Isa#and#Cobar#by:###
Research(team:(The$University$of$Queensland(Centre(for(Mined(Land(Rehabilitation(
The(University(of(Queensland(
##Contact:#
Thomas#Baumgartl# [email protected]#David#Mulligan# [email protected]#David#Doley# [email protected]#
December(2012(

DESIGNING'EFFECTIVE'STORE.RELEASE'COVERS'–'THE'ROLE'OF'VEGETATION
2
(

DESIGNING'EFFECTIVE'STORE.RELEASE'COVERS'–'THE'ROLE'OF'VEGETATION
3
This research was initiated and organised by ACMER (Australian Centre for Minerals Extension and Research) and sponsored by:
MAJOR SPONSOR
• Alcoa World Alumina Australia
• BHP Billiton Iron Ore
• Goldcorp Inc (Peak Gold Mines) – trial site ‘Cobar’
• Xstrata Zinc (Mt Isa Mines) – trial site ‘Mt Isa’
• International Network for Acid Prevention (INAP)
MINOR SPONSOR
• Barrick Gold of Australia Ltd
• BHP Billiton Mitsubishi Alliance (BMA) Coal
• Rio Tinto
• MMG – Minerals and Metals Group (Century)
• Straits Resources Ltd
• Panoramic Resources Ltd
The research team consisted of the following research groups and advisors:
The University of Queensland
Thomas Baumgartl, David Doley, David Mulligan, Anne Schneider (PhD student)
The University of Western Australia
Christoph Hinz, Erik Veneklaas, Tim Bleby, Willis Gwenzi (PhD student)
The University of Technology Sydney
Derek Eamus, Isa Yunusa (Postdoctoral fellow)
Advisors
Mike O’Kane (OKC)
Ward Wilson (UBC)

DESIGNING'EFFECTIVE'STORE.RELEASE'COVERS'–'THE'ROLE'OF'VEGETATION
4
DESIGNING'EFFECTIVE'STORE.RELEASE'COVERS'–'THE'ROLE'OF'VEGETATION
5
DESIGNING(EFFECTIVE(STOREHRELEASE(COVERS(FOR(THE(
LONGHTERM(CONTAINMENT(OF(MINE(WASTE(–(THE(ROLE(OF(
VEGETATION((STAGE(2)(
H(Research(outcomes(from(investigations(at(the((
trial(sites(Mt(Isa(and(Cobar(H(
Executive(Summary(
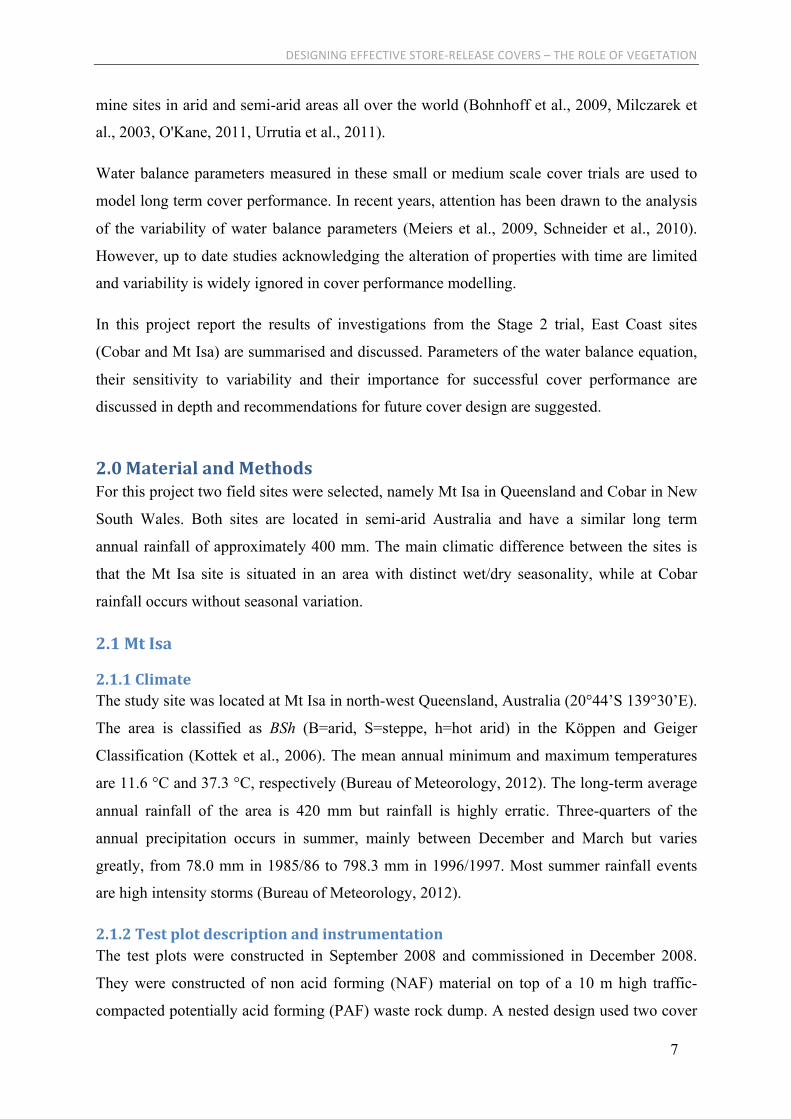
In arid and semi-arid environments evapotranspiration (ET) cover systems are widely
suggested as a viable method to mitigate the occurrence of (contaminated) seepage from
hazardous mine waste into the adjacent environment. The theory of ET covers is based on the
water balance equation with the aim of minimising seepage with the objective to influence the
design of key parameters of the water balance equation. Vegetation can play an important role
to influence the water balance and improve the performance of ET covers.
The performance of two ET cover trials constructed from benign waste rock in Mount Isa and
Cobar has been investigated. The water balance equation parameters and their variability was
analysed over a period of three years. The investigations showed, that seasonal and inter-
annual variations in rainfall critically influence cover performance. For successful cover
system operation, the return periods for higher than average rainfall must be taken into
account. In addition, failure of ET covers is more likely in areas with marked rainfall
seasonality. Water holding capacity and plant available water content are low in covers
constructed from waste rock. Changes in water holding capacity due to variation in particle
size distribution are likely and critically influence cover performance. The application of
topsoil can be beneficial for water ingress control through runoff, but a balance has to be
struck between runoff, erosion and plant available water. Changes in vegetation composition
only influence evapotranspiration water losses at plant coverage exceeding 50 %, which is
unrealistic in semi-arid areas.
The outcome of the project showed that the capacity of cover systems designed as
evapotranspiration covers (also known as store-and-release covers) to hold and dispose of
received rainfall is strongly dependent on materials and climate. Its function can be greatly
affected by preferential water flow in cover materials which contain rocks, so their
effectiveness can be limited, even in semi-arid and arid environments. Vegetation has a major
impact on the extraction of water only in climatic settings where precipitation is sufficient

DESIGNING'EFFECTIVE'STORE.RELEASE'COVERS'–'THE'ROLE'OF'VEGETATION
6
and relatively uniformly distributed, and where the cover material provides sufficient storage
for successive precipitation events.
In order to improve the reliability of long term cover performance, the variability of rainfall
and water holding capacity of the cover have to be analysed carefully through water balance
analysis and numerical modelling. Changes in cover properties over time are likely and only
mid- to long-term monitoring can provide confidence in the performance of waste covers.
1.0 Introduction(Mining activities result in the production of waste rock materials and tailings materials, both
of which, depending on geology and processing methodology, can be hazardous to the
adjacent natural environment (Lottermoser, 2007). For mine site relinquishment,
contamination of the natural environment by mining waste has to be prevented.
Common practice for the to minimisation of water ingress into hazardous waste, and
consequent seepage of contaminated water into the environment, is to isolate the hazardous
waste by enclosing it within a cover system (INAP: The International Network for Acid
Prevention, 2011). In arid and semi-arid areas evapotranspiration cover systems are often
proposed as a suitable method to minimise rainfall percolation into waste material (O'Kane
Consultants Inc., 2004, Williams, 2011, Wilson et al., 2003).
Evapotranspiration cover designs are based on the principle of the water balance equation
(Eq.1)
)( TEVSQPL +−Δ−−=
With L= seepage (mm), P= precipitation (mm), Q = runoff (mm), ΔS= change in moisture
storage (mm), EV= evaporation (mm) and T= transpiration (mm).
Evaporation and transpiration are often combined into the term evapotranspiration (ET),
giving the cover type assessed in this project its name.
The evapotranspiration cover method was developed in the 1980’s with the first cover system
trialled in Australia soon after (Taylor et al., 2003). Cover systems are now being tested on
DESIGNING'EFFECTIVE'STORE.RELEASE'COVERS'–'THE'ROLE'OF'VEGETATION
7
mine sites in arid and semi-arid areas all over the world (Bohnhoff et al., 2009, Milczarek et
al., 2003, O'Kane, 2011, Urrutia et al., 2011).
Water balance parameters measured in these small or medium scale cover trials are used to
model long term cover performance. In recent years, attention has been drawn to the analysis
of the variability of water balance parameters (Meiers et al., 2009, Schneider et al., 2010).
However, up to date studies acknowledging the alteration of properties with time are limited
and variability is widely ignored in cover performance modelling.
In this project report the results of investigations from the Stage 2 trial, East Coast sites
(Cobar and Mt Isa) are summarised and discussed. Parameters of the water balance equation,
their sensitivity to variability and their importance for successful cover performance are
discussed in depth and recommendations for future cover design are suggested.
2.0 Material(and(Methods(For this project two field sites were selected, namely Mt Isa in Queensland and Cobar in New
South Wales. Both sites are located in semi-arid Australia and have a similar long term
annual rainfall of approximately 400 mm. The main climatic difference between the sites is
that the Mt Isa site is situated in an area with distinct wet/dry seasonality, while at Cobar
rainfall occurs without seasonal variation.
2.1(Mt(Isa(
2.1.1(Climate(
The study site was located at Mt Isa in north-west Queensland, Australia (20°44’S 139°30’E).
The area is classified as BSh (B=arid, S=steppe, h=hot arid) in the Köppen and Geiger
Classification (Kottek et al., 2006). The mean annual minimum and maximum temperatures
are 11.6 °C and 37.3 °C, respectively (Bureau of Meteorology, 2012). The long-term average
annual rainfall of the area is 420 mm but rainfall is highly erratic. Three-quarters of the
annual precipitation occurs in summer, mainly between December and March but varies
greatly, from 78.0 mm in 1985/86 to 798.3 mm in 1996/1997. Most summer rainfall events
are high intensity storms (Bureau of Meteorology, 2012).
2.1.2(Test(plot(description(and(instrumentation(
The test plots were constructed in September 2008 and commissioned in December 2008.
They were constructed of non acid forming (NAF) material on top of a 10 m high traffic-
compacted potentially acid forming (PAF) waste rock dump. A nested design used two cover
DESIGNING'EFFECTIVE'STORE.RELEASE'COVERS'–'THE'ROLE'OF'VEGETATION
8
treatments, each with three replicates. The cover treatments were 20 m x 60 m areas
constructed from: (1) 0.5 m compacted non-acid-forming (NAF) material, overlaid by 1.5 m
uncompacted NAF material (Treatment C) and (2) 2.0 m uncompacted NAF material
(Treatment U)
The treatment plots were built in the same way as a large-scale cover system for a waste rock
dump or tailings facility. Compaction of the 0.5 m layer in Treatment C was achieved by the
passage of a bulldozer (Caterpillar D10) until a sufficiently even surface was obtained. The
cover material was applied in one lift through paddock dumping with haul trucks (Caterpillar
777D, 785C). Thereafter, the material was levelled out by an excavator (Hitachi ZX330LC)
and the sides of the plots were brought to an even slope. All waste rock originated from 300
m below the surface.
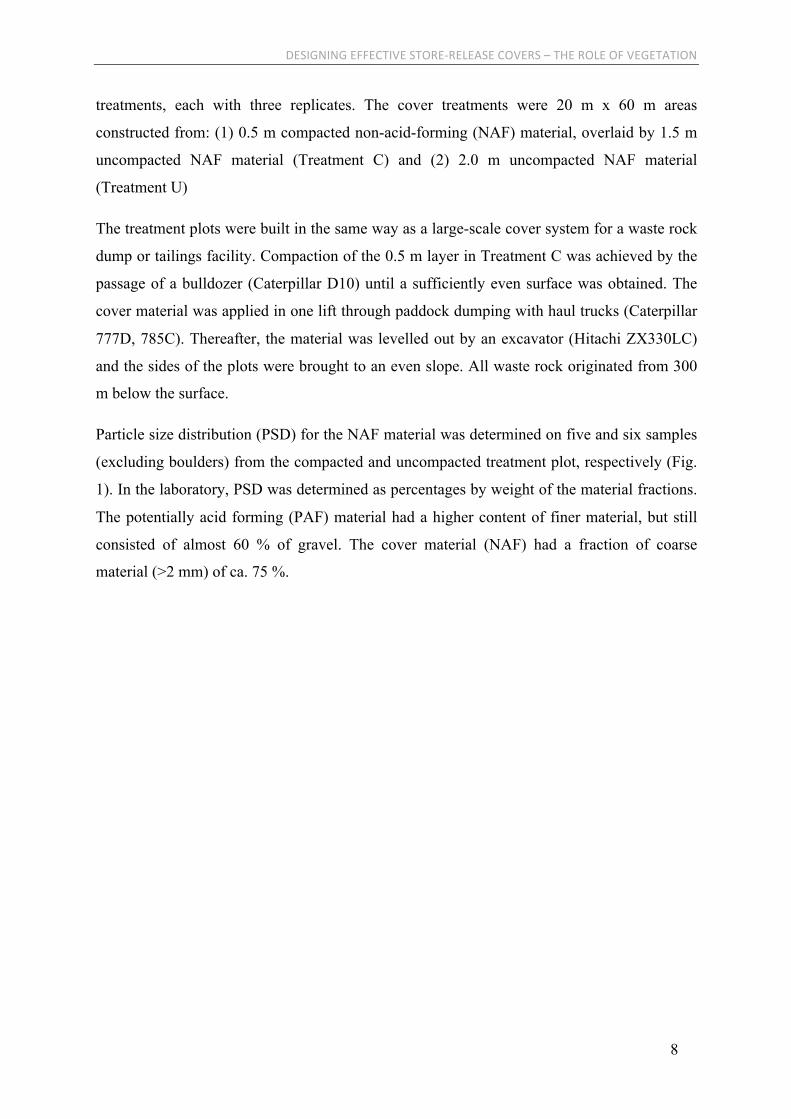
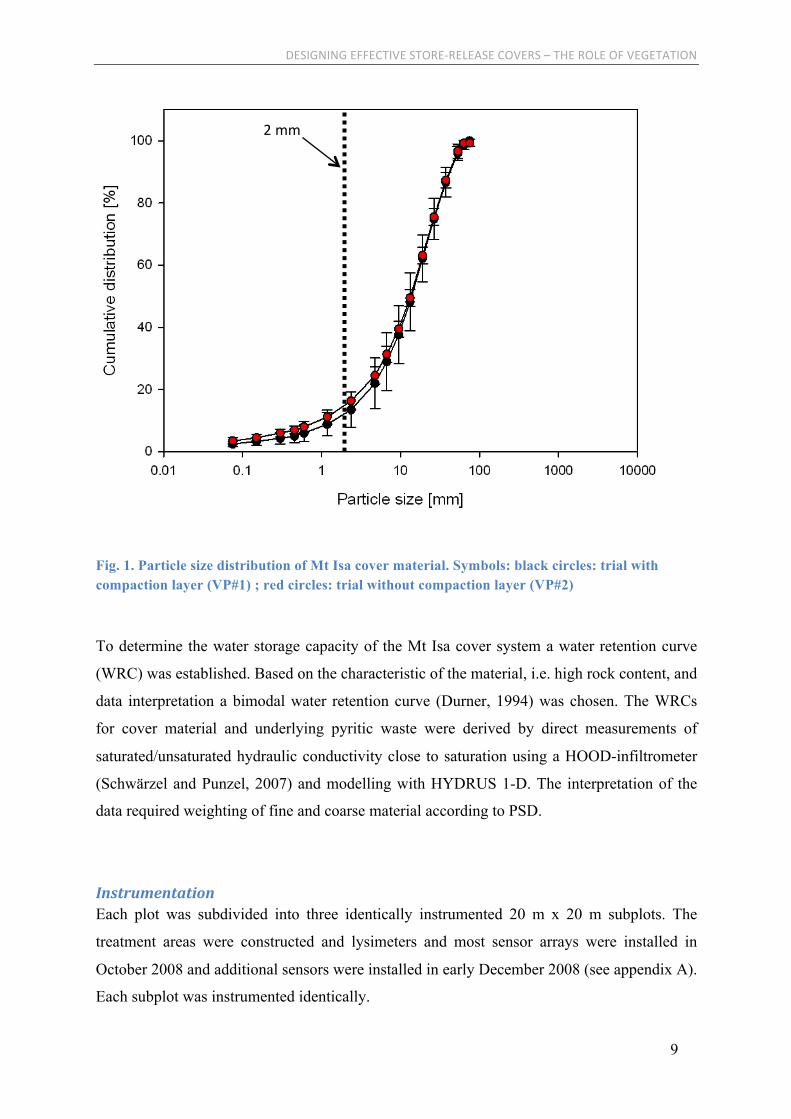
Particle size distribution (PSD) for the NAF material was determined on five and six samples
(excluding boulders) from the compacted and uncompacted treatment plot, respectively (Fig.
1). In the laboratory, PSD was determined as percentages by weight of the material fractions.
The potentially acid forming (PAF) material had a higher content of finer material, but still
consisted of almost 60 % of gravel. The cover material (NAF) had a fraction of coarse
material (>2 mm) of ca. 75 %.
DESIGNING'EFFECTIVE'STORE.RELEASE'COVERS'–'THE'ROLE'OF'VEGETATION
9
Fig. 1. Particle size distribution of Mt Isa cover material. Symbols: black circles: trial with compaction layer (VP#1) ; red circles: trial without compaction layer (VP#2)
To determine the water storage capacity of the Mt Isa cover system a water retention curve
(WRC) was established. Based on the characteristic of the material, i.e. high rock content, and
data interpretation a bimodal water retention curve (Durner, 1994) was chosen. The WRCs
for cover material and underlying pyritic waste were derived by direct measurements of
saturated/unsaturated hydraulic conductivity close to saturation using a HOOD-infiltrometer
(Schwärzel and Punzel, 2007) and modelling with HYDRUS 1-D. The interpretation of the
data required weighting of fine and coarse material according to PSD.
Instrumentation$Each plot was subdivided into three identically instrumented 20 m x 20 m subplots. The
treatment areas were constructed and lysimeters and most sensor arrays were installed in
October 2008 and additional sensors were installed in early December 2008 (see appendix A).
Each subplot was instrumented identically.
2"mm
DESIGNING'EFFECTIVE'STORE.RELEASE'COVERS'–'THE'ROLE'OF'VEGETATION
10
A lysimeter, consisting of an open-top rain water tank (3.0 m height, 3.0 m diameter), was
placed in the PAF waste, approximately at the centre of each subplot. The top of the lysimeter
was level with the PAF surface. A biaxial drainage net (FlownetTM, Geofabrics Australasia
Pty Ltd) was placed at the bottom of the lysimeter, covered by a geotextile liner (Filter Wrap
- bidim®, Geofabrics Australasia Pty Ltd) and a thin layer of washed sand. Thereafter, the
lysimeter was backfilled with PAF material in approximately 0.5 m lifts. After each lift, the
material was levelled by hand and compacted with a vibrating plate compactor (MVC 82
Mikasa Plate Compactor, Multiquip Inc.) to achieve the same bulk density as prior to the
excavation. The outside and inside of the lysimeter were backfilled alternately. The discharge
point from each lysimeter was connected to a calibrated tipping bucket flow gauge (Model
6506G, Unidata Pty Ltd) through a PVC pipe with a slope of ca. 2 %.
Six water content reflectometers (Model CS616, Campbell Scientific, Inc®) and 16 matric
water potential sensors (229-L, Campbell Scientific, Inc®) were installed from the bottom of
each lysimeter (approximately 4.8 m below final surface) to approximately 0.5 m beneath the
NAF cover surface during the process of backfilling.
To ensure optimal contact between the sensors and the waste material, the matric water
potential sensors were placed in sieved waste material (<4 mm). Water content reflectometers
were pre-calibrated for waste rock material and installed so as to avoid cavities between
sensor and material. In some cases, this led to finer material around the sensors compared to
the particle size distribution of the waste. Additional sensors were installed in early December
2008, requiring localised disturbance to approximately 1.0 m depth.
A weather station measuring rainfall (Campbell Scientific CS 700-L), air temperature and
humidity (Vaisala Model HMP45C), wind speed (R.M. Young Wind Sentry Anemometer
03101-L) and net radiation (NR-Lite-L) was located 500 m from the experimental area. All
sensors and the logger were acquired from Campbell Scientific, Inc.
2.2(Cobar(
2.2.1(Climate(
This field site was located near Cobar, in central west New South Wales, Australia (31°33’S,
145°52’E). The climate of this area is described as BSh (B= arid, S= steppe, h= hot) in the
Köppen and Geiger climate classification (Kottek et al., 2006). The long term average annual
rainfall of the region is approximately 400 mm per year, the mean annual minimum and
DESIGNING'EFFECTIVE'STORE.RELEASE'COVERS'–'THE'ROLE'OF'VEGETATION
11
maximum temperature are recorded to be 12.8 °C and 25.2 °C, respectively (Bureau of
Meteorology, 2011b). Rainfall distribution does not follow a seasonal pattern but tends to be
uniformly distributed throughout the year. However, rainfall can be highly variable,
especially in early spring and summer (Bureau of Meteorology, 2011a).
2.2.2(Test(plot(description(and(instrumentation(
Two evapotranspiration covers were built on the tailings dam facility from benign, oxidised
waste rock in 2002 by O’Kane Consultancy Ltd. The covers were designed to test the
performance of two different material thicknesses, namely 1.5 m uncompacted material and
2.0 m uncompacted material (hereafter TP1.5 and TP2.0, respectively). Cover trial
dimensions were approximately 35 x 35 m.
Covers were instrumented with heat-dissipation sensors (CS 229-L) and moisture probes
(EnviroSCAN®, Sentek, Stepney, Australia), a runoff gauge and a lysimeter (diameter 2.4 m,
height 2.5 m TP1.5 and 3.0 m TP2.0). On each plot the lysimeter, consisting of an open-top
rainwater tank, was installed one metre into the underlying tailings material, while the
lysimeter top was flush with the surface of the cover system. The lysimeter drain was covered
with a geotextile, over which 0.15 m of washed sand was placed. Unfortunately, no further
details about the sand or geotextile were available.
Both, thermal conductivity and moisture sensors were installed outside the lysimeter.
Thermal conductivity sensors were placed in vertical transects extending from a depth of 0.05
m to 2.40 m and 2.90 m in TP1.5 and TP2.0 respectively. For the installation of suction
sensors two methods were used. The sensors in the tailings material were placed by
excavating a trench and drilling into the trench wall. Sensors were then inserted and the
drilled holes as well as the trench were backfilled with tailings material. The instruments
within the cover system were installed during placement of the cover material, in a manner
identical to the suction sensors in the Mt Isa cover trial (as described above) (O'Kane
Consultants Inc., 2002). The calibration of thermal conductivity sensors were carried out as
described above.
The installation of the moisture probes also followed two methods. For the underlying tailings
material, a 56.5 mm diameter PVC tube enclosing the moisture probes was installed in an
auger hole in the material. Thereafter, the waste rock cover material was placed around the
tube by shovelling and a rubber-tyred backhoe until the final cover height was reached
(O'Kane Consultants Inc., 2002).
DESIGNING'EFFECTIVE'STORE.RELEASE'COVERS'–'THE'ROLE'OF'VEGETATION
12
Furthermore, a weather station with air temperature and relative humidity sensor (HMP45C,
Vaisala, Inc., Helsinki, Finland), wind direction and wind speed sensor (Model 03101, R.M.
Young Co., Traverse City, Michigan, USA), net radiometer (NR-Lite, Kipp and Zonen BV,
Delft, Netherlands) and a rainfall gauge (CS700, Campbell Scientific, Logan, Utah, USA)
was set up on TP2.0 (O'Kane Consultants Inc., 2002).
The particle size analysis, conducted after cover construction in 2002, showed that than at
TP1.5 less than 25 % of the waste rock was smaller than 2 mm, while at TP2.0 25 % of the
waste rock was classified as fine material (< 2 mm). Generally, waste rock from TP1.5 had a
slightly higher percentage of coarse material (> 2 mm) (O'Kane Consultants Inc., 2002)..
2.2.3(Vegetation(
In March 2008 approximately 150 mm of topsoil was spread on the surface of both cover
trials, ripped and seeded with a mixture of native grasses; re-seeding took place in April
2008. Vegetation establishment was low due to high grazing pressure from wild goats and
kangaroos in the area, so the plots were fenced in June 2008. Additionally Atriplex
nummilaria seedlings were planted in late 2008 and early 2009.
In April 2011 vegetation density was determined as foliage projective cover (FPC) (Specht,
1981). Two transects were run on each test trial, spanning the complete length of the plot,
FPC was assessed every meter.
In addition, evapotranspiration measurements were conducted with a laboratory calibrated
open top chamber (OTC), similar to the systems described by Hutley et al. (2000) and Zeppel
et al. (2006). Two species, which were abundant on both plots, were selected, namely Senna
artemisioides (DC. Randell) and Sclerolaena birchii (F. Muell). The OTC was provided by
the project partner Prof Derek Eamus, UTS, Sydney, New South Wales.
On both cover trials, two plants of each species were selected, as well as a bare spot, resulting
in five locations per cover plot. Measurements started at 6:30 hrs (sunrise), with one
measurement round taking approximately 1.5 hrs. Measurements were repeated every two
hours until 18:30 hrs (sunset). Each location was measured for 10 mins, after which the
chamber was removed to minimise disturbance of the microclimate. Measurements alternated
daily between TP1.5 and TP2.0.
DESIGNING'EFFECTIVE'STORE.RELEASE'COVERS'–'THE'ROLE'OF'VEGETATION
13
3.0 Results(
3.1(Precipitation(
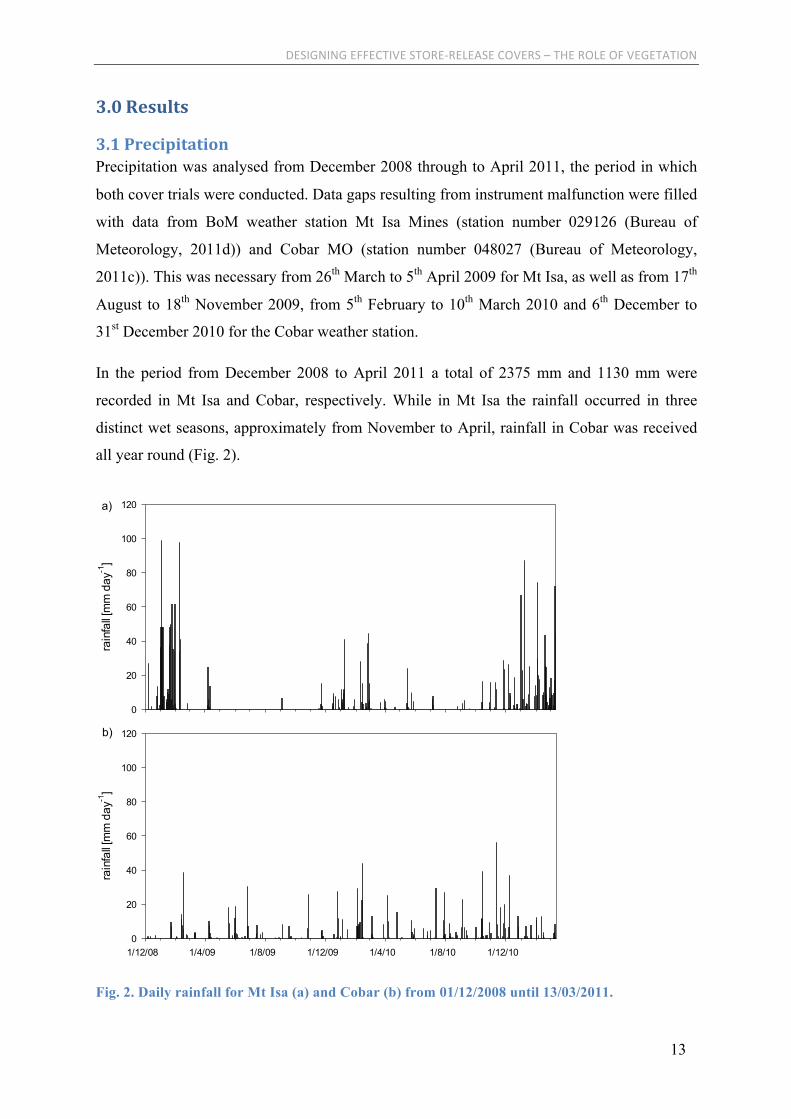
Precipitation was analysed from December 2008 through to April 2011, the period in which
both cover trials were conducted. Data gaps resulting from instrument malfunction were filled
with data from BoM weather station Mt Isa Mines (station number 029126 (Bureau of
Meteorology, 2011d)) and Cobar MO (station number 048027 (Bureau of Meteorology,
2011c)). This was necessary from 26th March to 5th April 2009 for Mt Isa, as well as from 17th
August to 18th November 2009, from 5th February to 10th March 2010 and 6th December to
31st December 2010 for the Cobar weather station.
In the period from December 2008 to April 2011 a total of 2375 mm and 1130 mm were
recorded in Mt Isa and Cobar, respectively. While in Mt Isa the rainfall occurred in three
distinct wet seasons, approximately from November to April, rainfall in Cobar was received
all year round (Fig. 2).
1/12/08 1/4/09 1/8/09 1/12/09 1/4/10 1/8/10 1/12/10
rain
fall [
mm
day
-1]
0
20
40
60
80
100
120
rain
fall [
mm
day
-1]
0
20
40
60
80
100
120a)
b)
Fig. 2. Daily rainfall for Mt Isa (a) and Cobar (b) from 01/12/2008 until 13/03/2011.
DESIGNING'EFFECTIVE'STORE.RELEASE'COVERS'–'THE'ROLE'OF'VEGETATION
14
The maximum daily rainfall recorded in Cobar was 57 mm. Daily precipitation exceeding 30
mm day-1 was measured only on six occasions (Fig. 2 b). In Mt Isa maximum daily rainfall
was 99 mm. Storm events above 30 mm day-1 were measured on 24 days (Fig. 2 a).
On both field sites years with precipitation exceeding the long term annual average were
recorded between 2008 and 2011. In Mt Isa 977 mm were recorded in 2009 and 564 mm in
the following year, both exceeding the long term annual average of 420 mm year-1. In Cobar
676 mm were recorded in 2010, exceeding the long term annual average of 400 mm year-1.
For these three years an average return period was calculated, following the Food and
Agriculture Organisation procedure (FAO) (Critchley and Siegert, 1991). Calculations were
based on long term observational data from BoM station Mt Isa Mines (data range from 1932
to 2011, (Bureau of Meteorology, 2011d)) and Cobar MO (data range from 1962 to 2011,
(Bureau of Meteorology, 2011c)).
Results showed that in Mt Isa a 977 mm annual rainfall had an average return period of 17
years, while 564 mm is likely to return every 4.5 years. On the other hand, the 676 mm
annual precipitation measured in Cobar in the year 2010 had an estimated return period of 79
years.
3.2(Runoff(
No runoff was detected at the Mt Isa site as the cover consisted of coarse waste rock without
texture change towards or at the surface. For the calculation of the water balance this
parameter was set to zero.
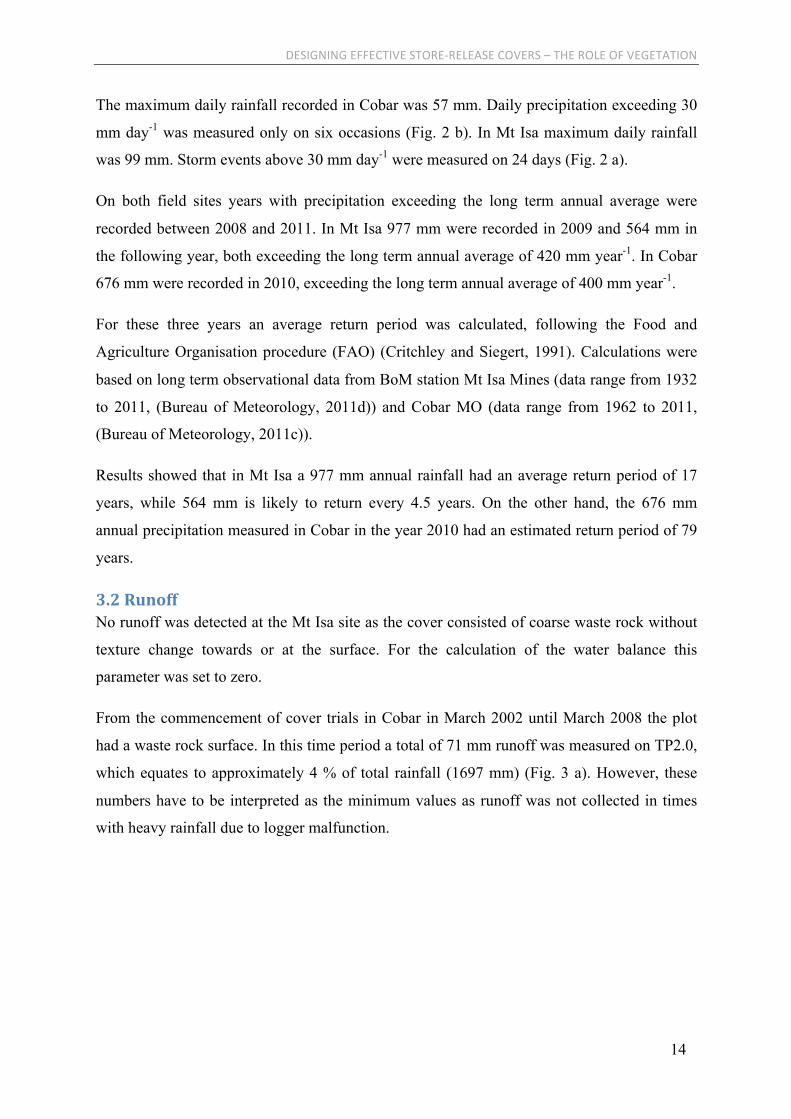
From the commencement of cover trials in Cobar in March 2002 until March 2008 the plot
had a waste rock surface. In this time period a total of 71 mm runoff was measured on TP2.0,
which equates to approximately 4 % of total rainfall (1697 mm) (Fig. 3 a). However, these
numbers have to be interpreted as the minimum values as runoff was not collected in times
with heavy rainfall due to logger malfunction.
DESIGNING'EFFECTIVE'STORE.RELEASE'COVERS'–'THE'ROLE'OF'VEGETATION
15
a)
b)
Fig. 3. Runoff (red (TP2.0)/green (TP1.5) lines) occurring on the Cobar cover trial with waste rock surface from 23/03/2002 until 28/02/2008 (a) and with topsoil from 01/04/2008 until 13/03/2011 (b); rainfall: blue lines.
!
1/1/02 1/1/03 1/1/04 1/1/05 1/1/06 1/1/07 1/1/08
cum
ulat
ive
runo
ff [m
m]
0
20
40
60
80
100
cum
ulat
ive
rain
fall [
mm
]
0
200
400
600
800
1000
1200
1400
1600
1800
!
1/4/08 1/8/08 1/12/08 1/4/09 1/8/09 1/12/09 1/4/10 1/8/10 1/12/10
cum
ulat
ive
runo
ff [m
m]
0
20
40
60
80
100
120
140
160
180
cum
ulat
ive
rain
fall
[mm
]
0
200
400
600
800
1000
1200

DESIGNING'EFFECTIVE'STORE.RELEASE'COVERS'–'THE'ROLE'OF'VEGETATION
16
Runoff amounts after spreading of topsoil in March 2008 increased markedly. From 1 April
2008 until 13 March 2011 a total of 1025 mm of rainfall was recorded, of which 16 % (161
mm) was recorded as runoff (Fig. 3 b).
Figure 4 depicts the runoff coefficient, runoff divided by rainfall, for TP2.0 before and after
topsoil application. The correlation between rainfall and runoff coefficient could be described
with a three parameter power function, with a coefficient of determination (R2) of 0.74 before
topsoil application and 0.77 after topsoil application.
After application of topsoil the runoff coefficient markedly increased. The trendline after
application of topsoil (dashed line) shows a logarithmic rise between 0-10 mm rainfall events,
whereas the trendline of the waste rock surface (solid line) shows an exponential increase.
Therefore lower rainfall events, i.e. below 10 mm, resulted in a higher runoff after the
spreading of topsoil. Between 30 mm to 80 mm rainfall events the trendlines ran parallel,
indicating a similar slope (Fig. 4).
rain [mm]
0 20 40 60 80 100
runo
ff co
eff
0.00
0.05
0.10
0.15
0.20
0.25
0.30
0.35
Fig. 4. Runoff coefficient for cover trial with waste rock surface (23/05/2002 until 28/02/2008) (solid symbols) and runoff coefficient with topsoil surface (01/042008 until 13/03/2011) (open symbols). Runoff coefficient and rainfall relationships are modelled by a three parameter power function. Waste rock surface (solid circles, solid line) R2 0.74 and with topsoil surface (open circles, dashed line) R2 0.77.

DESIGNING'EFFECTIVE'STORE.RELEASE'COVERS'–'THE'ROLE'OF'VEGETATION
17
3.4(Change(in(moisture(storage(
The ability of material to store moisture is determined by its pore system, which depends on
the particle size distribution of the material. The coarser the particles, the lesser is the
likelihood that pores are formed which can hold water against gravity. The maximum pore
size still able to store water is marked as field capacity (FC), which commonly occurs
between 60 and 100 hPa, equivalent to a pore diameter of 50µm and 10µm, respectively
(Hillel, 2004).
Precise identification of the change in storage is difficult for waste rock material. In natural
and agricultural soils, volumetric moisture is measured through moisture sensors. However,
due to the coarse nature of waste rock materials these sensors provide unreliable readings and
suction sensors provide the highest precision when measuring changes in moisture in waste
rock systems. Suction values can be converted to moisture values through water retention
curves (WRC).
Appendices B and D show the distribution of water potentials over the depth of the lysimeters
and for the period of measurement, appendices C and E the distribution of water contents
(vol. 5) over the depth of the lysimeters and for the period of measurement.
The distributions of moisture over depth and time show that there is an immediate response of
soil moisture to rainfall. In Mt Isa this response is not only restricted to the surface near depth
of the cover, but occurs throughout the lysimeter. This direct response of water flow to
precipitation and the immediate occurrence of water at greater depths under higher rainfall
amounts/intensities clearly shows that water flow through the coarse waste rock cover occurs
as preferential flow.
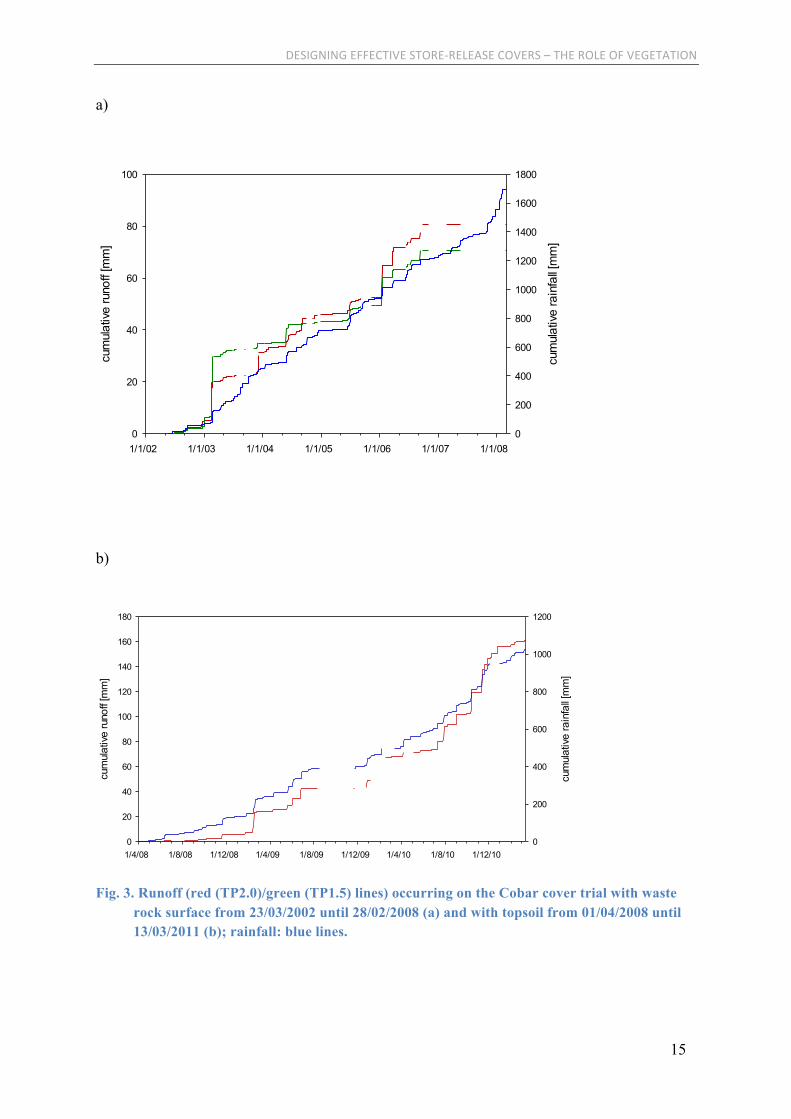
For modelling purposes and to characterise the hydraulic properties of the cover substrate, a
water retention curve is required. To determine the WRC various approaches were used:
theoretical, inverse modelling (using the numerical model HYDRUS-1D) of seepage based on
moisture distribution over a period of time and by using point measurements of
saturated/unsaturated hydraulic conductivity under different levels of tension (HOOD
infiltrometer). All three methods resulted in a shape of a WRC as shown in Fig. 5. Common
to all approaches for a successful solution of the problem was the requirement to describe the
WRC not as a uni-modal pore size distribution, but as a pore size distribution with a distinct
separation of a volume consisting of very coarse pores and a pore volume consisting of pores
defined by fine textured material (e.g. <2mm), i.e. a bi-modal WRC.
DESIGNING'EFFECTIVE'STORE.RELEASE'COVERS'–'THE'ROLE'OF'VEGETATION
18
Based on the WRC (Fig. 5) suction values were converted to volumetric moisture and stored
water was calculated for the 2 m cover and the pyritic waste (Fig. 6).
suction [hPa]
100 101 102 103 104 105 106 107 108
moi
stur
e [v
ol. %
]
0
5
10
15
20
25
Fig. 5. Bi-modal WRC for waste rock cover system in Mt Isa.
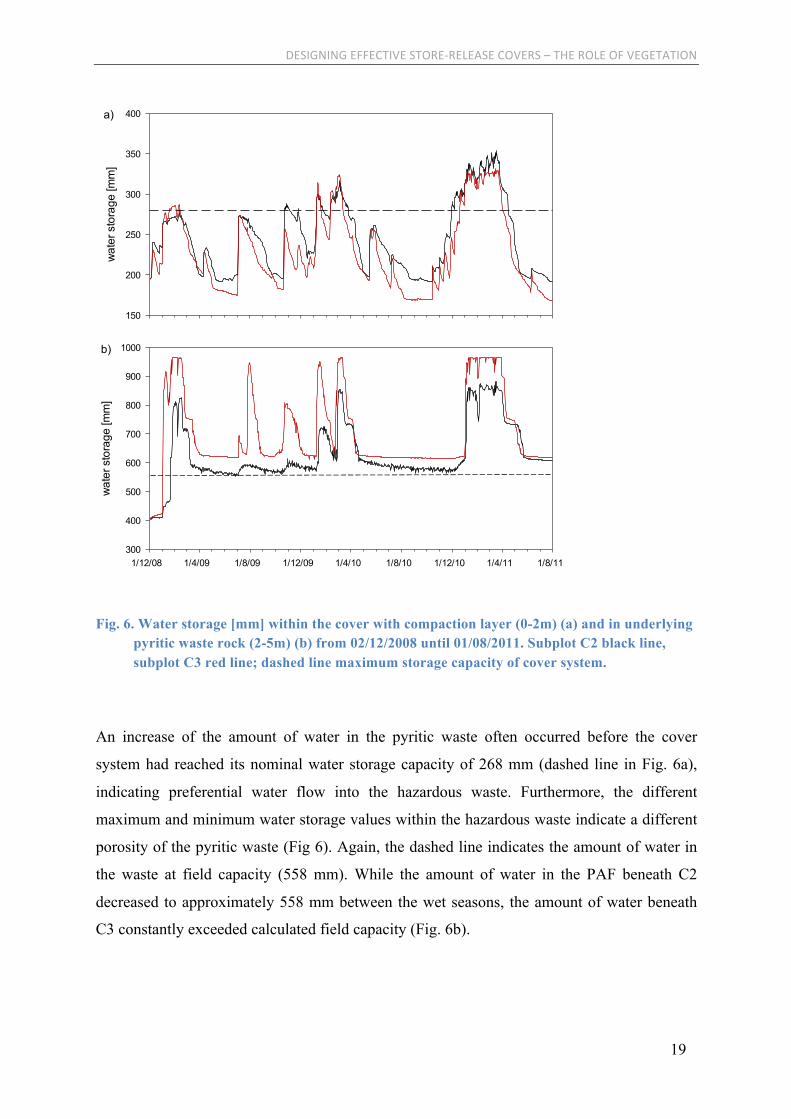
Figure 6 shows the change in stored water for the treatment C2 and C3. While maximum
amounts of stored water were similar, C3 showed a stronger desiccation between wet seasons
and a faster decrease in stored water compared to C2. The dashed line indicates maximum
storage capacity (280 mm) for the cover trials, calculated based on FC and cover thickness.
Water exceeding this value will, over time, result in deep drainage (Fig. 6).
DESIGNING'EFFECTIVE'STORE.RELEASE'COVERS'–'THE'ROLE'OF'VEGETATION
19
wat
er s
tora
ge [m
m]
150
200
250
300
350
400
1/12/08 1/4/09 1/8/09 1/12/09 1/4/10 1/8/10 1/12/10 1/4/11 1/8/11
wat
er s
tora
ge [m
m]
300
400
500
600
700
800
900
1000
a)
b)
Fig. 6. Water storage [mm] within the cover with compaction layer (0-2m) (a) and in underlying pyritic waste rock (2-5m) (b) from 02/12/2008 until 01/08/2011. Subplot C2 black line, subplot C3 red line; dashed line maximum storage capacity of cover system.
An increase of the amount of water in the pyritic waste often occurred before the cover
system had reached its nominal water storage capacity of 268 mm (dashed line in Fig. 6a),
indicating preferential water flow into the hazardous waste. Furthermore, the different
maximum and minimum water storage values within the hazardous waste indicate a different
porosity of the pyritic waste (Fig 6). Again, the dashed line indicates the amount of water in
the waste at field capacity (558 mm). While the amount of water in the PAF beneath C2
decreased to approximately 558 mm between the wet seasons, the amount of water beneath
C3 constantly exceeded calculated field capacity (Fig. 6b).
DESIGNING'EFFECTIVE'STORE.RELEASE'COVERS'–'THE'ROLE'OF'VEGETATION
20
For modelling the bimodal WRC a weighting of coarse to fine material of 60:40 was assumed
and derived from the particle size distribution. Table 1 presents calculated moisture values
and maximum storage capacity for varying coarse to fine ratios. In addition the volumetric
moisture, corresponding stored water for plant wilting point (PWP, assumed to be 15000 hPa)
and plant available water (storage at FC– storage at PWP) are presented.
Table 1. Volumetric moisture [%] and stored water [mm] for a 2 m waste rock
evapotranspiration cover with varying percentages of coarse (> 2mm) to fine (< 2 mm)
material at field capacity (FC, 65 hPa) and permanent wilting point (PWP, 15 000 hPa) and
according plant available water (PAW) [mm].
Ratio
coarse : fine
moisture at
FC [ vol. %]
water storage
at FC [mm]
moisture at
PWP [vol.%]
water storage
at PWP [mm]
PAW [mm]
30:70 20 400 13 260 140
50:50 16 320 10 200 120
60:40 14 280 9 180 100
70:30 11 220 8 160 60
For covers with 50 to 70 % coarse material, maximum water storage varies from 320 to 220
mm, respectively. A cover system with 70 % of the material smaller 2 mm could potentially
store 400 mm water. Moisture content at PWP varies over a range of 5 vol. % with variation
in fine material fraction fro 30 % and 70 %. Plant available water is low for all scenarios
(Table 1).
3.5(Seepage(
Seepage was measured on both cover designs and all subplots of Mt Isa, no seepage data are
available for Cobar due to instrument failure. Total amount of generated seepage varied
greatly and no trend in seepage formation in one cover design over the other was apparent
(Fig. 7).

DESIGNING'EFFECTIVE'STORE.RELEASE'COVERS'–'THE'ROLE'OF'VEGETATION
21
Fig. 7. 13 Cumulative rainfall (blue line) and cumulative seepage for subplots of treatment with
compacted layer (C1= black line, C2= red line, C3= green line) and subplots from
treatment without compaction (U1= yellow line, U2= turquoise line, U3= pink line) from
commencement of cover trial (04/12/08) until decommissioning (31/07/11).
Seepage as percentage of rainfall was highly variable and ranged between approximately 20%
(U3) to as high as 90% (C3) (Fig. 7). The plots C2 and U2 had no seepage recorded after the
first major rain event, while U1 and U2 had no seepage initially, but recorded relatively high
amounts from the second trial year onwards.
Table 2 shows the seepage recorded through tipping bucket devices and the calculated
minimum seepage. The latter value is based upon the amount of rainfall occurring when the
subplot was at field capacity. Field capacity describes the state in which no seepage occurs
but all pores, which are physically able to hold water against the force of gravity are filled.
Therefore, any additional water entering the system must result in the generation of seepage.
In general, field capacity lay between 7 and 16 kPa, depending on material properties. For the
cover trial, field capacity was assumed to be 8 kPa.
!
1/1/09 1/5/09 1/9/09 1/1/10 1/5/10 1/9/10 1/1/11 1/5/11
cum
ulat
ive
seep
age
[mm
]
0
500
1000
1500
2000
2500
3000
cum
ulat
ive
rain
fall [
mm
]
0
500
1000
1500
2000
2500
3000
DESIGNING'EFFECTIVE'STORE.RELEASE'COVERS'–'THE'ROLE'OF'VEGETATION
22
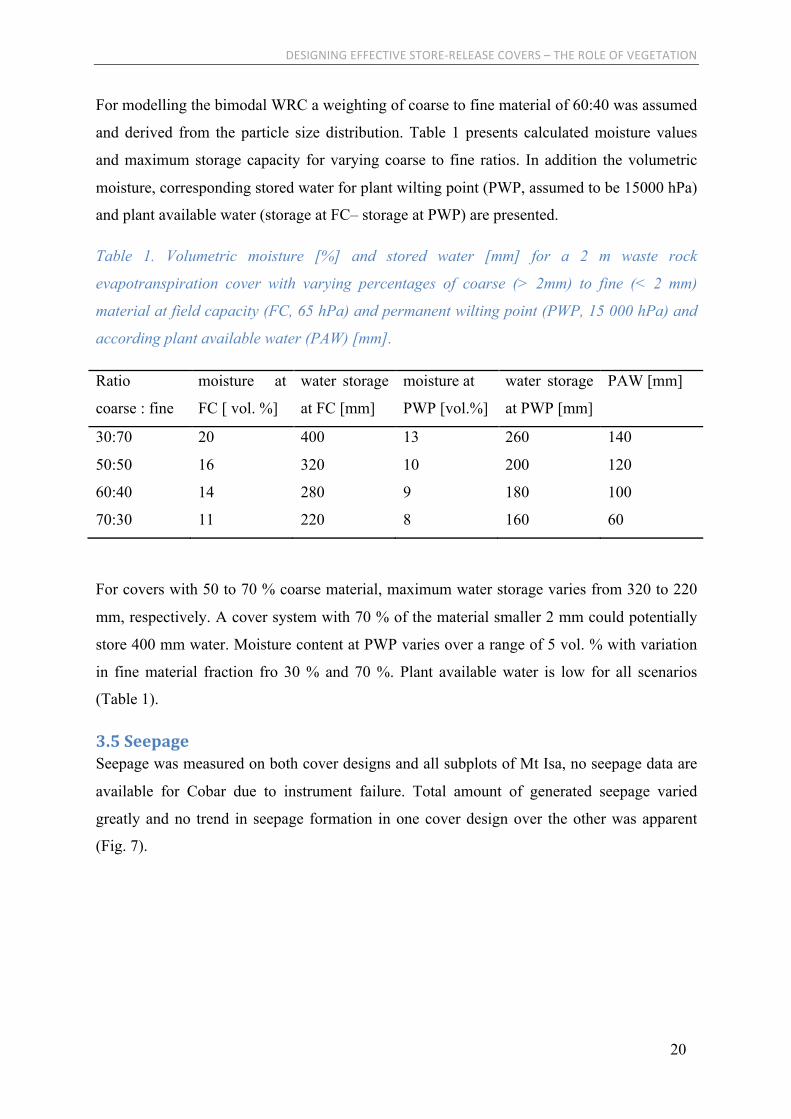
Table 2. Measured and calculated minimum seepage [mm], based on cumulative rainfall received when suction values were below field capacity (8 kPa)
Subplot Measured seepage [mm]
Calculated minimum seepage [mm]
1Va 4 264 (21/12/10) 1Vb 434 816 1Vc 2160 1390 2Va 805 1085 2Vb 1264 801 2Vc 250 974
Table 2 shows that in four out of six cases seepage was underestimated by tipping bucket
devices. This could be due to several reasons. The calibration tipping buckets could be
inaccurate and therefore the transformation of recorded tips into seepage values in millimetres
underestimates the true value of seepage. However, this is not likely to be the case as the
differences between measured and calculated values are too substantial and tipping buckets
were re-calibrated throughout the trial period.
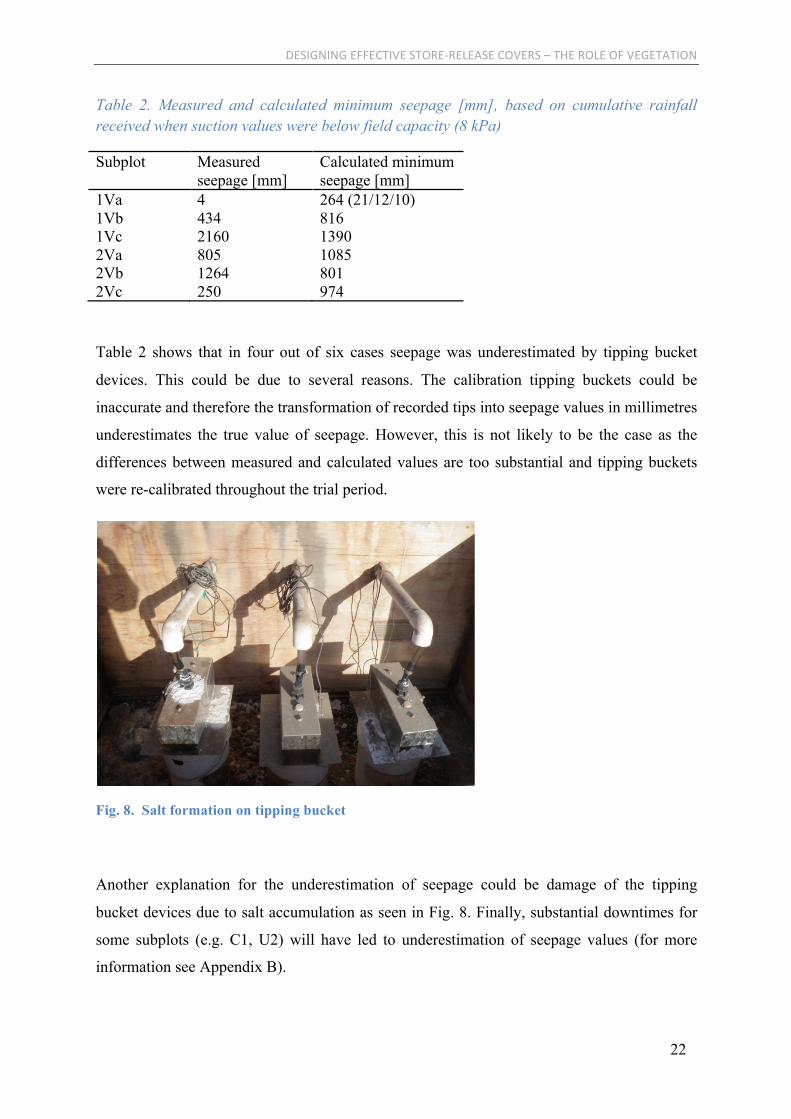
Fig. 8. Salt formation on tipping bucket
Another explanation for the underestimation of seepage could be damage of the tipping
bucket devices due to salt accumulation as seen in Fig. 8. Finally, substantial downtimes for
some subplots (e.g. C1, U2) will have led to underestimation of seepage values (for more
information see Appendix B).
DESIGNING'EFFECTIVE'STORE.RELEASE'COVERS'–'THE'ROLE'OF'VEGETATION
23
In two of the six subplots, C3 and U2, seepage calculated from field capacity and rainfall
resulted in an underestimation of percolation compared to the measured values. Both of these
subplots had high measured seepage. The discrepancy between the two values could be due to
preferential flow, resulting in the generation of seepage before the cover material had reached
field capacity. Another explanation could be gravitational water movement to the seepage
outlet point after the cessation of precipitation.
The discrepancy between measured and actual seepage for C3 and U2 emphasises that the
calculated seepage values are minimum seepage values as it is likely that percolation will
have occurred after precipitation and that preferential flow will have occurred on all plots.
Furthermore, it emphasises the need to compare measurements of measured seepage values
with suction values and the importance of regular maintenance of tipping buckets when
seepage waters are highly acidic.
(
3.6(Evapotranspiration(and(evaporation(
In general vegetation coverage on the Cobar test plots was relatively low, the line intercept
method resulting in an average of 19 % vegetation cover on TP1.5 and 26 % vegetation cover
on TP2.0.
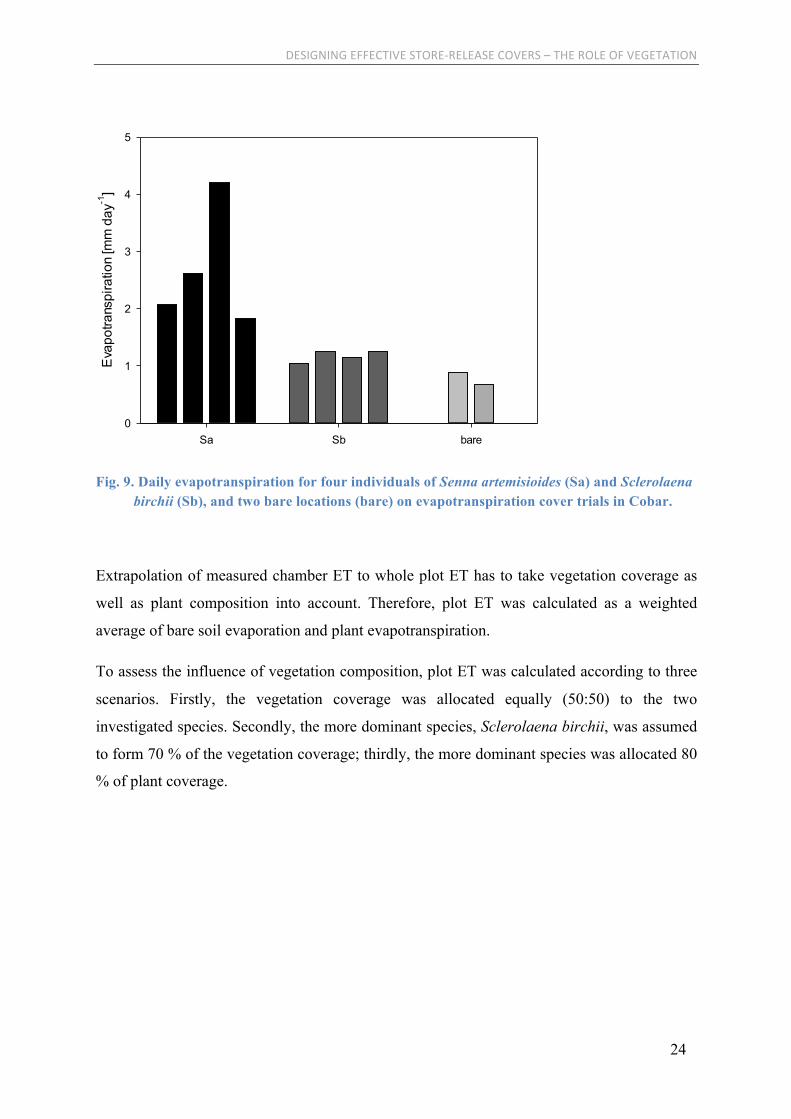
Measured evapotranspiration varied from a maximum 4.2 mm day-1 to a minimum of 1.0 mm
day-1 with Senna artemisioides generally showing a higher ET compared to Sclerolaena
birchii. Evaporation rates from bare soil were distinctly lower than ET rates, varying between
0.9 to 0.7 mm day-1 (Fig. 9).
DESIGNING'EFFECTIVE'STORE.RELEASE'COVERS'–'THE'ROLE'OF'VEGETATION
24
Sa Sb bare
Eva
potra
nspi
ratio
n [m
m d
ay-1
]
0
1
2
3
4
5
Fig. 9. Daily evapotranspiration for four individuals of Senna artemisioides (Sa) and Sclerolaena birchii (Sb), and two bare locations (bare) on evapotranspiration cover trials in Cobar.
Extrapolation of measured chamber ET to whole plot ET has to take vegetation coverage as
well as plant composition into account. Therefore, plot ET was calculated as a weighted
average of bare soil evaporation and plant evapotranspiration.
To assess the influence of vegetation composition, plot ET was calculated according to three
scenarios. Firstly, the vegetation coverage was allocated equally (50:50) to the two
investigated species. Secondly, the more dominant species, Sclerolaena birchii, was assumed
to form 70 % of the vegetation coverage; thirdly, the more dominant species was allocated 80
% of plant coverage.

DESIGNING'EFFECTIVE'STORE.RELEASE'COVERS'–'THE'ROLE'OF'VEGETATION
25
TP1.5 TP2.0
Plo
t ET
[mm
day
-1]
0.0
0.2
0.4
0.6
0.8
1.0
1.2
1.4
Fig. 10. Calculated plot ET based on vegetation coverage, with no weighing of plant component between plant species (black), 70 % of plant component formed by dominant species Sclerolaena birchii (light grey) and 80 % of plant component formed by dominant species Sclerolaena birchii (dark. grey)
Differences between the three scenarios for plot ET were small, with values ranging from 1.1
mm day-1 to 1.00 mm day-1 at TP1.5 and from 0.94 mm day-1 to 0.87 mm day-1 for TP2. (Fig.
10).
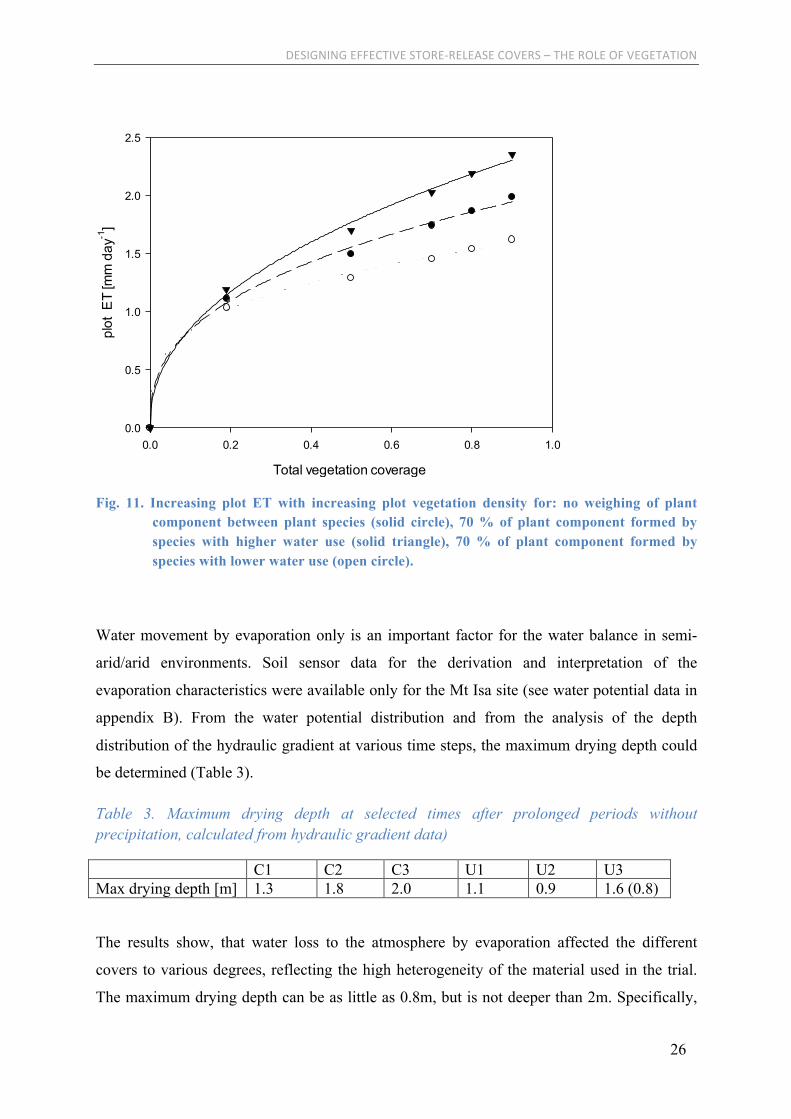
To determine the threshold when vegetation composition influences plot ET three scenarios,
(I) no weighing of vegetation for plant component, (II) 70% of plant component taken up by
species with higher water use and (III) 70% of plant component taken up by species with
lower water use, was applied for increasing plant densities.
These scenarios suggest that for vegetation composition to substantially influence daily plot
ET, a vegetation density of minimum 50 % coverage has to be achieved (Fig. 11)
DESIGNING'EFFECTIVE'STORE.RELEASE'COVERS'–'THE'ROLE'OF'VEGETATION
26
Total vegetation coverage
0.0 0.2 0.4 0.6 0.8 1.0
plot
ET
[mm
day
-1]
0.0
0.5
1.0
1.5
2.0
2.5
Fig. 11. Increasing plot ET with increasing plot vegetation density for: no weighing of plant component between plant species (solid circle), 70 % of plant component formed by species with higher water use (solid triangle), 70 % of plant component formed by species with lower water use (open circle).
Water movement by evaporation only is an important factor for the water balance in semi-
arid/arid environments. Soil sensor data for the derivation and interpretation of the
evaporation characteristics were available only for the Mt Isa site (see water potential data in
appendix B). From the water potential distribution and from the analysis of the depth
distribution of the hydraulic gradient at various time steps, the maximum drying depth could
be determined (Table 3).
Table 3. Maximum drying depth at selected times after prolonged periods without precipitation, calculated from hydraulic gradient data)
C1 C2 C3 U1 U2 U3 Max drying depth [m] 1.3 1.8 2.0 1.1 0.9 1.6 (0.8)
The results show, that water loss to the atmosphere by evaporation affected the different
covers to various degrees, reflecting the high heterogeneity of the material used in the trial.
The maximum drying depth can be as little as 0.8m, but is not deeper than 2m. Specifically,
DESIGNING'EFFECTIVE'STORE.RELEASE'COVERS'–'THE'ROLE'OF'VEGETATION
27
coarse pored substrates act as a kind of rock mulch and prevent the upward flow of water due
to the lack of continuously filled small pores, which are able to conduct the water to the
surface. At some point of drying, water loss is only possible by water vapour diffusion. This
further reduces the amounts of pore water which can be transported to the surface and
evaporated.
4.0(Discussion(
4.1(Precipitation(
The presented precipitation data clearly highlights the need to thoroughly understand the
climate of the location of the proposed cover system. While mean annual precipitation was
very similar in the two presented case studies, daily rainfall amounts and precipitation
frequencies differed substantially. The precipitation patterns of the site in north-west
Queensland describe a climate in which a successful evapotranspiration cover is unlikely to
be constructed.
Therefore, a generic categorisation into wet and semi-arid climates is insufficient. In general,
semi-arid areas are characterised by a potential evaporation rate up to twice the precipitation
rate (Christopherson, 1994). However, potential evaporation, or evapotranspiration (pET), is
the water loss driven by climatic demands assuming a constant, non limiting, water supply
from the soil or cover system (Allen et al., 1998). Markedly smaller actual evapotranspiration
(aET) rates compared to pET rates have been commonly reported for natural semi-arid areas
throughout the world (e.g. Baldocchi et al., 2004, Kurc and Small, 2004, Liu et al., 2010) and
are likely to occur for most of the time.
The highly seasonal rainfall distribution in central-north Queensland results in an oversupply
of moisture in the wet season, unlikely to be extracted through ET in the timeframes needed
to inhibit water ingress into hazardous waste. This is especially so when rainfall reached up to
100 mm day-1.
At the New South Wales site on the other hand, the relatively even distribution of rainfall
throughout the year and cumulative rainfall seldom exceeding 50 mm day-1 allowed the
system to partially wet up, resulting in increased evapotranspiration. This climatic setting
provides a higher probability of a successful evapotranspiration cover system, compared to
central-north Queensland’s climate.
DESIGNING'EFFECTIVE'STORE.RELEASE'COVERS'–'THE'ROLE'OF'VEGETATION
28
Rainfall in semi-arid areas is typically highly variable and erratic (D'Odorico and Porporato,
2006). However, the average return period for annual rainfall more than twice the amount of
the long term average rainfall is less than 20 years for the central-north Queensland site. In
this area, a successful cover should therefore not consider the long term annual rainfall as
baseline rainfall but at least double the amount of the long term average precipitation.
In central New South Wales on the other hand, the exceedance of the long term annual
rainfall by 70 % showed an average return period of almost 80 years. This leads to the
conclusion that in this region rainfall variability tends to result in lower than average annual
rainfall.
It is therefore of utmost importance to analyse site specific long term rainfall data and to
assess the likelihood of significant exceedance of long term average annual rainfall.
4.2(Runoff(
The amount of runoff generated by a cover system affects the amount of water entering a the
cover. If runoff generation is high, the probability of water ingress into the hazardous waste
becomes lower. However, depending on the surface material, high amounts of runoff may
result in high amounts of erosion leading to cover failure (Wilson et al., 2003). Another factor
to consider is that reduced water ingress into the cover system results in a higher likelihood of
plant water stress due to reduced plant available water in the system.
The potential of runoff generation from evapotranspiration cover system constructed from
benign waste rock, without a layer of topsoil, is small. The coarse nature of waste rock
material leads to high hydraulic conductivities (Smith et al., 1995) and therefore high
infiltration rates and low runoff coefficients.
Topsoil on the other hand, generally shows lower infiltration rates. Plant establishment and
pedogenetic processes may lead to an increase in hydraulic conductivity of topsoil over time
and therefore a decrease in runoff generation (Benson et al., 2007).
Runoff coefficients in Cobar after topsoil application were, as expected, increased compared
to the waste rock surface. However, no erosion gullies were visible and compared to other
cover systems (Baumgartl and Mulligan, 2009), the runoff coefficient was moderate. While
water ingress into the cover system was reduced, plant establishment, mainly by pioneer
species, occurred after topsoil application, showing that the addition of topsoil benefited the
hydraulic properties of the cover as well as plant communities.

DESIGNING'EFFECTIVE'STORE.RELEASE'COVERS'–'THE'ROLE'OF'VEGETATION
29
Therefore, in the case of the Cobar site, the addition of 150 mm of topsoil led to an enhanced
cover performance and a decreased likelihood of seepage generation.
4.3(Change(in(moisture(storage(
The more rapid and stronger decrease in water storage at C3 compared to C2 covers at Mt Isa
indicates a lower water holding potential of the former cover trial. In addition, the higher and
more frequent increase in water storage within the hazardous waste underlying C3 reflects a
poor cover performance due this water ingress. However, while percolation of water into the
pyritic waste beneath C2 was less pronounced, it nevertheless occurred in every wet season.
Therefore, neither subplot can be classified as a successful cover system.
Variability of water storage in the presented scenarios at Mt Isa ranged from 400 mm to 220
mm. As discussed above, a distinct wet dry seasonality exists in central north Queensland,
represented by this cover trial. In general 75 % of the annual rainfall is received in the wet
season from November to March (Bureau of Meteorology, 2012). Long term average rainfall
of the region is 420 mm, resulting in approximately 375 mm rainfall in an average wet season
of an average year.
If a cover t contained no stored moisture before the commencement of a wet season, which is
technically unlikely, and if preferential flow could be excluded, only a cover with a ratio of
30 : 70 coarse (> 2 mm) to fine (< 2 mm) material would succeed in preventing water ingress
into the underlying waste.
Particle size distributions of waste rock seldom provide a fine to coarse ratio above 30 : 70; in
fact often the percentage of fines in waste generally does not exceed 30 to 40 % (Smith et al.,
1995). For this reason the water storage potential of cover systems constructed from benign
waste rock is very likely to be low.
A slight variation in percentage of coarse to fine material resulted in a marked increase in
water storage potential. A homogeneous distribution of coarse and fine material cannot be
expected within an evapotranspiration cover system formed by benign waste rock, especially
for a full scale cover. Commonly, cover material is paddock dumped by haul trucks during
construction (O'Kane Consultants Inc., 2004). The particle size distribution of waste rock
depends on the nature of the parent rock material and the powder factor resulting from
blasting. As a result, it is highly probable that the particle size distribution of the waste
DESIGNING'EFFECTIVE'STORE.RELEASE'COVERS'–'THE'ROLE'OF'VEGETATION
30
carried by different haul trucks will be dissimilar. This inherent variability of PSD throughout
the cover system must result in heterogeneous water flow through the system.
Plant available water for all scenarios was very low. Plants endemic to dry areas of the world
are known to be able to extract water below 1500 kPa (Sharma, 1976, Winkworth, 1970).
However, even if it is assumed that 30 % more moisture can be extracted than calculated as
plant available water in the present study, the water stored for vegetation uptake is still low
and varies from 78 mm to 182 mm.
4.4(Evaporation(and(Evapotranspiration(
Foliage projective cover (FPC) values on both plots at Cobar were relatively low. However,
no signs of erosion could be seen on the trials, so the combination of near-level surface
vegetation and rocks on the surface seems to have resulted in a stable cover.
Daily ET rates lay well within values measured in semi-arid Australia (Pressland, 1978,
Sharma, 1976, Winkworth, 1970). Bare soil evaporation rates were distinctly lower than
evapotranspiration measured from the plant species.
Calculation of plot ET showed that the role of vegetation in the total water loss from the
evapotranspiration cover was minimal, whereas bare soil evaporation was the main
contributor in plot ET. This is reflected in the fact that the weighting of Senna artemisioides
and Sclerolaena birchii evapotranspiration rates did not have a great effect on whole plot ET,
even though their daily ET rates differed markedly. The reason for this lies in the high
percentage of bare ground on the cover systems, as well found by Stannard and Weltz (2006)
in a semi-arid shrubland in the United States.
While FPC values on the cover system were low, research has shown that in the long term the
FPC can be expected to be in equilibrium with moisture availability, while fluctuations after
rain or in drought will be the norm (Specht and Specht, 1999). Therefore, it can be expected
that observed vegetation densities are representative for the cover system.
When vegetation coverage reaches 50 % and above the role of vegetation for water loss from
a cover system becomes more pronounced. If plant species with higher transpiration rates
dominate the cover system this effect becomes more prominent. However, water supply to the
plant will regulate water losses during times of sufficient moisture and plant densities in times
of droughts. As demonstrated previously, water storage and plant availabe water in cover
DESIGNING'EFFECTIVE'STORE.RELEASE'COVERS'–'THE'ROLE'OF'VEGETATION
31
systems from bening waste rock is limited. Therefore irrigation would be necessary to sustain
vegetation densities above natural conditions.
The basic concept of an evapotranspiration cover makes this cover type only suitable for
semi-arid and arid environments whichare characterised through limited water availability to
biological systems (D'Odorico and Porporato, 2006). As a sustainable vegetation community
must be equilibrium with plant available water, vegetation densities on evpotranspiration
cover systems must always be relativly low. Due to this very basic, concept the role of
vegetation in an semi-arid evapotranspiration cover system must always be low.
Similarly, in instances where water loss to the atmosphere only occurs through evaporation
(without influence of vegetation), the distribution of events of precipitation, their amount and
intensity is critical for a successful performance of a cover.
Therefore it is of utmost importance that the remaining parameters of the water balance
equation, climate, runoff, and moisture storage, have to be able to minimise water ingress into
hazardous waste.
5.0(Conclusion((
While the basic concept behind evapotranspiration cover system, the water balance equation,
is relatively simple, parameters have to be considered carefully.
Changes in vegetation composition have less influence on cover performance as long as the
total vegetation coverage is below 50 %. Given the characteristic of semi-arid environments
and the low storage of plant available water in waste rock cover systems, vegetation densities
are likely to not exceed 30 % coverage. Therefore, while vegetation is essential for successful
waste facility rehabilitation, its role for water removal from an evapotranspiration cover
system is limited.
Variations in runoff, and therefore water ingress into the cover, can partly be influenced
through the application of topsoil to the waste rock surface. Runoff will minimise water
infiltration into the cover and therefore the risk of water ingress into hazardous waste. A
balance, site specific and climate specific, must be found between runoff and water ingress
into the cover in order to avoid erosion and enable plant growth.
DESIGNING'EFFECTIVE'STORE.RELEASE'COVERS'–'THE'ROLE'OF'VEGETATION
32
The probability of variations in rainfall regime in semi-arid environments is high. This can on
the one hand lead to increased, high intensity storm events, resulting in deep drainage into
hazardous waste. On the other hand, decreased precipitation rates may lead to temporary
droughts and severe die back of vegetation.
The second water balance parameter highly prone to variability is change is storage capacity.
Storage capacity is strongly affected by the type of material used and is respective pore size
distribution/ water retention characteristic. In addition and related to the aforementioned
property, the depth over which water can be stored and the maximum depth which can be
affected by evaporative loss is critical for the quantification of precipitation which can be
stored in a cover. Due to the variability of waste rock material,the storage capacity of a full
scale cover is very likely to vary spatially. This variability challenges the precision of inputs
to long term cover performance modelling and therefore the reliability of these model
outcomes. An analysis of the climatic data (e.g. frequency, amount and intensity of
precipitation) is therefore indispensable to minimise the risk of failure of a cover system prior
to its design and installation.
DESIGNING'EFFECTIVE'STORE.RELEASE'COVERS'–'THE'ROLE'OF'VEGETATION
33
References(
ALLEN, R. G., PEREIRA, L. S., RAES, D. & SMITH, M. 1998. Crop evapotranspiration: Guildines for computing crop water requirements. In: FAO (ed.) FAO Irrigation and Drainage Paper.
BALDOCCHI, D. D., XU, L. K. & KIANG, N. 2004. How plant functional-type, weather, seasonal drought, and soil physical properties alter water and energy fluxes of an oak-grass savanna and an annual grassland. Agricultural and Forest Meteorology, 123, 13-39.
BAUMGARTL, T. & MULLIGAN, D. R. 2009. Functions of Designed Cover Systems in Semi-Arid Environments of Australia. In: WIERTZ, J. & MORAN, C., eds. Enviromine2009, 30 September - 2 October 2009 Santiago, Chile.
BENSON, C. H., SAWANGSURIYA, A., TRZEBIATOWSKI, B. & ALBRIGHT, W. H. 2007. Postconstruction changes in the hydraulic properties of water balance cover soils. Journal of Geotechnical and Geoenvironmental Engineering, 133, 349-359.
BOHNHOFF, G. L., OGORZALEK, A. S., BENSON, C. H., SHACKELFORD, C. D. & APIWANTRAGOON, P. 2009. Field Data and Water-Balance Predictions for a Monolithic Cover in a Semiarid Climate. Journal of Geotechnical and Geoenvironmental Engineering, 135, 333-348.
BUREAU OF METEOROLOGY. 2011a. Climate of Cobar [Online]. Available: http://www.bom.gov.au/weather/nsw/cobar/climate.shtml [Accessed 14/06/2011 2011].
BUREAU OF METEOROLOGY. 2011b. Climate Statistics Cobar MO [Online]. Available: http://www.bom.gov.au/climate/averages/tables/cw_048027.shtml [Accessed 14/06/2011].
BUREAU OF METEOROLOGY. 2011c. Daily rainfall Cobar MO [Online]. Available: http://www.bom.gov.au/jsp/ncc/cdio/weatherData/av?p_nccObsCode=136&p_display_type=dailyDataFile&p_startYear=&p_c=&p_stn_num=048027 [Accessed 18/08/2011].
BUREAU OF METEOROLOGY. 2011d. Daily rainfall Mt Isa Mine [Online]. Available: http://www.bom.gov.au/jsp/ncc/cdio/weatherData/av?p_nccObsCode=136&p_display_type=dailyDataFile&p_startYear=&p_c=&p_stn_num=029126 [Accessed 01/12/2011].
BUREAU OF METEOROLOGY. 2012. Climate of Mount Isa [Online]. Available: http://www.bom.gov.au/weather/qld/mt_isa/climate.shtml [Accessed 04/02/2012].
CHRISTOPHERSON, R. W. 1994. Geosystems - An Introduction to Physical Geography, New Jersey, Macmillan College Publishing Company, Inc.
CRITCHLEY, W. & SIEGERT, K. 1991. Water harvesting: A manual for the design and construction of water harvesting schemes for plant production. In: FAO (ed.). Rome, Italy.
D'ODORICO, P. & PORPORATO, A. 2006. Ecohydrology of arid and semiarid ecosystems: An introduction. In: D'ODORICO, P. & PORPORATO, A. (eds.) Dryland Ecohydrology. Dordrechtn The Netherlands: Springer.
DURNER, W. 1994. Hydraulic conductivity estimation for soils with heterogenous pore structure. Water Resources Research, 30, 211-223.
HILLEL, D. 2004. Introduction to Environmental Soil Physics, Amsterdam, Elsevier Academic Press.
HUTLEY, L. B., O'GRADY, A. P. & EAMUS, D. 2000. Evapotranspiration from eucalypt open-forest savanna of northern Australia. Functional Ecology, 14, 183-194.

DESIGNING'EFFECTIVE'STORE.RELEASE'COVERS'–'THE'ROLE'OF'VEGETATION
34
INAP: THE INTERNATIONAL NETWORK FOR ACID PREVENTION. 2011. Global Acid Rock Drainage (GARD) Guide [Online]. Available: http://www.gardguide.com/index.php/Main_Page [Accessed 07/02/2012 2012].
KOTTEK, M., GRIESER, J., BECK, C., RUDOLF, B. & RUBEL, F. 2006. World Map of the Koeppen-Geiger climate classification updated. Meterologische Zeitschrift, 15, 259-263.
KURC, S. A. & SMALL, E. E. 2004. Dynamics of evapotranspiration in semiarid grassland and shrubland ecosystems during the summer monsoon season, central New Mexico. Water Resources Research, 40.
LIU, S., LI, S. G., YU, G. R., ASANUMA, J., SUGITA, M., ZHANG, L. M., HU, Z. M. & WEI, Y. F. 2010. Seasonal and interannual variations in water vapor exchange and surface water balance over a grazed steppe in central Mongolia. Agricultural Water Management, 97, 857-864.
LOTTERMOSER, B. 2007. Mine Wastes: Characterization, Treatment and Environmental Impacts, Berlin, Springer.
MEIERS, G., BARBOUR, S. L. & WILSON, D. 2009. The Influence of Soil Cover Heterogeneity on Water Movement within Water Balance Covers on Gold Mine Tailings. Securing the Future and 8th International Conference on Acid Rock Drainage (ICARD) Skellefta, Sweden.
MILCZAREK, M., YAO, T.-M., VINSON, J., WORD, J., KIESSLING, S., MUSSER, B. & MOHR, R. 2003. Performance of Mono-Layer Evapotranspirative Covers in Response to High Precipitation and Extended Drought Periods in the Southwestern United Staes. Proceedings of the 6th International Conference on Acid Rock Drainage. Cairns, Australia.
O'KANE CONSULTANTS INC. 2002. As-built report for the Peak Gold Mine tailings dam cover system field trials. Saskatoon, Canada.
O'KANE CONSULTANTS INC. 2004. Design, Construction and Performance Monitoring of Cover Systems for Waste Rock and Tailings. In: MEND (ed.). Prevention and Control, accessed at http://www.nrcan.gc.ca/mms-smm/tect-tech/sat-set/pub-pub-eng.html.
O'KANE, M. 2011. State-of-the-art performance monitoring of cover systems - Moving from point scale to macro scale approaches. In: BELL, L. C. & BRADDOCK, B. (eds.) Seventh Australian Workshop on Acid and Metalliferous Drainage. Darwin.
PRESSLAND, A. J. 1978. Soil moisture distribution and Evapotranspiration of a Mulga (Acacia aneura) Scrubland in South Western Queensland In: HOWES, D. J. (ed.) Studies of the Australian Arid Zone. III. Water in Rangelands. Perth: CSIRO.
SCHNEIDER, A., BAUMGARTL, T., DOLEY, D. & MULLIGAN, D. 2010. Evaluation of the Heterogeneity of Constructed Landforms for Rehabilitation Using Lysimeters. Vadose Zone Journal, 9, 898-909.
SCHWÄRZEL, K. & PUNZEL, J. 2007. Hood-infiltrometer - a new type of tension infiltrometer. Soil Sci. Soc. Am. 71:1438-1447.
SHARMA, M. L. 1976. Soil-water regimes and water extraction patterns under 2 semi-arid shrub (Atriplex spp) communities. Australian Journal of Ecology, 1, 249-258.
SMITH, L., LÓPEZ, D. L., BECKIE, R., MORIN, K., DAWSON, R. & PRICE, W. 1995. Hydrogeology of waste rock dumps. In: MEND (ed.).
SPECHT, R. L. 1981. Foliage projective cover and standing biomass. In: GILLISON, A. N. & ANDERSON, D. J. (eds.) Vegetation classification in Australia: Proceedings of a workshop sponsored by CSIRO Division of Land Use Research, Canberra, October 1978. Canberra: CSIRO and Australian National university Press.
DESIGNING'EFFECTIVE'STORE.RELEASE'COVERS'–'THE'ROLE'OF'VEGETATION
35
SPECHT, R. L. & SPECHT, A. 1999. Australian plant communities: Dynamics of structure, growth and biodiversity, New York, Oxford University Press.
STANNARD, D. I. & WELTZ, M. A. 2006. Partitioning evapotranspiration in sparsely vegetated rangeland using a portable chamber. Water Resources Research, 42.
TAYLOR, G., SPAIN, A., NEFIODOVAS, A., TIMMS, G., KUZNETSOV, V. & BENNET, J. 2003. Determination of the Reasons for Detoriation of the Rum Jungle Waste Rock Cover. In: ACMER (ed.). Brisbane, accessed at http://www.inap.com.au/public_downloads/Research_Projects/Rum_Jungle_Report.pdf (19/11/2008).
URRUTIA, P., WILSON, W., ARANDA, C., PETERSON, H., BLACKMORE, S., SIFUENTES, F. & SANCHEZ, M. 2011. Desing and construction of field-scale lysimeters for evaluation of cover systems at the Antamina Mine, Peru. Tailings and Mine Waste 2011. Vancouver, Canada: Norman B. Keevil Institute of Mining Engineering, University of British Columbia.
WILLIAMS, D. J. 2011. Appropriate geo-cover systems for different climates. In: BELL, L. C. & BRADDOCK, B. (eds.) Seventh Australian Workshop on Acid and Metalliferous Drainage. Darwin, Australia.
WILSON, G. W., WILLIAMS, D. G. & RYKAART, E. M. 2003. Integrity on Cover Systems - An Update. In: T., F. & TAYLOR, G. (eds.) 6th International Conference on Acid Rock Drainage. Cairns, Australia: The Australasian Institute of Mining and Metallurgy (AusIMM).
WINKWORTH, R. E. 1970. Soil water regime of an arid grassland (Eragrostis-Eriopoda Benth) community in central Australia. Agricultural Meteorology, 7, 387-399.
ZEPPEL, M. J. B., YUNUSA, I. A. M. & EAMUS, D. 2006. Daily, seasonal and annual patterns of transpiration from a stand of remnant vegetation dominated by a coniferous Callitris species and a broad-leaved Eucalyptus species. Physiologia Plantarum, 127, 413-422.

DESIGNING'EFFECTIVE'STORE.RELEASE'COVERS'–'THE'ROLE'OF'VEGETATION
36
Published journal papers and refereed conference proceedings containing information from this project:
Schneider, A., Doley, D., Arnold, S. Baumgartl, T., Mulligan, D. 2012. Evapotranspiration on a mine cover system in central New South Wales, Australia. In: Burkitt, L, Sparrow: Proceedings of the 5th Joint Australian and New Zealand Soil Science Conference. Hobart, Dec 2012.
Schneider, A., Baumgartl, T., Doley, D., Mulligan, D. 2012. Variability in Parameters of the Water Balance Equation and their Influence on Evapotranspiration Cover Performance. Life of Mine Conference Brisbane, 10-12 July 2012.
Baumgartl, T., Schneider, A., Mulligan, D. 2011. Applicability of cover designs in different climates of Australia, AAMD Conference - Darwin 2011.
Schneider, A., Baumgartl, T., Doley, D., Mulligan, D. 2010. Store and release cover systems: A suitable preventive for acid mine drainage in semi-arid monsoonal Queensland? 19th World Congress of Soil Science, 1-6 August Brisbane, Australia
Schneider, A., Baumgartl, T., Doley, D., Mulligan, D. 2010. Evaluation of the Heterogeneity of Constructed Landforms for Rehabilitation Using Lysimeters. Vadose Zone J. 9:898-909.
DESIGNING'EFFECTIVE'STORE.RELEASE'COVERS'–'THE'ROLE'OF'VEGETATION
37
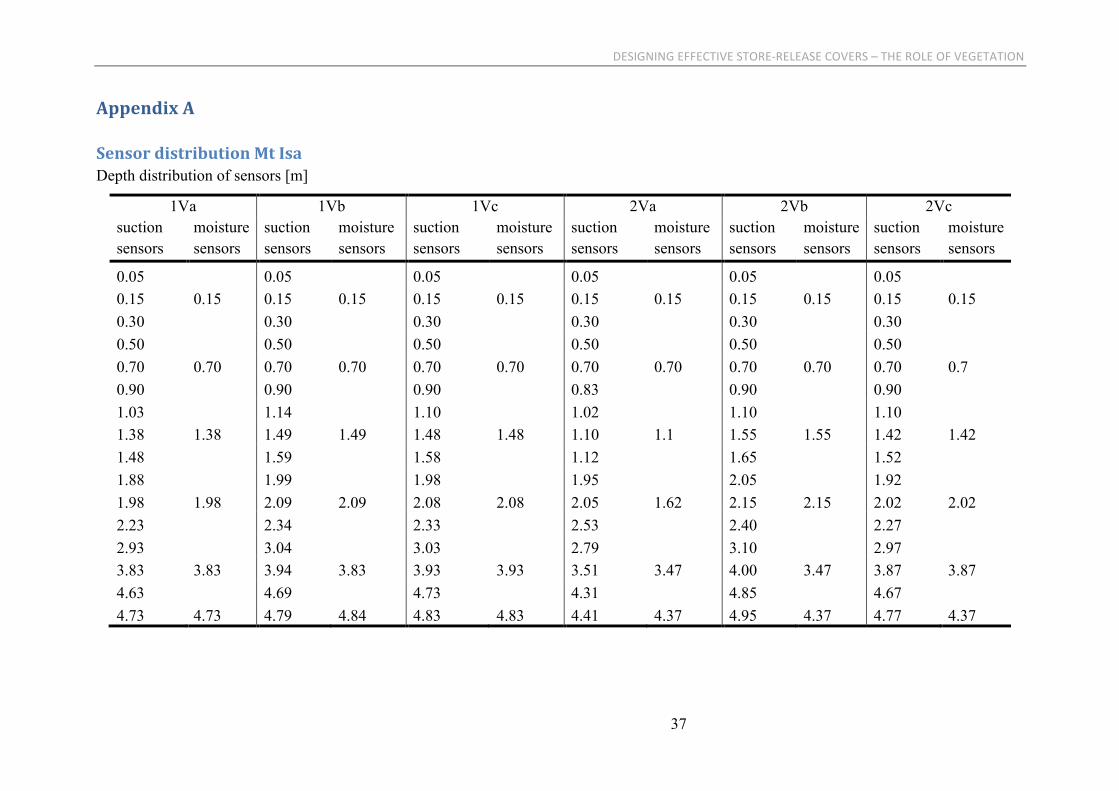
Appendix(A(
Sensor(distribution(Mt(Isa(Depth distribution of sensors [m]
1Va 1Vb 1Vc 2Va 2Vb 2Vc suction sensors
moisture sensors
suction sensors
moisture sensors
suction sensors
moisture sensors
suction sensors
moisture sensors
suction sensors
moisture sensors
suction sensors
moisture sensors
0.05 0.05 0.05 0.05 0.05 0.05 0.15 0.15 0.15 0.15 0.15 0.15 0.15 0.15 0.15 0.15 0.15 0.15 0.30 0.30 0.30 0.30 0.30 0.30 0.50 0.50 0.50 0.50 0.50 0.50 0.70 0.70 0.70 0.70 0.70 0.70 0.70 0.70 0.70 0.70 0.70 0.7 0.90 0.90 0.90 0.83 0.90 0.90 1.03 1.14 1.10 1.02 1.10 1.10 1.38 1.38 1.49 1.49 1.48 1.48 1.10 1.1 1.55 1.55 1.42 1.42 1.48 1.59 1.58 1.12 1.65 1.52 1.88 1.99 1.98 1.95 2.05 1.92 1.98 1.98 2.09 2.09 2.08 2.08 2.05 1.62 2.15 2.15 2.02 2.02 2.23 2.34 2.33 2.53 2.40 2.27 2.93 3.04 3.03 2.79 3.10 2.97 3.83 3.83 3.94 3.83 3.93 3.93 3.51 3.47 4.00 3.47 3.87 3.87 4.63 4.69 4.73 4.31 4.85 4.67 4.73 4.73 4.79 4.84 4.83 4.83 4.41 4.37 4.95 4.37 4.77 4.37
DESIGNING'EFFECTIVE'STORE.RELEASE'COVERS'–'THE'ROLE'OF'VEGETATION
38
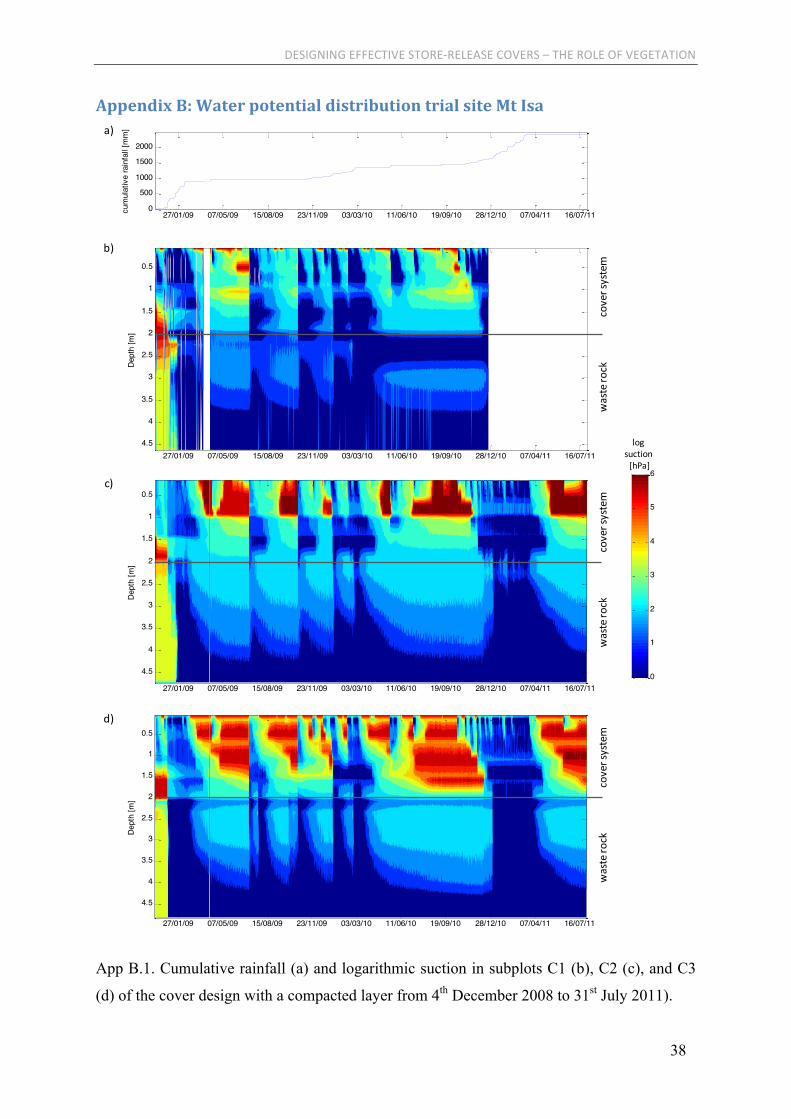
Appendix(B:(Water(potential(distribution(trial(site(Mt(Isa(
App B.1. Cumulative rainfall (a) and logarithmic suction in subplots C1 (b), C2 (c), and C3
(d) of the cover design with a compacted layer from 4th December 2008 to 31st July 2011).
27/01/09 07/05/09 15/08/09 23/11/09 03/03/10 11/06/10 19/09/10 28/12/10 07/04/11 16/07/110
500
1000
1500
2000
cum
ulat
ive
rain
fall
[mm
]
Dep
th [m
]
27/01/09 07/05/09 15/08/09 23/11/09 03/03/10 11/06/10 19/09/10 28/12/10 07/04/11 16/07/11
0.5
1
1.5
2
2.5
3
3.5
4
4.50
1
2
3
4
5
6
27/01/09 07/05/09 15/08/09 23/11/09 03/03/10 11/06/10 19/09/10 28/12/10 07/04/11 16/07/110
500
1000
1500
2000
cum
ulat
ive
rain
fall
[mm
]
Cumulative daily rainfall
Dep
th [m
]
27/01/09 07/05/09 15/08/09 23/11/09 03/03/10 11/06/10 19/09/10 28/12/10 07/04/11 16/07/11
0.5
1
1.5
2
2.5
3
3.5
4
4.5
0
1
2
3
4
5
6
27/01/09 07/05/09 15/08/09 23/11/09 03/03/10 11/06/10 19/09/10 28/12/10 07/04/11 16/07/110
500
1000
1500
2000
cum
ulat
ive
rain
fall
[mm
]
D
epth
[m]
27/01/09 07/05/09 15/08/09 23/11/09 03/03/10 11/06/10 19/09/10 28/12/10 07/04/11 16/07/11
0.5
1
1.5
2
2.5
3
3.5
4
4.50
1
2
3
4
5
6
27/01/09 07/05/09 15/08/09 23/11/09 03/03/10 11/06/10 19/09/10 28/12/10 07/04/11 16/07/110
500
1000
1500
2000
cum
ulat
ive
rain
fall
[mm
]
Dep
th [m
]
27/01/09 07/05/09 15/08/09 23/11/09 03/03/10 11/06/10 19/09/10 28/12/10 07/04/11 16/07/11
0.5
1
1.5
2
2.5
3
3.5
4
4.50
1
2
3
4
5
6
a)
b)
c)
d)
cover*system
waste*ro
ckcover*system
waste*ro
ckcover*system
waste*ro
ck
log*suction*[hPa]
DESIGNING'EFFECTIVE'STORE.RELEASE'COVERS'–'THE'ROLE'OF'VEGETATION
39
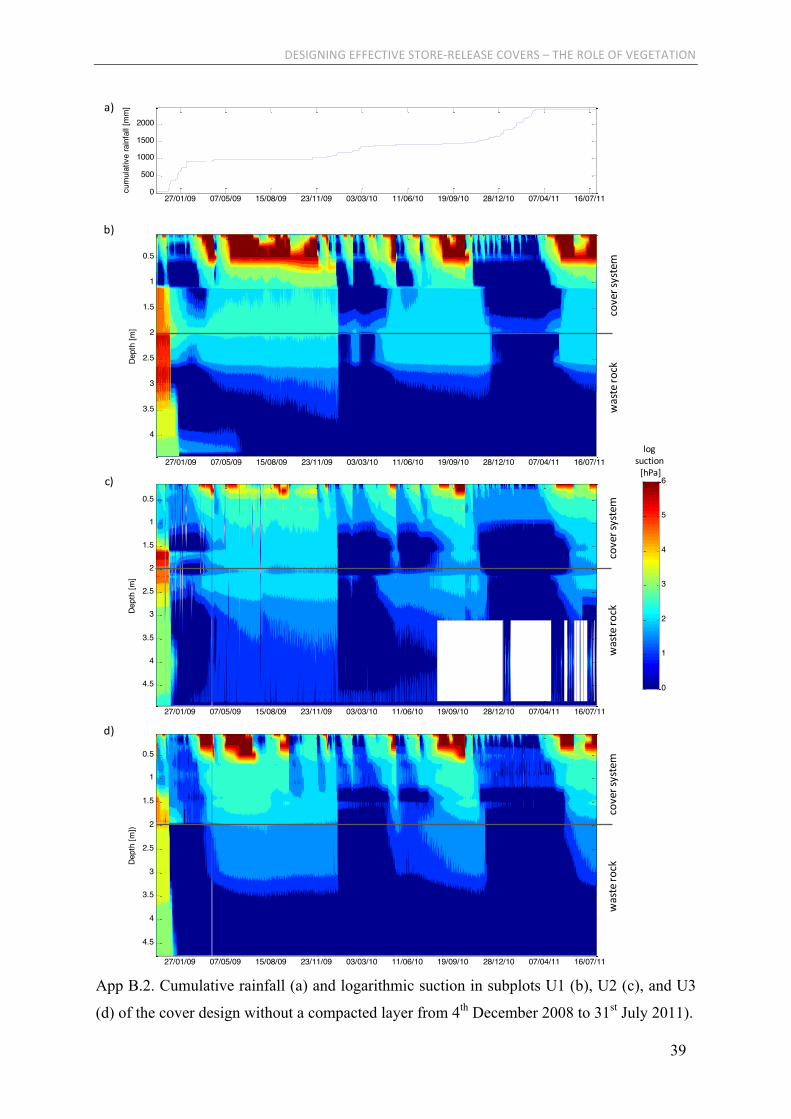
App B.2. Cumulative rainfall (a) and logarithmic suction in subplots U1 (b), U2 (c), and U3
(d) of the cover design without a compacted layer from 4th December 2008 to 31st July 2011).
27/01/09 07/05/09 15/08/09 23/11/09 03/03/10 11/06/10 19/09/10 28/12/10 07/04/11 16/07/110
500
1000
1500
2000cu
mul
ativ
e ra
infa
ll [m
m]
Dep
th [m
]
27/01/09 07/05/09 15/08/09 23/11/09 03/03/10 11/06/10 19/09/10 28/12/10 07/04/11 16/07/11
0.5
1
1.5
2
2.5
3
3.5
4
0
1
2
3
4
5
6
27/01 07/05 15/08 23/11 03/03 11/06 19/09 28/12 07/04 16/070
500
1000
1500
2000
cum
ulat
ive
rain
fall
[mm
]
Cumulative daily rainfall
Dep
th [m
]
27/01/09 07/05/09 15/08/09 23/11/09 03/03/10 11/06/10 19/09/10 28/12/10 07/04/11 16/07/11
0.5
1
1.5
2
2.5
3
3.5
4
4.5
0
1
2
3
4
5
6
27/01/09 07/05/09 15/08/09 23/11/09 03/03/10 11/06/10 19/09/10 28/12/10 07/04/11 16/07/110
500
1000
1500
2000
cum
ulat
ive
rain
fall
[mm
]
Cumulative daily rainfall
Dep
th [m
])
27/01/09 07/05/09 15/08/09 23/11/09 03/03/10 11/06/10 19/09/10 28/12/10 07/04/11 16/07/11
0.5
1
1.5
2
2.5
3
3.5
4
4.50
1
2
3
4
5
6
27/01/09 07/05/09 15/08/09 23/11/09 03/03/10 11/06/10 19/09/10 28/12/10 07/04/11 16/07/110
500
1000
1500
2000
cum
ulat
ive
rain
fall
[mm
]
Dep
th [m
]
27/01/09 07/05/09 15/08/09 23/11/09 03/03/10 11/06/10 19/09/10 28/12/10 07/04/11 16/07/11
0.5
1
1.5
2
2.5
3
3.5
4
4.50
1
2
3
4
5
6
log$suction$[hPa]
cover$system
waste$ro
ckcover$system
waste$ro
ckcover$system
waste$ro
ck
a)
b)
c)
d)
DESIGNING'EFFECTIVE'STORE.RELEASE'COVERS'–'THE'ROLE'OF'VEGETATION
40
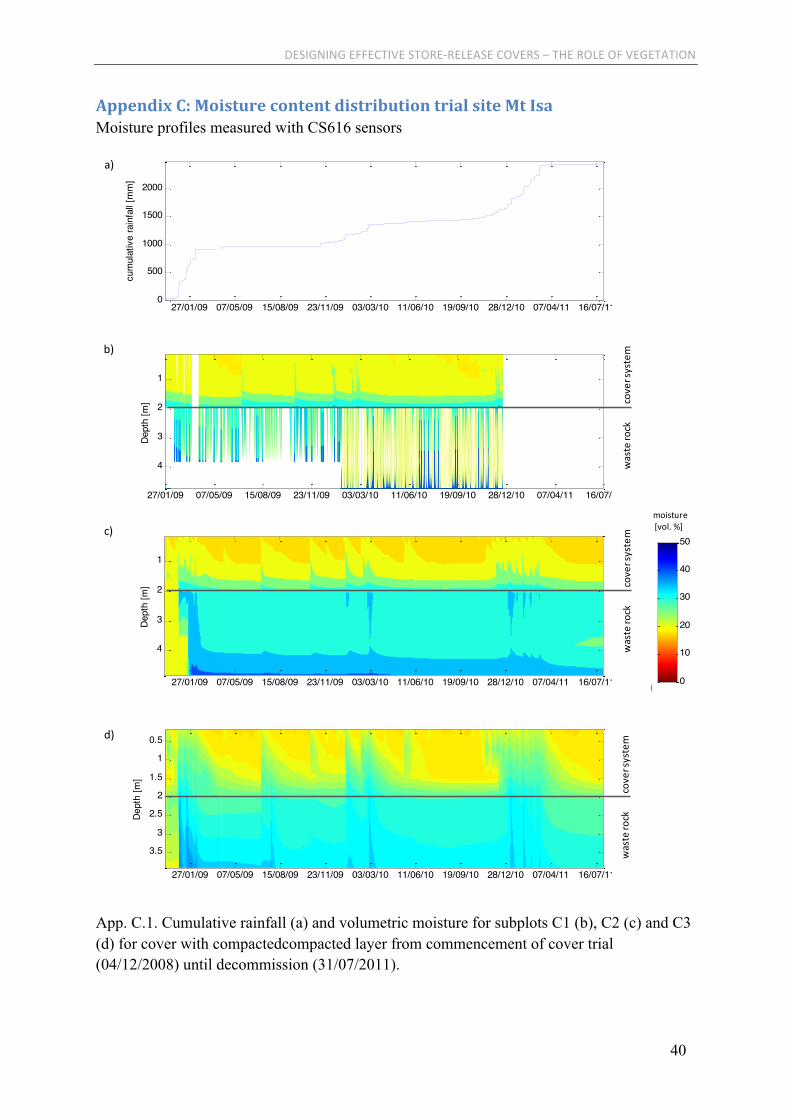
Appendix(C:(Moisture(content(distribution(trial(site(Mt(Isa(Moisture profiles measured with CS616 sensors
App. C.1. Cumulative rainfall (a) and volumetric moisture for subplots C1 (b), C2 (c) and C3 (d) for cover with compactedcompacted layer from commencement of cover trial (04/12/2008) until decommission (31/07/2011).
Dep
th [m
]
27/01/09 07/05/09 15/08/09 23/11/09 03/03/10 11/06/10 19/09/10 28/12/10 07/04/11 16/07/11
1
2
3
4
0
10
20
30
40
50
27/01/09 07/05/09 15/08/09 23/11/09 03/03/10 11/06/10 19/09/10 28/12/10 07/04/11 16/07/110
500
1000
1500
2000
cum
ulat
ive
rain
fall
[mm
]
27/01/09 07/05/09 15/08/09 23/11/09 03/03/10 11/06/10 19/09/10 28/12/10 07/04/11 16/07/110
500
1000
1500
2000
cum
ulat
ive
rain
fall
[mm
]
Dep
th [m
]
27/01/09 07/05/09 15/08/09 23/11/09 03/03/10 11/06/10 19/09/10 28/12/10 07/04/11 16/07/11
1
2
3
4
0
10
20
30
40
50
27/01/09 07/05/09 15/08/09 23/11/09 03/03/10 11/06/10 19/09/10 28/12/10 07/04/11 16/07/110
500
1000
1500
2000
cum
ulat
ive
rain
fall
[mm
]
Dep
th [m
]
27/01/09 07/05/09 15/08/09 23/11/09 03/03/10 11/06/10 19/09/10 28/12/10 07/04/11 16/07/11
0.5
1
1.5
2
2.5
3
3.5
0
10
20
30
40
50
27/01/09 07/05/09 15/08/09 23/11/09 03/03/10 11/06/10 19/09/10 28/12/10 07/04/11 16/07/110
500
1000
1500
2000
cum
ulat
ive
rain
fall
[mm
]
Dept
h [m
]
27/01/09 07/05/09 15/08/09 23/11/09 03/03/10 11/06/10 19/09/10 28/12/10 07/04/11 16/07/11
0.5
1
1.5
2
2.5
3
3.5
0
10
20
30
40
50
cover&system
waste&rock
cover&system
waste&rock
cover&system
waste&rock
a)
b)
c)
d)
moisture[vol.&%]
DESIGNING'EFFECTIVE'STORE.RELEASE'COVERS'–'THE'ROLE'OF'VEGETATION
41
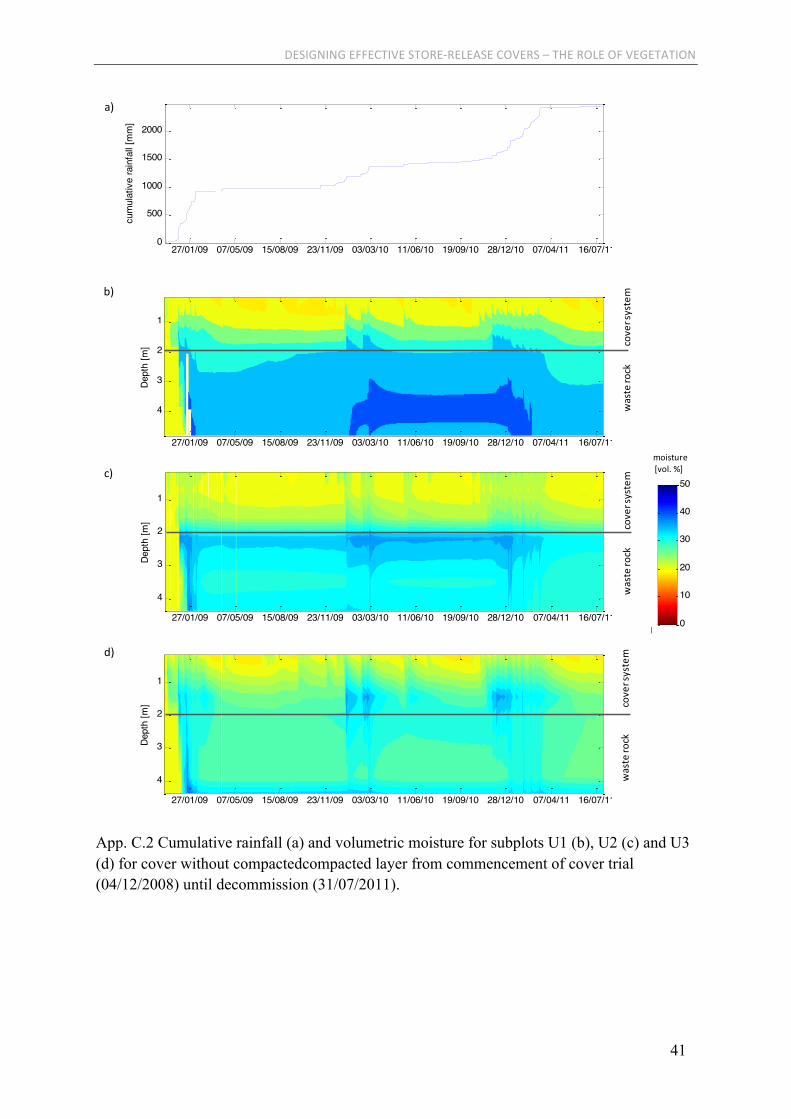
App. C.2 Cumulative rainfall (a) and volumetric moisture for subplots U1 (b), U2 (c) and U3 (d) for cover without compactedcompacted layer from commencement of cover trial (04/12/2008) until decommission (31/07/2011).
27/01/09 07/05/09 15/08/09 23/11/09 03/03/10 11/06/10 19/09/10 28/12/10 07/04/11 16/07/110
500
1000
1500
2000cu
mul
ativ
e ra
infa
ll [m
m]
Dep
th [m
]
27/01/09 07/05/09 15/08/09 23/11/09 03/03/10 11/06/10 19/09/10 28/12/10 07/04/11 16/07/11
1
2
3
4
0
10
20
30
40
50
27/01/09 07/05/09 15/08/09 23/11/09 03/03/10 11/06/10 19/09/10 28/12/10 07/04/11 16/07/110
500
1000
1500
2000
cum
ulat
ive
rain
fall
[mm
]
Dep
th [m
]
27/01/09 07/05/09 15/08/09 23/11/09 03/03/10 11/06/10 19/09/10 28/12/10 07/04/11 16/07/11
1
2
3
40
10
20
30
40
50
27/01/09 07/05/09 15/08/09 23/11/09 03/03/10 11/06/10 19/09/10 28/12/10 07/04/11 16/07/110
500
1000
1500
2000
cum
ulat
ive
rain
fall
[mm
]
Dep
th [m
]
27/01/09 07/05/09 15/08/09 23/11/09 03/03/10 11/06/10 19/09/10 28/12/10 07/04/11 16/07/11
1
2
3
40
10
20
30
40
50
27/01/09 07/05/09 15/08/09 23/11/09 03/03/10 11/06/10 19/09/10 28/12/10 07/04/11 16/07/110
500
1000
1500
2000
cum
ulat
ive
rain
fall
[mm
]
Dept
h [m
]
27/01/09 07/05/09 15/08/09 23/11/09 03/03/10 11/06/10 19/09/10 28/12/10 07/04/11 16/07/11
0.5
1
1.5
2
2.5
3
3.5
0
10
20
30
40
50
cover&system
waste&rock
cover&system
waste&rock
cover&system
waste&rock
a)
b)
c)
d)
moisture[vol.&%]
DESIGNING'EFFECTIVE'STORE.RELEASE'COVERS'–'THE'ROLE'OF'VEGETATION
42
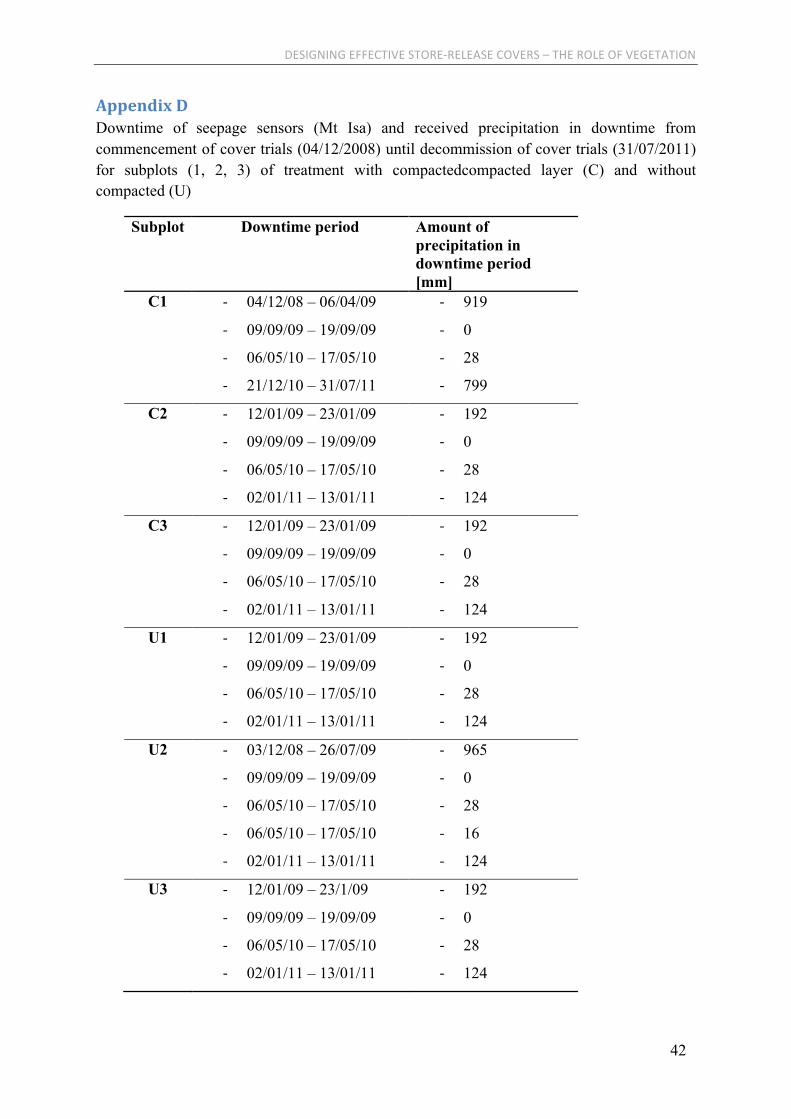
Appendix(D(Downtime of seepage sensors (Mt Isa) and received precipitation in downtime from commencement of cover trials (04/12/2008) until decommission of cover trials (31/07/2011) for subplots (1, 2, 3) of treatment with compactedcompacted layer (C) and without compacted (U)
Subplot Downtime period Amount of precipitation in downtime period [mm]
C1 . 04/12/08 – 06/04/09
. 09/09/09 – 19/09/09
. 06/05/10 – 17/05/10
. 21/12/10 – 31/07/11
. 919
. 0
. 28
. 799
C2 . 12/01/09 – 23/01/09
. 09/09/09 – 19/09/09
. 06/05/10 – 17/05/10
. 02/01/11 – 13/01/11
. 192
. 0
. 28
. 124
C3 . 12/01/09 – 23/01/09
. 09/09/09 – 19/09/09
. 06/05/10 – 17/05/10
. 02/01/11 – 13/01/11
. 192
. 0
. 28
. 124
U1 . 12/01/09 – 23/01/09
. 09/09/09 – 19/09/09
. 06/05/10 – 17/05/10
. 02/01/11 – 13/01/11
. 192
. 0
. 28
. 124
U2 . 03/12/08 – 26/07/09
. 09/09/09 – 19/09/09
. 06/05/10 – 17/05/10
. 06/05/10 – 17/05/10
. 02/01/11 – 13/01/11
. 965
. 0
. 28
. 16
. 124
U3 . 12/01/09 – 23/1/09
. 09/09/09 – 19/09/09
. 06/05/10 – 17/05/10
. 02/01/11 – 13/01/11
. 192
. 0
. 28
. 124
DESIGNING'EFFECTIVE'STORE.RELEASE'COVERS'–'THE'ROLE'OF'VEGETATION
43
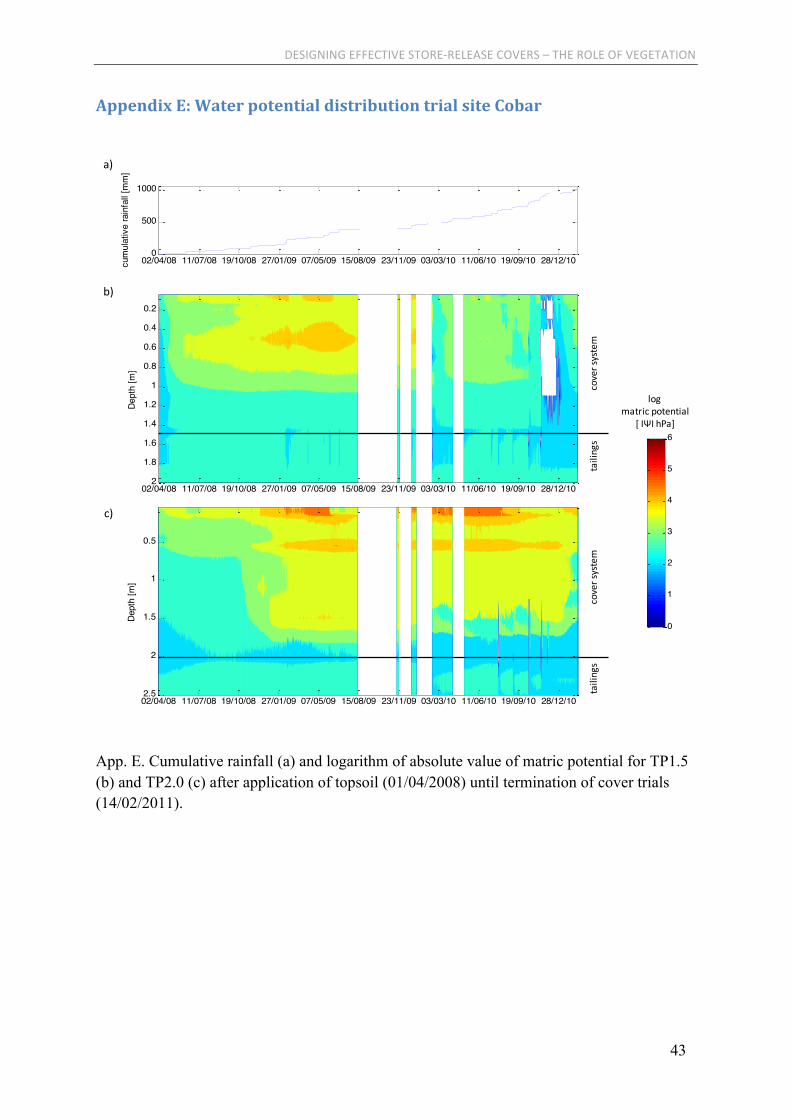
Appendix(E:(Water(potential(distribution(trial(site(Cobar(
App. E. Cumulative rainfall (a) and logarithm of absolute value of matric potential for TP1.5 (b) and TP2.0 (c) after application of topsoil (01/04/2008) until termination of cover trials (14/02/2011).
03/07/02 19/01/03 07/08/03 23/02/04 10/09/04 29/03/05 15/10/05 03/05/06 19/11/06 07/06/07 24/12/070
500
1000
1500
cum
ulat
ive
rain
fall
[mm
]
Dept
h [m
]
03/07/02 19/01/03 07/08/03 23/02/04 10/09/04 29/03/05 15/10/05 03/05/06 19/11/06 07/06/07 24/12/07
0.5
1
1.5
2
2.5 0
1
2
3
4
5
6
02/04/08 11/07/08 19/10/08 27/01/09 07/05/09 15/08/09 23/11/09 03/03/10 11/06/10 19/09/10 28/12/100
500
1000
cum
ulat
ive
rain
fall
[mm
]
Dept
h [m
]
02/04/08 11/07/08 19/10/08 27/01/09 07/05/09 15/08/09 23/11/09 03/03/10 11/06/10 19/09/10 28/12/10
0.2
0.4
0.6
0.8
1
1.2
1.4
1.6
1.8
2 0
1
2
3
4
5
6
02/04/08 11/07/08 19/10/08 27/01/09 07/05/09 15/08/09 23/11/09 03/03/10 11/06/10 19/09/10 28/12/100
500
1000
cum
ulat
ive
rain
fall
[mm
]
Dept
h [m
]
02/04/08 11/07/08 19/10/08 27/01/09 07/05/09 15/08/09 23/11/09 03/03/10 11/06/10 19/09/10 28/12/10
0.5
1
1.5
2
2.5 0
1
2
3
4
5
6
cover&system
tailings
cover&system
tailings
a)
b)
c)
log&matric&potential
[&IΨI&hPa]

DESIGNING'EFFECTIVE'STORE.RELEASE'COVERS'–'THE'ROLE'OF'VEGETATION
44
Appendix(F:(Water(potential(distribution(trial(site(Cobar(
App. F. Cumulative rainfall (a) and moisture for TP1.5 (b) and TP2.0 (c) from
commencement of cover trials (23/05/2002) until application of topsoil (28/02/2008).
03/07/02 19/01/03 07/08/03 23/02/04 10/09/04 29/03/05 15/10/05 03/05/06 19/11/06 07/06/07 24/12/07
500
1000
1500
cum
ulat
ive
rain
fall
[mm
]
Dep
th [m
]
03/07/02 19/01/03 07/08/03 23/02/04 10/09/04 29/03/05 15/10/05 03/05/06 19/11/06 07/06/07 24/12/07
0.2
0.4
0.6
0.8
1
1.2
1.4
1.6
1.8
2
2.2
0
0.05
0.1
0.15
0.2
0.25
0.3
0.35
0.4
0.45
0.5
03/07/02 19/01/03 07/08/03 23/02/04 10/09/04 29/03/05 15/10/05 03/05/06 19/11/06 07/06/07 24/12/07
500
1000
1500
cum
ulat
ive
rain
fall
[mm
] Cumulative daily rainfall
Dep
th [m
]
03/07/02 19/01/03 07/08/03 23/02/04 10/09/04 29/03/05 15/10/05 03/05/06 19/11/06 07/06/07 24/12/07
0.5
1
1.5
2
2.5
0
0.05
0.1
0.15
0.2
0.25
0.3
0.35
0.4
0.45
0.5
cover&system
tailings
cover&system
tailings
moisture[m3m33]
a)
b)
c)


![SERV1857 785C (1HW), 785D (MSY), 789C 2BS)_TXT[1].pdf](https://img.pdfslide.us/doc/110x75/5695d0e01a28ab9b029439a1/serv1857-785c-1hw-785d-msy-789c-2bstxt1pdf.jpg)
