Embed Size (px)
DESCRIPTION
Designing with data
Citation preview
O’Reilly Media, Inc. 2/26/2015
Preface
Design & Data: A Perfect Synergy
All design is informed by data. Sometimes the ‘data’ is based in the experiences and observations of the designer, it’s “craft knowledge”. When design innovations yield great benefits to users and to companies, the practice of applying such craft knowledge derived from years of informal observation has fueled a mystique of the “genius designer”. However, we live in data rich times. With the advent of large scale data collection and with the increasing fascination with measures and metrics, such craft knowledge can appear ungrounded. An unintended side effect for some has been the assumption that design as a practice is never an empirical discipline, that design is never grounded in data, and that design is practice is opposed to data science. Some believe that large scale experiments can be run to gather data from millions of users to answer all design questions that such analytics can replace design. Some believe that any and all questions regarding, for example, font types, colours and sizes, questions such as “Should we have a blue or a red dialog box?”, “Do people engage more with a list or a carousel?” or “Does a wizard help with new user on-boarding flow?” are not the purview of designers but can be more effectively answered by engineering and data science. Let the crowd speak with their clicks, and what emerges will necessarily be the best design.
1
www.it-ebooks.info
O’Reilly Media, Inc. 2/26/2015
[Insert diagram illustrating the chicken and egg problem, eternally shifting venn diagrams, laddering the order of data and design]
We have a different view. Rather than an either/or, a divide between analytics and design insight, we believe designers have a significant role to play in the design of data gathering activities (what should be captured and why), in the design of data itself (what format should data take, what data types need to be triangulated) and in the presentation and communication of insights and results that derive from the data capture and analysis. We believe that data capture, data validation, data curation and management, and data analysis for insights are central to design practice. We believe that design practice is central to effective data design.
Therefore, in this book we ask: What is the relationship between data, design and ultimately the user?
We concede that, on the surface, data practice and design practice might seem incompatible. Much design practice centralises the creation of empathy with users focus on creating artful solutions for them, addressing their needs by creating and crafting effective products. For many designers, it’s emotive, it’s a non-linear exploratory journey, it cannot be articulated as a set of procedures or steps to be followed, it cannot be rationalized and constrained, it’s human, it’s a fluid practice. Design practice results in products that are experienced in ways that cannot be
2
www.it-ebooks.info
O’Reilly Media, Inc. 2/26/2015
reduced to numbers, cannot be captured with one size fits all measures and metrics. By contrast, the common belief is that data is rational, is about measurements and numbers that are irrefutable. Data is black and white. Data reveals the truth, it is not a fluid craft but a proceduralized scientific endeavor where rigor leads to irrefutable results, to certainty. Data science leads to truth, and is trustworthy. For some designers most measures do not capture the essence of the users experience and for some data scientists the only way to understand experience is to measure activity.
Both of these stories are, of course, myths. In reality, data sciences and design practices are working toward the same goal: understanding users and creating positive engagements with users. They are better together, in dialogue. Designers know that design practice has always been about different forms of data. Designers also know that we are in ever-changing marketplace and industry. This means that new technologies, new applications and therefore new behaviours are constantly emerging. We are designing in a dynamic environment where we need to quickly adapt and learn what works well or doesn’t work for our users. Data can play a big role in helping us learn and respond as quickly as possible. By harnessing and leveraging the power of data at scale, there are new ways to understand people, to understand “users”.
Designers also know that too often data gathered at scale does not accurately represent the human experience. One response to this is to reject and/or shy away from engaging with data at scale. But this is a two-way conversation: design can bring deeper meaning to data. Data at all scales, systematically collected, analyzed, communicated and leveraged can empower design. Designers have to engage in the practice and business of designing data, that is being part of the conversation about what data should be collected, when and most importantly why.
Who this is for As we wrote this book for you, we imagined a few things. That you felt a strong sense of responsibility towards representing user needs. Because of this, you see yourself as an advocate for users and want to ensure that you’re representing them accurately and appropriately. By being accountable to your users, you’re probably also eager to find ways to reflect them in business goals, measures and metrics. Ideally, you want data to be disciplined and in turn, you want to be disciplined about how you use data. We hope that the audience for this book is familiar with the concepts of iteration and continuous learning and that you want to bring that perspective to the design of data gathering and analysis and the practice of design itself.
3
www.it-ebooks.info
O’Reilly Media, Inc. 2/26/2015
For Designers
We are writing for designers who are largely unfamiliar with leveraging data or have very limited exposure to it in their day-to-day work. Perhaps you started your career with a strong art background (as opposed to engineering) or while you have done some qualitative user research, you have only worked at companies that haven’t had access to rich data.
The target audience for this book is not designers who have already gone through a corporate boot camp on data or regularly program API’s and consider Python a good friend of yours. While we have many friends who are like you, we feel like you are probably already familiar with much of what we will cover, so this book will be of limited use to you.
For User Researchers
We are also writing this book for user researchers who are focused on people’s everyday experience. You’re already empathetic and a humanist, with a desire to truly understand how people feel. You’re probably looking to get a stronger grasp of data because you want to learn more about how rich data at scale can augment your job.
We’re not writing this book for user researchers who are very familiar with statistical analysis, lab studies and rich survey analysis. Again, like so many of our designer friends, this book is will cover some of the basics of what you already know.
For Product Managers and Developers
If you are interested in the blending of design and data, then this book could help you gain insight into how designers are starting to approach their job by incorporating data. We know that great product is only built when you have product, technology and design working together hand in hand, so we’re of course excited to have as many people from other disciplines engage with this book as well.
All this being said, even if you are in our “not” column, you might be interested because you get the other side of the coin on how people view you.
Ultimately, this book is written for people involved in launching digital products - designers and product managers - who have little to no experience with taking a data aware approach to product development. You might be part of a small start up with just a few folks working on building your product or you might be part of a team in a larger company
4
www.it-ebooks.info
O’Reilly Media, Inc. 2/26/2015
and looking to bring some of the data methodology to your group. You might work as an in-house designer or you may be working in an agency with clients. So long as you have an interest in understanding how blending data and design can help you solve problems for your product, then we believe that you will find this book useful.
Scope Although this book is titled “Designing with Data”, we are not going to talk very much about design principles or patterns and we’re not going to teach you how to design. We are assuming that you have a basic understanding of design thinking and best practices, and working with partners in product management and technology to build your products. Based on our experience, the biggest adjustments for a designer or organization looking to leverage data is that they first need to get a solid understanding of data types and how they work together. Very rarely does it require a significant change to the fundamentals of how they design.
Our aim in this book is to help you understand the basics of designing with data, recognize the value of incorporating data into your workflow and avoid some of the pitfalls as you do. Although there are many types of data that you might use as a designer, we are focusing this book on large scale experiments and AB testing. We’re doing this specifically because we have found this to be where analytics and design have converged the least, but where we think that some of the greatest gains can be made. We will, however, provide a broad overview of other kinds of data in our appendix as a list of resources and recommendations that you can look into further on your own if you like.
At the end of this book, you should understand at a basic level the kinds of large scale data you can gather and when you’ll want to use various methods. You should get a sense of the relationship between different data gathering methods, and have a deeper sense about methods like AB testing which will include how to structure tests and what variables to consider as well as how to interpret your results. You probably already have a high-level an understanding of quantitative and qualitative data engagements, but you want to know more about the former. We aim to give some perspectives on how to incorporate a data aware approach into your organization, the long term benefits of it and how to consider or avoid some of the pitfalls as well. Throughout the book we’ll share our experiences and the experiences of others, suggest ways that your team can change the way you work, and get the most benefit from your data.
5
www.it-ebooks.info
O’Reilly Media, Inc. 2/26/2015
We want you to become more effective at what and how you design, and a better advocate for your work through data. We want you to get the best feedback from data to help you evaluate whether or not you are succeeding at what you set out to achieve. We want you to be able to argue your case with confidence about what should be measured, when and how to best illustrate, test and further your design intention. Ultimately, we would love to make you feel excited and eager to embark on a data aware approach within your company or organization. Remember, this is a nascent field and you can be a central part of how data and design come together in the future.
What we believe
We started to write this book because we wanted to encourage designers to influence and change the conversation around measures and metrics that purport to reflect the value of a product or service. Between the two of us, we have managed and driven user-centered design and evaluation processes in the Internet industry, we both care deeply about understanding the ways in which people interface with, interact with and derive value from technology. We also feel strongly that carefully gathered and analysed data can and does help develop that understanding but that we need to broaden the conversation. Ultimately though, we hope that by sharing our enthusiasm and passion for deeply integrating different forms of systematically and programmatically gathered data into the design process we can persuade others who have a human-centered approach to design to be more centrally part of the data design process. We believe this will lead to better products and better business. We believe data and design need to be seen as two sides of the same coin. We believe that designers, data scientists, developers and business leaders need to work together to determine what data to collect, when and why and how to manage, curate, summarize and communicate with and through data.
We also believe that “data” is by definition broad. We take into account everything from qualitative to quantitative data, bearing in mind that all qualitative data can be distilled into quantitative measures and all quantitative data are the result of qualitative judgments about what is measureable and what should or should not be measured. You may be gathering qualitative feedback by talking with your customers and users in a usability session about how effective or simple your product seems to them. Or you might be capturing quantitative data through tracking that you’ve instrumented in your product to measure exactly what actions your customers are doing in your product. If you only consider one form of
6
www.it-ebooks.info
O’Reilly Media, Inc. 2/26/2015
“data”, for example “click data”, you are not getting a full picture of your customer’s experience. Therefore we believe that the definition of data needs to be broad and constantly reviewed for completeness and addressing the questions posed.
In our daily work, we have heard concerns about incorporating data into the design process. Some of the most often discussed concerns about having a data orientation to design are:
• It enslaves you – believing in data as way to evaluate designs takes the power away from design as a practice
• Having a data orientation diminishes design as a practice, ie experience and instinct aren’t valued
• Having a data orientation stifles creativity and removes the “art” from the design process
• Focusing on data as a measure of user experience de-humanizes the design process, reducing experience and design assessment to “just numbers”
• Having a data orientation drives incrementalism, leads us to always get stuck in the minutia and focus on tweaking small variations in the design
While each of these concerns has some grain of truth–we have experienced some circumstances and work situations where these criticisms held–we believe that this was the case because designers were not part of the data collection and analysis conversation. That design intent and design evaluation was poorly matched to the data capture and analysis because designers with a desire to understand user experience were not in effective dialogue with data scientists and machine learning experts. By developing an awareness of and an affinity for data, such conversations will be possible and will be beneficial for both disciplines. Design practice can be enhanced, managed well, data science can demonstrate the worth of creativity in design rather than stifle it.
For us, the strongest benefits of taking a data aware approach are that it can help you:
• create a direct feedback loop with your users – elevating the way you understand and think about customer behavior, ultimately helping you to hone your instinct about users over time
• create a stronger bond between the user needs and how your business measures success, helping to align a cross-functional team
7
www.it-ebooks.info
O’Reilly Media, Inc. 2/26/2015
• create a rigorous approach which can help to eliminate hierarchy and rank from the process of decision making, allowing you to focus on your users’ needs
We believe that a data aware approach gives you a framework to have discussions around what your product needs to be or could be for a better business and user value overall result. Carefully captured, curated and analysed data can help you with future product innovations. We hope that by the end of this book you will feel like you are not just leveraging data, but also designing a new approach to crafting products.
Why us/About us We are excited to write this book because we are passionate about empowering designers to be able to formulate, inform and evaluate their approach to product design with data. Both of us have had a lot of experience working with data in both qualitative and quantitative capacities. We believe that our backgrounds were natural compliments to each other and as representatives of both design and user research in the companies we’ve worked in we’ve had a first row seat at witnessing the evolution of how designers have changed their relationship with data over the past 15 years.
A word from Elizabeth
My original training as an undergraduate was in experimental psychology. Therefore, carefully constructed questions that are programmatically addressed using the scientific method of data collection and analysis is baked into my way of thinking. I believe systematic data collection can help us understand people, their traits and motivations, their experiences and behaviors.
In this book we focus on user-testing at scale using logged behavioral data from online activity. My desire to write this book stems from a frustration I have with the separation of design practice and data science. As someone concerned with users and their experiences, it is incomprehensible to me that the two disciplines that are most responsible for users’ experiences are not in a more productive dialogue.
More specifically, while I am a strong advocate of data collection and data analysis to address questions regarding human behavior and to determine the effectiveness of design options, I have too often experienced the powerful tools of data science being used to address inappropriate
8
www.it-ebooks.info
O’Reilly Media, Inc. 2/26/2015
questions and poorly applied. While “data science” has become a well-regarded tool for companies, the art and science of asking the right questions (posing hypotheses), designing an effective study to address those questions, including designing the right measures to determine answers to the questions has not been equally emphasized. I have seen designers shy away from the evaluation process which evaluates their carefully crafted designs. I have read too many reports, sat in too many meetings and reviewed too many slide decks that contain summaries of user-behavior that at best make no sense and at worst reveal nothing about human behavior but everything about the biases and lack of training of the data “science”.
On the other side, I have seen many designers whose intuitions are excellent, whose skills are evident in the products they create, but who shy away from or actively resist answering the questions “What can we expect to see in terms of changes in user behavior from this roll-out? What should we look for as indicating people are learning the product? What kinds of error do you think people will make and what behavior should we instrument for, should we measure, to see if our hunch and our hypotheses are correct?”. Some designers don’t believe that is part of their job. They are happy to hand off to analysts and take on their next assignment. This book is not for them. Some designers do want to be part of that conversation but don’t feel empowered. I am writing this book to appeal to them. I am part of this project because I believe they are the best user advocates and because I believe that all questions about all products should start with the value to the user first. Given most businesses that offer discretionary products live and die by their user base, in these competitive markets, it only makes sense to develop a deeper connection between design, user experience and analytics. These together will provide the foundations for a responsive, customer centric business.
A word from Rochelle
I remember the first time I started to take a more data driven approach to design. It was in 2001. I was at a small startup and someone had mentioned how Amazon was applying AB testing as a technique to make decisions about their user experience. In AB testing you were exposing your users to several different kinds of experiences and then measuring which one “performed the best”. Our start-up was always great about reviewing the business metrics on a weekly basis and we were keen to get our hands on as much data as possible. However with the introduction of AB testing, we really got our heads around using data in an even more effective and sophisticated way than we previously had. During the next few years, our start-up took a very DIY and self-taught approach to
9
www.it-ebooks.info
O’Reilly Media, Inc. 2/26/2015
figuring the ins and outs of being more data driven. We studied and learned as much as we could about what other data driven companies like Netflix and Amazon were doing and tried to apply those learnings in practice.
Over the years, I’ve gotten more exposure to companies that really excelled in gathering data and information from their users - my company was acquired by Intuit which had a well established and widely respected approach towards user research and then later I joined Netflix which is one of the most disciplined technology companies at using data to make decisions. Having witnessed world class data driven environments has made me appreciate how incredible a tool it can be in helping to transform the way that an entire product organization works. I’ve learned that there are many nuances to combining data and design, and that while there are many benefits, there are also many pitfalls as well. My goal is to help more designers appreciate and take advantage of the benefits while avoiding some of the pitfalls that I, and others, have made in the past.
I’m writing this book, because I hope that I can share my enthusiasm and passion for working in a data driven environment with other designers and product managers and that I can help you elevate the way in which you work with data.
How to Use this Book Chapters 1-3 will give you a foundation for working with data. This not only includes some basic instruction on the different kinds of data and terminology, but will also cover how data relates to your business. We will discuss the importance of grounded question asking and creating hypotheses, of determining what critical mechanisms or levers for human behavior, about designing and developing for meaningful measures and metrics, and in general applying design thinking to the design of data capture, management and interpretation. In Chapters 3, 4 and 5 we look at more in-depth case studies to illustrate how to think about data capture, analysis and communication strategies during early, mid and late design evaluation. The last part of the book looks at some pitfalls and highlights some cautionary tales around data at scale. Here, we want you to be able to think critically and sharpen your data design lens. We highlight areas of concern both internally (how you work with your data) as well as externally (what does it mean to collect large amounts of data on your customers). We will conclude with some summary overview.
10
www.it-ebooks.info
O’Reilly Media, Inc. 2/26/2015
Chapter by Chapter Overview
We’ve divided the book into eight chapters and give a brief summary of each one below.
Chapter 1 – Why Does Data Matter?
This chapter is an introduction to data. We talk about the kind of data that you have access to as a designer, how different roles in a company interact with data and cover some of our basic terminology. We’ll also share two personal case studies with you to illustrate the importance of data, design and business.
Chapter 2 – Business Matters
Here we cover how businesses can be transformed as a result of data. We talk about the key concepts of the customer funnel and what kind of data you might measure at each stage. We also try to help you identify what kind of business you are and therefore how to determine which kind of data might be most important for you at this stage.
Chapter 3 – Foundations and Basics
In this chapter we’ll give you the necessary foundation around data. We talk in more depth about data types and how you collect them. We balance the pros and cons of qualitative and quantitative data and introduce the experimental methodology which is necessary to make sure you are using your data to its fullest.
Chapter 4 – Putting it to Use
Here we take the ideas from the previous chapters and put it into practice. We’ll use an in-depth case study or two to show how to walk through a design process from creating a hypothesis to analysis of results and roll out.
Chapter 5 – Culture and Communication
In this chapter we focus on communicating what you’ve learned to a broader audience. We also write about how to drive a culture focused on learning and making data a core part of that learning. We also talk about some of the softer side of culture including the kinds of people that work well in that environment and the longer-term benefits of using data in the design process.
11
www.it-ebooks.info
O’Reilly Media, Inc. 2/26/2015
Chapter 6 – Pitfalls and Cautions
In this chapter, we cover the most common pitfalls that people can fall into when incorporating data into their design practice. We talk about both easy mistakes that people or teams can make and some of the common misconceptions about the power of data.
Chapter 7 – The Ethics of Data
Here we acknowledge and examine some of the ethics around using data. As designers we want to make sure that we are always advocating for the user, and that also means being considerate about how we use their data and build trust with them.
Chapter 8 – Conclusions
We will summarize and consolidate the thoughts and focus of the previous chapters. We’ll leave you with some of the key highlights and some open areas for you to explore further.
How to read this book
If you don’t know much about designing with data, we’d suggest that you start by reading the first 5 chapters in order. After that, you can jump to the relevant parts or things you’re interested in in the second part of the book, referring back to the basics and “how to” sections as needed.
No matter how experienced you are with incorporating qualitative and quantitative data into your design process, we always find actual examples and interviews to be a great way to learn more about how the theories are being applied in reality. Vignettes are scattered throughout the book and aimed at showing you working examples of how data helped to facilitate design decisions. You can see the hypothesis that they were looking to prove and then see how they were articulated in the product or in the design and then see the results and what decisions were made. Remember that the results of each case study may not be applicable to you - you may have a different audience, product or constraints. The takeaway should be what the framework is and how you can apply it to your own situation or product. We’ve tried to pick case studies that illustrate key points, so you’re also welcome to just scan the case studies as a way to get an overview of the themes covered in this book as well.
It’s always fun for us to hear other people talk about how they think about the balance between data and design. We love to hear perspectives on how
12
www.it-ebooks.info
O’Reilly Media, Inc. 2/26/2015
13
data and analytics are changing our field. We’ve also included a few sidebars where we’ve asked people who are involved in the industry and familiar with the topic of designing with data to share their thoughts on how they leverage this data in their day-to-day work. These sidebars are also distributed throughout the book and can be read ad hoc on their own.
We hope this book will give you what you need to start out on this journey and to build a shared understanding with your peers of your product, based on objective feedback direct from your customers.
www.it-ebooks.info
O’Reilly Media, Inc. 2/26/2015
Why Does Data Matter?
Introduction
In this chapter we want to give you a high level introduction into how bringing data into the design process can transform your business. To do this, we’ll give some historical examples of the critical role that data played in illuminating core problems which will hopefully show you how powerful data can be. We’ll also cover how digital interfaces have fundamentally changed our ability to use data and some of the emerging tools and services which allows even the smallest companies to gather their own data at scale. Because we are using this chapter to set the foundation for the rest of the book, we will also use it to provide some basic terminology and touch on the different philosophical approaches to data and design. Ideally we’d like to take these data terms and transform them into design terms which you will feel comfortable with.
This chapter is much more about giving you a basic understanding of the relationship between data, business and design, rather than teaching you how to design or making you an expert statistician or data scientist. We’d like to show you how data and design are just tools that you use to build really great experiences for your users. If you are building great experiences for your users, then you have a great foundation for your business. We will feel successful if we can get you to leave this chapter convinced that understanding the data that you can gather about your users will make your design and therefore your business better.
The Power of Digital Interfaces
It might feel like using data is big news now, but the truth is that we’ve been using data for a long time already. For the past 20 years, we’ve been moving and replicating more and more experiences that we used to have in the physical world into the digital world. Sharing photos, having conversations, duties that we used to perform in our daily work have all become digital. We could probably have a separate discussion as to how much the migration from the physical “real” world to the digital world has benefitted or been
1
www.it-ebooks.info
O’Reilly Media, Inc. 2/26/2015
detrimental to our society, but you can’t deny that it’s happening and only continues to accelerate at a breakneck pace.
Let’s take a look at what it means for these experiences to be moving from the physical to the digital. Not too long ago, the primary way that you shared photos with someone was that you would have to have used your camera to take a photo at an event. When your roll was done, you’d take that film to the local store where you would drop it off for processing. A few days or a week later you would need to pick up your developed photos and that would be the first time you’d be able to evaluate how well the photos that you took many days prior actually turned out. Then, maybe when someone was at your house, you’d pull out those photos and narrate what each photo was about. If you were going to really share those photos with someone else, you’d maybe order duplicates and then put them in an envelope to mail to them – and a few days later, your friend would get your photos as well. If you were working at a company like Kodak that had a vested interest in getting people to use your film, processing paper or cameras more, then there are so many steps and parts of the experience that I just described which are completely out of your control. You also have almost no way to collect insight into your customer’s behaviors and actions along the process.
Now let’s take the same example of sharing a photo in the digital world. Your user will take out their phone and take a photo. They may open up your Instagram, apply some filters to the photo and edit it on the spot before adding a caption and then sharing it. They might also choose to share it on different channels, like Twitter or via email. The entire experience of sharing a photo has been collapsed and condensed into one uninterrupted flow and a single screen, one that you can hold in the palm of your hand. And because all of this is digital, data is continuously being collected along the way. You have access to all kinds of information that you wouldn’t have had before. Location, time spent in each step, which filters were tried but not used, what was written about the photo and to whom the photo was sent. You can also gather consumption data on the photo, how many people viewed it or liked it? Not only are you able to gather that information on just one user, but you can gather it for each and every single user. And that data is both precise as well as dynamic – so you could get an instant understanding of how your customers behaviours and interactions might be changing and evolving with respect to your product and in reaction to changes you make to your product.
All this data can be really powerful, and BECAUSE digital interfaces have made data collection so easy we have to make sure that we don’t fool ourselves into thinking that data interpretation is easier than it actually is. There is a danger that the ease in gathering data also makes it easer to make bigger mistakes with that data. It becomes our responsibility to make sure we use that data responsibly. That we are clear and careful about how we use data. We are just seeing the beginning of this time where data at scale is just as accessible to small startups as it is to well established large companies and the future holds so much promise for what designers will be able to do with access to all this information.
2
www.it-ebooks.info
O’Reilly Media, Inc. 2/26/2015
Commoditization of data
We are seeing that data is quickly becoming commoditized with companies and services springing up to help you with your data. There are so many tools and services available now that can really help you gather data about your customers that there is almost no excuse to not be leveraging data more in your design and product development cycle. We’re seeing this commoditization of data happening in all aspects,
Companies like usertesting.com and others are making it easier to get qualitative data even if you don’t have dedicated user research facilities, in fact you could argue that services like this can be stronger than traditional labs because the virtual nature of the service allows you to gather feedback from customers around the world. Optimizely, and other companies are making quantitative data collection easier by allowing companies to run quick and easy AB tests on their websites as well. We see data boot camps springing up … and there are also companies where you can outsource your data analysis to as well so that you don’t need to bear the expense of hiring and keeping data analysts on staff.
Finally we see more and more places where there are new data degrees emerging.
Quantitative data at scale
We thought it would be fun to include a little bit of history in this chapter, that by taking a step back, way back, it might help to give our readers some perspective into how the smart use of data has been something we have been doing for a very long time. As designers, we pride ourselves on being excellent at solving problems, seeing how others have used data to illuminate and solve the problems they face in other industries can be quite enlightening.
The 15th century marked the beginning of the Age of Discovery, when Europeans embarked on expeditions to explore the world. However, on especially long trips where they could not store fruits and vegetables, scurvy – a serious disease, was a significant problem. In May 1747, aboard the British Navy ship HMS Salisbury, naval surgeon James Lind conducted an experiment to identify a cure for scurvy. He chose six pairs of seamen suffering from the disease and gave a different “remedy” to each pair, in addition to their normal rations. Five of these pairs of sailors showed no significant improvement, but one pair, who had been prescribed oranges and lemons, quickly showed signs of recovering from the disease.
“On the 20th of May, 1747, I took twelve patients in the scurvy, on board the Salisbury at sea. Their cases were as similar as I could have them. They all in general had putrid gums, the spots and lassitude, with weakness of the knees. They lay together in one place, being a proper apartment for the sick in the fore-hold and had one diet common to all … two of these were ordered each a quarter of cyder a day. Two others took twenty-five gutts of elixir vitriol three times a day… Two others took two spoonfuls of vinegar three times a day …Two of the worst patients, were put under a course of sea-water. Two others
3
www.it-ebooks.info
O’Reilly Media, Inc. 2/26/2015
4
each had two oranges and one lemon given them every day. The consequence was, that the most sudden and visible good effects were perceived from the use of the oranges and lemons.”1
By this simple experiment, Lind managed to demonstrate that oranges and lemons were a more effective cure for scurvy than any of the other known remedies. Eventually, the Navy started giving citrus fruit to all sailors on long voyages, to protect against the disease.
In another historical example, Dr. John Snow was working with the Reverend Henry Whitehead in the midst of the 19th century cholera outbreak in London. As described by Steven Johnson in his book “The Ghost Map”, the two men worked together to take a truly multidisciplinary approach. John Snow’s scientific understanding behind the transmission of the disease was powerfully coupled with Rev. Henry Whitehead’s human understanding of the local community and their behaviors to help uncover the source and ultimately stop the spread of the disease.
The link between British scientists and how we use data in design today might not seem immediately obvious, but Lind is credited with not only conducting the first ever clinical trial, but the first controlled experiment on multiple groups, where all factors remained the same aside from a single variable. As for Dr. Snow and Rev. Whitehead, you can see here how qualitative data was gathered and used to both provide more insight into uncovering what was going on in the communities and how that qualitative data collected at scale was able to bring insight and clarity to a phenomenon that was initially confounding.
The history of the modern “data scientist” is much more recent.2 It was in the 1960s that statisticians like John Tukey started to think more about what it was to bring a scientific approach to data analysis. In the 1970s we see these analysts start to recognize that the power they can bring to the data is to fill it with insight and more information. As we jump ahead to today, there is no question that data science is a term which now captures all the work that is done to both capture, measure and to interpret the vast amount of data that represents our users on a daily basis.
We now take it for granted that in medicine, new treatments will be fully researched and rigorously evaluated against other options, before being adopted. We expect the same level of rigour in the design and engineering of safety-critical systems like aircraft, automobiles or nuclear power stations. But in the design of consumer-facing and recreational software and web sites, where human lives are rarely at stake, the pursuit of the best possible designs through a similar approach of testing various options using a scientifically structured methodology is a relatively new phenomenon. Based on the sheer volume of articles, publications, talks that we see generated about data and business, data and technology, data and marketing… it’s clear that data is a very hot topic and the currency of the day. What we want to do with this book is to take the term “data science” and expand it even further to move beyond the realm of people who consider themselves statisticians and to something that designers will start to embrace as part of their skillset as well.
1 http://www.ncbi.nlm.nih.gov/pmc/articles/PMC1081662/pdf/medhist00113‐0029.pdf 2 http://www.forbes.com/sites/gilpress/2013/05/28/a-very-short-history-of-data-science/
www.it-ebooks.info
O’Reilly Media, Inc. 2/26/2015
5
Data roles
As you start to incorporate the usage of data in your day to day, you’ll find that in addition to navigating the data itself, you’ll also need to navigate the various people who work with data in different ways. In some cases there might be just one person who represents each of the roles we describe, in other cases there might be an entire team based around a particular role and in some cases you will find one person might play multiple roles. We break these roles up into two key groups; those that help to create and capture the data (producers) and those who use the data and information generated from it in their work (consumers).
Data can be generated in so many ways –through tracking of user behaviors in your product, or through interviews with customers or by soliciting user feedback through surveys. The people we often find associated with the generative side of data are; data analysts, data scientists, user researchers, designers and marketers.
Data analysts and scientists3 should be involved throughout the lifecycle of a product. They help to take the mass of data that is collected from a product and then help to clean, interpret, transform, model and validate that data. All of this work is done with the intent of helping the business to make better decisions. Data analysts and scientists often bring insight which can help the business predict where it needs to go, but they can also help to analyze the resulting data from a business decision to understand if the business accomplished what it set out to do. Common background for data analysts and scientists will include statistics, information management , technology and business intelligence.
User researchers4 are complimentary to data analysts and scientists and in some cases will overlap with them in terms of skills and interests – especially as user researchers start to do more of their work on a bigger and bigger scale. Typically user researchers are championing the user by seeking to understand who your users are and what they want. They are interested in both attitudinal and behavioral information about your users. They will tend to do this by focusing on qualitative information gathering via interviews, surveys, diary studies and other forms of ethnographic research. Common backgrounds for people involved in user research might include psychology, cognitive science, as well as the standard backgrounds that you often find for designers.
Designers, as we’ve been insisting throughout this book need to also be concerned with the generation of data. It’s not new for designers to seek information about our users or to gather information about our designs as we evaluate them. In some companies that don’t have the room for dedicated user researchers or analysts the designer will have to step into those roles occasionally to get the information that they need to generate their
3 http://shop.oreilly.com/product/0636920028529.do 4http://www.fastcodesign.com/3032719/ui-ux-who-does-what-a-designers-guide-to-the-tech-industry
www.it-ebooks.info
O’Reilly Media, Inc. 2/26/2015
designs. Designers can also play a key role in the generation of data based on what they design and choose to prototype. Designers can just as easily come from a tech or art background. Human factors or HCI are also fairly common as well.
Marketers can also be great collaborators in terms of data generation and too often we find that a weak tie between product and marketing means that a lot of valuable information which could be shared by both teams can get lost. Marketers are often seeking to understand the target audience, the market size of that audience and as a result often generate a lot of data around customers. Many people in marketing will have a strong business background.
On the consumption side of data roles, we find people who are actively taking the insights generated from the data to help them make decisions about how to push the business forward. In this bucket, we typically find; business managers, product managers and, of course, designers.
Business managers and product managers look to data to get stronger insights into how the business is performing. Business metrics (which we cover in more depth in Chapter 2) are monitored and used to provide a health check on how the business is performing. They also look for impact of business decisions and to see if the changes that are being done in the product are performing as expected.
Designers should not only be caring about the business metrics, but also thinking about any additional metrics with respect to usability or the user interface. Of course designers should also be actively involved in understanding the data that comes back from user researchers or analysts on their own design throughout the product development cycle. The key for designers is to interpret these results and understanding them within the context of the larger business.
User researchers and analysts should also be consumers of each others data. Looking to see how a broader understanding of the data that is being collected on their product can provide clarity into why they might be seeing locally in their own data.
These roles do not have strict boundaries or definitions. However, as you might find yourself playing into either a consumer or producer of data it can be helpful to understand which side of this divide it is that you are fitting into at that specific point in time.
Our use of terminology in this book
Terms like “big data” and “design thinking” are in fairly common use now as is the distinction between “data driven” and “data informed” design. However, we’d still like to take the opportunity to define these terms and a handful of others that we’ll be relying on pretty heavily throughout the book. The terms we define in this chapter are especially important as they represent some of the key philosophical foundation of what you will find in the book.
6
www.it-ebooks.info
O’Reilly Media, Inc. 2/26/2015
7
Big data5 - it seems that finding a formal definition of “big data” can be quite difficult. The term first emerged in 2007 and has generally come be used to describe very large data sets (structured and unstructured) which can has the potential to be analyzed and mined for information.
Design thinking – also a very common term which is used to describe a process for creating new ideas and solving problems. The term was popularized by Tim Brown6 and the folks at IDEO to describe a process where innovation comes from direct observation of users and relies on creating strong empathy for them. What we hope to do in this book is to not only show how all kinds of data fits nicely into the construct of design thinking, but how design thinking as a practice can also be applied to the data itself.
The design council in the UK introduced the notion of the “double diamond”7 design process model in 2005. The phases of this model are as follows:
Phase 1: Discovery – where activities like market research, user research help to identify the user needs. Much of what we discuss in this book is leveraged at this stage of the design process.
Phase 2: Definition – in this stage you are aligning the user needs to the business. It’s for this stage that its especially important to understand what your business objectives are and which metrics will help you and your team align to them best. We cover this in more detail in Chapter 2.
Phase 3: Development – the design solutions are developed and iterated on at this stage of the process and it’s in this phase that the designer should be thinking proactively about the kind of data that they will need to capture to best understand the effectiveness of their work.
Phase 4: Delivery – this represents the time where the product is finalized and launched. At this stage we think it’s most important for the designer to be able to close the loop and determine the effectiveness of what they have done. Understanding the resulting data from their design and how it provides insight into which next steps they should or shouldn’t take are the key things at this stage.
Quantitative and qualitative data at scale – for the purposes of this book we really focus on gathering either qualitative or quantitative data at scale. For us what that means is looking to getting enough information that it can be interpreted at a level that gives you the confidence that whatever you interpret as a result from that data will scale. That the
5 http://www.forbes.com/sites/gilpress/2014/09/03/12-big-data-definitions-whats-yours/ 6 https://hbr.org/2008/06/design-thinking 7 http://www.designcouncil.org.uk/sites/default/files/asset/document/ElevenLessons_Design_Council%20%282%29.pdf
www.it-ebooks.info
O’Reilly Media, Inc. 2/26/2015
8
data you are gathering and interpreting is statistically significant. We’ll talk more about the details around making sure that your data is sound in Chapter 3.
Data vs. Design vs. designer vs. designing – it may seem obvious, but we do want to call out that the design that is produced by a designer is a tool (in the same way that we are advocating for the fact that ‘data’ is also a tool) that is used to help the designer craft a solution for their users. The act of designing is something that we want to redefine as a process that not only speaks to the work of crafting a design, but also taking into account and incorporating data.
Data driven vs. Data Informed vs. Data Aware
Before proceeding we’d like to spell out some differences we have perceived in how data and design have been positioned in the industry. The three terms are “data driven”, “data informed” and one we have coined, “data aware”. You are probably already somewhat familiar with the debate between “data driven” and “data informed” and you are also probably aware of the different views that surround those terms as well as the potential pitfalls of taking too binary approach to data.
One of the best descriptions that we’ve ever seen on the difference between data-driven and data-informed comes by way of Andrew Chen. In a well referenced post entitled “Know the difference between data-informed and data-driven” 8, he explains that “[…]the difference […] in my mind, is that you weigh the data as one piece of a messy problem you’re solving with thousands of constantly changing variables. While data is concrete, it is often systematically biased. It’s also not the right tool, because not everything is an optimization problem. And delegating your decision-making to only what you can measure right now often de-prioritizes more important macro aspects of the problem.”
The words “not everything is an optimization problem” sum up the philosophy behind this book. Our intent is to broaden the definition of “data” from being an overly strong association with AB test results to acknowledging that what companies need and should gather are multiple forms of data gathered from many different sources. In reality, many companies are already collecting all kinds of data on their customer’s behaviors: business analytics, trace log data, user experience lab-based data, interview data, customer feedback data, NPS and other industry standard data formats, call center data around issues and complaints. However one of the things we are concerned with in this book is that AB testing at scale has captured the imagination as THE tool to use even when not systematically conducted because of the enticement of large numbers …and the obsession in or industry with ‘scale’ as if large numbers can’t be wrong. We want to acknowledge that the intersection of data and design can be so much more than AB testing and to recognize that it can be equal parts art and science.
• Data driven design implies that the data that are collected are what drives design decisions. In some instances, this is the right way forward. We will give examples through the book where data are gathered and directly effect the
8 http://andrewchen.co/2012/05/29/know-the-difference-between-data-informed-and-versus-data-driven/
www.it-ebooks.info
O’Reilly Media, Inc. 2/26/2015
design decision that was made next. The data is used to answer a specific question and the results are unequivocal.
• In some instances however, things are more nuanced and the data might suggest an answer but it is not cut and dried. This is what we call data-informed design, where a team decides to take the data gathered with a pinch of salt, and perhaps set up another iteration of investigation. This is when more research may need to be done, different kinds of data gathered, and/or an informed creative leap is taken. We will give examples of this kind of situation in the book too.
• Finally, we use the term “data aware” design to underscore the fact that the design process is a creative one, where design decisions need to be taken not just from data but back to data – that how a system is instrumented, that what data types are being captured and how they are combined is itself a design problem. So, designers and data scientists need to work with developers and business strategists to actively design systems so that the right data types forms are collected to address the right questions. Designers always need to be designing their hypotheses and the data they would like to see collected to test their assumptions.
In this book, we want to encourage you to inform your design decisions by specific, objective evidence; data. Data comes in many forms, and it is collected in a number of different ways, and it should be used to give teams a better understanding of what customers are doing with a product. We want to acknowledge that data is not information until it is effectively managed and analyzed and it is not knowledge until it is put into the business and decision making context. Using data in our decision making entails that we reflect on the quality of the data, on what data is right for the decision making setting – that we critically engage with question relevance (as we asking the right questions?), data appropriateness (does it answer our questions) and data quality (is the data reliable? Did we lose something in data collection/curation?). It also requires we ask: would different data and/or a different analysis be more appropriate? Are we doing what is convenient rather than what is right?
Being smart about data in your decision making has considerable advantages. Having common success metrics within your company can also help designers and the broader product team to align around common goals and to understand what kind of data is the most important to track and follow. So more specifically, for our purposes, we hope to present a framework that you can use as a designer to help you hone your understanding of customer behavior, align you and your team to the larger company objectives and business goals.
Personal Stories
We thought it would be useful to share a personal story from each of us, to help share with you why we are so passionate about this topic. Each of us has seen how leveraging data smartly in the product development cycle has made an impact on our ability to react to our customers and make smart decisions.
9
www.it-ebooks.info
O’Reilly Media, Inc. 2/26/2015
A note on “Why I love data” from Rochelle
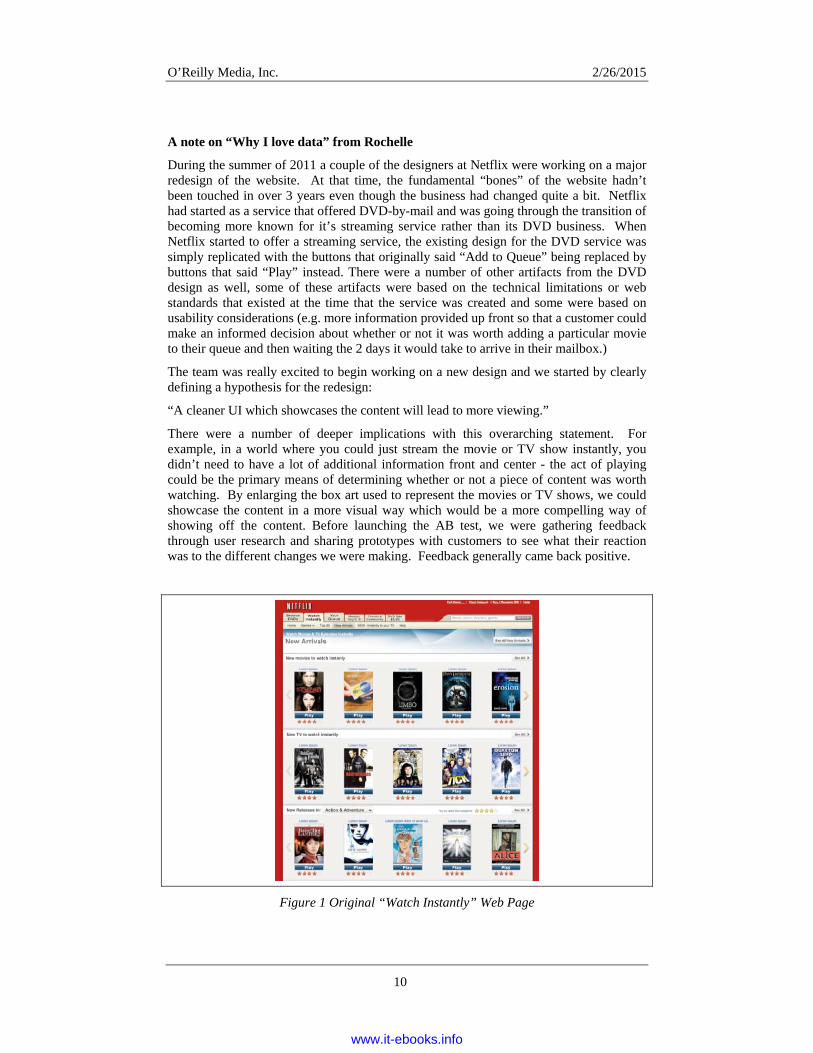
During the summer of 2011 a couple of the designers at Netflix were working on a major redesign of the website. At that time, the fundamental “bones” of the website hadn’t been touched in over 3 years even though the business had changed quite a bit. Netflix had started as a service that offered DVD-by-mail and was going through the transition of becoming more known for it’s streaming service rather than its DVD business. When Netflix started to offer a streaming service, the existing design for the DVD service was simply replicated with the buttons that originally said “Add to Queue” being replaced by buttons that said “Play” instead. There were a number of other artifacts from the DVD design as well, some of these artifacts were based on the technical limitations or web standards that existed at the time that the service was created and some were based on usability considerations (e.g. more information provided up front so that a customer could make an informed decision about whether or not it was worth adding a particular movie to their queue and then waiting the 2 days it would take to arrive in their mailbox.)
The team was really excited to begin working on a new design and we started by clearly defining a hypothesis for the redesign:
“A cleaner UI which showcases the content will lead to more viewing.”
There were a number of deeper implications with this overarching statement. For example, in a world where you could just stream the movie or TV show instantly, you didn’t need to have a lot of additional information front and center - the act of playing could be the primary means of determining whether or not a piece of content was worth watching. By enlarging the box art used to represent the movies or TV shows, we could showcase the content in a more visual way which would be a more compelling way of showing off the content. Before launching the AB test, we were gathering feedback through user research and sharing prototypes with customers to see what their reaction was to the different changes we were making. Feedback generally came back positive.
Figure 1 Original “Watch Instantly” Web Page
10
www.it-ebooks.info
O’Reilly Media, Inc. 2/26/2015
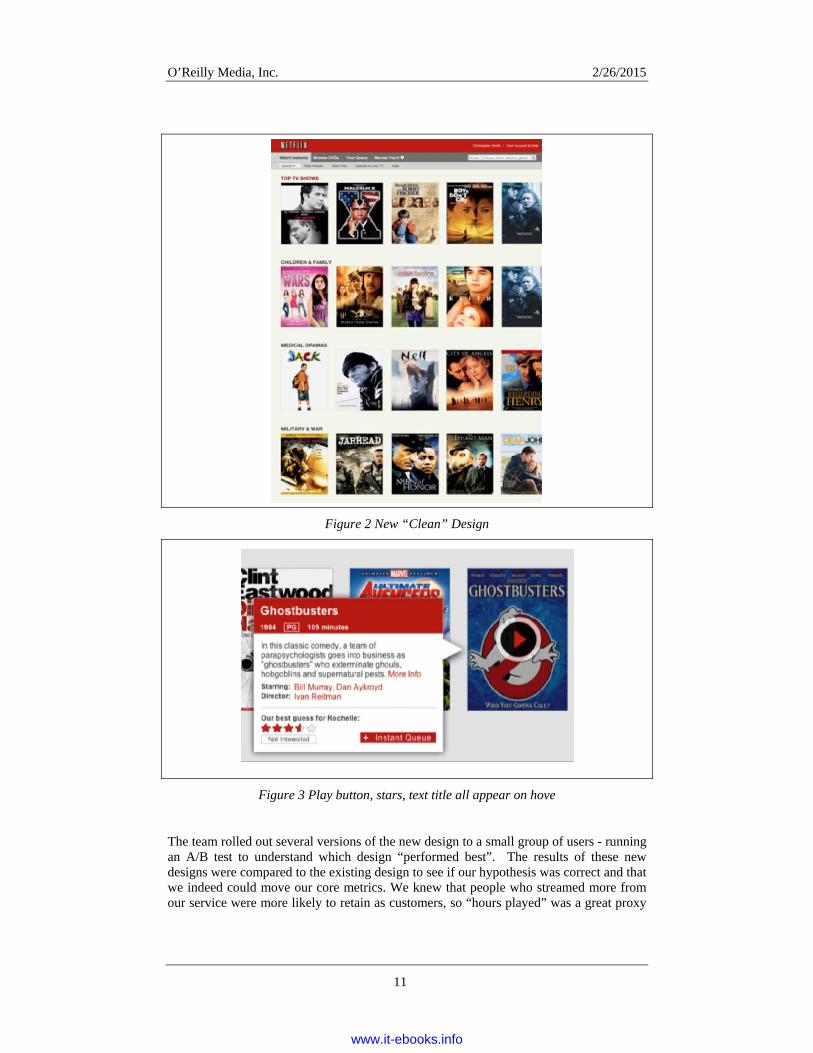
Figure 2 New “Clean” Design
Figure 3 Play button, stars, text title all appear on hove
The team rolled out several versions of the new design to a small group of users - running an A/B test to understand which design “performed best”. The results of these new designs were compared to the existing design to see if our hypothesis was correct and that we indeed could move our core metrics. We knew that people who streamed more from our service were more likely to retain as customers, so “hours played” was a great proxy
11
www.it-ebooks.info
O’Reilly Media, Inc. 2/26/2015
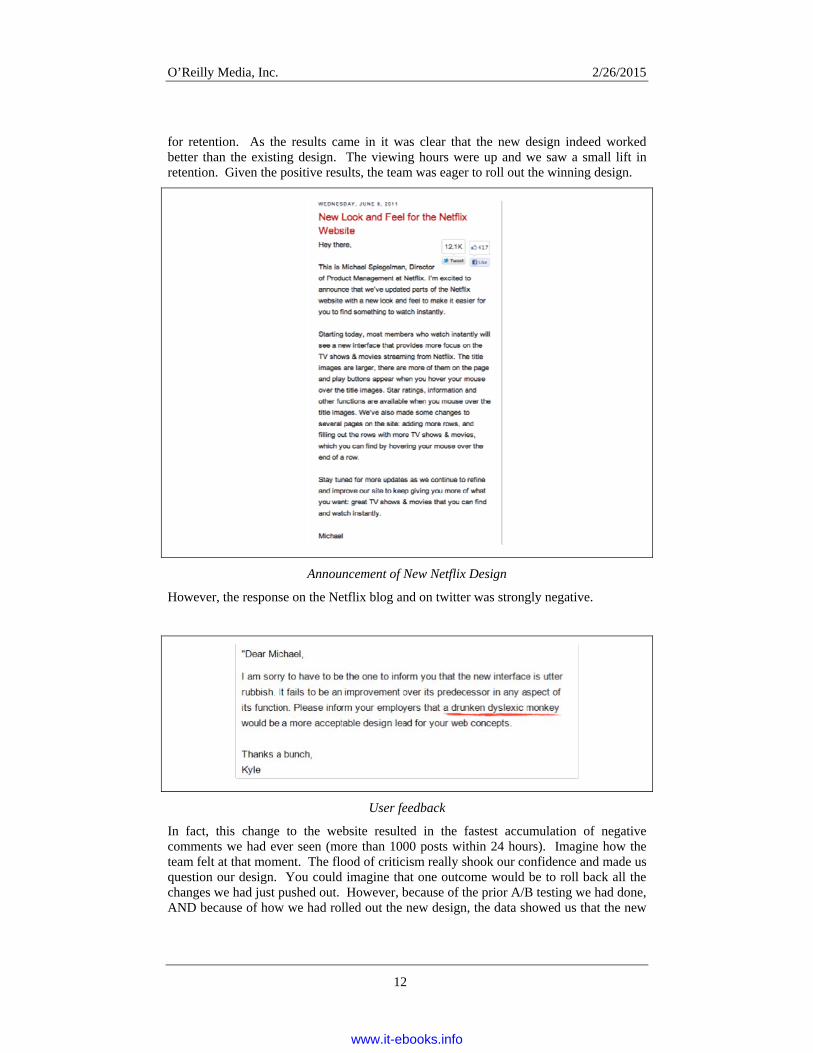
for retention. As the results came in it was clear that the new design indeed worked better than the existing design. The viewing hours were up and we saw a small lift in retention. Given the positive results, the team was eager to roll out the winning design.
Announcement of New Netflix Design
However, the response on the Netflix blog and on twitter was strongly negative.
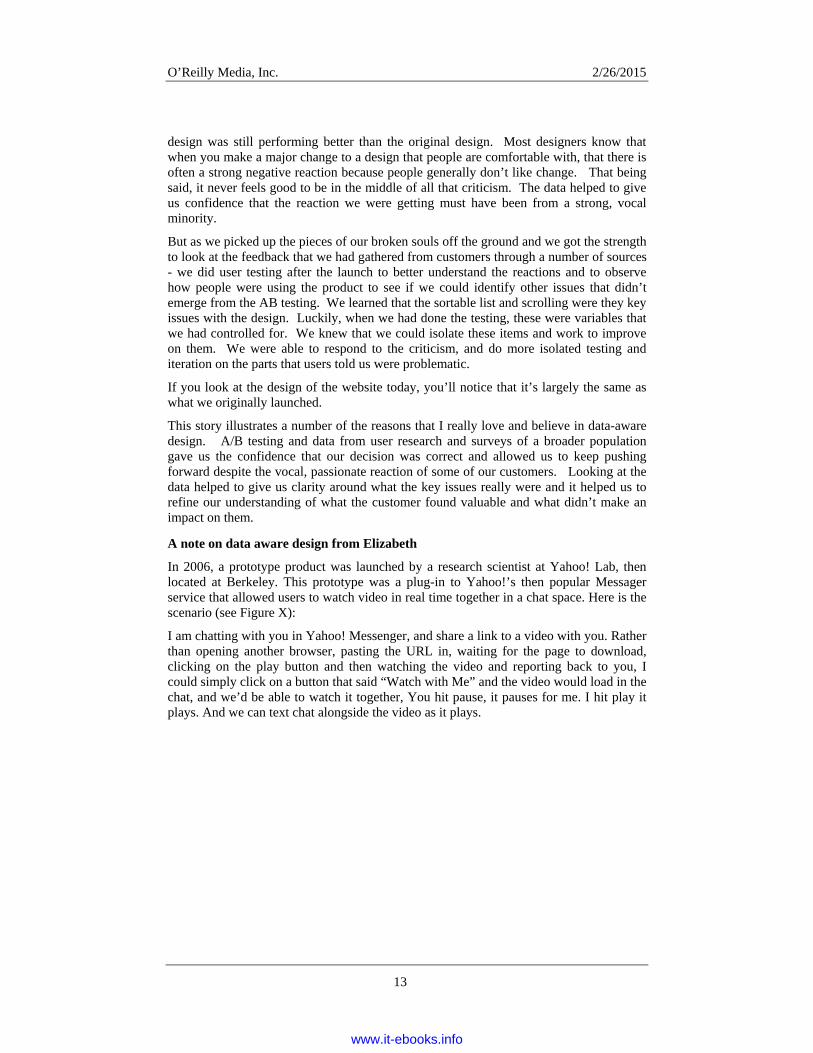
User feedback
In fact, this change to the website resulted in the fastest accumulation of negative comments we had ever seen (more than 1000 posts within 24 hours). Imagine how the team felt at that moment. The flood of criticism really shook our confidence and made us question our design. You could imagine that one outcome would be to roll back all the changes we had just pushed out. However, because of the prior A/B testing we had done, AND because of how we had rolled out the new design, the data showed us that the new
12
www.it-ebooks.info
O’Reilly Media, Inc. 2/26/2015
design was still performing better than the original design. Most designers know that when you make a major change to a design that people are comfortable with, that there is often a strong negative reaction because people generally don’t like change. That being said, it never feels good to be in the middle of all that criticism. The data helped to give us confidence that the reaction we were getting must have been from a strong, vocal minority.
But as we picked up the pieces of our broken souls off the ground and we got the strength to look at the feedback that we had gathered from customers through a number of sources - we did user testing after the launch to better understand the reactions and to observe how people were using the product to see if we could identify other issues that didn’t emerge from the AB testing. We learned that the sortable list and scrolling were they key issues with the design. Luckily, when we had done the testing, these were variables that we had controlled for. We knew that we could isolate these items and work to improve on them. We were able to respond to the criticism, and do more isolated testing and iteration on the parts that users told us were problematic.
If you look at the design of the website today, you’ll notice that it’s largely the same as what we originally launched.
This story illustrates a number of the reasons that I really love and believe in data-aware design. A/B testing and data from user research and surveys of a broader population gave us the confidence that our decision was correct and allowed us to keep pushing forward despite the vocal, passionate reaction of some of our customers. Looking at the data helped to give us clarity around what the key issues really were and it helped us to refine our understanding of what the customer found valuable and what didn’t make an impact on them.
A note on data aware design from Elizabeth
In 2006, a prototype product was launched by a research scientist at Yahoo! Lab, then located at Berkeley. This prototype was a plug-in to Yahoo!’s then popular Messager service that allowed users to watch video in real time together in a chat space. Here is the scenario (see Figure X):
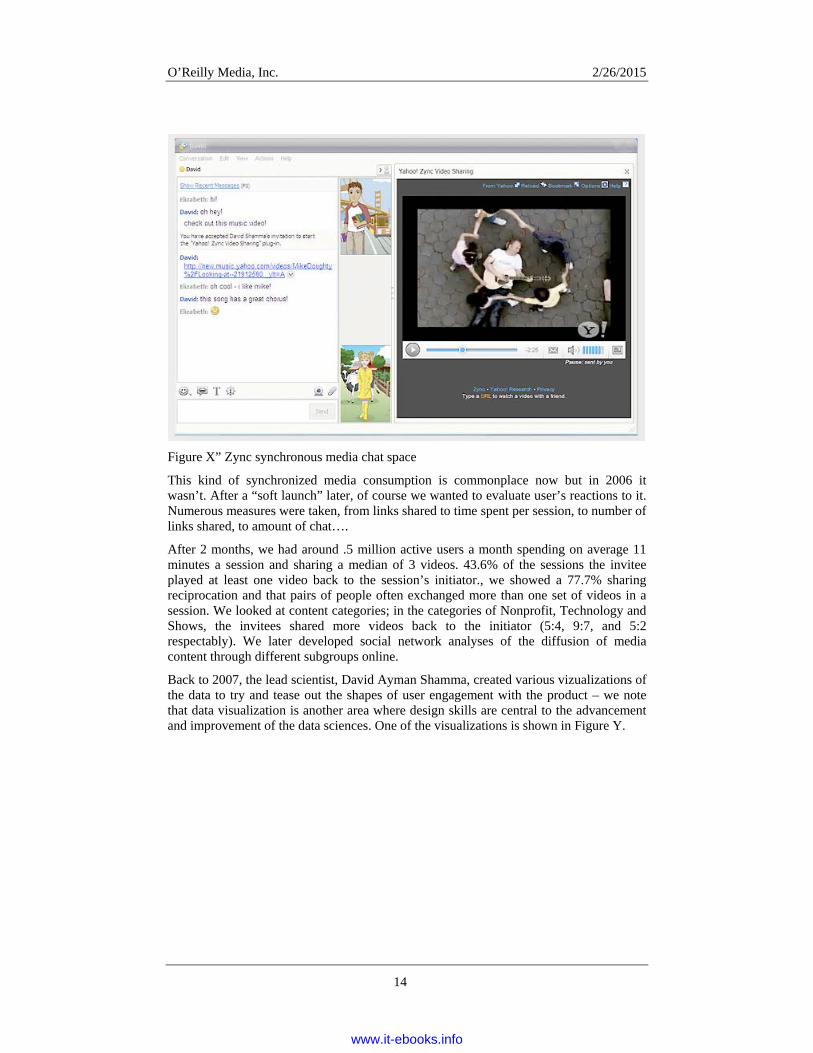
I am chatting with you in Yahoo! Messenger, and share a link to a video with you. Rather than opening another browser, pasting the URL in, waiting for the page to download, clicking on the play button and then watching the video and reporting back to you, I could simply click on a button that said “Watch with Me” and the video would load in the chat, and we’d be able to watch it together, You hit pause, it pauses for me. I hit play it plays. And we can text chat alongside the video as it plays.
13
www.it-ebooks.info
O’Reilly Media, Inc. 2/26/2015
Figure X” Zync synchronous media chat space
This kind of synchronized media consumption is commonplace now but in 2006 it wasn’t. After a “soft launch” later, of course we wanted to evaluate user’s reactions to it. Numerous measures were taken, from links shared to time spent per session, to number of links shared, to amount of chat….
After 2 months, we had around .5 million active users a month spending on average 11 minutes a session and sharing a median of 3 videos. 43.6% of the sessions the invitee played at least one video back to the session’s initiator., we showed a 77.7% sharing reciprocation and that pairs of people often exchanged more than one set of videos in a session. We looked at content categories; in the categories of Nonprofit, Technology and Shows, the invitees shared more videos back to the initiator (5:4, 9:7, and 5:2 respectably). We later developed social network analyses of the diffusion of media content through different subgroups online.
Back to 2007, the lead scientist, David Ayman Shamma, created various vizualizations of the data to try and tease out the shapes of user engagement with the product – we note that data visualization is another area where design skills are central to the advancement and improvement of the data sciences. One of the visualizations is shown in Figure Y.
14
www.it-ebooks.info
O’Reilly Media, Inc. 2/26/2015
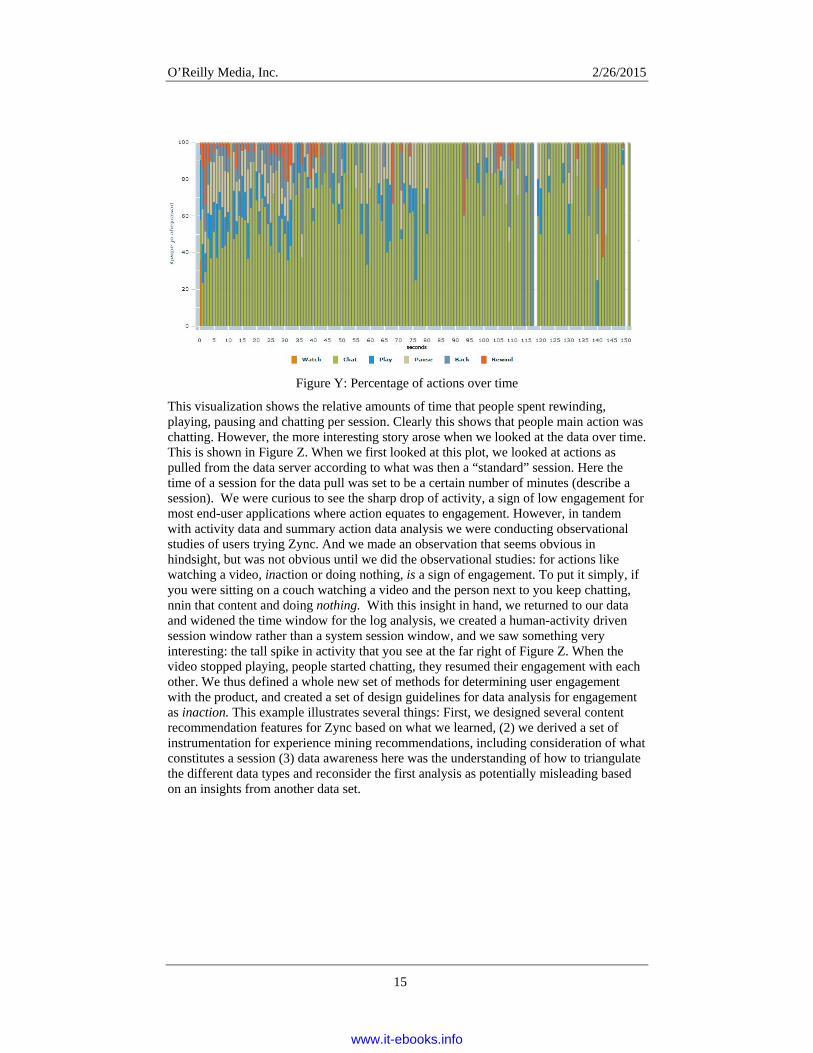
Figure Y: Percentage of actions over time
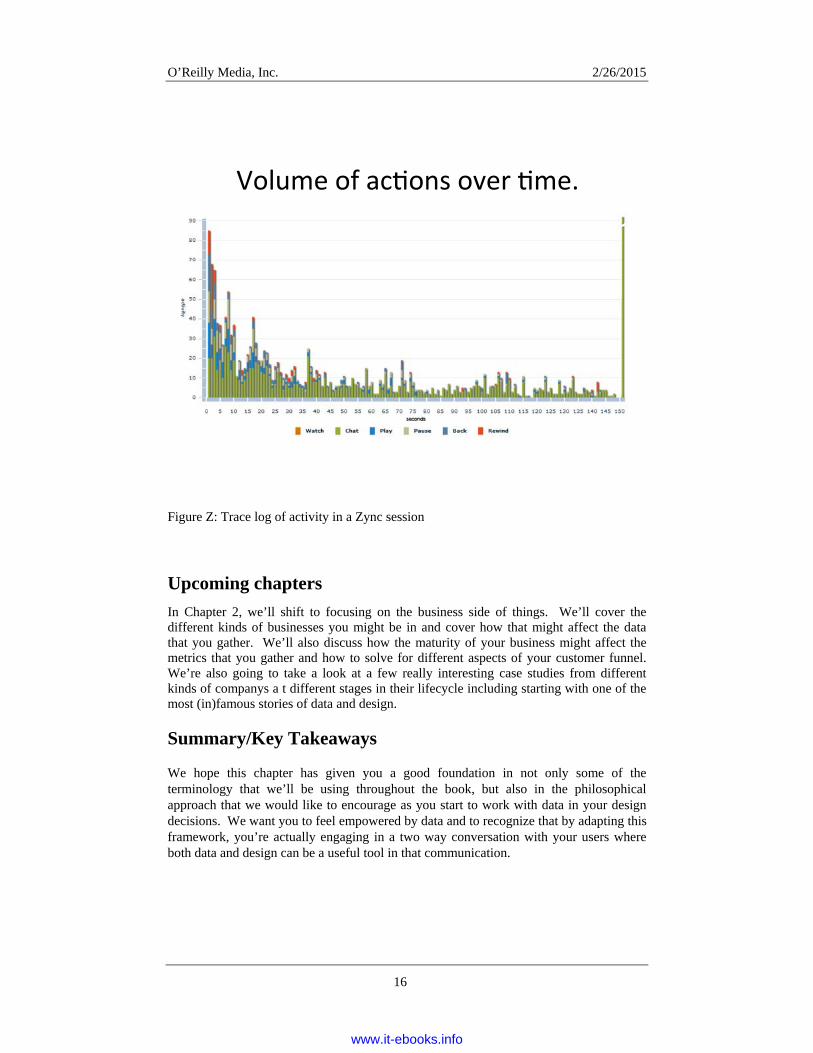
This visualization shows the relative amounts of time that people spent rewinding, playing, pausing and chatting per session. Clearly this shows that people main action was chatting. However, the more interesting story arose when we looked at the data over time. This is shown in Figure Z. When we first looked at this plot, we looked at actions as pulled from the data server according to what was then a “standard” session. Here the time of a session for the data pull was set to be a certain number of minutes (describe a session). We were curious to see the sharp drop of activity, a sign of low engagement for most end-user applications where action equates to engagement. However, in tandem with activity data and summary action data analysis we were conducting observational studies of users trying Zync. And we made an observation that seems obvious in hindsight, but was not obvious until we did the observational studies: for actions like watching a video, inaction or doing nothing, is a sign of engagement. To put it simply, if you were sitting on a couch watching a video and the person next to you keep chatting, nnin that content and doing nothing. With this insight in hand, we returned to our data and widened the time window for the log analysis, we created a human-activity driven session window rather than a system session window, and we saw something very interesting: the tall spike in activity that you see at the far right of Figure Z. When the video stopped playing, people started chatting, they resumed their engagement with each other. We thus defined a whole new set of methods for determining user engagement with the product, and created a set of design guidelines for data analysis for engagement as inaction. This example illustrates several things: First, we designed several content recommendation features for Zync based on what we learned, (2) we derived a set of instrumentation for experience mining recommendations, including consideration of what constitutes a session (3) data awareness here was the understanding of how to triangulate the different data types and reconsider the first analysis as potentially misleading based on an insights from another data set.
15
www.it-ebooks.info
O’Reilly Media, Inc. 2/26/2015
Figure Z: Trace log of activity in a Zync session
Upcoming chapters In Chapter 2, we’ll shift to focusing on the business side of things. We’ll cover the different kinds of businesses you might be in and cover how that might affect the data that you gather. We’ll also discuss how the maturity of your business might affect the metrics that you gather and how to solve for different aspects of your customer funnel. We’re also going to take a look at a few really interesting case studies from different kinds of companys a t different stages in their lifecycle including starting with one of the most (in)famous stories of data and design.
Summary/Key Takeaways
We hope this chapter has given you a good foundation in not only some of the terminology that we’ll be using throughout the book, but also in the philosophical approach that we would like to encourage as you start to work with data in your design decisions. We want you to feel empowered by data and to recognize that by adapting this framework, you’re actually engaging in a two way conversation with your users where both data and design can be a useful tool in that communication.
16
www.it-ebooks.info
O’Reilly Media, Inc. 2/26/2015
17
• The history of using data to bring insight and information which facilitates problem solving is long, we can learn a lot by looking at how other industries have used data.
• Though incorporation of data into design is relatively recent, we believe this is the beginning of an exciting and long era to come.
• As a designer, you will play both the role of a producer and a consumer of data.
• There isn’t a “one size fits all” approach to data and design, and understanding the nuances of data driven vs. data aware vs data informed can be a powerful tool in design.
Fundamentally, the difference between data-aware and instinct driven design comes down to what you rely on to inform your design decisions. With data-aware design, data is a creative production and is the primary decision making tool when and only when the data have been themselves well designed and have been proven to be what we call fit for purpose; with instinct- or experience-driven design, decision-making is more experimental. Both paths can lead to great design. Is one way right? Absolutely not. Are these methods mutually-exclusive? No. For us, the “right” approach to design will vary depending on the nature of the problem you are trying to solve, how you operate best and will almost always requires a balance between leveraging experience, instinct and data. You need to have great instinct and experience to be a great designer regardless. Data can be one more (great) tool that you can add to that toolkit.
Questions to ask yourself
We thought it would be helpful to include a section on “Questions to ask yourself’ at the end of each chapter. These questions are included as a way to spark some conversation either with yourself or within your company.
• How is your company currently using data?
• What kinds of data does your company use?
• Who is currently producing and consuming data in your company?
• Are there data “gaps”?
• How could you close those gaps?
• What kinds of questions would you like to answer about your users?
Additional resources Content
www.it-ebooks.info
O’Reilly Media, Inc. 6/15/2015
Chapter 2 Business Matters
Introduction Smart data practices are key when it comes to having a strategic impact in any business.
If you have a great user experience, then you have the foundation of a great business. User centered design and activity data analytics are both focused on working out whether your idea of a successful, rewarding and repeat-worthy experience aligns with the views of your intended or current customer base. In a monopoly environment, a business can offer unsatisfying service and still seem apparently successful. Thankfully, today’s competitive landscape means the company that provides a better service will win.
Data capture, management and analysis is the best way to bridge between design, user experience and business relevance. A data aware approach to design is a good foundation for cross-functional collaboration within your business, whether large, medium or small. It’s also an excellent way to have impact upon and create alignment between design and business goals, focusing on the critical part of any business: providing the best possible service to your customers and clients, understanding their goals and concerns, and addressing their frustrations. A user centered design practice centralizes empathy and customer understanding, and as such, is best positioned to also work to define and design the right measures that accurately reflect the customer experience.
Being user focused and data aware means you and the people you work with should also be actively contributing to the creation of meaningful business goals that are focused on the greatest asset of any business: users, clients and customers.
Our bottom line: don’t just design the user experience, sketch out what data you will need that will help you test your design. Design the data capture, analysis and questions as part of your design process. Be clear about the data that will best help you measure and articulate the effect of your design on your customers and then through that to the business.
In this chapter we will give you one take, based on our experiences of how data in combination with design can impact business.
1
www.it-ebooks.info
O’Reilly Media, Inc. 6/15/2015
Thinking about your business As you can imagine, the kind of business you’re in will influence how you measure the health of your business. Business “health” is an extremely complex concept, that includes myriad different measures, that roll up into a “bottom line” that defines whether the business is viable or not. Such measures include engineering analytics (service delivery and robustness metrics), business analytics (which in the end is about balancing profit and loss), markets and competitiveness, and so on. Ultimately though, whether you are focused on one audience or many, the dynamic quality of the market today means our focus, what customers – “users” – do, is key.
We kick off this chapter by first asking you to take a step back and to reflect on the fundamentals of your business. We ask three questions in this section:
1) What kind of business are you?
2) What is your revenue model?
3) How mature is your business?
Your answers to these questions will determine the kind of data that you will want to collect.
What kind of business are you in?
The data you collect, the measures you define and the metrics you track will, to some extent, depend on the industry or space that you operate within. Though not a comprehensive list of business types, the following are some of the most common.
• Transactional – Companies are on selling goods to customers or creating a marketplace. Well-known examples are Amazon, eBay and Zappos.com.
• User Generated Content (UGC) – User generated content sites often, but not always, use social networks for content distribution. UGC sites rely on their users to create content that is stored, disseminated, annotated and mined by the service. That content might take many different forms whether it’s video, blogs, audio files, images, commentary, and so on. The best known examples here are Twitter, Facebook, YouTube, Vimeo, Instagram and Flickr.
• Media Sites – Companies that provide access to curated media, such as news, music and video. Examples here are Hulu, Spotify and the NY Times.com.
• Software as a Service (SAAS) – Companies that provide a service or software for their customers, hosted by the company. Examples here include Salesforce.com, Intuit, Squarespace and Zendesk.
Once you have decided what kind of business you are in, looking at what competitors and others in your industry value will also provide you with important clues as to what might be of greatest value and thus what to focus on.
What is your revenue model?
The next question to ask yourself is about your revenue model. What is the primary source of revenue for your business? Some of the most common models are:
• Production - the primary source of revenue comes from selling goods.
2
www.it-ebooks.info
O’Reilly Media, Inc. 6/15/2015
3
• Subscription – your company collects a recurring fee for services or access to content and tools. Factors to consider here are how often does the subscription renew? Within the subscription model, some companies will use a Freemium pricing model where the service is free, but customers might pay for premium or proprietary features or functionality.
• Advertising – the primary source of income will be from advertising revenue. Advertisers might be charged for the number of times that their ads are seen or based on the number of times that their ad is clicked. You might also get revenue from advertisers that are looking to get exposure through sponsorship.
• Pay as you go – customers will pay for access to a service or content on a one off basis, as needed.
How mature is your business?
In addition to being thoughtful about the kind of business you are in, you’ll also want to take into consideration the stage of growth your business is in. The maturity (or immaturity) of your business and your customer base will have a critical role in the way you apply a data aware framework. Here are some of the key considerations at various phases1:
• Young businesses – in the earliest stages of a business, you’ll be most concerned with establishing a presence and acquiring customers. You’ll be focused on ensuring that you have a viable business so market fit might also be a consideration at this stage. A solid foundation between your product and the market is essential before scaling a business, and the best way to test this fit is to do carefully designed user testing of your product to go alongside more traditional marketing analytics.
• Mid stage businesses – after establishing that you have enough demand from customers for your product or service and that you are somewhat stable enough to keep these customers, your focus in this stage may switch from growth and acquiring customers to optimizing the relationship between your revenue and expenses. In order to do this, you will need to find out what aspects of your product or service offering is returning robust and reliable results, and if there are opportunities for growth.
• Mature businesses - if your business is at a fairly mature state then it’s likely that you are more concerned with retention of your customers, protecting them and not losing ground to new competitors. In order to do this, you will need to find out which aspects of your product are not working as well as which are and ask yourself, where am I losing potential or actual customers.
With all three of the areas we outline above, you will find that placing yourself into any of those groups is not clear cut. Some UGC businesses might also have a transactional component to them. You might be a new business, but that doesn’t mean that you shouldn’t care about retaining the customers you have.
1 https://hbr.org/1983/05/the-five-stages-of-small-business-growth
www.it-ebooks.info
O’Reilly Media, Inc. 6/15/2015
Business influences on data, measures and metrics Naturally, the kind of business you’re in has a huge impact on what metrics and data it makes sense for you to collect, manage and report. The considerations of the businesses are very different across different industries, but there may be overlap. Customer/user engagement, for example, is something that all businesses care about.
A basic engagement measure is the Active User (AU). The idea is to capture how many people use your product or service on a daily or monthly basis. Business reports often include summaries of Daily Active Users (DAU) and Monthly Active Users (MAU), potentially across many categories if the nature of the business is complex. Of course, defining “active” can get complicated. It can vary dramatically from company to company, and can change within a company over time. For example, to Wikipedia, an active user may be someone who contributed to more than one article. According to the Wall Street Journal, Twitter considers a user active if they log in once a month. For a social platform, an active visitor is someone who has come back to the platform at least once within 30 days. For an ecommerce platform, a metric like active browsing 2 days out of 7 may be the metric the business considers successful. For a news media outlet, active engagement with stories once a day may be sufficient.
Drilling deeper we can define “engagement” metrics that address and measure a broader spectrum of user activities. The amount of a user profile that is filled out could be one such measure. Engagement for a social network may mean number of contacts, numbers of connections or communications made with those contacts, time spent on site, volume of content posted, produced and/or consumed and so on. For an ecommerce site, engagement means transactions (purchases, sales, returns, refunds and so on). For a business with an online presence where revenue is drawn from advertising, clicks (which are a proxy for interest piqued) and conversions (transactions that include purchase for example) may be the best metric of success.
The definition and characterization of “active” for business health and longevity is a prime example of a metric that needs user centered design thinking, and design expertise in the creation of measures that will deliver meaningful results and therefore a meaningful and business relevant set of metrics.
Business types: positive and negative measurements
Let’s take a more structured look at the kinds of things that different businesses will measure. This is not meant to be a comprehensive list, but rather a structure that you might use to consider what measurements are key for your business. In this structure, we’re looking at positive and negative measurements. Positive measurements are the factors that the businesses are looking to see trend upward and have positive impact on the business. Negative measurements are correlated to negative impact on the business and are things that businesses would look to reduce.
Table 2-1
Type of business Example Positive Measurements
Example Negative Measurements
Transactional • Number of products viewed
• Conversions (emails given,
• Bounce rate (number of visitors who come to your
4
www.it-ebooks.info
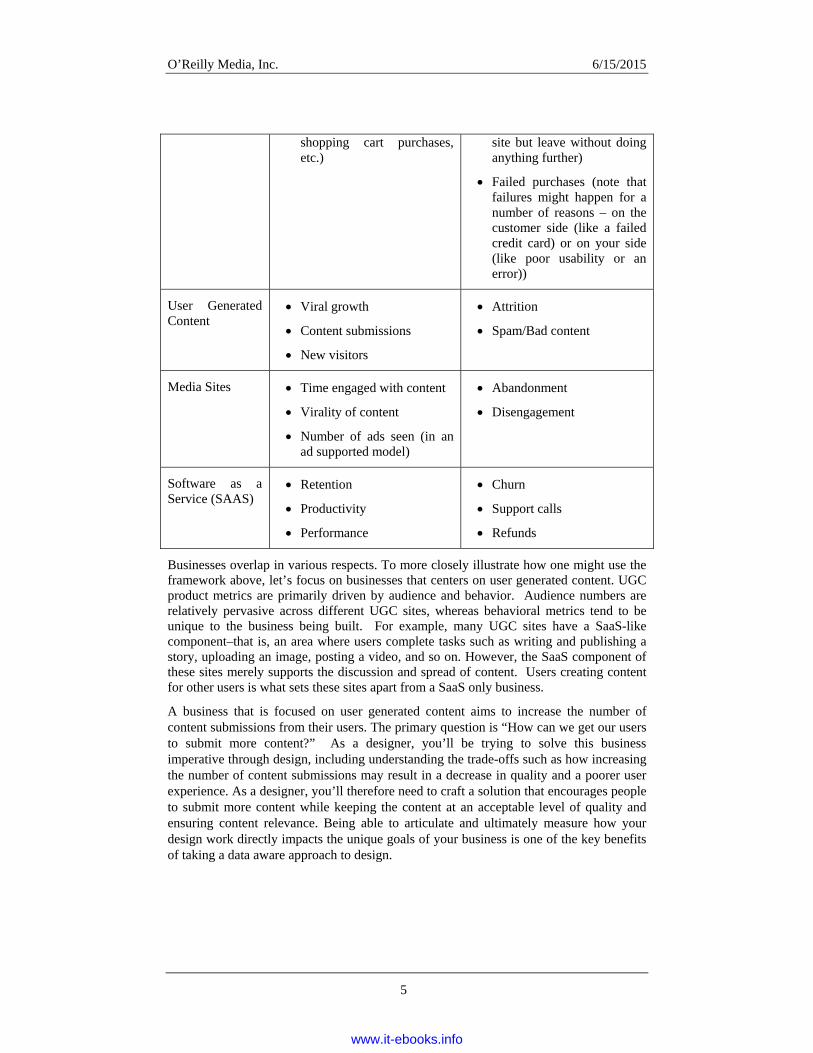
O’Reilly Media, Inc. 6/15/2015
shopping cart purchases, etc.)
site but leave without doing anything further)
• Failed purchases (note that failures might happen for a number of reasons – on the customer side (like a failed credit card) or on your side (like poor usability or an error))
User Generated Content
• Viral growth
• Content submissions
• New visitors
• Attrition
• Spam/Bad content
Media Sites • Time engaged with content
• Virality of content
• Number of ads seen (in an ad supported model)
• Abandonment
• Disengagement
Software as a Service (SAAS)
• Retention
• Productivity
• Performance
• Churn
• Support calls
• Refunds
Businesses overlap in various respects. To more closely illustrate how one might use the framework above, let’s focus on businesses that centers on user generated content. UGC product metrics are primarily driven by audience and behavior. Audience numbers are relatively pervasive across different UGC sites, whereas behavioral metrics tend to be unique to the business being built. For example, many UGC sites have a SaaS-like component–that is, an area where users complete tasks such as writing and publishing a story, uploading an image, posting a video, and so on. However, the SaaS component of these sites merely supports the discussion and spread of content. Users creating content for other users is what sets these sites apart from a SaaS only business.
A business that is focused on user generated content aims to increase the number of content submissions from their users. The primary question is “How can we get our users to submit more content?” As a designer, you’ll be trying to solve this business imperative through design, including understanding the trade-offs such as how increasing the number of content submissions may result in a decrease in quality and a poorer user experience. As a designer, you’ll therefore need to craft a solution that encourages people to submit more content while keeping the content at an acceptable level of quality and ensuring content relevance. Being able to articulate and ultimately measure how your design work directly impacts the unique goals of your business is one of the key benefits of taking a data aware approach to design.
5
www.it-ebooks.info
O’Reilly Media, Inc. 6/15/2015
6
Business types: critical moments
Depending on your business, there are also differences in what is and what is not critical to measure and monitor. It is useful to think about whether your product or service is critical for your primary target user group’s activities. An emergency helpline for example need to be always available; it is critical that the helpline does not have “down time”. A discretionary use, social sharing platform may be able to afford a small amount of down-time, without the results being critically negative for the users. However you're your business is a transaction-based marketplace, where personal allegiance is exceeded by customer satisfaction with an efficient transaction, the longer you have downtime, the more likely your audience will go elsewhere. The point here is that, what is critical to your business is where your resources will be allocated, and where your most fine grained and nuanced data gathering may need to be.
Take for example, the differences between what mattered to businesses and services like Twitter and Gmail in their early days. As we all know, critical for most businesses is “up time”, that is making sure your services are available – a key part of the engineering analytics we mentioned above. The worst thing that can happen is when the services go down, that is are not available. We have all clicked through to a URL to see an error, and it is jarring.
When Flickr, the photo sharing site goes down, a playful image is shown with the message “Flickr is having a massage.”, intended to let users know someone is working on the problem and the site will be available again soon. The message is personal and personable. In the early days of Twitter, the platform went down very, very often. The root cause came down to scale – too many people trying to use the product at once. The underlying technology couldn’t support it, which lead to many users getting error messages. The error message was a picture created by Yiying Lu, later dubbed the “Fail Whale” (see figure 2-1) by twitter user @qrush (Nick Quaranto)2. Biz Stone, the co-founder of Twitter told an NPR interviewer that their idea was to convey “that it’s a big job but we’re all working together to do it." It was intentionally fun, but not “so jokey”.
2 https://twitter.com/qrush/status/822613478
www.it-ebooks.info
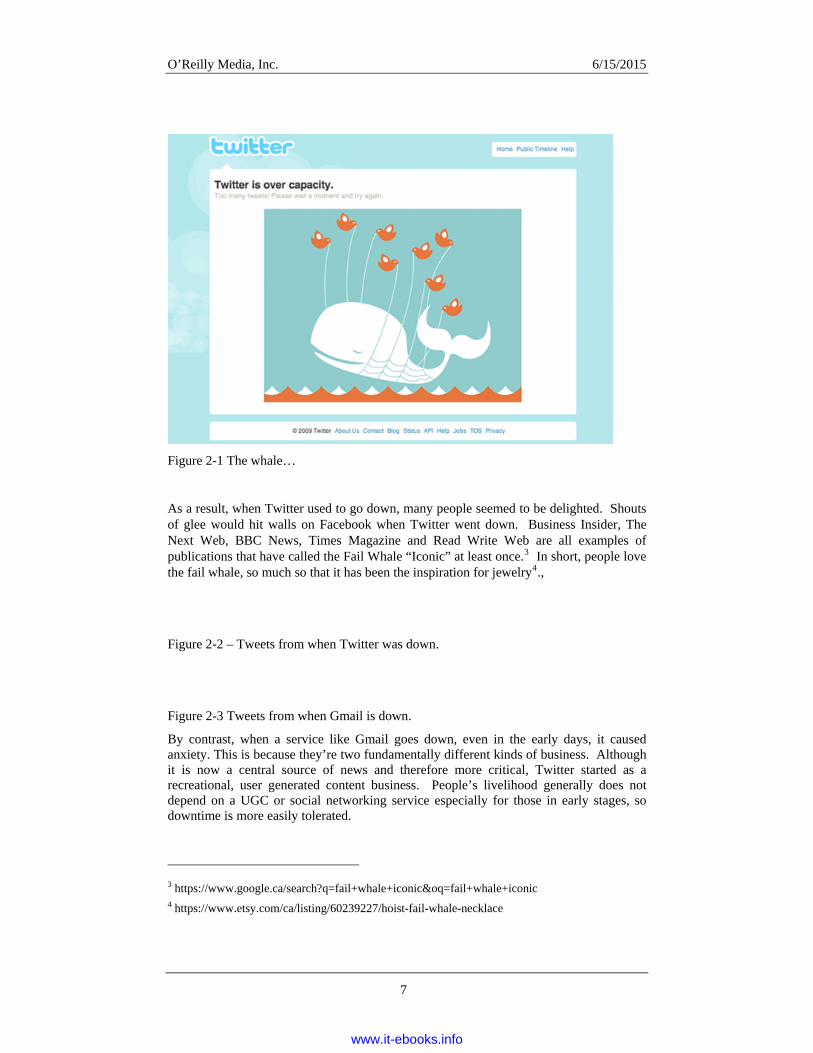
O’Reilly Media, Inc. 6/15/2015
7
Figure 2-1 The whale…
As a result, when Twitter used to go down, many people seemed to be delighted. Shouts of glee would hit walls on Facebook when Twitter went down. Business Insider, The Next Web, BBC News, Times Magazine and Read Write Web are all examples of publications that have called the Fail Whale “Iconic” at least once.3 In short, people love the fail whale, so much so that it has been the inspiration for jewelry4.,
Figure 2-2 – Tweets from when Twitter was down.
Figure 2-3 Tweets from when Gmail is down.
By contrast, when a service like Gmail goes down, even in the early days, it caused anxiety. This is because they’re two fundamentally different kinds of business. Although it is now a central source of news and therefore more critical, Twitter started as a recreational, user generated content business. People’s livelihood generally does not depend on a UGC or social networking service especially for those in early stages, so downtime is more easily tolerated.
3 https://www.google.ca/search?q=fail+whale+iconic&oq=fail+whale+iconic 4 https://www.etsy.com/ca/listing/60239227/hoist-fail-whale-necklace
www.it-ebooks.info
O’Reilly Media, Inc. 6/15/2015
SaaS products like gmail are products people rely on. When it goes down, it means someone can’t do something that they’ve generally paid (or are getting paid) to do.
The moral here isn’t that it’s more fun to work at Twitter than at gmail. The moral is that SaaS companies care about things like performance and user experience. Social networks care about completely different things, like sharing, return visits, or reducing spam content.
Metrics for different business stages Drilling a little deeper into the stage where you are in your business, one of the most common frameworks for growth is looking at the “customer funnel” through what have been called “AARRRC” metrics. These letters stand for Acquisition, Activation, Retention, Referral, Revenue and Conversion. In detail:.
• Acquisition – How well is your business doing at acquiring new users? If your business is relatively new, then you might be most focused on building up this part of your customer funnel – acquiring new users to your service or product.
o Examples of typical acquisition metrics include – number of new users/day or week, number of sign-ups, etc.
• Activation - How do you know if the user you just acquired is really going to stick around? What do you measure to gain confidence that they are going to actively use your product or service on an ongoing basis?
o When measuring activation, a good way to approach it is to think of the key value that you want to make sure your customers get exposure to in their first usage of your product or service. Usually this gives you a great way to measure activation: Is it sharing something to another person? Is it registering more of their friends? Is it playing a song or watching a video? Is it uploading something to your service?
• Retention - How do you understand if your users will be coming back to you on a regular basis and that you are creating a sustainable business? Retention is fundamentally about continuing to build your user base, retaining your customers. There’s no sustainable way to grow your customer base if you have a leaky bucket and therefore retention is very often a key metric for many companies.
o Typical retention metrics might look at how many new users remain active 2 weeks after first using your service/product or 1 month after using your service/product. You may want to tie the timing of your retention numbers directly to the length of your trial period.
• Referral – this looks at how many people are referring your product or service to others. It’s a good predictor of growth and typical metrics looked at here might be shares, viral coefficient or NPS (net promoter score).
• Revenue – this is the fairly obvious measurement of how much revenue your product or service is generating. In as much as most businesses aspire to eventually be self-sustainable, revenue is a key metric to track. You might look at revenue growth over different periods of time.
• Conversion - This is most relevant for businesses that have a free trial or a freemium model and it refers to converting your customers from a free customer to a paying one. With conversion metrics, you may want to consider what time period you’d like your customers to convert in - do you want them to convert as
8
www.it-ebooks.info
O’Reilly Media, Inc. 6/15/2015
fast as possible or is it ok if they are a free customer for a long time before deciding to pay?
Depending on the kind of business you’re in and the maturity of your company, some of these stages in the customer funnel will have different levels of importance for you. Good data-driven decision making isn’t even possible at certain stages in the development of a company. Early-stage companies have, in most cases, far more pressing issues than split testing the color of a button. They may also not have access to good, robust and reliable data at scale. They may also be designing their metrics as they go or want to take leaps of creative inspiration that go counter to what the data say. In some cases, the data may also be focused around a local minima because the company simply hasn’t been around long enough, or tried enough divergent variations to find their ‘sweet spot’ yet.
For example, if you are part of a start up that just launched you are most likely focused on getting new users and establishing your customer base. In this situation you would focus on acquisition and activation. The data that you collect and the kinds of experiences that you create will most likely be around trying to find insight into how you can improve this early part of the customer funnel.
If you’re part of a company that has been around for a long time and has a substantial user base you’re probably thinking about how you can retain the customers that you’ve worked so hard to get. You’ll want to collect information about the retention and conversion sections of the customer experience as well and you’ll want to understand what is working or not working for your customers. By understanding what data you’re using to monitor the health of your business you’ll be able to align your design thinking to the very same problem space and metrics that you’re using to judge your business on.
Having a solid understanding of the different metrics that you can influence at the different stages of the customer funnel can also give you a perspective on the longer term consequences of your design. As an example - let’s say that you are trying to optimize your sign up flow. Right now, you ask customers to fill in their password twice to confirm that they’ve entered it correctly. However, you believe that every extra step (no matter how seemingly small) causes friction for your user that you want to eliminate - so you devise a design that doesn’t have the field to repeat the password collection. You might find that this actually works, and you are getting more users to complete the flow so the metric of # of users who sign up increases. However, if you think about the full customer funnel, you might start to find that the users who didn't have to enter their password were more likely to call customer support to retrieve their password or that they didn’t come back because they couldn’t remember it and didn’t bother to return. In this situation, you may have successfully increased one part of the funnel, but without considering the full set of metrics that are relevant to your business you may choose metrics that satisfy a local goal but harm the overall business goal. This is why it’s key to plan ahead and make sure that you understand how the suite of metrics related to you business relate to each other and potentially interact.
9
www.it-ebooks.info
O’Reilly Media, Inc. 6/15/2015
Other relevant business metrics There are other business metrics that are really important to track when driving a holistic, user centered data aware design framework. Two worth highlighting are:
• Net Promoter Score (NPS), which we mentioned in brief above • Customer Lifetime Value (CLV)
Net promoter score – the net promoter score or NPS has become a fairly common way for companies to measure satisfaction and the general sentiment that their customers have. It’s based on the question, “How likely are you to recommend this service/product to a friend or colleague.” This is measured on a 10 point scale. The score is calculated by taking the number of promoters of a brand or company (those who rate it 9 or 10) and subtracting the percentage of people who are detractors (those who rate it 0-6).
Customer Lifetime Value – the customer lifetime value helps you to measure the amount of profit that your company will derive from a customer. CLV is a metric that many companies will optimize for by ensuring that they are attracting and retaining the customers that will provide the most value for them in the long term.
As businesses today develop ecosystems, it’s going to be increasingly important that you think about all the inputs from various devices, locations and experiences that contribute to the full picture of how your business is doing and what is important to that business. Collecting data from a single source (whether it be a platform or a market) will not give you an accurate impression of the health of your business and you might find yourself optimizing for the wrong things. The emergence of the internet of things and new cross-device and platform experiences means that we will be generating new sources and new forms of measure and metrics that should all be taken into account when considering the input to your designs.
Focused metrics It is important to be clear about what are, for your business, key metrics that you and your cross functional partners can focus on driving. As we’ve pointed out in this chapter, being aware and recognizing all the variables around the type of metrics you may care about from a business point of view can help. But it’s easy to get caught up in a long list of everything that you could possibly measure and care about - so make sure that you have carefully selected the metrics that you think are most representative of what you need to focus on for your business to be successful and that you are not picking too many. Be disciplined about identifying what you need to improve. Everyone has a limited amount of time and resources, so you will want to keep the team focused on driving the metrics that really matter and not getting caught up in moving things that aren’t key or won’t impact your business.
These metrics should be fairly stable; resist changing them month over month.
• You should ALWAYS be monitoring and measuring your company key metrics. Tracking these metrics on everything you do will help to keep you thinking about the larger picture so that you don’t fall into the trap of over optimizing for one piece of the puzzle rather than the whole thing.
10
www.it-ebooks.info
O’Reilly Media, Inc. 6/15/2015
• Ask yourself: Are you selecting metrics that get you to focus on the right things? The metrics that you pick to focus on will affect your behavior and the kind of solutions you design. If you focus on click through of a button, you will make designs that only focus on the button. If you focus on improving the retention metric, you will think of designs that improve the overall user experience.
• Some companies have tried the exercise of having “one key metric” – the bottom line metric that if that was the one thing to be measured it would reflect the business health. Think about what would be your businesses’ one metric and how you might design your experiences to impact that metric.
Why spend so much time on metrics?
There are three key reasons why we think metrics matter.
1. Alignment 2. Focus 3. Consistency (for future learning)
Ensuring that you and anyone else you work with are all in agreement about which metrics matter most for your business will keep you aligned. There are many times (not just in a data aware environment) where teams can get distracted or waste time because they don’t realize that they are solving different problems. By having a clearly defined and objective measurement of success like a specific set of metrics - it can help to ensure that you and your partners are aligned and have the same goal. You have agreement that you are trying to impact the same thing in your business.
Having commonly defined metrics can also help to ensure that you stay focused. It’s very easy to think of additional things that you want to change about your customer experience. You start to layer in feature after feature and improvement after improvement, without being disciplined about making sure that those improvements tie back clearly to your original goal.
Finally, by having clear metrics you also allow for consistency over time. Hopefully, you aren’t changing the metrics for success all the time. Occasionally these metrics will change, but ideally, that’s the exception and not the rule. This way, if you are working on a series of explorations and you have a consistent set of metrics that you’re using to measure them against, then you actually get to understand what kind of impact (delta) you can expect to get from certain kinds of design changes. You can compare results from one design to another. Metrics should provide you with a solid framework for ideation. By knowing what metrics you want to affect, you should be focusing on the kinds of ideas that will actually have impact on the things you measure and consider to be important. By having all of your design explorations evaluated by the SAME metrics you can compare their impact against each other and have a good baseline so that all of your ideas are being judged on a level playing field.
Summary/Key Takeaways Understanding your business and the maturity of your company (early stage, growing or established) are critical factors in determining the measures and the metrics that will best reflect how your designs are impacting your business goals.
11
www.it-ebooks.info
O’Reilly Media, Inc. 6/15/2015
Common metrics and measures help to align and focus your work, and ultimately they should tie directly back to the user experience. It is important to think carefully about the customer journey with your product(s) for different user groups. What is the customer experience that you’re trying to drive and how does that relate to some of the business metrics that your company cares about?
You want to make sure that everyone in your team agrees ahead of time on how you are measuring the success or failure of your design. It’s important to iron out any differences at the beginning of your project and to continue to build alignment at every step of the process. That means aligning on the key metrics at the company and business level.
• To do this you’ll talk to key stakeholders, CEOs and other people who craft the product vision. It’s best if you actually do this together so that you have complete buy in and understanding of what the key metrics are at all levels of your organization. If you were to share the metrics you think are most important back to the CEO will he or she agree that those metrics are an accurate way to measure their vision?
• It’s also good to build alignment with not just the top people in your organization, but also the people who are building the actual product. If they buy into the way you are measuring success then they will make better tradeoffs and push for the right decisions as the product gets built. Once you’ve built alignment on the key metrics – it’s not likely you’ll need to do this again unless your business model shifts.
Finally and critically, you should always try to put yourself in a situation where a good customer experience will be reflected in good metrics. When you start to find that you are creating bad designs in order to move your metrics you should question the metrics you need to stop and assess what it is that you are doing wrong. As a designer, you are advocating for the customer experience first and foremost, a successful business should be giving its customers a great experience.
Questions to ask yourself • What kind of business is your company in?
o What are the positive and negative metrics that matter most to your business?
• What stage of maturity is your business at? o Are you starting up (i.e. acquiring new users?) or are you a more
established business and care about retaining existing users? Or is it some combination of those two?
• What does success look like and how are you measuring it? • Who is the audience you hope to affect?
o What do you know about them as a demographic? Their habits? • What are you trying to accomplish? What is your goal and what does success
look like? o What is the customer behavior that you want to encourage? o Are you trying to directly increase a metric that is important to your
business (e.g. getting more people to sign up, getting your customers to return more often to your product?)
o What will you do to encourage the user behavior that you are seeking?
12
www.it-ebooks.info
O’Reilly Media, Inc. 6/15/2015
13
• How are you measuring success? o Which metrics are you going to look at to understand if the impact you
hope to make through design is the right one or will have a big enough impact?
o How or will you measure or factor in user sentiment? Will you use surveys, focus groups, and interviews?
• How do the various measures and metrics relate to each other? o How are you ensuring that a positive result in a specific arena (e.g.,
password setting) does not have down-stream negative consequences on the business?
o How do your behavioral and usage measures relate to the attitudinal measures reflected in your customer satisfaction surveys, NPS surveys and user verbatims?
• If you had just one metric to measure the health of your business, what would it be?
All of the above questions are implicated by the business you’re in and the way you approach gathering data on your design and your experience will have clear impact on your business. In Chapter 4, we’ll revisit a number of these questions as we begin to offer some more specific and practical advice about how you apply a data aware framework to design.
www.it-ebooks.info
O’Reilly Media, Inc. 4/8/2015
Chapter 5
Culture and Communication
Introduction As we mentioned at the beginning of the book, the strategic and programmatic capture, management and analysis of user behavior data are typically not considered to be a part of good design practice. Indeed, quantitative data collection and analysis to drive design decisions in particular has been contentious and has sometimes even had a polarizing effect on designers and product managers.
However, we believe that designers need to play a part in the design of data capture and analysis, as we have argued in earlier chapters. We also believe that designers can play a key strategic role in companies by engaging in the design of data communication strategies and practices. However, to communicate most effectively you need to be willing to interrogate and get your hands into the data yourself, to be part of designing the tests so you know where the results came from.
This chapter follows on from our description of business cultures in Chapter 2 to address company culture and specifically group and company communication cultures. We focus on communicating data driven and data informed ideas, showcasing where product excellence is derived from systematic and programmatic engagement with data and how to put the foundations in place for a data aware group and company culture. Creating a culture where all of this comes together well really depends on three key things: the material to be presented, the presentation format and process, and the people.
When you have a culture that supports data communication and prioritizes collaborative learning, it is easier to create strategic, tactical and operational business alignment. More than that, as a design practitioner, data is one of the best ways to persuade people of your case, to support your arguments and this to more effectively advocate for your users and create the most effective and delightful experiences. Data allows you to bring your users’ voice into the conversation, helps you know which interactions are the most important and when. In some senses the usage data you capture is a representation of your user, of what they care about and when, of what they need and don’t need. So you need to design your data to help you know your user better.
Although we focus on communication here, we don’t intend this chapter to offer you the foundations for becoming a marketer/PR person, nor a data visualization expert. These
1
www.it-ebooks.info
O’Reilly Media, Inc. 4/8/2015
are both of skillsets and competencies you may want to hire for and/or leverage as you design your company’s internal- and external-facing communication strategies. Rather, we are advocating that you work by enacting 6 principle activities:
(1) aim for shared understanding of the value of user centered as a company universal, by …
(2) laying the foundations for engaged and transparent conversations about systematic data collection, in order to …
(3) create alignment, and locate and establish allies and co-partners across company functions.
Also aim to
(4) hire and internally recruit the right people, and to
(5) articulate the long term benefits and the ability to do effective pattern finding across different kinds of data set and to
(6) drive a culture of learning, and communicate what you’ve learned with clarity and integrity.
On integrity, in our next chapter we will investigate more on the issues to do with ethical data collection.
In this chapter, we’ll cover two things:
1) What a data informed culture looks like
2) Some tactics that you can use to get there
Benefits of designing your culture of communication When it comes to user data, summarization and communication are key to having an impact on business.
In a recent Harvard Business Review article (April 2014) the benefits of being a design led organization were outlined. It is clear that those design organizations that are most successful are ones where communication is carefully crafted.
What are the benefits of carefully crafting and designing communication around data? A culture of communication allows deeper business understanding, including understanding of actual and hoped-for users, and for better product experience over a customer life-time. Creating a culture of questioning, learning and data innovation, and a culture that develops a common set of goals, and agreed on set of user-focused metrics and a common vocabulary will lead to a more successful business. There are a number of ways of achieving this that we will discuss in this chapter:
• Aim for shared understanding of the value of user centered as a company universal… which requires you to
• Lay the foundations for engaged and transparent conversations about systematic data collection. You need to create a dialogue, set expectations and develop a common vocabulary.
• Create alignment, and locate and establish allies and co-partners across company functions….and….
2
www.it-ebooks.info
O’Reilly Media, Inc. 4/8/2015
3
• Build a team through strategic hiring to reflect, amplify and grow the above…..and
• Articulate the long term benefits and the ability to do effective pattern finding across different kinds of data set by establishing a disciplined and consistent approach to leveraging data that is programmatic, flexible and not rigid …..by
• Creating a learning organization to ensure you perennially grow your knowledge base.
We’ll walk through each of these points to help you think about which things you want to adopt for your organization and which may not make as much sense for you or your team. At the end of the chapter, we’ll suggest some tactics that you might use as you build up your own culture of data informed design.
Principle #1
Aim for shared understanding of the value of user centered as a company universal
For a data informed approach to be successful in any organization, it must be both universally embraced and understood. By “universal” we mean both in terms of depth (that is accepted at all levels, from senior executives to individual contributors) and breadth (that it is accepted throughout the company, beyond the product development organization as well). This means that people at all levels in the company and across a broad set of functions within the company recognize that all kinds of data are triangulated to inform product decisions, and that they have a part to play in designing, understanding and interrogating data. It also means that they have at least a basic understanding of what this process looks like and what the pros and cons are of using data are. This means that there is a good “support net” for data informed design to happen – having this level of transparency in the process and common understanding can help to keep the design and product teams accountable to good practices.
Depth: Top to bottom
Because a data and design framework is conceptualized as being in opposition to “gut” decision making, it is often also about breaking the hierarchical decision making structure. Traditional management-led, top-down decision-making based on hunches goes away, and is replaced by company-wide, all-level data literacy which includes addressing well-formulated, carefully investigated questions. While this is the norm for business analytics, this needs to be developed for user behavior analysis for more effective customer-centric learning to drive product decisions.
This data may be collected using any number of techniques (such as ethnographic field research, field deployments of prototypes, surveys, lab studies and usability research, testing at scale using AB testing, etc.) Such grounded and carefully gathered user data can drive your decisions, and is a less risky prospect than relying on hunches from individual executives working from “gut feeling”. An early paper that focused on AB testing published in 2007 by Ron Kohavi, Randal Henne and Dan Sommerfield entitled “Practical Guide to Controlled Expriements on the Web: Listen to Your Customers not to the HIPPO”1, addressed this issue:
1
www.it-ebooks.info
O’Reilly Media, Inc. 4/8/2015
”Many organizations have strong managers who have strong opinions, but lack data, so we started to use the term HiPPO, which stands for Highest Paid Person’s Opinion, as a way to remind everyone that success really depends on the users’ perceptions.”
If you are trying to shift into a data informed framework, it will be critical to look at the way product and design decisions were made previously made. If these decisions were largely in the hands of one or two individuals then it’s worth taking the time to make sure that they can understand and recognize the value of bringing in user/customer data into the decision making process because in the end, they may find that their weight is diminished (as is the “weight” of any individual opinion). This is a good point to check with yourself as well – are you comfortable and willing to see how depending more on data will change the weight of your own opinion within the design and product development process?
Breadth: beyond design and product
In addition to getting all levels of an organization on board with a data informed approach, it can be just as important for teams outside of product and design to have a basic understanding of a data informed framework and how it’s being employed. Company cultures that embrace transparency are company cultures that encourage participation and engagement from their staff.
Sharing well-summarised data will engage parts of the organization that are not normally part of the design & product development process and make them feel like they have a closer affinity with how the product is shaped. If people in organizations beyond product and design feel like they can empathize with your users, then they can also feel empowered as part of this process. A carefully articulated data and design framework is something that many people beyond product and design can understand. By being more transparent with the rest of the company about how product and design decisions are being made (and especially in product and design driven companies), you can build broader support within the company for the decisions that are being made.
There is another positive side effect of having your data informed approach being broadly understood. It may initially seem like it’s superfluous to have teams like recruiting, HR, sales, or finance fundamentally understand a data driven approach. However, it is always helpful to have any team that you work with in any capacity understand how you do your work. Having recruiting and HR understand the company’s engagement with data helps with attracting, attaining and retaining top talent, something we will turn to later in this chapter. When product development teams understand what questions are being posed by different parts of the company and how those questions are prioritized and then answered through data helps staff understand the various aspects of the business. This, in turn empowers them further in the idea generation stage and better aligned around product and business success. Imagine the sales executive who feels that they know exactly what you need to build into your product but may be overly swayed by a key vocal client. If that sales executive understands that you build product by looking at the data, then they realize that they need to start to articulate their arguments into the same framework - and it helps to get you and them aligned with what you are building, why you are building it and what impact you think it will have on your overall user base.
There is a difference between using data to make and inform decisions in one part of an organization (e.g. business strategy) and having it be universally embraced by the entire organization. To get this level of understanding throughout the company, using data has to be something that you actively share within all parts of the company and has to be
4
www.it-ebooks.info
O’Reilly Media, Inc. 4/8/2015
something that is talked about and participated in broadly (e.g. in company all hands meetings and other public forums).
Principle #2
Create a dialog, set expectations, establish a shared vocabulary and lay the foundations for engaged and transparent conversations about systematic data collection.
It is important to make sure that the people in your organization understand at least superficially what’s involved and that they are essential to the process when it comes to leveraging user data effectively. If a process isn’t already established in a company there will always be some level of skepticism around something new. You might find that there are people who will say “Yes! We should definitely start to take a data informed approach to design, but we shouldn’t do X, Y and Z” or that what they think it means to be data informed, might be something very specific (like only AB testing) and that they aren’t considering the bigger picture where different kinds of data collection and analysis fit together to answer strategically important questions.
Establishing a knowledge baseline
Therefore, having decided you want to enroll the company around data capture, analysis and consumption, you will need to create a dialog. Find out what people really do know and don’t know about taking a data informed approach to design. Some people may understand user research, but have much less experience with AB testing (or vice versa). Find out what the biases and assumptions are about data informed design and do this at all levels of the organization (from CEO to individual designer or product manager). Having all of this understanding up front about what people think and know can really save a lot of time in the long run: You’ll be able to assess where you might want to focus initially in terms of establishing best practices and you’ll also become aware of any challenges you might face as you try to get a data informed design process established.
Once you’ve established what the knowledge level is, where there is deep knowledge and where there are opportunities for teaching, learning and sharing, then explicitly talk about what practices you want to establish and why. Getting your team and others that you work with to agree to try out some of these things that might be new to them will be important if they’re not familiar with some of these tactics. It’s always good to set expectations for what you will do and what you expect to see as a result, so saying “I’d like to take an extra few days on this to make sure we have time for user feedback on how usable this flow is.” Makes it clear that the cost will be a little more time to introduce something new and what level of results you hope to get from it. Be clear about what method you will be using to answer which questions and why; too often A/B tests are used to answer questions that would have been better suited small-N, lab –based usability research - or vice versa. This leads to inappropriate negative evaluations of good methods. As we have shown in previous chapters, literacy in data collection and analysis methods of all kinds means you can create a clear rationale, set appropriate expectations and offset negative reactions and loss of trust. Data ignorance fuels data reticence.
5
www.it-ebooks.info
O’Reilly Media, Inc. 4/8/2015
Establishing a common vocabulary
A key part of establishing a shared set of values is the language that you use. Think about the words that you most often hear at your company. What are the words and phrases that are unique to your company? Which acronyms have you created and embraced? When you first joined what were the things that stood out to you as unique? Now think about how those words and phrases help to set a tone for how business is conducted within the company and how usage of certain phrases make you feel like you’re part of an “in-group” or “in the know”. To make a data informed decision-making framework is universally embraced, it’s then important to actually have a common vocabulary and way of speaking about it.
You’ll find that a common vocabulary will help in a number of ways, from making brainstorms more effective to making debate over product and design decisions even more rich because you’ll have a shorthand for the things that are most important to the discussion. Seemingly simple questions that can get asked over and over again, “How do we know X?”, “How are we going to measure Y?”, “How do you expect the majority of users will react?”, “What is the learning curve for this?”, “What user errors or stumbling blocks do we think are reasonable or not?”, “What do you expect to learn about user behavior from this design?”, “What does design success look like?”, “What does design failure look like?” can quickly help to train people and set expectations about the role that data can play in decision making and in strategic, grounded design iteration.
Remember though, this should be as much about having common definitions as it is about having a common vocabulary. Since a data informed environment requires a certain amount of discipline and rigor to the practice, you can’t ensure consistent application of this framework if you don’t also have alignment on your definitions as well as your vocabulary. Don’t get too caught up in the words and acronyms (especially around metrics) such that you forget that the ultimate goal is to provide the best, the most compelling experience for your users. Find ways to actively represent the user in your definitions so that everyone recognizes that data itself does not humanize but it’s how we interpret it and how it is applied and used to rationalize decisions about product design and product quality that can be dehumanizing.
Key phrases and vocabulary for a data-aware approach have been defined throughout the book, and these include terms like:
• Design Space
• Hypothesis - by stating “my hypothesis is...” it helps to place your idea within the context of everyone else’s ideas. Calling it a “hypothesis” reminds you that it hasn’t been proven yet and that it needs to be tested. Hypothesis also has the added benefit of sounding more scientific, making people less attached to their ideas and therefore more open to testing them and being proven wrong.
• Statistically significant - a great shorthand for knowing whether or not you should act on the results from your test. You can always refer back to whether or not the results were “statistically significant”.
• Variables
• Measures
6
www.it-ebooks.info
O’Reilly Media, Inc. 4/8/2015
• Metrics - We’ve spent some time in this book pointing you to the fact that the right user (rather than business bottom-line) metrics for your company need to be designed. We have also spent some time identifying the difference between core, proxy and secondary metrics. For the purpose of this section, “metrics” is a key part of the data informed vocabulary because the metrics that you use and measure represents how you measure success. Clear understanding and agreement on how you are defining metrics (at the company level and at the project level) will ultimately be an indicator of how aligned you are on any given project or discussion and can therefore play a significant role in how effective your discussions are. You might find that you start to use questions like “is this change really going to move the metrics?” to ask if you’re really investing your time into a project that will have a measurable impact on your users. Questions like “which metrics do you think this will affect?” can help you to make sure you’re looking to impact the right level of user behavior.
• Validity
• Reliability
• Soundness
• Replication/reproduceable
• Confound
• Certainty
• Ecological validity
In reality, the vocabulary itself may not be as important, it’s really more about consistent usage of this vocabulary that helps to reinforce a specific mindset and a way of thinking. Like working in any company, the vocabulary can help to shape the culture. What are the words that are already part of your company culture that you can adopt to support a data informed approach?
<Sidebar: Vocabulary>
Principles #3 and #4
Create alignment, and locate and establish allies and co-partners across company function and build a team through strategic hiring to reflect, amplify and grow the above…
People matter. Look inside your company, seek out sympathetic and curious others, recruit allies through conversation, question asking and engaging in their processes. Invite colleagues to be pilots for studies and to comment on designs and plans. Small “pilot groups” are invaluable. If your company or organization has not been data aware historically, and/or has engaged in a data informed design practice before, you’re likely to find that there are some folks who are eager to try something new and others who will have more resistance to it or not want to be bothered with the hassle of adopting a new
7
www.it-ebooks.info
O’Reilly Media, Inc. 4/8/2015
practice. Generally, finding a few allies who are willing to try something out with you and who are also going to be more forgiving in the initial stages when you are likely to make a lot of mistakes can be really helpful. This will give you a chance to work out any kinks in the process with a small group of supportive people and then have more confidence as you try to roll it out to other designers or teams.
To find a good “pilot” project, there are a couple of characteristics to consider. Find something small so that you can ideally get a “quick win” and share the positive results of using data informed design to others. If the first project you pick to use data informed design takes you a few months just to establish what data you’re looking for or to do the analysis on the results, it’s very unlikely that you’ll get a lot of enthusiasm from others to adopt something new. Find a project which has well defined success metrics. This will make it easier for you to explain what you’ve learned or not by applying a data informed process. A project that allows you to do a couple of quick iterations can also be good because it can demonstrate a data informed process over a couple of cycles. We really try to encourage using data to do more than “just optimization” but when you’re establishing the practice for the first time – these kinds of projects are perfect for warming up the larger organization to the concept of data informed design and to build confidence in adopting a new framework for design.
Finally a note on “allies”. As mentioned above, some people will be naturally drawn to a data informed approach and others will not. The best allies exist in other teams. Having many different voices who can advocate for a data informed process is very powerful. Some of the best advocates are in analytics teams and in marketing. Seeking support from the broader organization helps to make this more than “just a design thing” and helps to elevate it to the level of a company wide initiative. This also helps with the “universally accepted” aspect of culture we discussed earlier.
<Sidebar: Establishing a new function>
In addition to gaining internal allies and collaborators, new people matter. The people you hire play a huge role in the success of your team. Building a team to work effectively with data informed design requires hiring a certain kind of profile. There are several qualities that are central to creating a strong team to drive a data aware design team and a data informed design practice in your organization:
1. fundamental design skills – the best designers know how to interpret a difficult problem and create a solution that addresses it. They can also articulate and justify the reasoning behind their design decisions. It’s no different working in a data aware environment. The best designers in a data aware environment will leverage these fundamental design skills to address and articulate user problems and needs that will often be identified and measured using data.
2. a passion for driving a successful business that is also consumer/user-centered. Ideally the people you hire will have a passion and curiosity about the business you’re in. To build a data aware design environment, it becomes even more important for people to have a certain level of business passion and desire to contribute to strategic thinking about the business. This is because it all ties back to being able to create hypotheses that have the intent of moving the measures metrics you use to measure your business by. If the designers and
8
www.it-ebooks.info
O’Reilly Media, Inc. 4/8/2015
product managers who are tasked with building the business solutions don’t have a baseline level of passion for the business bottom-line measures and metrics, if they are happier being tasked and “throwing designs over the wall”, then they will be unhappy in the environment you are creating.
3. an affinity for understanding, generalizing and being able to replicate design success and drive consistent user centered design and product excellence. Being programmatic and systematic through data is about understanding and being able to derive general principles and being able to replicate your results and to derive general principles. Even if results cannot be replicated for good data reasons, it is important that general principles are extracted that could be applicable to adjacent or downstream projects.
4. a desire to engage with and learn about the scientific method and develop some skill or affinity for mathematics. It is true that having some basic understanding of statistics and analysis can make a big difference in whether or not an individual can succeed in a data-aware design environment. You don’t need to be great at it, but it’s important to have some basic level of math is just so that you can have conversations with the folks that are doing the analysis of your work. You need to be able to question how the success of your work is being measured and you need to have an appreciation for it. Without some fundamental understanding of the theory behind many of the techniques in a data informed environment, you won’t be able to engage in the more strategic conversations.
5. an ability to be open-minded, iterative and engaged but not enslaved by initial design inspirations. There are many kinds of designers that exist in companies and all types of designers can be successful in their careers. For some designers, a healthy ego and a deep belief in the fundamental “rightness” of their designs is a necessary and positive characteristic as it can sometimes give designers the confidence and ability to convince others of their vision and to sell them on that. Ego is a necessary component for creativity to survive. In a data aware, experimental, iterative design environment, over attachment to designs that can result from ego can get in the way of success. This is because as part of a data informed organization you often have to be willing to let the user and usage data make the decisions. Just as the common phrase applied to authors – that they have to be the “murderers of their children” – may be true, the same is true for designers. Letting go can be hard but may be necessary.
6. an ability to be very focused on results as well as production. Especially in the AB testing part of data informed design, it can be easy to get distracted with different options and test cells and variations. By having a certain amount of focus and discipline, your staff will be better equipped to resist the urge to fall into the various pitfalls of AB testing around making a decision too early or building out too many test cells.
You don’t always need to hire people who have actually had experience in doing data informed design, but you at least need to find people that seem to have an affinity for working within that framework. If the folks that you hire aren’t fundamentally open to the concept of data driven design then it can make it very difficult for them to be successful in the team. This of course doesn’t mean that they are “bad” designers, it just means that they would probably be more effective (and more appreciated by their peers) in a different environment. As we mention throughout the book, there are many ways to
9
www.it-ebooks.info
O’Reilly Media, Inc. 4/8/2015
do design and to build product. What fundamentally determines the success of design or product is finding the right fit between the individuals, organization and the processes that you use to get there.
<Sidebar: accepting data>
Principle #5
• Articulate the long term benefits and the ability to do effective pattern finding across different kinds of data set by establishing a disciplined and consistent approach to leveraging data that is programmatic, flexible and not rigid …..by
One of the aspects of creating a shared culture around user centered data is to be programmatic about your data collection and sharing. What does this mean? We have already talked about crafting a careful and consistent. Beyond this though you need to create a framework for sharing results. The more you can create a set of data sharing formats and practices the more people will sign up. For example, create a consistent look and feel to your reports. Create a carefully managed repository of reports where people can seek information as they need it. Create a rhythm for data sharing. Use physical space to showcase results as they come in. Create what social scientist Nina Wakeford calls “atmospheres” around the presentation of your data so that you can help others understand and interpret their significance, and so that they can work to make the connection to what the data suggest are actionable next steps. By careful management of results over time you can avoid ephemerality and you can avoid the constant redoing of work and the constant “reinvention of the wheel”. Systematic record keeping and sharing in common formats makes your message potential stronger, and makes the business stronger. We advocate putting considerable effort into your “data hygeine”.
Revisiting Data
One of the main reasons people consider adopting a data informed design approach is that it can save you a lot of time in learning something about your product before you release it. You can learn a lot from past internal examples as well as by looking externally at what other companies are sharing about their learnings.
As data informed design is becoming an established process, we’ve found that an effective technique is to take past projects and then retrospectively look at the data using a data informed framework. Of course this may not always be possible, because you may not have had all the proper tracking in place but many times the basic metrics will be tracked and available. You can look at old projects and see if there was any way of looking at the data ahead of time that might have affected the decisions you made on the project. Often the data is available to but the team just wasn’t considering it.
This might be especially effective on projects where the outcome wasn’t what you were expecting. For example, was there a project where you were hoping to see a big lift in acquisition and it didn’t happen? Going back to the data, was there anything you could have looked at prior to making those changes that might have given you a hint as to the fact that it wasn’t going to be successful? How can you build that knowledge into future tests? Or perhaps your users reacted very badly to a new feature you launched but really
10
www.it-ebooks.info
O’Reilly Media, Inc. 4/8/2015
thought was going to make them happy… applying some survey techniques or user research in these instances (even though the feature has already been launched) will give you insight into what your users might have been able to tell you ahead of time if you had done this work pre-launch. When you can share these kind of insights back to the team (even if it does feel “too late”) it makes people that much more enthusiastic to incorporate a data informed approach earlier in the process the next time.
Another best practice which is especially effective with respect to AB testing is to keep track of which cells you (and your team) think will “win” and then comparing it to what actually happens. To cast your “vote” ahead of launching a test, ask all the members of the team to write down what they think the results will be and why they think those results will happen. When you get the actual results and can compare it with the votes that were cast prior to the test being launched then it gives you a chance to see how well you and your team were actually able to predict the impact to users.
Over time, it’s always interesting to keep track of who in the team has the “best” product instincts. There’s of course a danger in this tactic in that it can create a competitive environment, but the trick is to make it more about learning together and keeping each other honest.
Developing a rhythm around data sharing
Finally you might find that there are some very easy ways to set up a rhythm around data. There may be other things that you can look to piggy back on to set up an expectation within your team about good habits that you can make part of a recurring rhythm.
For example, rather than setting up user research as needed, you could set up a monthly user research session which either focuses on your baseline experience or that gets filled with whatever happens to be going on that week. You might also consider sending out a monthly update with insights from the various projects that you’ve been doing. By starting to set up expectations that data will be collected on a regular basis or looking to create dashboards that show how metrics might be changing over time given changes that you are making to the product, you can start to establish a working rhythm in your organization around data.
<Sidebar: Developing rhythm>
As you begin applying a data informed framework, there’s no way to just turn it “on” so you’ll start with selectively. However, your goal should be to make data aware design a consistent part of product development. To do that, it will require discipline and vigilance. This is probably true of any decision-making platform, but if you’re going to take a data informed approach to product and design it’s important to not apply this framework selectively.
Fundamentally, taking a data informed approach to design is about trying to make decisions about your product and for your customers using as much information as possible along the way. It’s about trying to mitigate the subjective aspects of product development by incorporating data from your customers into the process. It’s therefore almost inherent to the nature of a data informed design process that you need to apply it
11
www.it-ebooks.info
O’Reilly Media, Inc. 4/8/2015
consistently across all projects for it to work. We’ve seen that using data inconsistently within an organization can often cause confusion or skepticism about the larger process.
One of the critiques that we’ve heard about using data inconsistently is that the data is only used when it supports the opinion of the person who’s making the decision. This can definitely happen in organizations and as many of us might know from lab courses in college or high school, there are often ways to “fudge” the data or read it in a way that makes it support the outcome you’re looking for. As you’re trying to establish the value of data informed design, it’s even more critical that they way you leverage and interpret data is such that it reinforces the objective value that it brings. As a designer or product manager working in this environment, you might find that there can be a dose of skepticism around which cells are being tested and why. Therefore, it becomes important to treat all projects with the same amount of rigor across the board. Crafting solutions and making decisions in absence of data and user feedback should become the exception and when you do make those decisions without testing or user feedback you’ll want to be able to articulate and defend why that was the case.
Especially when you are trying to establish the methodology of data informed design, it can be important to showing how you consistently hold yourself accountable to the methodology of data informed design, but ask others to hold you accountable as well. This goes back to the first two points about having data informed design be universally embraced and having a common vocabulary. If you have those two things in place, then your whole company will be helping to keep you and your team accountable as well.
Principle # 6
• Create a learning organization to ensure you perennially grow your knowledge base.
Data aware design environments work best when they are seen as part of an overall company culture that encourages learning. Many companies are focusing on creating “learning environments” where there is a focus on building individual skills as well as encouraging development. Data aware design lends itself to this environment because one of the core attitudes that you need to have about using a data informed framework is to recognize that you are constantly trying to build up and add to your knowledge about your customer’s behavior. Using a data informed approach is fundamentally about “honing your consumer instinct”. This is an ongoing activity and every project is an opportunity to get better at developing that instinct through learning, information and data.
There are some very practical habits and best practices that can really help to support this culture. Some things that we’ve seen be especially effective are:
• Sharing results and information broadly
• Keeping sharp on both theory and practice
• Self awareness/evaluation
Share broadly
If you are actively using a data informed design framework, one of the best things that you can do for your company is to broadly share the results and to give everyone access
12
www.it-ebooks.info
O’Reilly Media, Inc. 4/8/2015
to the data. In a data informed environment it becomes even more important that designers understand how their designs are being judged and performing. Designers are often very engaged with user research (which we also classify or include as part of the “data informed” framework because the design is still in progress and user research is often more integrated into the design process). However, there are many places where once the design is done, the designer disengages from the product development process and doesn’t stay as engaged with the results post launch.
Designers need to get the results from any AB tests that are conducted over their designs. Getting access to this data is a key shift in their ability to become more strategic. Understanding (even if only at a high level) how to analyze this data and how to then use that data to make informed decisions about what to design (and test) next is a key skill.
Habitual sharing/context setting/broad communication, company-wide, of test results - reinforces that most decisions are influenced by data. It also helps folks to build up shared knowledge about what works and what doesn’t work. All this testing doesn’t really get you much further if you’re only using it to make decisions on a micro level. What should be happening is really taking away learning from these smaller instances and then using them to hone your instincts about your users over time. The best way to do this is to vet it with your peers and to subject your testing to debate and discussion.
Theory and practice
It is useful not only to share the results of ongoing work, but to also recognize that operating in a data informed environment can be new for a number of people. Sharing results from ongoing work means that you’re sharing knowledge and insights which helps people develop a better understanding when it comes to your particular product or project, but it can also be helpful to make sure that people who have less experience with data informed design have an opportunity to build a good foundation about the practice itself.
Discussions and debate around more general topics and “theory” of data informed design can be very helpful to make sure that everyone has a common foundation. Topics might include everything from how to pick the right technique for different kinds of projects, the pros and cons of different methodologies, or even details on how to pick a statistically significant cell size or what a p-value is. The number and level of discussions that you have on these best practices will be determined by how mature the organization is with respect to data informed design. If everyone can have a common baseline of knowledge on the theory behind the practice of data informed design you’ll find that your discussions on actual projects will be much richer and much more efficient. You’ll also hopefully avoid some of the pitfalls of not using the data properly (and therefore being more likely to subjective or mis-interpretation). You’ll find plenty of potential topics for these “theory” discussions from some of the earlier chapters in this book.
Self awareness/evaluation
As we’ve mentioned before, one of the biggest benefits of a data informed approach to design is that it gives you a great tool to use to hone your consumer instinct over time. If part of the culture of data informed design is about transparency and a more objective evaluation of your work via the data then as we’ve hinted before accountability to holding everyone to a similar standard is important. It’s really helpful to create an environment where you can encourage self-evaluation and to not be afraid of making
13
www.it-ebooks.info
O’Reilly Media, Inc. 4/8/2015
mistakes and building out ideas that don’t actually “move the needle”, that is positively impact the business bottom line by increasing one of the established success metrics (e.g. user retention or engagement, revenue, etc)… so long as you are keeping track of them and then learning from those experiences.
We’ve discussed keeping track of track records as a good way to see how you’re actually doing. Being self aware of when your instinct has differed from what has been reflected in the data is one of the fastest ways of improving and if you’re in a culture where sharing data and results is very common, then you should have a lot of tools available for you to evaluate yourself. In the next chapter we will address some of the pitfalls of being in a data informed environment if you DON’T hold yourself accountable to your decisions and if you don’t do this constant self evaluation. For example, “over-testing” can actually be a side effect of not having a strong enough instinct for what are the right things to test. Developing a good instinct for what will give you the best return on your resources investment (your “ROI”) will actually come from constant viligence and self-evaluation as to how well your team is operating and how well your instincts are validated by data. Not only should this be applied to the individual, but to the organization overall and it’s best if you can explicitly think about fine tuning and improving your collective understanding about your customers.
Ongoing education and establishing a rhythm around data
As we’ve mentioned before, creating an environment where it’s clear that ongoing learning is supported can be one of the most effective tools to getting traction for a framework like data informed design. This is best done through a series of ongoing meetings, forums and occasional talks.
Lectures – this might be more applicable to larger teams - introducing a topic to a broad audience (say a mix of tech, product and design) can be an effective way to plant some of the seeds of data informed design with that group. Lectures are good for:
• Introduction of company wide metrics
• Overview of best practices and introduction to data informed design processes
• Overview of different methods and techniques and when to use them
However, lectures can’t be the only means of introducing a new framework to an organization. Lectures are ofen most useful for offering an introduction or overview. Follow-up discussions with active project teams at the right time in their process are essential. So, while it’s good to use an all-hands or team meeting to talk about the ways that you might leverage early stage user research, it won’t really feel concrete or useful until you can find a team that is actually at a stage in their project where they can leverage early stage research and speak directly to what techniques make sense for them at that point in time.
Project review meetings
One of the most effective meetings for sharing knowledge is a recurring project review meeting. This might be an ongoing meeting between a broad set of product managers and designers to review a number of topics around ongoing work. The key is when you invite people that may not normally work day-to-day with each other. Such meetings provide an opportunity to share what they are learning in each of their areas to the broader organization and it helps generally with building up that shared knowledge base of what
14
www.it-ebooks.info
O’Reilly Media, Inc. 4/8/2015
is working and what doesn’t work when it comes to your users. You might break this meeting into two sections:
1) Ongoing or upcoming work
2) Results from launched projects
The meeting should encourage a lot of discussion and debate about the projects that are being shared and it should feel more like a working meeting where everyone is vetting what is being presented. Presenters should leave the room feeling more confident about the approach that they are taking and perhaps have some new insights as well. To get you started here are some of the kinds of things you might present and discuss.
On ongoing or upcoming projects your discussion might include the following:
• Hypothesis
o What is the hypothesis?
o Background for what generated the hypothesis and any prior work/data/research that influenced it.
o Does it resonate and contribute to the overall product goals? More specifically, is the hypothesis valid?
• Success metrics
o What are the success metrics? How were they derived?
o Are they right ones? Will these really measure the validity of the hypothesis?
o What other things might you measure or use to measure success?
• Methodology
o What techniques are you using to collect data for this project? (e.g. user research, AB testing, etc.)
o What do you hope to learn?
o Are there other methods that could reveal better data? Would some form of data triangulation give you deeper insights?
o To what extent were methods chosen as a result of extraneous constraints (e.g., time constraints)?
o Given an infinite amount of time, what would the ideal method(s) be?
• Design
o How effective is the design at reflecting the hypothesis or variations of that hypothesis?
o How does the design support what you want to learn from this project?
Note: This meeting will be different from a design review where you might be looking at consistency within your design language, etc. and giving more pure design feedback. Those meetings are still useful, but probably a separate meeting from this one.
15
www.it-ebooks.info
O’Reilly Media, Inc. 4/8/2015
16
For projects that have launched and where you are reviewing results, discussion might revolve around the following:
• Summary of methodology
o What methods were used and why? What other methods were considered? Why were they not selected?
o How effective were the methods used at getting the insights that were sought?
• Results and analysis
o Was the hypothesis proven? Why or why not?
o What did the team learn and what can be applied to other work that is going on?
o Did the results support any other larger trends that you might have seen before?
o How do these results compare to prior work?
o What are the next steps?
By reviewing the work that is done in this manner on a regular basis, people can actively learn about what works and doesn’t work. It also encourages people to ask questions and discuss, thereby learning together and actively learning while doing. When the organization is newer to data informed design, having a meeting like this is a good way for the few who might be more comfortable with the concepts to teach those who are less familiar. When the organization is more mature at using data informed methodologies, then the discussion can stimulate further learning and perhaps even innovation in methods and analyses.
We advocate subscribing to user testing and design related blogs and services, and doing regular searched for slide-decks and white papers online. Although results fro other companies may not always be transferrable to your company, garnering an understanding of what other companies have learned can be a good way to stimulate creative ways to look at your own product(s) and your own practices. Looking to what may already be written or shared can be a great way to pre-inform or to accelerate acceptance for adopting a data informed design process in your company. For example, you might be considering creating a side navigation system, but an article from Next Web suggests side drawer navigation reduces user engagement. 2 Sharing this data back to your team should could motivate running a test on your own navigational system.
Through these techniques you can establish your own internal process of data informed design and ultimately build up your own knowledge base of things that work best for your company and your product.
2 http://thenextweb.com/dd/2014/04/08/ux-designers-side-drawer-navigation-costing-half-user-engagement/
www.it-ebooks.info
O’Reilly Media, Inc. 4/8/2015
Conclusions/Questions to ask yourself As you set this up, we also advocate you think through:
• What are the things that will be challenges for you as an individual to change?
• What are some of the things that will be challenging for your organization or team in a move to a more data aware approach to design?
• How does your organization currently communicate? o Who initiates user testing? o Who “owns” the results?
• Who do you already have in your organization that might prove helpful for you to pair with as you try to establish these practices?
• What resources including skills do you and your team currently have in place and what do you need to acquire, create and/or develop?
• What existing habits and cultural aspects are already in place that might make a good foundation upon which to build a culture of data informed design and decision making?
As we mentioned when we started this chapter, culture is really something that is unique to every organization and we would never dictate what the right solution might be for you. You may want to take some of the practical things we’ve suggested and put them in place right away. You will find that some of them will work well and endure, whereas others will not get traction or will require considerable perseverance to establish.
In keeping with our theme of data aware design, we’ve always taken an experimental approach to organizational processes too. We advise you to do the same. Try things out get feedback from “users” (which may mean teams) as to which things are effective, valuable and valued and for what reasons, and which are not. See if you can create ways to measure your success, to measure what works and why. In the case of a cultural transformation, these measures will not be as clear cut as a simple data pull of the number of users on your site to reflect “retention” or “acquisition”, but you can find other ways to measure your success. Ask yourself: How well has your “common vocabulary” taken hold? Are people using the terms you have introduced in meetings and in company correspondence in email, messaging and announcements? Are people actively asking to bring data into the design and product development cycle? Has your time spent “selling” the idea reduced? Are your outreach activities meeting with more positive responses? How much does data informed design get attributed for the success of your product and how much is it referred to by other organizations in your company?
Throughout this book we emphasise patience, persistence, resilience and tenacity. It will take a while to see the fruits of your labor paying off (or not). It can take anywhere upwards of 6 months to really see a change in the mindset of an organization take effect. The length of time depends on the organization and the business you are in. It will depend on the size of the organization. Aim for some small successes to start and build from those. Establish, share and monitor your success metrics. With time, iteration specification and allies, you’ll find that data informed design really does have a positive effect not just on how you build your products, but on your culture as well.
17
www.it-ebooks.info
O’Reilly Media, Inc. 4/8/2015
18
Summary If you really want to be effective at integrating any kind of framework into your company, you’ll want it in your DNA/Culture. It’s a hundred times easier to adopt something when the culture supports it … and that’s why the success of a data informed framework is really going to depend on the culture at your company.
If you’re interested enough in creating a lasting and deep culture around using a data aware framework for design in your organization so you can make grounded, user-centered product decisions, you’ll also invest some time in building up a culture which can support it with the right processes as well as the right people. Even if your company has the mechanics in place to embrace data as part of the decision making process, it’s equally important that you have a culture that supports it as well. With respect to data, there are a handful of tactics that we’ve seen work really well at different companies and that are really important have as part of the company DNA. Some of these tactics apply to carving out or transforming individual roles and responsibilities, some are more directed at establishing collaborations and support from recruiting groups and teams.
We advocate the following to make this possible:
• Aim for shared understanding of the value of user centered as a company universal… which requires you to
• Lay the foundations for engaged and transparent conversations about systematic data collection. You need to create a dialogue, set expectations and develop a common vocabulary ….in order to….
• Create alignment, and locate and establish allies and co-partners across company functions….and….
• Build a team through strategic hiring to reflect, amplify and grow the above…..and
• Articulate the long term benefits and the ability to do effective pattern finding across different kinds of data set by establishing a disciplined and consistent approach to leveraging data that is programmatic, flexible and not rigid …..by Creating a learning organization to ensure you perennially grow your knowledge base.
In the next chapter, we will turn to some pitfalls of uncritically overinvesting your faith in a data driven approach. Part of being data informed and data aware is knowing what can go horribly wrong.
Additional resources Content
www.it-ebooks.info