Embed Size (px)
Citation preview

Designing the Wireless Business
dr Jarosław M. JaniszewskiWroclaw University of TechnologyWroclaw, Poland

J.M. Janiszewski 2
About the Author
� Jaroslaw M. Janiszewski� obtained his PH.D. in telecommunications from the Wrocław
University of Technology in1984� He was working there as a researcher and lecturer from 1983
to 1997 � Than he joined the board the independent telecom operator,
holding the post CTO and CEO. He participated in start-up telecom operator (from 3 employees in 1997 to over 1200 in 2002)
� From 2002 he came back to Wroclaw University of Technology. � Presently, he is holding the post of a docent (lecturer). � His interests cover radiocommunications including propagation,
radio systems (mobile. Wi_Fi, WiMax …), electromagnetic compatibility and business aspects of telecommunications.
� He also works as an independent expert and advisor. � He has published more than 45 papers.

J.M. Janiszewski 3
Agenda
� Wireless data transmission� Business planning (on case study basis)
� Strategic objectives
� Marketing
� Network
� Operation
� Financial indicators
� Case study results� Summary

J.M. Janiszewski 4
Data transmission

J.M. Janiszewski 5
Wireless technology (1)
� Mobile � GSM/DCS
� HSCSD (High Speed CircuitSwitched Data)
� GPRS (GeneralPacket Radio Service)
� EDGE (Enhanced Data Rate for GSM Evolution)
64
9,6
57,6
171,2
384473
0
50
100
150
200
250
300
350
400
Prz
epły
wno
ść [k
bit/s
]
ISDN GSM faza 1/2 HSCSD GPRS EDGE

J.M. Janiszewski 6
Wireless technology (2)
� 3G� UMTS -Higher
speed� 384 kb/s� HSDPA (High
SpeedDownlinkPacketAccess) – upto 14 Mb/s
� CDMA EVDO� 2,4 – 3,1
Mb/s (comparablewith ADSL)
Source: Ibrahim A. Ghaleb

J.M. Janiszewski 7
Wireless technology (3)
� WLAN – IEEE 802.11 – Wi-Fi� Standard IEEE
802.11b – 11 Mb/s
� Standard IEEE 802.11g – 54 Mb/s
� WMAN – IEEE 802.16 – WiMax� Up to 70 Mb/s

J.M. Janiszewski 8
Wi-FI
� Wireless Fidelity� Standard IEEE 802.11b – 11
Mb/s� Standard IEEE 802.11g – 54
Mb/s
� Frequency band 2,4 GHz� Unlicensed (ISM – Industrial,
Scientific, Medical)� Limited power (in Poland:
EIRP < 100 mW)� Interferences (WiLL – eg.
MultiGainWireless, BlueTooth, microwave ovens …)
� Access to Internet (hotspots)� Growing clients� Link Wi-Fi Aliance: www.wi-fi.org
Source: Deepak Pareek,The business of Wimax, Willey, 2006

J.M. Janiszewski 9
Wi-Fi – frequency plan
� Channel bandwidth 22 MHz� Only 3 channels (1, 6, 11) do not overlap
Source: Wireless Networking in the Developing World

J.M. Janiszewski 10
Wi-Fi – pro i cons
� Advantages� Unlicensed frequency
� Cheap equipment
� Built-in in notebook, PDA
� Adapters (PCMCIA, PCI)
� Access points
� Disadvantages� Interferences
� Security
� Short ranges
� Good solution for developing markets

J.M. Janiszewski 11
Wi-Fi trends
� Wi-Fi includes wireless standards 802.11, 802.11a, 802.11b, and 802.11grepresents a small but quickly growing component of wirelesscommunications services
� The proliferation of Wi-Fi access points (hot spots), expansion of wireless corporate LANs and growth in the use of network interface cards (NICs) as standard equipment in laptops are the reasons for boost in spending
� Spending on Wi-Fi infrastructure equipment is expected to total $7 billion in 2008, a 12.6% compound annual increase
� Spending on Wi-Fi services is expected to reach $335 million by 2008� Aggregate revenue is expected to remain relatively low because most Wi-Fi
services are offered either free as a promotion or bundled with otherservices
� Wi-Fi is not expected to become a significant source of service revenue by itself. Rather, it is expected to stimulate other revenue by attracting business and by growing the equipment market
Source: Deepak Pareek,The business of Wimax, Willey, 2006

J.M. Janiszewski 12
Source: U. Lechner, Univ. Der Bundeswehre
J.M. Janiszewski 13
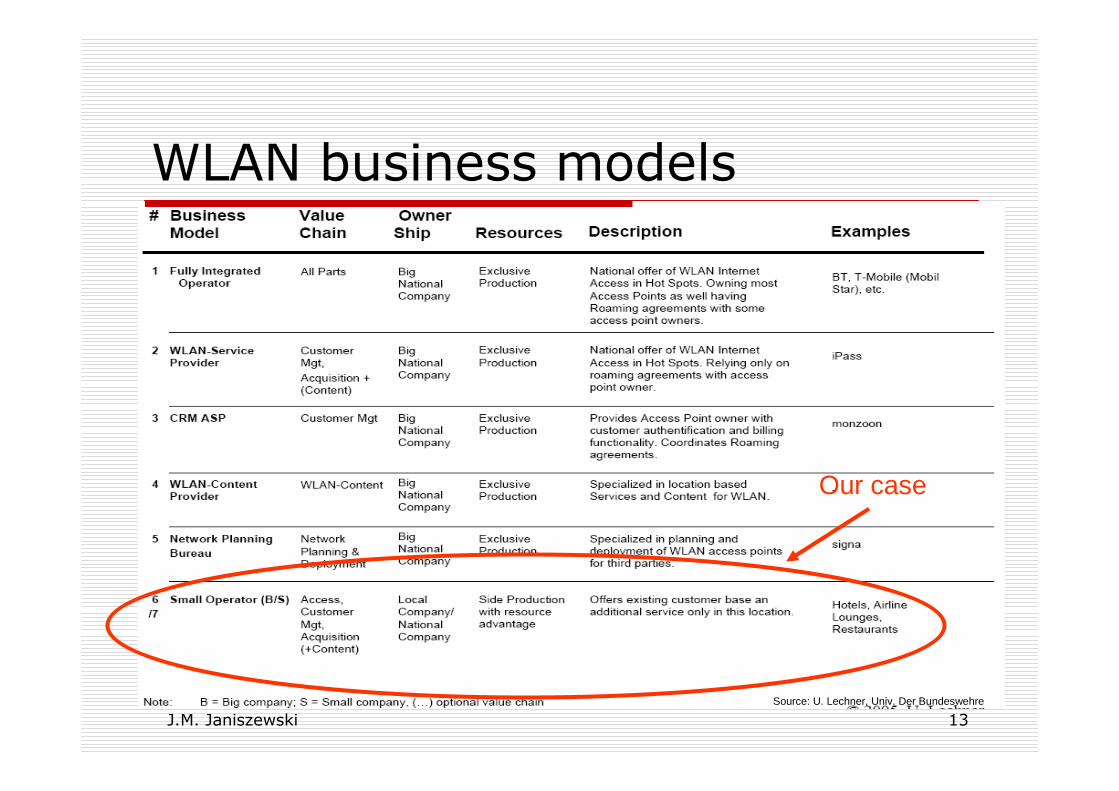
WLAN business models
Source: U. Lechner, Univ. Der Bundeswehre
Our case

J.M. Janiszewski 14
Business plan definition
A Business Plan presents the calculation of the financialindicators that enable the managers to evaluate the financial performances of an enterprise in order to take decisions
� A Business Plan summarises the results of the planning process:� the objectives to reach ( subscribers demand, sales)
� the description of all activities requested by the project
� the future revenues expected from the project
� the planned expenses (investment and operations)
� the accounting statements and the financial indicators characterising the profitability of the project

J.M. Janiszewski 15
Business planning
Source: ITU

J.M. Janiszewski 16
Strategic objectives
� To built the wireless network for rural area and small cities
� To offer the access to internet� Broadband (speed higher than ISDN - 144 kb/s)
� Good quality
� Competitive price
� Payback period less than 5 years� To organize a good business for several years for
the owners

J.M. Janiszewski 17
Case study -assumptions
� Wireless network for province in Poland� Low cost network
� Unlicensed frequencies (in Poland)
� 5,6 – 5,8 GHz (IEEE 802.11 a)
� 2,4 GHz (IEEE 802.11 b/g)
� Cheap equipment
� Basic services – Internet Access� 512 kb/s – class A
� 256 kb/s – class B
� Competitive tariffs

J.M. Janiszewski 18
Requirements for competition
� Customer segmentation� Residential� SOHO (Small Office Home Office)� SME (Small Medium Enterprise)� Company
� The best customer segment to address� The best service for customer with competitive
price� Objectives:
� maximize profitability� Reduce CAPEX and OPEX

J.M. Janiszewski 19
Business planning
Source: ITU

J.M. Janiszewski 20
Marketing planning
� Area selection� Competition analysis� Services� Tariffs� Market (population, households, purchase
power)

J.M. Janiszewski 21
Area selection
� Zielona Góra (GreenMountain) provinceexcluding capitol ofprovince� Population 89000
� Households 24000
� Competition� Polish Telecom (TP
- the biggest fixedcompany) – ADSL
� Mobile operators

J.M. Janiszewski 22
Competitive services and prices
� ADSL offered by TP� Problem with old infrastructure
� Long cooper wires, not sufficient for xDSL
� Customer relationships (monopolist for years - aversion, improper customer care, difficult contact – only by Call Center)
� Too expensive (data with voice) from 60 PLN (limited time -promotion) to 150 PLN
� Mobile operators� Too slow
� Only GPRS, from time to time EDGE
� Limited transfer� Price
� Additional modem (USB or PCMCIA to laptop)� Monthly fee 60 PLN (1GB limit)
� There is room for broadband access for less than 50 PLN
J.M. Janiszewski 23
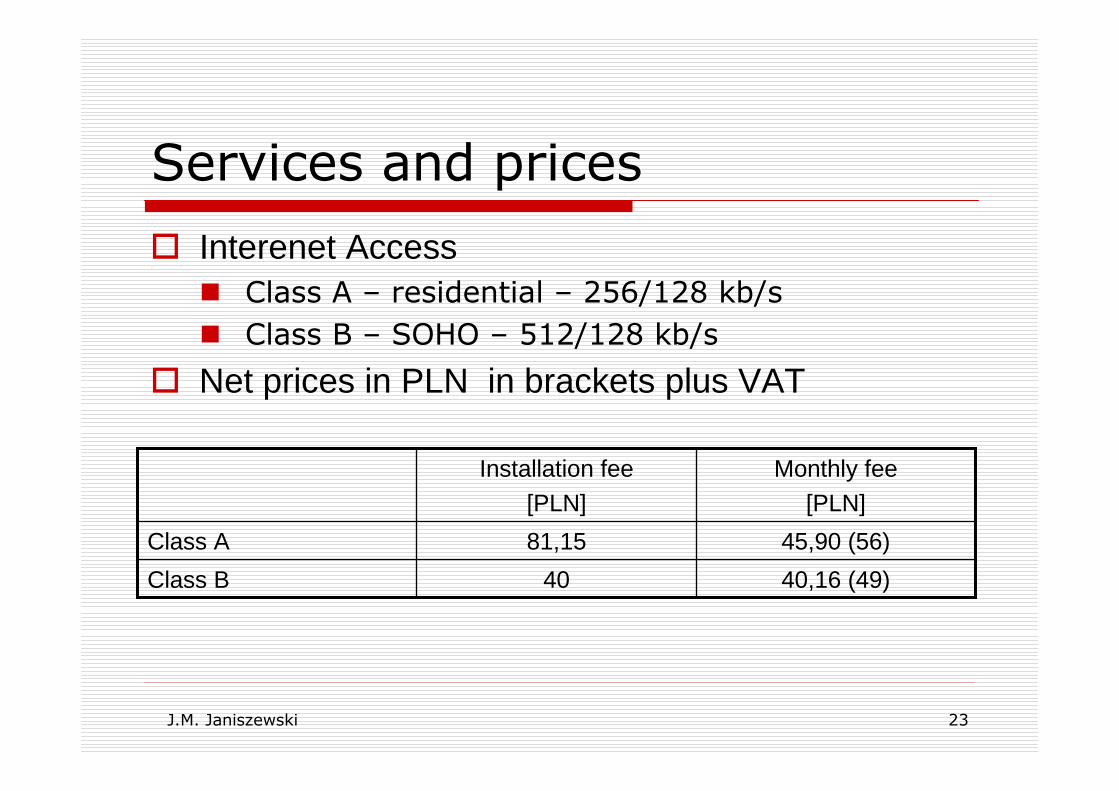
Services and prices
� Interenet Access� Class A – residential – 256/128 kb/s
� Class B – SOHO – 512/128 kb/s
� Net prices in PLN in brackets plus VAT
Monthly fee[PLN]
Installation fee[PLN]
40,16 (49)40Class B
45,90 (56)81,15Class A

J.M. Janiszewski 24
Market
� Population 89 000� Households 24 000� Computer penetration
� Poland more than 50%� In rural areas 30%
� Market share� According to experience market share is 10% of households (2400)
� 20% SOHO and 80% residential
� Number of potential clients can be predicted on the basis of the market research
� Number of villages and number of households� Case study – 1900 users (80% from 2400 in network coverage)
� (20% SOHO – 380; 80% - 1520)
� Purchase power� Acceptable price for Internet access – less than 50 PLN
� 2 years subscriber penetration target

J.M. Janiszewski 25
Business planning
Source: ITU

J.M. Janiszewski 26
Wi-Fi Network Architecture(case study)
Internet
Transmission line
Backhaul
5,6 – 5,8 GHz band
ResidentialSOHO
5,6 GHz band
2,4 GHz
2,4 GHz

J.M. Janiszewski 27
Wi-Fi Network Architecture(case study)
Internet
Transmission line
15000/800 kb/s
Backhaul (star)
5,6 – 5,8 GHz band
ResidentialSOHO
5,6 GHz band
2,4 GHz
2,4 GHz
SOHO
5,6 GHz band
2,4 GHz
2,4 GHz
Residential

J.M. Janiszewski 28
Network planning
� General concept� The choice of equipment� Planning criteria
� Coverage � Capacity� Throughput
� Data to business plan� Number of stations, locations� List and prices of equipment � Costs of operation (labour costs, power, rental
of towers)� CAPEX
J.M. Janiszewski 29
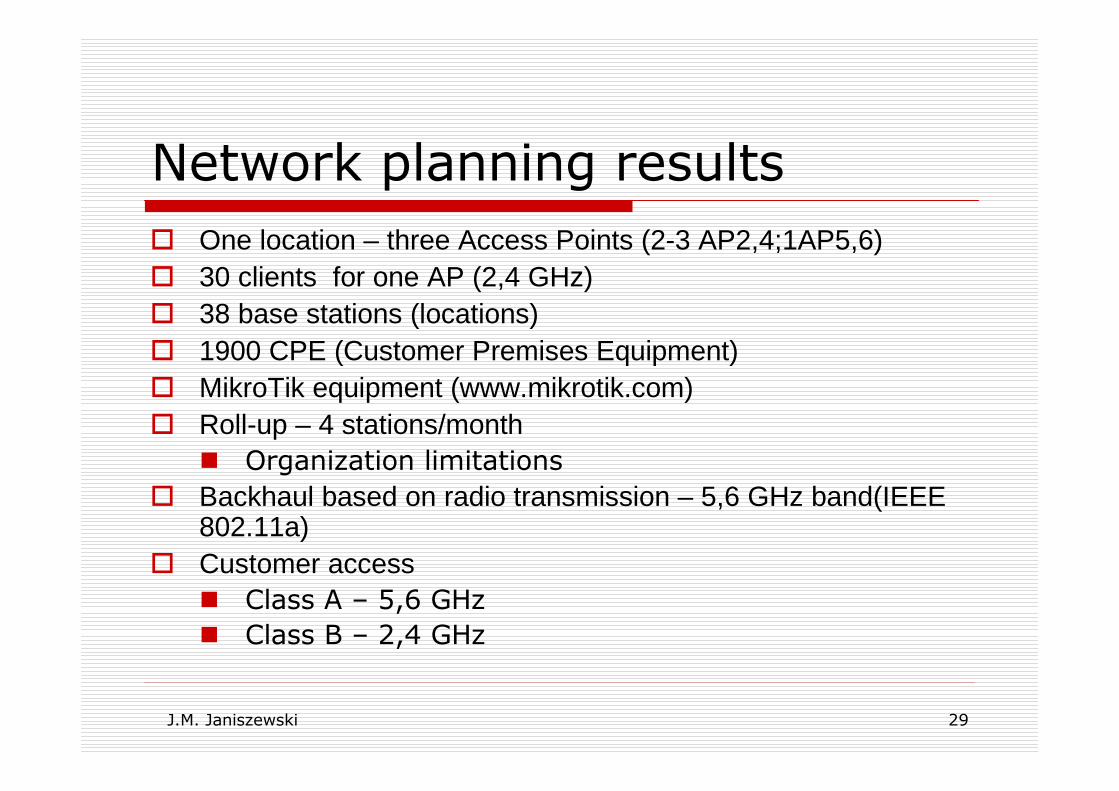
Network planning results
� One location – three Access Points (2-3 AP2,4;1AP5,6)� 30 clients for one AP (2,4 GHz)� 38 base stations (locations)� 1900 CPE (Customer Premises Equipment)� MikroTik equipment (www.mikrotik.com)� Roll-up – 4 stations/month
� Organization limitations
� Backhaul based on radio transmission – 5,6 GHz band(IEEE802.11a)
� Customer access� Class A – 5,6 GHz
� Class B – 2,4 GHz

J.M. Janiszewski 30
Business planning
Source: ITU
J.M. Janiszewski 31
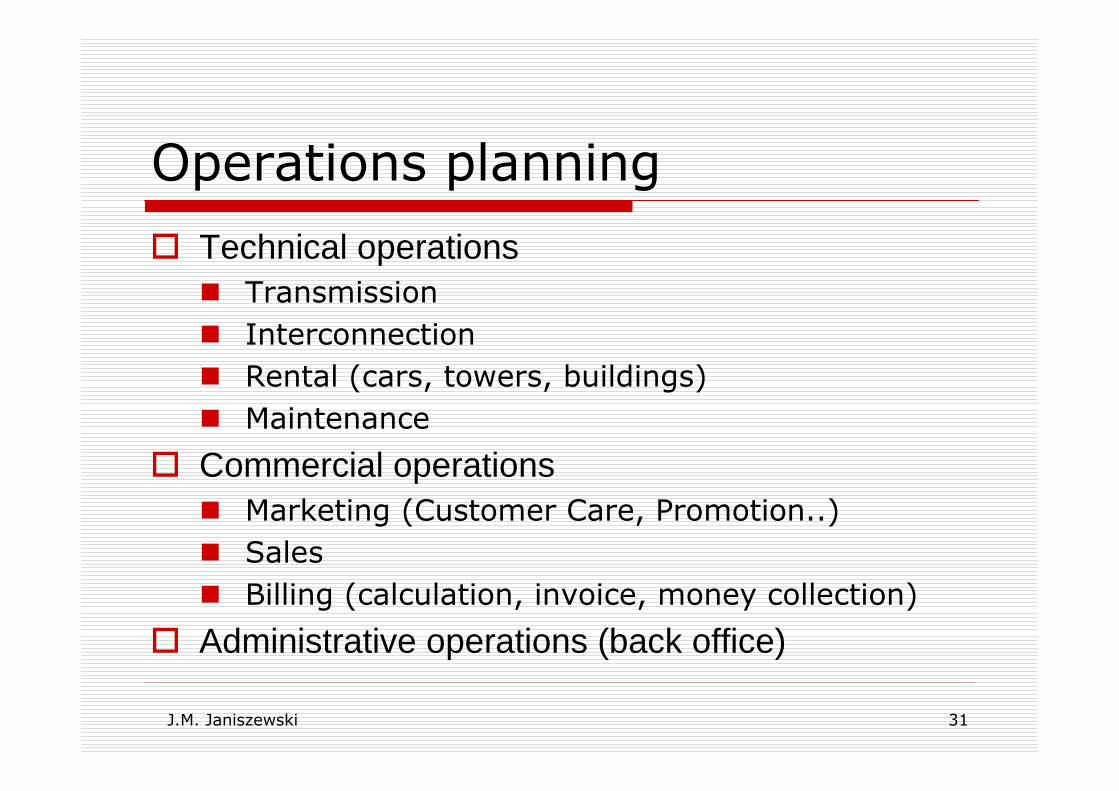
Operations planning
� Technical operations � Transmission
� Interconnection
� Rental (cars, towers, buildings)
� Maintenance
� Commercial operations� Marketing (Customer Care, Promotion..)
� Sales
� Billing (calculation, invoice, money collection)
� Administrative operations (back office)

J.M. Janiszewski 32
Human resources
� The number of workers depends on � Roll-out plan
� Number of subscribers
� The concept of back office
� Outsourcing (accounting, invoice printing and delivering…)
� Timetable of employment – the data to businessplan
� Costs of employment play important role ineconomic results
J.M. Janiszewski 33
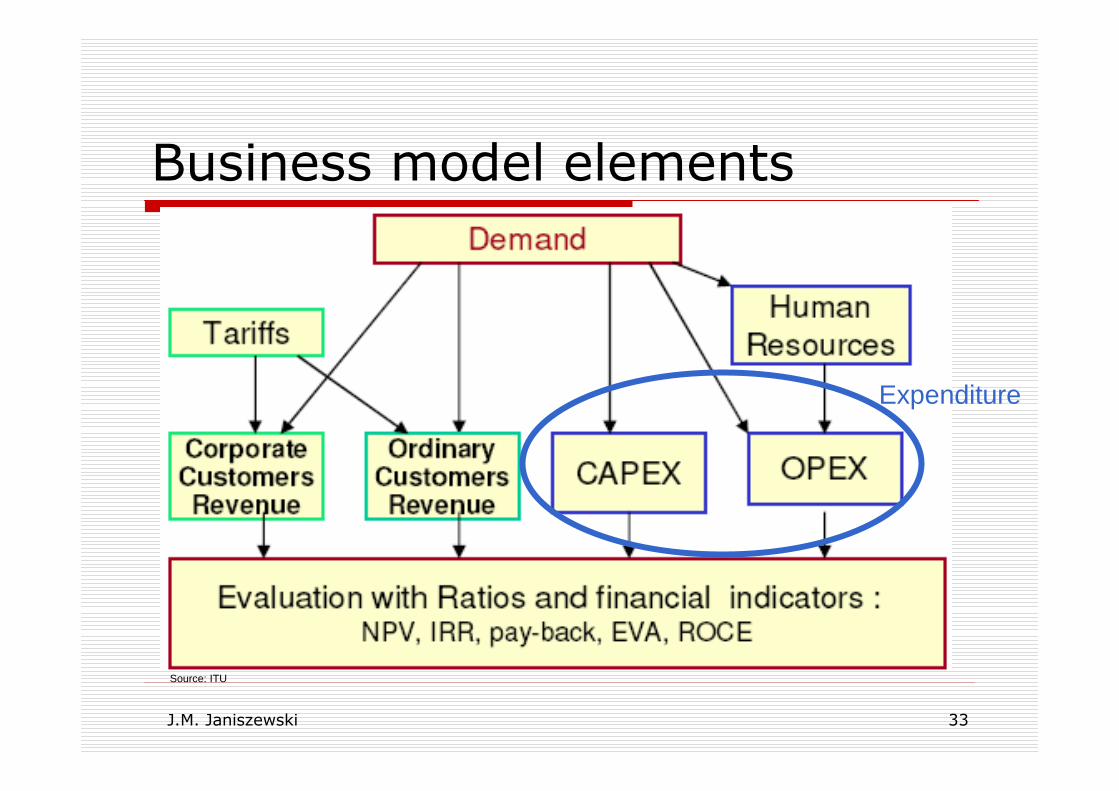
Business model elements
Source: ITU
Expenditure

J.M. Janiszewski 34
Expenditure (1)
� CAPEX – Capital Expense� Includes the investments to:
� The network infrastructure and devices
� The hardware for network management and billing (charging)
� Components� Base stations (Access Points)
� Core network equipment (backhaul)
� Site preparation (site acquisition, civil works, power, antenna system, transmission)
� Service platforms
� Spectrum (if obtained in result of the tender)
� Incured only once

J.M. Janiszewski 35
Expenditure (2)
� OPEX – Operational Expense� Includes:
� The labor costs
� Expenses for managing the network
� Expenses for marketing, sales and customer care
� Three different kinds of costs� Customer driven – terminal subsidies, dealer
commissions
� Revenue driven – costs related to generated traffic eg. interconnection, promotion
� Network driven – associated with the operation of the network eg. transmission, site rentals, operation and maintenance

J.M. Janiszewski 36
Full costs
Source: ITU

J.M. Janiszewski 37
Cash flow
Source: U. Lechner, Univ. Der Bundeswehre
Users
AP
AP
Expenditure
AP
APAP
APAP
Source: U. Lechner, Univ. Der Bundeswehre
AP
AP
AP
AP
User

J.M. Janiszewski 38
NPV – Net Present Value (1)
� Each cash inflow/outflow is discounted back to its present value. Then they are summed. Therefore
� Where� t - the time of the cash flow
� n - the total time of the project
� r - the discount rate
� Ct- the net cash flow (the amount of cash) at that point in time.
� C0- the capitial outlay at the beginning of the investment time ( t = 0 )
� Discount rate on the level between 7 – 10 % (comparable to deposit interest)

J.M. Janiszewski 39
NPV (2)
� Net Present Value (NPV) is one of the most robust financial tools available to analyze any type of investment or activity. NPV has four key elements to evaluate an investment: � Time Value of Money - NPV recognizes the concept that the
money earned today is worth more than the money earned five years from now
� Cash Flows - NPV calculates a project’s expected cash flows and includes the unique risks of obtaining those cash flows. Using NPV helps to eliminate accounting inconsistencies, since the cash flows represent the benefits of the project, not just the profits
� Risks - NPV incorporates the risks associated with a project via the expected cash flows and/or discount rate.
� Flexibility - NPV provides flexibility and depth, since the NPV equation can adjust for inflation and be used with other tools such as Scenario analysis and Monte Carlo simulation

J.M. Janiszewski 40
NPV – an example
In t0 outlay C0 = 1500; r = 10%
NPV = dCF – C0 = 1911,13 – 1500 = 411,13NPV > 0 the project should be accepted
1911,13Total
620,921000100020005
2049,043000100040004
2629,603500100045003
-2479,34-3000100040002
-909,09-1000100001
Discounted CF
(dCF=cf/(1+r)t)
Cash Flow(Incomes –
Costs)
CostsIncomesPeriod (t)

J.M. Janiszewski 41
IRR - Internal Rate of Return
� IRR is defined as the discount rate that makes the project have a zero Net Present Value (NPV)
� IRR is an alternative method of evaluating investments without estimating the discount rate
� IRR takes into account the time value of money by considering the cash flows over the lifetime of a project
� The IRR and NPV concepts are related but they are not equivalent
J.M. Janiszewski 42
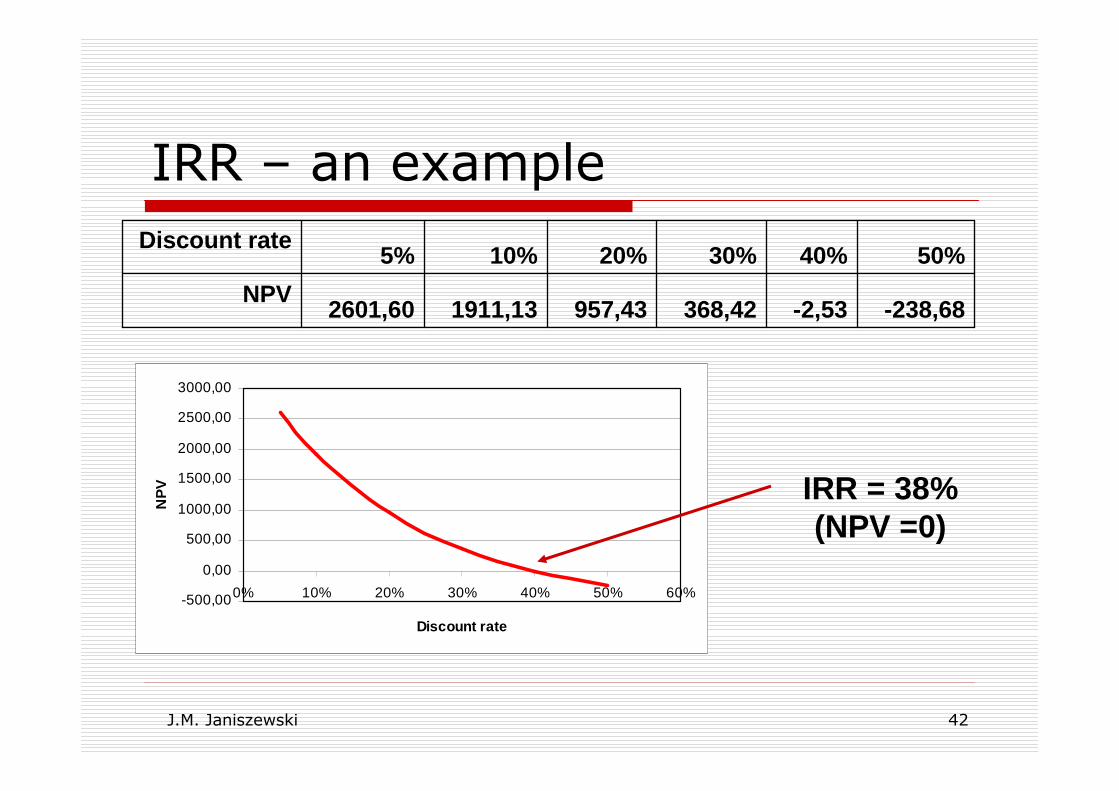
IRR – an example
-500,00
0,00
500,00
1000,00
1500,00
2000,00
2500,00
3000,00
0% 10% 20% 30% 40% 50% 60%
Discount rate
NP
V
-238,68-2,53368,42957,431911,132601,60NPV
50%40%30%20%10%5%Discount rate
IRR = 38% (NPV =0)

J.M. Janiszewski 43
Payback period
� The Payback Period is defined as the length of time required to recover an initial investment through cash flows generated by the investment
� The Payback Period lets you see the level of profitability of aninvestment in relation to time
� The shorter the time period the better the investment opportunity� In our example
350010005
250030004
-50035003
-4000-30002
-1000-10001
Cumulating CFCash Flow
(Incomes – Costs)Period (t)
Payback period is more than three years

J.M. Janiszewski 44
WLAN network – case study
� Business plan components� CAPEX
� OPEX
� Incomes
� Marketing data
J.M. Janiszewski 45
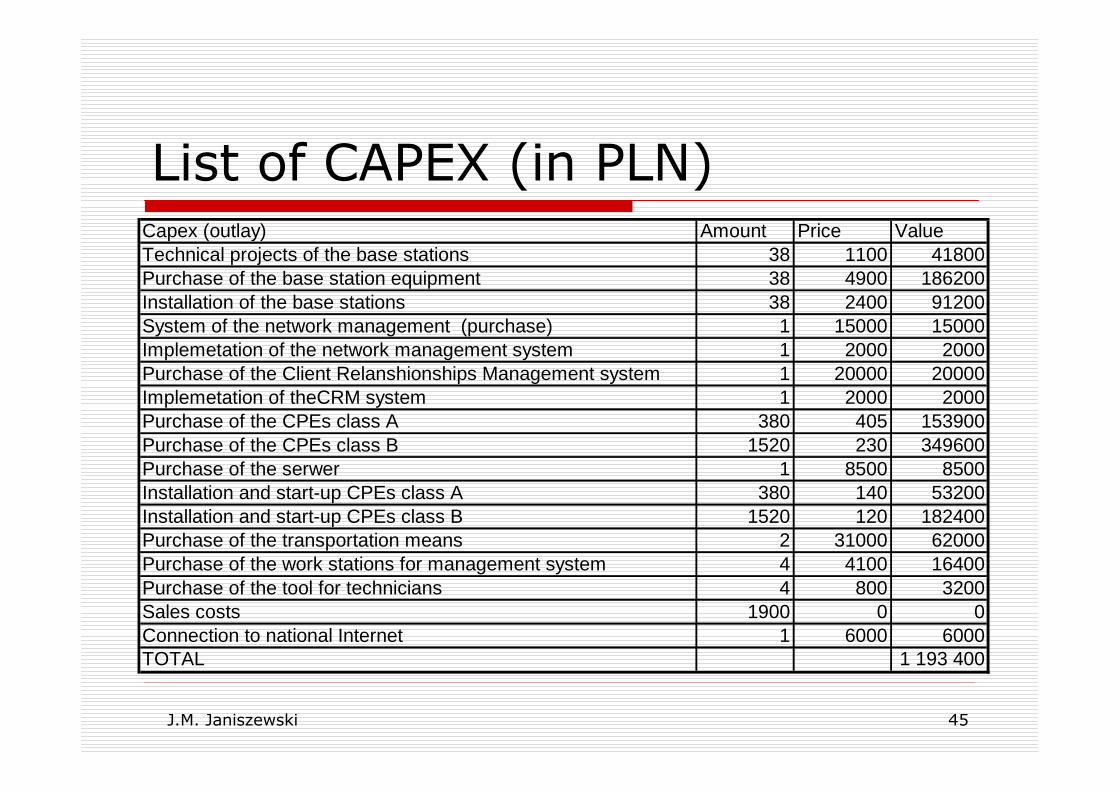
List of CAPEX (in PLN)Capex (outlay) Amount Price ValueTechnical projects of the base stations 38 1100 41800Purchase of the base station equipment 38 4900 186200Installation of the base stations 38 2400 91200System of the network management (purchase) 1 15000 15000Implemetation of the network management system 1 2000 2000Purchase of the Client Relanshionships Management system 1 20000 20000Implemetation of theCRM system 1 2000 2000Purchase of the CPEs class A 380 405 153900Purchase of the CPEs class B 1520 230 349600Purchase of the serwer 1 8500 8500Installation and start-up CPEs class A 380 140 53200Installation and start-up CPEs class B 1520 120 182400Purchase of the transportation means 2 31000 62000Purchase of the work stations for management system 4 4100 16400Purchase of the tool for technicians 4 800 3200Sales costs 1900 0 0Connection to national Internet 1 6000 6000TOTAL 1 193 400

J.M. Janiszewski 46
CAPEX timetable in 2007 [PLN]Capex (outlay) Jan Feb March April May June July August Sept Oct Nov Dec
Connections 0 0 105 105 105 110 110 115 120 120 120 120
Technical projects of the base stations 4 400 4 400 4 400 4 400 4 400 4 400 4 400 4 400 4 400 2 200
Purchase of the base station equipment 19 600 19 600 19 600 19 600 19 600 19 600 19 600 19 600 19 600 9 800
Installation of the base stations 9 600 9 600 9 600 9 600 9 600 9 600 9 600 9 600 9 600 4 800
System of the network management (purchase) 15 000
Implemetation of the network management system 2 000
Purchase of the Client Relanshionships Management system 20 000
Implemetation of theCRM system 2 000
Purchase of the CPEs class A 0 0 8 505 8 505 8 505 8 910 8 910 9 315 9 720 9 720 9 720 9 720
Purchase of the CPEs class B 0 0 19 320 19 320 19 320 20 240 20 240 21 160 22 080 22 080 22 080 22 080
Purchase of the serwer 8 500
Installation and start-up CPEs class A 0 0 2 940 2 940 2 940 3 080 3 080 3 220 3 360 3 360 3 360 3 360
Installation and start-up CPEs class B 0 0 10 080 10 080 10 080 10 560 10 560 11 040 11 520 11 520 11 520 11 520
Purchase of the transportation means 31 000 31 000
Purchase of the work stations for management system 4 100 4 100 4 100 4 100
Purchase of the tool for technicians 1 600 1 600
Sales costs
Connection to national Internet 6 000
Total 0 12 900 132 145 100 545 82 145 80 490 76 390 78 335 80 280 80 280 78 080 92 280
Last AP

J.M. Janiszewski 47
Capex timetable in 2008
� July 2008 – the end of investements
Capex (outlay) Jan Feb March April May June TotalConnections 120 130 130 130 130 130 1 900Technical projects of the base stations 0Purchase of the base station equipment 0Installation of the base stations 0System of the network management (purchase) 0Implemetation of the network management system 0Purchase of the Client Relanshionships Management s ystem 0Implemetation of theCRM system 0Purchase of the CPEs class A 9 720 10 530 10 530 10 530 10 530 10 530 62 370Purchase of the CPEs class B 22 080 23 920 23 920 23 920 23 920 23 920 141 680Purchase of the serwer 0Installation and start-up CPEs class A 3 360 3 640 3 640 3 640 3 640 3 640 21 560Installation and start-up CPEs class B 11 520 12 480 12 480 12 480 12 480 12 480 73 920Purchase of the transportation means 0Purchase of the work stations for management system 0Purchase of the tool for technicians 0Sales costs 0 0 0 0 0 0 0Connection to national Internet 0
0Total 46 680 50 570 50 570 50 570 50 570 50 570 299 530
Only CPEs
Full capacity
J.M. Janiszewski 48
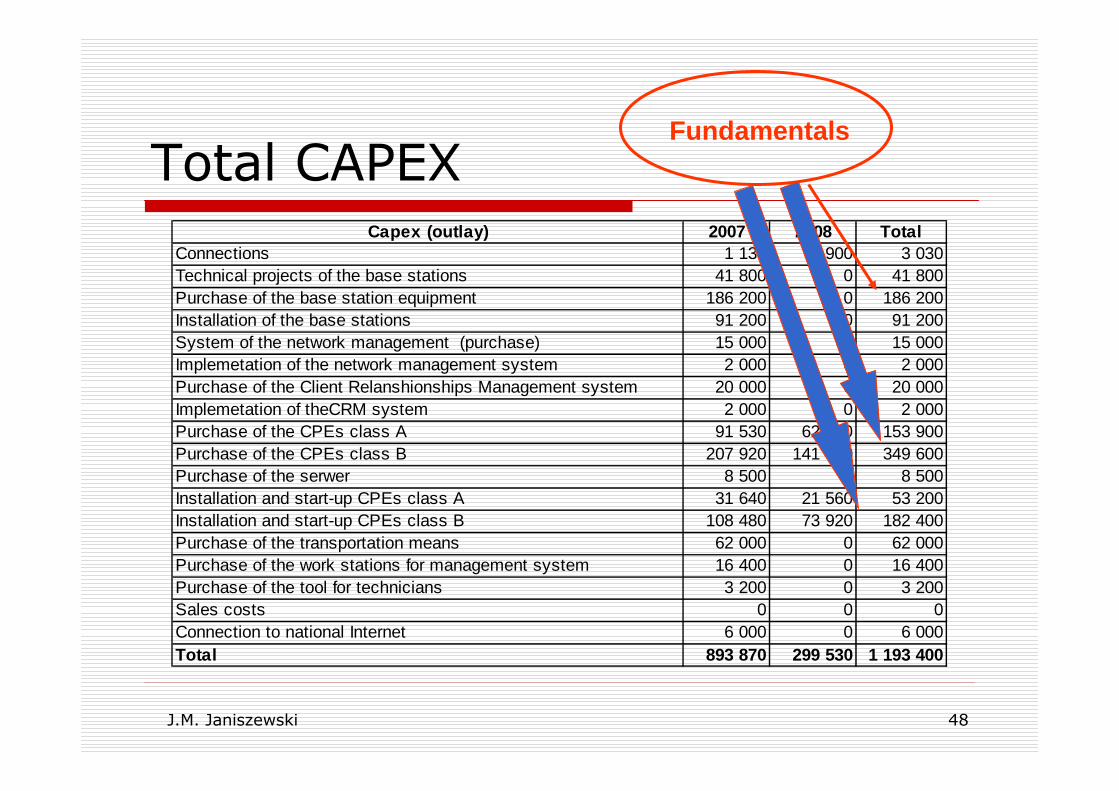
Total CAPEXCapex (outlay) 2007 2008 Total
Connections 1 130 1 900 3 030Technical projects of the base stations 41 800 0 41 800Purchase of the base station equipment 186 200 0 186 200Installation of the base stations 91 200 0 91 200System of the network management (purchase) 15 000 0 15 000Implemetation of the network management system 2 000 0 2 000Purchase of the Client Relanshionships Management system 20 000 0 20 000Implemetation of theCRM system 2 000 0 2 000Purchase of the CPEs class A 91 530 62 370 153 900Purchase of the CPEs class B 207 920 141 680 349 600Purchase of the serwer 8 500 0 8 500Installation and start-up CPEs class A 31 640 21 560 53 200Installation and start-up CPEs class B 108 480 73 920 182 400Purchase of the transportation means 62 000 0 62 000Purchase of the work stations for management system 16 400 0 16 400Purchase of the tool for technicians 3 200 0 3 200Sales costs 0 0 0Connection to national Internet 6 000 0 6 000Total 893 870 299 530 1 193 400
Fundamentals
J.M. Janiszewski 49
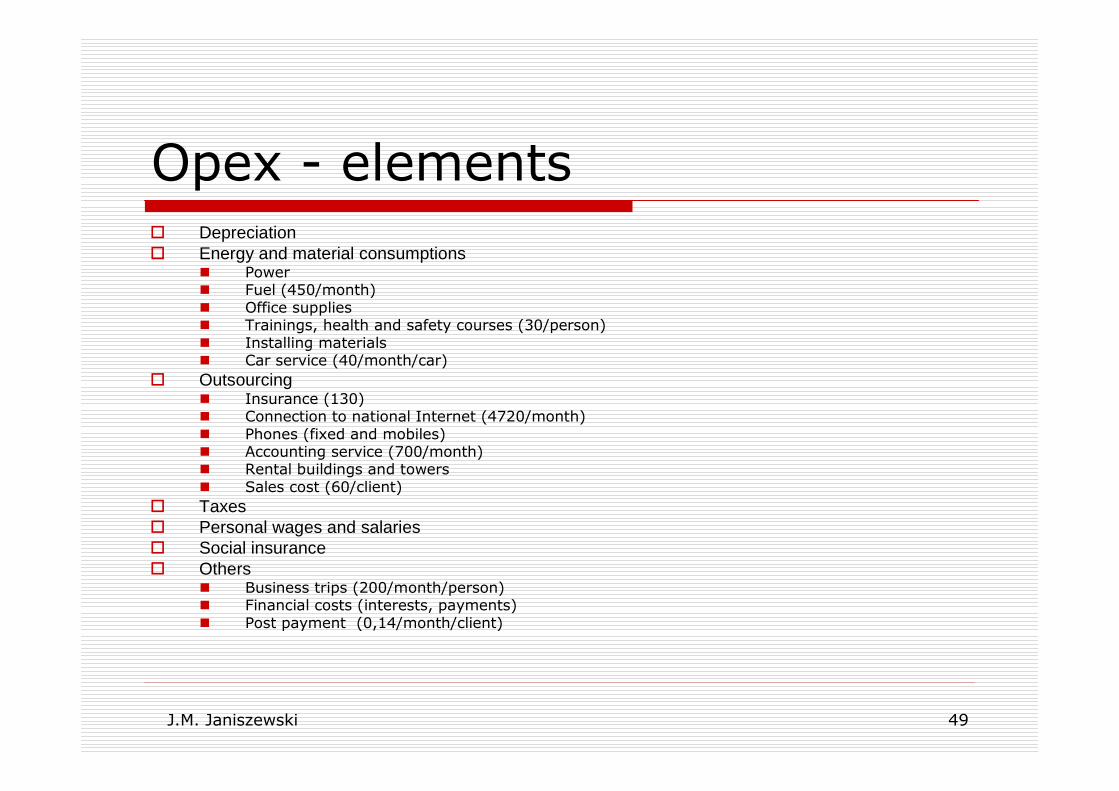
Opex - elements� Depreciation� Energy and material consumptions
� Power� Fuel (450/month)� Office supplies� Trainings, health and safety courses (30/person)� Installing materials� Car service (40/month/car)
� Outsourcing � Insurance (130)� Connection to national Internet (4720/month)� Phones (fixed and mobiles)� Accounting service (700/month)� Rental buildings and towers� Sales cost (60/client)
� Taxes � Personal wages and salaries � Social insurance � Others
� Business trips (200/month/person)� Financial costs (interests, payments)� Post payment (0,14/month/client)

J.M. Janiszewski 50
Opex in 2007 [PLN]OPEX Jan Feb March April May June July August Sept Oct Nov Dec 2007
Energy and material consumptions 0 150 2 830 2 860 2 920 2 950 2 980 3 010 3 040 3 070 3 100 3 680
Power 0 0 30 60 90 120 150 180 210 240 270 300Fuel 450 450 450 450 450 450 450 450 450 450 900
Office supplies 150 150 150 150 150 150 150 150 150 150 150Trainings, health and safety
courses 30 0 0 60 60 90 90 90 90 90 90 90 150Installing materials 0 0 2 100 2 100 2 100 2 100 2 100 2 100 2 100 2 100 2 100 2 100
Car service 40 40 40 40 40 40 40 40 40 40 80
Outsourcing 0 0 12 170 12 320 12 520 12 670 12 820 12 970 13 120 13 270 13 420 13 740Insurance 130 130 130 130 130 130 130 130 130 130 130
Connection to national Internet 4720 4 720 4 720 4 720 4 720 4 720 4 720 4 720 4 720 4 720 4 720
Phones (fixed and mobiles) 100 0 0 100 100 150 150 150 150 150 150 150 250Paking 70 70 70 70 70 70 70 70 70 70 140
Accounting service 700 700 700 700 700 700 700 700 700 700 700Rental buildings and
towers 0 0 150 300 450 600 750 900 1 050 1 200 1 350 1 500Sales cost 60 0 0 6 300 6 300 6 300 6 300 6 300 6 300 6 300 6 300 6 300 6 300
Taxes 0 0 0 0 0 0 0 0 0 0 0 0
Personal wages and salaries 0 0 3 400 3 400 5 100 5 100 5 100 5 100 5 100 5 100 5 100 8 500
Social insurance 0 0 748 748 1 122 1 122 1 122 1 122 1 122 1 122 1 122 1 870
Others 0 300 343 802 1 155 1 445 1 731 2 003 2 283 2 569 2 856 3 135Business trips 200 200 200 200 200 200 200 200 200 200 200 200
Interests 0 0 43 487 825 1 101 1 372 1 628 1 892 2 161 2 431 2 693Bank payments 100 100 100 100 100 100 100 100 100 100 100 100
Post payment 0,14 0 0 0 15 29 44 60 75 91 108 125 141TOTAL 0 450 19 491 20 130 22 817 23 287 23 753 24 205 24 665 25 131 25 598 30 925 240 452

J.M. Janiszewski 51
Incomes in 2007 [PLN], monthly
� March – start operation� Total incomes in 2007 = 257 322 PLN� Client numbers 1010
Jan Feb March April May June July August Sept Oct Non Dec Total
Connections number 105 105 105 110 110 115 120 120 120 120
Incomes - installation fee class A 1 704 1 704 1 704 1 785 1 785 1 866 1 948 1 948 1 948 1 948 18 340
Incomes - montly fee class A 964 1 928 2 892 3 902 4 911 5 967 7 069 8 170 9 272 45 074
Incomes - installation fee class B 3 360 3 360 3 360 3 520 3 520 3 680 3 840 3 840 3 840 3 840 36 160
Incomes - montly fee class B 3 373 6 747 10 120 13 654 17 188 20 883 24 739 28 594 32 449 157 748
Actual clients number 105 210 315 425 535 650 770 890 1 010
Total income 5 064 9 401 13 739 18 317 22 861 27 646 32 638 37 595 42 552 47 509 257 322
Accumulated total income 5 064 14 466 28 204 46 522 69 383 97 029 129 667 167 262 209 814 257 322

J.M. Janiszewski 52
Results
Year 2007 2008 2009 2010 2011 2012Clients 1130 770Income 257 322 866 602 941 822 941 822 941 822 941 822Opex 240 452 363 378 322 874 314 525 306 175 297 826Profit Margin 16 871 503 224 618 949 627 298 635 647 643 996Capex 893 870 299 530CF -876 999 203 694 618 949 627 298 635 647 643 996Cumulated CF -876 999 -673 305 -54 357 572 941 1 208 588 1 852 584dCF (10%)= -876 999 185 176 511 528 471 298 434 155 399 871
� NPV (sum of dCF) = 1 125 029� IRR = 45%� Payback in 4th year
NPV(discount rate)
-200 000
0
200 000
400 000
600 000
800 000
1 000 000
1 200 000
0% 10% 20% 30% 40% 50% 60%
Discount rateN
PV
[PLN
] IRR = 45%
J.M. Janiszewski 53
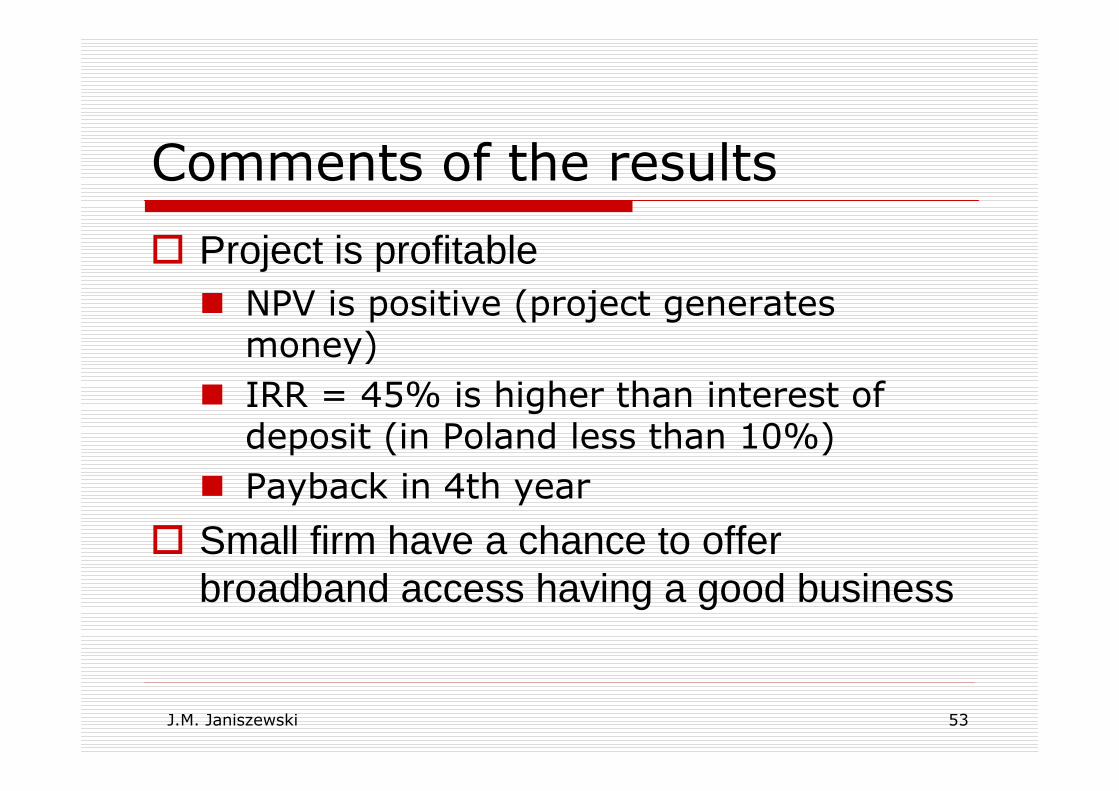
Comments of the results
� Project is profitable� NPV is positive (project generates
money)
� IRR = 45% is higher than interest ofdeposit (in Poland less than 10%)
� Payback in 4th year
� Small firm have a chance to offerbroadband access having a good business
J.M. Janiszewski 54
Risk elements
� Network growth� Many administrative procedures (necessary
permittion for base stations…)
� Number of clients� on schedule with plans (influence on incomes)
� Tariffs� Price erosion (market liberalization)
� Competition

J.M. Janiszewski 55
Risks analysis
� Vulnerability analysis on market changes (our share in), prices, network development
� SWOT (Strength, Weakness, Opportunities, Threats)
� Funds� Owner capital
� Dept (credit, loan)

J.M. Janiszewski 56
Summary (1)
� Idea of designing the wireless business presented� Described of the elements of the business plan
� Skipped details
� Case� Small company
� Network for province in Poland
� Service – Interent access
� Business plan

J.M. Janiszewski 57
Summary (2)
� Reached objectives� It is possible to establish WLAN business
– small company
� Broadband access offer
� Good economic results of the project
� IRR 45%
� Acceptable payback period
� Positive cash flow


![MikroTik RouterOS™ v3.0 Reference Manualmikrotik.axiom-pro.ru/library/mtman/refman3.0.pdf[admin@MikroTik] > [admin@MikroTik] ip address> export file=address [admin@MikroTik] ip address>](https://img.pdfslide.us/doc/110x75/5fbbeede1da86f5a0b15f2b4/mikrotik-routerosa-v30-reference-adminmikrotik-adminmikrotik-ip-address.jpg)