Embed Size (px)
Citation preview
Designing the new PrEmo An empirical research on how to improve the emotion measuring tool
David Güiza Caicedo
Design for interaction MSc. Student Delft University of Technology (TU Delft) – 2009 In collaboration with Dr. P.M.A. Desmet
Associate Professor - Faculty of Industrial Design Engineering Delft University of Technology
2 | P a g e
Table of Contents Introduction ............................................................................................................................................ 3
PrEmo and the goal of the project .......................................................................................................... 3
Literature Research ................................................................................................................................. 4
Self Assessment Mannequin - SAM (Lang, 1985) ............................................................................... 4
Emoti*Scape (Ipsos-ASI) ..................................................................................................................... 5
Geneva Emotions Wheel (Scherer, 2005) ........................................................................................... 5
Relevance ............................................................................................................................................ 6
Designing the new PrEmo ....................................................................................................................... 6
Selection of Emotions ......................................................................................................................... 6
New character and animations ........................................................................................................... 8
Alternative Interfaces ......................................................................................................................... 9
Graphical User Interface ..................................................................................................................... 9
General improvements ................................................................................................................... 9
Click-and-Drag interface ................................................................................................................... 10
Single-Click interface ......................................................................................................................... 11
Branding ............................................................................................................................................ 12
Testing the New PrEmo......................................................................................................................... 12
Goal ................................................................................................................................................... 12
Test Set-up ........................................................................................................................................ 13
Test Results ....................................................................................................................................... 16
Conclusions ........................................................................................................................................... 20
Further Recommendations: .................................................................................................................. 21
References ............................................................................................................................................ 22
Appendices ............................................................................................................................................ 23
Appendix A - Translations of Emotions ............................................................................................. 24
Appendix B - Validation Questionnaire Example .............................................................................. 25
Appendix C - Contacts of Lenticular Production Companies ............................................................ 27
Appendix D - Online Questionnaire .................................................................................................. 28
Appendix E - Online test results ........................................................................................................ 29
Appendix F - Online test Comments ................................................................................................. 35
3 | P a g e
Introduction After being a subject of psychological, social and even anthropological studies for many years, the nature of emotions and their measurement has become a popular target for research in recent times, in fields such as advertising and design.
The consumer world is starting to realize that the human is by nature an emotional being, and that it is important to start addressing this in many different levels in order to for example improve sales, develop better and more personal products and in general to evaluate the effect that all these products and services may have in our life.
Conferences and similar events that have been held around the world (e.g. Desmet & Hekkert, 2002, and Overbeeke & Hekkert, 1999), and the growing number of studies being conducted by experts from fields other than the social sciences, in search for better and more reliable ways to measure emotions, are just but a mere reflection of the fact that emotions are gaining an important spot in other fields as well.
This project dealt with the improvement of one such tool (PrEmo – Desmet, 2003) in an attempt to quantify and qualify emotions in a more reliable manner.
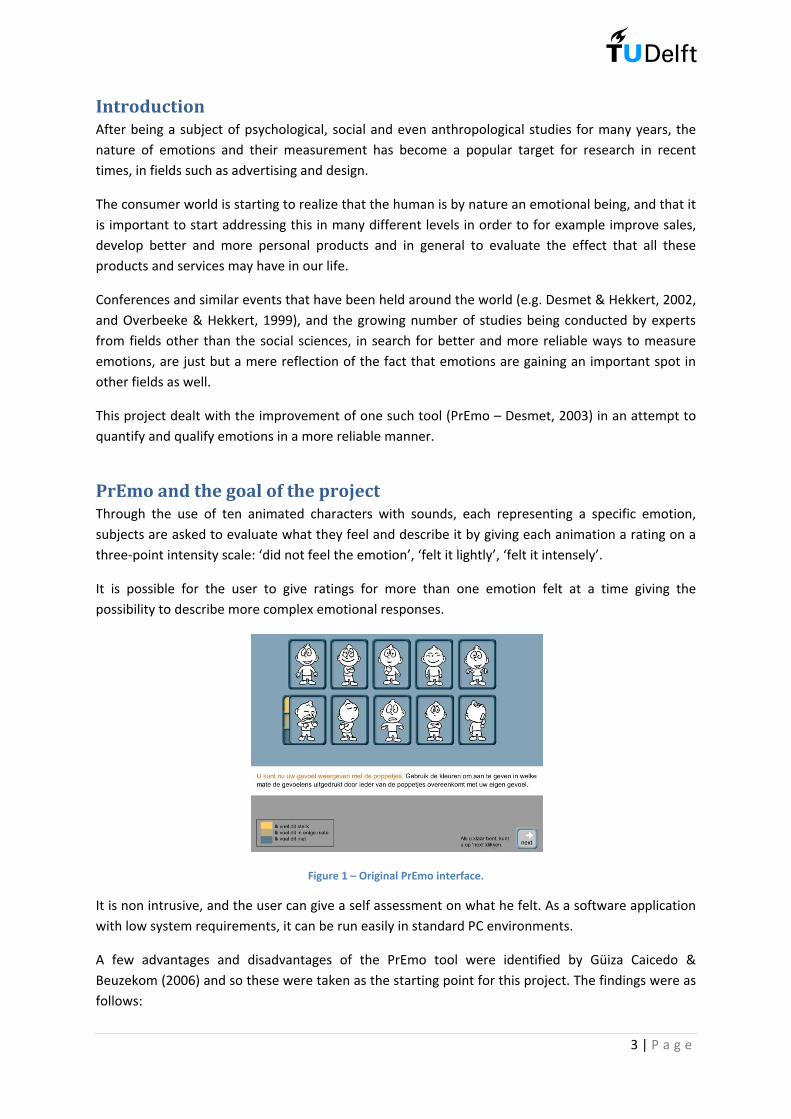
PrEmo and the goal of the project Through the use of ten animated characters with sounds, each representing a specific emotion, subjects are asked to evaluate what they feel and describe it by giving each animation a rating on a three-point intensity scale: ‘did not feel the emotion’, ‘felt it lightly’, ‘felt it intensely’.
It is possible for the user to give ratings for more than one emotion felt at a time giving the possibility to describe more complex emotional responses.
Figure 1 – Original PrEmo interface.
It is non intrusive, and the user can give a self assessment on what he felt. As a software application with low system requirements, it can be run easily in standard PC environments.
A few advantages and disadvantages of the PrEmo tool were identified by Güiza Caicedo & Beuzekom (2006) and so these were taken as the starting point for this project. The findings were as follows:
4 | P a g e
Strong Points: - In general, the use of animations and sounds works as a good support for the representation
of emotions. - The pictorial approach makes it ideal for cross-cultural environments and assessment of
illiterate subjects. This was proven by the fact that for the fieldwork (conducted in Dutch) only the instructions had to be translated into Dutch before the tool could be used.
Weak Points: - The limited amount of emotions may constrain the subject from fully expressing what he
feels. - The 3-point scale is a bit insufficient for the differentiation of experienced emotional
intensities; especially for a field in which subtle reactions are to be expected. - Some of the animations are not completely clear to the user (the one representing “desire”
for example was mentioned various times by the users as being incomprehensible).
The goal of this project is to improve the PrEmo tool in order to have a more reliable measurement of the emotions experienced by the user. This will be tackled both in terms of understanding of the tool and usability of it
Literature Research It was decided that the best way of starting the project would be to do some literature research to try and find similar tools that could be used as reference points as to how other tools approach the weaknesses found on PrEmo (if at all), and how these could serve as inspiration for the improvements needed.
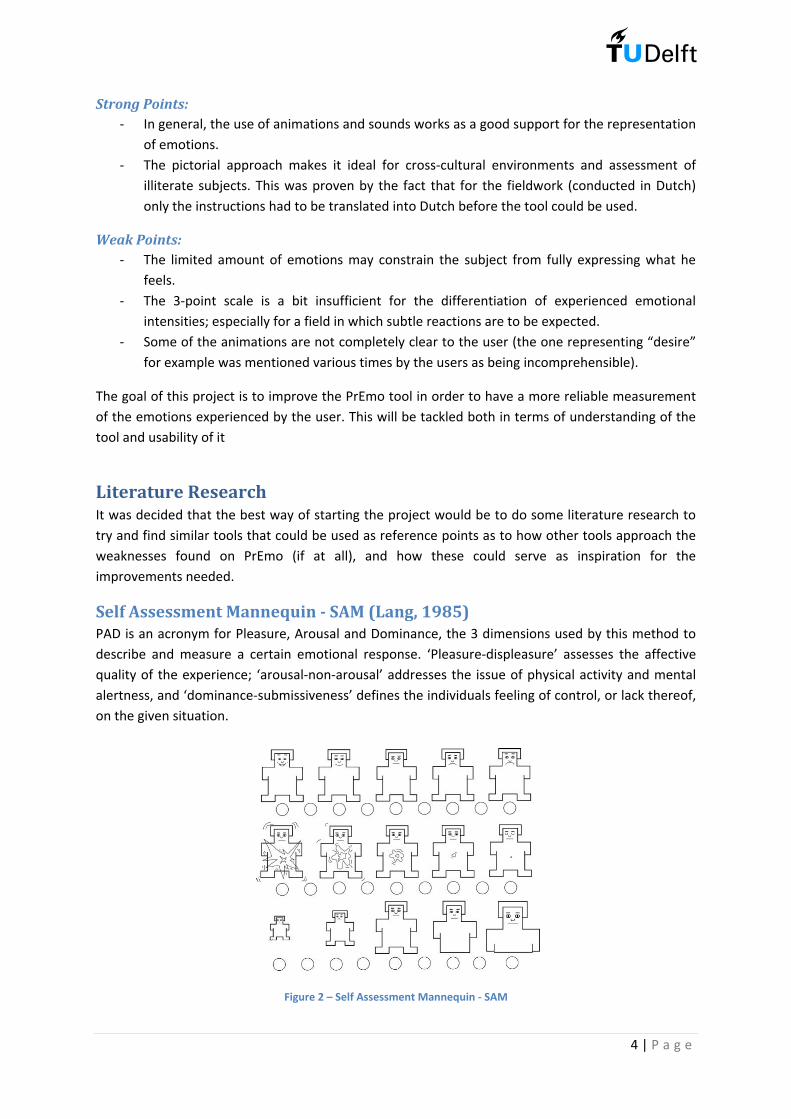
Self Assessment Mannequin - SAM (Lang, 1985) PAD is an acronym for Pleasure, Arousal and Dominance, the 3 dimensions used by this method to describe and measure a certain emotional response. ‘Pleasure-displeasure’ assesses the affective quality of the experience; ‘arousal-non-arousal’ addresses the issue of physical activity and mental alertness, and ‘dominance-submissiveness’ defines the individuals feeling of control, or lack thereof, on the given situation.
Figure 2 – Self Assessment Mannequin - SAM
5 | P a g e
SAM is a graphical depiction of the PAD dimensions developed by Lang as an alternative to the verbal self report measures. It represents each dimension with a graphical character and a nine-point scale from which the user can choose what he feels.
The tool has been used extensively in the field of advertising and due to its graphical nature it can be used in a cross-cultural environment. Specific emotions are not measured or differentiated with this approach, but rather the intensity of the different underlying dimensions.
The pictorial approach of this tool makes it ideal to be used in a cross-cultural environment, and with illiterate subjects (such as children), and as it can easily be distributed as printed material to be filled in by hand, it has very low technical requirements for its implementation.
Nonetheless, the inability to measure differentiated emotions is a very important weak point that makes it unsuitable for more elaborate measurements.
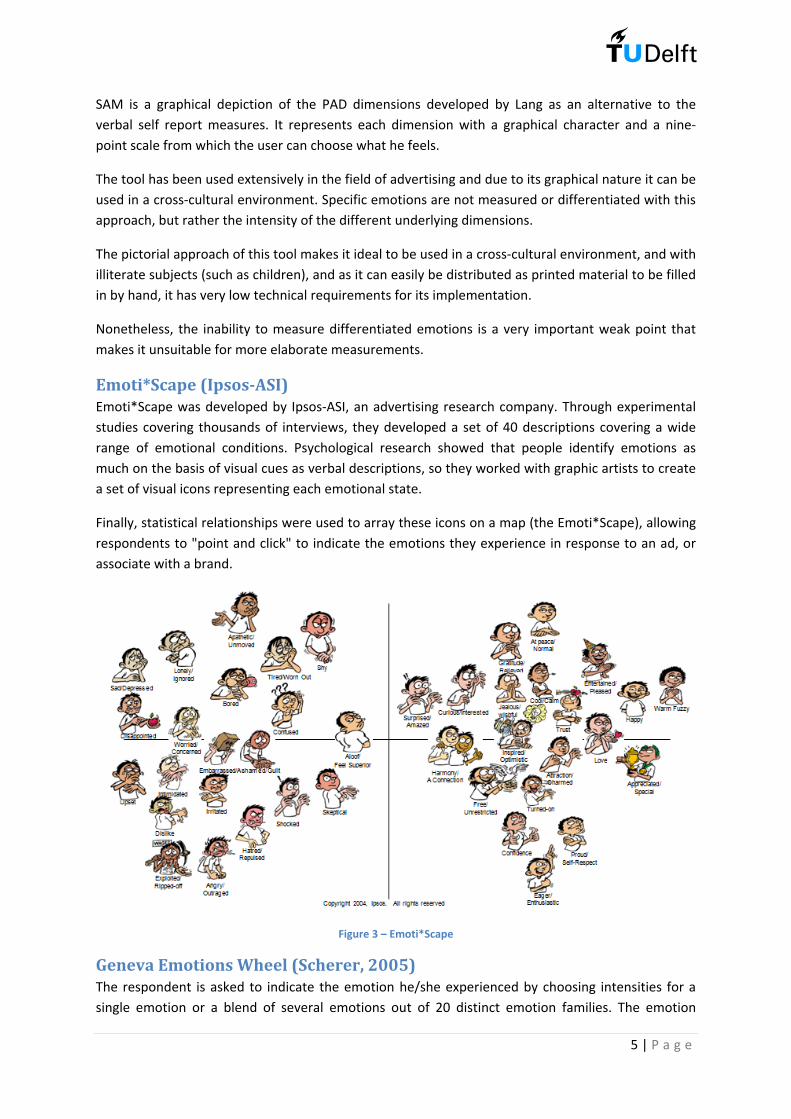
Emoti*Scape (Ipsos-ASI) Emoti*Scape was developed by Ipsos-ASI, an advertising research company. Through experimental studies covering thousands of interviews, they developed a set of 40 descriptions covering a wide range of emotional conditions. Psychological research showed that people identify emotions as much on the basis of visual cues as verbal descriptions, so they worked with graphic artists to create a set of visual icons representing each emotional state.
Finally, statistical relationships were used to array these icons on a map (the Emoti*Scape), allowing respondents to "point and click" to indicate the emotions they experience in response to an ad, or associate with a brand.
Figure 3 – Emoti*Scape
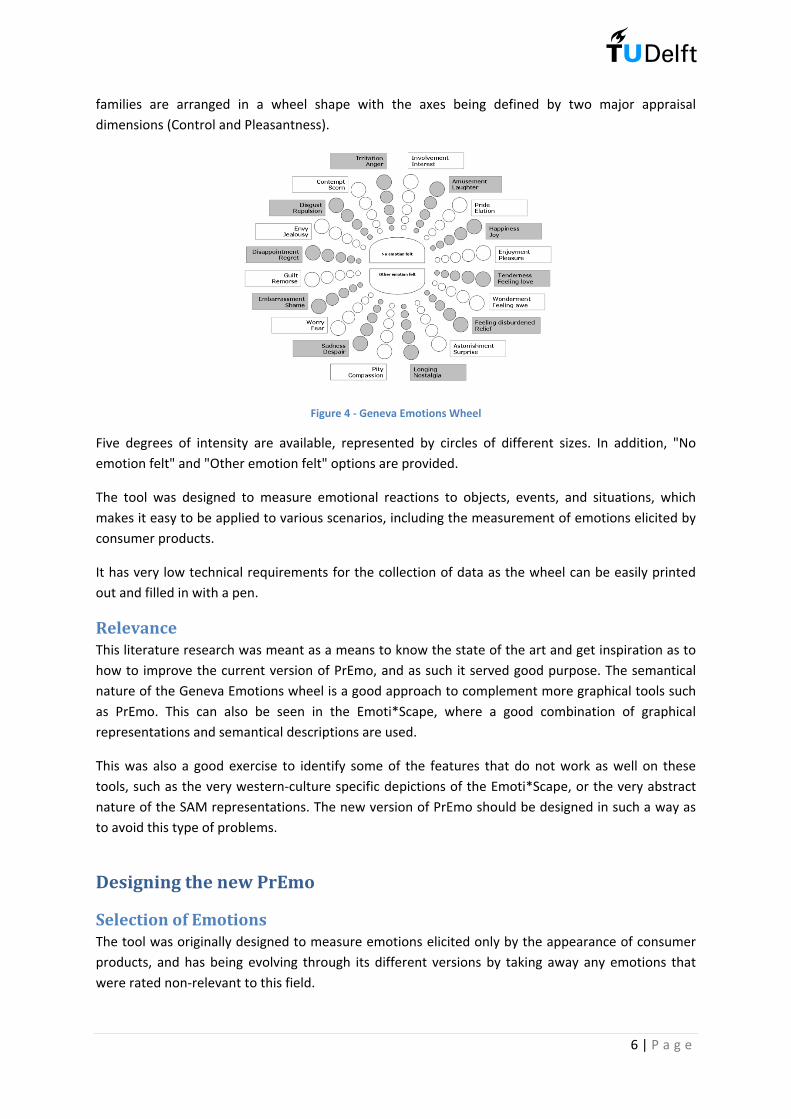
Geneva Emotions Wheel (Scherer, 2005) The respondent is asked to indicate the emotion he/she experienced by choosing intensities for a single emotion or a blend of several emotions out of 20 distinct emotion families. The emotion
6 | P a g e
families are arranged in a wheel shape with the axes being defined by two major appraisal dimensions (Control and Pleasantness).
Figure 4 - Geneva Emotions Wheel
Five degrees of intensity are available, represented by circles of different sizes. In addition, "No emotion felt" and "Other emotion felt" options are provided.
The tool was designed to measure emotional reactions to objects, events, and situations, which makes it easy to be applied to various scenarios, including the measurement of emotions elicited by consumer products.
It has very low technical requirements for the collection of data as the wheel can be easily printed out and filled in with a pen.
Relevance This literature research was meant as a means to know the state of the art and get inspiration as to how to improve the current version of PrEmo, and as such it served good purpose. The semantical nature of the Geneva Emotions wheel is a good approach to complement more graphical tools such as PrEmo. This can also be seen in the Emoti*Scape, where a good combination of graphical representations and semantical descriptions are used.
This was also a good exercise to identify some of the features that do not work as well on these tools, such as the very western-culture specific depictions of the Emoti*Scape, or the very abstract nature of the SAM representations. The new version of PrEmo should be designed in such a way as to avoid this type of problems.
Designing the new PrEmo
Selection of Emotions The tool was originally designed to measure emotions elicited only by the appearance of consumer products, and has being evolving through its different versions by taking away any emotions that were rated non-relevant to this field.
7 | P a g e
Nevertheless, during Güiza Caicedo and Beuzekom’s study (2006), which dealt not only with appearance of products but also with their use, it was found that “The limited amount of emotions [in the original PrEmo] may constrain the subject from fully expressing what he feels”.
It was therefore decided to take a closer look back at the selection of emotions used on the current tool and the criteria for their selection, and a new selection was made which would more accordingly fit the requirements of the tool for a broader range of emotional reactions.
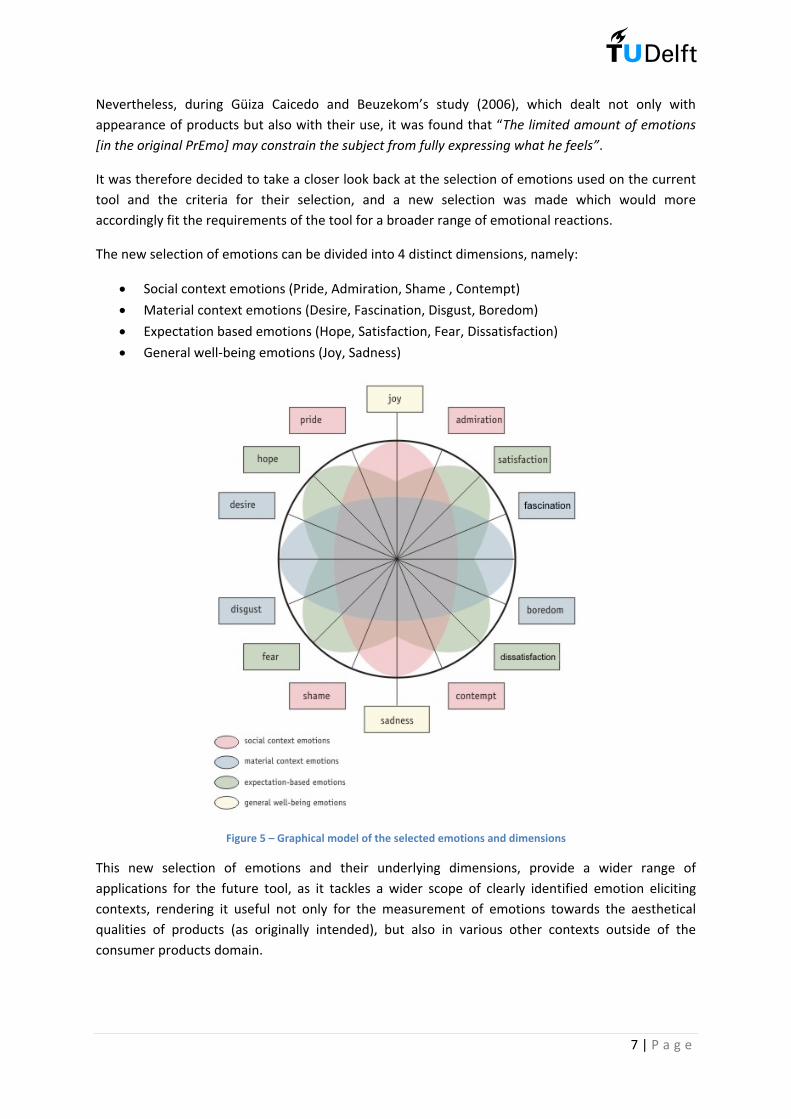
The new selection of emotions can be divided into 4 distinct dimensions, namely:
• Social context emotions (Pride, Admiration, Shame , Contempt)
• Material context emotions (Desire, Fascination, Disgust, Boredom)
• Expectation based emotions (Hope, Satisfaction, Fear, Dissatisfaction)
• General well-being emotions (Joy, Sadness)
Figure 5 – Graphical model of the selected emotions and dimensions
This new selection of emotions and their underlying dimensions, provide a wider range of applications for the future tool, as it tackles a wider scope of clearly identified emotion eliciting contexts, rendering it useful not only for the measurement of emotions towards the aesthetical qualities of products (as originally intended), but also in various other contexts outside of the consumer products domain.
8 | P a g e
New character and animations Having new emotions for the tool also meant that new animations had to be created to represent the ones which were not previously present. By studying the current animations more closely, it was identified that the lower part of the body does not play a very important role in successfully depicting each emotion even though it takes close to one fourth of the space of each animation. The original character was also identified as having a childish look.
Due to these reasons, it was decided that the best approach was to create new animations completely from scratch in order to have a set of graphics with a unique and coherent style, and with a brand new character which could have a more neutral look.
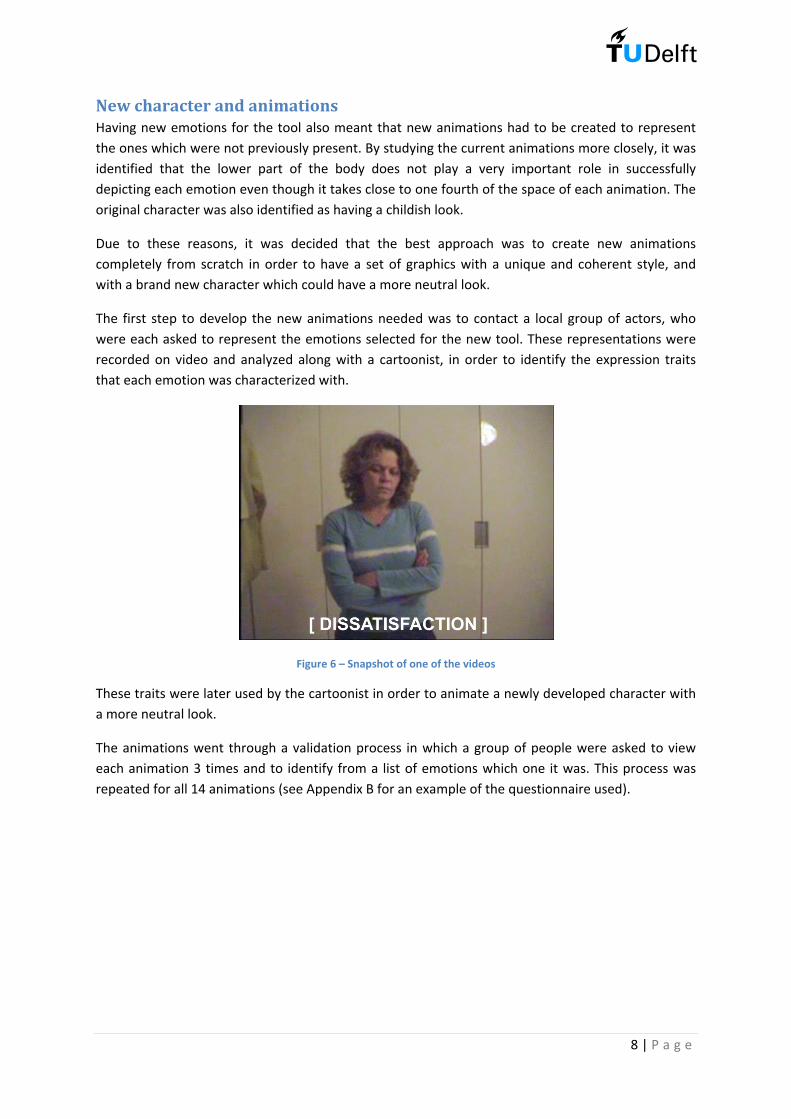
The first step to develop the new animations needed was to contact a local group of actors, who were each asked to represent the emotions selected for the new tool. These representations were recorded on video and analyzed along with a cartoonist, in order to identify the expression traits that each emotion was characterized with.
Figure 6 – Snapshot of one of the videos
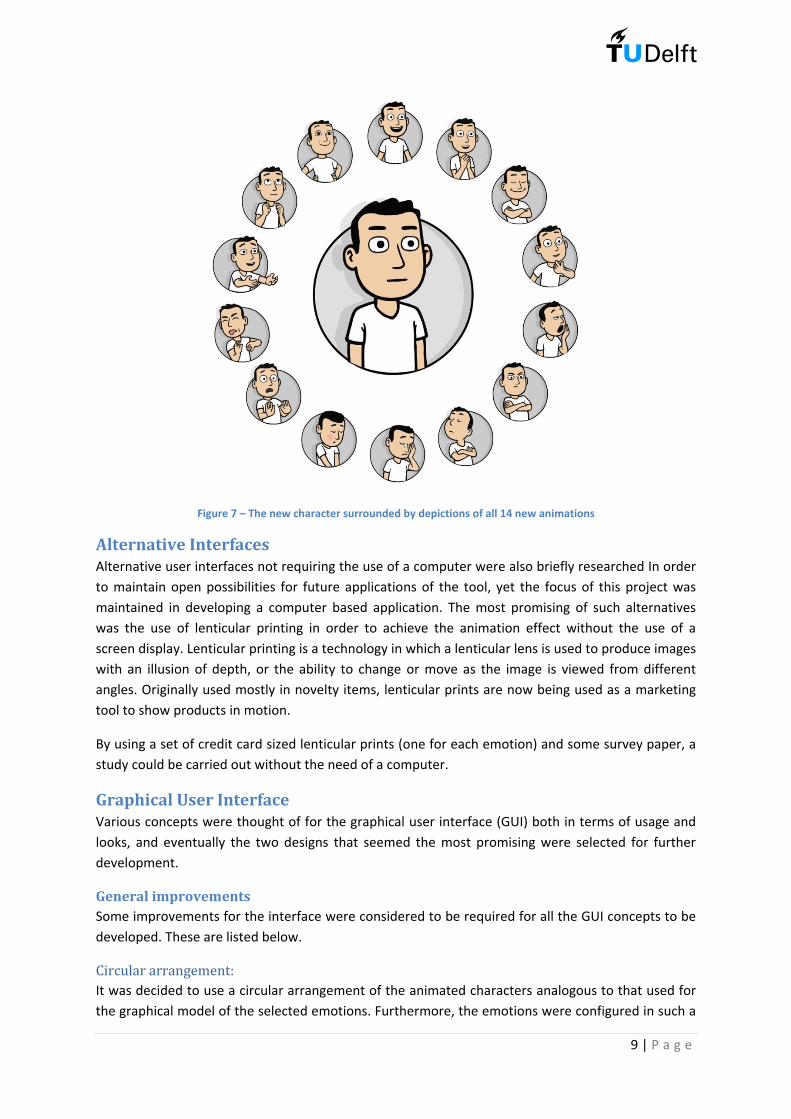
These traits were later used by the cartoonist in order to animate a newly developed character with a more neutral look.
The animations went through a validation process in which a group of people were asked to view each animation 3 times and to identify from a list of emotions which one it was. This process was repeated for all 14 animations (see Appendix B for an example of the questionnaire used).
9 | P a g e
Figure 7 – The new character surrounded by depictions of all 14 new animations
Alternative Interfaces Alternative user interfaces not requiring the use of a computer were also briefly researched In order to maintain open possibilities for future applications of the tool, yet the focus of this project was maintained in developing a computer based application. The most promising of such alternatives was the use of lenticular printing in order to achieve the animation effect without the use of a screen display. Lenticular printing is a technology in which a lenticular lens is used to produce images with an illusion of depth, or the ability to change or move as the image is viewed from different angles. Originally used mostly in novelty items, lenticular prints are now being used as a marketing tool to show products in motion.
By using a set of credit card sized lenticular prints (one for each emotion) and some survey paper, a study could be carried out without the need of a computer.
Graphical User Interface Various concepts were thought of for the graphical user interface (GUI) both in terms of usage and looks, and eventually the two designs that seemed the most promising were selected for further development.
General improvements Some improvements for the interface were considered to be required for all the GUI concepts to be developed. These are listed below. Circular arrangement: It was decided to use a circular arrangement of the animated characters analogous to that used for the graphical model of the selected emotions. Furthermore, the emotions were configured in such a
10 | P a g e
way that positive emotions would be on the upper half and their negative counterpart in mirrored positions in the lower half, in order to give a better overview of the dimensions involved. This means that opposite emotions (such as pride and shame) will be placed on the circular pattern in positions mirrored by the horizontal. This circular arrangement also gives a more cohesive look to the tool. Textual description of emotions: From the results seen by Güiza Caicedo and Beuzekom, which suggest that complementing the graphical representation of each emotion with a textual description of it might improve their understanding, it was decided to add the possibility to see such a textual description of the emotions. However this description would not be visible by default, but could be activated by the user if any of the emotions was unclear and is only meant as support. Color coding: The positive emotions will be given a green colored tint and the negative emotions a red colored one. This is an attempt to help the users to more easily differentiate between positive and negative emotions. Broader intensity scale: One of the main weaknesses identified in the current version of PrEmo, was the 3 point intensity scale used to assess each emotion (‘did not feel the emotion’, ‘felt it lightly’, ‘felt it intensely’) which offered a low fidelity measurement. A higher fidelity measurement could be achieved by using a broader scale, and so it was decided to use a 5 point scale (1 being equivalent to ‘did not feel the emotion’ and 5 to ‘felt the emotion intensively’).
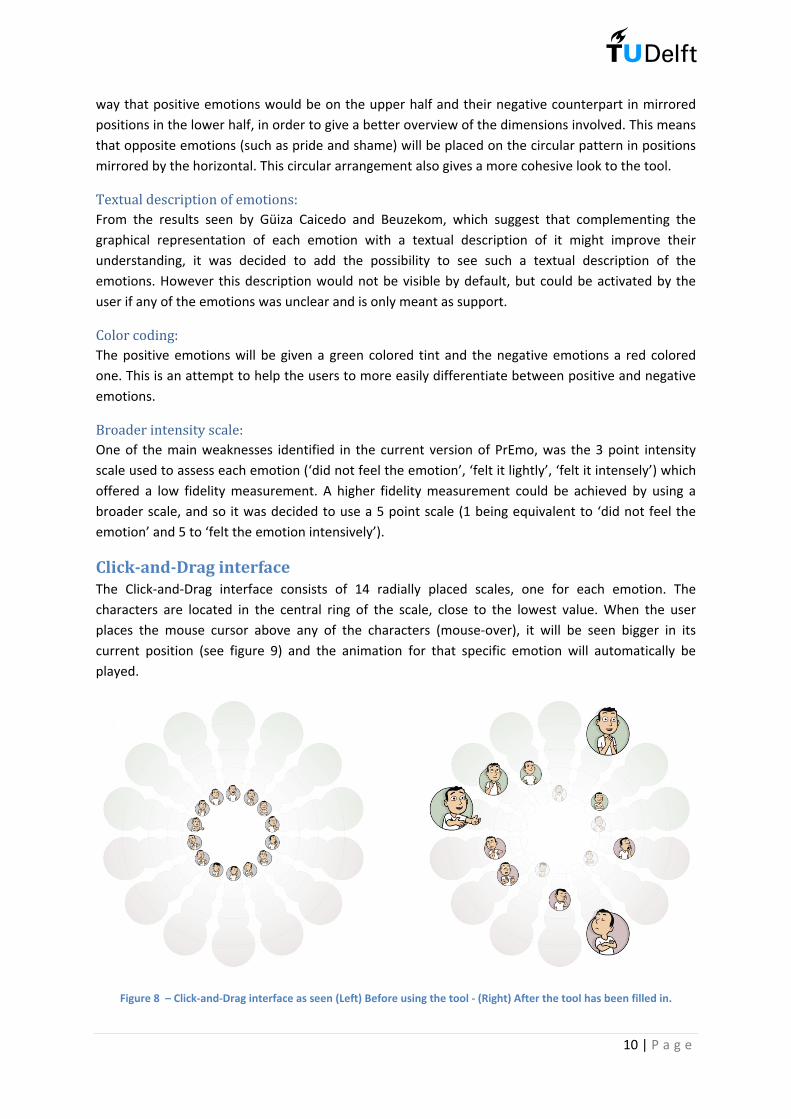
Click-and-Drag interface The Click-and-Drag interface consists of 14 radially placed scales, one for each emotion. The characters are located in the central ring of the scale, close to the lowest value. When the user places the mouse cursor above any of the characters (mouse-over), it will be seen bigger in its current position (see figure 9) and the animation for that specific emotion will automatically be played.
Figure 8 – Click-and-Drag interface as seen (Left) Before using the tool - (Right) After the tool has been filled in.
11 | P a g e
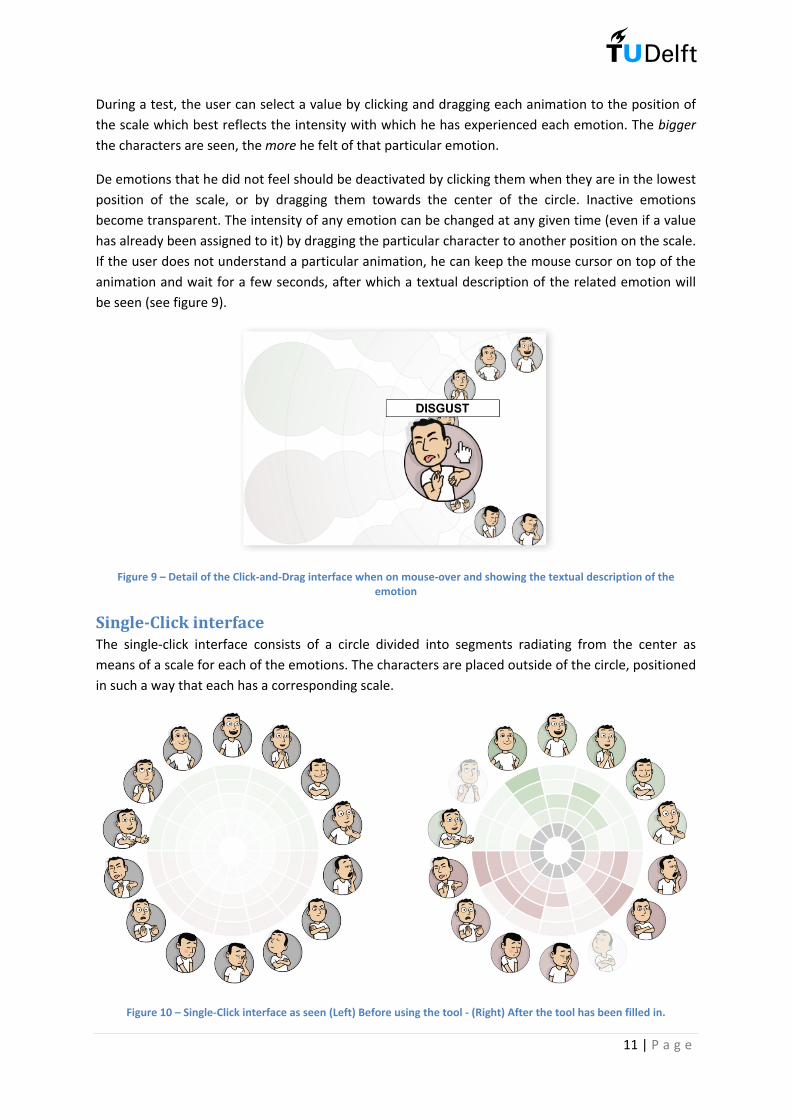
During a test, the user can select a value by clicking and dragging each animation to the position of the scale which best reflects the intensity with which he has experienced each emotion. The bigger the characters are seen, the more he felt of that particular emotion.
De emotions that he did not feel should be deactivated by clicking them when they are in the lowest position of the scale, or by dragging them towards the center of the circle. Inactive emotions become transparent. The intensity of any emotion can be changed at any given time (even if a value has already been assigned to it) by dragging the particular character to another position on the scale. If the user does not understand a particular animation, he can keep the mouse cursor on top of the animation and wait for a few seconds, after which a textual description of the related emotion will be seen (see figure 9).
Figure 9 – Detail of the Click-and-Drag interface when on mouse-over and showing the textual description of the emotion
Single-Click interface The single-click interface consists of a circle divided into segments radiating from the center as means of a scale for each of the emotions. The characters are placed outside of the circle, positioned in such a way that each has a corresponding scale.
Figure 10 – Single-Click interface as seen (Left) Before using the tool - (Right) After the tool has been filled in.
12 | P a g e
To assign an intensity value to each emotion, the user can click on the box that best reflects the intensity with which he experienced each emotion. The bigger the box and the larger the distance from the centre of the circle, the more he felt of that particular emotion. The background of each emotion for which a value has been already selected will change into the color of the selected box.
If the user does not feel a particular emotion, he should deactivate it by clicking the box that's closest to the centre of the circle (the smallest box). Inactive emotions become transparent, and the smallest box of the corresponding scale becomes grey.
The intensity of any emotion can be changed at any given time (even if a value has already been assigned to it) by clicking one of the other boxes within that particular emotion’s scale.
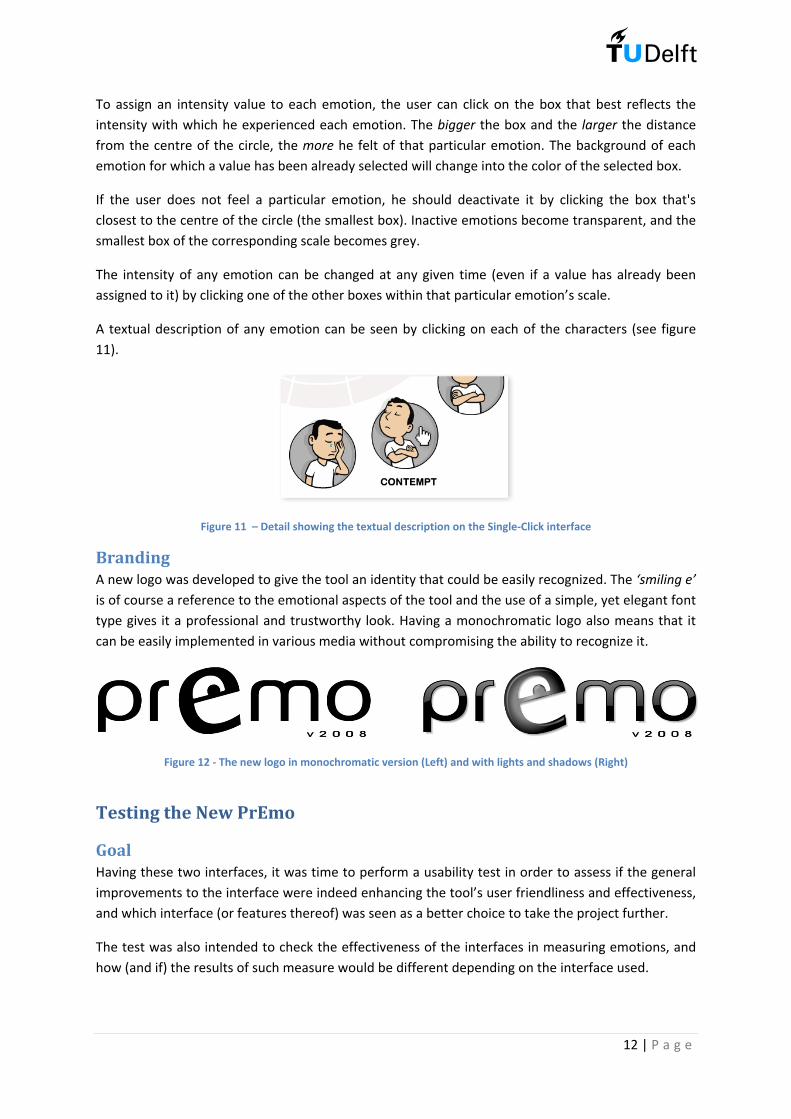
A textual description of any emotion can be seen by clicking on each of the characters (see figure 11).
Figure 11 – Detail showing the textual description on the Single-Click interface
Branding A new logo was developed to give the tool an identity that could be easily recognized. The ‘smiling e’ is of course a reference to the emotional aspects of the tool and the use of a simple, yet elegant font type gives it a professional and trustworthy look. Having a monochromatic logo also means that it can be easily implemented in various media without compromising the ability to recognize it.
Figure 12 - The new logo in monochromatic version (Left) and with lights and shadows (Right)
Testing the New PrEmo
Goal Having these two interfaces, it was time to perform a usability test in order to assess if the general improvements to the interface were indeed enhancing the tool’s user friendliness and effectiveness, and which interface (or features thereof) was seen as a better choice to take the project further.
The test was also intended to check the effectiveness of the interfaces in measuring emotions, and how (and if) the results of such measure would be different depending on the interface used.
13 | P a g e
Test Set-up
Method It was decided that to be able to assess the tool’s cross-cultural nature, it should be tested with a culturally diverse sample of test users, and in order to reach such an audience it was a good idea to exploit the computer-based nature of the tool and prepare an online test that could be accessed from anywhere in the world.
Figure 13. Welcome screen for the website that was set-up for the user testing
A website was set up where both interfaces were presented to the test users and followed by a survey. The website was available in 3 different languages (English, Spanish and Dutch).
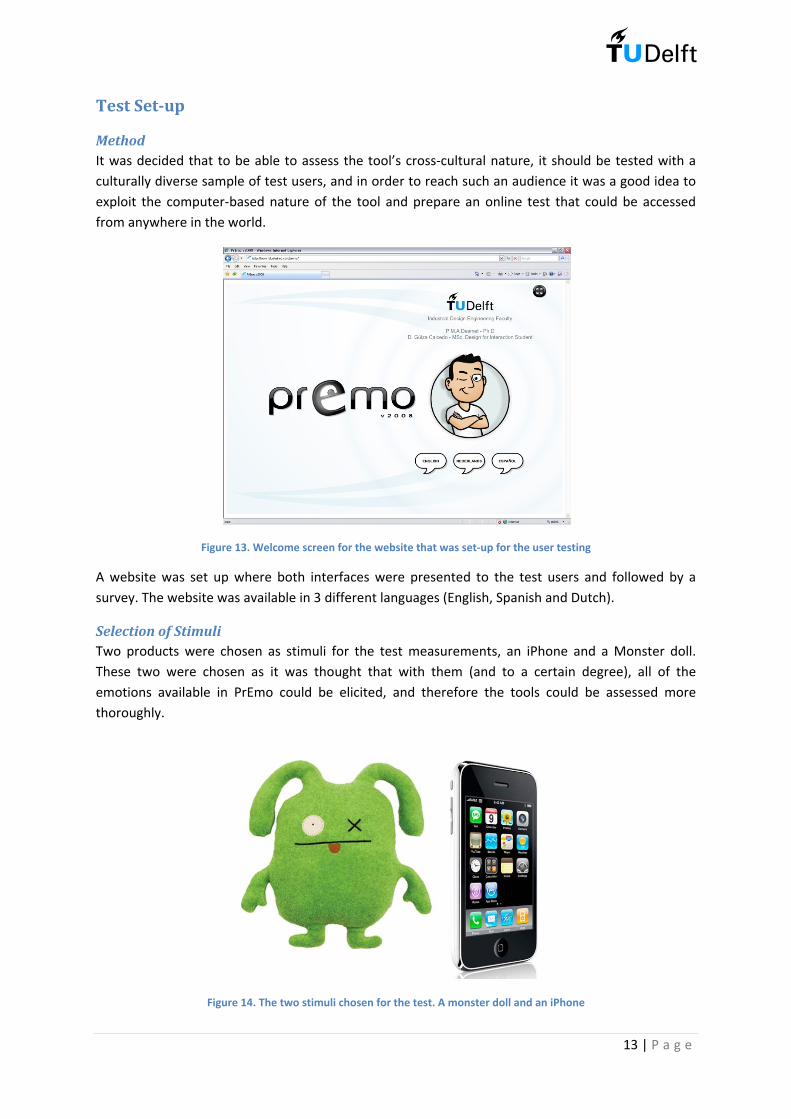
Selection of Stimuli Two products were chosen as stimuli for the test measurements, an iPhone and a Monster doll. These two were chosen as it was thought that with them (and to a certain degree), all of the emotions available in PrEmo could be elicited, and therefore the tools could be assessed more thoroughly.
Figure 14. The two stimuli chosen for the test. A monster doll and an iPhone
14 | P a g e
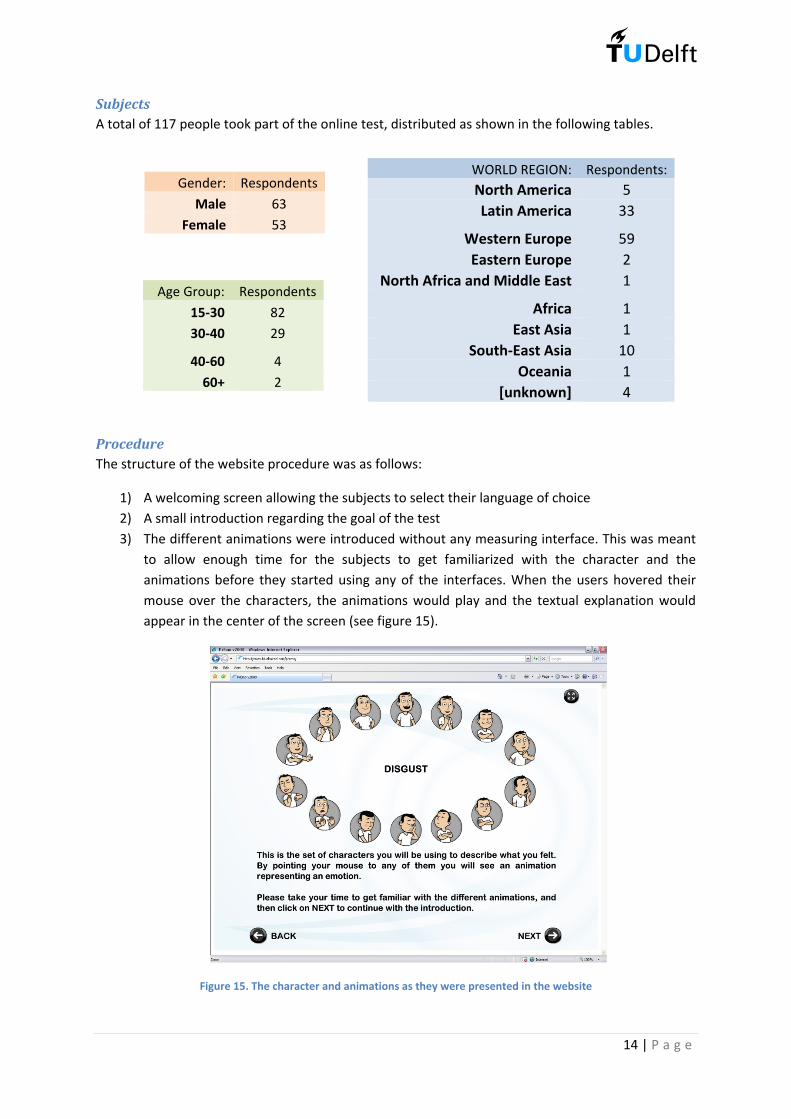
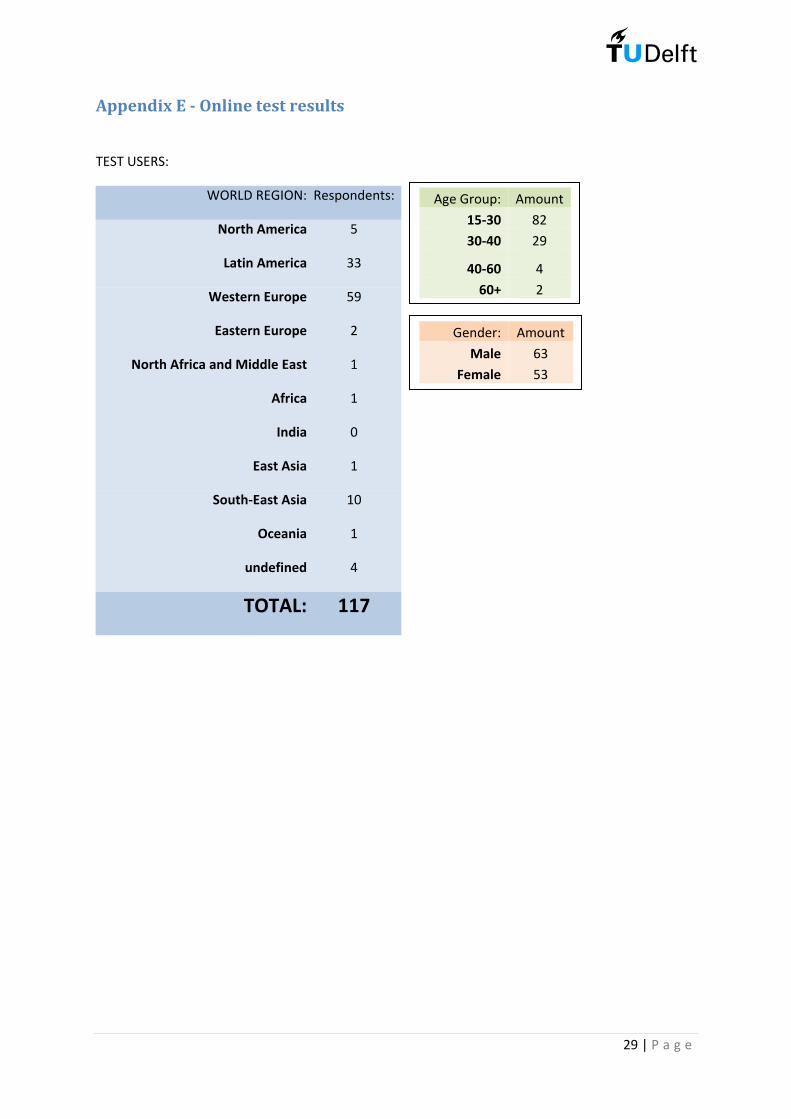
Subjects A total of 117 people took part of the online test, distributed as shown in the following tables.
Procedure The structure of the website procedure was as follows:
1) A welcoming screen allowing the subjects to select their language of choice 2) A small introduction regarding the goal of the test 3) The different animations were introduced without any measuring interface. This was meant
to allow enough time for the subjects to get familiarized with the character and the animations before they started using any of the interfaces. When the users hovered their mouse over the characters, the animations would play and the textual explanation would appear in the center of the screen (see figure 15).
Figure 15. The character and animations as they were presented in the website
WORLD REGION: Respondents:North America 5 Latin America 33
Western Europe 59 Eastern Europe 2
North Africa and Middle East 1
Africa 1 East Asia 1
South-East Asia 10 Oceania 1
[unknown] 4
Gender: Respondents
Male 63 Female 53
Age Group: Respondents
15-30 82 30-40 29
40-60 4
60+ 2
15 | P a g e
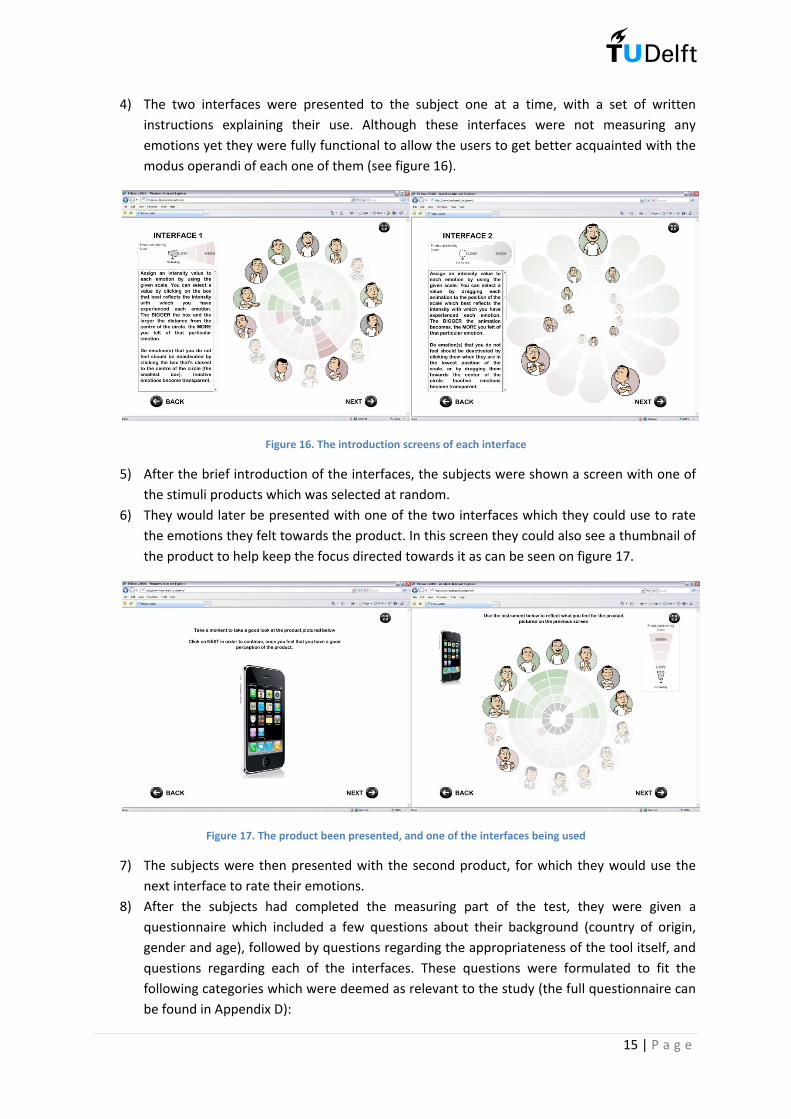
4) The two interfaces were presented to the subject one at a time, with a set of written instructions explaining their use. Although these interfaces were not measuring any emotions yet they were fully functional to allow the users to get better acquainted with the modus operandi of each one of them (see figure 16).
Figure 16. The introduction screens of each interface
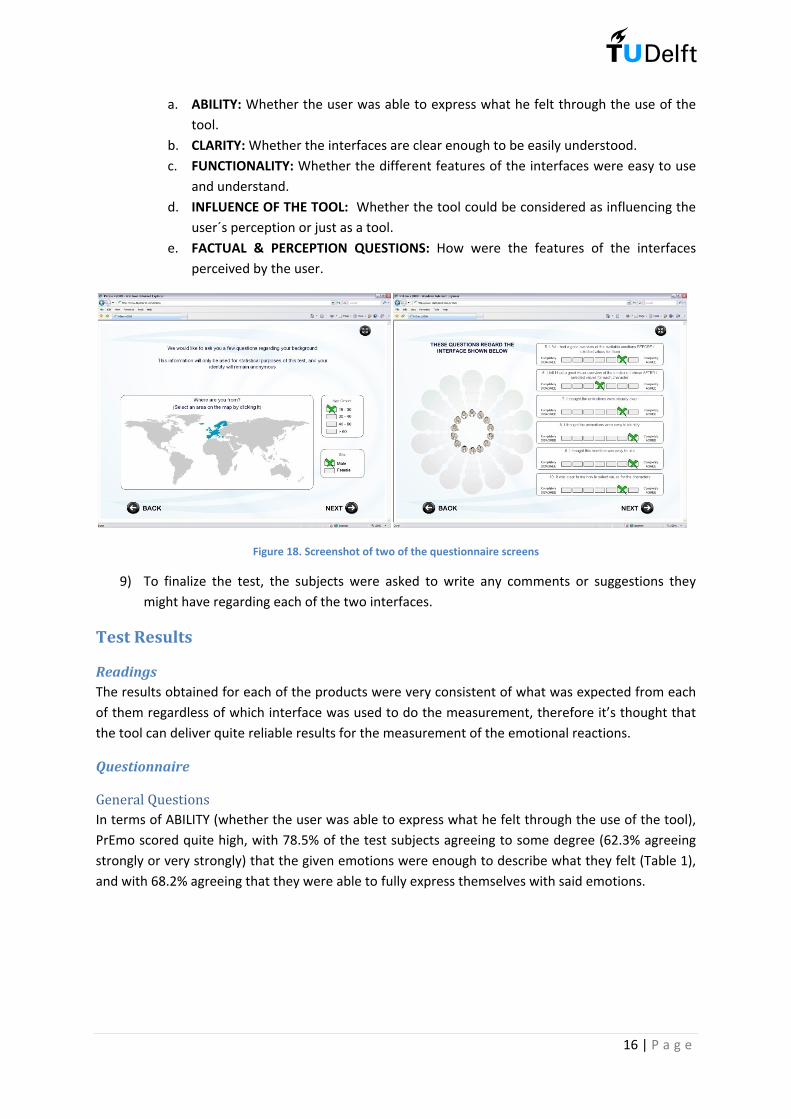
5) After the brief introduction of the interfaces, the subjects were shown a screen with one of the stimuli products which was selected at random.
6) They would later be presented with one of the two interfaces which they could use to rate the emotions they felt towards the product. In this screen they could also see a thumbnail of the product to help keep the focus directed towards it as can be seen on figure 17.
Figure 17. The product been presented, and one of the interfaces being used
7) The subjects were then presented with the second product, for which they would use the next interface to rate their emotions.
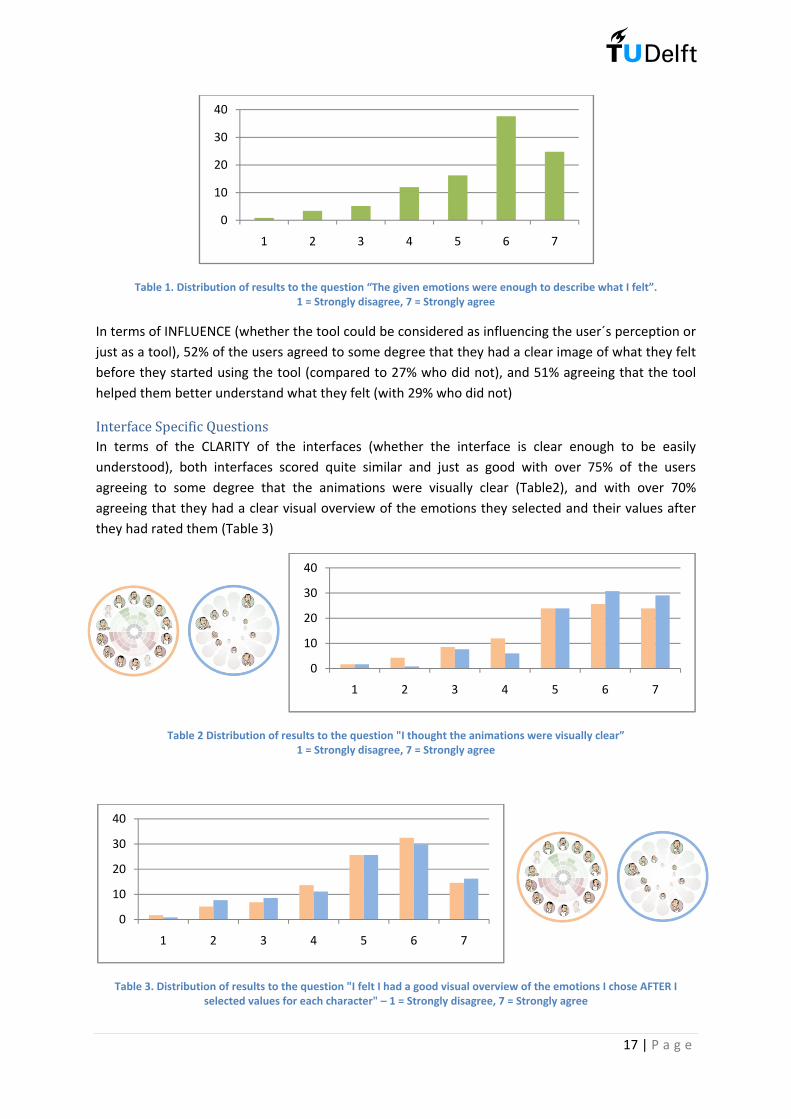
8) After the subjects had completed the measuring part of the test, they were given a questionnaire which included a few questions about their background (country of origin, gender and age), followed by questions regarding the appropriateness of the tool itself, and questions regarding each of the interfaces. These questions were formulated to fit the following categories which were deemed as relevant to the study (the full questionnaire can be found in Appendix D):
16 | P a g e
a. ABILITY: Whether the user was able to express what he felt through the use of the tool.
b. CLARITY: Whether the interfaces are clear enough to be easily understood. c. FUNCTIONALITY: Whether the different features of the interfaces were easy to use
and understand. d. INFLUENCE OF THE TOOL: Whether the tool could be considered as influencing the
user´s perception or just as a tool. e. FACTUAL & PERCEPTION QUESTIONS: How were the features of the interfaces
perceived by the user.
Figure 18. Screenshot of two of the questionnaire screens
9) To finalize the test, the subjects were asked to write any comments or suggestions they might have regarding each of the two interfaces.
Test Results
Readings The results obtained for each of the products were very consistent of what was expected from each of them regardless of which interface was used to do the measurement, therefore it’s thought that the tool can deliver quite reliable results for the measurement of the emotional reactions.
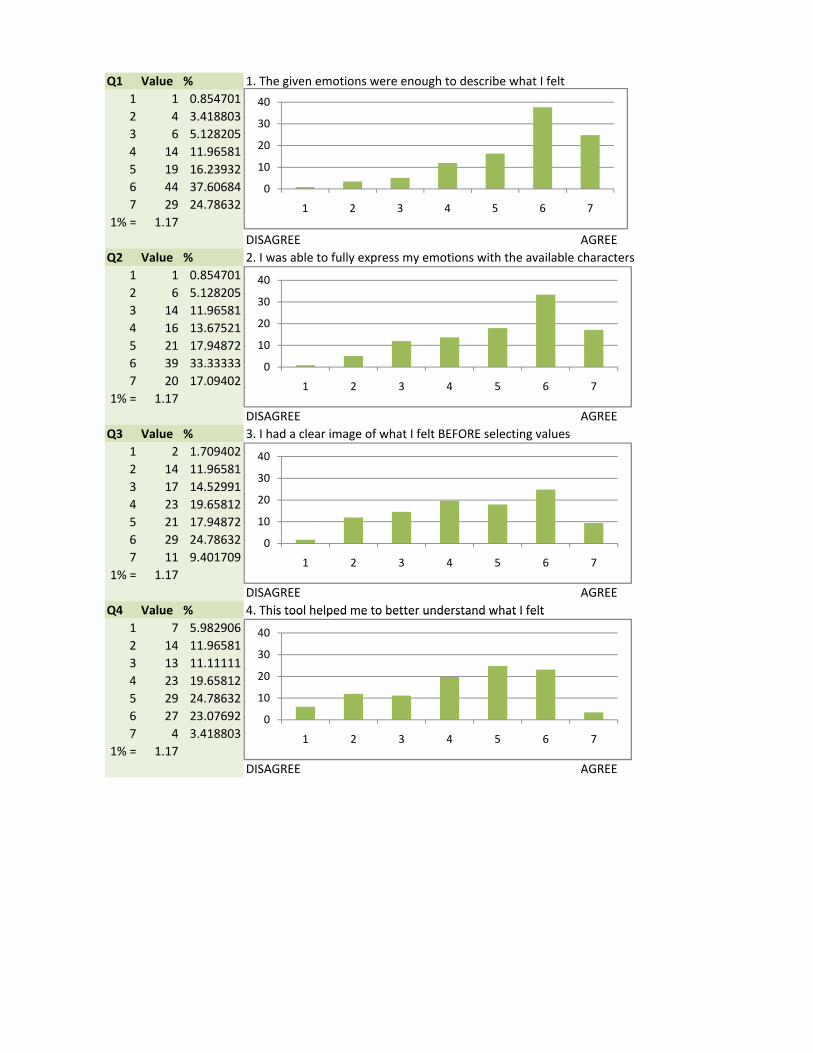
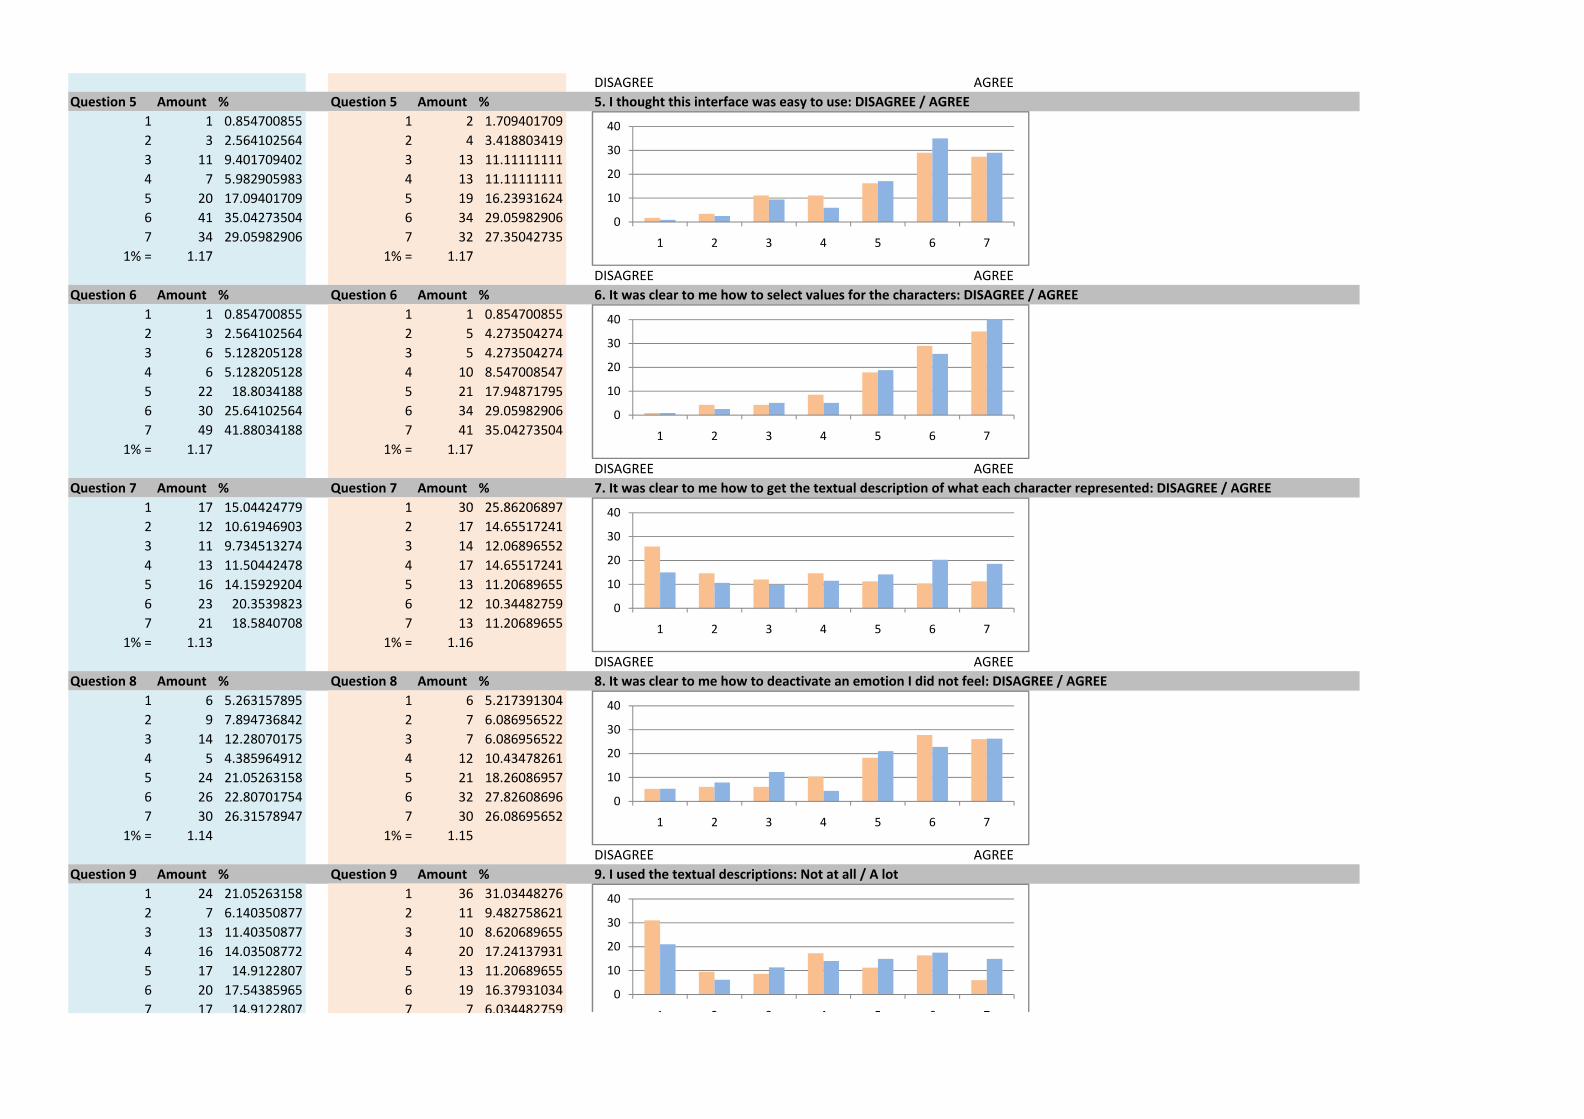
Questionnaire General Questions In terms of ABILITY (whether the user was able to express what he felt through the use of the tool), PrEmo scored quite high, with 78.5% of the test subjects agreeing to some degree (62.3% agreeing strongly or very strongly) that the given emotions were enough to describe what they felt (Table 1), and with 68.2% agreeing that they were able to fully express themselves with said emotions.
17 | P a g e
Table 1. Distribution of results to the question “The given emotions were enough to describe what I felt”. 1 = Strongly disagree, 7 = Strongly agree
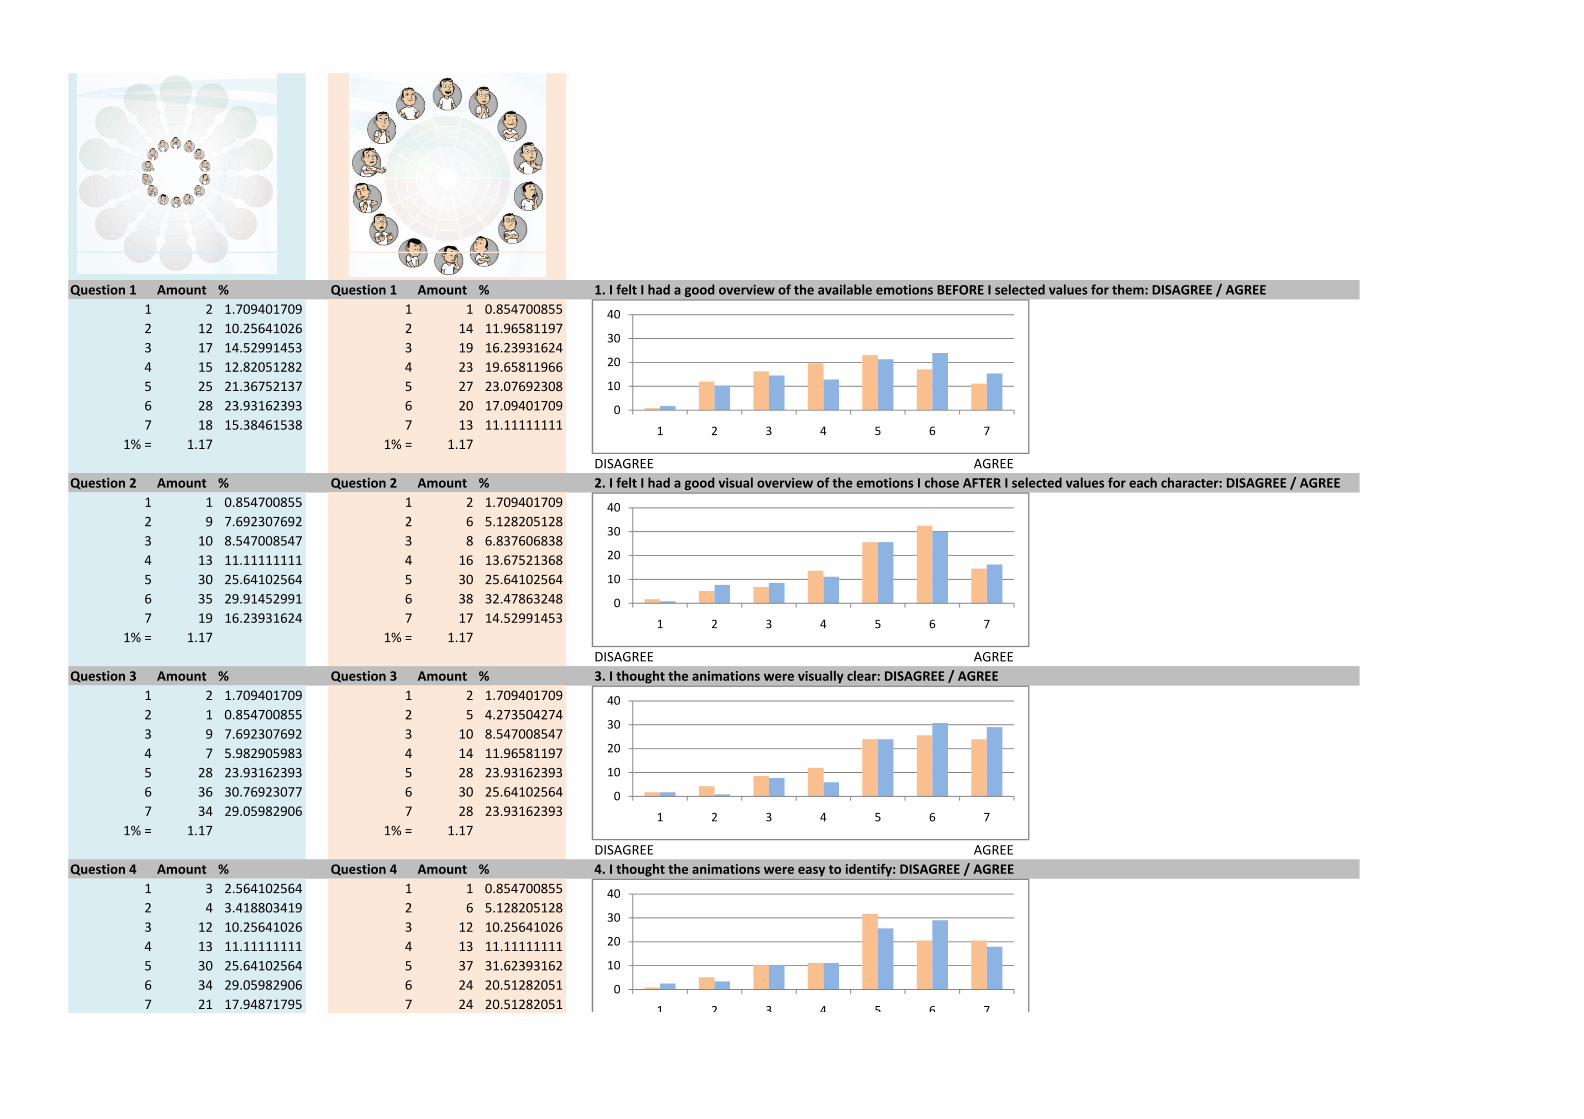
In terms of INFLUENCE (whether the tool could be considered as influencing the user´s perception or just as a tool), 52% of the users agreed to some degree that they had a clear image of what they felt before they started using the tool (compared to 27% who did not), and 51% agreeing that the tool helped them better understand what they felt (with 29% who did not) Interface Specific Questions In terms of the CLARITY of the interfaces (whether the interface is clear enough to be easily understood), both interfaces scored quite similar and just as good with over 75% of the users agreeing to some degree that the animations were visually clear (Table2), and with over 70% agreeing that they had a clear visual overview of the emotions they selected and their values after they had rated them (Table 3)
Table 2 Distribution of results to the question "I thought the animations were visually clear” 1 = Strongly disagree, 7 = Strongly agree
Table 3. Distribution of results to the question "I felt I had a good visual overview of the emotions I chose AFTER I selected values for each character" – 1 = Strongly disagree, 7 = Strongly agree
0
10
20
30
40
1 2 3 4 5 6 7
0
10
20
30
40
1 2 3 4 5 6 7
0
10
20
30
40
1 2 3 4 5 6 7
18 | P a g e
In terms of FUNCTIONALITY (whether the different features of the interfaces were easy to use and understand), once again both interfaces scored quite similarly. Over 70% of the users agreed that the interfaces were easy to use (Table 4), and with over 80% agreeing that it was clear how to select a values for each emotion (with the drag-and-drop interface scoring slightly higher in the “strongly agree” value). The procedure to deactivate an emotion that they did not feel was rated with a slightly lower score (over 65% agreeing) and in this matter the drag-and-drop interface scored slightly worse, as can be seen by the amount of users disagreeing with the statement (Table 6)
Table 4. Distribution of results to the question “I thought this interface was easy to use” 1 = Strongly disagree, 7 = Strongly agree
Table 5. Distribution of results to the question “It was clear to me how to select values for the characters” 1 = Strongly disagree, 7 = Strongly agree
Table 6. Distribution of results to the question “It was clear to me how to deactivate an emotion I did not feel” 1 = Strongly disagree, 7 = Strongly agree
0
10
20
30
40
1 2 3 4 5 6 7
0
10
20
30
40
1 2 3 4 5 6 7
0
10
20
30
40
1 2 3 4 5 6 7
19 | P a g e
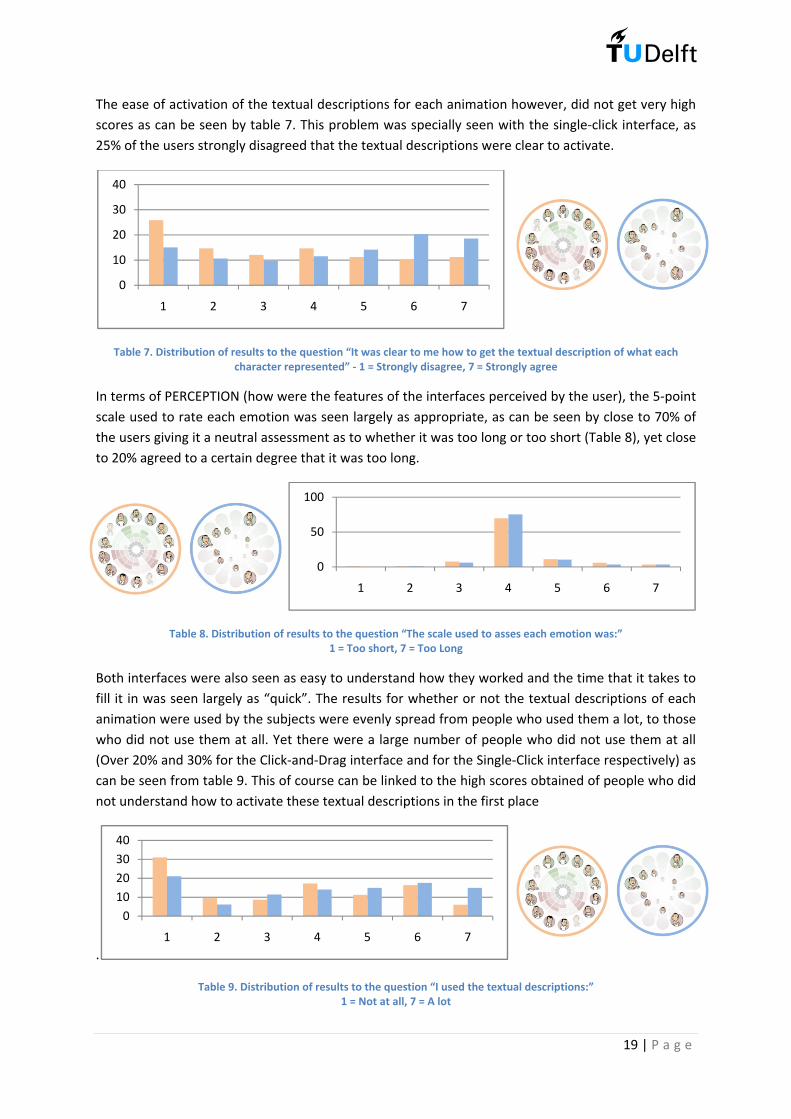
The ease of activation of the textual descriptions for each animation however, did not get very high scores as can be seen by table 7. This problem was specially seen with the single-click interface, as 25% of the users strongly disagreed that the textual descriptions were clear to activate.
Table 7. Distribution of results to the question “It was clear to me how to get the textual description of what each character represented” - 1 = Strongly disagree, 7 = Strongly agree
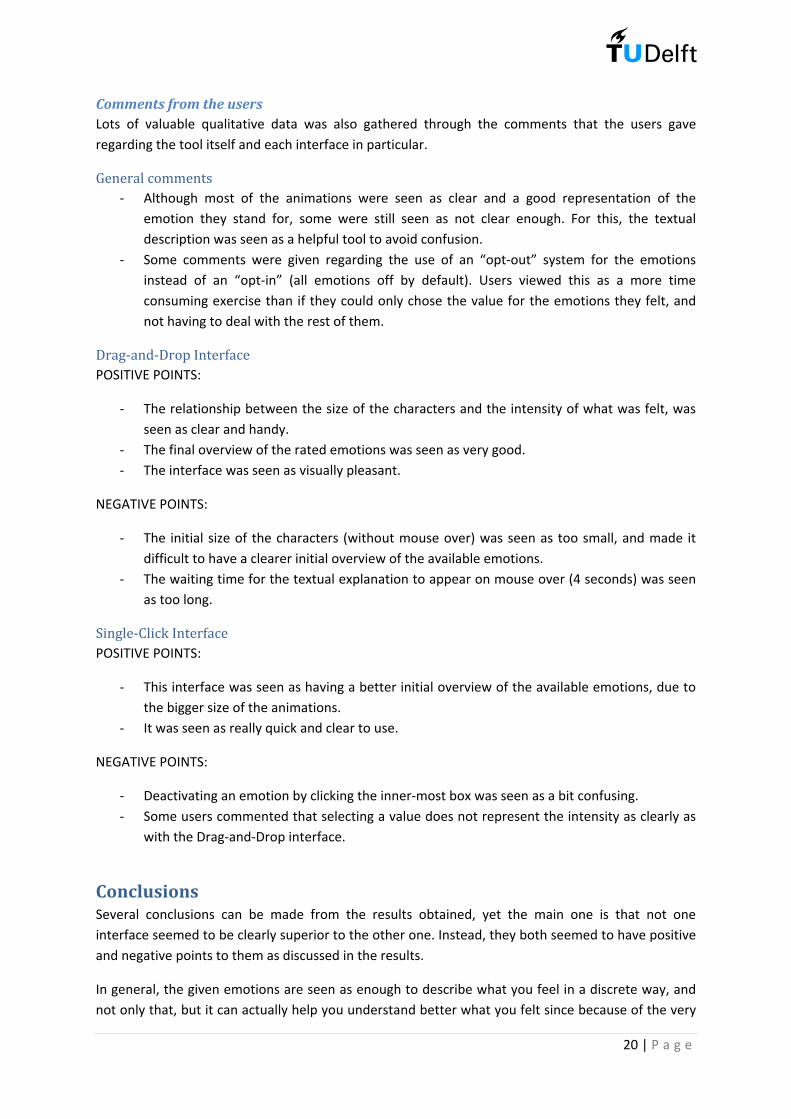
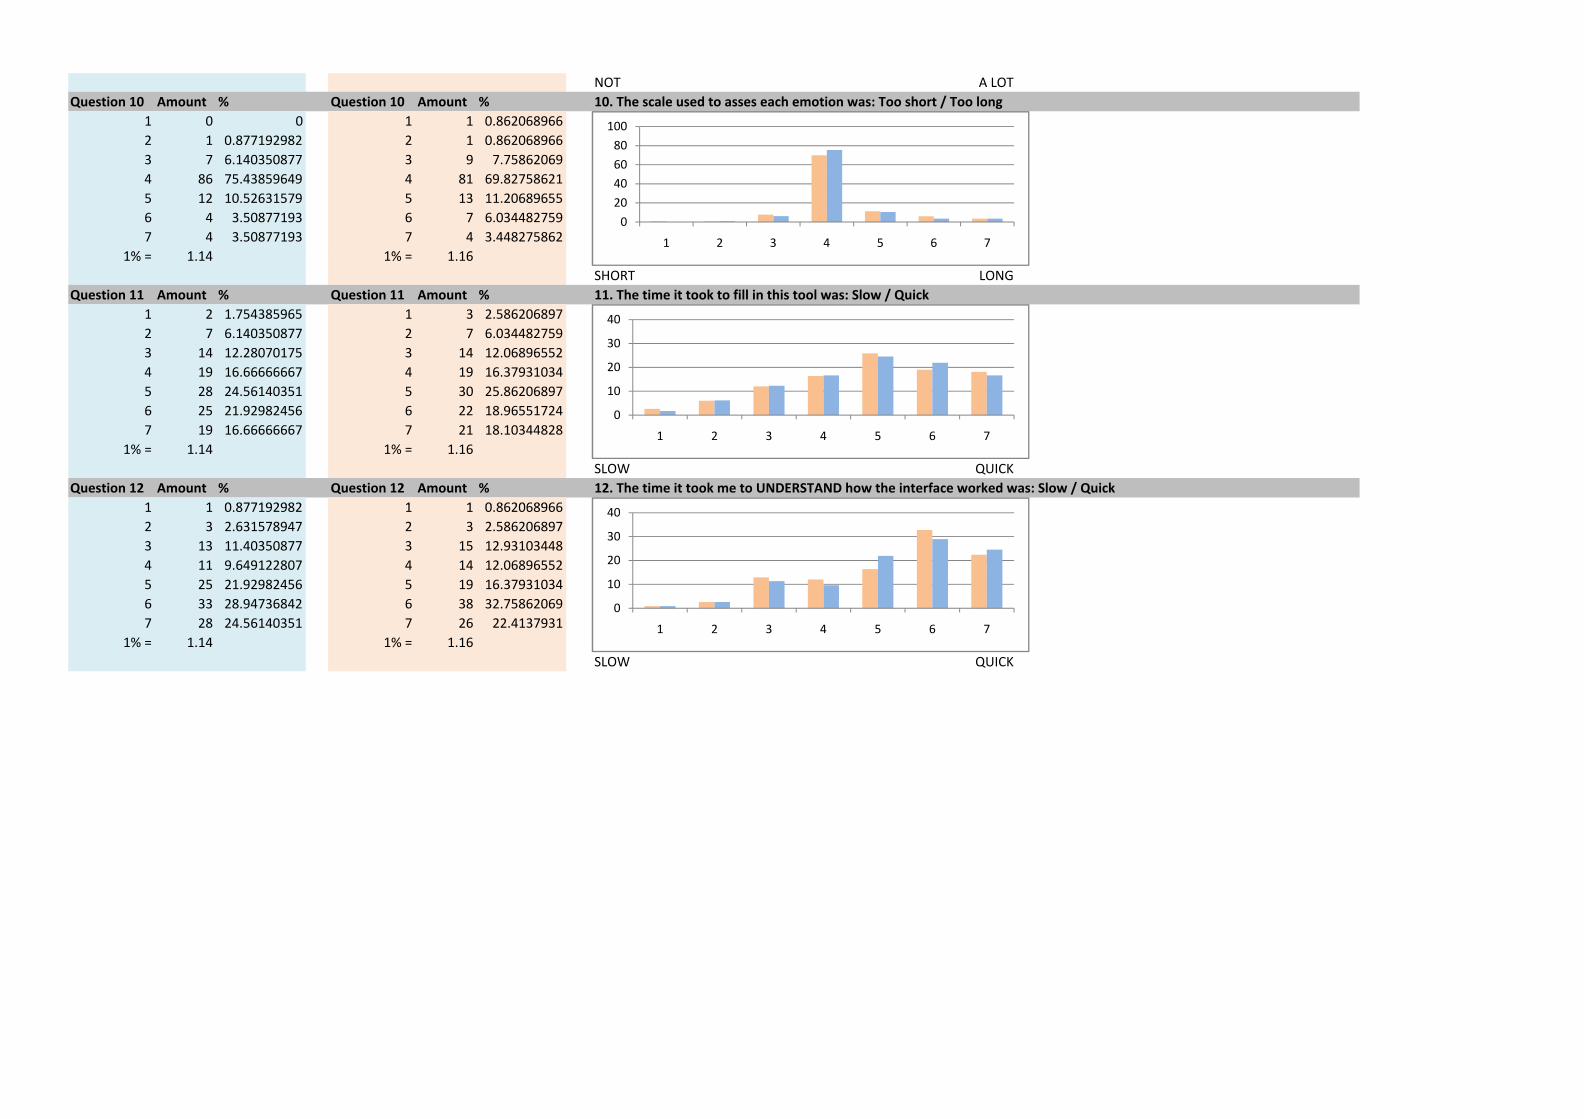
In terms of PERCEPTION (how were the features of the interfaces perceived by the user), the 5-point scale used to rate each emotion was seen largely as appropriate, as can be seen by close to 70% of the users giving it a neutral assessment as to whether it was too long or too short (Table 8), yet close to 20% agreed to a certain degree that it was too long.
Table 8. Distribution of results to the question “The scale used to asses each emotion was:” 1 = Too short, 7 = Too Long
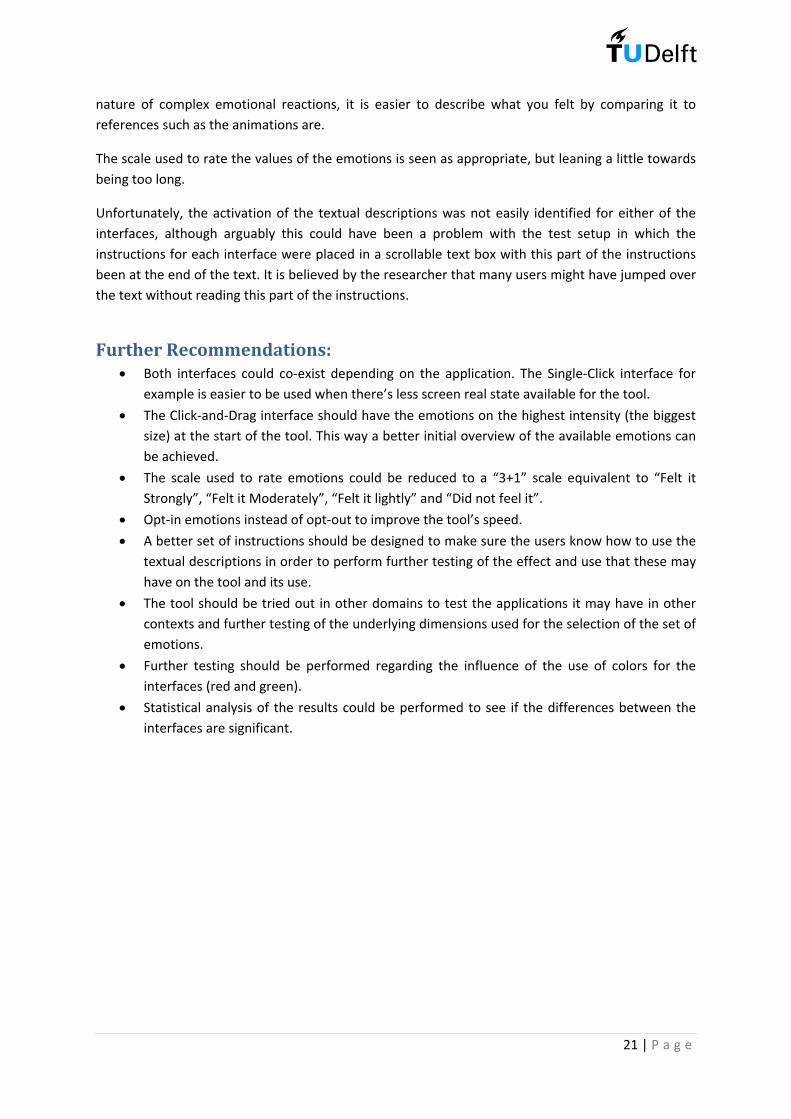
Both interfaces were also seen as easy to understand how they worked and the time that it takes to fill it in was seen largely as “quick”. The results for whether or not the textual descriptions of each animation were used by the subjects were evenly spread from people who used them a lot, to those who did not use them at all. Yet there were a large number of people who did not use them at all (Over 20% and 30% for the Click-and-Drag interface and for the Single-Click interface respectively) as can be seen from table 9. This of course can be linked to the high scores obtained of people who did not understand how to activate these textual descriptions in the first place
.
Table 9. Distribution of results to the question “I used the textual descriptions:” 1 = Not at all, 7 = A lot
0
10
20
30
40
1 2 3 4 5 6 7
0
50
100
1 2 3 4 5 6 7
010203040
1 2 3 4 5 6 7
20 | P a g e
Comments from the users Lots of valuable qualitative data was also gathered through the comments that the users gave regarding the tool itself and each interface in particular. General comments
- Although most of the animations were seen as clear and a good representation of the emotion they stand for, some were still seen as not clear enough. For this, the textual description was seen as a helpful tool to avoid confusion.
- Some comments were given regarding the use of an “opt-out” system for the emotions instead of an “opt-in” (all emotions off by default). Users viewed this as a more time consuming exercise than if they could only chose the value for the emotions they felt, and not having to deal with the rest of them. Drag-and-Drop Interface
POSITIVE POINTS:
- The relationship between the size of the characters and the intensity of what was felt, was seen as clear and handy.
- The final overview of the rated emotions was seen as very good. - The interface was seen as visually pleasant.
NEGATIVE POINTS:
- The initial size of the characters (without mouse over) was seen as too small, and made it difficult to have a clearer initial overview of the available emotions.
- The waiting time for the textual explanation to appear on mouse over (4 seconds) was seen as too long. Single-Click Interface
POSITIVE POINTS:
- This interface was seen as having a better initial overview of the available emotions, due to the bigger size of the animations.
- It was seen as really quick and clear to use.
NEGATIVE POINTS:
- Deactivating an emotion by clicking the inner-most box was seen as a bit confusing. - Some users commented that selecting a value does not represent the intensity as clearly as
with the Drag-and-Drop interface.
Conclusions Several conclusions can be made from the results obtained, yet the main one is that not one interface seemed to be clearly superior to the other one. Instead, they both seemed to have positive and negative points to them as discussed in the results.
In general, the given emotions are seen as enough to describe what you feel in a discrete way, and not only that, but it can actually help you understand better what you felt since because of the very
21 | P a g e
nature of complex emotional reactions, it is easier to describe what you felt by comparing it to references such as the animations are.
The scale used to rate the values of the emotions is seen as appropriate, but leaning a little towards being too long.
Unfortunately, the activation of the textual descriptions was not easily identified for either of the interfaces, although arguably this could have been a problem with the test setup in which the instructions for each interface were placed in a scrollable text box with this part of the instructions been at the end of the text. It is believed by the researcher that many users might have jumped over the text without reading this part of the instructions.
Further Recommendations: • Both interfaces could co-exist depending on the application. The Single-Click interface for
example is easier to be used when there’s less screen real state available for the tool.
• The Click-and-Drag interface should have the emotions on the highest intensity (the biggest size) at the start of the tool. This way a better initial overview of the available emotions can be achieved.
• The scale used to rate emotions could be reduced to a “3+1” scale equivalent to “Felt it Strongly”, “Felt it Moderately”, “Felt it lightly” and “Did not feel it”.
• Opt-in emotions instead of opt-out to improve the tool’s speed.
• A better set of instructions should be designed to make sure the users know how to use the textual descriptions in order to perform further testing of the effect and use that these may have on the tool and its use.
• The tool should be tried out in other domains to test the applications it may have in other contexts and further testing of the underlying dimensions used for the selection of the set of emotions.
• Further testing should be performed regarding the influence of the use of colors for the interfaces (red and green).
• Statistical analysis of the results could be performed to see if the differences between the interfaces are significant.
22 | P a g e
References Desmet, P.M.A. (2003). Measuring emotion; development and application of an instrument to measure emotional responses to products. In: M.A. Blythe, A.F. Monk, K. Overbeeke, & P.C. Wright (Eds.), Funology: from usability to enjoyment (pp. 111-123). Dordrecht: Kluwer Academic Publishers.
Güiza Caicedo, D.F., Beuzekom, M (2006). “How do you feel?” - An assessment of existing tools for the measurement of emotions and their application in consumer products research. TU Delft: Department of Industrial design
Overbeeke, C.J., Hekkert, P. (Eds.) (1999). Proceedings of the first international conference on Design and Emotion. TU Delft: Department of Industrial Design.
Lang, P.J., (1985), The cognitive psychophysiology of Emotion: Anxiety and the anxiety disorders. Hillside, NJ: Lawrence Erlbaum.
Emoti*Scape – Ipsos-ASI (2005). Available from http://www.ipsos-ideas.com/article.cfm?id=3161 [Accessed January 20 - 2009]
23 | P a g e
Appendices
24 | P a g e
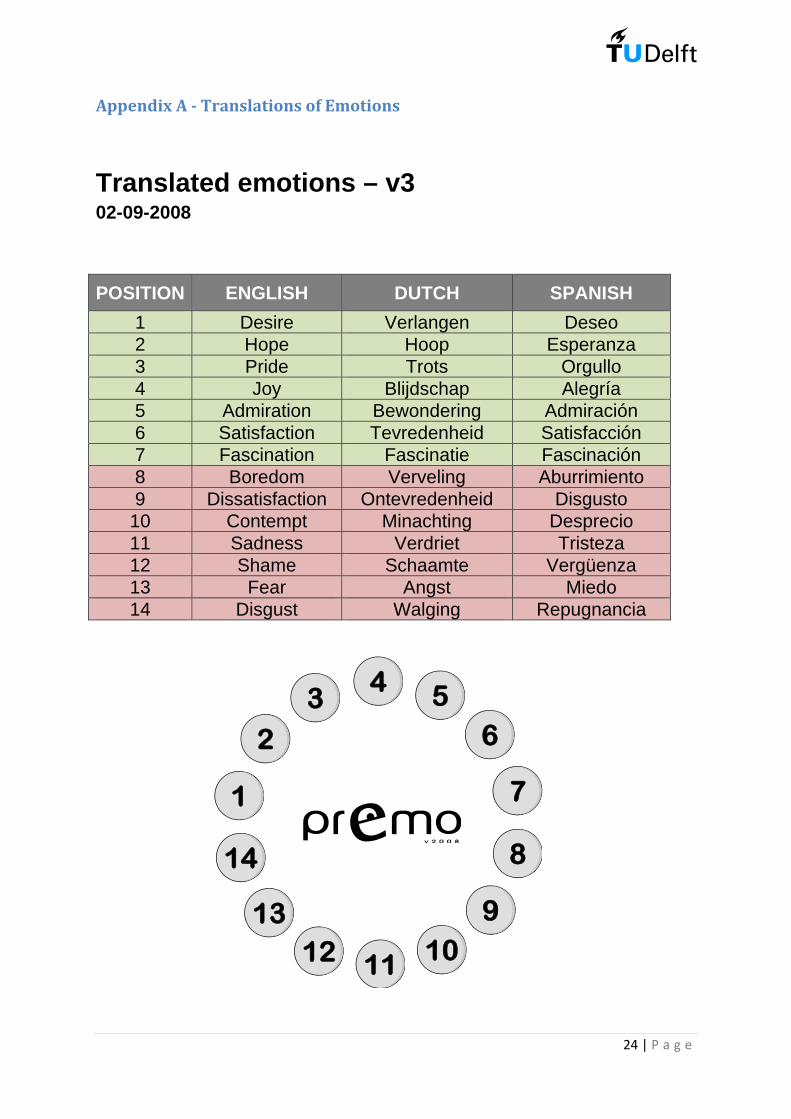
Appendix A - Translations of Emotions
Translated emotions – v3 02-09-2008
POSITION ENGLISH DUTCH SPANISH 1 Desire Verlangen Deseo 2 Hope Hoop Esperanza 3 Pride Trots Orgullo 4 Joy Blijdschap Alegría 5 Admiration Bewondering Admiración 6 Satisfaction Tevredenheid Satisfacción 7 Fascination Fascinatie Fascinación 8 Boredom Verveling Aburrimiento 9 Dissatisfaction Ontevredenheid Disgusto
10 Contempt Minachting Desprecio 11 Sadness Verdriet Tristeza 12 Shame Schaamte Vergüenza 13 Fear Angst Miedo 14 Disgust Walging Repugnancia
7
56
3
2
1
14
1312
9
11 10
8
4

Appen
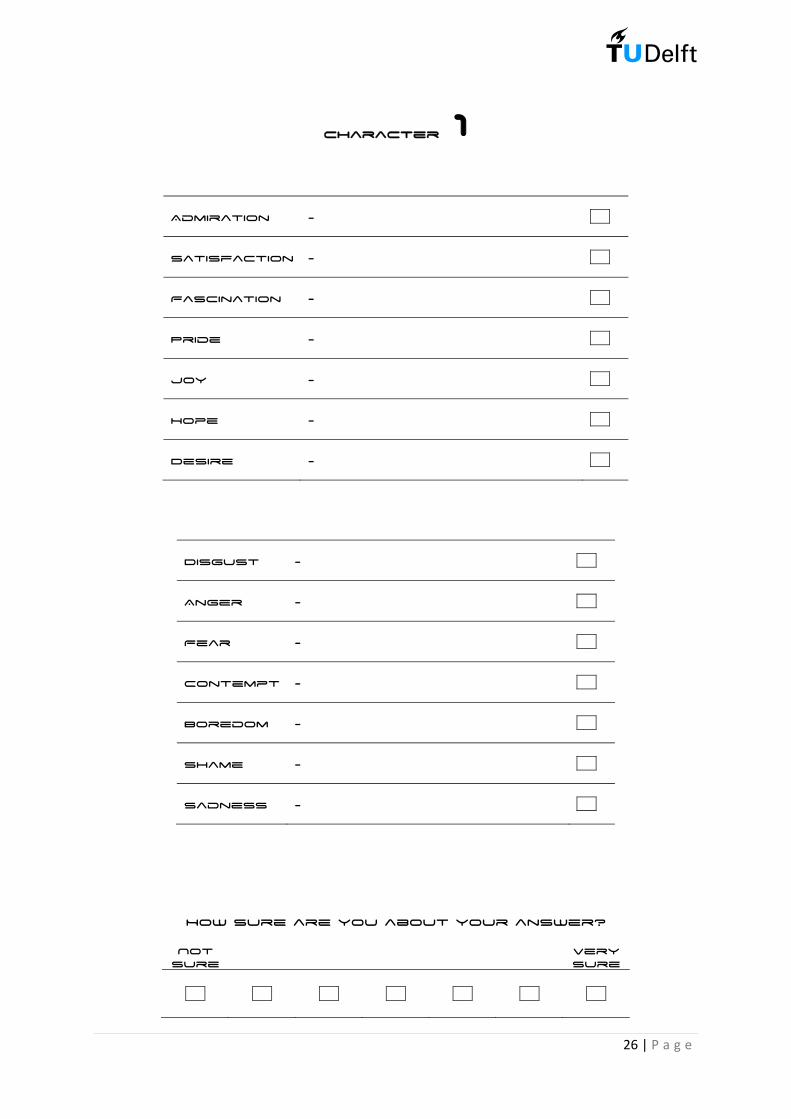
ndix B - Vaalidation Question
nnaire Exaample
25 | P a g e
26 | P a g e
character 1
Admiration -
Satisfaction -
Fascination -
Pride -
Joy -
Hope -
Desire -
Disgust -
Anger -
Fear -
Contempt -
Boredom -
Shame -
Sadness -
How sure are you about your answer?
Not sure
Very sure
27 | P a g e
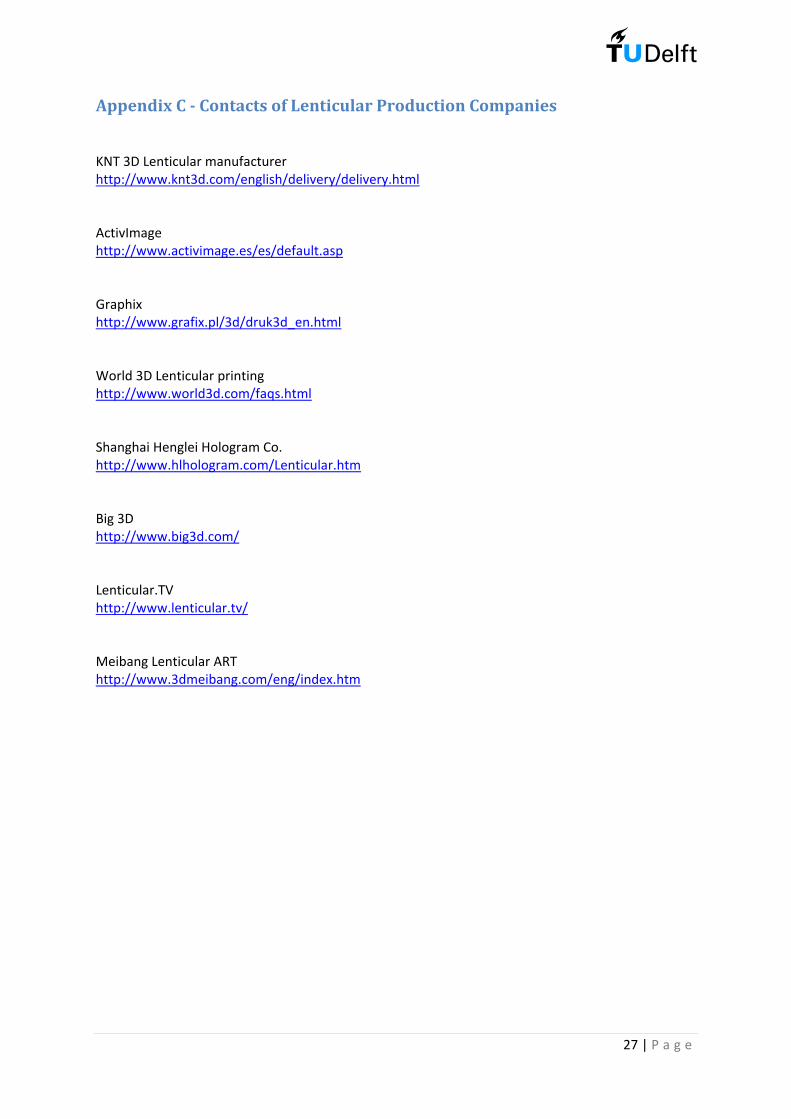
Appendix C - Contacts of Lenticular Production Companies
KNT 3D Lenticular manufacturer http://www.knt3d.com/english/delivery/delivery.html ActivImage http://www.activimage.es/es/default.asp Graphix http://www.grafix.pl/3d/druk3d_en.html World 3D Lenticular printing http://www.world3d.com/faqs.html Shanghai Henglei Hologram Co. http://www.hlhologram.com/Lenticular.htm Big 3D http://www.big3d.com/ Lenticular.TV http://www.lenticular.tv/ Meibang Lenticular ART http://www.3dmeibang.com/eng/index.htm
28 | P a g e
Appendix D - Online Questionnaire 15-09-2008
Question Categories: o ABILITY: Whether the user was able to express what he felt. o CLARITY: Whether the interfaces are clear enough to be understood o FUNCTIONALITY: Whether the different features of the interfaces were easy
to use and understand. o INFLUENCE OF THE TOOL: Whether the tool could be considered as
influencing the user´s perception or just as a tool. o FACTUAL & PERCEPTION QUESTIONS: How were the different features of
the interfaces perceived by the user.
General
• [Ability] The given emotions where enough to describe what I felt. • [Ability] I was able to fully express my emotions with the available characters • [Influence] I had a clear image of what I felt BEFORE selecting values for the
different characters • [Influence] This tool helped me to better understand what I felt.
Interface specific
• [Clarity] I felt I had a good overview of the available emotions BEFORE I selected values for them?
• [Clarity] I felt I had a good visual overview of the emotions I chose AFTER I selected values for each character?
• [Clarity] I thought the animations were visually clear? • [Functionality] I thought the animations were easy to identify? • [Functionality] I thought this interface was easy to use? • [Functionality] It was clear to me how to select values for the characters? • [Functionality] It was clear to me how to get the textual description of what
each character represented? • [Functionality] It was clear to me how to give no value for an emotion I did not
feel. • [Factual] I used the textual descriptions: Not at all / A lot • [Factual] The scale used to asses each emotion was: Too short / Too long • [Factual] The time it took to fill in this tool was: Slow / Quick • [Factual] The time it took me to UNDERSTAND how the interface worked
was: Slow / Quick
General subjective question:
• Questions or suggestions regarding each interface?
29 | P a g e
Appendix E - Online test results
TEST USERS:
WORLD REGION: Respondents:
North America 5
Latin America 33
Western Europe 59
Eastern Europe 2
North Africa and Middle East 1
Africa 1
India 0
East Asia 1
South-East Asia 10
Oceania 1
undefined 4
TOTAL: 117
Age Group: Amount
15-30 82 30-40 29
40-60 4
60+ 2
Gender: Amount
Male 63 Female 53
Q1 Value % 1. The given emotions were enough to describe what I felt1 1 0.8547012 4 3.418803 30
40
3 6 5.1282054 14 11.965815 19 16.239326 44 37.606847 29 24.78632
1% = 1.17DISAGREE AGREE
0
10
20
30
1 2 3 4 5 6 7
Q2 Value % 2. I was able to fully express my emotions with the available characters1 1 0.8547012 6 5.1282053 14 11.965814 16 13.675215 21 17.948726 39 33.33333 0
10
20
30
40
7 20 17.094021% = 1.17
DISAGREE AGREEQ3 Value % 3. I had a clear image of what I felt BEFORE selecting values
1 2 1.7094022 14 11.965813 17 14.52991
0
1 2 3 4 5 6 7
30
40
3 17 14.529914 23 19.658125 21 17.948726 29 24.786327 11 9.401709
1% = 1.17DISAGREE AGREE
Q4 Value % 4. This tool helped me to better understand what I felt
0
10
20
1 2 3 4 5 6 7
Q4 Value % 4. This tool helped me to better understand what I felt1 7 5.9829062 14 11.965813 13 11.111114 23 19.658125 29 24.786326 27 23.076927 4 3.418803
0
10
20
30
40
1 2 3 4 5 6 77 4 3.4188031% = 1.17
DISAGREE AGREE
1 2 3 4 5 6 7
Question 1 Amount % Question 1 Amount % 1. I felt I had a good overview of the available emotions BEFORE I selected values for them: DISAGREE / AGREE1 2 1.709401709 1 1 0.8547008552 12 10.25641026 2 14 11.965811973 17 14.52991453 3 19 16.239316244 15 12.82051282 4 23 19.658119665 25 21.36752137 5 27 23.076923086 28 23.93162393 6 20 17.094017097 18 15.38461538 7 13 11.11111111
1% = 1.17 1% = 1.17DISAGREE AGREE
Question 2 Amount % Question 2 Amount % 2. I felt I had a good visual overview of the emotions I chose AFTER I selected values for each character: DISAGREE / AGREE1 1 0.854700855 1 2 1.709401709
0
10
20
30
40
1 2 3 4 5 6 7
401 1 0.854700855 1 2 1.7094017092 9 7.692307692 2 6 5.1282051283 10 8.547008547 3 8 6.8376068384 13 11.11111111 4 16 13.675213685 30 25.64102564 5 30 25.641025646 35 29.91452991 6 38 32.478632487 19 16.23931624 7 17 14.52991453
1% = 1.17 1% = 1.17DISAGREE AGREE
Question 3 Amount % Question 3 Amount % 3. I thought the animations were visually clear: DISAGREE / AGREE1 2 1.709401709 1 2 1.7094017092 1 0.854700855 2 5 4.2735042743 9 7.692307692 3 10 8.5470085474 7 5.982905983 4 14 11.96581197
0
10
20
30
40
1 2 3 4 5 6 7
20
30
40
4 7 5.982905983 4 14 11.965811975 28 23.93162393 5 28 23.931623936 36 30.76923077 6 30 25.641025647 34 29.05982906 7 28 23.93162393
1% = 1.17 1% = 1.17DISAGREE AGREE
Question 4 Amount % Question 4 Amount % 4. I thought the animations were easy to identify: DISAGREE / AGREE1 3 2.564102564 1 1 0.8547008552 4 3.418803419 2 6 5.1282051283 12 10.25641026 3 12 10.256410264 13 11.11111111 4 13 11.111111115 30 25.64102564 5 37 31.623931626 34 29.05982906 6 24 20.512820517 21 17.94871795 7 24 20.51282051
0
10
1 2 3 4 5 6 7
0
10
20
30
40
1 2 3 4 5 6 7
DISAGREE AGREEQuestion 5 Amount % Question 5 Amount % 5. I thought this interface was easy to use: DISAGREE / AGREE
1 1 0.854700855 1 2 1.7094017092 3 2.564102564 2 4 3.4188034193 11 9.401709402 3 13 11.111111114 7 5.982905983 4 13 11.111111115 20 17.09401709 5 19 16.239316246 41 35.04273504 6 34 29.059829067 34 29.05982906 7 32 27.35042735
1% 1 17 1% 1 17
0
10
20
30
40
1 2 3 4 5 6 71% = 1.17 1% = 1.17
DISAGREE AGREEQuestion 6 Amount % Question 6 Amount % 6. It was clear to me how to select values for the characters: DISAGREE / AGREE
1 1 0.854700855 1 1 0.8547008552 3 2.564102564 2 5 4.2735042743 6 5.128205128 3 5 4.2735042744 6 5.128205128 4 10 8.5470085475 22 18.8034188 5 21 17.948717956 30 25.64102564 6 34 29.059829067 49 41.88034188 7 41 35.04273504
1% = 1.17 1% = 1.17DISAGREE AGREE
Question 7 Amount % Question 7 Amount % 7. It was clear to me how to get the textual description of what each character represented: DISAGREE / AGREE1 17 15 04424779 1 30 25 86206897
0
10
20
30
40
1 2 3 4 5 6 7
1 17 15.04424779 1 30 25.862068972 12 10.61946903 2 17 14.655172413 11 9.734513274 3 14 12.068965524 13 11.50442478 4 17 14.655172415 16 14.15929204 5 13 11.206896556 23 20.3539823 6 12 10.344827597 21 18.5840708 7 13 11.20689655
1% = 1.13 1% = 1.16DISAGREE AGREE
Question 8 Amount % Question 8 Amount % 8. It was clear to me how to deactivate an emotion I did not feel: DISAGREE / AGREE1 6 5.263157895 1 6 5.2173913042 9 7.894736842 2 7 6.0869565223 14 12.28070175 3 7 6.0869565224 5 4 385964912 4 12 10 43478261
0
10
20
30
40
1 2 3 4 5 6 7
20
30
40
4 5 4.385964912 4 12 10.434782615 24 21.05263158 5 21 18.260869576 26 22.80701754 6 32 27.826086967 30 26.31578947 7 30 26.08695652
1% = 1.14 1% = 1.15DISAGREE AGREE
Question 9 Amount % Question 9 Amount % 9. I used the textual descriptions: Not at all / A lot1 24 21.05263158 1 36 31.034482762 7 6.140350877 2 11 9.4827586213 13 11.40350877 3 10 8.6206896554 16 14.03508772 4 20 17.241379315 17 14.9122807 5 13 11.206896556 20 17.54385965 6 19 16.379310347 17 14.9122807 7 7 6.034482759
0
10
1 2 3 4 5 6 7
0
10
20
30
40
1 2 3 4 5 6 7
NOT A LOTQuestion 10 Amount % Question 10 Amount % 10. The scale used to asses each emotion was: Too short / Too long
1 0 0 1 1 0.8620689662 1 0.877192982 2 1 0.8620689663 7 6.140350877 3 9 7.758620694 86 75.43859649 4 81 69.827586215 12 10.52631579 5 13 11.206896556 4 3.50877193 6 7 6.0344827597 4 3.50877193 7 4 3.448275862
1% 1 14 1% 1 16
0
20
40
60
80
100
1 2 3 4 5 6 71% = 1.14 1% = 1.16
SHORT LONGQuestion 11 Amount % Question 11 Amount % 11. The time it took to fill in this tool was: Slow / Quick
1 2 1.754385965 1 3 2.5862068972 7 6.140350877 2 7 6.0344827593 14 12.28070175 3 14 12.068965524 19 16.66666667 4 19 16.379310345 28 24.56140351 5 30 25.862068976 25 21.92982456 6 22 18.965517247 19 16.66666667 7 21 18.10344828
1% = 1.14 1% = 1.16SLOW QUICK
Question 12 Amount % Question 12 Amount % 12. The time it took me to UNDERSTAND how the interface worked was: Slow / Quick1 1 0 877192982 1 1 0 862068966
0
10
20
30
40
1 2 3 4 5 6 7
1 1 0.877192982 1 1 0.8620689662 3 2.631578947 2 3 2.5862068973 13 11.40350877 3 15 12.931034484 11 9.649122807 4 14 12.068965525 25 21.92982456 5 19 16.379310346 33 28.94736842 6 38 32.758620697 28 24.56140351 7 26 22.4137931
1% = 1.14 1% = 1.16SLOW QUICK
0
10
20
30
40
1 2 3 4 5 6 7

Emotion: Average: Emotion: Average: TOTALDESIRE 1.164179104 DESIRE 0.88 1.022089552HOPE 0.776119403 HOPE 0.34 0.558059701PRIDE 0.791044776 PRIDE 0.34 0.565522388
JOY 1.910447761 JOY 1.46 1.685223881ADMIRATION 1.149253731 ADMIRATION 0.8 0.974626866SATISFACTION 0.880597015 SATISFACTION 0.58 0.730298507FASCINATION 1.611940299 FASCINATION 1.52 1.565970149
BOREDOM 1 119402985 BOREDOM 0 98 1 049701493BOREDOM 1.119402985 BOREDOM 0.98 1.049701493DISSATISFACTION 0.47761194 DISSATISFACTION 0.42 0.44880597
CONTEMPT 0.492537313 CONTEMPT 0.5 0.496268657SADNESS 0 462686567 SADNESS 0 22 0 341343284SADNESS 0.462686567 SADNESS 0.22 0.341343284SHAME 0.328358209 SHAME 0.26 0.294179104
FEAR 0.52238806 FEAR 0.74 0.63119403DISGUST 0 686567164 DISGUST 1 2 0.943283582DISGUST 0.686567164 DISGUST 1.2 0.943283582
0 0.5 1 1.5 2 2.5 3 3.5 4
Emotion: Average: Emotion: Average: TOTALDESIRE 2.530612245 DESIRE 2.119402985 2.325007615HOPE 1.285714286 HOPE 1.074626866 1.180170576PRIDE 1.265306122 PRIDE 1.164179104 1.214742613
JOY 2.16 JOY 1.805970149 1.982985075ADMIRATION 2.183673469 ADMIRATION 2.119402985 2.151538227SATISFACTION 1 673469388 SATISFACTION 1 358208955 1 515839171SATISFACTION 1.673469388 SATISFACTION 1.358208955 1.515839171FASCINATION 2.755102041 FASCINATION 2.462686567 2.608894304
BOREDOM 0.530612245 BOREDOM 0.701492537 0.616052391DISSATISFACTION 0 408163265 DISSATISFACTION 0 298507463 0 353335364DISSATISFACTION 0.408163265 DISSATISFACTION 0.298507463 0.353335364
CONTEMPT 0.673469388 CONTEMPT 0.52238806 0.597928724SADNESS 0.346938776 SADNESS 0.104477612 0.225708194SHAME 0 265306122 SHAME 0 119402985 0 192354554SHAME 0.265306122 SHAME 0.119402985 0.192354554
FEAR 0.469387755 FEAR 0.089552239 0.279469997DISGUST 0.428571429 DISGUST 0.343283582 0.385927505
0 0.5 1 1.5 2 2.5 3 3.5 4
35 | P a g e
Appendix F - Online test Comments
Comments 1 - Dragging interface
Groter verschil tussen positieve en negatieve emoties relacionar la talla del icono con la intensidad de mi sentimiento fue mas facil en esta interface. More complicated. Hard to deactivate emotions I didn't feel de emoties zijn te klein aan het begin, waardoor ik ze niet makkelijk kan herkennen. Ik heb soms de behoeft nodig om de tekstuele beschrijving te zien, maar deze kon ik niet makkelijk vinden. I like this one better, because you can actually place the emotion. Since you have to place every emotion, it's no problem the icons are small at first. You drag them out and place them back where you want. This also keeps you more focused on the emotion you have to think about. Me parece dinamica y mas acorde con las emociones que se presentan Las imagenes son un poco pequeñas al iniciar y es dificil acordarse bien de que significa cada animacion.La escala de intensidad es mucho mas clara en esta interface que en la otra. Un texto con el nombre de el sentimiento que sea visible al hacer el roll over sobre cada
animacion seria suficiente.En ambas interfaces seria muy util solo tener que mover las emociones que aplican al caso y no tener que desactivar las demás
No sabía bien como activar los textos de las emociones de las cuales no me acordaba. esta me gusta mas!!!, por que el tamaño de la animacion concuerda con la intensidad de la emocion lo que lo hace mas claro. de textuele toelichting kon ik niet vinden, was in eerste instantie vervelend, omdat ik wist dat het er moest zijn ergens. Maar achteraf kan ik misschien wel concluderen dat die tekst niet echt nodig is...een mens mist niet wat er ook niet is... plaatjes klein aan t begin. plaatjes zijn in het begin wel erg klein menor tiempo de espera por las descripciones textuales. Personalmente creo que esta interface es más fácil de relacionar con la intensidad de las emociones experimentadas. El programa no me permitio clasificar las emociones. I could not get the descriptions of the emotions to work so I had to guess for some of them. The one at 10 o'clock was not one I could identify well. Prefer this one than the other.
36 | P a g e
Although this one was more appealing to the eye, the other one was easier to use. the textual descriptions appear too slowly
Ik vind deze het beste omdat je na het invullen een goed overzicht hebt van wat je gekozen hebt, dat had ik bij die andere interface minder. Don't let the animation play on rollover, just mouse down I had difficulty fing the description, but the use was more interactive and it looks better. No me fue posible encontrar las descripciones textuales, y aunque las animaciones son claras, hace falta una indicación de la emoción que representan. Es claro el concepto de la escala en relación con el nivel de intensidad de las emociones. Es más fácil visualizar y hacer ajustes en el nivel de las emociones con esta escala al estar el tamaño de la animación asociado a la intensidad de la misma Las descripciones textuales no aparecen al pasar el puntero sobre el circulo o al hacer click y hay algunas animaciones que se pueden confundir (ej. sorpresa, admiración) los iconos inicales hacia el centro pueden ser un poco mas grandes con un roll over, ayuda un poco ver la primera interfae para identificar los iconos, tambien la descripcion textual puede activarse un poco mas rapido. en ambas me parece que no todas las expreciones positivas son claras, ni que sus sonidos me hacen sentir lo que veo.
Mooi al asignar un tamano especifico se ascentua el significado de la intesidad visual me senti mas comodo con esta I can't find the icon's description, I sometimes forgot what the icon is all about I think both interfaces should display what they mean, yes some are clear but this is not applicable to all Ik vond deze beter!Misschien moeten ze standaard op uit. Als je iets voelt, kun je die emotie aanzetten, anders moet je ze allemaal een voor een aanzetten intuitiever. it was not easy how I can control the interface. I think, because before using this interface, the previous one was controlled by just clicking, I couldn\'t anticipate the later requires dragging. Het tonen van de naam van de emotie was onduidelijk hard to see the details...too small Dat slepen is een beetje raar, maar misschien komt dat omdat je net ervoor met die andere gewoon klikte op de waarde die je wilde. El tiempo que tarda en aparecer la descripción de cada sensación es demasiado.
37 | P a g e
Me gusta bastante me parece muy interesante the textual description took to long to appear but overall i thought it was more pleasant to use. Beter Would it be possile to have the textual description next to the picture, to avoid the lengthy wait before the description popped up when holding the curser over the emotion? I preferred the this interface. Los iconos de las emociones son pequeñas y es un poco mas díficil identificarlas por el tamaño, aunque la retroalimentación que ofrece la escala una vez que se hizo la evaluación es mejor (el tamaño del icono es más grande de acuerdo a la intensidad) The images are too small in the beginning Ik kon de tekst niet vinden en ik vond het verschil tussen de verschillende niveaus niet zo duidelijk. me parece mejor que la otra The size of the animation gives a nice overview of the intensity of each emotion at the end of the test. Ik kwam er niet achter hoe je de tekstuele uitleg van de emotie te zien kreeg. Vooral daardoor vond ik die andere interface beter. No that clear, and difficult to see the icons not good
i think the growing faces enabled the user to assess his/her feelings much better. As the icon grew, I felt: Oh yes I did feel so happy about this! or no, I did not feel so intensely happy about this. La ventana de texto donde explican la forma de usarlo parece no cambiar de la interfase anterior, por lo tanto pensé que no debía leerla nuevamente. Sin instrucciones no pude usar la interfase fácilmente De plaatjes zijn erg klein, doordat ik de andere interface eerder had gedaan wist ik wat elk plaatje betekende, en waar ze stonden. Als ik hem los zou doen zou ik er denk ik moeite mee hebben. I prefered this interface, however the inital size of the emotions are too small for my liking. for people with not so good eyes and a small screen; which will be encountered a lot in Asia; this interface is hardly recognizeable. I think this one have a nicer interface than the other one. Ze beginnen klein, waardoor de lastiger te herkennen zijn. Verder heb ik volgens mij niet ontdekt hoe ik de tekst erbij kon halen. Het plaatsen van de animaties ging makkelijk en de intensiteit was intuitief. Intuitief werkt dit beter omdat de plaatjes groter worden. Bij mij wrkte de beschrijving niet als ik met de muis bleef hangen, en dit is wel erg handig. Verder vind ik het sowieso wel lastig om heel snel de emoties uit te kiezen, want je voelt stiekem veel verschillende dingen. Tekstuele omschrijving opvragen is onduidelijk. Geen duidelijk onderscheid tussen
38 | P a g e
"beginwaarde" en de "0-waarde". Geen goed overzicht over de verschillende emoties op het begin door de te kleine plaatjes. Drag&drop is voor veel mensen een lastigere move dan gewoon klikken snel rommelig door de overlap van de vergrootte icoontjes Het lijkt nu alsof de startpositie al aangeeft dat het 'geen waarde' is, omdat het icoon doorloopt in de schaal. Bij de andere (iconen buiten een web) is het duidelijker dat je voor elke icoon wat moet kiezen. Verder is deze wel leuker om mee te spelen, maar klikken op de positie waar je hem nu heen moet schrijven zou ook handig zijn. icons are too small. it was not clear how to de-select an emotion. Didn\'t like this interface at all A survey itself usually has a bad reaction due to the time it takes away from more personally productive activities. This interface requires click and drag which requires more effort.
39 | P a g e
Comments 2 - Boxes interface
Groter verschil tussen positieve en negatieve emoties ESTA INTERFACE CREO QUE ES LA MAS CLARA Y DE FACIL ENTENDIMIENTO PARA UNA PERSONA DE CUALQUIER EDAD Easier, faster ik vond het een beetje raar dat ik ze op nul moest zetten. als ik ze niet kies, dan is het toch vanzelfsprekend? I like this one less, obviously. It's more confusing, because all emotions are fairly visible. Difficult to know where to start. es un poco mas complicado y ademas cuando se evalua no representa la emocion como tal,.... me gusta mas la otra alternativa EL tamaño inicial de las imagenes es muy bueno, pero es muy dificil saber exactamente que quiere decir cada animacion.La escala de intensidad de los sentimientos no es tan intuitivaUn texto con el nombre de el sentimiento que sea visible al hacer el roll over sobre cada animacion seria suficiente.En ambas interfaces seria muy util no tener que desactivar las emociones que no aplican. Debería poderse dejar en blanco las emociones que no sentí y no tener que seleccionar una por
una.
het was mij niet helemaal duidelijk dat ze uit waren als je 1 hokje had ingekleurd. ik vind deze versie er professioneler uit zien. en nou weet ik nog steeds niet hoe je die 'tekstuele beschrijving' van de verschillende plaatjes zou kunnen krijgen. tijdens het doen van de demo had ik dit wel nodig, omdat sommige plaatjes niet helemaal duidelijk waren. Tener preactivadas la opcion de "no lo senti", centro del circulo, en todas. Si sentiste algo, pues lo dices, pero evita muchos clicks. Fue sencillo This one was a bit harder and slower to use for me. I like this one better. I didnt even know there were textual descriptions until I read it in the questionaire. I suggest that you have them in both tests with the mouse over but faster that it is in the other one A combination of this interface with the one where you have to drag, would be perfect Looks more old fashioned than the other one. Me quedó más fácil encontrar la descripción textual. Es un poco más complicado la selección del nivel de intensidad de la emoción Funciona bastante bien y es más fácil identificar las animaciones (los círculos son inicialmente más grandes y la descripción textual aparece al hacer
40 | P a g e
click, lo cual no sucede en la otra interface)
me parecio un poco mejor la interface anterior para asignar los valores, ya que hay un cero, y un cien por ciento que se mide atraves del movimiento, en este el valor de no lo siento se asigna y confunde un poco. en ambas me parece que no todas las expreciones positivas son claras, ni que sus sonidos me hacen sentir lo que veo. nog mooier el lenguaje de colores e sun poco confuso el contraste entre rojo y verde claramente hace alucion a malas y buenas emociones pero a su vex senti que efatizaba las malas to find the first point in the center is a bit difficult for beginner...it's not really clear de kleuren binnenin mogen iets duidelijker. bijvoorbeeld geel naar rood goed: klikken opkarakter geeft tekst clear and funny! Deze is in gebruik prettiger dan de andere interace, grotere afbeeldingen vd emoties en je geeft apart de sterkte van de emotie aan. Dat geeft mij gevoelsmatig meer kracht. Wat er goed is aan beide is de kleur verschillen tussen postieve en negatieve emoties. Ik zou de kleur tinten (die de kracht aan geven van de emotie) harder maken. Bijvoorbeeld van Donker rood naar licht rose. Hopelijk kun je hier wat mee.Groetjes clear enough..but I guess some expressions aren't represent the actual feeling...
Ik vind deze overzichtelijker. creo que esta es bastante más fácil de entender y de manejar. Creo que esto es mas sencillo. More visually friendly. However, it is a good idea to have different interfaces, i think. I liked that the tool is dynamic better text but more difficult to use because you work from the inside out but the characters are on the outside. I like the drag on the other one more. That way you always know witch character you are rating. Slechter trate de dejar una casilla sin evaluar para ver que pasaba pero no me indico nada la interfaz creo que esta es más clara Duidelijk! The initial overview of emotions is better on this interface, but at the end the overview is not as good as with the other interface. De start plaatjes zijn groot, dat is duidelijk ok te zien. I prefer this interface, because icons are bigger and easy to identify Good
41 | P a g e
it was not too easy to realize two things: clicking on the meoticon gives you the textual description,the emoticon becomes invisible on the lowest scale but it is not invisible at the beginning of the test. Wellicht is het mogelijk een textuele beschrijving van de gezamelijke emoties te beschrijven. Verder wat meer contrast in de uiteindelijke keuze, maakt het misschien wat duidelijker this interface was ok, looks neat and organised but i didn\'t like the turn off option (ie. select the middle of the circle) you should be able to double click it or something. I like this interface although the gradation from the emotion intensity levels could be more clearer and the emotion shown by the icons could also be more clearer. it's not as atractive as the other one. Deze rommelde vrij veel heen en weer. Animaties gingen spontaan spelen doordat ik niet zo precies met m'n muis bewoog. De 0-waarde waarde zou wat duidelijker kunnen. Verder heeft deze interface mijn voorkeur. toppertje, houden :) Leent zich beter voor overzicht, is wat zakelijker. I liked this interface. It was clear, eady to use and quick to use. Although it was a bit difficult to understand how you could de-select an emotion. The textual explanation should be indicated
continuously next to the icon. This interface was better. I think there should be a way to disable the sound - I don't want the stupid noises when I'm in a room with other people. The pictures / sounds / actions to not clearly describe the emotion felt I was totally reliant on the text. If it was up to me I'd get rid of the animation and the sound and just have the faces with the text of the emotion permanently underneath. I like the concept of being able to choose multiple emotions and I liked the way you had a range for how strongly you felt the emotion. I regularly do surveys online and this isn't something I have seen before. The interface also seemed to load quickly which is good - would this be the case for a longer survey? Good interface, quick and easy to respond. Few might be confusing: Pride/Satisfaction and hope/anticipation the rest are very clear.

![Juan Caicedo - Amazon S3s3.amazonaws.com/zanran_storage/€¦ · Juan Caicedo From: Pronczuk, Jenny [pronczukj@who.int] Sent: 30 June 2006 18:29 To: Juan Caicedo Cc: Meredith, Tim;](https://img.pdfslide.us/doc/110x75/5ba3b6cf09d3f2205e8bdeea/juan-caicedo-amazon-s3s3-juan-caicedo-from-pronczuk-jenny-pronczukjwhoint.jpg)