Embed Size (px)
Citation preview
EARSeL eProceedings 10, 2/2011 149
DESIGNING TEACHING UNITS VIA WEBGIS: REMOTELY SENSED IMAGERY IN THE LANGUAGE CLASSROOM
Nils Lammert-Siepmann, Dennis Edler, Andreas Redecker, and Carsten Jürgens
Ruhr-University Bochum, Geography Department, Bochum, Germany; nils.lammert-siepmann(at)rub.de
ABSTRACT The capabilities of some open source web map client applications allow users to imbed remotely sensed data obtained from free of charge web services into web browser applications via their Ap-plication Programming Interface (API). As an example, Google imagery is one of those interesting sources for different educational applications. The visual base provided by Google can be ex-tended with OpenLayers, an open source JavaScript library, which allows users to link the acoustic dimension with visual spatial representations.
To support language teachers in the design and creation of space-related teaching material, a re-search project named Localized Language Learning (LLL) has been started in the Geomat-ics/Remote Sensing Group at the Ruhr-University Bochum (RUB), Germany. Here, students shall be invited to study linguistic features such as vocabulary, grammar and pronunciation while simul-taneously looking at remotely sensed images on different scales.
The present paper is focused on the project’s technical implementation. In addition, it contains four examples of teaching units that have already been used in an Irish language course at RUB.
INTRODUCTION According to estimations, about 80% of all information has a reference to space (1). So, it is not surprising that the introductory chapters of language textbooks include words which could be rep-resented by visualisations of geographic data and information. These words, especially their spell-ing, are often introduced via maps. Some of these maps are nothing but a poor sketch in black and white. Some of these maps, however, have a nice design and, thus, allow a playful and motivating approach of teaching vocabulary and orthography - but modern techniques of geovisualisation make it possible to go further:
Based on OpenLayers, an open source JavaScript library, users can design their individual WebGIS applications including different information layers. These layers may contain pictoral in-formation – see, for instance, the Google Maps imagery, whose raster image layers are freely ac-cessible. Thanks to its Application Programming Interface (API), Google allows its users to imbed remotely sensed images into their WebGIS applications. This implementation is based on some Hypertext Markup Language (html) programming. In addition to image layers, there are other types of information layers such as vector feature layers. This type of layers is made up of point, line or polygon features. Furthermore, these features contain thematic attributes. Aside from textual in-formation, these attributes may also refer to external data files such as Adobe ® Flash ® anima-tions, videos and sounds. Sound, in terms of language teaching, plays a significant role: it en-hances the teaching of pronunciation as well as intonation, it addresses auditory learners, and, in general, it makes language learning more vivid and interesting (2,3,4). Linked with geographic information, sound supports the communication of additional information through a second sensory mode. Here, by moving “sound around the user” (5) in order “to offload some of the work from our eyes to our ears” (6). Research on the use of sound in multimedia cartography – ‘acoustic cartog-raphy’ (7) – has been few and far between (8,9,10). By today, it has primarily been focused on the use of non-speech audio backing up information already communicated via the visual dimension. The use of “vocal narration” (11), however, allows the communication of additional linguistic infor-mation.
EARSeL eProceedings 10, 2/2011 150
Using open source software, Google’s image layers and audio-visual feature layers, a free of charge WebGIS application called Localized Language Learning (LLL) has been developed in the Geogra-phy Department at the Ruhr-University Bochum (RUB), Germany. The overall aim of LLL is to com-bine the learning and teaching of linguistic features, i.e. grammar, vocabulary, orthography, pronun-ciation and intonation (12), with remotely sensed imagery. So, LLL is an attempt to offer language teachers a - technically - easy way for the creation of individual audio-visual teaching units.
This paper is focused on the project’s technical implementation. Moreover, it shows some exam-ples which have already been used in a beginners’ module for the Irish language at RUB. The module is designed for students of all faculties. The weekly sessions are held in English.
METHODS – TECHNICAL IMPLEMENTATION As mentioned before, the project’s technical implementation is mainly based on OpenLayers, which provides the application’s framework as well as its Graphical User Interface (GUI). In addi-tion to the capabilities of OpenLayers, a few html-code lines support the implementation of freely accessible image layers, such as Google’s mosaic of remotely sensed imagery or the maps pro-vided by OpenStreetMap. Located on a web server, LLL can be accessed via the Internet from basically anywhere at any time.
Whenever teachers wish to use LLL in order to design their own teaching units, they are invited to create their individual feature layer(s). Each feature layer, also called “overlay”, is - technically speaking - an OpenLayers object class whose features are defined as clickable points in the pro-ject’s html file. By a click, they reveal a pop-up window including an object’s English meaning as well as its corresponding Irish equivalent. Furthermore, the pop-up window contains an audio file featuring the object’s pronunciation in either English or Irish. The language of the audio file de-pends on the point symbol that has been clicked before. In addition, there is a link to a wiki inviting the students to discuss either language-specific or geographical topics they are interested in.
The feature layers, however, are committed to the application via GeoServer, an open source server application to make geodata available. This server conveys the standards and conventions of the Web Feature Service (WFS) established by the Open Geospatial Consortium. The WFS standard bears the possibility of editing geodata which have already been displayed. When using the Localized Language Learning Editor, students as well as teachers can extend their interaction with the application. The editor application features the adding of points. The graphical user inter-face enables the users to fulfill this work step by intuition and in an easy way of doing. The points added by the users are immediately saved into the layers, which are used to display the ‘localized’ words. Hence, teachers – and also students – may invent and create their very own learning and teaching materials.
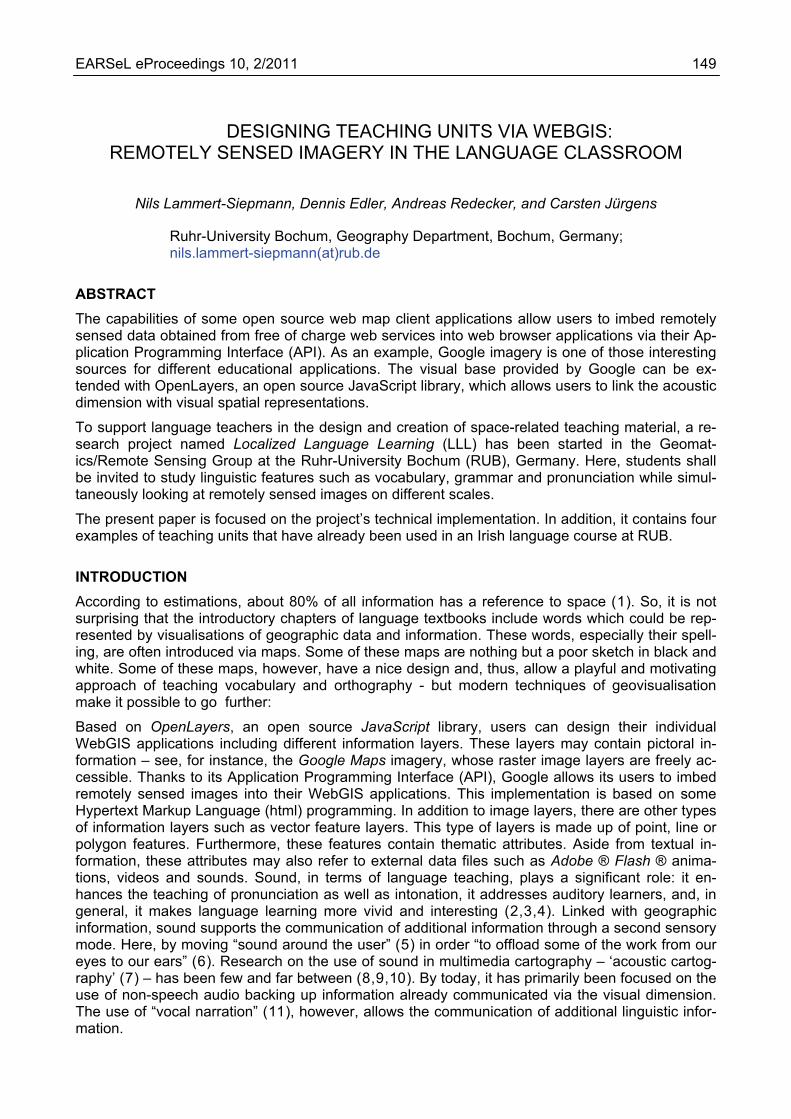
The editor, moreover, is based on GeoExt, a JavaScript toolkit which builds on OpenLayers. To successfully use the capabilities of LLL’s editor, the users need to follow a small series of quite simple work steps: firstly, they have to set a point feature inside the map window, which is usually showing a Google Maps satellite layer. In a second step, the users may specify the English name of the target object. As another option, they may also equip the point feature with an Irish name. Finally, the users are requested to specify the language of the sound file (Figure 1).
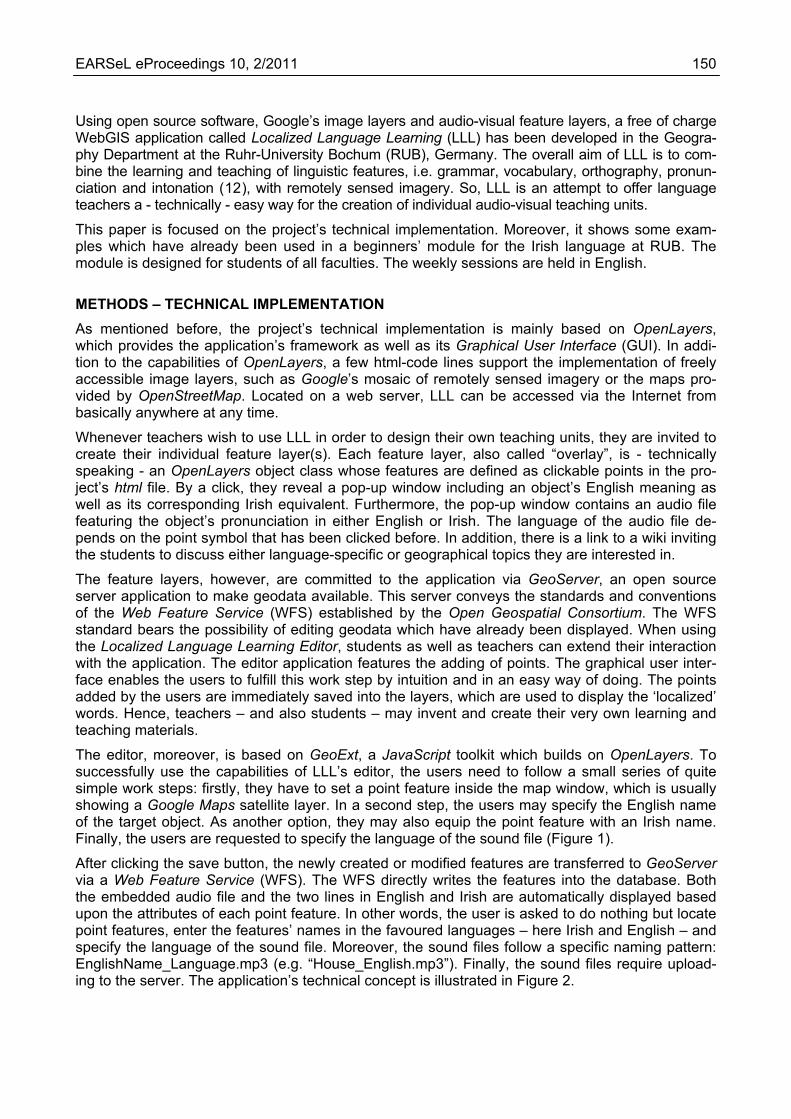
After clicking the save button, the newly created or modified features are transferred to GeoServer via a Web Feature Service (WFS). The WFS directly writes the features into the database. Both the embedded audio file and the two lines in English and Irish are automatically displayed based upon the attributes of each point feature. In other words, the user is asked to do nothing but locate point features, enter the features’ names in the favoured languages – here Irish and English – and specify the language of the sound file. Moreover, the sound files follow a specific naming pattern: EnglishName_Language.mp3 (e.g. “House_English.mp3”). Finally, the sound files require upload-ing to the server. The application’s technical concept is illustrated in Figure 2.
EARSeL eProceedings 10, 2/2011 151
Figure 1: The “Localized Language Learning Editor”, ©2011 Google Maps API, Imagery ©2011. DigitalGlobe, GeoEye, InfoTerra Ltd & Bluesky.
Figure 2: The application’s technical concept.
EXAMPLES Localized Language Learning (LLL), in general, should not be regarded as a finalised application supporting the very limited number of Irish language learners only. It is rather a future-oriented ‘web stage’ which has especially been opened for language teachers. These teachers may indi-vidually design LLL to create fruitful cross curriculum teaching aids. It is obvious that the main idea of the project is to simplify the establishment of e-learning and blended learning materials and, thus, to support language teachers who appreciate remotely sensed imagery, maps and interactive online media in general. The individual teaching units created by the teachers shall be protected by passwords. In this way, the protection of their data content can be guaranteed – it cannot be modi-fied by any random user of the general public. The following examples, which have already been used in Irish language teaching at the Ruhr-University Bochum (RUB), may indicate the potential of
EARSeL eProceedings 10, 2/2011 152
LLL. To watch a screencast introducing to some of the following examples, please click on: http://geo-lingo.geomatik.rub.de/localizedlanguagelearning/screencast.html
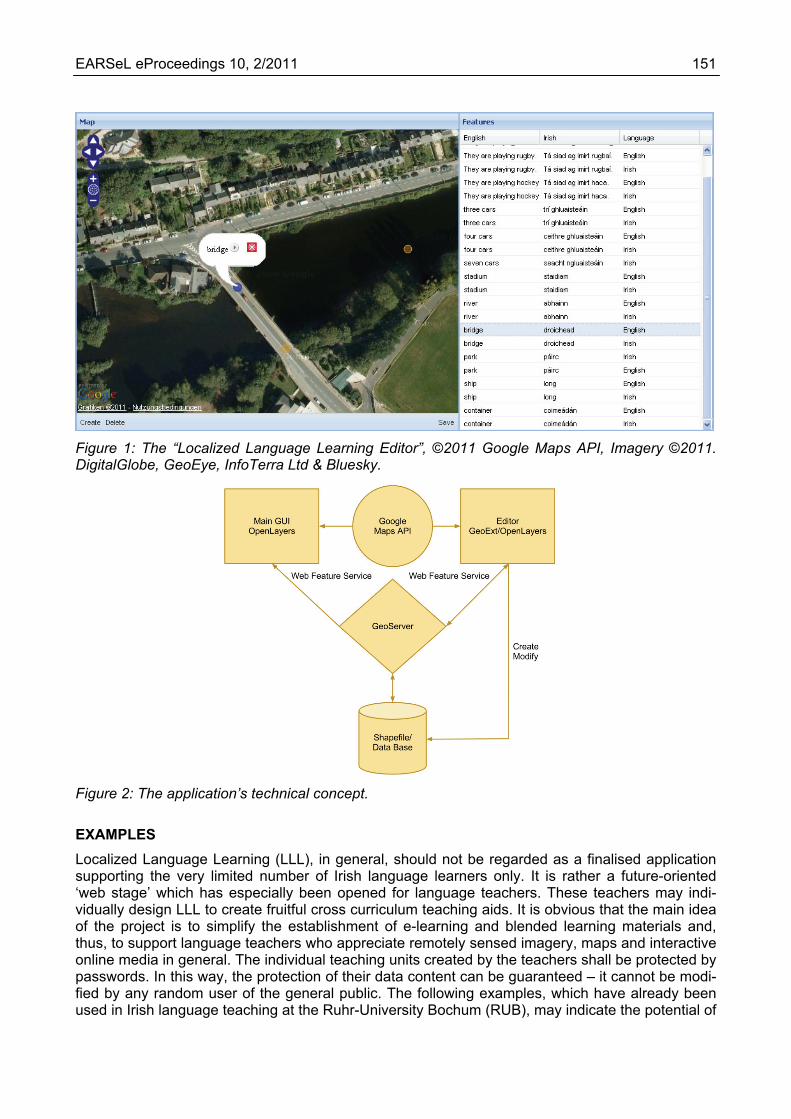
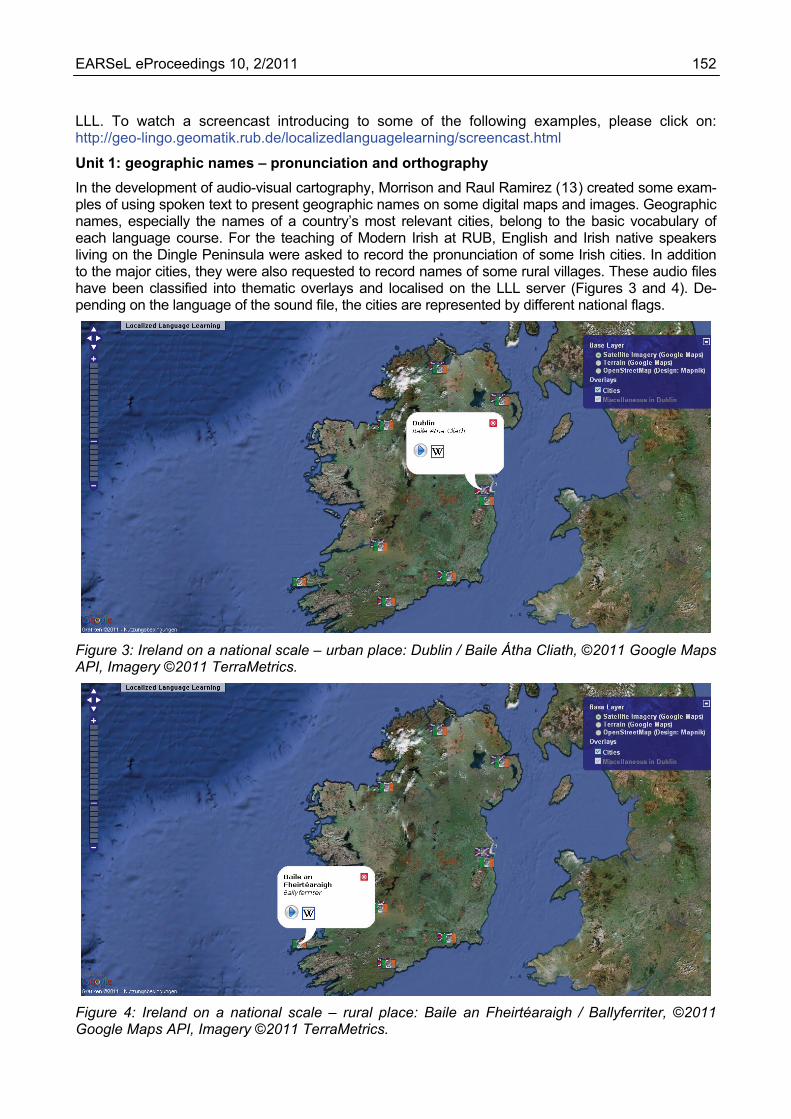
Unit 1: geographic names – pronunciation and orthography In the development of audio-visual cartography, Morrison and Raul Ramirez (13) created some exam-ples of using spoken text to present geographic names on some digital maps and images. Geographic names, especially the names of a country’s most relevant cities, belong to the basic vocabulary of each language course. For the teaching of Modern Irish at RUB, English and Irish native speakers living on the Dingle Peninsula were asked to record the pronunciation of some Irish cities. In addition to the major cities, they were also requested to record names of some rural villages. These audio files have been classified into thematic overlays and localised on the LLL server (Figures 3 and 4). De-pending on the language of the sound file, the cities are represented by different national flags.
Figure 3: Ireland on a national scale – urban place: Dublin / Baile Átha Cliath, ©2011 Google Maps API, Imagery ©2011 TerraMetrics.
Figure 4: Ireland on a national scale – rural place: Baile an Fheirtéaraigh / Ballyferriter, ©2011 Google Maps API, Imagery ©2011 TerraMetrics.
EARSeL eProceedings 10, 2/2011 153
The idea of this teaching unit is, first of all, to introduce the students to Ireland’s most important urban areas and some – rather unknown – rural areas. Unlike printed maps in textbooks, students, here, may vary the zoom level. Thanks to the flexibility of Google’s zoom level, students can make their own ‘virtual field trips’ (14) to Ireland’s urban areas at different scales. Having discovered – or even rediscovered – some of the tagged places, the users are now asked to click on the flags and, thus, to activate the pop-up windows. Now, the students are confronted with the orthography of both the Irish and English place name. After reading this ‘virtual bilingual vocabulary unit’, the final step requires pressing the play button, and the respective audio file will be played.
This educational unit comprises three educational stages: discovering the optical imagery, reading the place name and listening to the pronunciation of the place name. The general concept of this unit is to provide Irish language students with an audio-visual vocabulary practice in tandem with the discovery of the country’s urban and rural areas.
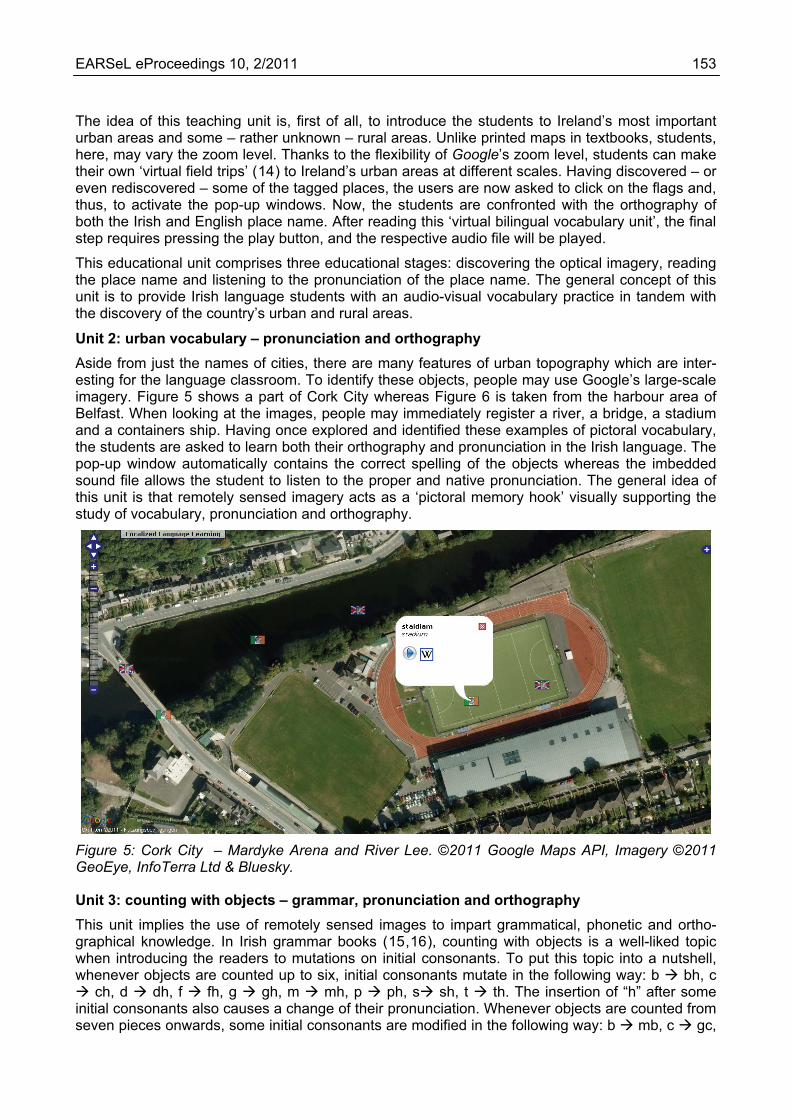
Unit 2: urban vocabulary – pronunciation and orthography Aside from just the names of cities, there are many features of urban topography which are inter-esting for the language classroom. To identify these objects, people may use Google’s large-scale imagery. Figure 5 shows a part of Cork City whereas Figure 6 is taken from the harbour area of Belfast. When looking at the images, people may immediately register a river, a bridge, a stadium and a containers ship. Having once explored and identified these examples of pictoral vocabulary, the students are asked to learn both their orthography and pronunciation in the Irish language. The pop-up window automatically contains the correct spelling of the objects whereas the imbedded sound file allows the student to listen to the proper and native pronunciation. The general idea of this unit is that remotely sensed imagery acts as a ‘pictoral memory hook’ visually supporting the study of vocabulary, pronunciation and orthography.
Figure 5: Cork City – Mardyke Arena and River Lee. ©2011 Google Maps API, Imagery ©2011 GeoEye, InfoTerra Ltd & Bluesky.
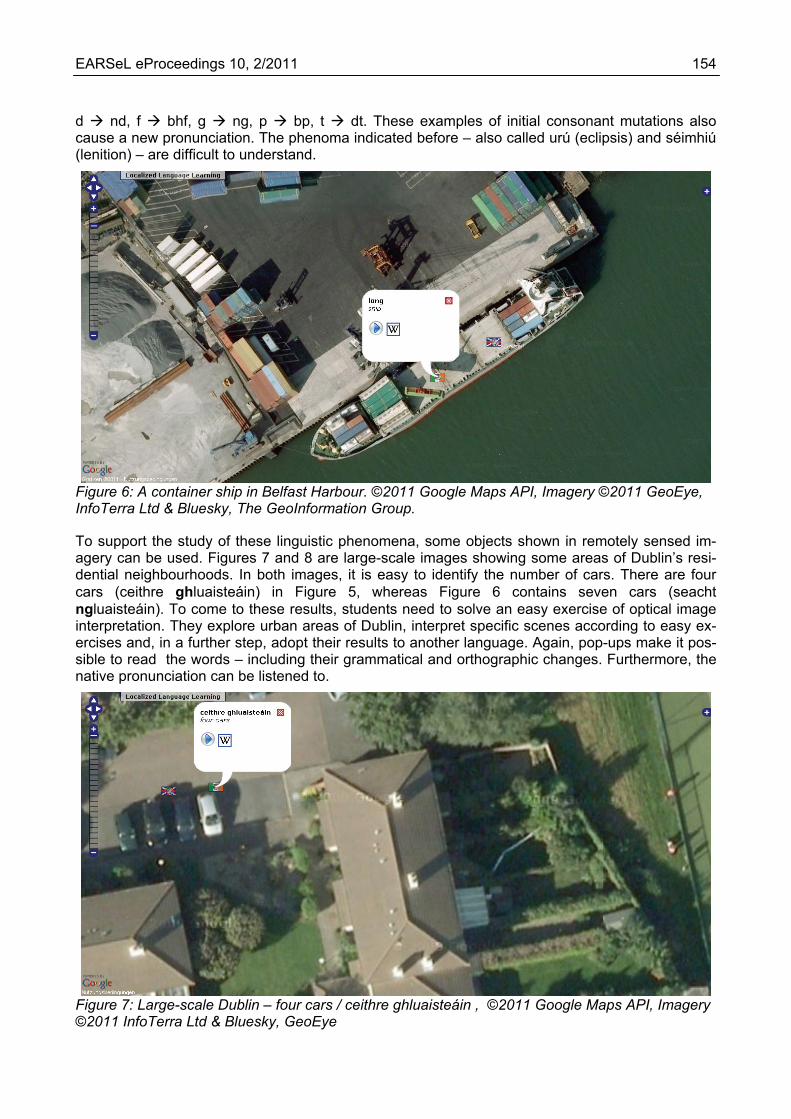
Unit 3: counting with objects – grammar, pronunciation and orthography This unit implies the use of remotely sensed images to impart grammatical, phonetic and ortho-graphical knowledge. In Irish grammar books (15,16), counting with objects is a well-liked topic when introducing the readers to mutations on initial consonants. To put this topic into a nutshell, whenever objects are counted up to six, initial consonants mutate in the following way: b bh, c
ch, d dh, f fh, g gh, m mh, p ph, s sh, t th. The insertion of “h” after some initial consonants also causes a change of their pronunciation. Whenever objects are counted from seven pieces onwards, some initial consonants are modified in the following way: b mb, c gc,
EARSeL eProceedings 10, 2/2011 154
d nd, f bhf, g ng, p bp, t dt. These examples of initial consonant mutations also cause a new pronunciation. The phenoma indicated before – also called urú (eclipsis) and séimhiú (lenition) – are difficult to understand.
Figure 6: A container ship in Belfast Harbour. ©2011 Google Maps API, Imagery ©2011 GeoEye, InfoTerra Ltd & Bluesky, The GeoInformation Group.
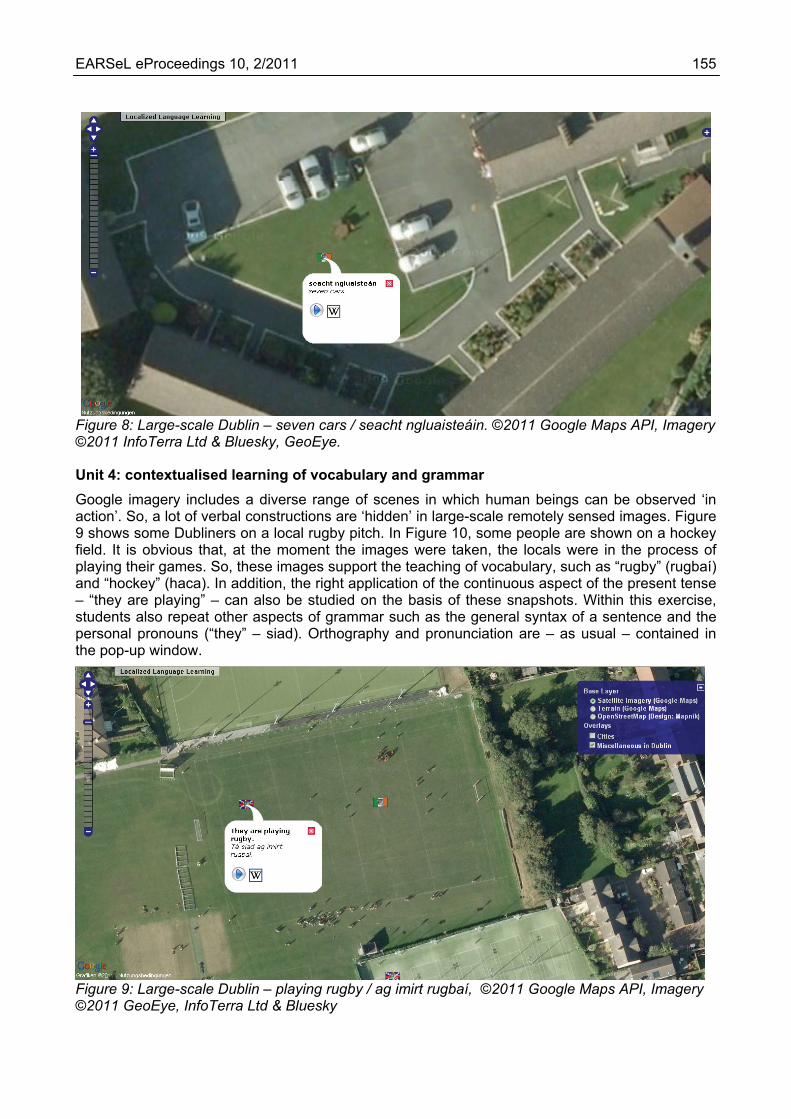
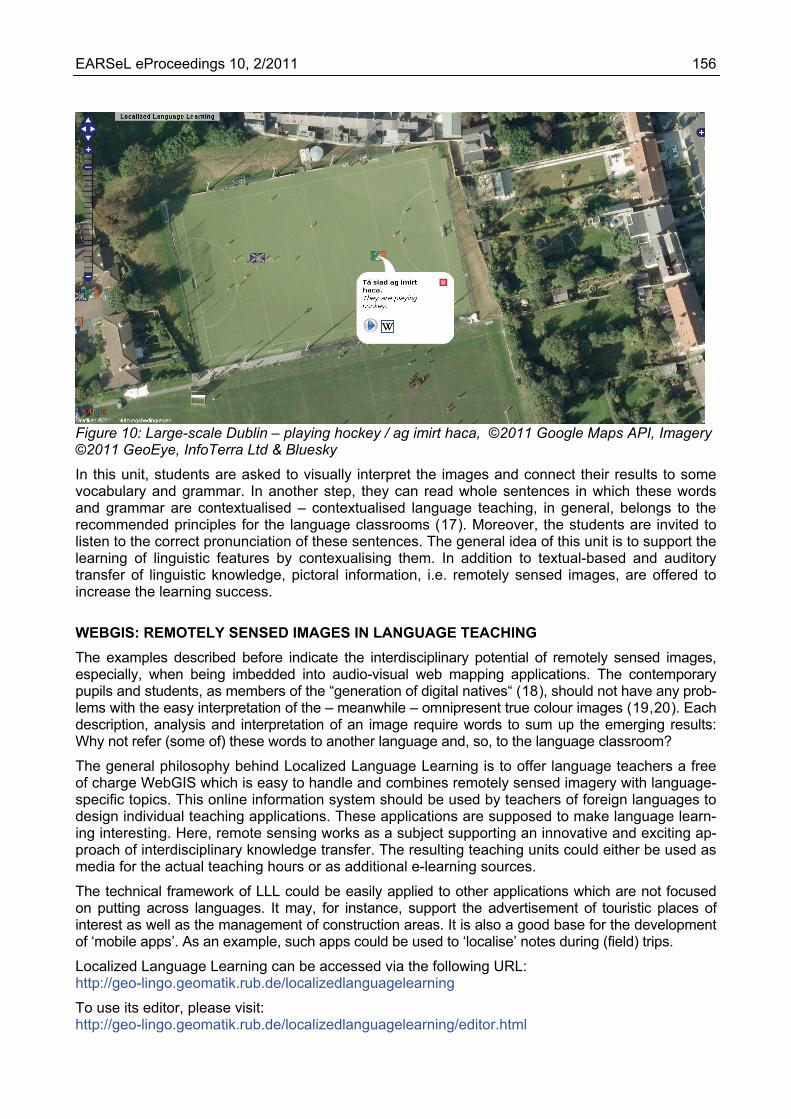
To support the study of these linguistic phenomena, some objects shown in remotely sensed im-agery can be used. Figures 7 and 8 are large-scale images showing some areas of Dublin’s resi-dential neighbourhoods. In both images, it is easy to identify the number of cars. There are four cars (ceithre ghluaisteáin) in Figure 5, whereas Figure 6 contains seven cars (seacht ngluaisteáin). To come to these results, students need to solve an easy exercise of optical image interpretation. They explore urban areas of Dublin, interpret specific scenes according to easy ex-ercises and, in a further step, adopt their results to another language. Again, pop-ups make it pos-sible to read the words – including their grammatical and orthographic changes. Furthermore, the native pronunciation can be listened to.
Figure 7: Large-scale Dublin – four cars / ceithre ghluaisteáin , ©2011 Google Maps API, Imagery ©2011 InfoTerra Ltd & Bluesky, GeoEye
EARSeL eProceedings 10, 2/2011 155
Figure 8: Large-scale Dublin – seven cars / seacht ngluaisteáin. ©2011 Google Maps API, Imagery ©2011 InfoTerra Ltd & Bluesky, GeoEye.
Unit 4: contextualised learning of vocabulary and grammar Google imagery includes a diverse range of scenes in which human beings can be observed ‘in action’. So, a lot of verbal constructions are ‘hidden’ in large-scale remotely sensed images. Figure 9 shows some Dubliners on a local rugby pitch. In Figure 10, some people are shown on a hockey field. It is obvious that, at the moment the images were taken, the locals were in the process of playing their games. So, these images support the teaching of vocabulary, such as “rugby” (rugbaí) and “hockey” (haca). In addition, the right application of the continuous aspect of the present tense – “they are playing” – can also be studied on the basis of these snapshots. Within this exercise, students also repeat other aspects of grammar such as the general syntax of a sentence and the personal pronouns (“they” – siad). Orthography and pronunciation are – as usual – contained in the pop-up window.
Figure 9: Large-scale Dublin – playing rugby / ag imirt rugbaí, ©2011 Google Maps API, Imagery ©2011 GeoEye, InfoTerra Ltd & Bluesky
EARSeL eProceedings 10, 2/2011 156
Figure 10: Large-scale Dublin – playing hockey / ag imirt haca, ©2011 Google Maps API, Imagery ©2011 GeoEye, InfoTerra Ltd & Bluesky
In this unit, students are asked to visually interpret the images and connect their results to some vocabulary and grammar. In another step, they can read whole sentences in which these words and grammar are contextualised – contextualised language teaching, in general, belongs to the recommended principles for the language classrooms (17). Moreover, the students are invited to listen to the correct pronunciation of these sentences. The general idea of this unit is to support the learning of linguistic features by contexualising them. In addition to textual-based and auditory transfer of linguistic knowledge, pictoral information, i.e. remotely sensed images, are offered to increase the learning success.
WEBGIS: REMOTELY SENSED IMAGES IN LANGUAGE TEACHING
The examples described before indicate the interdisciplinary potential of remotely sensed images, especially, when being imbedded into audio-visual web mapping applications. The contemporary pupils and students, as members of the “generation of digital natives“ (18), should not have any prob-lems with the easy interpretation of the – meanwhile – omnipresent true colour images (19,20). Each description, analysis and interpretation of an image require words to sum up the emerging results: Why not refer (some of) these words to another language and, so, to the language classroom?
The general philosophy behind Localized Language Learning is to offer language teachers a free of charge WebGIS which is easy to handle and combines remotely sensed imagery with language-specific topics. This online information system should be used by teachers of foreign languages to design individual teaching applications. These applications are supposed to make language learn-ing interesting. Here, remote sensing works as a subject supporting an innovative and exciting ap-proach of interdisciplinary knowledge transfer. The resulting teaching units could either be used as media for the actual teaching hours or as additional e-learning sources.
The technical framework of LLL could be easily applied to other applications which are not focused on putting across languages. It may, for instance, support the advertisement of touristic places of interest as well as the management of construction areas. It is also a good base for the development of ‘mobile apps’. As an example, such apps could be used to ‘localise’ notes during (field) trips.
Localized Language Learning can be accessed via the following URL: http://geo-lingo.geomatik.rub.de/localizedlanguagelearning
To use its editor, please visit: http://geo-lingo.geomatik.rub.de/localizedlanguagelearning/editor.html
EARSeL eProceedings 10, 2/2011 157
ACKNOWLEDGEMENTS The authors wish to thank the anonymous native speakers participating in the project.
REFERENCES 1 BMU (Federal Ministry for the Environment, Nature Conservation and Nuclear Safety, Berlin),
2008. Digitale Geodaten werden einfacher zugänglich. Press Release 163/08 (last date ac-cessed: 12 Oct 2011)
2 Edler D, 2010. ’Native’ sound maps, 3D-modelling and remote sensing in an interactive tutorial for teaching modern Irish as a foreign language. In: Visualising the World: From the Sea-bed to the Cloud-tops, edited by F Cawkwell & N Dwyer (RSPSoc, Cork) 8 pp.
3 Edler D & N Lammert-Siepmann, 2010. Approaching the acoustic dimension in cartographic theory and practice: an example of mapping Estonia(n). meta-carto-semiotics, 3: 1-15
4 Edler D & J Dodt, 2010. Eine audio-visuelle Flash-Applikation als Lehrmittel zur Fremdspra-chenvermittlung. Kartographische Nachrichten, 60 (5): 276-278
5 Mitbø T, 2001. Perception of time variables on dynamic maps. In: Proceedings of the 20th In-ternational Cartographic Conference (Beijing, China) 8 pp. (WORD document, last date ac-cessed: 15 Oct 2011)
6 Harrower M, 2007. The cognitive limits of animated maps. Cartographica, 42 (4): 349-357
7 Müller J-C, H Scharlach & M Jäger, 2001. Der Weg zu einer akustischen Kartographie. Karto-graphische Nachrichten, 47(2): 41-51
8 Brauen G, 2006. Designing interactive sound maps using scalable vector graphics. Carto-graphica, 41(1): 59-71
9 Théberge P, 2005. Sound maps: music and sound in cybercartography. In: Cybercartography: Theory and Practice, edited by D R Fraser Taylor, 389-410
10 Caquard S, 2001. Des cartes multimedias dans le débat public. Pour une nouvelle conception de la cartographie appliqué à la gestion de l’eau (PhD Thesis, Université Jean Monet Saint-Etienne) 277 pp. (last date accessed: 12 Oct 2011)
11 Krygier J, 1994. Sound and geographic visualization. In: Visualization in Modern Cartography, edited by A MacEachren & D R Fraser Taylor, 149-166
12 Council of Europe, 2001. Common European Framework of Reference for Languages: Learn-ing, Teaching, Assessment (CUP) 276 pp. (last date accessed: 12 Oct 2011)
13 Morrison J L & J Raul Ramirez, 2001. Integrating audio and user-controlled text to query digital databases and to present geographic names on digital maps and images. In: Proceedings of the 20th International Cartographic Conference (Beijing, China) 8 pp. (WORD document, last date accessed: 15 Oct 2011)
14 Chan M & F Dickmann, 2010. “Virtuelle Exkursionen” im Internet. Die Nutzung frei zugängli-cher Informationen auf interaktiven Webseiten (Bochum University Press) 88 pp.
15 Mac Congáil N, 2004. Irish Grammar Book (Cló Iar-Chonnachta) 222 pp.
16 McConagle N, 1998. Irish Grammar: A Basic Handbook (Hippocrene Books) 100 pp.
17 Hinkel E, 2005. Handbook of Research in Second Language Teaching and Learning (Routledge) 1176 pp.
18 Wilson J J, 2008. How to Teach Listening (Pearson Longman) 192 pp.
EARSeL eProceedings 10, 2/2011 158
19 Neumann-Mayer U-P, 2006. Der Zugang zu Satellitenbildern in der Orientierungsstufe – Prob-
leme und Möglichkeiten (Dissertation, Kiel University) 274 pp.
20 Naumann S, A Siegmund, R Ditter, M Haspel, M Jahn & A Siegmund, 2009. Remote sensing in school – Theoretical concept and practical implementation. In: E-Learning Tools, Tech-niques and Applications, edited by G König & H Lehmann (ISPRS, Potsdam) 8 pp. (last date accessed: 15 Oct 2011)