Embed Size (px)
Citation preview
Designing SQL Server 2012 Analysis
Services Cubes using Dillard’s Dataset
Updated May 18, 2012
Using Microsoft’s Business Intelligence Suite to Design Cubes
Once you receive your University of Arkansas MEC account, access will be via remote desktop connection. Remote
access documentation is at the following link:
http://enterprise.waltoncollege.uark.edu/Remote_Desktop_MEC_GW.pdf
Microsoft’s Business Intelligence Suite provides tools that assist in all phases of business intelligence from building the
data warehouse, creating and analyzing cubes to data mining. The following provides a cube designing example using the
UA_Dillards database.
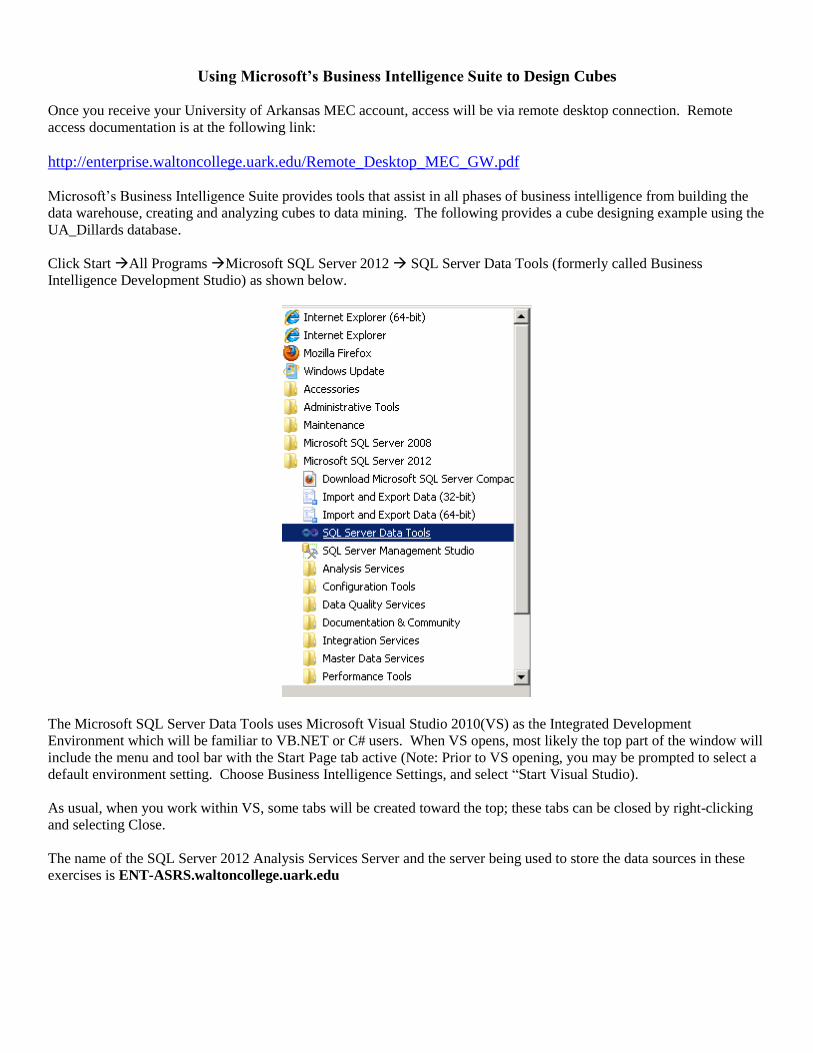
Click Start All Programs Microsoft SQL Server 2012 SQL Server Data Tools (formerly called Business
Intelligence Development Studio) as shown below.
The Microsoft SQL Server Data Tools uses Microsoft Visual Studio 2010(VS) as the Integrated Development
Environment which will be familiar to VB.NET or C# users. When VS opens, most likely the top part of the window will
include the menu and tool bar with the Start Page tab active (Note: Prior to VS opening, you may be prompted to select a
default environment setting. Choose Business Intelligence Settings, and select “Start Visual Studio).
As usual, when you work within VS, some tabs will be created toward the top; these tabs can be closed by right-clicking
and selecting Close.
The name of the SQL Server 2012 Analysis Services Server and the server being used to store the data sources in these
exercises is ENT-ASRS.waltoncollege.uark.edu
Designing a Cube using SSAS
Last updated 5/17/2012 2:10 PM Page - 3 -
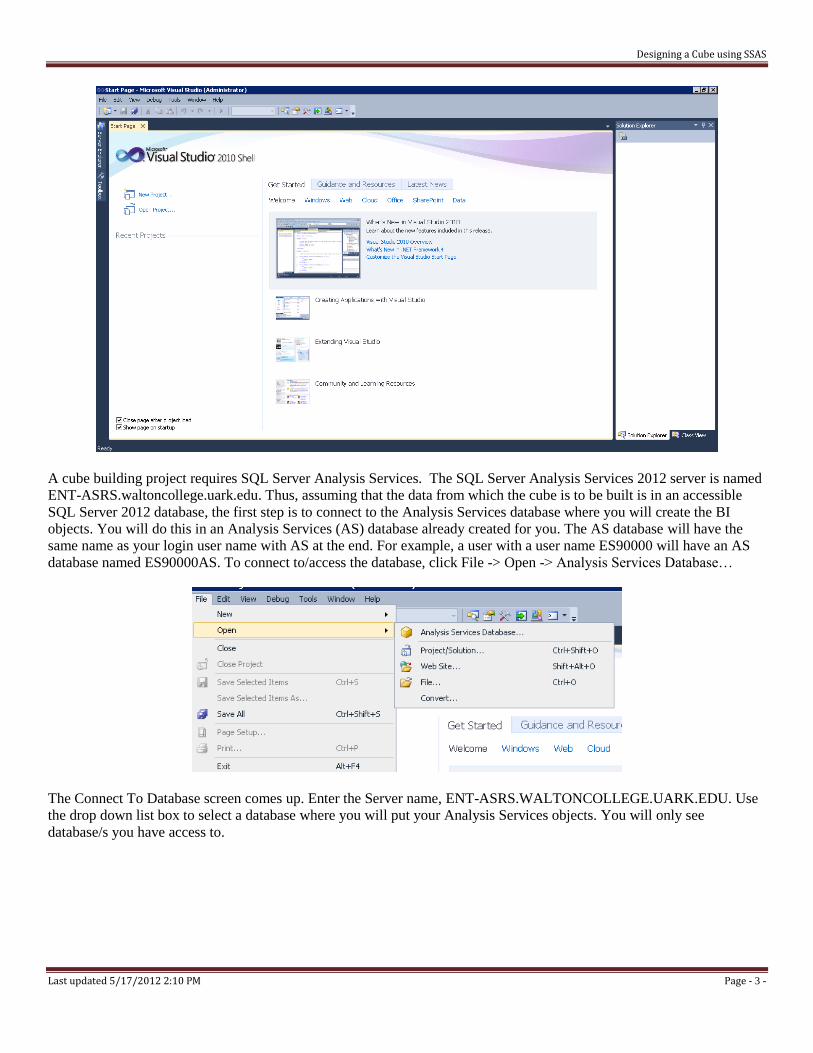
A cube building project requires SQL Server Analysis Services. The SQL Server Analysis Services 2012 server is named
ENT-ASRS.waltoncollege.uark.edu. Thus, assuming that the data from which the cube is to be built is in an accessible
SQL Server 2012 database, the first step is to connect to the Analysis Services database where you will create the BI
objects. You will do this in an Analysis Services (AS) database already created for you. The AS database will have the
same name as your login user name with AS at the end. For example, a user with a user name ES90000 will have an AS
database named ES90000AS. To connect to/access the database, click File -> Open -> Analysis Services Database…
The Connect To Database screen comes up. Enter the Server name, ENT-ASRS.WALTONCOLLEGE.UARK.EDU. Use
the drop down list box to select a database where you will put your Analysis Services objects. You will only see
database/s you have access to.
Designing a Cube using SSAS
Last updated 5/17/2012 2:10 PM Page - 4 -
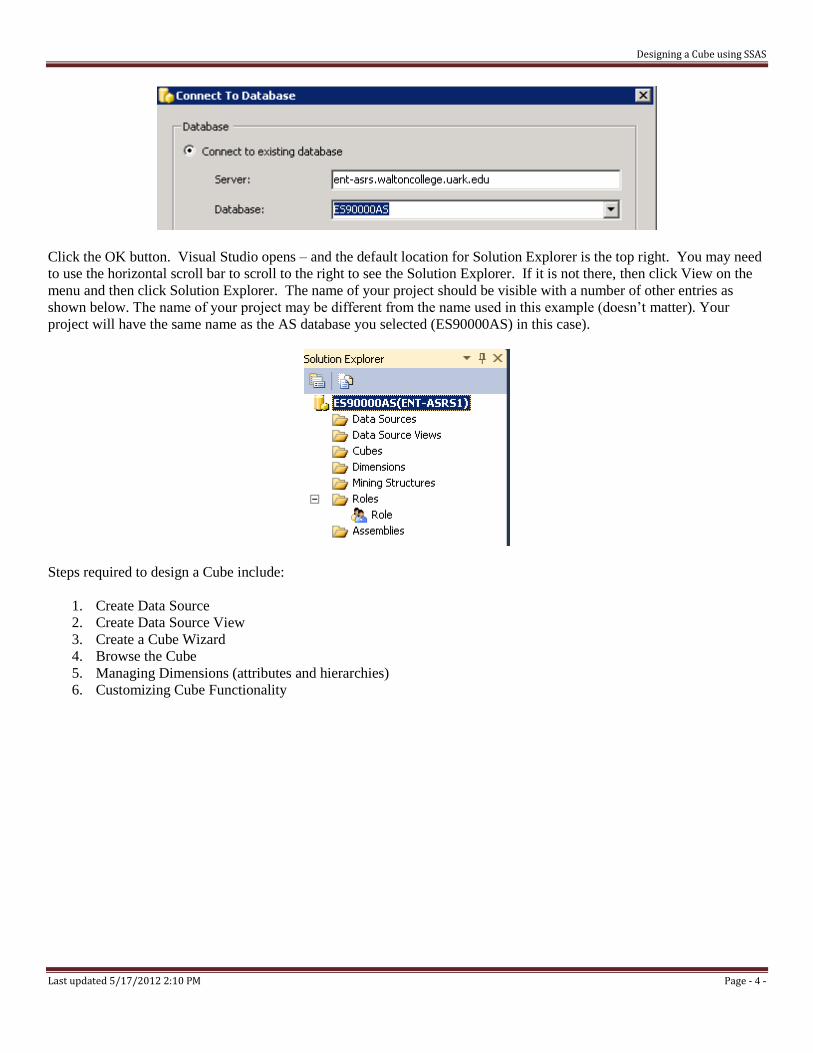
Click the OK button. Visual Studio opens – and the default location for Solution Explorer is the top right. You may need
to use the horizontal scroll bar to scroll to the right to see the Solution Explorer. If it is not there, then click View on the
menu and then click Solution Explorer. The name of your project should be visible with a number of other entries as
shown below. The name of your project may be different from the name used in this example (doesn’t matter). Your
project will have the same name as the AS database you selected (ES90000AS) in this case).
Steps required to design a Cube include:
1. Create Data Source
2. Create Data Source View
3. Create a Cube Wizard
4. Browse the Cube
5. Managing Dimensions (attributes and hierarchies)
6. Customizing Cube Functionality
Designing a Cube using SSAS
Last updated 5/17/2012 2:10 PM Page - 5 -
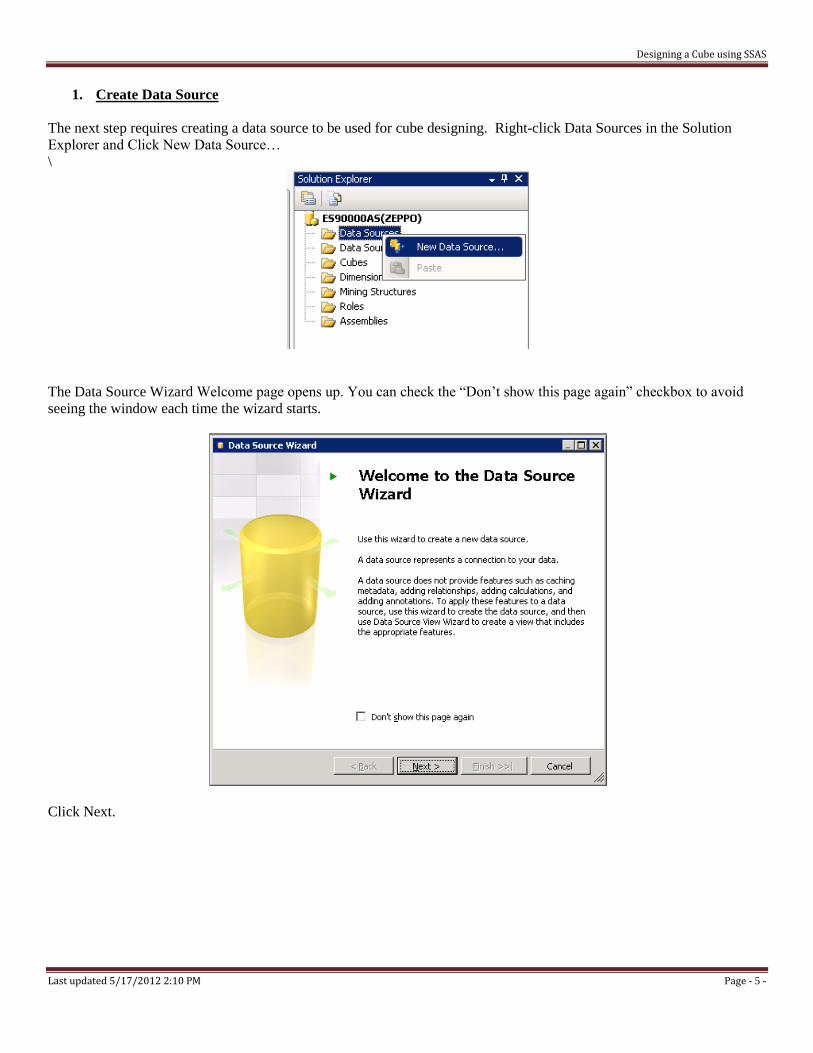
1. Create Data Source
The next step requires creating a data source to be used for cube designing. Right-click Data Sources in the Solution
Explorer and Click New Data Source…
\
The Data Source Wizard Welcome page opens up. You can check the “Don’t show this page again” checkbox to avoid
seeing the window each time the wizard starts.
Click Next.
Designing a Cube using SSAS
Last updated 5/17/2012 2:10 PM Page - 6 -
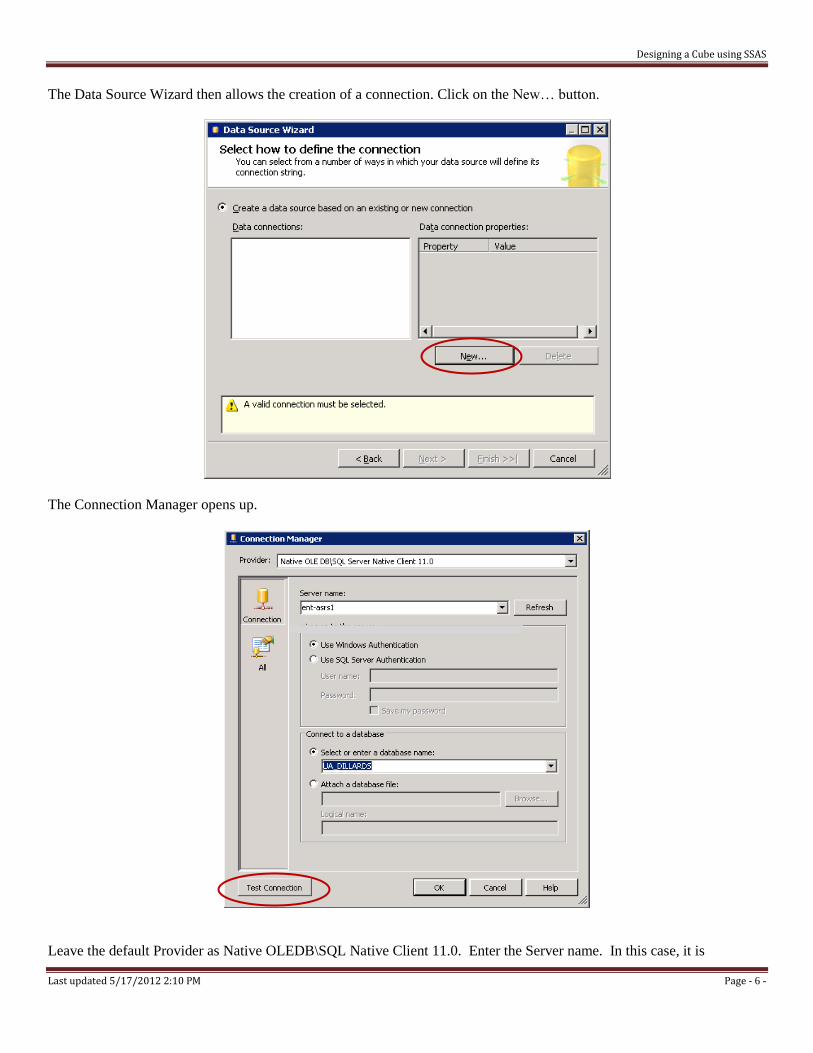
The Data Source Wizard then allows the creation of a connection. Click on the New… button.
The Connection Manager opens up.
Leave the default Provider as Native OLEDB\SQL Native Client 11.0. Enter the Server name. In this case, it is
Designing a Cube using SSAS
Last updated 5/17/2012 2:10 PM Page - 7 -
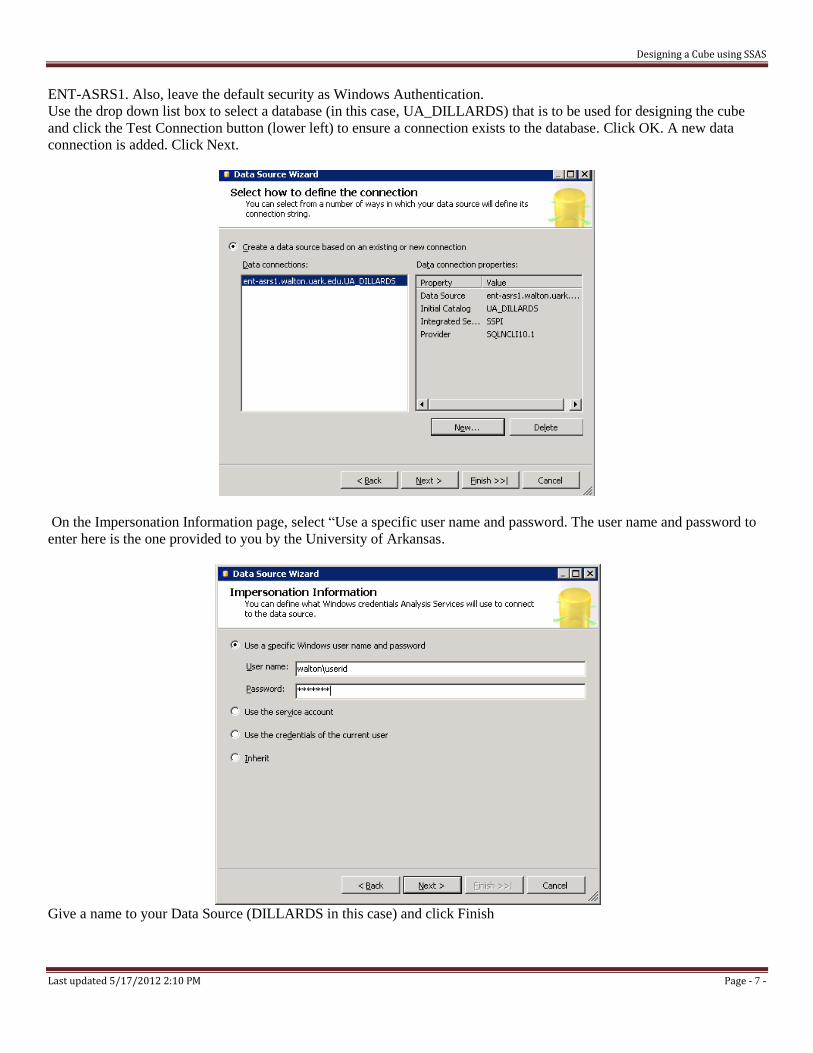
ENT-ASRS1. Also, leave the default security as Windows Authentication.
Use the drop down list box to select a database (in this case, UA_DILLARDS) that is to be used for designing the cube
and click the Test Connection button (lower left) to ensure a connection exists to the database. Click OK. A new data
connection is added. Click Next.
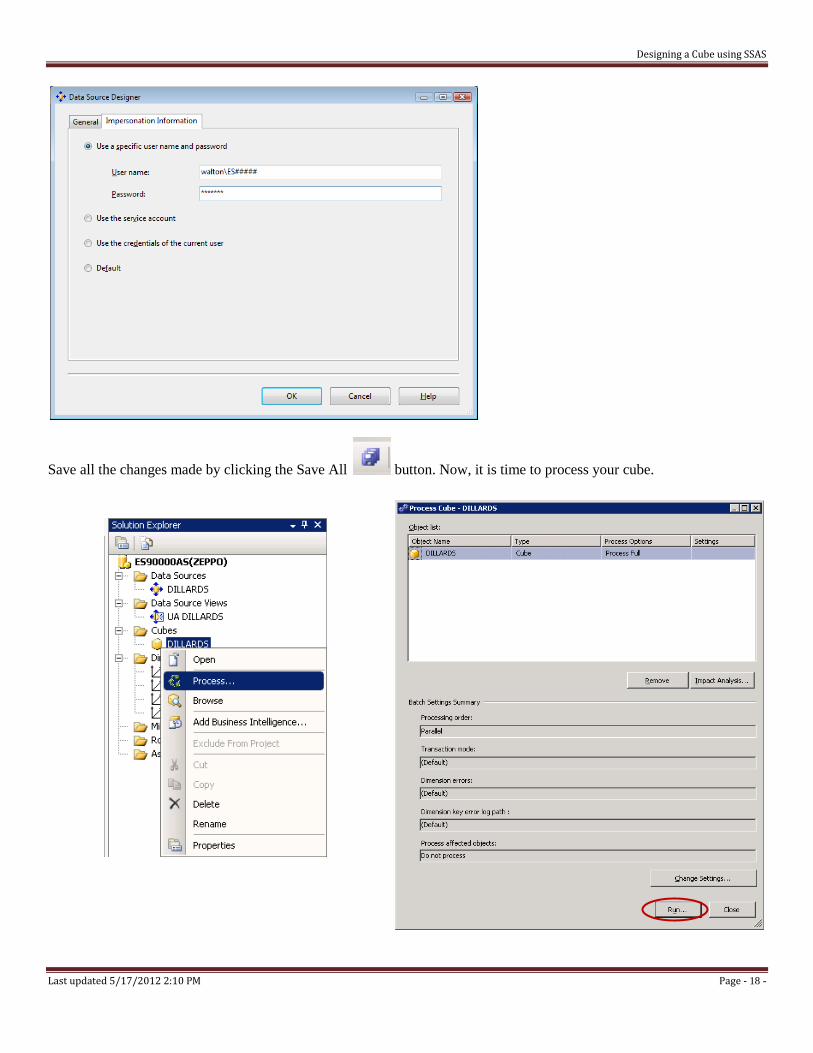
On the Impersonation Information page, select “Use a specific user name and password. The user name and password to
enter here is the one provided to you by the University of Arkansas.
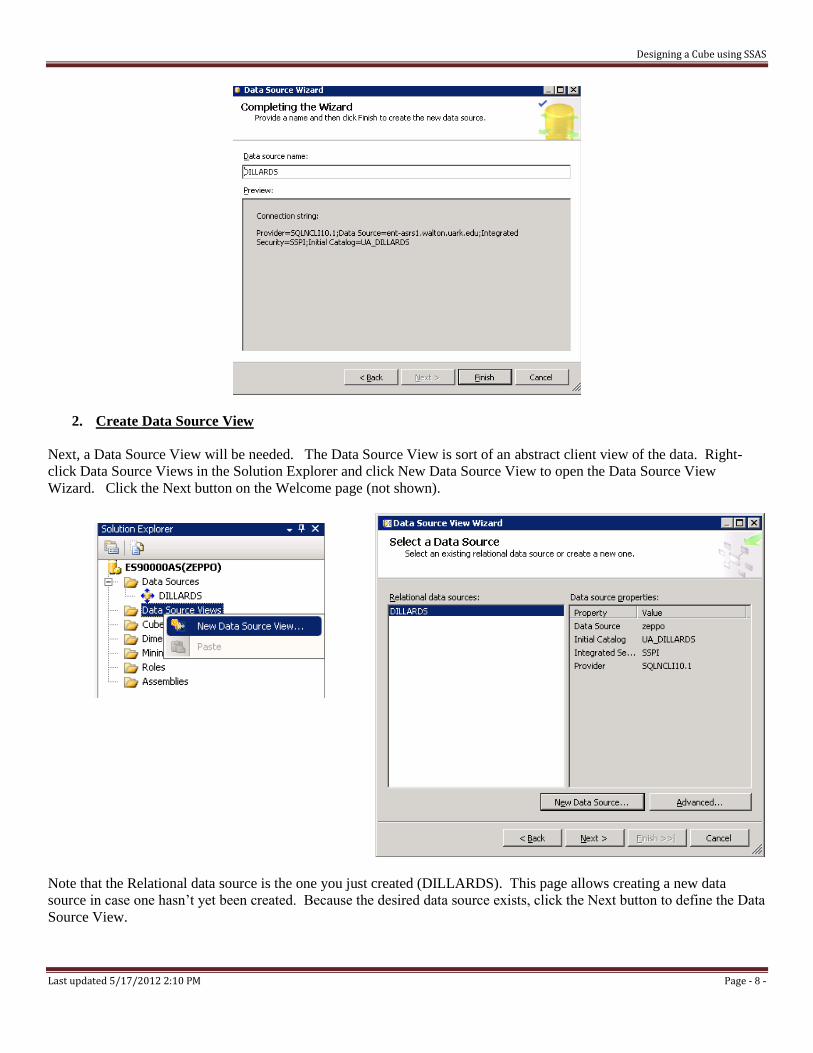
Give a name to your Data Source (DILLARDS in this case) and click Finish
Designing a Cube using SSAS
Last updated 5/17/2012 2:10 PM Page - 8 -
2. Create Data Source View
Next, a Data Source View will be needed. The Data Source View is sort of an abstract client view of the data. Right-
click Data Source Views in the Solution Explorer and click New Data Source View to open the Data Source View
Wizard. Click the Next button on the Welcome page (not shown).
Note that the Relational data source is the one you just created (DILLARDS). This page allows creating a new data
source in case one hasn’t yet been created. Because the desired data source exists, click the Next button to define the Data
Source View.
Designing a Cube using SSAS
Last updated 5/17/2012 2:10 PM Page - 9 -
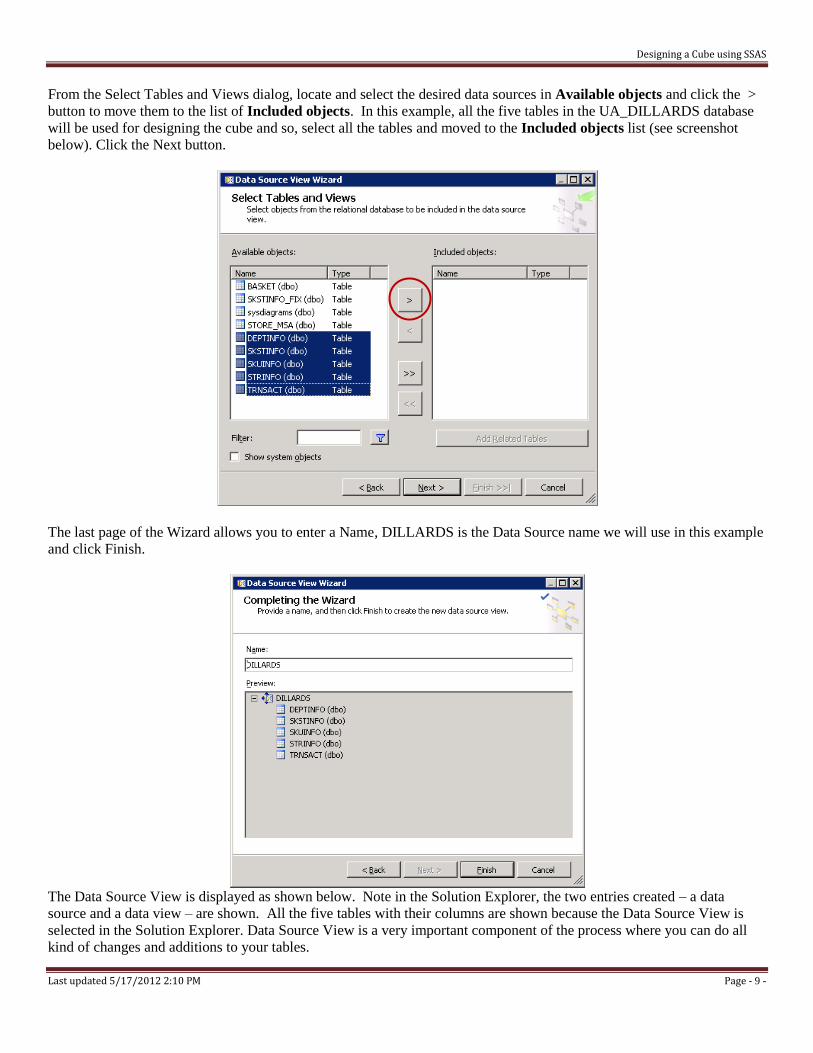
From the Select Tables and Views dialog, locate and select the desired data sources in Available objects and click the >
button to move them to the list of Included objects. In this example, all the five tables in the UA_DILLARDS database
will be used for designing the cube and so, select all the tables and moved to the Included objects list (see screenshot
below). Click the Next button.
The last page of the Wizard allows you to enter a Name, DILLARDS is the Data Source name we will use in this example
and click Finish.
The Data Source View is displayed as shown below. Note in the Solution Explorer, the two entries created – a data
source and a data view – are shown. All the five tables with their columns are shown because the Data Source View is
selected in the Solution Explorer. Data Source View is a very important component of the process where you can do all
kind of changes and additions to your tables.
Designing a Cube using SSAS
Last updated 5/17/2012 2:10 PM Page - 10 -
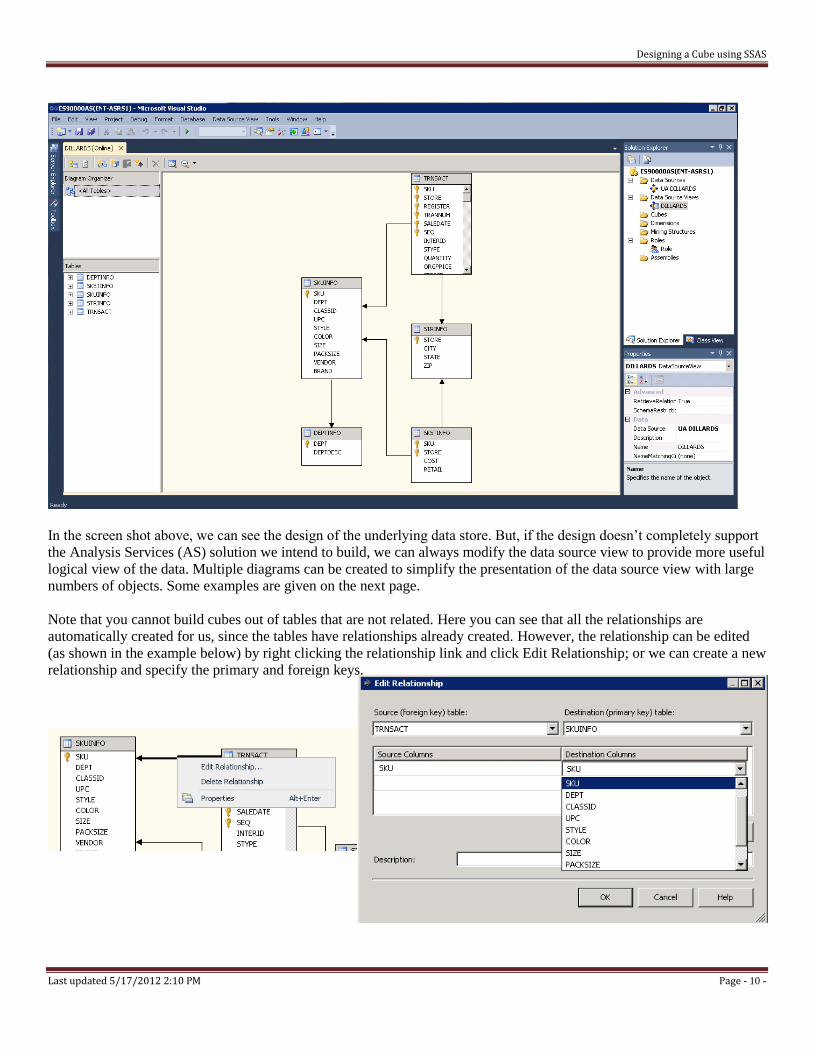
In the screen shot above, we can see the design of the underlying data store. But, if the design doesn’t completely support
the Analysis Services (AS) solution we intend to build, we can always modify the data source view to provide more useful
logical view of the data. Multiple diagrams can be created to simplify the presentation of the data source view with large
numbers of objects. Some examples are given on the next page.
Note that you cannot build cubes out of tables that are not related. Here you can see that all the relationships are
automatically created for us, since the tables have relationships already created. However, the relationship can be edited
(as shown in the example below) by right clicking the relationship link and click Edit Relationship; or we can create a new
relationship and specify the primary and foreign keys.
Designing a Cube using SSAS
Last updated 5/17/2012 2:10 PM Page - 11 -
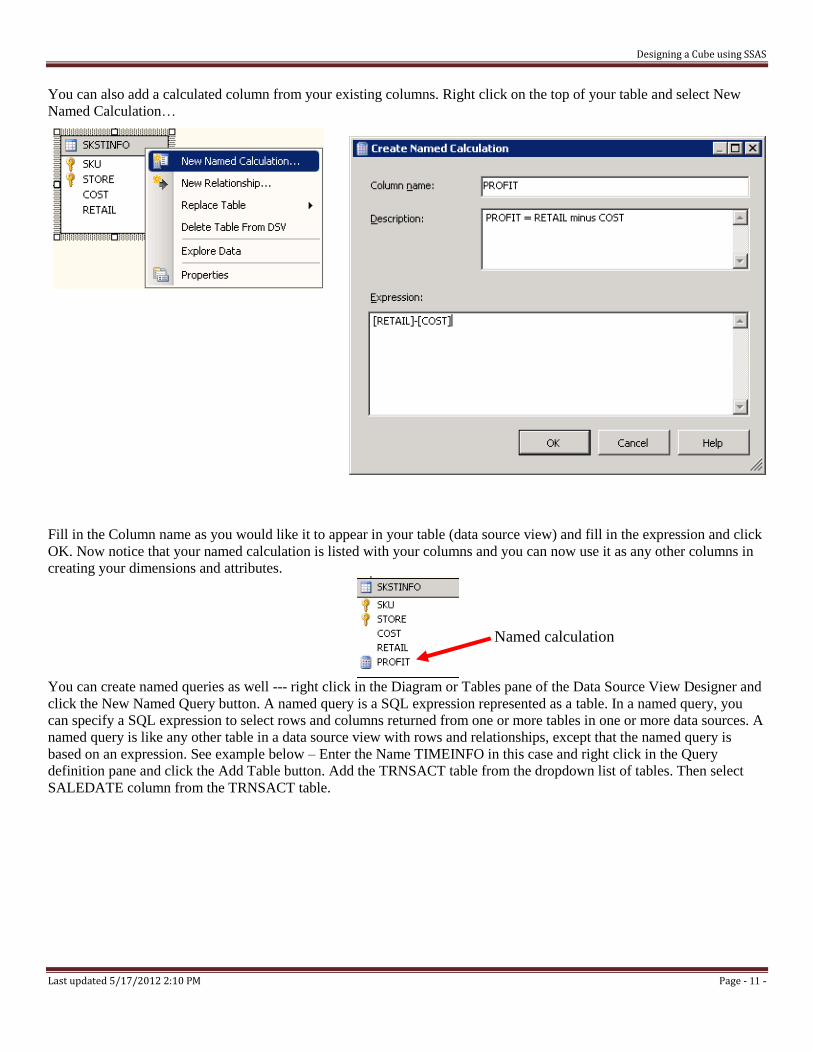
You can also add a calculated column from your existing columns. Right click on the top of your table and select New
Named Calculation…
Fill in the Column name as you would like it to appear in your table (data source view) and fill in the expression and click
OK. Now notice that your named calculation is listed with your columns and you can now use it as any other columns in
creating your dimensions and attributes.
You can create named queries as well --- right click in the Diagram or Tables pane of the Data Source View Designer and
click the New Named Query button. A named query is a SQL expression represented as a table. In a named query, you
can specify a SQL expression to select rows and columns returned from one or more tables in one or more data sources. A
named query is like any other table in a data source view with rows and relationships, except that the named query is
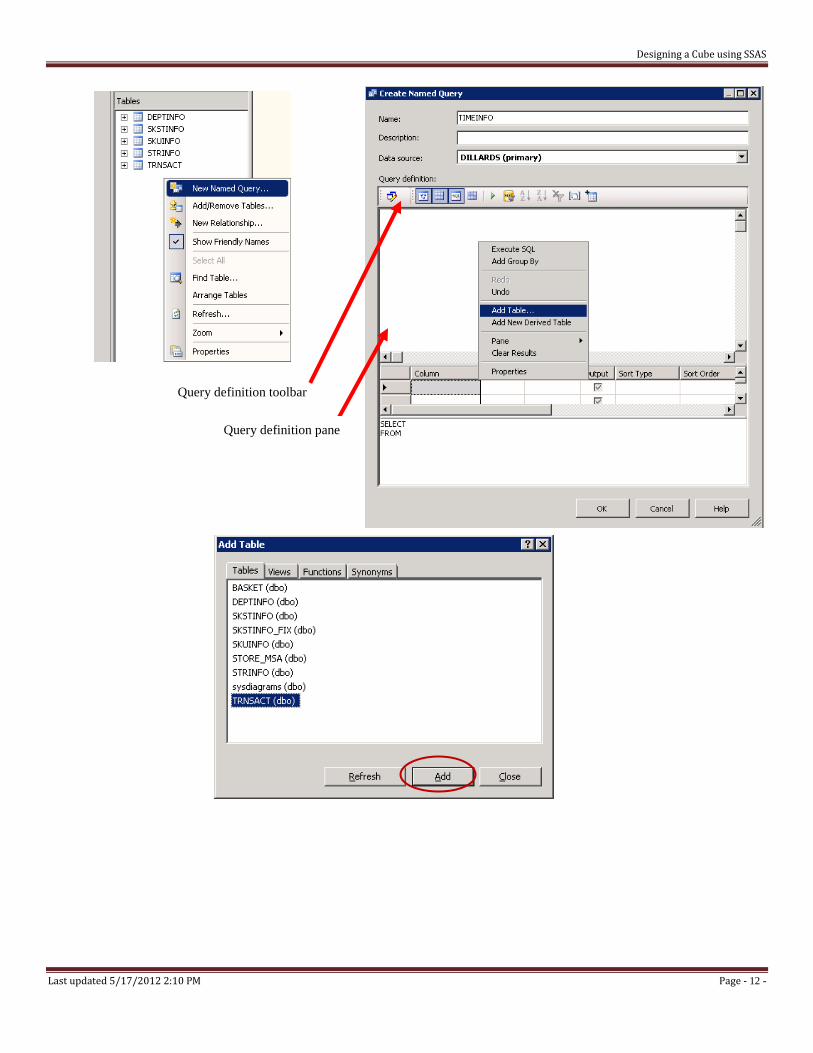
based on an expression. See example below – Enter the Name TIMEINFO in this case and right click in the Query
definition pane and click the Add Table button. Add the TRNSACT table from the dropdown list of tables. Then select
SALEDATE column from the TRNSACT table.
Named calculation
Designing a Cube using SSAS
Last updated 5/17/2012 2:10 PM Page - 12 -
Query definition toolbar
Query definition pane
Designing a Cube using SSAS
Last updated 5/17/2012 2:10 PM Page - 13 -
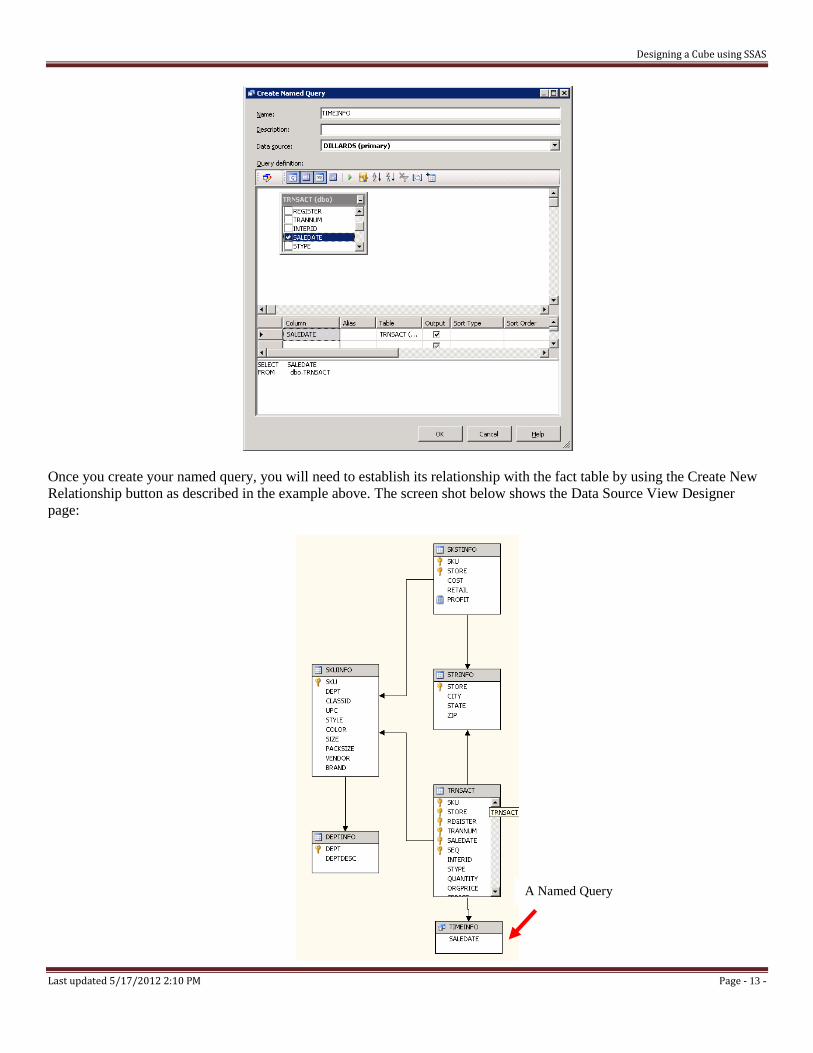
Once you create your named query, you will need to establish its relationship with the fact table by using the Create New
Relationship button as described in the example above. The screen shot below shows the Data Source View Designer
page:
A Named Query
Designing a Cube using SSAS
Last updated 5/17/2012 2:10 PM Page - 14 -
Now that we have the named query in place, we can use it as any other tables. In this case we will use it as our Time
Dimension table. We will later see how we can add more columns to this table.
Along the way, it is always a good idea to click the Save all icon (multiple blue disks) on the tool bar. If you try to close
a tab that hasn’t been saved, it should prompt you to save your work for that part of the project.
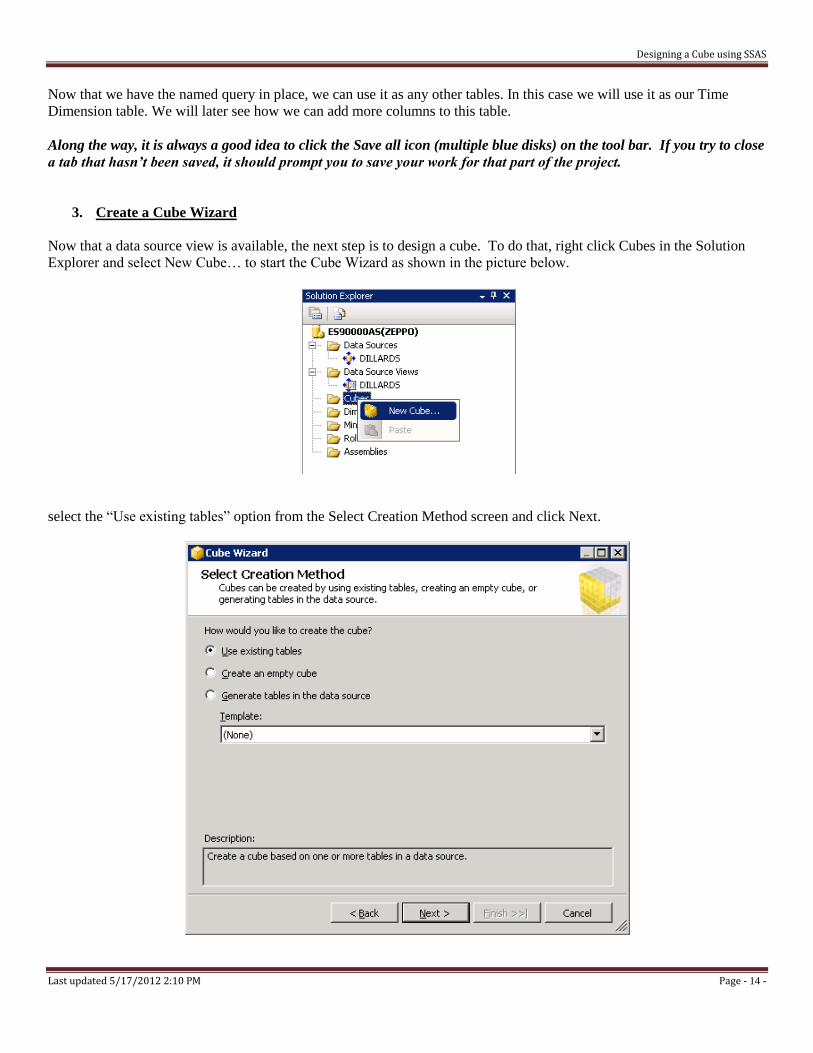
3. Create a Cube Wizard
Now that a data source view is available, the next step is to design a cube. To do that, right click Cubes in the Solution
Explorer and select New Cube… to start the Cube Wizard as shown in the picture below.
select the “Use existing tables” option from the Select Creation Method screen and click Next.
Designing a Cube using SSAS
Last updated 5/17/2012 2:10 PM Page - 15 -
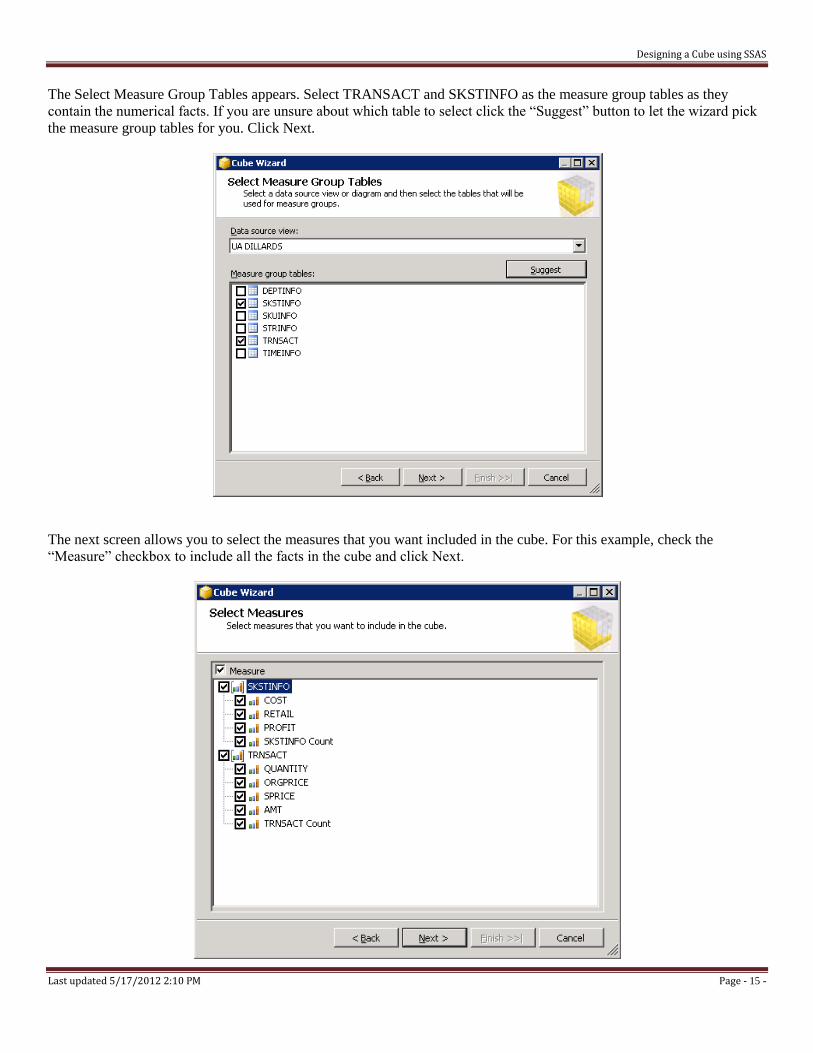
The Select Measure Group Tables appears. Select TRANSACT and SKSTINFO as the measure group tables as they
contain the numerical facts. If you are unsure about which table to select click the “Suggest” button to let the wizard pick
the measure group tables for you. Click Next.
The next screen allows you to select the measures that you want included in the cube. For this example, check the
“Measure” checkbox to include all the facts in the cube and click Next.
Designing a Cube using SSAS
Last updated 5/17/2012 2:10 PM Page - 16 -
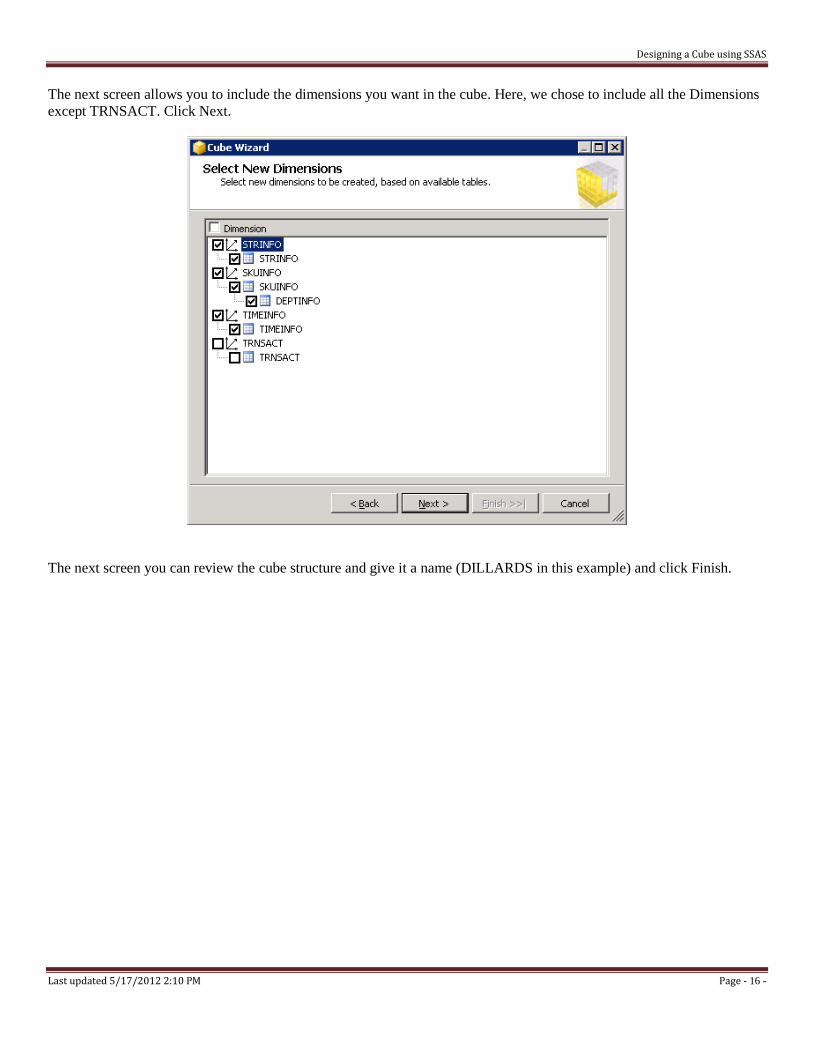
The next screen allows you to include the dimensions you want in the cube. Here, we chose to include all the Dimensions
except TRNSACT. Click Next.
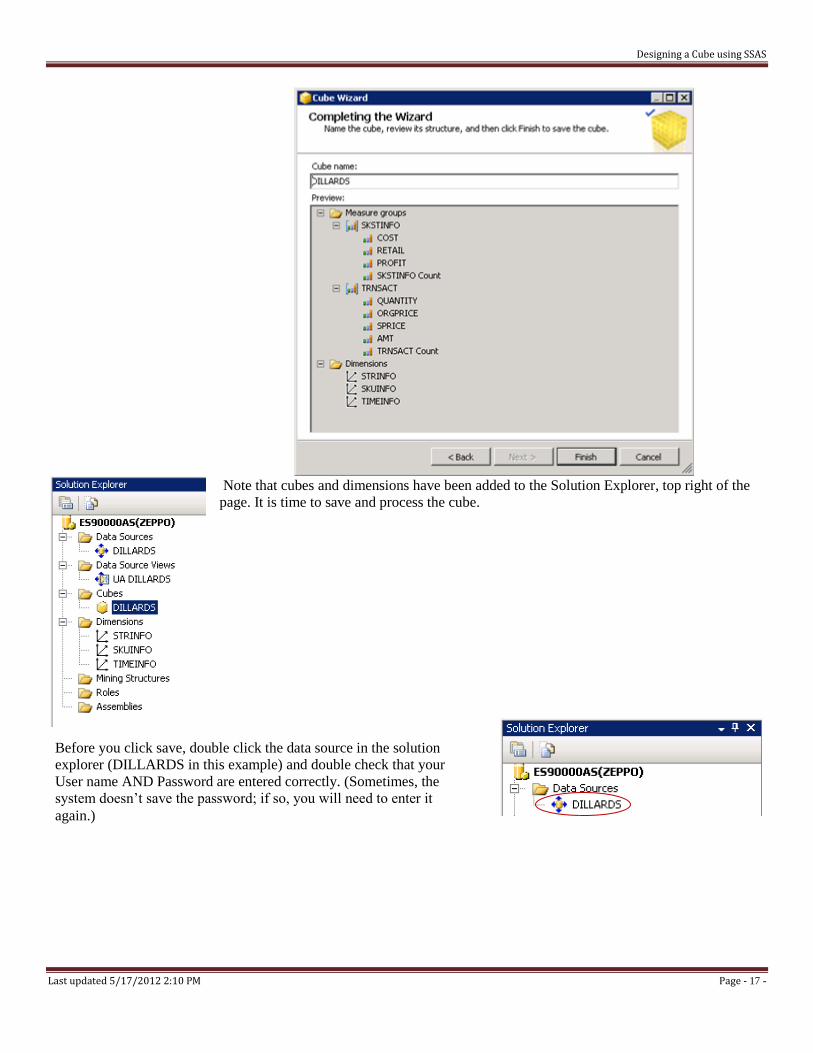
The next screen you can review the cube structure and give it a name (DILLARDS in this example) and click Finish.
Designing a Cube using SSAS
Last updated 5/17/2012 2:10 PM Page - 17 -
Note that cubes and dimensions have been added to the Solution Explorer, top right of the
page. It is time to save and process the cube.
Before you click save, double click the data source in the solution
explorer (DILLARDS in this example) and double check that your
User name AND Password are entered correctly. (Sometimes, the
system doesn’t save the password; if so, you will need to enter it
again.)
Designing a Cube using SSAS
Last updated 5/17/2012 2:10 PM Page - 18 -
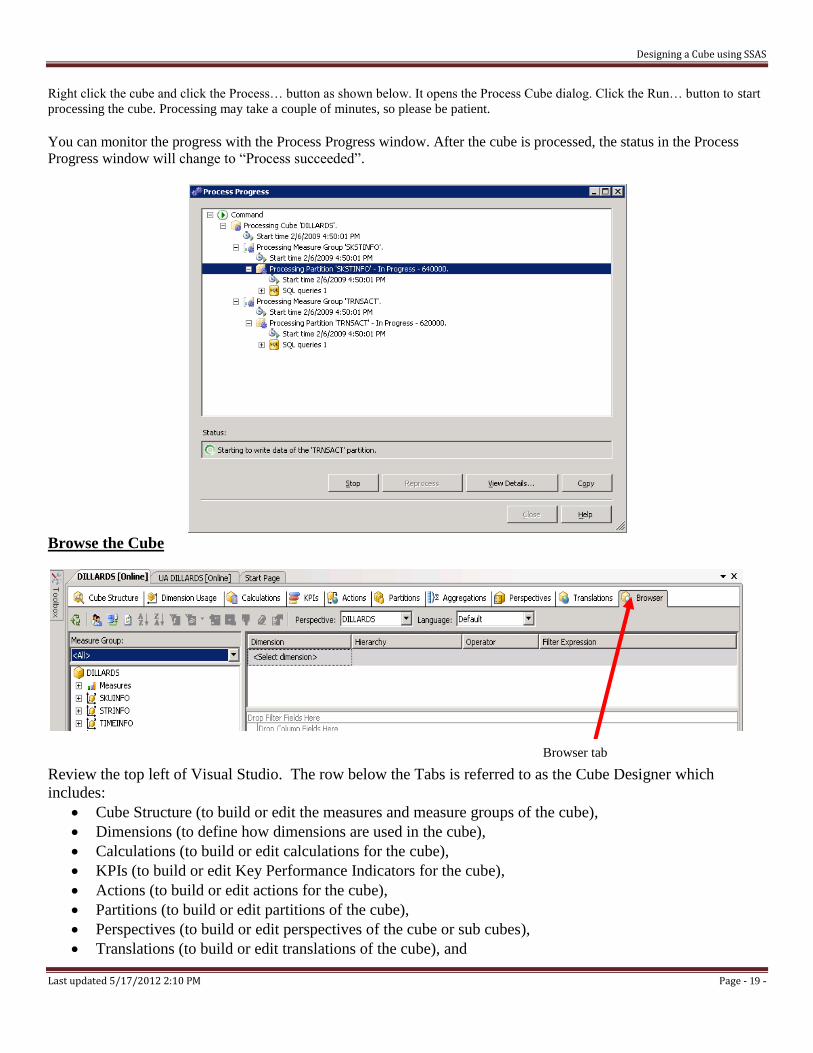
Save all the changes made by clicking the Save All button. Now, it is time to process your cube.
Designing a Cube using SSAS
Last updated 5/17/2012 2:10 PM Page - 19 -
Right click the cube and click the Process… button as shown below. It opens the Process Cube dialog. Click the Run… button to start
processing the cube. Processing may take a couple of minutes, so please be patient.
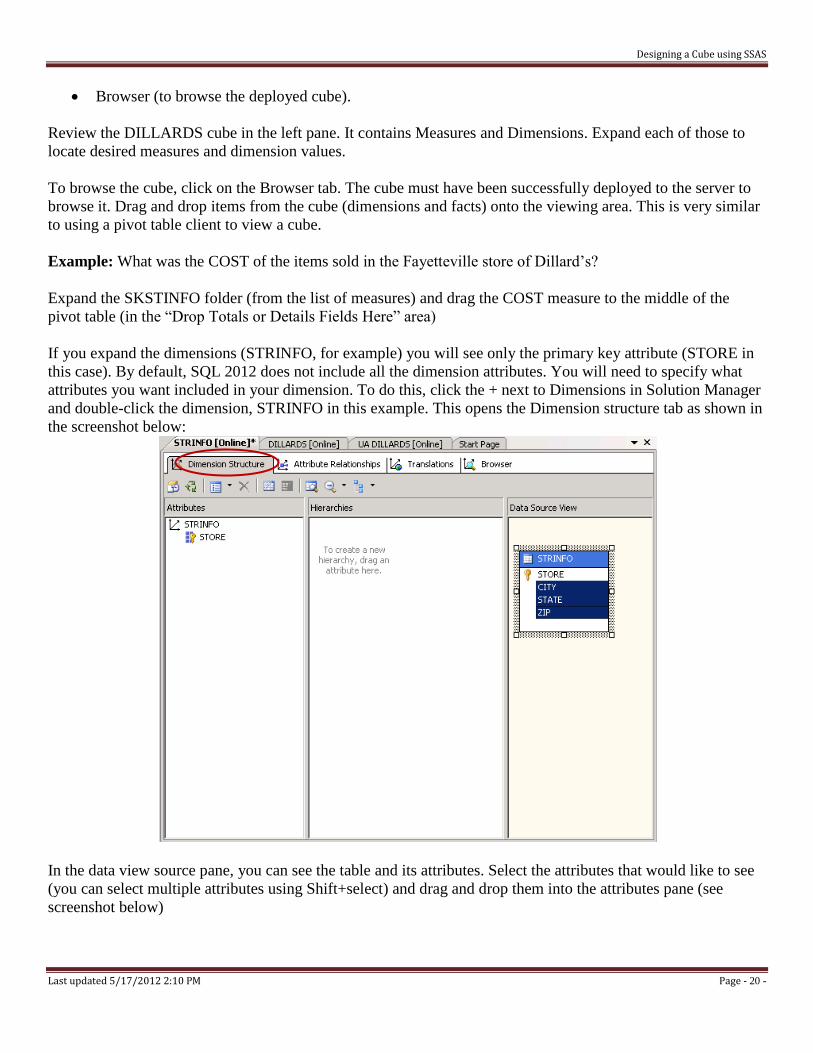
You can monitor the progress with the Process Progress window. After the cube is processed, the status in the Process
Progress window will change to “Process succeeded”.
Browse the Cube
Review the top left of Visual Studio. The row below the Tabs is referred to as the Cube Designer which
includes:
Cube Structure (to build or edit the measures and measure groups of the cube),
Dimensions (to define how dimensions are used in the cube),
Calculations (to build or edit calculations for the cube),
KPIs (to build or edit Key Performance Indicators for the cube),
Actions (to build or edit actions for the cube),
Partitions (to build or edit partitions of the cube),
Perspectives (to build or edit perspectives of the cube or sub cubes),
Translations (to build or edit translations of the cube), and
Browser tab
Designing a Cube using SSAS
Last updated 5/17/2012 2:10 PM Page - 20 -
Browser (to browse the deployed cube).
Review the DILLARDS cube in the left pane. It contains Measures and Dimensions. Expand each of those to
locate desired measures and dimension values.
To browse the cube, click on the Browser tab. The cube must have been successfully deployed to the server to
browse it. Drag and drop items from the cube (dimensions and facts) onto the viewing area. This is very similar
to using a pivot table client to view a cube.
Example: What was the COST of the items sold in the Fayetteville store of Dillard’s?
Expand the SKSTINFO folder (from the list of measures) and drag the COST measure to the middle of the
pivot table (in the “Drop Totals or Details Fields Here” area)
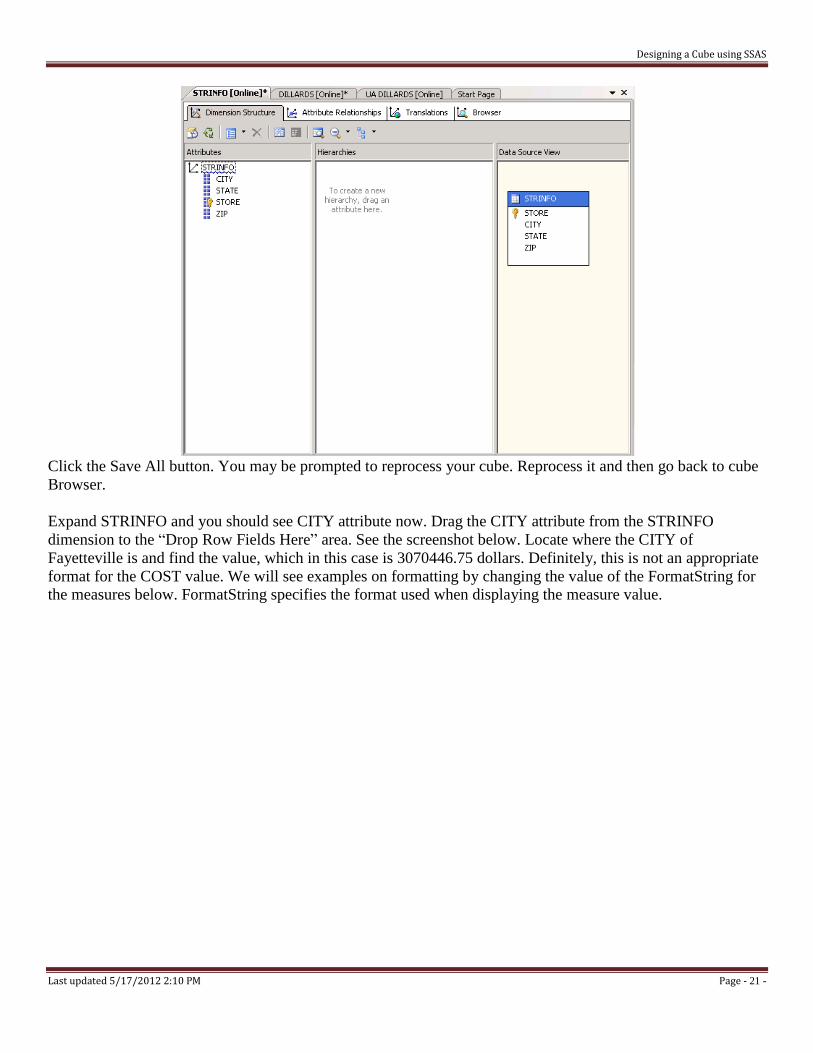
If you expand the dimensions (STRINFO, for example) you will see only the primary key attribute (STORE in
this case). By default, SQL 2012 does not include all the dimension attributes. You will need to specify what
attributes you want included in your dimension. To do this, click the + next to Dimensions in Solution Manager
and double-click the dimension, STRINFO in this example. This opens the Dimension structure tab as shown in
the screenshot below:
In the data view source pane, you can see the table and its attributes. Select the attributes that would like to see
(you can select multiple attributes using Shift+select) and drag and drop them into the attributes pane (see
screenshot below)
Designing a Cube using SSAS
Last updated 5/17/2012 2:10 PM Page - 21 -
Click the Save All button. You may be prompted to reprocess your cube. Reprocess it and then go back to cube
Browser.
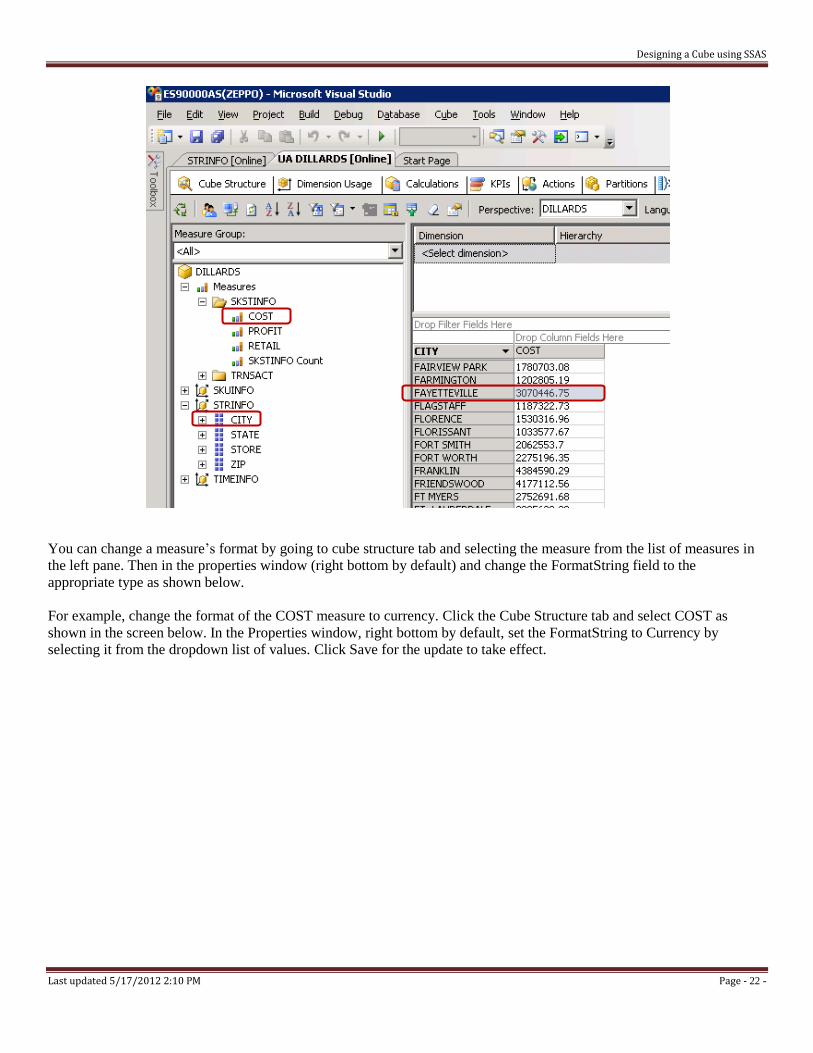
Expand STRINFO and you should see CITY attribute now. Drag the CITY attribute from the STRINFO
dimension to the “Drop Row Fields Here” area. See the screenshot below. Locate where the CITY of
Fayetteville is and find the value, which in this case is 3070446.75 dollars. Definitely, this is not an appropriate
format for the COST value. We will see examples on formatting by changing the value of the FormatString for
the measures below. FormatString specifies the format used when displaying the measure value.
Designing a Cube using SSAS
Last updated 5/17/2012 2:10 PM Page - 22 -
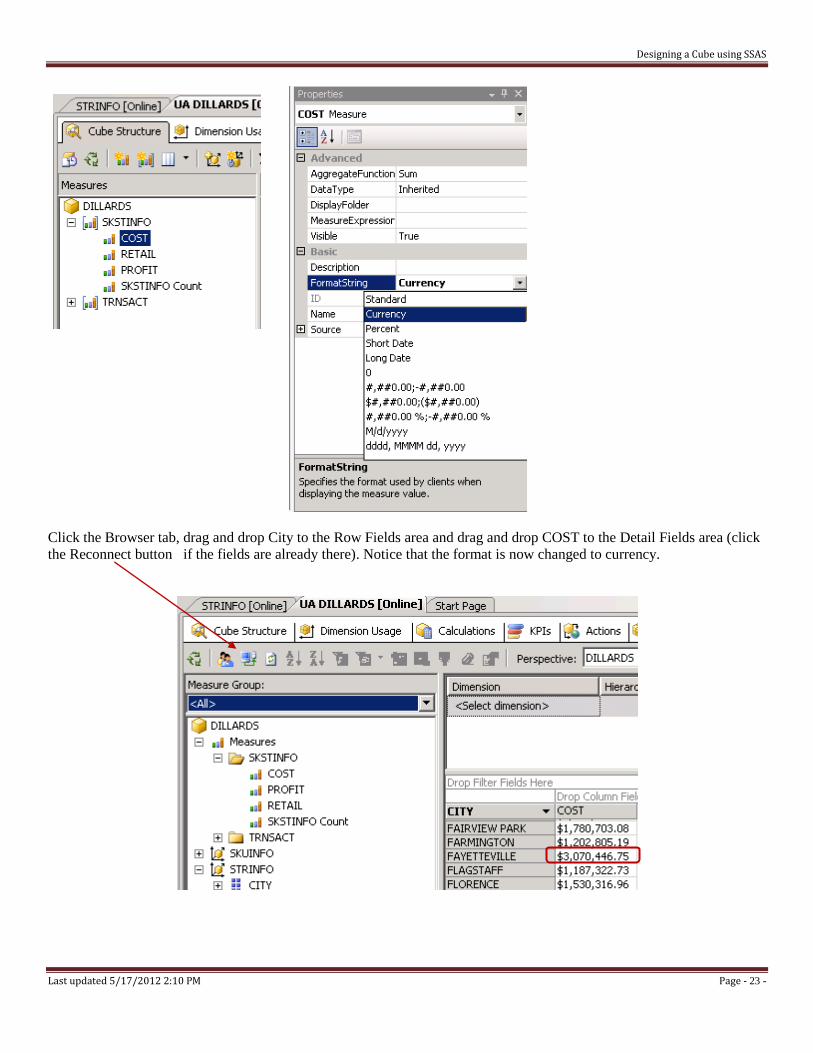
You can change a measure’s format by going to cube structure tab and selecting the measure from the list of measures in
the left pane. Then in the properties window (right bottom by default) and change the FormatString field to the
appropriate type as shown below.
For example, change the format of the COST measure to currency. Click the Cube Structure tab and select COST as
shown in the screen below. In the Properties window, right bottom by default, set the FormatString to Currency by
selecting it from the dropdown list of values. Click Save for the update to take effect.
Designing a Cube using SSAS
Last updated 5/17/2012 2:10 PM Page - 23 -
Click the Browser tab, drag and drop City to the Row Fields area and drag and drop COST to the Detail Fields area (click
the Reconnect button if the fields are already there). Notice that the format is now changed to currency.
Designing a Cube using SSAS
Last updated 5/17/2012 2:10 PM Page - 24 -
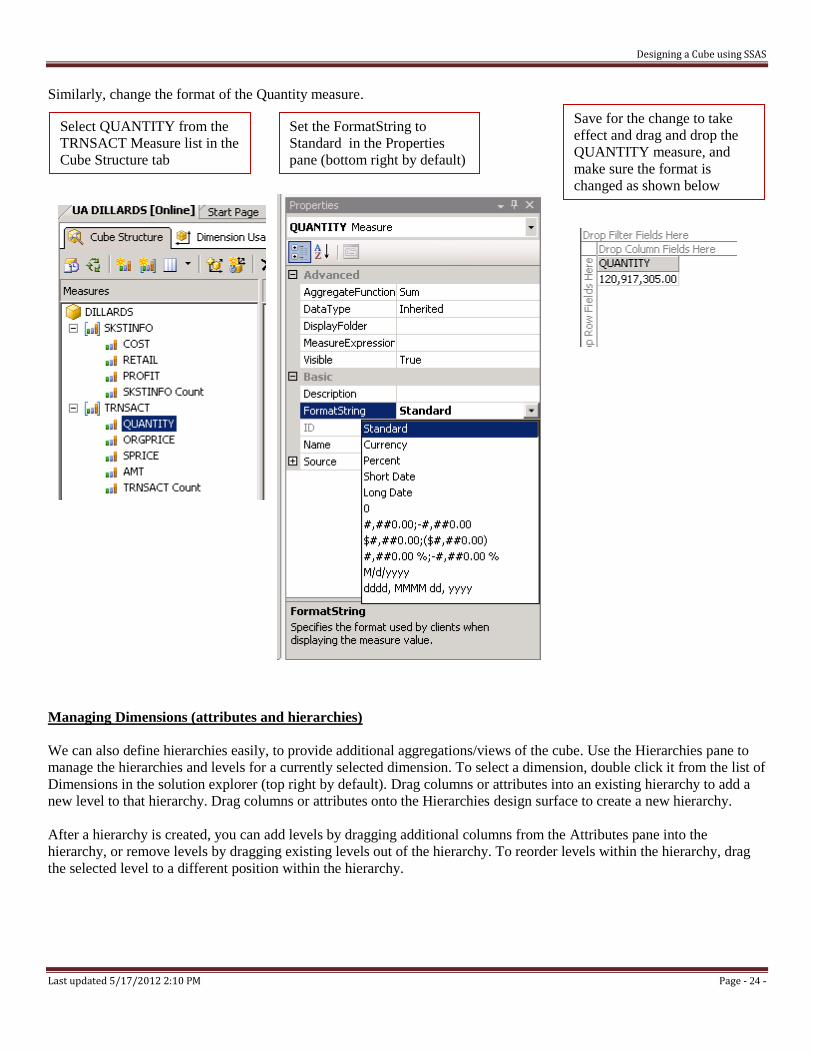
Similarly, change the format of the Quantity measure.
Managing Dimensions (attributes and hierarchies)
We can also define hierarchies easily, to provide additional aggregations/views of the cube. Use the Hierarchies pane to
manage the hierarchies and levels for a currently selected dimension. To select a dimension, double click it from the list of
Dimensions in the solution explorer (top right by default). Drag columns or attributes into an existing hierarchy to add a
new level to that hierarchy. Drag columns or attributes onto the Hierarchies design surface to create a new hierarchy.
After a hierarchy is created, you can add levels by dragging additional columns from the Attributes pane into the
hierarchy, or remove levels by dragging existing levels out of the hierarchy. To reorder levels within the hierarchy, drag
the selected level to a different position within the hierarchy.
Select QUANTITY from the
TRNSACT Measure list in the
Cube Structure tab
Set the FormatString to
Standard in the Properties
pane (bottom right by default)
Save for the change to take
effect and drag and drop the
QUANTITY measure, and
make sure the format is
changed as shown below
Designing a Cube using SSAS
Last updated 5/17/2012 2:10 PM Page - 25 -
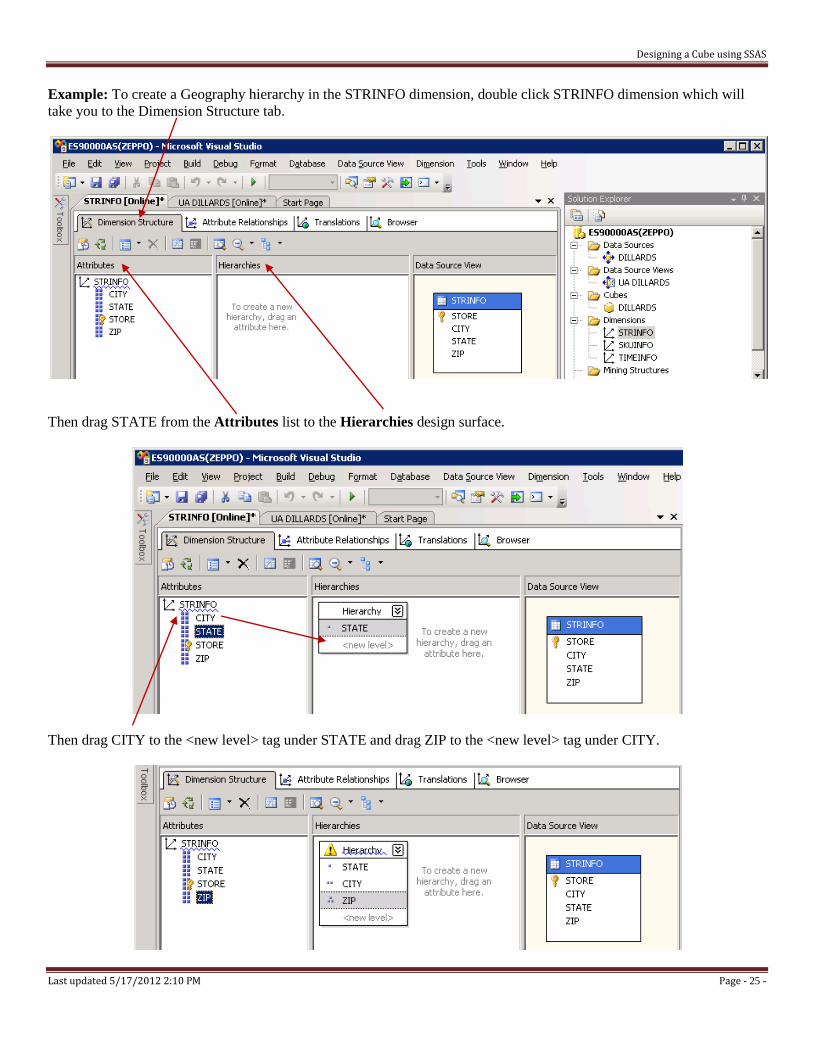
Example: To create a Geography hierarchy in the STRINFO dimension, double click STRINFO dimension which will
take you to the Dimension Structure tab.
Then drag STATE from the Attributes list to the Hierarchies design surface.
Then drag CITY to the <new level> tag under STATE and drag ZIP to the <new level> tag under CITY.
Designing a Cube using SSAS
Last updated 5/17/2012 2:10 PM Page - 26 -
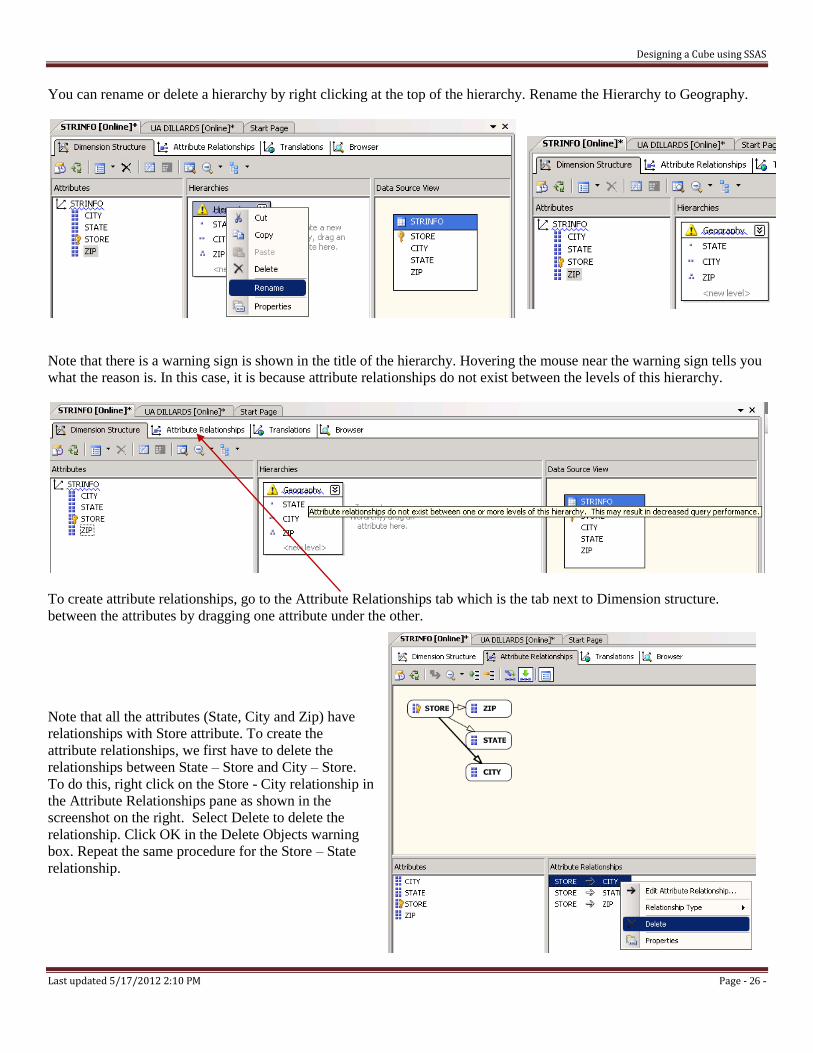
You can rename or delete a hierarchy by right clicking at the top of the hierarchy. Rename the Hierarchy to Geography.
Note that there is a warning sign is shown in the title of the hierarchy. Hovering the mouse near the warning sign tells you
what the reason is. In this case, it is because attribute relationships do not exist between the levels of this hierarchy.
To create attribute relationships, go to the Attribute Relationships tab which is the tab next to Dimension structure.
between the attributes by dragging one attribute under the other.
Note that all the attributes (State, City and Zip) have
relationships with Store attribute. To create the
attribute relationships, we first have to delete the
relationships between State – Store and City – Store.
To do this, right click on the Store - City relationship in
the Attribute Relationships pane as shown in the
screenshot on the right. Select Delete to delete the
relationship. Click OK in the Delete Objects warning
box. Repeat the same procedure for the Store – State
relationship.
Designing a Cube using SSAS
Last updated 5/17/2012 2:10 PM Page - 27 -
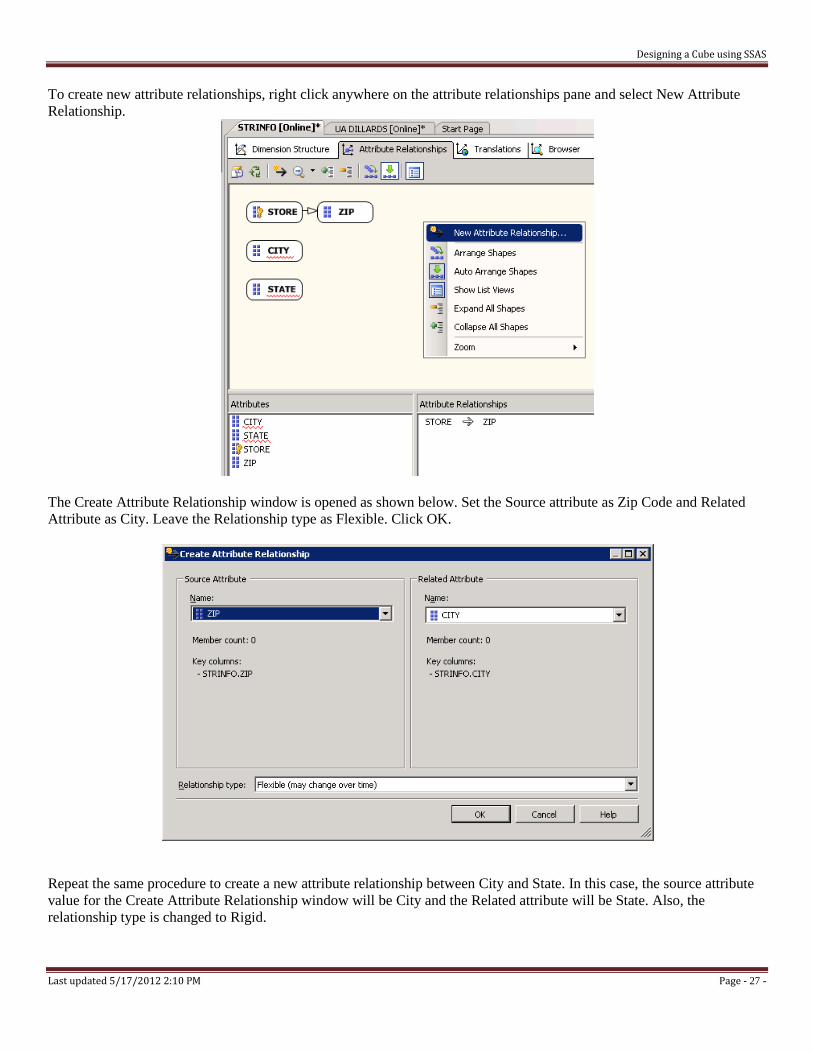
To create new attribute relationships, right click anywhere on the attribute relationships pane and select New Attribute
Relationship.
The Create Attribute Relationship window is opened as shown below. Set the Source attribute as Zip Code and Related
Attribute as City. Leave the Relationship type as Flexible. Click OK.
Repeat the same procedure to create a new attribute relationship between City and State. In this case, the source attribute
value for the Create Attribute Relationship window will be City and the Related attribute will be State. Also, the
relationship type is changed to Rigid.
Designing a Cube using SSAS
Last updated 5/17/2012 2:10 PM Page - 28 -
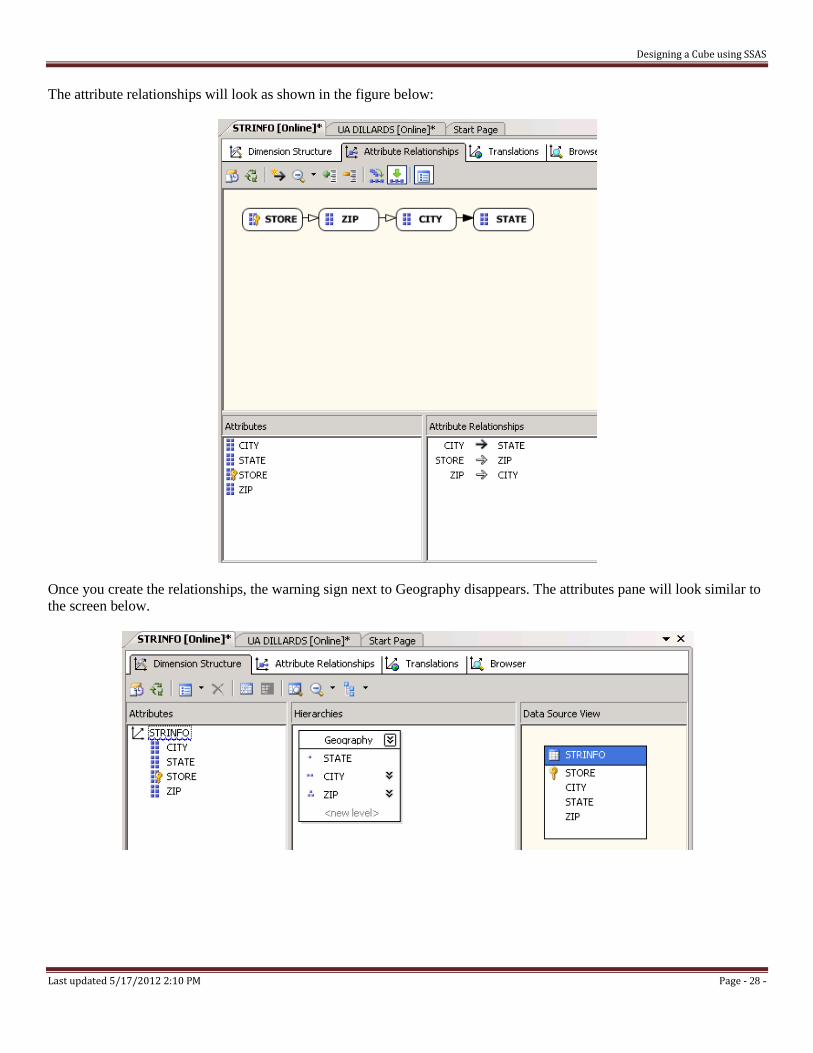
The attribute relationships will look as shown in the figure below:
Once you create the relationships, the warning sign next to Geography disappears. The attributes pane will look similar to
the screen below.
Designing a Cube using SSAS
Last updated 5/17/2012 2:10 PM Page - 29 -
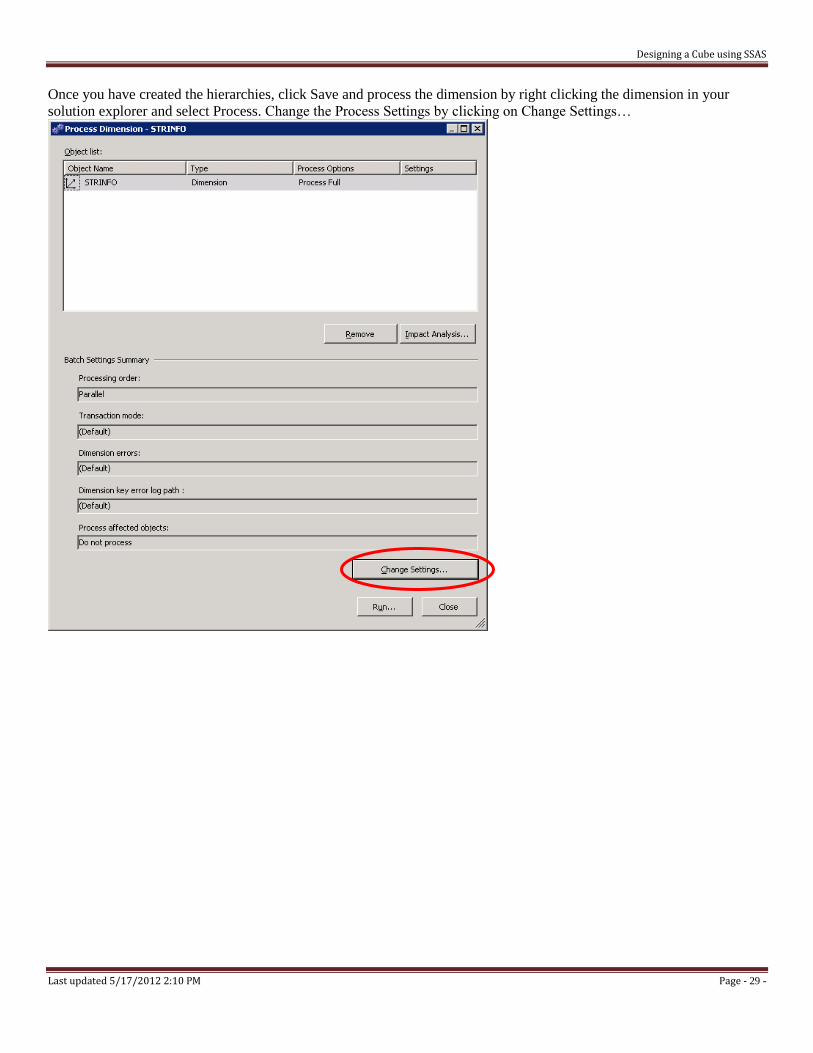
Once you have created the hierarchies, click Save and process the dimension by right clicking the dimension in your
solution explorer and select Process. Change the Process Settings by clicking on Change Settings…
Designing a Cube using SSAS
Last updated 5/17/2012 2:10 PM Page - 30 -
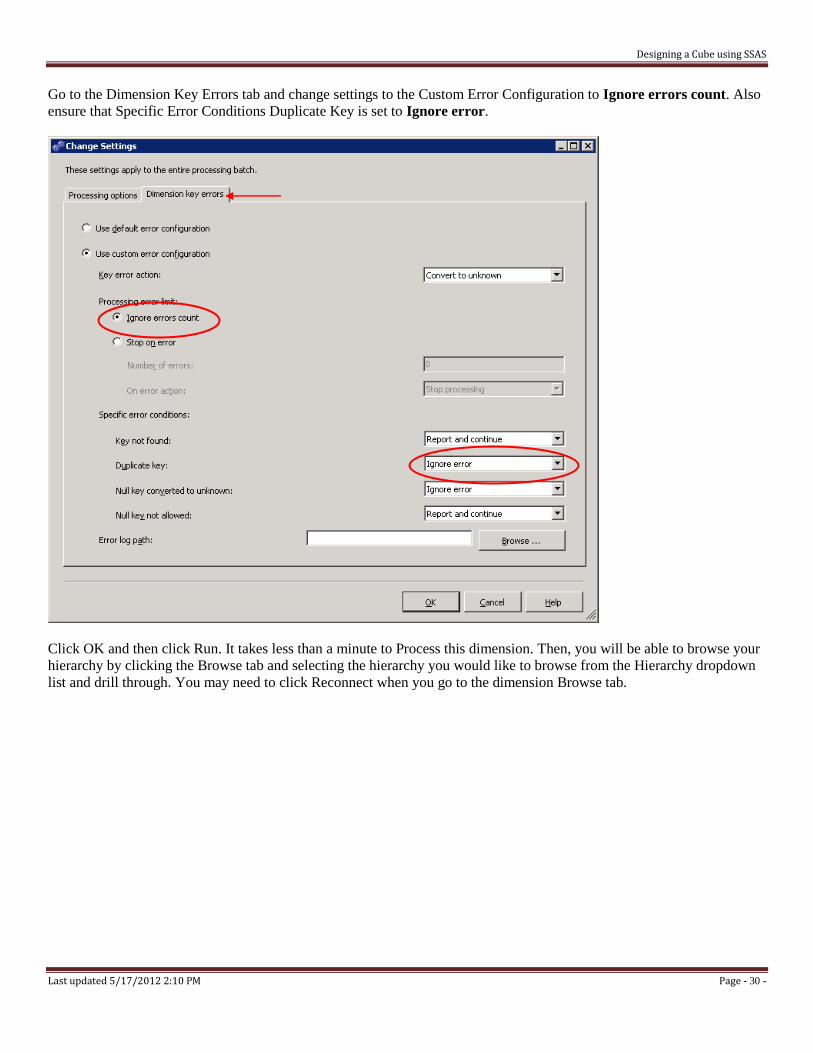
Go to the Dimension Key Errors tab and change settings to the Custom Error Configuration to Ignore errors count. Also
ensure that Specific Error Conditions Duplicate Key is set to Ignore error.
Click OK and then click Run. It takes less than a minute to Process this dimension. Then, you will be able to browse your
hierarchy by clicking the Browse tab and selecting the hierarchy you would like to browse from the Hierarchy dropdown
list and drill through. You may need to click Reconnect when you go to the dimension Browse tab.
Designing a Cube using SSAS
Last updated 5/17/2012 2:10 PM Page - 31 -
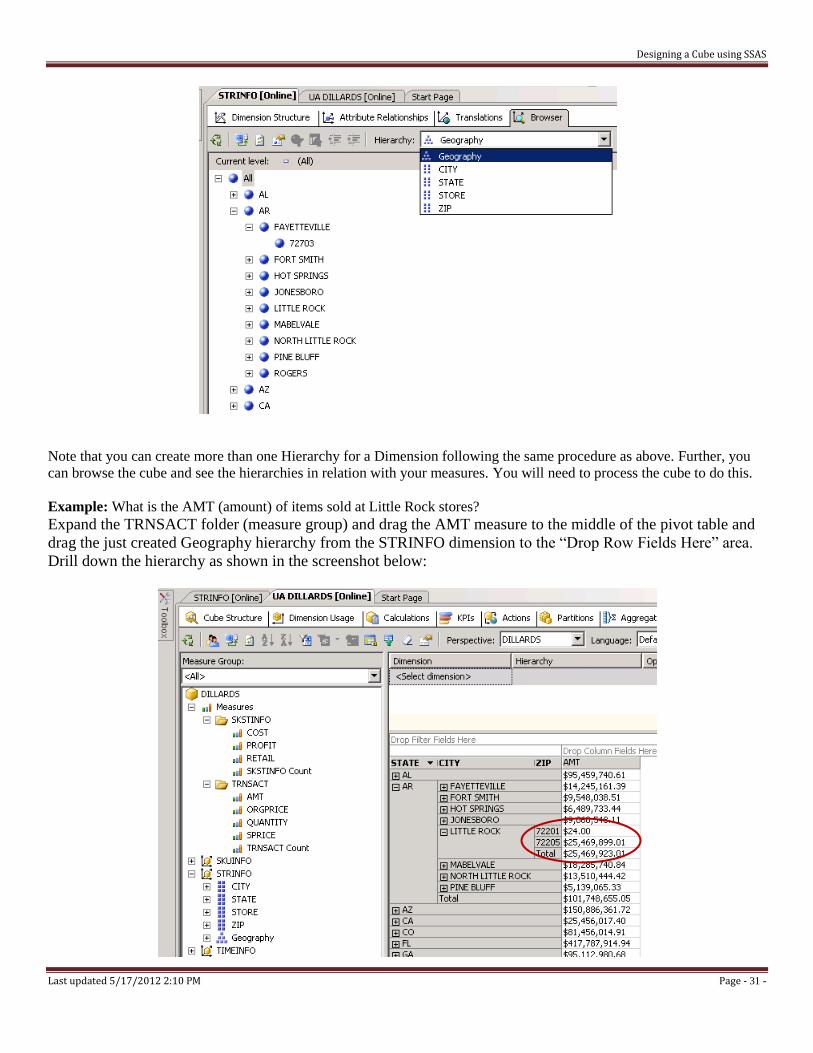
Note that you can create more than one Hierarchy for a Dimension following the same procedure as above. Further, you
can browse the cube and see the hierarchies in relation with your measures. You will need to process the cube to do this.
Example: What is the AMT (amount) of items sold at Little Rock stores?
Expand the TRNSACT folder (measure group) and drag the AMT measure to the middle of the pivot table and
drag the just created Geography hierarchy from the STRINFO dimension to the “Drop Row Fields Here” area.
Drill down the hierarchy as shown in the screenshot below:
Designing a Cube using SSAS
Last updated 5/17/2012 2:10 PM Page - 32 -
In the same way we can create time hierarchies that include dimensions like Year-Quarter-Month-Day or Year-Week-
Day. To do this, we first need to edit the Time Dimension table created above. Double click the data source view named
UA DILLARDS in this example.
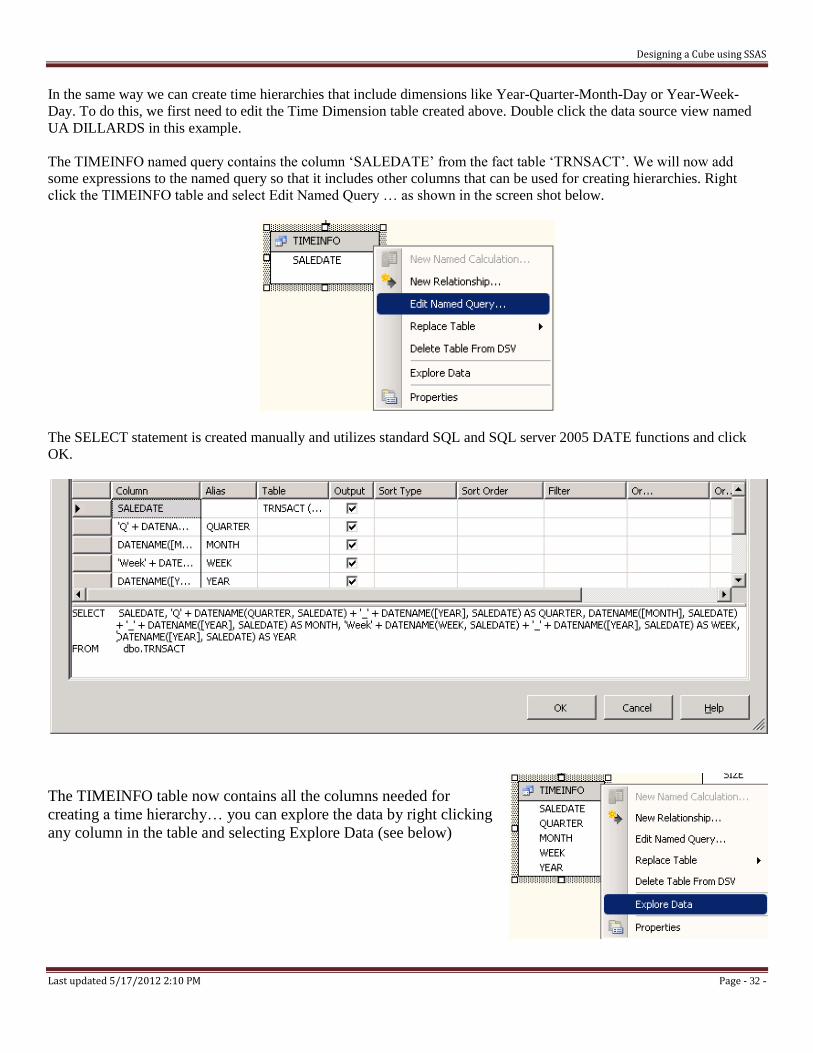
The TIMEINFO named query contains the column ‘SALEDATE’ from the fact table ‘TRNSACT’. We will now add
some expressions to the named query so that it includes other columns that can be used for creating hierarchies. Right
click the TIMEINFO table and select Edit Named Query … as shown in the screen shot below.
The SELECT statement is created manually and utilizes standard SQL and SQL server 2005 DATE functions and click
OK.
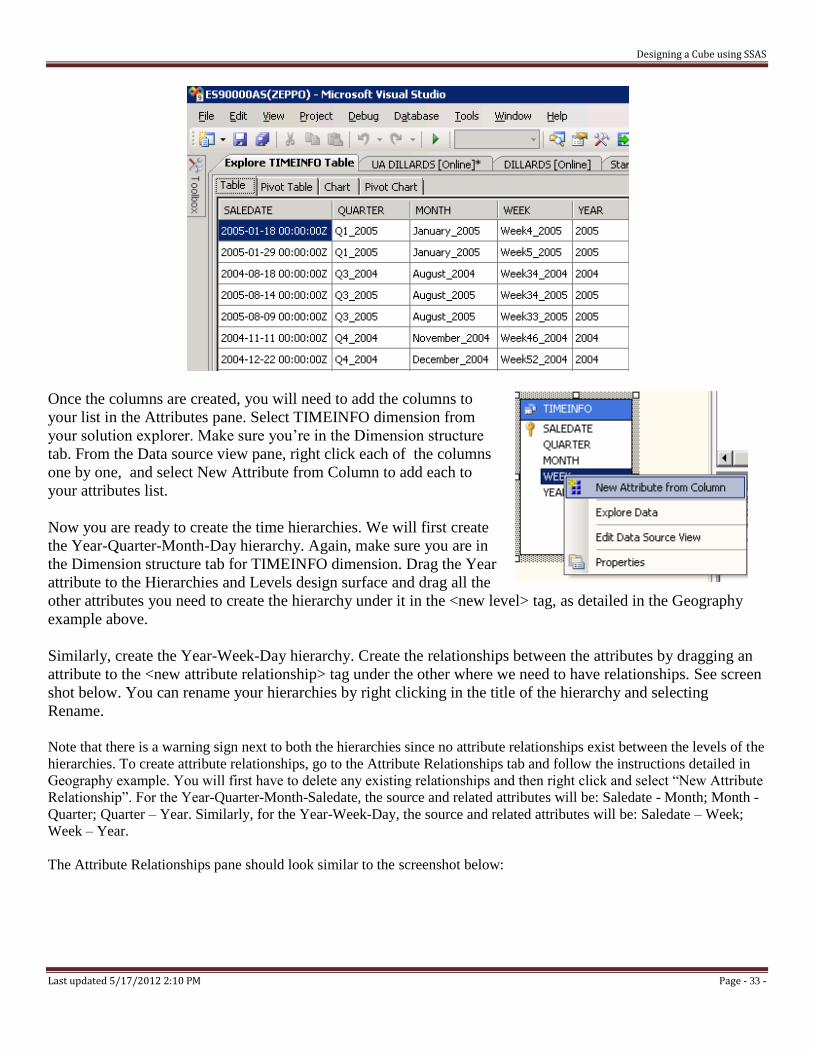
The TIMEINFO table now contains all the columns needed for
creating a time hierarchy… you can explore the data by right clicking
any column in the table and selecting Explore Data (see below)
Designing a Cube using SSAS
Last updated 5/17/2012 2:10 PM Page - 33 -
Once the columns are created, you will need to add the columns to
your list in the Attributes pane. Select TIMEINFO dimension from
your solution explorer. Make sure you’re in the Dimension structure
tab. From the Data source view pane, right click each of the columns
one by one, and select New Attribute from Column to add each to
your attributes list.
Now you are ready to create the time hierarchies. We will first create
the Year-Quarter-Month-Day hierarchy. Again, make sure you are in
the Dimension structure tab for TIMEINFO dimension. Drag the Year
attribute to the Hierarchies and Levels design surface and drag all the
other attributes you need to create the hierarchy under it in the <new level> tag, as detailed in the Geography
example above.
Similarly, create the Year-Week-Day hierarchy. Create the relationships between the attributes by dragging an
attribute to the <new attribute relationship> tag under the other where we need to have relationships. See screen
shot below. You can rename your hierarchies by right clicking in the title of the hierarchy and selecting
Rename.
Note that there is a warning sign next to both the hierarchies since no attribute relationships exist between the levels of the
hierarchies. To create attribute relationships, go to the Attribute Relationships tab and follow the instructions detailed in
Geography example. You will first have to delete any existing relationships and then right click and select “New Attribute
Relationship”. For the Year-Quarter-Month-Saledate, the source and related attributes will be: Saledate - Month; Month -
Quarter; Quarter – Year. Similarly, for the Year-Week-Day, the source and related attributes will be: Saledate – Week;
Week – Year.
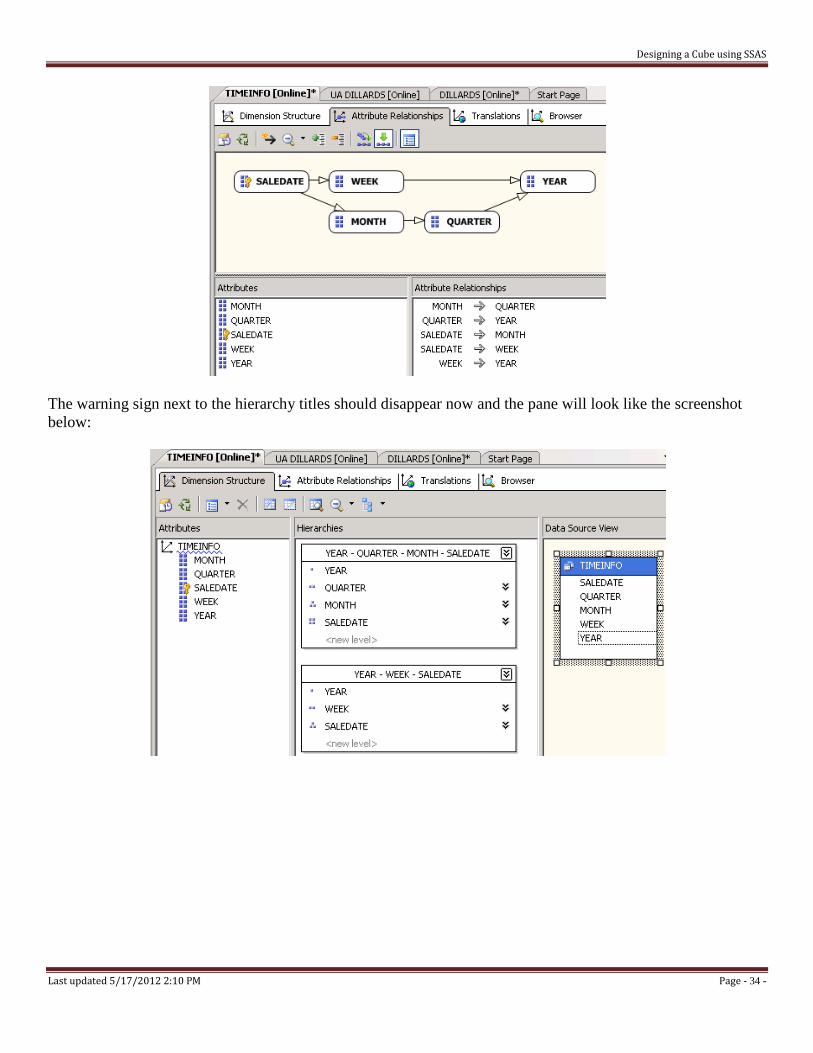
The Attribute Relationships pane should look similar to the screenshot below:
Designing a Cube using SSAS
Last updated 5/17/2012 2:10 PM Page - 34 -
The warning sign next to the hierarchy titles should disappear now and the pane will look like the screenshot
below:
Designing a Cube using SSAS
Last updated 5/17/2012 2:10 PM Page - 35 -
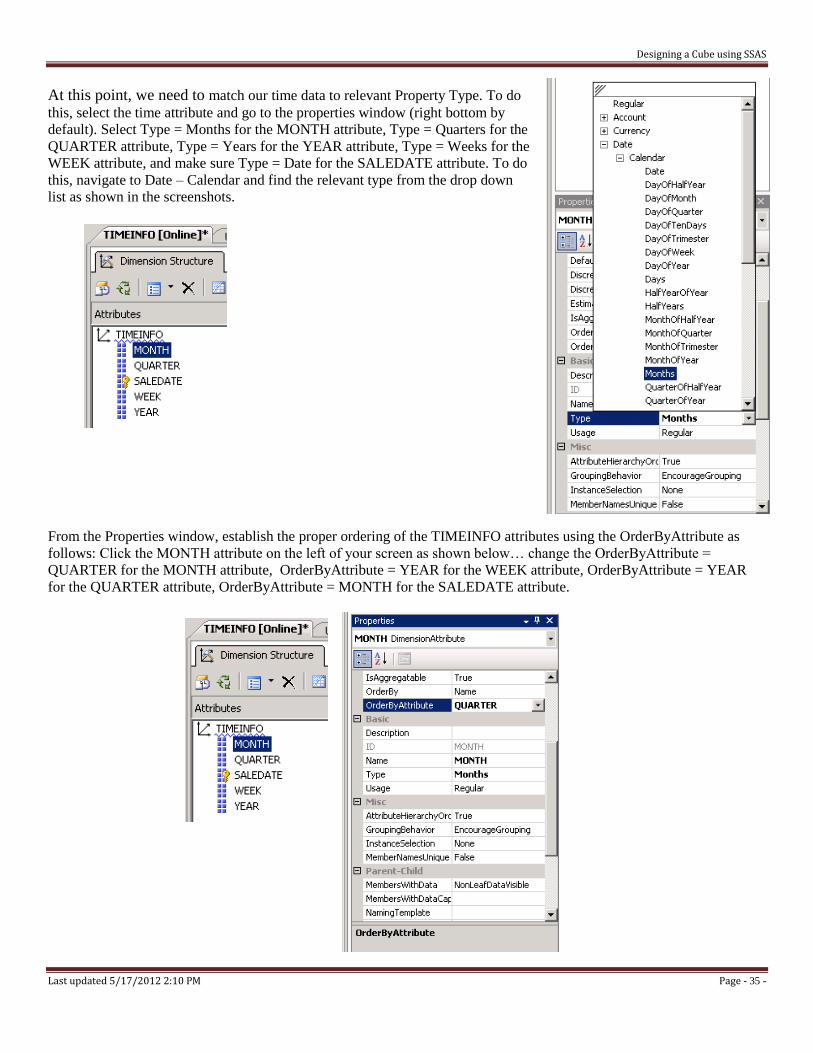
At this point, we need to match our time data to relevant Property Type. To do
this, select the time attribute and go to the properties window (right bottom by
default). Select Type = Months for the MONTH attribute, Type = Quarters for the
QUARTER attribute, Type = Years for the YEAR attribute, Type = Weeks for the
WEEK attribute, and make sure Type = Date for the SALEDATE attribute. To do
this, navigate to Date – Calendar and find the relevant type from the drop down
list as shown in the screenshots.
From the Properties window, establish the proper ordering of the TIMEINFO attributes using the OrderByAttribute as
follows: Click the MONTH attribute on the left of your screen as shown below… change the OrderByAttribute =
QUARTER for the MONTH attribute, OrderByAttribute = YEAR for the WEEK attribute, OrderByAttribute = YEAR
for the QUARTER attribute, OrderByAttribute = MONTH for the SALEDATE attribute.
Designing a Cube using SSAS
Last updated 5/17/2012 2:10 PM Page - 36 -
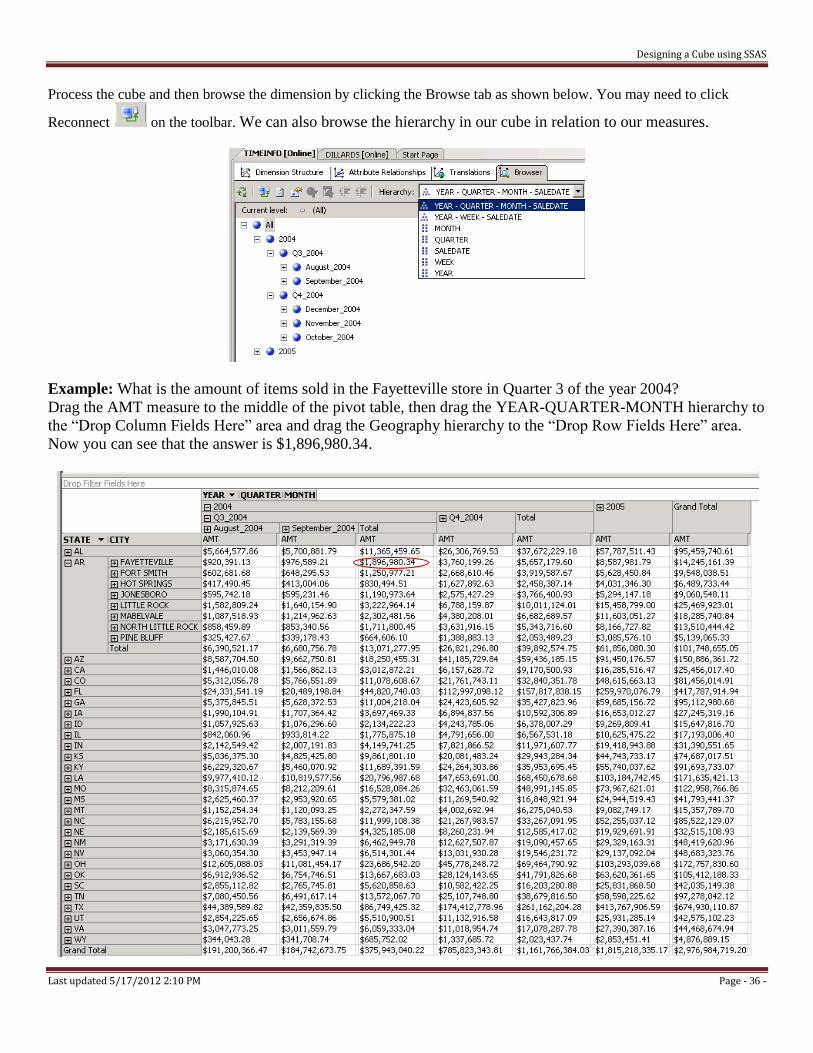
Process the cube and then browse the dimension by clicking the Browse tab as shown below. You may need to click
Reconnect on the toolbar. We can also browse the hierarchy in our cube in relation to our measures.
Example: What is the amount of items sold in the Fayetteville store in Quarter 3 of the year 2004?
Drag the AMT measure to the middle of the pivot table, then drag the YEAR-QUARTER-MONTH hierarchy to
the “Drop Column Fields Here” area and drag the Geography hierarchy to the “Drop Row Fields Here” area.
Now you can see that the answer is $1,896,980.34.
Designing a Cube using SSAS
Last updated 5/17/2012 2:10 PM Page - 37 -
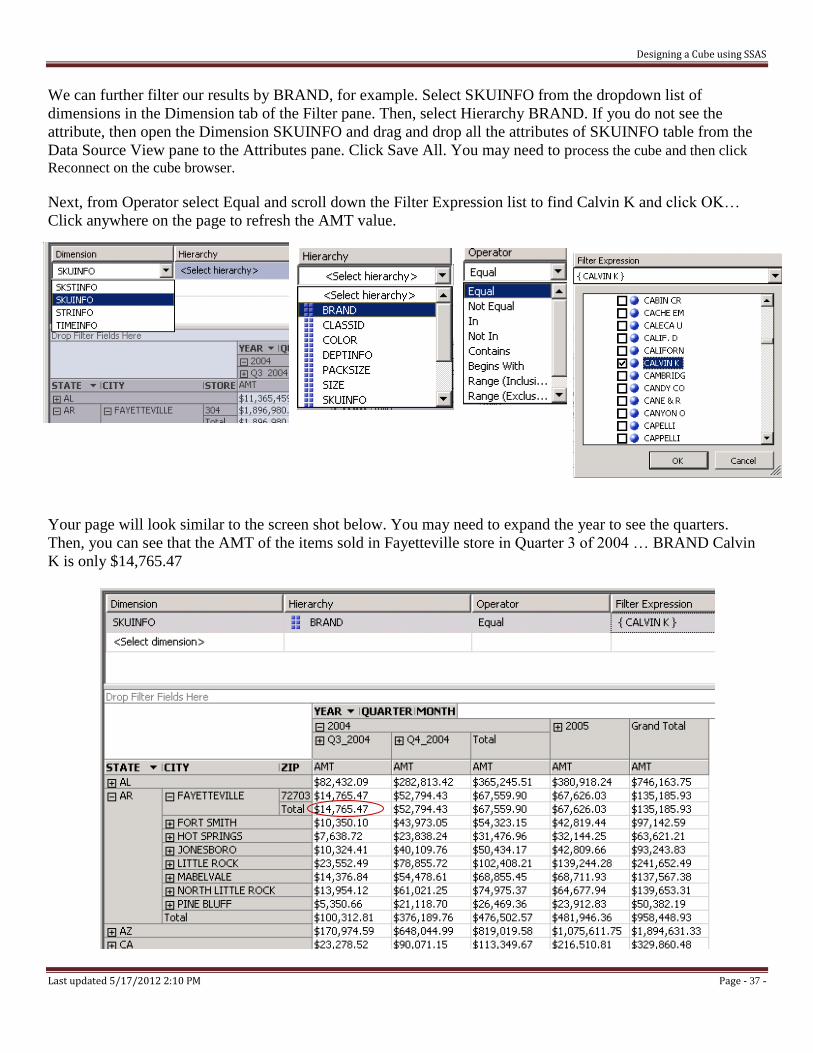
We can further filter our results by BRAND, for example. Select SKUINFO from the dropdown list of
dimensions in the Dimension tab of the Filter pane. Then, select Hierarchy BRAND. If you do not see the
attribute, then open the Dimension SKUINFO and drag and drop all the attributes of SKUINFO table from the
Data Source View pane to the Attributes pane. Click Save All. You may need to process the cube and then click
Reconnect on the cube browser.
Next, from Operator select Equal and scroll down the Filter Expression list to find Calvin K and click OK…
Click anywhere on the page to refresh the AMT value.
Your page will look similar to the screen shot below. You may need to expand the year to see the quarters.
Then, you can see that the AMT of the items sold in Fayetteville store in Quarter 3 of 2004 … BRAND Calvin
K is only $14,765.47
Designing a Cube using SSAS
Last updated 5/17/2012 2:10 PM Page - 38 -
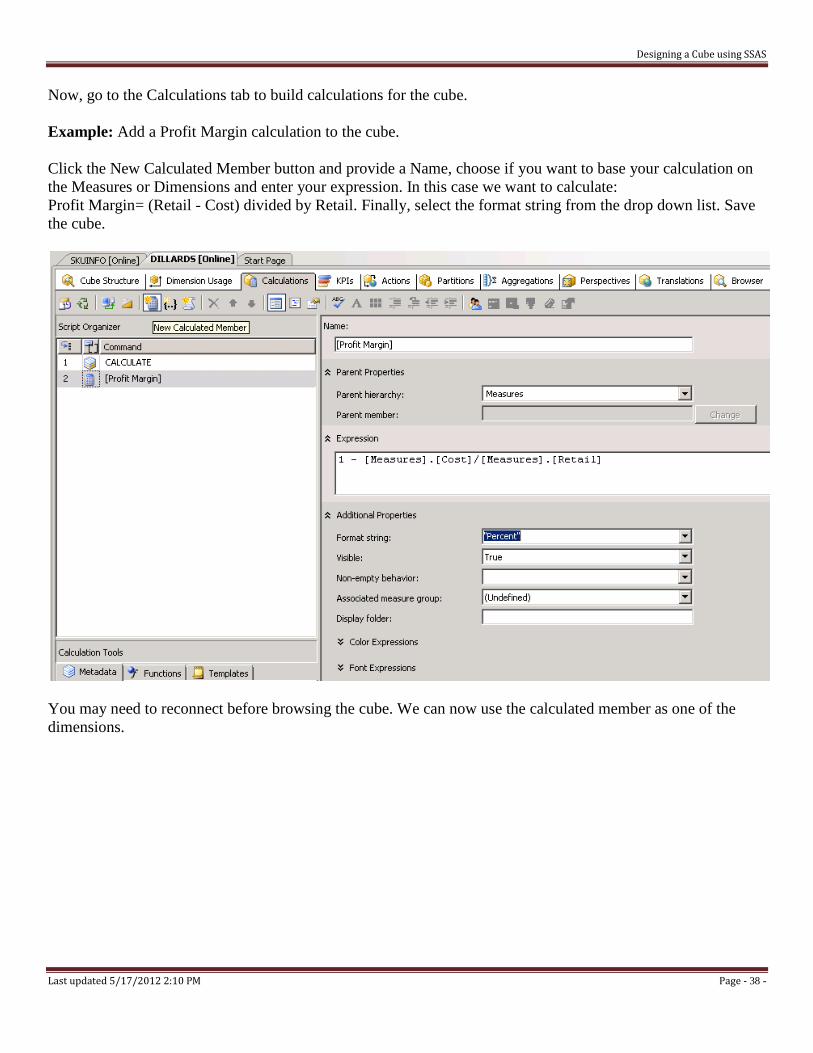
Now, go to the Calculations tab to build calculations for the cube.
Example: Add a Profit Margin calculation to the cube.
Click the New Calculated Member button and provide a Name, choose if you want to base your calculation on
the Measures or Dimensions and enter your expression. In this case we want to calculate:
Profit Margin= (Retail - Cost) divided by Retail. Finally, select the format string from the drop down list. Save
the cube.
You may need to reconnect before browsing the cube. We can now use the calculated member as one of the
dimensions.
Designing a Cube using SSAS
Last updated 5/17/2012 2:10 PM Page - 39 -
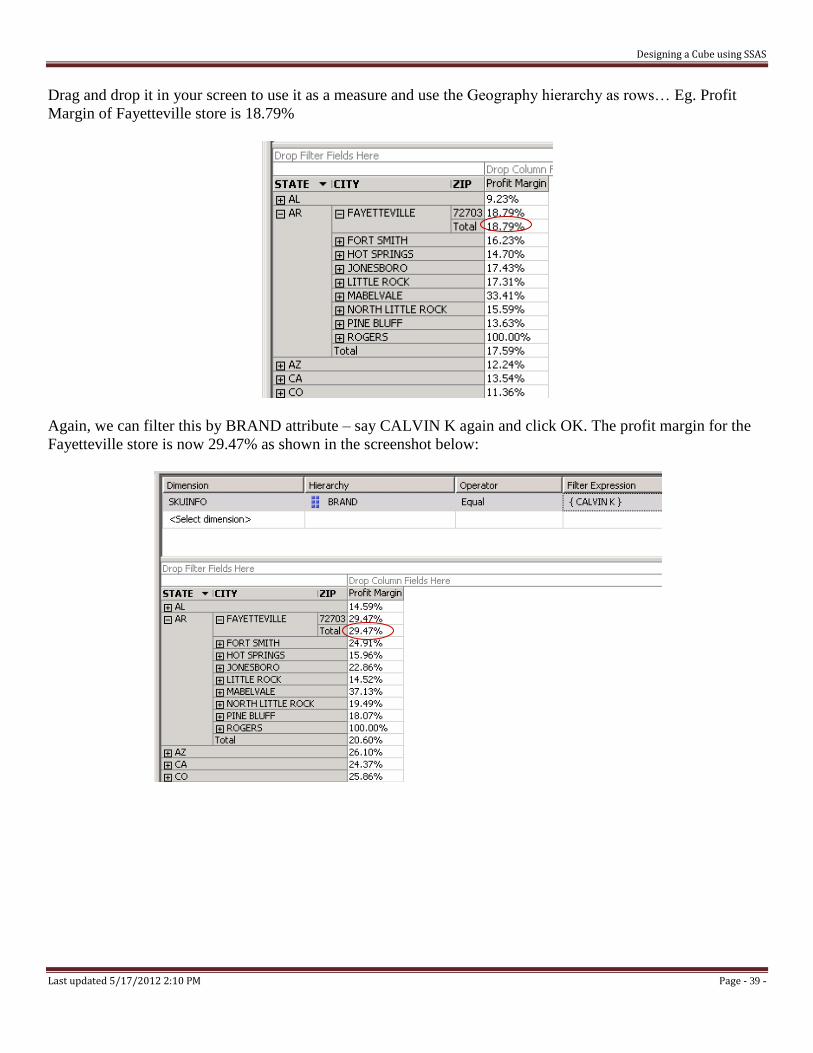
Drag and drop it in your screen to use it as a measure and use the Geography hierarchy as rows… Eg. Profit
Margin of Fayetteville store is 18.79%
Again, we can filter this by BRAND attribute – say CALVIN K again and click OK. The profit margin for the
Fayetteville store is now 29.47% as shown in the screenshot below:
Designing a Cube using SSAS
Last updated 5/17/2012 2:10 PM Page - 40 -
Customizing Cube Functionality
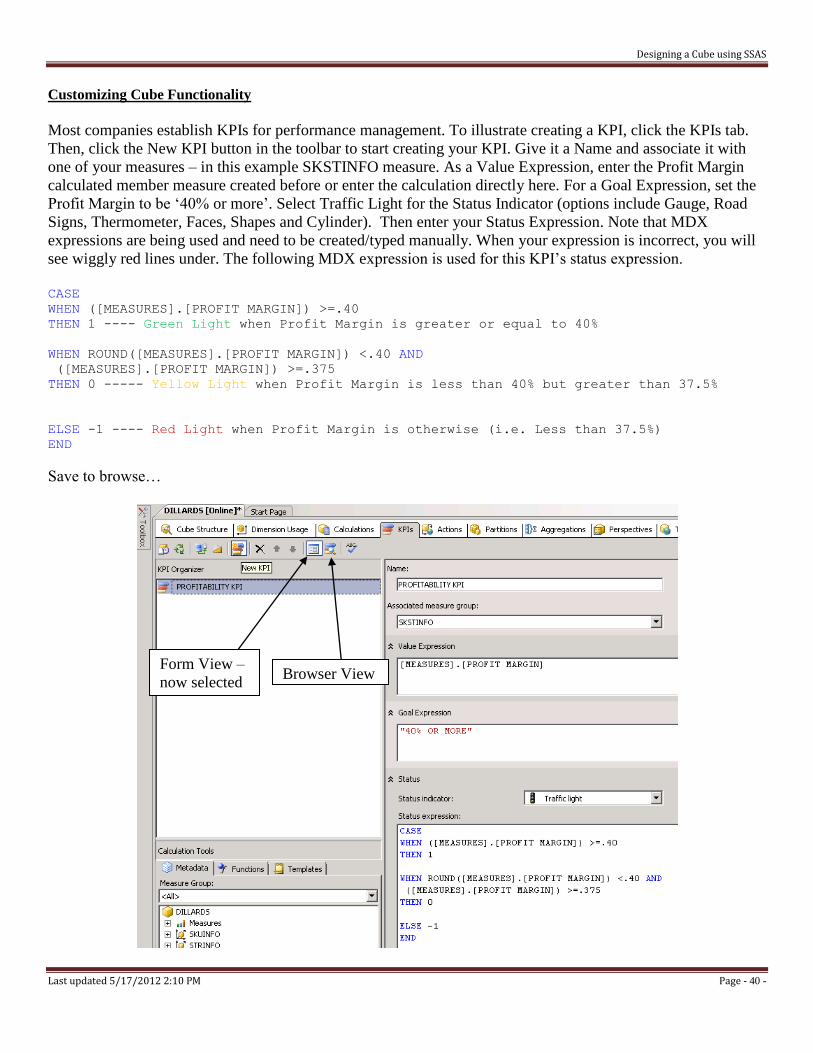
Most companies establish KPIs for performance management. To illustrate creating a KPI, click the KPIs tab.
Then, click the New KPI button in the toolbar to start creating your KPI. Give it a Name and associate it with
one of your measures – in this example SKSTINFO measure. As a Value Expression, enter the Profit Margin
calculated member measure created before or enter the calculation directly here. For a Goal Expression, set the
Profit Margin to be ‘40% or more’. Select Traffic Light for the Status Indicator (options include Gauge, Road
Signs, Thermometer, Faces, Shapes and Cylinder). Then enter your Status Expression. Note that MDX
expressions are being used and need to be created/typed manually. When your expression is incorrect, you will
see wiggly red lines under. The following MDX expression is used for this KPI’s status expression.
CASE
WHEN ([MEASURES].[PROFIT MARGIN]) >=.40
THEN 1 ---- Green Light when Profit Margin is greater or equal to 40%
WHEN ROUND([MEASURES].[PROFIT MARGIN]) <.40 AND
([MEASURES].[PROFIT MARGIN]) >=.375
THEN 0 ----- Yellow Light when Profit Margin is less than 40% but greater than 37.5%
ELSE -1 ---- Red Light when Profit Margin is otherwise (i.e. Less than 37.5%)
END
Save to browse…
Browser View Form View –
now selected
Designing a Cube using SSAS
Last updated 5/17/2012 2:10 PM Page - 41 -
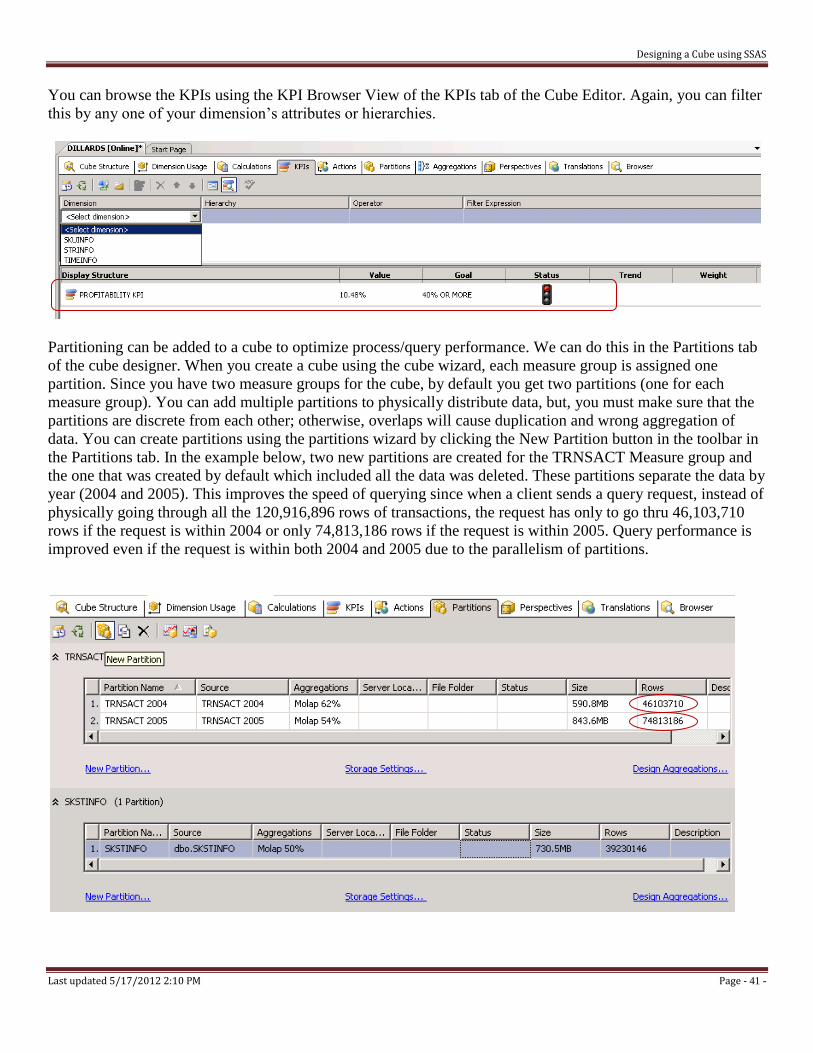
You can browse the KPIs using the KPI Browser View of the KPIs tab of the Cube Editor. Again, you can filter
this by any one of your dimension’s attributes or hierarchies.
Partitioning can be added to a cube to optimize process/query performance. We can do this in the Partitions tab
of the cube designer. When you create a cube using the cube wizard, each measure group is assigned one
partition. Since you have two measure groups for the cube, by default you get two partitions (one for each
measure group). You can add multiple partitions to physically distribute data, but, you must make sure that the
partitions are discrete from each other; otherwise, overlaps will cause duplication and wrong aggregation of
data. You can create partitions using the partitions wizard by clicking the New Partition button in the toolbar in
the Partitions tab. In the example below, two new partitions are created for the TRNSACT Measure group and
the one that was created by default which included all the data was deleted. These partitions separate the data by
year (2004 and 2005). This improves the speed of querying since when a client sends a query request, instead of
physically going through all the 120,916,896 rows of transactions, the request has only to go thru 46,103,710
rows if the request is within 2004 or only 74,813,186 rows if the request is within 2005. Query performance is
improved even if the request is within both 2004 and 2005 due to the parallelism of partitions.