Embed Size (px)
Citation preview
DESIGNING ENERGY AND ENVIRONMENTAL FISCAL INSTRUMENTS
TO IMPROVE PUBLIC HEALTH
Joseph E. Aldy
Joseph E. Aldy: John F. Kennedy School of Government, Harvard University, Cambridge, MA, USA <[email protected]>

1
Abstract
Environmental pollution represents a significant cause of morbidity and premature mortality. Nearly seven million people die prematurely around the world each year as a result of air pollution, and hundreds of thousands more die due to unimproved water and sanitation (Lim et al., 2012). The monetized health and productivity damages from air pollution exceed a hundred billion dollars annually in China and the United States (Matus et al., 2012; US EPA, 2011).
In response to the significant impacts of pollution on health, governments traditionally
pursued command-and-control regulations. These have delivered significant gains in environmental health, although high costs of regulatory mandates suggest the need for alternative approaches to reducing pollution. This paper focuses on taxes and subsidies as potential means for reducing the health burden from environmental pollution.
Pollution taxes change the business calculus for the sources of pollution (Aldy et al.,
2010). Just as higher wages induce firms to invest in labor-saving capital, a pollution tax induces investments that lower pollution. A well-designed tax can ensure that all sources face the same marginal cost of pollution, thereby minimizing the aggregate costs for a given gain in environmental and health quality, and can maximize social welfare by ensuring that the tax equals the marginal benefits of pollution reduction. Raising revenue through a pollution tax could help offset labor and capital taxes, which are distortionary and impose welfare costs as a consequence of raising revenues through these means. Some countries environmentally-related tax revenues comprise 5-10 percent of total tax revenue (OECD, 2011). Taxing fossil fuels in the United States to account for local air pollution and climate change damages would raise revenues equal to about 1.5 percent of GDP (Jorgenson, 2012).
Subsidies in the energy sector can have a profound impact on pollution and health outcomes. Many countries in the developing world subsidize fossil fuels that results in excessive consumption and increased air pollution. Iran’s 2010 subsidy reform illustrates the impact of reducing fossil fuel subsides: fuel prices increases of an order of magnitude reduced carbon dioxide, sulfur dioxide, and nitrogen oxide emissions by 10-20 percent (IMF, 2011). Subsidies for clean energy technologies, by lowering their adoption cost, may displace dirtier sources of energy and produce public health benefits. Subsidizing specific clean energy technologies is typically more costly in aggregate than a pollution tax since it fails to fully exploit the flexibility that a tax offers. For example, a subsidy for an existing set of technologies may not reward innovation like a tax would, nor would it support technologies or process changes that are beyond the scope of the parameters of the subsidy. The design and implementation of fiscal instruments should account for a variety of real-world considerations. Tax instruments deliver greater certainty for the returns to emission abatement investment, and could drive more abatement and innovation than command-and-control regulations or cap-and-trade programs. Such certainty is transparent, which may elicit political opposition since policy-makers typically prefer to impose opaque costs on constituents (Keohane et al., 1998). In some cases, it may be technically or administratively challenging to directly target the pollution externality. For example, India taxes coal as opposed to the more

2
difficult to monitor sulfur dioxide emissions from coal combustion. There are also important interaction effects among multiple policies, such as the prospect of a pollution tax to raise revenue that enables a reduction in labor and capital tax rates. This new revenue source could improve the political palatability of pollution taxes given the fiscal demands in many countries, and a prudent ramping of the policy over time may facilitate broader public support. In countries with subsidized fossil fuel prices, a pollution tax may be ineffective unless the tax can be passed through to consumers. Finally, a pollution tax or fossil fuel subsidy elimination will increase energy prices, and this could raise important distributional questions. Some policy reforms – including the British Columbia carbon tax and the 2005 fossil fuel subsidy reform in Indonesia – have included means-tested unconditional cash transfers to address regressivity concerns.
Keywords: pollution tax, carbon tax, fossil fuel subsidies, cap-and-trade
JEL Codes: H23, Q53, Q58
3
DESIGNING ENERGY AND ENVIRONMENTAL FISCAL INSTRUMENTS
TO IMPROVE PUBLIC HEALTH
I. INTRODUCTION
Environmental pollution represents a significant cause of morbidity and premature
mortality. Household air pollution from the combustion of solid fuels, such as coal and biomass,
ranks as the third leading risk factor in the global disease burden, resulting in some 3.5 million
premature mortalities annually. Ambient particulate matter pollution, primarily from the
combustion of fossil fuels in transportation, industry, and the power sectors, contributes to
another 3.2 million premature mortalities globally. Unimproved water and sanitation lead to
more than 300,000 premature mortalities around the world each year (Lim et al., 2012).
Waterborne diseases rank as the third leading cause of excess mortality in the developing
world (Bruce et al. 2006). In developing countries, indoor air pollution causes about one-third of
children’s acute respiratory infections, which accounts for about 20 percent of under-age five
mortality (Duflo et al., 2008). Air pollution imposes economic damages – from morbidity,
mortality, and foregone labor productivity – in China on the order of more than $120 billion per
year (Matus et al., 2012). Reducing particulate matter pollution in the United States through
2020 may lower annual premature mortality by several hundred thousand (US EPA, 2011).
In response to the significant, adverse impacts of pollution on health, governments have
pursued an array of public policy interventions. Conventional command-and-control regulations
have delivered significant gains in environmental health, especially in developed countries,
although questions of cost-effectiveness remain (US EPA 1997; Lutter and Belzer, 2000).
Subsidies for investments in cleaner-burning cook stoves and for water treatment have aimed to
4
reduce exposure to environmental pollutants in developing countries, with mixed results (Hanna
et al., 2012). Market-based approaches, such as pollution taxes and cap-and-trade programs, have
increased in application to air, water, and waste pollution problems in recent years, reflecting
interest in cost-effective mitigation and the potential for raising revenues (OECD, 2011). This
paper focuses on fiscal instruments – taxes, subsidies, and to a limited degree, cap-and-trade
programs – as potential means for reducing the health burden from environmental pollution.
Pollution taxes change the business calculus for the sources of pollution. With the
emission of every unit of pollution, sources covered by such a tax must bear the social cost of
pollution – for many types of emissions, this primarily reflects premature mortality risk – and
this creates the incentive for them to seek out ways to reduce their adverse impact on
environmental health. A well-designed tax can ensure that all sources face the same marginal
cost of pollution, thereby minimizing the aggregate costs for a given gain in environmental and
health quality, and can maximize social welfare by ensuring that the tax equals the marginal
benefits of pollution reduction. The tax instrument provides a significant opportunity to raise
revenue – some countries environmentally-related tax revenues comprise 5-10 percent of total
tax revenue – that could allow for a reduction in distortionary labor and capital tax rates. While
pollution taxes can deliver socially efficient environmental protection and substantial associated
health benefits, administrative feasibility and political obstacles have undermined broader
application to date.
Subsidies in the energy sector can have a profound impact on pollution and subsequent
health outcomes. Many countries in the developing world subsidize fossil fuels – gasoline,
diesel, kerosene, electricity, and natural gas – that results in excessive consumption of these
fuels, weak incentives for adoption of low-emitting alternatives, and increased air pollution.
5
Phasing out these fossil fuel subsidies could deliver substantial health benefits and serve as a
precursor to subsequent pollution taxes. Failing to remedy fossil fuel subsidies could limit the
efficacy of pollution taxes in delivering emission abatement. Subsidies for clean energy
technologies, by lowering their adoption cost, may displace dirtier sources of energy and produce
some public health benefits. Subsidizing specific clean energy technologies is typically more
costly in aggregate than a pollution tax since it fails to fully exploit the flexibility that a tax offers
to covered firms. In many countries, the politics of clean energy subsidies are ambiguous: energy
sector firms generally prefer subsidies for new investment to taxes on existing investment, but
budget hawks may prefer tax revenues to a subsidy scheme’s tax expenditures.
In this paper, I address energy taxes and subsidies. The vast majority of local air pollution
and the carbon dioxide (CO2) emissions that contribute to global warming occur as a by-product
of fossil fuel combustion. Many developed countries have employed taxes on transportation
fuels, and on other forms of energy to a lesser extent, and many developing countries have
subsidized transportation fuels and electricity, with potentially significant environmental health
and climate change impacts. The array of energy fiscal instruments affect today’s health through
local air pollution and future health outcomes through global climate change. In this assessment,
I also include a discussion of cap-and-trade. Although cap-and-trade is typically considered a
regulatory instrument, it has some important fiscal implications, especially in the case of
auctioning emission allowances. Cap-and-trade also has a more extensive track record in practice
around the world that can serve to inform consideration of emission taxes.
The next section describes the design of specific energy and environmental fiscal
instruments and reviews their application around the world, including pollution and carbon taxes,
subsidies for fossil fuels, subsidies for clean energy technologies, and cap-and-trade. The third
6
section addresses key design features and the political economy of the use of energy and
environmental fiscal instruments. The final section concludes with a discussion of policy
implications.
II. EXPERIENCE WITH ENERGY AND ENVIRONMENTAL FISCAL INSTRUMENTS
A. Pollution Taxes
The most straightforward fiscal instrument to reduce pollution is to tax it. Imposing a tax
on the emissions of an environmental pollutant ensures that the sources of the pollution
externality bear the same incentive to reduce the pollution. A well-structured tax can be set at a
level equating marginal benefits to marginal costs and, hence, maximizes social welfare. In doing
so, the pollution tax can generate substantial revenue to meet existing fiscal needs and/or permit
a reduction in distortionary taxes, such as on capital and labor.
The base of a pollution tax could reflect monitored emissions, emission inputs, or some
other related measure. For example, the U.S. government collects high-frequency data on sulfur
dioxide (SO2) emissions from power plants. Thus, a SO2 emission tax could be implemented
based on these monitored data. Alternatively, a carbon tax could be implemented based on the
carbon content of fossil fuels (see below for more discussion). In general, the basis for the tax
should be as closely connected with the harm caused by the pollution as is administratively
feasible. In some countries, monitoring and enforcement may suggest a tax on a proxy associated
with pollution. For example, India has implemented a coal tax of about $1 per ton, with the
revenues dedicated to clean energy financing. (Refer to section III for a discussion of the trade-
offs between administrative feasibility and effective targeting of the externality).
7
A broad-based tax that covers all sources of a given type of pollution can facilitate cost-
effective emission abatement and maximize the tax revenue for a given tax rate. By setting a
common tax rate on all sources, firms will respond and make investments such that the cost of
their last unit of abatement should be equivalent to the firm’s cost of complying with the
emission tax. Firms with low abatement costs would undertake more emission abatement and
firms with high abatement costs would undertake less emission abatement, but they should all
incur the same marginal cost of abatement. As a result, the reduction in environmental pollution
is achieved cost-effectively, and no other policy can deliver the same environmental outcome at
a lower cost. This approach taps into the profit motive of private firms by providing them with
the flexibility to undertake any actions to lower their emissions, and hence legally reduce their
tax bill. This represents a more economically appealing alternative to higher cost, command-and-
control approaches that limit a firm’s flexibility in complying with environmental standards.
To maximize social welfare, the emission tax rate should be set such that it equals the
marginal benefits of emission reduction. This is equivalent to requiring the source of pollution to
pay for the marginal environmental damage associated with that pollution. Just as a firm must
bear the cost of using labor, materials, and capital in the production of its goods, it would also
bear the cost of the pollution by-product from its manufacturing process. In practice, emission
taxes may fall short of the full social cost, perhaps reflecting political pressure. For example,
France implemented a tax on nitrogen oxide emissions (NOX) of about $23 per ton starting in the
early 1980s while Sweden imposed a tax of about $4,000/tNOX.1 This does not reflect two orders
of magnitude difference in the social cost of nitrogen oxide emissions between France and
Sweden, but variation in the outcome of a political process.
1 Note that all references to tons in this paper are technically to metric tonnes.

8
Several European nations have employed emission taxes as a component of their policy
programs aimed at reducing water pollution (OECD, 2011). The Netherlands imposed effluent
charges on industrial pollution starting in the 1970s, and these charges are considered the
primary driver of declines in organic and heavy metal pollution – as much as one-half in first
decade of operation (Bressers, 1988). France has employed a combination of command-and-
control regulations and effluent taxes. The tax rates in France are considered too low to have a
meaningful impact on pollution (Barde and Smith, 1997; Glachant, 2001). Germany and
Denmark have also implemented effluent charges, but with more modest environmental benefits
than in the Dutch case, perhaps reflecting differences in policy design and institutional context
(Andersen, 2001). In these countries, the revenues from the water effluent charges are typically
earmarked for investment in wastewater treatment capacity. Thus, even if the investment does
not induce a reduction in pollution at the source, it may nonetheless finance public investment in
water quality and hence improve public health. An array of political and institutional factors
explains the paucity of effluent charges (as well as cap-and-trade schemes) to reduce water
pollution (Boyd, 2003).
In many countries that have centralized water distribution systems, the government
typically sets the prices on the quantity of water used by residential, industrial, and agricultural
consumers. Changes in Israeli water pricing policies, in response to water scarcity concerns, have
reduced agricultural sector water consumption while water productivity in crop production has
improved (OECD, 2011). In the U.S. residential sector, households respond to higher prices by
economizing on their consumption as well (Olmstead et al., 2007). In combination, price-setting
to affect water demand and effluent charges to affect the pollution load of discharged water can

9
improve local water quality, although the price and tax levels have, in practice, often been set
below socially-optimal levels.
An emission tax can raise revenue to finance reductions in taxes that discourage the
supply of labor and capital. Lowering payroll, income, or capital gains tax rates could offset
some of the costs of environmental policy. Such a “tax swap” would increase the tax rate on
“bads,” such as pollution, and reduce the tax rate on “goods,” such as labor and capital.
Environmentally-related tax revenue represents about 5 to 10 percent of total tax revenue for
several developed countries, including Australia, Denmark, Finland, Italy, the Netherlands,
Norway, Sweden, Switzerland, and the United Kingdom (OECD, 2011). In the United States,
imposing pollution taxes on fossil fuels to reflect their social costs associated with local air
pollution and climate change would raise a significant amount of revenue. The pollution tax on
coal would be more than 200 percent of its current price, while the pollution tax on oil and
natural gas would be about 10 percent (Jorgenson, 2012). This illustrates the very significant
adverse impacts of coal, primarily through premature mortality, that are not reflected in the
current prices for the commodity. Implementing such tax rates would result in emission sources
facing marginal costs equal to the marginal benefits of pollution abatement and raise tax
revenues equal to about 1.5 percent of GDP (based on an analysis calibrated to 2011 data;
Jorgenson, 2012).
Despite the appealing attributes of emission taxes, most environmental policies employ
command-and-control regulatory standards to reduce pollution. While these regulatory mandates
have delivered significant environmental health gains in developed countries over the past
several decades, diminishing returns in developed countries and weak monitoring and
10
enforcement in many developing countries suggest an opening for more extensive use of tax
instruments to deliver improved environmental health.
B. Carbon Taxes
A carbon tax represents the simplest approach to ensure that sources of CO2 emissions
bear the full cost of those emissions (Metcalf, 2007). Most carbon tax proposals call for the
government to set a tax in terms of dollars per ton of CO2 on the carbon content of the three
fossil fuels (coal, petroleum, and natural gas) as they enter the economy (Aldy, Ley, and Parry
2008). Such an upstream approach can effectively minimize the number of firms covered
necessary to tax the entire CO2 emissions base. It is an appropriate means of targeting CO2
emissions given the properties of fossil fuels. Monitoring the physical quantities of these fuels
yields a precise estimate of the emissions that would occur during their combustion, unless
carbon capture and storage technology becomes commercially viable.
To be cost-effective, such a tax would cover all sources, and to be efficient, the carbon
price would be set equal to the marginal benefits of emission reduction, represented by estimates
of the social cost of carbon (Interagency Working Group on Social Cost of Carbon, 2010). A
carbon tax would be administratively straightforward to implement in most industrialized
countries, since the tax could piggy-back on existing methods for fuel-supply monitoring and
reporting to the tax authority. For example, in the United States, refineries and importers of
refined petroleum product pay a per barrel tax to finance the Oil Spill Liability Trust Fund and
coal mines pay a per ton tax to finance the Black Lung Disability Trust Fund (Aldy, 2013b).
Some developing countries, with effective tax systems, could also implement carbon taxes in a
similar manner.
11
Raising energy prices – through carbon taxation and/or removing fossil fuel subsidies –
drive changes in the investment and use of emission-intensive technologies, as reflected in real-
world experience with energy prices. In the United States, high gasoline prices in 2008 reduced
vehicle miles traveled by the existing light-duty vehicle fleet and resulted in a shift in the
composition of new cars and trucks sold toward more fuel-efficient vehicles (Ramey and Vine,
2010). The dramatic decline in U.S. natural gas prices (and decline in the relative gas-coal price)
in recent years caused utilities to dispatch more electricity from gas plants that resulted in lower
carbon dioxide emissions and the lowest share of U.S. power generation by coal in some four
decades (US EIA, 2009). In Guatemala, higher crude oil prices reduced liquefied petroleum gas
(LPG) consumption as households substituted to biomass for cooking. The higher consumption
of biomass increased the rate of respiratory illnesses among children (Venkataramani and Fried,
2011). High energy prices induce more innovation – measured by frequency and importance of
patents – and increase the commercial availability of more energy-efficient products (Newell,
Jaffe, and Stavins, 1999; Popp, 2002).
In the 1990s, Denmark, Finland, Norway, and Sweden imposed carbon taxes as part of
their programs to limit their greenhouse gas emissions.2 In contrast to the standard policy
prescription to impose a uniform carbon tax on the entire emission base, these countries have set
tax rates that vary by fuel and industry. In Norway, the carbon tax on gasoline is about 70
percent higher than the carbon tax on diesel (Government of Norway, 2009) and, in Denmark
and Sweden, energy-intensive manufacturing is effectively exempt from the carbon tax
(Government of Denmark, 2009; Daugjberg and Pedersen, 2004). For those sources facing a
carbon tax in northern Europe, the tax rate varied by an order of magnitude in recent years,
ranging between US$17 – US$135 per ton CO2 (Aldy and Stavins, 2012a). 2 Refer to Aldy and Stavins (2012a) for further discussion of these programs.
12
The carbon tax policies represented an element of fiscal reform. For example, in 1991,
Sweden implemented a carbon tax of about $33/tCO2 as a part of a fiscal reform that lowered
high income tax rates (Speck, 2008). In 1997, Finland imposed a general tax on energy coupled
with a surtax based on the carbon content of the energy.
In 2008, the Canadian province of British Columbia (BC) implemented a carbon tax
consistent with many principles of a good tax design discussed above. The carbon tax covers all
sources in the economy through an upstream point of compliance (Duff, 2008). The tax started at
C$10 per ton of CO2 emissions in 2008 and increased by C$5 per year for four years, finally
reaching C$30/ton in 2012. The provincial government returns 100% of the tax revenue through
tax cuts to businesses and individuals, and a Low Income Climate Action Tax Credit for low-
income individuals.
An initial assessment of the BC carbon tax suggests that it has reduced consumption of
petroleum products and lowered CO2 emissions without undermining economic activity in the
province. A simple differences-in-differences analysis of outcomes for BC relative to other
Canadian provinces between the pre-2008 period and the first four years of the carbon tax in BC
indicates that per capita consumption of refined petroleum products is about 5.6 percent lower,
per capita greenhouse gas emissions are about 5.3 percent lower, and provincial GDP is about
1/10 of 1 percent higher in BC after the implementation of the tax (Elgie, 2012).
C. Fossil Fuel Subsidies
Many countries, especially in the developing world, subsidize the consumption of fossil
fuels that result in excessive fuel consumption, local air pollution, and CO2 emissions. About 61
percent of the world’s population lives in countries that price refined petroleum products below
13
market prices and 60 percent live in countries with subsidized electricity prices (IEA, 2012; UN,
2012).
Removing fossil fuel subsidies can deliver incentives for efficiency and fuel switching
comparable to imposing a carbon tax or SO2 tax. The economic and fiscal benefits of fossil fuel
subsidy reform could be significant. In 2008, fossil fuel consumption subsidies exceeded $500
billion globally, and could exceed $660 billion by 2020 without policy reforms (IEA, 2011). In at
least ten countries, fossil fuel subsidies exceeded 5 percent of GDP, and constituted substantial
fractions of government budgets (IEA, 2010). For example, Egypt, Indonesia, and Yemen have
had fossil fuel subsidies equal to at least 20 percent of their national government budgets in
recent years (OECD et al., 2010; IMF, 2010; Fattouh and El-Katiri, 2012).
Eliminating fossil fuel subsidies could reduce global oil consumption by about 4.7
million barrels per day by 2020, representing a decline of about 5 percent of current
consumption. The International Energy Agency (2010) estimates that eliminating all fossil fuel
subsidies would reduce global CO2 emissions by about two gigatons per year by 2020. In
general, the climate and health benefits of eliminating fossil fuel subsidies arise from an
incentive to conserve or switch to less-polluting sources. For example, the significant ramping up
of refined petroleum product prices in Iran starting in December 2010 – in some cases increasing
prices by more than an order of magnitude – is estimated to have reduced nitrogen oxide (NOX)
and sulfur dioxide (SO2) emissions by 10–20 percent in the first year of the subsidy reform (IMF,
2011). Exceptions to this include subsidies for LPG for poor and rural households in developing
countries. Removing these subsidies may result in households burning more biomass for
cooking, which can cause more adverse respiratory impacts than these fuels. In addition, the
14
climate benefits of reducing LPG subsidies could be significantly offset by land clearing for and
combustion of biomass fuels.
Some governments claim that fossil fuel subsidies serve as a way to benefit poor
households, especially in those countries that lack the institutional capacity to implement an
effective means-tested cash transfer program. In practice, a significant fraction of subsidies
benefit the wealthy. For example, the wealthiest income quintile enjoys 44 percent of petroleum
subsidies in Africa and 38 percent of petroleum subsidies in Latin America, while the lowest
income quintile receives only 8 and 6 percent, respectively, of the subsidy value in these regions
(Coady et al., 2010). In addition, subsidized fuels, especially those targeting low-income
households, may be diverted illegally to non-subsidized markets, thereby benefitting those
operating in the black market, not low-income households. For example, 40 percent of
subsidized kerosene in India has been diverted to non-subsidized markets (Shenoy, 2010).
Some energy subsidies are explicitly design to target low-income households and these
programs deliver public health benefits. For example, the U.S. Low Income Home Energy
Assistance Program (LIHEAP) provides mean-tested financial support to households for heating
in the winter and cooling in the summer. For low-income households, there is a “heat or eat”
trade-off, in which fuel expenditure shocks result in lower expenditures and consumption of food
(Bhattacharya et al., 2003; Beatty et al., forthcoming). LIHEAP subsidy receipt is associated
with less evidence of undernutrition and lower probabilities of emergency room visits among
low-income children (Frank et al., 2006). The vast majority of energy subsidies globally,
however, are not targeted to low-income households.
D. Clean Energy Subsidies
15
Many governments have subsidized clean energy investments in an effort to lower
conventional air pollution and CO2 emissions. For example, the clean energy package of the
2009 American Recovery and Reinvestment Act focused on investments in clean energy that
targeted various externalities, particularly CO2 emissions (Aldy, 2013a). Although subsidies for
low-emitting technologies are not as efficient as taxing the emitting sources themselves (Metcalf,
2009), the primary policy tools of an economic stimulus are tax expenditures and government
outlays, not new taxes.
The Recovery Act provided more than $90 billion to support clean energy activities
including more than $25 billion for renewable power and nearly $20 billion for energy efficiency
investments (CEA, 2010). Transportation activities, including high-speed rail, mass transit, and
advanced vehicles, fuels, and battery technologies received about $24 billion. The Act
appropriated more than $10 billion for grid modernization, including smart grid deployment and
financing for transmission capacity for two Federal power marketing administrations. To
promote the deployment of new technologies, the clean energy package employed a variety of
policy instruments including deployment grants, tax credits, subsidized bonds, and R&D outlays.
Globally, governments spent more than $400 billion on clean energy subsidies as a part of their
stimulus packages in 2008-2009 (Robins et al., 2009).
The significant ramping up of subsidies had a material impact on energy sector
investment. In energy efficiency, the Department of Energy weatherized nearly 300,000 homes
in 2010 (triple the annual average over 2003-2007), and approximately 600,000 homes with
Recovery Act funding. The Recovery Act promoted renewable power through tax credits, grants,
loan guarantees, and accelerated depreciation. By the end of 2010, U.S. wind generating capacity
had increased about 60% over two years, reflecting triple the investment that the U.S. Energy

16
Information Administration forecast under its business-as-usual (i.e., no stimulus) scenario.
Wind power generation increased from 55 billion kilowatt hours in 2008 to 95 billion kilowatt
hours in 2010 and was forecast to exceed 115 billion kilowatt hours in 2011 (US EIA, 2011).
These wind subsidies may have reduced U.S. power sector CO2 emissions as much as 43 million
tons in 2010 (Aldy, 2013a).
In recent years, Germany has delivered substantial subsidies for solar power through
feed-in tariffs (FITs): fixed rates for power above expected electricity prices for conventional
power sources. Over 2008-2010, Germany’s expenditures for solar FITs exceeded €10 billion
with guaranteed rates as high as 46¢/kWh. During these three years, installed solar capacity more
than quadrupled in Germany. Although these resource expenditures delivered a significant
increase in solar capacity, these subsidies were not cost-effective. The effective cost per ton of
CO2 abated through the solar FIT was more than €500/tCO2, an order of magnitude greater than
the estimated cost of emission abatement under the EU Emission Trading Scheme (Marcantonini
and Ellerman, 2013). Likewise, the generous suite of Recovery Act subsidies for wind (e.g., tax
credit, loan guarantees, and accelerated depreciation) and state programs supporting wind power
investment (e.g., renewable portfolio standards) resulted in a cost per ton of CO2 avoided at least
four times the social cost of carbon (Aldy, 2013a).
E. Cap-and-Trade
While cap-and-trade is typically considered a regulatory instrument, I have included it in
this discussion because it can have important fiscal properties and deliver comparable incentives
to reduce pollution as an emission tax. A cap-and-trade system effectively rations the right to
emit in a cost-effective manner. It constrains the aggregate emissions of regulated sources by
17
creating a limited number of tradable emission allowances – in sum equal to the overall cap –
and requiring those sources to surrender allowances to cover their emissions (Stavins, 2007). The
value a firm places on an allowance reflects the cost of the emission reductions that can be
avoided by surrendering an allowance. Trading creates the incentives for allowances to be put to
their highest-valued use, i.e., covering those emissions that are the most costly to reduce while
firms undertake the least costly reductions (Montgomery, 1972; Hahn and Stavins, 2011). As
firms buy and sell a fixed quantity of allowances, a price on emissions emerges, which is
effectively the dual of an emission tax that prices emissions and yields a quantity of emissions as
firms respond to the tax’s mitigation incentives. Uncertainty in emission abatement costs leads to
uncertainty regarding the emissions price under a cap-and-trade system and uncertainty
regarding emissions quantity under a tax.
In designing a cap-and-trade system, policymakers must determine the size of the
emission cap (i.e., how many allowances to issue), and the scope of the cap’s coverage (i.e., the
types of emissions and sources covered by the cap. Policymakers must also determine whether to
freely distribute or sell (auction) allowances. Free allocation of allowances to firms could reflect
some historical record (“grandfathering”), such as past emissions or sales. Such grandfathering
involves a transfer of wealth, equal to the value of the allowances, to existing firms, whereas,
with an auction, this same wealth is transferred to the government. As with receipts under an
emission tax, auction revenues could be used to reduce distortionary taxes or finance other
programs.
In the United States, allowance trading systems have been deployed to phase out lead
from gasoline in the 1980s and to lower SO2 emissions contributing to acid rain starting in the
1990s (Schmalensee and Stavins, 2012). The SO2 cap-and-trade program lowered emissions in
18
the power sector to half of their 1980 levels at much lower costs (and allowance prices) than
anticipated at the time that the program was passed into law. More importantly, it became clear
with epidemiological research that the SO2 reductions delivered dramatic public health benefits,
with annual economic benefits from mortality risk reduction on the order of $50 - $100 billion
(Schmalensee and Stavins, 2012).
By far the world’s largest cap-and-trade program is the European Union Emission
Trading Scheme (EU ETS). Beginning in 2005, the EU ETS covers about 11,500 facilities,
representing approximately half of EU CO2 emissions, including oil refineries, combustion
installations over 20 MWh, coke ovens, cement factories, ferrous metal production, glass and
ceramics production, and pulp and paper production. The EU ETS has expanded to include
several non-EU European countries: Croatia, Iceland, Norway, and Liechtenstein. The European
Union plans to extend the EU ETS through Phase III, 2013-2020, with a cap becoming
increasingly more stringent (at least 20% below 1990 emissions), and a larger share of the
allowances subject to auctioning. The EU appears to have lowered greenhouse gas emissions
consistent with its Kyoto Protocol target of 8 percent below 1990 levels over the 2008-2012
period (net of some offsets through the Clean Development Mechanism, a project-based
approach to lowering emissions in developing countries under the Kyoto Protocol), although
further analysis is necessary to determine the role that the ETS played, relative to renewable and
efficiency mandates, and the decline in economic activity.
In January 2008, New Zealand launched its Emissions Trading Scheme (NZ ETS) and
Australia brought its hybrid tax/cap-and-trade program online in 2012. China has plans to initiate
19
seven city/provincial level cap-and-trade pilot programs over the next few years and South Korea
also plans a cap-and-trade program to address greenhouse gas emissions.3
In the United States, ten northeast and mid-Atlantic states launched the Regional
Greenhouse Gas Initiative (RGGI) in 2008, a power sector CO2 cap-and-trade program. RGGI
auctions off all of the emission allowances and most states use the revenues to subsidize clean
energy investment. The cap-and-trade program has delivered little environmental benefit because
the emissions caps were set at levels that have not been binding since policymakers did not
anticipate the 2008-2009 recession or the dramatic decline in natural gas prices. Through June
2013, RGGI has held twenty auctions, and allowances have sold for about $2-$3/t CO2
(reflecting the auction price floor of about $2/t CO2 and the prospect of banking allowances for
future years when emission caps may be binding). As a result, the program has raised about $1.3
billion over 2008-2013 for use primarily in state energy programs, and some limited use as
general revenues in these states. In 2012, California implemented a cap-and-trade program
covering about 85 percent of the state’s greenhouse gas emissions. The program established a
downward trajectory for emissions through caps intended to lower emissions to 1990 levels by
2020 (Burtraw et al., 2012).
III. INSTRUMENT CHOICE AND DESIGN
A. Prices versus Quantities versus Command-and-Control Regulation
Dating back to the dawn of the modern environmental movement in the 1970s, the
conventional approaches to environmental policy have employed uniform standards to protect
environmental quality. These so-called command-and-control regulatory standards typically
3 For further details on these cap-and-trade programs, refer to The World’s Carbon Markets: A Case Study Guide to Emissions Trading, produced by Environmental Defense Fund and the International Emissions Trading Association, available at: http://www.edf.org/climate/worlds-carbon-markets (last accessed June 26, 2013).
20
require specific equipment or procedures (technology standards) or specify allowable levels of
emissions (performance standards). In principle and in some practice, uniform technology and
performance standards have been effective in achieving some environmental objectives.
Such approaches, however, result in higher costs than necessary to reduce pollution. In
addition to failing on static cost-effectiveness grounds, conventional standards do not provide
dynamic incentives for the development, adoption and diffusion of environmentally and
economically superior emission mitigation technologies. Firms face little incentive to develop or
adopt cleaner technology once they have demonstrated compliance with a regulation. The
prospect that the government may impose tighter standards in the future if firms voluntarily
adopt superior technology today may further inhibit innovation. Since command-and-control
regulation impose greater costs than emission taxes or cap-and-trade, it may be difficult to secure
political support for a given environmental goal and thus result in weaker standards and lower
environmental benefits.4
In contrast, emission taxes and cap-and-trade can deliver cost-effective and economically
efficient pollution mitigation. As noted above, by explicitly pricing the pollution externality,
these types of instruments provide incentives to the private sector to seek out and exploit the
lowest cost ways of reducing emissions. By minimizing the costs of pollution abatement, they
can facilitate the setting of more ambitious pollution reduction goals, in terms of both the
political process and benefit-cost analysis. The setting of tax levels or emission caps such that
marginal costs equal the marginal benefits of pollution abatement can maximize social welfare.
In theory, and assuming certainty in costs and benefits, an emission tax and a cap-and-trade
program can be designed to deliver equivalent, welfare-maximizing outcomes.
4 Command-and-control regulation may be appropriate for those special cases in which emission monitoring and enforcement are technically challenging and particularly costly. This serves as one explanation for light-duty vehicle tailpipe emission standards.
21
While emission taxes and cap-and-trade are generally preferred on efficiency and cost-
effectiveness grounds to command-and-control, the comparison between tax and cap-and-trade
instruments is more ambiguous. On efficiency grounds, an emission tax would be preferred to an
otherwise equivalent cap-and-trade program if the former enabled a reduction in distortionary tax
rates while the latter gave away emission allowances for free. On political grounds, however, the
free allocation of allowances may be necessary to secure sufficient support for the pollution
reduction policy (Aldy and Pizer, 2009).
The uncertainties characterizing the costs of reducing pollution impact the tax versus cap-
and-trade calculus. Price-based approaches like an emission tax provide certainty over marginal
costs of compliance but result in uncertain environmental outcomes. Quantity-based approaches
like cap-and-trade provide certainty over the environmental outcomes but result in uncertain
marginal abatement costs. Given the uncertainties in reducing emissions, a tax is generally
preferred if a small change in emission abatement would result in a greater change in costs than
in benefits. If small change in abatement delivers a greater change in benefits than costs, then a
quantity instrument would be preferred under abatement cost uncertainty (Weitzman, 1974). In
the context of mitigating greenhouse gas emissions, the estimated benefit and cost functions
typically employed to evaluate climate change policies provide evidence that a price-based
approach, such as a carbon tax, would deliver greater social welfare than cap-and-trade (Aldy et
al., 2010).
Complicating this analysis, and suggesting further evidence that a tax instrument is
preferable to cap-and-trade, is the impact that uncertainty has on investment (Dixit and Pindyck,
1994). Firms may delay making decisions about investments that are irreversible in nature (e.g.,
like most pollution-control equipment) if there is uncertainty about the returns to the investment

22
and some prospect of learning that reduces this uncertainty over time. Under an emission tax, a
firm knows with certainty the abatement cost for a unit of emissions. Under cap-and-trade, a firm
cannot know with certainty the price of emission allowances in advance of the implementation of
the program. Thus, it could be in the firm’s interest to postpone an investment decision until it
has better information about the price of allowances, such as after the program has begun and
trading has commenced. If there are future events that could impact the price of allowances, and
hence the returns to abatement decisions, this could also inhibit investment well beyond the start-
up of a cap-and-trade regime. As a result, the lower investment could yield higher costs and
potentially less innovation than what an otherwise equivalent emission tax would deliver.
B. Efficacy of Targeting the Externality
An effective tax or subsidy should target the externality as closely as possible to
minimize the policy’s welfare losses. Administrative and/or political feasibility may limit how
well a given instrument targets the externality. Consider a few examples.
Parry and Small (2005) note that some externalities associated with driving light-duty
vehicles are a function of fuel consumption (e.g., CO2 emissions), while others are a function of
vehicle miles traveled (e.g., accidents, local air pollution). As a result, a simple tax instrument
that addresses just one of these margins, such as a gasoline tax, will not ensure that drivers bear
the accurate social cost of driving. In their analyses of the externalities from driving in the
United States, Parry and Small found that the optimal vehicle miles traveled tax yields about four
times greater welfare gain than the optimal gasoline tax. A combination gasoline and vehicle
miles traveled tax could yield greater social welfare than one instrument in isolation.
23
Heterogeneity in the damages from consuming energy may also undermine the efficiency
of a fiscal instrument. For example, all wind power farms in the United States can claim a
2¢/kWh production tax credit, even though a given wind farm in the Pacific Northwest may
displace hydropower on the grid, yielding no CO2 or local air pollutant benefits, while a wind
farm in the Midwest may displace coal- or gas-fired power generation with associated CO2
emission mitigation and, in the case of coal, considerable local air pollution mitigation benefits.
Related to this spatial heterogeneity point, Muller and Mendelsohn (2009) find dramatic
differences across the country in the social damages – primarily premature mortality – from a ton
of SO2 emissions (as well as a ton of NOX emissions). Some emission sources are upwind of
large, dense population centers that could bear significant adverse health impacts from
emissions, while others are in sparsely populated areas. As a result, they estimate that the US
SO2 cap-and-trade program, which treats a ton of SO2 as the same regardless of location,
foregoes at least half of the potential social welfare benefits of pursuing trading in lieu of
command-and-control regulation by failing to permit trading as a function of the health damages
associated with emissions at any pair of sources considering an allowance trade. Such a scheme
of trading ratios, however, could significantly reduce trading volume – given its complexity and
effective rendering of a commodity into a specialized, transaction-specific product – and may
elicit political objections by identifying quite explicitly winners and losers. In addition, the
complexities and nonlinearities of atmospheric chemistry – such as the fact that NOX emissions
from some sources upwind of a few large, eastern urban areas decrease premature mortality
(Fraas and Lutter, 2012) – may suggest that a simpler, administratively feasible approach may be
preferable even if, in theory, it is sub-optimal in terms of social welfare.
24
Heterogeneity also impacts the effectiveness of a gasoline tax. Knittel and Sandler (2013)
show that a uniform gasoline tax intended to fully internalize the costs of local air pollutants on
average only reduces about 25 percent of the deadweight loss that occurs when these pollutants
are untaxed. This reflects the fact that some cars, especially older cars, are significantly dirtier
than others. In their evaluation of more than seven million California vehicles, they find that a
car 10-15 years old has, on average, three times more hydrocarbon, ten times more carbon
monoxide, and about two times more NOX emissions per mile than a car four to nine years old.
Thus, a well-targeted tax instrument should attempt to address the vintage or, more specifically,
the pollution profile of the automobile. This may also be administratively challenging and may
elicit some political challenges because of its potentially regressive nature.
C. Institutional Capacity and Administrative Feasibility
The choice of fiscal instrument may depend in part on a given government’s institutional
capacity. For example, in some developing countries, finance ministries have implemented tax
systems that could permit relatively straightforward implementation of an emission tax. In
contrast, few developing countries have strong, effective environmental ministries and the
requisite legal system to implement a cap-and-trade program.
The challenge and cost of measuring emissions may make weaken the case for an
emission tax. In such a scenario, subsidies for easily observable activity (e.g., building a wind
farm) may be the only feasible option. Alternatively, a tax on a proxy – such as coal instead of
SO2 emissions at a power plant – may be available to policymakers, although it may not
represent an efficacious targeting of the externality.

25
As a general principle, an administratively simple (and feasible) fiscal instrument should
be preferred over a more complex option. An administratively simple and transparent tax is more
likely to be understood by covered sources, and thus they may respond in socially desirable
ways. A simpler tax instrument also facilitates explanations of rules as well as enforcement
actions by the tax authority. Likewise, simpler subsidy regime designs remove ambiguity that
might otherwise inhibit socially-desirable investment.
D. Interactions among Multiple Policy Instruments
1. Tax versus Cap-and-Trade in Presence of Other Instruments
Although public policies are frequently proposed and analyzed in isolation, they in fact
interact with one another in a number of very important ways, which can affect the policy’s
environmental effectiveness and costs. Emission mitigation policies of all kinds raise production
costs and act as implicit taxes and interact with pre-existing taxes in ways that drive up the costs
of the policies. This is the so-called tax-interaction effect (Goulder, 1995). Those policy
instruments that produce revenues for government, including carbon taxes and cap-and-trade
with auctioned allowances, can dedicate part or all of their revenue to cutting existing,
distortionary taxes, thereby offsetting some or – in principle – all of the tax-interaction effect.
These interactions can have profound effects on the costs of a climate policy (Goulder and Parry,
2008).
In addition, cap-and-trade systems introduce another set of issues due to their interaction
with other policies. In general, once a cap-and-trade program is in place, any attempt to elicit
greater reductions from some specific source or sector under the cap will essentially be undone
by some other covered source or sector under the cap, because of allowed trading. Thus,
26
subsidizing clean energy investments in a sector covered by cap-and-trade yields zero
incremental health benefits. Likewise, a performance standard coupled with cap-and-trade also
reduces cost-effectiveness, increases costs, and delivers no additional health benefits when
compared to cap-and-trade in isolation.
This is a significant issue for cap-and-trade systems, renewable electricity standards,
clean energy standards, and motor-vehicle fuel efficiency standards. These problematic
interactions can occur when one policy instrument is nested within another, as with sub-national
policies and national policies and when two policy instruments co-exist within the same political
jurisdiction (Goulder and Stavins, 2011; McGuinness and Ellerman, 2008; Fischer and Preonas,
2010; Levinson, 2010; OECD 2010). The social costs of such perverse interactions are likely to
be lower with an emission tax than cap-and-trade, since multiple policies could yield a lower
emission level than the tax in isolation, but at the expense of cost-effectiveness.
2. Fossil Fuel Subsidies and Emission Taxes
The extensive role of the state in setting prices for transportation fuels, electricity, and
other fossil fuels may undermine the effectiveness of an emission tax in some countries. An
efficacious emission tax operates on several margins: inducing the emission source to make
investments to lower the emission intensity of production and raising the cost of the emission-
intensive good, thereby inducing less consumption of the polluting good. If the retail price of an
emission-intensive good, such as electricity, is fixed by the government, then power plants may
not be able to pass through the emission tax to consumers. As a result, the environmental and
public health benefit of the emission tax will have been muted in part by the government’s
system of fossil fuel subsidies. Thus, governments seriously considering emission taxes should
27
account for how these instruments will interact with existing energy price-setting regimes and
determine how the taxes can be passed through to consumers.
E. Political Economy Considerations
1. Distributional Considerations
Any public policy will inevitably have significant distributional consequences, even if it
does no more than reinforce the status quo. Taxing emissions, especially CO2 but also any
pollutant associated with fossil fuel combustion, will increase energy prices, particularly
increasing the cost of energy derived from coal combustion and, to a lesser extent, petroleum and
natural gas combustion. Firms providing pollution control equipment and low-emitting
technologies would likely benefit from emission taxes. Reducing pollution through tax
instruments would likely disproportionately benefit young children, the elderly, and those in poor
health. The economic incidence of such energy price increases – in terms of costs and benefits –
may vary across sectors of the economy, across regions of the nation, across income groups, and
even across countries, and are likely to have significant political impacts on the feasibility of
policy instruments.
2. Instrument Transparency
Given the political economy implications of the costs of environmental policy and the
political stigma of taxes (in at least some countries), policymakers have strong incentives to
select instruments that minimize the perceived costs of policies (Keohane et al., 1998). Of
course, unambitious policies can accomplish this goal, but more importantly cost-effective
instruments may also deliver on this political objective. Public officials may find policy
28
instruments that hide or partially obscure their costs appealing. This explains, in part, the long-
term support for conventional command-and-control instruments, such as performance and
technology standards to address environmental health risks.
3. Ramping Up Policy Stringency
In an array of policy contexts, stakeholder and public support have been gained through
the gradual ramping-up in policy stringency. British Columbia implemented a carbon tax in 2008
at C$10/tCO2 and increased the tax C$5/tCO2 annually until reaching C$30/tCO2 in 2012. The
U.S. EPA phased in the SO2 cap-and-trade program over two time periods. The first phase
started in 1995 and covered the largest power plants and the second phase began five years later
when the program expanded to cover the balance of the facilities. The EU launched the Emission
Trading Scheme with a pilot phase in 2005 that imposed a relatively lax CO2 emission caps. The
pilot phase provided time for covered facilities and regulators to gain experience with the trading
regime before moving into the more stringent second phase in 2008.
4. Need for Revenues
Given the current poor fiscal outlook in many developed countries, a new revenue stream
through an emission tax may become politically palatable even if a tax typically would not be in
isolation (Aldy, 2013b). Likewise, developing country governments may find fossil fuel subsidy
reform appealing in light of the kinds of pressures such subsidies impose on other spending
needs. Conversely, subsidies for clean energy technologies may face tough political headwinds
given the various demands for spending and deficit reduction in many countries. It appears quite
unlikely that clean energy subsidies in developed countries could return to their levels of 2009.

29
5. Salient Revenue Recycling
Skeptics of a tax swap – taxing emissions and using the revenues to lower labor and/or
capital taxes – claim that governments may impose an emission tax and use the revenues to
enlarge the public sector. To address this concern and to build support for a new CO2 mitigation
program, the province of British Columbia distributed C$100 checks to every resident in the
month before implementing the tax. These initial checks represented a down payment on the
revenue expected to be raised by the tax in the first year.
In a similar context, several countries have implemented fossil fuel subsidy reforms
coupled with cash transfers. In 2002, the Government of Indonesia made an ill-fated attempt to
increase petroleum product prices as street protests led the government to back off from
increasing prices. In 2005, the government successfully doubled gasoline and diesel prices and
tripled kerosene prices (eliminating much of the effective subsidy at the time). In conjunction
with the energy price reforms, the Government of Indonesia implemented a means-tested cash
transfer program. The typical monthly transfer of $10 per household for some 19 million
households likely reduced the incentive for some Indonesians to protest the price hikes
(Mourougane, 2010). In December 2010, the Government of Iran increased gasoline, diesel, and
kerosene prices by at least a factor of ten. At the same time, the government transferred about
$30 billion to approximately 80 percent of the population through specially created bank
accounts (IMF, 2011).
While these lump-sum transfers make the recycling of revenues more salient to the
public, and the policy reforms potentially more politically appealing, they also run the risk of
foregoing even greater economic benefits through the reduction of pre-existing distortionary

30
taxes. An array of model simulations show that lump-sum recycling of a carbon tax foregoes
significant economic benefits associated with reducing distortionary tax rates (Goulder et al.,
1997). The British Columbia experience is instructive in this case: a single lump-sum payment to
households opened the program, and then the government recycled revenues thereafter by cutting
personal and business income tax rates.
V. CONCLUSIONS
With pollution serving as one of the highest-ranked risk factors contributing to premature
mortality around the world, expanding the use of tax and subsidy instruments to reduce pollution
could deliver significant public health benefits. Well-designed and effectively implemented
versions of a pollution tax, carbon tax, fossil fuel subsidy reform, clean energy subsidies, and
cap-and-trade could each produce important health benefits, especially in developing countries
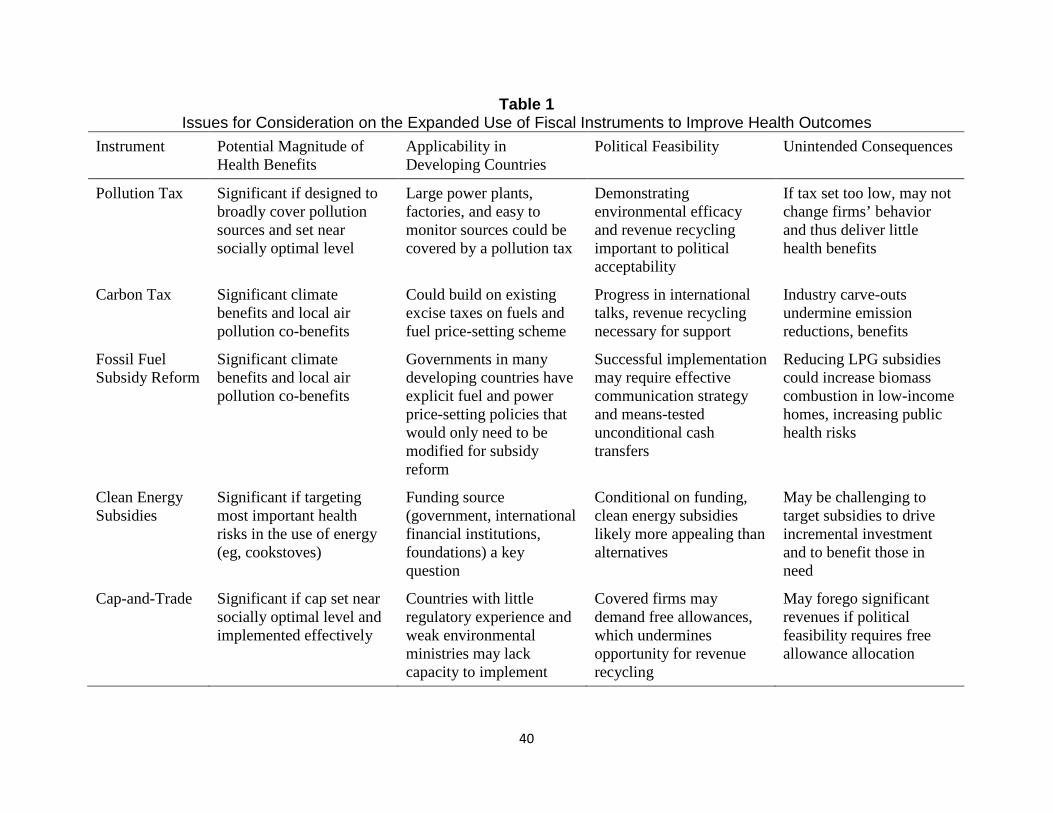
with nascent efforts to mitigate environmental health risks (Table 1).
[Table 1]
Fossil fuel subsidy reform could represent a meaningful first step in many countries that
currently price fuels and power well below what would otherwise be the prevailing market price.
In some countries, such reforms would increase fossil fuel prices much more than a carbon tax
and provide revenues that could finance means-tested cash transfers, increased health spending,
or other socially beneficial programs. Such reforms are also administratively much simpler than
designing other fiscal instruments, since it involves the modification of existing government
interventions in energy markets.

31
The technical and administrative capacity to monitor pollution would affect the
applicability of a pollution tax and cap-and-trade in many countries. Thus, initial efforts to
implement a pollution tax (or cap-and-trade) may focus on the easy-to-monitor large point
sources, such as power plants and factories. These challenges may also suggest focusing on
taxing proxies – e.g., a tax on inefficient or pollution-intensive vehicles instead of on tailpipe
emissions – that have lower administrative barriers. In contrast, it may be relatively
straightforward to administer a carbon tax in many countries given the opportunity to build the
tax onto either (a) existing energy excise tax regimes, or (b) existing government price-setting
schemes for fuels and power. Since finance ministries and tax regimes are typically stronger and
better developed, respectively, than environmental ministries and regulatory frameworks in many
developing countries, it may be challenging to implement a successful cap-and-trade program to
reduce pollution.
Each of these policy instruments has been employed in practice, indicating that the
political barriers are not insurmountable. Nonetheless, political obstacles can explain why
governments have not implemented these instruments more broadly. For the instruments that will
raise energy and product prices (pollution and carbon taxes and fossil fuel subsidy reform),
political feasibility will likely depend on efforts to demonstrate the return of revenues to the
economy through means-tested cash transfers and/or reductions in other tax rates. In addition, the
tax instruments will need to demonstrate environmental and health returns or risk facing
opposition from advocates for more conventional command-and-control regulation. Support for a
carbon tax in developing countries may also depend on progress in international negotiations,
since few countries will take on meaningful emission reduction policies without some assurance
32
that their economic peers are doing the same. Clean energy subsidies face lower political hurdles,
but require funding if they are to meaningfully scale up.
The details in the design and implementation of these instruments are important, and
poorly designed policies risk unintended consequences. A low tax would generate modest
revenues and little to no environmental and health benefits, which could weaken long-term
support for the instrument. Industry carve-outs from a pollution tax or a carbon tax could
likewise undermine its environmental objective. Given the adverse health impacts of residential
biomass combustion, a fossil fuel subsidy reform that does not address cook stoves in low-
income areas may risk increasing poor health outcomes. In particular, it may be sensible to
support broader use of LPG as a substitute for biomass and kerosene. The challenge lies in
effective targeting of subsidies so that it yields meaningful incremental investment in cleaner
energy technologies. In the context of cap-and-trade, free allowance allocations that may be
necessary to ensure its political acceptance could reduce government revenues and make it more
difficult to tighten the cap in the future in order to deliver greater environmental and health
benefits.
The promise of such instruments suggests that further research on the environmental and
health efficacy, economic and fiscal impacts, and political economy of these tax and subsidy
instruments in practice could inform policy-makers as they consider policies to address the
environmental health impacts of energy use and economic activity more broadly. Implementing
these instruments would serve as substantial complements to governments’ efforts to improve
public health.
33
ACKNOWLEDGMENTS
This research was funded by the Center for Disease Dynamics, Economics, and Policy for the Lancet Commission on Investing in Health. Helpful comments on an earlier draft were provided by Ramanan Laxminarayan and participants at the 2013 Workshop on Health and Welfare Implications of Taxation and Subsidy Policies to Alter Non-Communicable Disease Risks sponsored by the Commission in Investing in Health, the Harvard Global Health Institute, and the Disease Control Priorities Project.
34
REFERENCES Aldy, Joseph E. 2013a. A Preliminary Review of the American Recovery and Reinvestment Act’s Clean Energy Package. Review of Environmental Economics and Policy 7(1): 136-155. Aldy, Joseph E. 2013b. The Case for a U.S. Carbon Tax. Oxford Energy Forum 91: 13-16. Aldy, Joseph E., Eduardo Ley, and Ian W.H. Parry. 2008. A Tax-Based Approach to Slowing Global Climate Change. National Tax Journal 61: 493-517. Aldy, Joseph E., Alan J. Krupnick, Richard G. Newell, Ian W.H. Parry, and William A. Pizer. 2010. Designing Climate Mitigation Policy. Journal of Economic Literature 48(4). Aldy, Joseph E. and William A. Pizer. 2009. Issues in Designing U.S. Climate Policy. The Energy Journal 30(3). Aldy, Joseph E. and Robert N. Stavins. 2012a. The Promise and Problems of Pricing Carbon: Theory and Experience. Journal of Environment and Development 21(2): 152-180. Aldy, Joseph E. and Robert N. Stavins. 2012b. “Using the Market to Address Climate Change: Insights from Theory and Experience.” Daedalus 141(2): 45-60. Andersen, Mikael Skou. 2001. Economic Instruments and Clean Water: Why Institutions and Policy Design Matter. Paris, OECD. Barde, Jean-Philippe and Stephen Smith. 1997. Do Economic Instruments Help the Environment? OECD Observer 204: 22-26. Beatty, Timothy K.M., Laura Blow, and Thomas F. Crossley. Forthcoming. Is There a ‘Heat-or-Eat’ Trade-off in the UK? Journal of the Royal Statistical Society A. Bhattacharya, Jayanta, Thomas DeLeire, Steven Haider, and Janet Currie. 2003. Heat or Eat? Cold-Weather Shocks and Nutrition in Poor American Families. American Journal of Public Health 93(7): 1149-1154. Boyd, James. 2003. Water Pollution Taxes: A Good Idea Doomed to Failure? Resources for the Future Discussion Paper 03-20. Resources for the Future, Washington DC. Bressers, Hans Th.A. 1988. A Comparison of the Effectiveness of Incentives and Directives: The Case of Dutch Water Quality Policy. Policy Studies Review 7(3): 500-518. Bruce, Nigel, Eva Rehfuess, Sumi Mehta, Guy Hutton, and Kirth Smith. 2006. Indoor Air Pollution. In: Jamison, Dean T., Joel G. Breman, Anthony R. Measham, George Alleyne, Mariam Claeson, David B. Evans, Prabhat Jha, Anne Mills, and Philip Musgrove (eds.), Disease Control Priorities in Developing Countries, 793-815. Oxford University Press, New York, NY.
35
Burtraw, Dallas, David McLaughlin, and Sarah Jo Szambelan. 2012. California’s New Gold: A Primer on the Use of Allowance Value Created under the CO2 Cap-and-Trade Program. Resources for the Future Discussion Paper 12-23. Coady, David, Robert Gillingham, Rolando Ossowski, John Piotrowski, Shamsuddin Tareq, and Justin Tyson. 2010. Petroleum Product Subsidies: Costly, Inequitable, and Rising. IMF Staff Position Note SPN/10/05. International Monetary Fund, Washington, DC. Council of Economic Advisers. 2010. The Economic Impact of the American Recovery and Reinvestment Act of 2009: Second Quarterly Report. The White House, Washington, DC. Daugjberg, Cartsen and Anders Branth Pedersen. 2004. New Policy Ideas and Old Policy Networks: Implementing Green Taxation in Scandinavia. Journal of Public Policy 24(2): 219-249. Dixit, Avinash and Robert Pindyck. 1994. Investment Under Uncertainty. New York: Princeton University Press. Duff, David G. 2008. Carbon Taxation in British Columbia. Vermont Journal of Environmental Law 10: 85-105. Duflo, Esther, Michael Greenstone, and Rema Hanna. 2008. Indoor Air Pollution, Health, and Economic Well-Being. S.A.P.I.E.N.S. 1(1). Elgie, Stewart. 2012. British Columbia’s Carbon Tax Shift: The First Four Years. Sustainable Prosperity Research Report, University of Ottawa. Fattouh, Bassam and Laura El-Katiri. 2012. Energy Subsidies in the Arab World. Arab Human Development Report Research Paper Series. Internet: http://www.arab-hdr.org/publications/other/ahdrps/Energy%20Subsidies-Bassam%20Fattouh-Final.pdf, last accessed June 25, 2013. Fischer, Carolyn and Louis Preonas. 2010. Combining Policies for Renewable Energy: Is the Whole Less than the Sum of Its Parts? International Review of Environmental and Resource Economics 4(1): 51-92. Fraas, Art and Randall Lutter. Efficient Pollution Regulation: Getting the Prices Right: Comment. American Economic Review 102: 602-607. Frank, Deborah A., Nicole B. Neault, Anne Skalicky, John T. Cook, Jacqueline D. Wilson, Suzette Levenson, Alan F. Meyers, Timothy Heeren, Dianna B. Cutts, Patrick H. Casey, Maureen M. Black, and Carol Berkowitz. 2006. Heat or Eat: The Low Income Home Energy Assistance Program and Nutritional and Health Risks Among Children Less than 3 Years of Age. Pediatrics 118(5): e1203-e1302.
36
Glachant, Matthieu. 2001. The Political Economy of Water Effluent Charges in France: Why Are Rates Kept Low? CERNA Working Paper. Paris, Ecole Nationale Superieure des Mines de Paris. Goulder, Lawrence H. 1995. Environmental Taxation and the ‘Double Dividend’: A Reader’s Guide. International Tax and Public Finance 2(2). Goulder, Lawrence H., Ian W.H. Parry, and Dallas Burtraw. 1997. Revenue-Raising Versus Other Approaches to Environmental Protection: The Critical Significance of Preexisting Tax Distortions. The RAND Journal of Economics 28(4): 708-731. Goulder, Lawrence H. and Ian W.H. Parry. 2008. Instrument Choice in Environmental Policy. Review of Environmental Economics and Policy 2(2): 152-174. Goulder, Lawrence H. and Robert N. Stavins. 2011. Challenges from State-Federal Interactions in U.S. Climate Change Policy. American Economic Review Papers and Proceedings 101(3): 253-257. Government of Denmark. 2009. Denmark’s Fifth National Communication on Climate Change. Ministry of Climate and Energy, Copenhagen. Government of Norway. 2009. Norway’s Fifth National Communication under the Framework Convention on Climate Change. Norwegian Ministry of the Environment, Oslo. Hahn, Robert W. and Robert N. Stavins. 2011. The Effect of Allowance Allocations on Cap-and-Trade System Performance. The Journal of Law and Economics 54(4): S267-S294. Hanna, Rema, Esther Duflo, and Michael Greenstone. 2012. Up in Smoke: The Influence of Household Behavior on the Long-Run Impact of Improved Cooking Stoves. NBER Working Paper 18033. National Bureau of Economic Research, Cambridge, MA. International Energy Agency. 2012. World Energy Outlook 2012. Paris: IEA. International Monetary Fund. 2010. Staff Report for the Article IV Consultation: Arab Republic of Egypt. Washington: IMF, March 9. International Monetary Fund. 2011. Staff Report for the Article IV Consultation: Islamic Republic of Iran. Washington: IMF, August. Jorgenson, Dale W. 2012. Comprehensive Tax Reform and U.S. Energy Policy. Testimony before the U.S. Senate Committee on Finance, Hearing on Tax Reform: The Impact on U.S. Energy Policy, June 12. Keohane, Nathaniel, Richard Revesz, and Robert Stavins. 1998. The Choice of Regulatory Instruments in Environmental Policy. Harvard Environmental Law Review 22(2): 313-367.
37
Knittel, Christopher R. and Ryan Sandler. 2013. The Welfare Impact of Indirect Pigouvian Taxation: Evidence from Transportation. NBER Working Paper 18849. National Bureau of Economic Research, Cambridge, MA. Levinson, Arik. 2010. Interactions Among Climate Policy Regulations. NBER Working Paper 16109. National Bureau of Economic Research, Cambridge, MA. Lim, Stephen S. et al. 2012. A Comparative Risk Assessment of Burden of Disease and Injury Attributable to 67 Risk Factors Clusters in 21 Regions, 1990-2010: A Systematic Analysis for the Global Burden of Disease Study 2010. Lancet 380: 2224-2260. Lutter, Randall and Richard B. Belzer. 2000. EPA Pats Itself on the Back. Regulation 23(3): 23-28. Marcantonini, Claudio and A. Denny Ellerman. 2013. The Cost of Abating CO2 Emissions by Renewable Energy Incentives in Germany. EUI Working Paper RSCAS 2013/05. European University Institute, Florence, Italy. Matus, Kira, Kyung-Min Nam, Noelle E. Selin, Lok N. Lamsal, John M. Reilly, and Sergey Paltsev. 2012. Health Damages from Air Pollution in China. Global Environmental Change 22: 53-66. McGuinness, Meghan and A. Denny Ellerman. 2008. The Effects of Interactions between Federal and State Climate Policies. Massachusetts Institute of Technology Center for Energy and Environmental Policy Research Working Paper WP-2008-004. Metcalf, Gilbert E. 2007. A Proposal for a U.S. Carbon Tax Swap. The Hamilton Project Discussion Paper 2007-12. The Brookings Institution, Washington DC. Metcalf, Gilbert E. 2009. Tax Policies for Low-Carbon Technologies. National Tax Journal 62(3): 519-533. Montgomery, David W. 1972. Markets in Licenses and Efficient Pollution Control Programs. Journal of Economic Theory 5(3): 395-418. Mourougane, Annabelle. 2010. Phasing Out Energy Subsidies in Indonesia. Economics Department Working Paper no. 808. OECD, Paris. Muller, Nicholas Z. and Robert Mendelsohn. 2009. Efficient Pollution Regulation: Getting the Prices Right. American Economic Review 99(5): 1714-1739. Newell, Richard G., Adam B. Jaffe, and Robert N. Stavins. 1999. The Induced Innovation Hypothesis and Energy-Saving Technological Change. Quarterly Journal of Economics 114(3): 941-975.

38
Organization for Economic Cooperation and Development. 2010. Interactions Between Emission Trading Systems and Other Overlapping Policy Instruments. Paris: Environment Directorate, OECD. OECD. 2011. Pro-Active Policies for Green Growth and the Market Economy. Directorate for Financial and Enterprise Affairs, Competition Committee. June 21. Paris: OECD. OECD, IEA, OPEC, World Bank. 2010. Analysis of the Scope of Energy Subsidies and Suggestions for the G-20 Initiative. Joint report prepared for the G-20. Olmstead, Sheila M., W. Michael Hanemann, and Robert N. Stavins. 2007. Water Demand under Alternative Price Structures. Journal of Environmental Economics and Management 54: 181-198. Parry, Ian W H and Kenneth A. Small. 2005. Does Britain or the United States Have the Right Gasoline Tax? American Economic Review 95(4): 1276-1289. Popp, David. 2002. Induced Innovation and Energy Prices. American Economic Review 92(1): 160-180. Ramey, Valerie A. and Daniel J. Vine. 2010. Oil, Automobiles, and the U.S. Economy: How Much Have Things Really Changed? NBER Working Paper 16067. National Bureau of Economic Research, Cambridge, MA. Robins, Nick, Robert Clover, and Charanjit Singh. 2009. A Climate For Recovery: The Colour of Stimulus Goes Green. HSBC Global Research, February 25. Internet: http://www.euractiv.de/fileadmin/images/HSBC_Green_New_Deal.pdf, last accessed June 25, 2013. Schmalensee, Richard and Robert N. Stavins. 2013. The SO2 Allowance Trading System: The Ironic History of a Grand Policy Experiment. Journal of Economic Perspectives 27(1): 103-122. Shenoy, Bhamy V. 2010. Lessons Learned from Attempts to Reform India’s Kerosene Subsidy. Winnipeg, Canada: International Institute for Sustainable Development. Speck, Stefan. 2008. The Design of Carbon and Broad-Based Energy Taxes in European Countries. Vermont Journal of Environmental Law 10: 31-59. Stavins, Robert N. 2007. A U.S. Cap-and-Trade System to Address Global Climate Change. The Hamilton Project Discussion Paper 2007-13. The Brookings Institution, Washington, DC. U.S. Energy Information Administration. 2011. Short-Term Energy Outlook: June 2011. Department of Energy, Washington, DC. U.S. Energy Information Administration. 2009. Emissions of Greenhouse Gases in the United States. Department of Energy, Washington, D.C.
39
United States Environmental Protection Agency. 2011. The Benefits and Costs of the Clean Air Act from 1990 to 2020. Washington, DC: Office of Air and Radiation, USEPA. United States Environmental Protection Agency. 1997. The Benefits and Costs of the Clean Air Act from 1970 to 1990. Washington, DC: Office of Air and Radiation, USEPA. Venkataramani, Atheendar S. and Brian J. Fried. 2011. Effect of Worldwide Oil Price Fluctuations on Biomass Fuel Use and Child Respiratory Health: Evidence from Guatemala. American Journal of Public Health 101(9): 1668-1675. Weitzman, Martin L. 1974. Prices vs. Quantities. Review of Economic Studies 41(4): 477-491.
40
Table 1 Issues for Consideration on the Expanded Use of Fiscal Instruments to Improve Health Outcomes
Instrument Potential Magnitude of Health Benefits
Applicability in Developing Countries
Political Feasibility Unintended Consequences
Pollution Tax Significant if designed to broadly cover pollution sources and set near socially optimal level
Large power plants, factories, and easy to monitor sources could be covered by a pollution tax
Demonstrating environmental efficacy and revenue recycling important to political acceptability
If tax set too low, may not change firms’ behavior and thus deliver little health benefits
Carbon Tax Significant climate benefits and local air pollution co-benefits
Could build on existing excise taxes on fuels and fuel price-setting scheme
Progress in international talks, revenue recycling necessary for support
Industry carve-outs undermine emission reductions, benefits
Fossil Fuel Subsidy Reform
Significant climate benefits and local air pollution co-benefits
Governments in many developing countries have explicit fuel and power price-setting policies that would only need to be modified for subsidy reform
Successful implementation may require effective communication strategy and means-tested unconditional cash transfers
Reducing LPG subsidies could increase biomass combustion in low-income homes, increasing public health risks
Clean Energy Subsidies
Significant if targeting most important health risks in the use of energy (eg, cookstoves)
Funding source (government, international financial institutions, foundations) a key question
Conditional on funding, clean energy subsidies likely more appealing than alternatives
May be challenging to target subsidies to drive incremental investment and to benefit those in need
Cap-and-Trade Significant if cap set near socially optimal level and implemented effectively
Countries with little regulatory experience and weak environmental ministries may lack capacity to implement
Covered firms may demand free allowances, which undermines opportunity for revenue recycling
May forego significant revenues if political feasibility requires free allowance allocation