Embed Size (px)
Citation preview
Designing, Deploying and Using an Organizational Performance
Management System in Public Health: Cultural Transformation Using the PDCA
Approach
John W. Moran, Public Health Foundation Paul D. Epstein, Public Health Foundation
Leslie M. Beitsch, Public Health Foundation
2013
1
Designing, Deploying, and Using an Organizational Performance Management
System in Public Health: Cultural Transformation Using the PDCA Approach
John W. Moran, Paul D. Epstein, and Leslie M. Beitsch 1
Organizations have long struggled with developing a performance management (PM)
system to help understand and guide operations on a timely basis. While many local
governments now use some form of performance measurement, far fewer have successfully
completed the transition to a performance management system — integrating performance
measurement into the ongoing management of the organization. This transition is much more
difficult than the initial development of performance measures.2
One of the hallmarks of leading-edge organizations—be they public or private—has been
the successful application of performance measurement to gain insight into, and make judgments
about, the organization and the effectiveness and efficiency of its programs, processes, and
people. However, leading organizations do not stop at the gathering and analysis of performance
data; rather, these organizations use performance measurement to drive improvements and
successfully translate strategy into action. In other words, they use performance measurement for
managing their organizations.3
A good PM system is the central nervous system of the organization since it is providing
operational intelligence on a real time basis, indicating performance relative to goals,
effectiveness and efficiency of programs and services, performance of processes, and customer
1 John W. Moran, MBA, Ph.D., CMC, CQIA, CMQ/OE, is a Senior Quality Advisor to the Public Health
Foundation and a Senior Fellow at the University of Minnesota, School of Public Health in the Division of Health
Policy and Management. Vice-President of the Advisory Board of Choose To Be Healthy Coalition for York
County, Maine, 2011 – present, and a faculty member of the CDC/IHI Antibiotic Stewardship project 2011-2012. A
member of the PHAB QI and Evaluation Committee -2013 – present. Paul D. Epstein is Principal of the Results
That Matter Team of Epstein & Fass Associates, A New York-based consulting firm. He is on the performance
management & QI consulting teams of the Public Health Foundation and the Association of State and Territorial
Health Officers, and he has been a national QI and Evaluation coach for the National Association of County & City
Health Officials. Leslie M. Beitsch, MD, JD is on the faculty at the Florida State University College of Medicine as
Professor of Health Policy and Director of the Center for Medicine and Public Health. Before joining FSU, Dr.
Beitsch was the Commissioner of the Oklahoma State Department of Health and worked for the Florida Department
of Health at the state and local level for a dozen years. 2 http://www.gfoaconsulting.org/downloads/GFR-Aug06-FiveCriticalFactors.pdf, accessed 11/16/12
3 http://energy.gov/sites/prod/files/maprod/documents/BalancedScorecardPerfAndMeth.pdf, accessed
11/16/12
2
satisfaction levels. Ultimately, the PM system should provide the knowledge leadership requires
to manage the overall enterprise, and to aide in prioritizing which areas need improvements.
Choose or Adapt a PM System Model to Fit the Public Health Organization
A variety of performance management models have been used in the public and private
sectors. The necessary characteristic that makes any PM model a PM “system” (sometimes
called a “managing for results process”) is that it can be articulated as a cycle in which measured
results are regularly fed back into decision making to continually improve future performance.4
For illustration, this paper uses three PM system models that have been used successfully in the
public sector:
1. The “Plan-Do-Check-Act” (PDCA) model5 adapted from Quality Improvement by
some entire local governments (e.g., City of Austin, TX; King County, WA)
2. The balanced scorecard strategic management approach6, which was adapted from the
private sector for many public sector applications, including “Community Balanced
Scorecards” used by health departments and community health partnerships
3. The “Stat” model7 of high frequency review of operating data to make rapid
performance improvements
An interesting feature of these three PM system models is that they are not mutually
exclusive. For example, a Stat system of high-frequency operational improvement can be used
on a PDCA basis, and included within a larger PDCA system with lower-frequency cycles (e.g.,
annual performance plans and budgets with quarterly performance reviews). Similarly, some or
all of the measurement models within the larger PDCA cycle could be based on balanced
scorecard strategies.
Whether a health department draws on any or all of the three system models used in this
paper, or on other approaches to performance management8 will depend on the specific needs of
4 Epstein, Paul D., Paul M. Coates, Lyle D. Wray, & David Swain (2006). Results That Matter. (San Francisco:
Jossey-Bass/Wiley), pp. 51-71. 5 Moran, John, & Duffy, Grace (2012). The Quality Improvement Tools Encyclopedia and Glossary, Public Health
Foundation, 6 Kaplan, Robert S. & David P. Norton (1996). The Balanced Scorecard: Translating Strategy in Action. (Boston:
Harvard Business School Press) and Kaplan, Robert S. and David P. Norton (2001). The Strategy-Focused
Organization. (Boston: Harvard Business School Press) 7 Ammons, David, editor (2008). Leading Performance Management in Local Government. (Washington, DC:
ICMA Press), “Section III: The ‘Stat’ Approach: Compstat, CitiStat, and Others” pp. 141-193. 8 For example, see Ammons, David N. ed. (2006). Leading Performance Management in Local Government.
(Washington, DC: ICMA Press).

3
the department. The design of a PM system should be reflective of the organization itself.
Aspects for careful consideration include: an organization’s current and desired future culture,
preferred leadership style, current capacities, work force capability, budget limitations, and other
resource constraints. Every health department will emphasize different organizational variables
in designing its optimal PM. Although there are tried and proven models, one size does not fit all
in designing a PM system. Nonetheless, each version shares the same common purpose of
providing operational intelligence on a timely basis to help make informed decisions at all levels
of the organization. Those informed decisions should facilitate efficient and effective delivery of
the products and services public health customers seek and make the health department and its
partners more effective in their efforts to improve population health
The Turning Point Model9, shown in Figure 1, was originally developed specifically for
public health and is a good conceptual model describing essential elements of a PM system.
Figure 1: Turning Point Model
9 Public Health Foundation
(“http://www.phf.org/focusareas/performancemanagement/Pages/Performance_Management.aspx")
4
However, the Turning Point Model offers limited guidance about what makes these elements a
usable “system” or about “how” to develop an organization-wide PM system. Questions this
model leaves unanswered include the following:
How do we select standards?
How do we measure against standards?
How do we report data for the measures compared with targets?
What process do we use to prioritize which areas need improvement?
How do we make this a “system” to manage our organization effectively and not
just give us more things to do?
This paper addresses these questions first by looking at how a PM system operates that is
based on the PDCA model, and then by examining how to achieve a responsive and continually
improving PM system by using the PDCA cycle for system development.
A PDCA-BASED PERFORMANCE MANAGEMENT SYSTEM
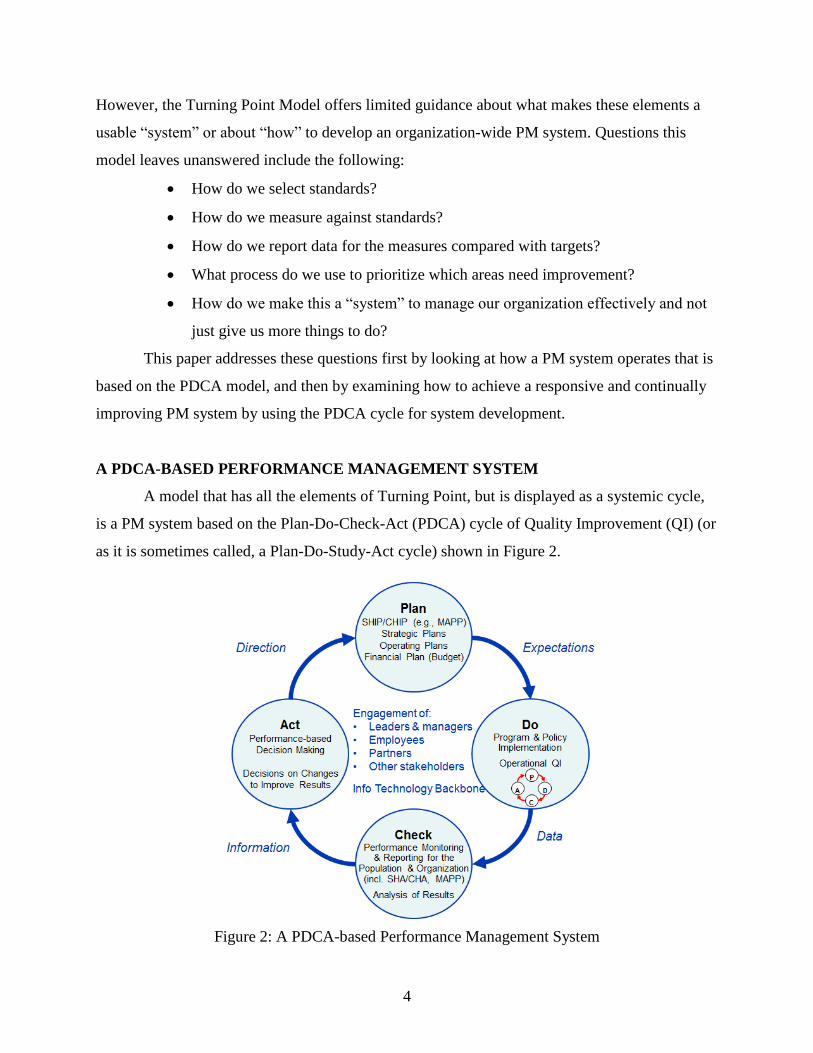
A model that has all the elements of Turning Point, but is displayed as a systemic cycle,
is a PM system based on the Plan-Do-Check-Act (PDCA) cycle of Quality Improvement (QI) (or
as it is sometimes called, a Plan-Do-Study-Act cycle) shown in Figure 2.
Figure 2: A PDCA-based Performance Management System
5
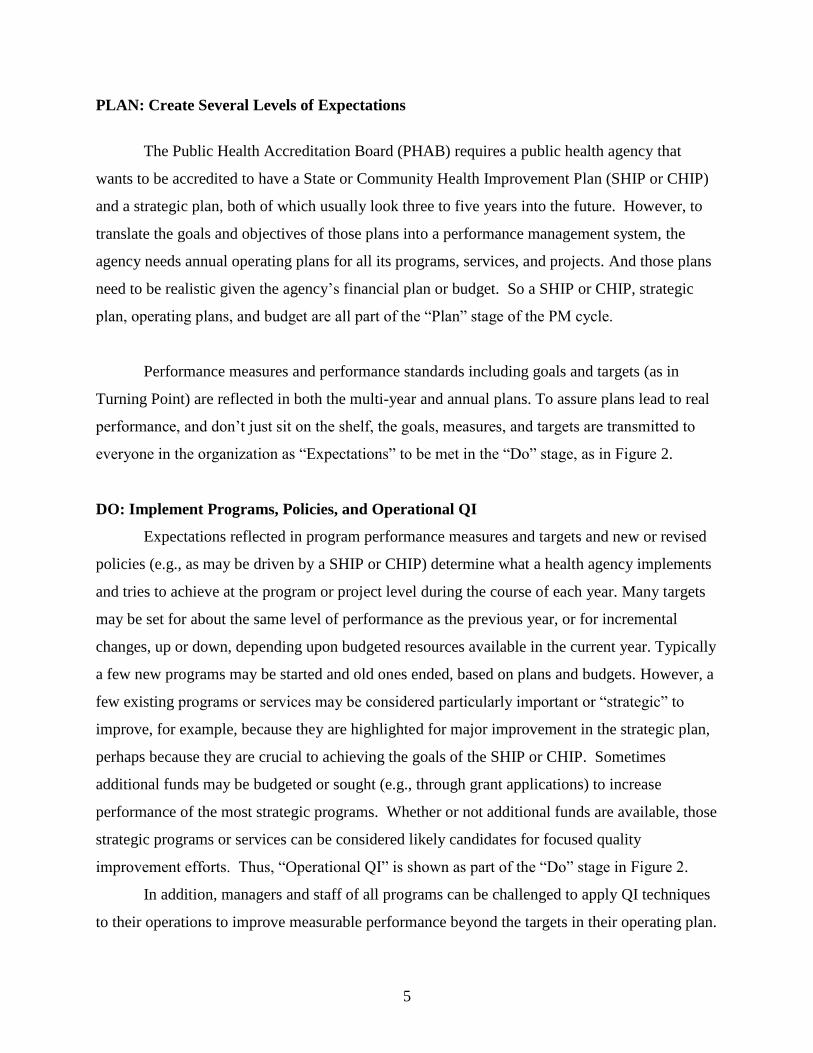
PLAN: Create Several Levels of Expectations
The Public Health Accreditation Board (PHAB) requires a public health agency that
wants to be accredited to have a State or Community Health Improvement Plan (SHIP or CHIP)
and a strategic plan, both of which usually look three to five years into the future. However, to
translate the goals and objectives of those plans into a performance management system, the
agency needs annual operating plans for all its programs, services, and projects. And those plans
need to be realistic given the agency’s financial plan or budget. So a SHIP or CHIP, strategic
plan, operating plans, and budget are all part of the “Plan” stage of the PM cycle.
Performance measures and performance standards including goals and targets (as in
Turning Point) are reflected in both the multi-year and annual plans. To assure plans lead to real
performance, and don’t just sit on the shelf, the goals, measures, and targets are transmitted to
everyone in the organization as “Expectations” to be met in the “Do” stage, as in Figure 2.
DO: Implement Programs, Policies, and Operational QI
Expectations reflected in program performance measures and targets and new or revised
policies (e.g., as may be driven by a SHIP or CHIP) determine what a health agency implements
and tries to achieve at the program or project level during the course of each year. Many targets
may be set for about the same level of performance as the previous year, or for incremental
changes, up or down, depending upon budgeted resources available in the current year. Typically
a few new programs may be started and old ones ended, based on plans and budgets. However, a
few existing programs or services may be considered particularly important or “strategic” to
improve, for example, because they are highlighted for major improvement in the strategic plan,
perhaps because they are crucial to achieving the goals of the SHIP or CHIP. Sometimes
additional funds may be budgeted or sought (e.g., through grant applications) to increase
performance of the most strategic programs. Whether or not additional funds are available, those
strategic programs or services can be considered likely candidates for focused quality
improvement efforts. Thus, “Operational QI” is shown as part of the “Do” stage in Figure 2.
In addition, managers and staff of all programs can be challenged to apply QI techniques
to their operations to improve measurable performance beyond the targets in their operating plan.
6
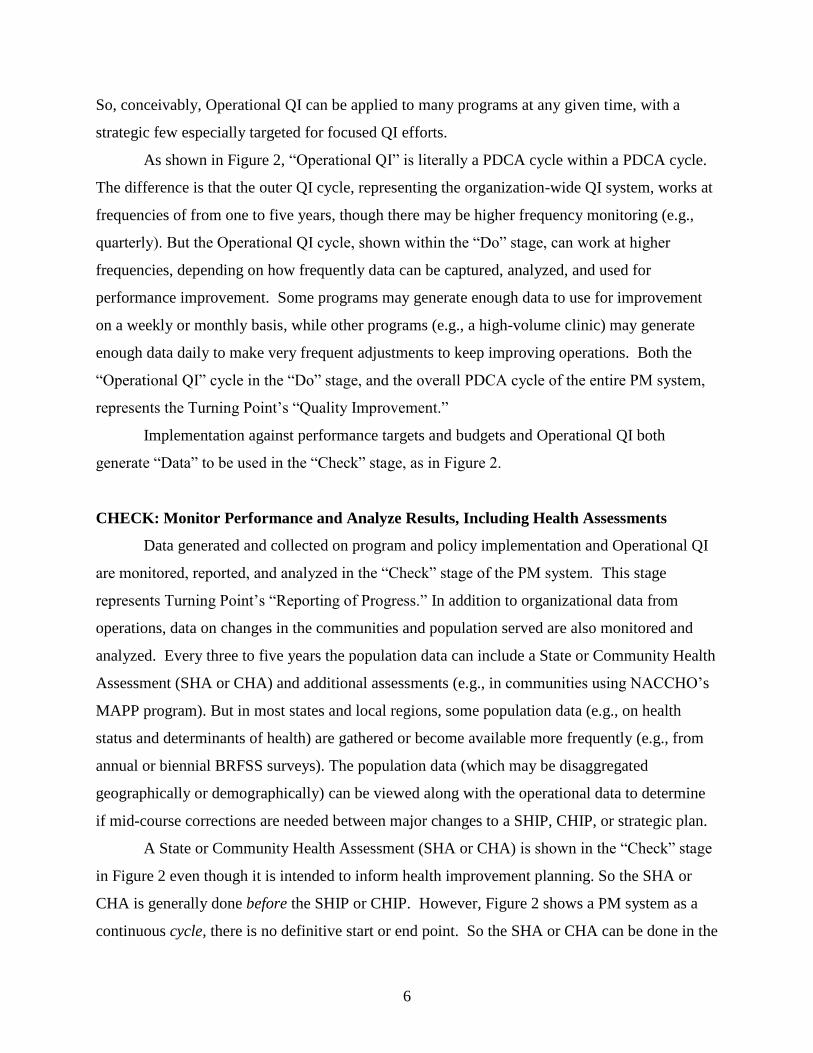
So, conceivably, Operational QI can be applied to many programs at any given time, with a
strategic few especially targeted for focused QI efforts.
As shown in Figure 2, “Operational QI” is literally a PDCA cycle within a PDCA cycle.
The difference is that the outer QI cycle, representing the organization-wide QI system, works at
frequencies of from one to five years, though there may be higher frequency monitoring (e.g.,
quarterly). But the Operational QI cycle, shown within the “Do” stage, can work at higher
frequencies, depending on how frequently data can be captured, analyzed, and used for
performance improvement. Some programs may generate enough data to use for improvement
on a weekly or monthly basis, while other programs (e.g., a high-volume clinic) may generate
enough data daily to make very frequent adjustments to keep improving operations. Both the
“Operational QI” cycle in the “Do” stage, and the overall PDCA cycle of the entire PM system,
represents the Turning Point’s “Quality Improvement.”
Implementation against performance targets and budgets and Operational QI both
generate “Data” to be used in the “Check” stage, as in Figure 2.
CHECK: Monitor Performance and Analyze Results, Including Health Assessments
Data generated and collected on program and policy implementation and Operational QI
are monitored, reported, and analyzed in the “Check” stage of the PM system. This stage
represents Turning Point’s “Reporting of Progress.” In addition to organizational data from
operations, data on changes in the communities and population served are also monitored and
analyzed. Every three to five years the population data can include a State or Community Health
Assessment (SHA or CHA) and additional assessments (e.g., in communities using NACCHO’s
MAPP program). But in most states and local regions, some population data (e.g., on health
status and determinants of health) are gathered or become available more frequently (e.g., from
annual or biennial BRFSS surveys). The population data (which may be disaggregated
geographically or demographically) can be viewed along with the operational data to determine
if mid-course corrections are needed between major changes to a SHIP, CHIP, or strategic plan.
A State or Community Health Assessment (SHA or CHA) is shown in the “Check” stage
in Figure 2 even though it is intended to inform health improvement planning. So the SHA or
CHA is generally done before the SHIP or CHIP. However, Figure 2 shows a PM system as a
continuous cycle, there is no definitive start or end point. So the SHA or CHA can be done in the
7
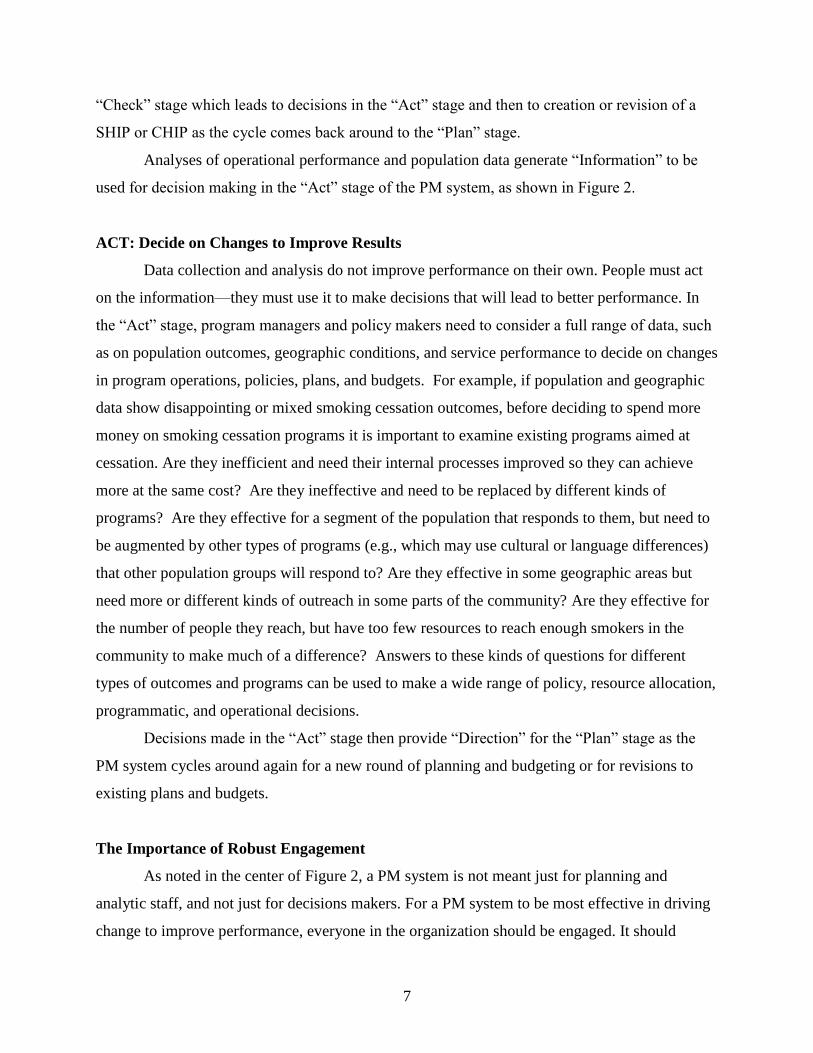
“Check” stage which leads to decisions in the “Act” stage and then to creation or revision of a
SHIP or CHIP as the cycle comes back around to the “Plan” stage.
Analyses of operational performance and population data generate “Information” to be
used for decision making in the “Act” stage of the PM system, as shown in Figure 2.
ACT: Decide on Changes to Improve Results
Data collection and analysis do not improve performance on their own. People must act
on the information—they must use it to make decisions that will lead to better performance. In
the “Act” stage, program managers and policy makers need to consider a full range of data, such
as on population outcomes, geographic conditions, and service performance to decide on changes
in program operations, policies, plans, and budgets. For example, if population and geographic
data show disappointing or mixed smoking cessation outcomes, before deciding to spend more
money on smoking cessation programs it is important to examine existing programs aimed at
cessation. Are they inefficient and need their internal processes improved so they can achieve
more at the same cost? Are they ineffective and need to be replaced by different kinds of
programs? Are they effective for a segment of the population that responds to them, but need to
be augmented by other types of programs (e.g., which may use cultural or language differences)
that other population groups will respond to? Are they effective in some geographic areas but
need more or different kinds of outreach in some parts of the community? Are they effective for
the number of people they reach, but have too few resources to reach enough smokers in the
community to make much of a difference? Answers to these kinds of questions for different
types of outcomes and programs can be used to make a wide range of policy, resource allocation,
programmatic, and operational decisions.
Decisions made in the “Act” stage then provide “Direction” for the “Plan” stage as the
PM system cycles around again for a new round of planning and budgeting or for revisions to
existing plans and budgets.
The Importance of Robust Engagement
As noted in the center of Figure 2, a PM system is not meant just for planning and
analytic staff, and not just for decisions makers. For a PM system to be most effective in driving
change to improve performance, everyone in the organization should be engaged. It should
8
become an integral part of the way everyone does their jobs and not just another thing they have
to do. To the extent possible, their engagement should be as users of the system, so it’s important
that everyone in the organization understands how they can use the information in the system to
do their jobs better, improve program performance, and ultimately be more effective in
improving population health. Because improving population health requires efforts by people
and organizations besides the public health agency, it is also important to engage the agency’s
partners and other external stakeholders who may be providers or users of data to improve public
health.
Inevitably, some people’s role will be more as generators, collectors, or reporters of data,
and less as decision makers. If they do not know the importance of the data they provide for
improving program performance and population health, they may not take the care needed to
provide reliable data. We have seen this phenomenon with some existing public health PM
systems. So be sure to engage them to make sure they know why they’re collecting the data
they’ve been asked for, and how that data will be used. Even better, where possible, from time to
time ask for their interpretations of changes in the data, which may both provide useful insights
to decision makers and help staff understand that their data collection efforts are valued. This is
just as important for external data providers as it is for internal staff. Both sets of users are also
customers, and their views are critical to success of the entire PM enterprise.
Technology Backbone
The middle of Figure 2 also refers to a “Technology Backbone,” which acknowledges the
need for an appropriate information technology (IT) system to keep the PM system running
smoothly without inordinate staff effort. Some public health agencies may be part of a
government that already has its own jurisdiction-wide performance management IT system, and
can use that for its technology backbone. But sometimes a jurisdiction-wide system does not
provide all the functionality the agency needs for its own performance management. For
example, it may not be updated frequently enough for all the operational QI the agency wants to
apply to its day-to-day program operations. In those cases the public health agency may need to
augment the jurisdiction-wide system with some of its own internal IT support. Whether
augmenting jurisdiction-wide systems or developing systems of their own, public health agencies
do not have to start from scratch, but can procure and adapt existing systems, which now include
9
low- and moderately-priced systems that range from simple spreadsheet templates designed for
internal reporting to web-based performance management and strategy management systems.
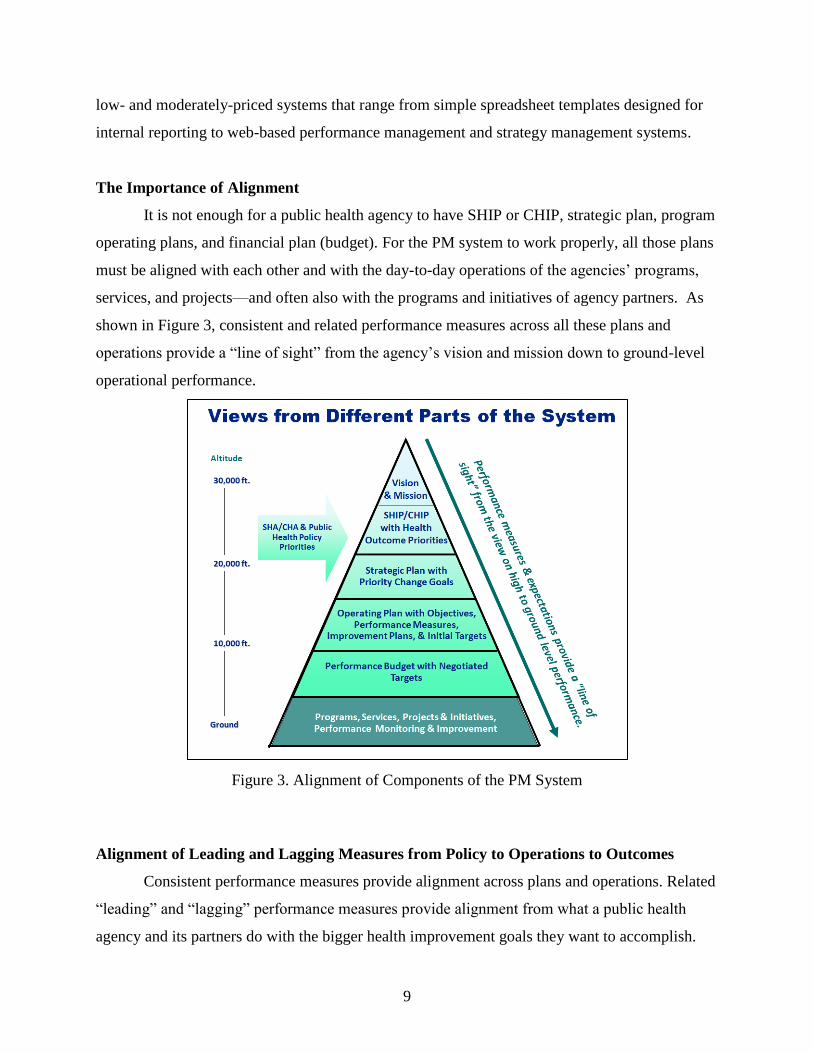
The Importance of Alignment
It is not enough for a public health agency to have SHIP or CHIP, strategic plan, program
operating plans, and financial plan (budget). For the PM system to work properly, all those plans
must be aligned with each other and with the day-to-day operations of the agencies’ programs,
services, and projects—and often also with the programs and initiatives of agency partners. As
shown in Figure 3, consistent and related performance measures across all these plans and
operations provide a “line of sight” from the agency’s vision and mission down to ground-level
operational performance.
Figure 3. Alignment of Components of the PM System
Alignment of Leading and Lagging Measures from Policy to Operations to Outcomes
Consistent performance measures provide alignment across plans and operations. Related
“leading” and “lagging” performance measures provide alignment from what a public health
agency and its partners do with the bigger health improvement goals they want to accomplish.
10
For example, to reduce obesity, a public health agency may determine that it needs to develop
and advocate for policies that increase active living and healthy eating. The agency may be able
to at least partly implement some of these policies on its own, such as by integrating exercise or
nutrition improvement efforts into its maternal and child health programs. In other cases, the
agency will need to advocate for others, such as a city planning commission, a parks and
recreation department, a YMCA, schools, and private employers to adopt and implement these
policies. Measures of policy development, outreach, and advocacy efforts10
are “leading
indicators” of eventual adoption and implementation of these policies as part of organizations’
operational practices. Then, practice changes by partners and measures of health agency
program operations are leading indicators of outcomes of increased active living and healthy
eating and reduced obesity. Those outcomes are “lagging indicators” of policy and operational
progress. An effective PM system will include alignment of these leading and lagging measures,
and not have a disconnect between what agencies and their partners do and the outcomes they
want to improve. Balanced scorecards, especially “Community Balanced Scorecard” tools being
used in public health, described next, are particularly strong in this regard, by helping users map
out strategies for public health issues or programs, then aligning their measurement system with
those strategies from “performance drivers” (leading indicators) of assets, policies, and
operations to “outcomes” organizations and community partnerships want to accomplish.
Community Balanced Scorecards for Strategy and Measurement Alignment
To achieve alignment needed for effective performance management at all levels of an
organization, performance measures should be aligned with the organization’s strategy. The
“Balanced Scorecard” (BSC) started in the early 1990s as a corporate performance measurement
framework and evolved in just a few years to a strategy management system in which an
organization’s high-level strategy drives how performance is measured and managed, to achieve
strategic alignment of what people do with how the organization is trying to achieve its goals.11
10
For ways to measure policy development, outreach, and advocacy, see “Performance Measurement for Public
Health Policy.” American Public Health Association and Public Health Foundation. Aug. 1, 2012. 11
For example, see Kaplan, Robert S. and David P. Norton (1996). The Balanced Scorecard: Translating Strategy
in Action. (Boston: Harvard Business School Press) and Kaplan, Robert S. and David P. Norton (2001). The
Strategy-Focused Organization. (Boston: Harvard Business School Press)
11
Balanced scorecard tools, such as strategy maps, are particularly well suited to graphically depict
strategy in a way that facilitates developing strategy-aligned measures.12
In public health, which is a population and community-focused endeavor rather than a
profit and customer-focused endeavor, a “Community Balanced Scorecard” (CBSC) approach
has been evolving to achieve strategic alignment of multiple organizations in the state or
community public health system, rather than just alignment of a single organization, and using
the ten essential services of public health as a guide to mapping and measuring strategy. Since
the first publication of this approach for public health in 200913
CBSC tools have been used by
community health partnerships from New Hampshire to Florida and from New Jersey to Illinois
for priority health issues. The State of Delaware Division of Public Health has been using CBSC
for its strategic planning and at least one county (St. Johns County, FL) has used it in its
published CHIP.14
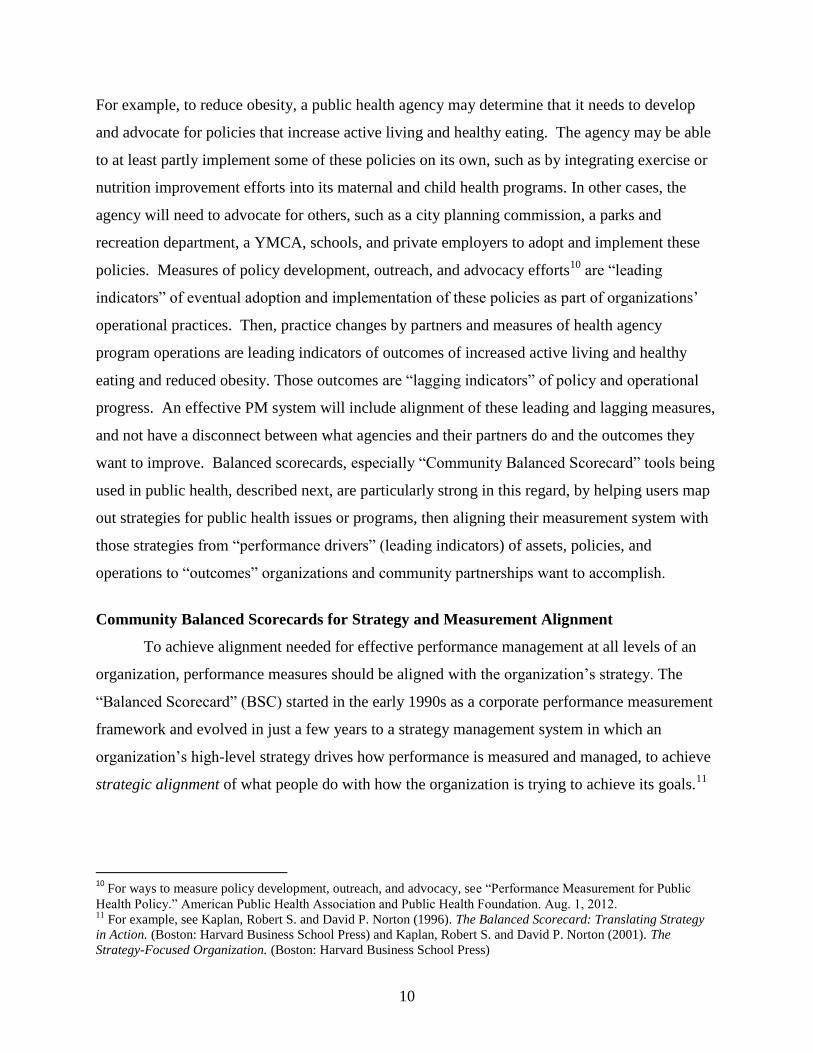
To help create alignment across all strategies, including strategies for specific
programs and cross-cutting strategies involving multiple programs and organizations to address
priority health issues (e.g., obesity reduction, access to care), a “top level strategy map” can be
used based on the twelve domains of the Public Health Accreditation Board, shown in Figure 4.
12
Kaplan, Robert S. &Norton, David P. (2004). Strategy Maps. (Boston: Harvard Business School Press) 13
Epstein, Paul D., Simone, Alina, & Wray, Lyle D. (2009). “Community Balanced Scorecards for Strategic Public
Health Improvement” in Bialek, Ron, Grace L. Duffy, and John W. Moran, eds. The Public Health Quality
Improvement Handbook. (Milwaukee: ASQ Quality Press), pp. 251-270. 14
St. Johns County Health Leadership Council (Aug. 2011). St. Johns County – 2011: Community Health
Assessment and Community Health Improvement Plan. (St. Augustine, FL: St. Johns County Health Department).
12
Figure 4. Top Level CBSC Strategy Map Based on the 12 PHAB Domains
Note in Figure 4 that the PHAB domains are not shown in numerical order, but are on the bottom
three “perspectives” (rows in Figure 4) based on bottom-up performance driver relationships
concerning how they relate to each other, and how, collectively, they drive performance of the
top two strategic goals: “H1. Improve Health Outcomes & Eliminate Disparities” and “H2.
Improve the Environment for Health & Reduce Health Risks.”
More specific strategy maps for public health programs relate back to the top level map,
but the strategic goals and objectives (the bubbles) are worded to be specific to that program, and
only the PHAB domains relevant to that program are included. For example, a strategy map for
an Environmental Health Enforcement and Investigation Program might look like Figure 5, with
arrows showing specific performance driver relationships between strategic objectives leading to
the strategic outcome goals on top. The numbers in the bubbles relate back to the same numbered
goals and objectives in the top level map. When strategy maps are developed for other programs
and for cross-cutting strategies involving multiple programs or partners, their alignment with the
top level map visually shows how all public health agency strategies are aligned.
13
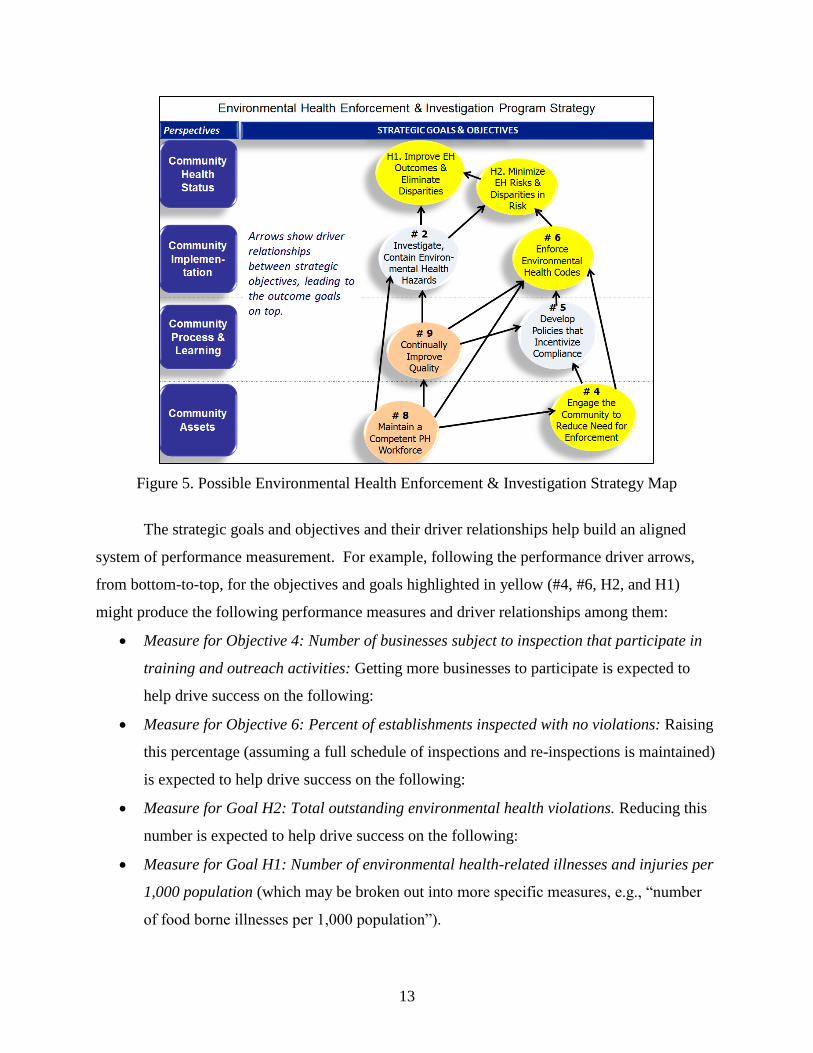
Figure 5. Possible Environmental Health Enforcement & Investigation Strategy Map
The strategic goals and objectives and their driver relationships help build an aligned
system of performance measurement. For example, following the performance driver arrows,
from bottom-to-top, for the objectives and goals highlighted in yellow (#4, #6, H2, and H1)
might produce the following performance measures and driver relationships among them:
Measure for Objective 4: Number of businesses subject to inspection that participate in
training and outreach activities: Getting more businesses to participate is expected to
help drive success on the following:
Measure for Objective 6: Percent of establishments inspected with no violations: Raising
this percentage (assuming a full schedule of inspections and re-inspections is maintained)
is expected to help drive success on the following:
Measure for Goal H2: Total outstanding environmental health violations. Reducing this
number is expected to help drive success on the following:
Measure for Goal H1: Number of environmental health-related illnesses and injuries per
1,000 population (which may be broken out into more specific measures, e.g., “number
of food borne illnesses per 1,000 population”).
14
Note in Figure 5 that two of the strategic objectives (#9 on Quality Improvement and #8
on a Competent Workforce) are not specific to environmental health. They represent strategic
objectives that a public health agency may mandate for all of its programs and services. Strategic
Objective 9 in particular would represent the Environmental Health Program’s responsibility for
“Operational QI” in the “Do” stage of the Public Health Agency’s overall PDCA performance
management System, shown in Figure 2. As environmental health is usually addressed on a
geographic basis, it may be a good candidate for using a “Stat System” for QI, described next.
The Potential for a “Stat System” as Part of Operational QI
As described above, the “Operational QI” cycle in the “Do” stage of a PDCA-based QI
system represents high-frequency collection and analysis of data to improve performance. In
that sense the “Stat” systems being used in Police Departments across the country (as started in
New York City with “Compstat” in the 1990s15
), and by some state and local governments for a
wide range of services (as started in Baltimore with “CitiStat” in 200016
) are high-frequency
operational QI systems. Stat systems not only use operational information, they use high-
frequency geographic data on outcomes or conditions being addressed by programs, displayed on
maps for review and action (e.g., maps of crimes, street defects, or environmental problems).17
As most health agencies are concerned with where outbreaks occur, where there are
environmental health issues, where underserved populations live, and other place-based data, a
Stat-like geo-based high-frequency system can be a valuable component of a public health
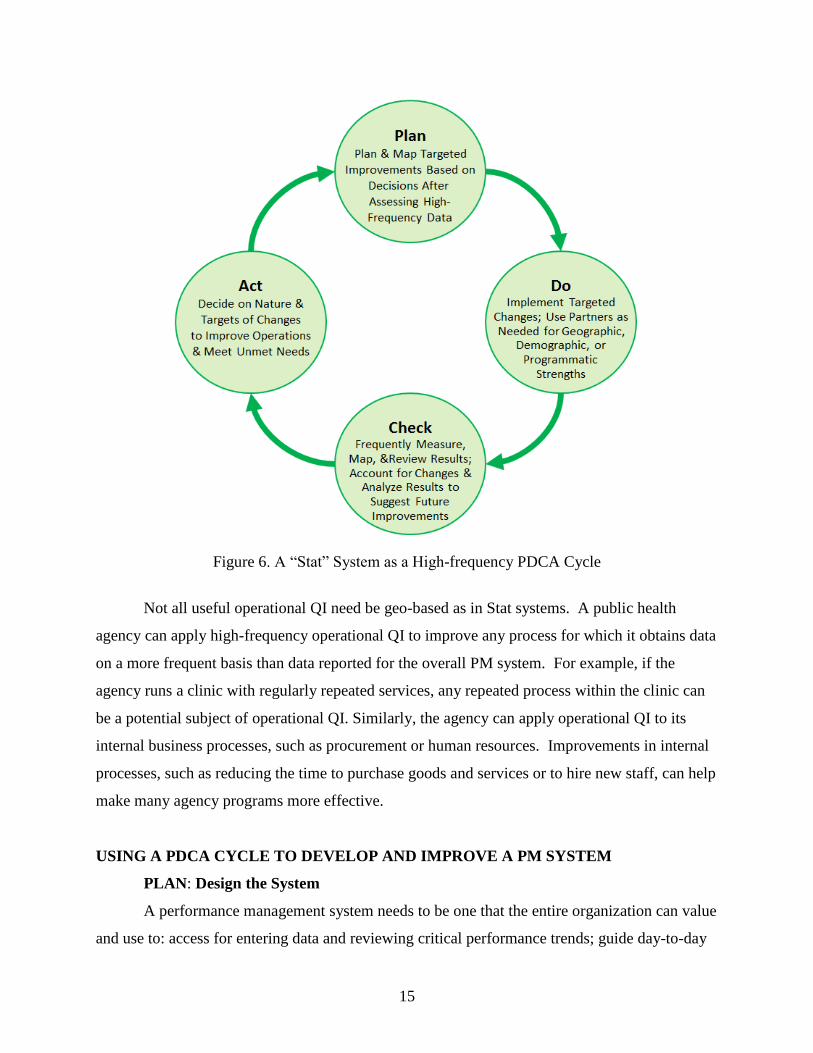
agency’s performance management system. Figure 6 depicts a Stat-like high-frequency
performance improvement cycle. Note in the “Do” Stage in Figure 6, where partners are needed
to help address health issues, as is often the case, they can be included in the responses to
mapped conditions.
15
Silverman, Eli (1999). NYPD Battles Crime: Innovative Strategies in Policing.(Northeastern Publisher), 16
Swope, Christopher (2001). “Restless for Results” in Governing, April, 2001. 17
For example, see Ammons, David N. ed. (2006). Leading Performance Management in Local Government.
(Washington, DC: ICMA Press). pp. 141-193.
15
Figure 6. A “Stat” System as a High-frequency PDCA Cycle
Not all useful operational QI need be geo-based as in Stat systems. A public health
agency can apply high-frequency operational QI to improve any process for which it obtains data
on a more frequent basis than data reported for the overall PM system. For example, if the
agency runs a clinic with regularly repeated services, any repeated process within the clinic can
be a potential subject of operational QI. Similarly, the agency can apply operational QI to its
internal business processes, such as procurement or human resources. Improvements in internal
processes, such as reducing the time to purchase goods and services or to hire new staff, can help
make many agency programs more effective.
USING A PDCA CYCLE TO DEVELOP AND IMPROVE A PM SYSTEM
PLAN: Design the System
A performance management system needs to be one that the entire organization can value
and use to: access for entering data and reviewing critical performance trends; guide day-to-day
16
operations; develop performance plans, budgets, and longer-term strategic and health
improvement plans; and direct attention to areas needing improvement. Whether you are
planning a new system, adding on, or retrofitting an existing PM system a complete and well-
defined performance management design is essential.
A good place to start is to appoint a Performance Management System Design Team
(PMSDT). This team needs to be staffed with expected system users (e.g., program and
operations managers, budget staff), IT staffers, and representatives from executive management
who ultimately will have to “own” the PM system.
The first task of a PMSDT is to develop a conceptual model to help define how the
performance management system will work. Too often, systems development efforts fail because
they do not reflect the realities of the organization. Rather the system was an off the shelf model,
and the expectation was that people’s work would conform to the system, with no opportunities
for local adaptation, resulting in most employees becoming resentful and uncooperative with the
system. The PMSDT needs to avoid such pitfalls. The design team can build its model from
existing models, such as those noted in this paper, experiences with past reporting systems,
existing software, and what has been successful at other agencies. But they should be careful to
adapt any models to the culture and capacity of the public health agency and how the agency
does business. Often part of the purpose of a new PM system is to change the culture to move
away from “business as usual” to a data-driven, results-focused approach. Even so, the existing
culture and business practices must be considered and staff engaged to be sure they’re part of
designing and “owning” the change.
In addition to the conceptual model, the design team must define the system’s DNA, in
broad terms:
Purpose - What is the purpose of the performance management system and what
do we want it to accomplish with it today and in the future?18
Functional requirements – what it is supposed to do? What capabilities must it
have?
Performance requirements - how does the system perform its functions?
18
Moran, John, & Duffy, Grace (2012). The Quality Improvement Tools Encyclopedia and Glossary, Public Health
Foundation, reference the Purpose Hierarchy, pp. 101 - 102
17
Usability requirements - who are the users and what do they want from the
system?
Data semantics – What are the key business and process terms we will be using,
such as types of performance measures and their definitions?
Environmental requirements - under what conditions does the system have to
work and meet its performance goals?
Budget requirements – what will be the ongoing staffing, licensing, operating and
upgrade costs for this system
The planning process identifies the needs of the organization and its users. These needs
are translated into business requirements - “what we want.” Translating the needs into
requirements can be facilitated by using Quality Function Deployment (QFD) matrices19
. QFD is
a process that uses a variety of matrices to help developers of a PM system prioritize functions
using the voice of the user. Eventually, the design team can transition into a “Performance
Management System Team” (PMST), which will oversee and improve the system in the long-
term. Some team members may change in this transition, as the PMST is likely to include people
who will spend a higher percentage of their time developing and improving the system. The
PMST will make decisions on operational guidance, software, hardware, upgrades, and additions
as the system matures. An effective performance management system needs to have adequate
ongoing resources, including funding, to run efficiently. It is important that the PMST be an
ownership group that has full accountability for the system and makes sure the system is meeting
the needs of the organization on an ongoing basis. This group will be a decision making body
that will entertain user requests for changes, different reporting modules, additional fields, and
any refinements to the system to make it user friendly. The PMST should report to the Health
Director and leadership team since the PM system will be used to guide the organization’s
critical decision making.
The agency’s IT staff, especially the IT representatives on the PMST, will facilitate how
the system will fulfill the requirements by developing the enabling processes. Enabling processes
19
Duffy, Grace L. Moran, John, & Riley, William (2011). Quality Function Deployment and Lean Six Sigma
Applications in Public Health, ASQ Quality Press, pp. 173 - 184
18
are the nuts and bolts of the system, such as how existing systems will be integrated; what
systems will no longer be supported; how existing data will be migrated into the new system;
how to automate data collection and develop dashboards for each organizational level; what
reports will be available at what times; security levels; what new data warehouses or data marts
may be needed; how to create supporting policies, procedures, and user tools; and how users will
be trained to use the new system. Many planning steps must be completed before the system can
be deployed. Lack of a thorough planning process can result in a lot of rework throughout the
organization during system deployment, driving skepticism and potential failure. To avoid these
pitfalls, some organizations deploy their system in stages, discussed under “Do: Deployment.”
A key planning step that can provide a transition to the “Do: Deployment” stage is the
selection of performance measures for all organizational units or programs, and for any cross-
cutting strategies to address priority health issues. So the PMST must develop a process to help
division and program managers to select, define, and standardize performance and quality
measures across the organization and set the targets to be achieved for each measure. In many
cases existing measures can be used, but the PMST must make it clear that measures must be
chosen that fit the conceptual model of the PM system and that are aligned with the agency’s
major strategies to improve population health. This can lead to dropping some existing measures
that do not align with agency strategy and adding new measures that do. Adopting a
“performance driver-outcome” (or leading-lagging) approach to performance measurement,
described earlier in this paper, can help achieve that alignment. Program managers can continue
to use data from measures not included in the PM system to manage their operations. But that
data will not reported on PM system scorecards or dashboards used by others in the organization.
One problem that emerges with measures that are not well aligned is a disconnect
between a strategic goal (e.g., reduce number of smokers in our service area by 20,000/year) and
operational measures of what agency programs are doing in relation to that goal (e.g., number of
stop smoking clinics held or number of pamphlets handed out at a Stop Smoking Fair). This is
where the PMST must help people across the entire organization understand that they need to be
able to defend their logic that success in meeting targets for their operational measures will make
a strong contribution to achieving strategic goals. Three ways they may do this are:
Use evidence to show that improving results on their operational measures really
does drive outcome results for strategic goals.
19
Develop new measures and targets that have an evidence base to make them
credible.
If the evidence base is thin or non-existent for an issue, target population, or
desired practice, use measures and data in the PDCA cycle of the PM system to
develop their own evidence, including rigorous analysis of “performance driver”
and “outcome” data at appropriate time intervals.
DO: Deployment
The deployment of the performance management system should be part of an
organizational cultural change that strongly aligns the organization and its employees with the
agency’s major strategies to improve population health. The deployment of a PM system is a
time to use measures to drive a new culture focused on quality and strategic alignment. The
public health agency must focus on developing and advocating for policies and practices to
improve priority health outcomes for the population they serve, and, as appropriate, on
implementing those policies and practices. For service programs, staff must focus on delivering
high-quality value-added services to their customer base. The deployment of the PM system
must ensure that all strategic and operational measures align with the major strategies of the
organization throughout the value chain, not just during the service delivery process, but also, for
example, in how employees are trained and how policies are developed. And there may always
be programs that are vital to preserving public health (e.g., vaccinations, preparedness) but are
not part of a SHIP, CHIP, or strategic plan because other health issues emerged as more pressing.
The continuing importance of those programs should be established through their own budgets
and operating plans with measures and targets demonstrating that their staff, as all staff in the
organization, is dedicated to results and continual quality improvement. The culture change will
be achieved when it is clear to everyone in the agency how everything they do adds value to
improving population health—not just in concept, but through clear strategic connections from
their work and the work of others to the health outcome goals of the agency.
To make this cultural change a reality the measures, targets, scorecards, and dashboards
developed must have participation of those who will be held accountable for reaching the targets
and must be available on a timely basis to all employees, demonstrating how they are linked to

20
the organizational objectives. A culture will change when the new desired behaviors are
measured, reacted to, rewarded, reported, and celebrated.
As shown in Figure 7, the PM system should enable the deployment of the goals and
objectives of the organization as well as providing a structured framework to allow the relevant
information to flow to appropriate points for enabling decision and control processes.20
Figure 7 The closed loop deployment and feedback system
In order to avoid user resistance to a new performance management system, the PMST
needs to develop an on-line dictionary of terms and acronyms that are used in the PM system to
help avoid confusion and misinterpretations. This applies to key types of metrics such as health
status outcomes and other basic terminology used in the system. People will resist if they feel
they do not understand the new measures, that the measures are not relevant or reliable, or that
data from the measures will be used against them. That can drive people to develop their own
spreadsheets to prove they are right and the “system” is wrong. Such “data fights” burn a lot of
time and energy defending the new system against those who are being measured by it, instead
of helping people learn how to use the system to become better contributors to population health.
20
Bititci, Umit S, Carrie, Allan S, & McDevitt, Liam. Integrated Performance Measurement Systems: A
Development Guide. International Journal of Operations and Production Management, vol. 17, no. 6, May/June
1997, MCB University Press, pp. 522-535.
21
Staged Deployment:
This is an approach used to work out system issues with a few pilot programs or organizational
units before rolling out the PM system to the entire organization. Generally, staff groups are
chosen as pilots who are most likely to be cooperative with a new PM system, perhaps because
they know their current system is inadequate for their current purposes (e.g., to achieve desired
improvements or to meet grant requirements), or they have had a positive experience with QI or
other results-focused change process, or because they have demonstrated a willingness to try new
things or to be accountable for results. If possible, it is useful to select pilot groups with various
types of functions and strategic roles (e.g., one closely connected with an agency strategic
priority, one that plays a health preservation role, one that plays a support role such as human
resources development) so later, more groups in the agency can identify with their examples.
As the PMST completes planning steps with the pilot groups (e.g., select aligned
measures and targets) and helps them work through deployment, PMST members and pilot group
staff can identify system bugs and weaknesses in the planning and deployment processes to be
corrected before full agency deployment. Then, in the larger roll-out, it will be easier to avoid
pitfalls and help people in all programs adapt the new system to meet their performance needs.
CHECK: Review the System
A review of the performance management system should be conducted at least yearly by the
PMST to ensure that the system is meeting the needs and expectations of the organization and all
system users. The general areas to focus on for review are:
Effective Use of Data by Users – system is being used as a decision making tool
and not just compiling data. The PMST should ensure that different levels of the
organization are using the data to make informed decisions.
Alignment – system is aligned with organizational goals and helps users support
goal achievement.
Results-focus – system delivers timely and accurate information that holds
employees accountable for achieving results appropriate to their level of
responsibility.
22
Relevant Measures – system is providing employees with timely data on measures
that are most relevant to how they contribute to organization success, which will vary
among staff groups and may include, for example, measures of outcomes, quality,
quantity, timeliness, efficiency, cost-effectiveness, professional competencies, or
customer satisfaction.
Reliable Data – system provides data that are accurate, valid, and consistent, with
clear, documented definitions for all measures that are consistently followed in
collecting data and compiling and reporting results.
Employee Involvement - employees are continually involved in the design and
upgrade of the PM system since this is designed for all in the organization to use.
Training - The PMST reviews the user training programs to ensure they are making
the organization more competent in the use of the system.
Organizational Assessment and Guidance - the PMST conducts leadership and
user satisfaction surveys to determine if the PM system is meeting the current needs
of the organization and its users. Then the PMST uses the survey data to make
decisions on any needed changes to the system.
ACT: Improve the System
Based on the results of a regular review of the performance management system the PMST
should review the output and decide where improvements are needed. These improvements will
require the team to start the PDCA cycle again and review the system requirements to see if they
remain relevant. Any time a change to the PM system is made a communication to all users
should also be made indicating the change process and what will be changing. The PMST needs
to update all documents, policies, procedures, terminology, and training to reflect the upgrades to
the system. All changes and their impact on the users of the PM system need to be
communicated well in advance of the changes taking place.
Summary:
A well defined and deployed performance management system will ensure that strategic and
operational goals and objectives are aligned and reinforce one another. The PM system aligns all
23
agency measurement frameworks to help executives, managers, and employees make informed
decisions at any level of the organization. The PM system should not just supply data but should
help users turn data into actionable knowledge to improve performance. To make that happen,
the Performance Management System Team should clarify to all users the overarching system
policies and functions and actively assist users in learning how to make effective use of system
information. Ultimately, the PM system should help all public health agency employees
understand how their work contributes to improving population health, and should help them
become more effective in doing so.