Embed Size (px)
Citation preview
Approved for public release; distribution is unlimited.
ERD
C/C
ERL
TR-0
0-40
Designing Coalescing Oil/Water Separators for Use at Army Washracks
Con
stru
ctio
n En
gine
erin
g
Res
earc
h La
bora
tory
by Gary L. Gerdes, Angelo DeGuzman,
and Jeffrey Grubich December 2000
2 ERDC/CERL TR-00-40
Foreword
This study was conducted for the U.S. Army Corps of Engineers under project 40162720A896, “Base Facilities Environmental Quality,” Work Unit TB0, “Oil/ Water Separator Technology.” The technical monitor was Gregory W. Hughes (CECW-EW).
The work was performed by the Environmental Processes Branch (CN-E) of the Installations Division (CN), Construction Engineering Research Laboratory (CERL). The CERL Principal Investigator was Gary L. Gerdes, CN-E. The technical editor was Linda L. Wheatley, Information Technology Laboratory. Dr. Ilker R. Adiguzel is Chief, CN-E, and Dr. John T. Bandy is Chief, CN. The asso-ciated Technical Director was Gary W. Schanche, CVT. The Acting Director of CERL is William D. Goran.
CERL is an element of the U.S. Army Engineer Research and Development Cen-ter (ERDC), U.S. Army Corps of Engineers. The Director of ERDC is Dr. James R. Houston and the Commander is COL James S. Weller.
DISCLAIMERDISCLAIMERDISCLAIMERDISCLAIMER
The contents of this report are not to be used for advertising, publication, or promotional purposes. Citation of trade namesdoes not constitute an official endorsement or approval of the use of such commercial products. All product names andtrademarks cited are the property of their respective owners.
The findings of this report are not to be construed as an official Department of the Army position unless so designated byother authorized documents.
DESTROY THIS REPORT WHEN IT IS NO LONGER NEEDED. DO NOT RETURN IT TO THE ORIGINATOR.DESTROY THIS REPORT WHEN IT IS NO LONGER NEEDED. DO NOT RETURN IT TO THE ORIGINATOR.DESTROY THIS REPORT WHEN IT IS NO LONGER NEEDED. DO NOT RETURN IT TO THE ORIGINATOR.DESTROY THIS REPORT WHEN IT IS NO LONGER NEEDED. DO NOT RETURN IT TO THE ORIGINATOR.
ERDC/CERL TR-00-40 3
Contents
Foreword............................................................................................................................................... 2
List of Figures and Tables.................................................................................................................. 5
1 Introduction ................................................................................................................................... 7 Background .........................................................................................................................7 Objectives .........................................................................................................................10 Approach...........................................................................................................................10 Mode of Technology Transfer............................................................................................ 11 Units of Weight and Measure............................................................................................ 11
2 Wash Water Characterization................................................................................................... 12 U.S. Army Reserve Study .................................................................................................12
Influent Characterization: All Facilities ........................................................................................12 Aviation Support Facilities............................................................................................................13 Area Maintenance Support Activities ...........................................................................................14 Equipment Concentration Sites ...................................................................................................14 Organizational Maintenance Shops .............................................................................................14 Other Sites...................................................................................................................................15
Summary...........................................................................................................................16
3 Treatability Study........................................................................................................................ 17 Experiment Design............................................................................................................17
Contaminants...............................................................................................................................18 Coalescer Material .......................................................................................................................18 Coalescing Plate Angle of Incline.................................................................................................19 Water Temperature ......................................................................................................................19 Configurations..............................................................................................................................19 Duration .......................................................................................................................................20 Surface Loading Rate ..................................................................................................................20 Sampling and Analysis.................................................................................................................21 Test Start-up.................................................................................................................................21
Results ..............................................................................................................................21 Oil and Grease Removal..............................................................................................................21 Sediment Accumulation ...............................................................................................................22
4 ERDC/CERL TR-00-40
4 Conclusions and Recommendations ..................................................................................... 23 Conclusions.......................................................................................................................23 Recommendations ............................................................................................................23
References.......................................................................................................................................... 24
Appendix: Results of Test Cell Sampling..................................................................................... 25
CERL Distribution.............................................................................................................................. 42
Report Documentation Page ........................................................................................................... 43
ERDC/CERL TR-00-40 5
List of Figures and Tables
Figures
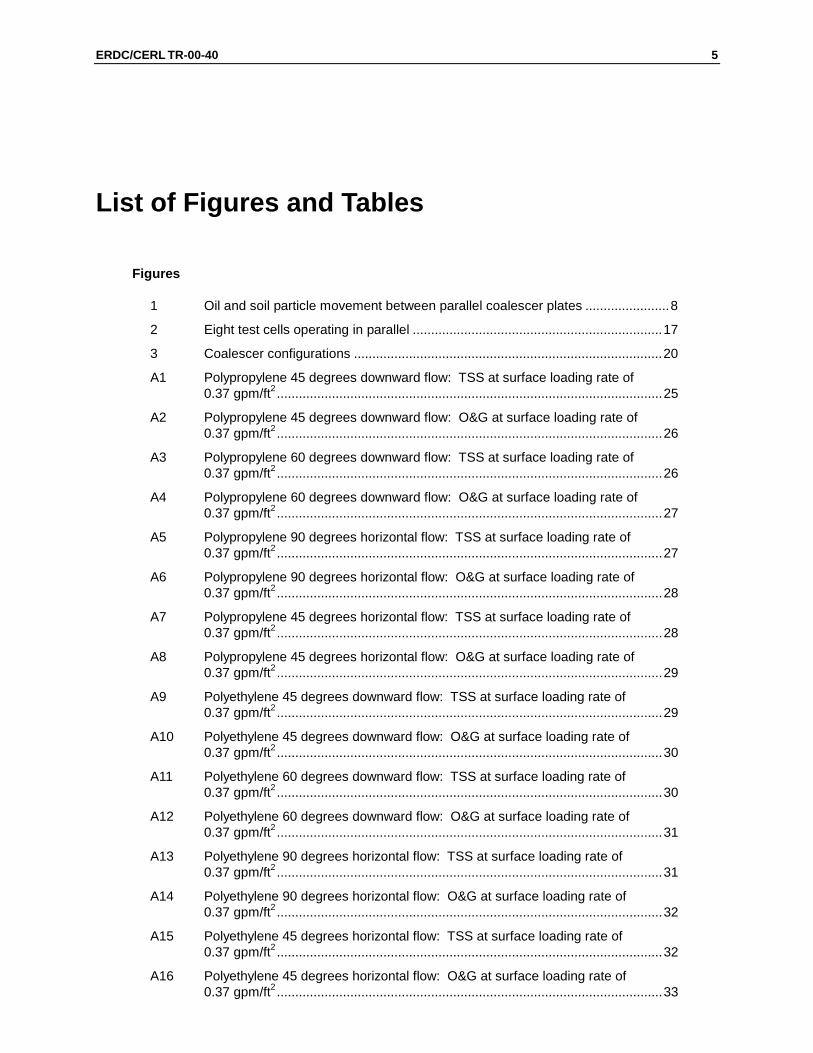
1 Oil and soil particle movement between parallel coalescer plates .......................8 2 Eight test cells operating in parallel ....................................................................17 3 Coalescer configurations ....................................................................................20
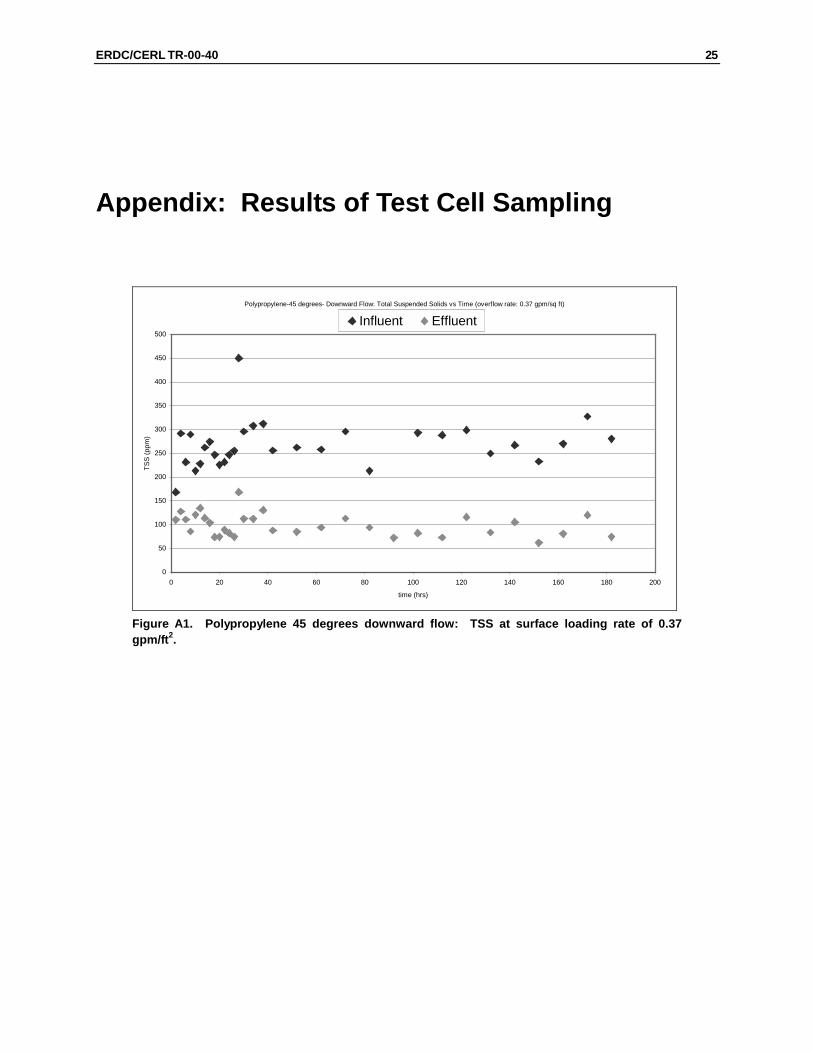
A1 Polypropylene 45 degrees downward flow: TSS at surface loading rate of 0.37 gpm/ft2 .........................................................................................................25
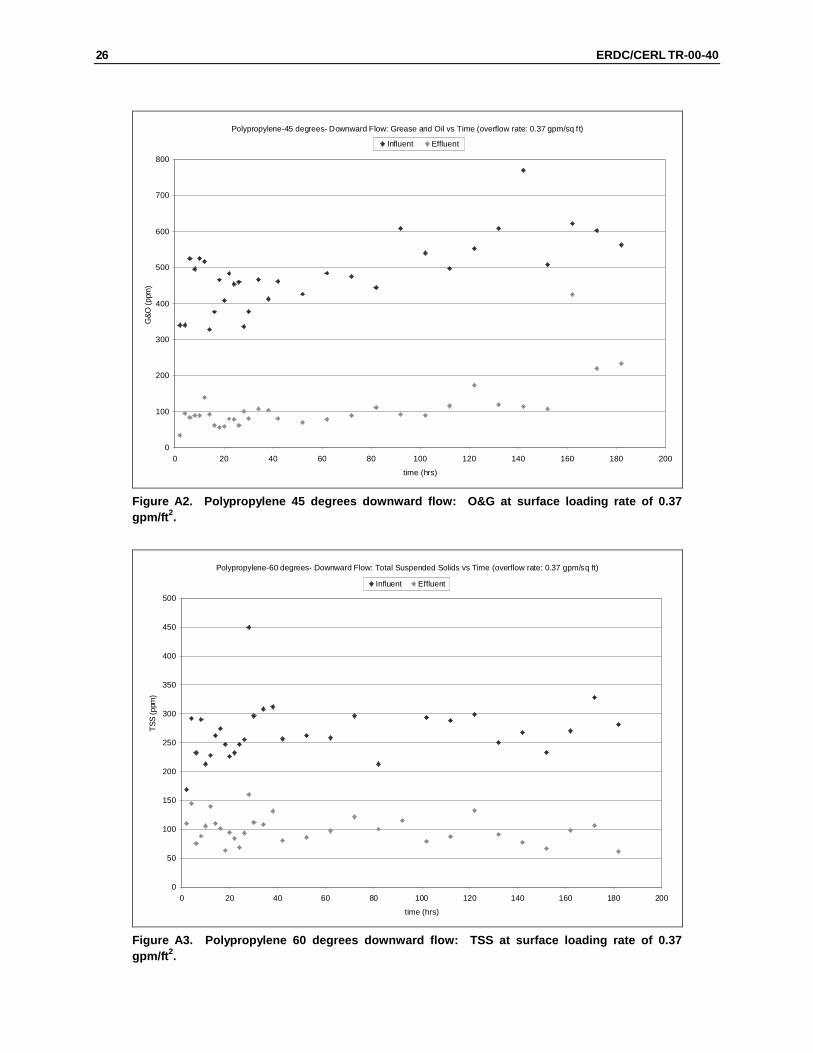
A2 Polypropylene 45 degrees downward flow: O&G at surface loading rate of 0.37 gpm/ft2 .........................................................................................................26
A3 Polypropylene 60 degrees downward flow: TSS at surface loading rate of 0.37 gpm/ft2 .........................................................................................................26
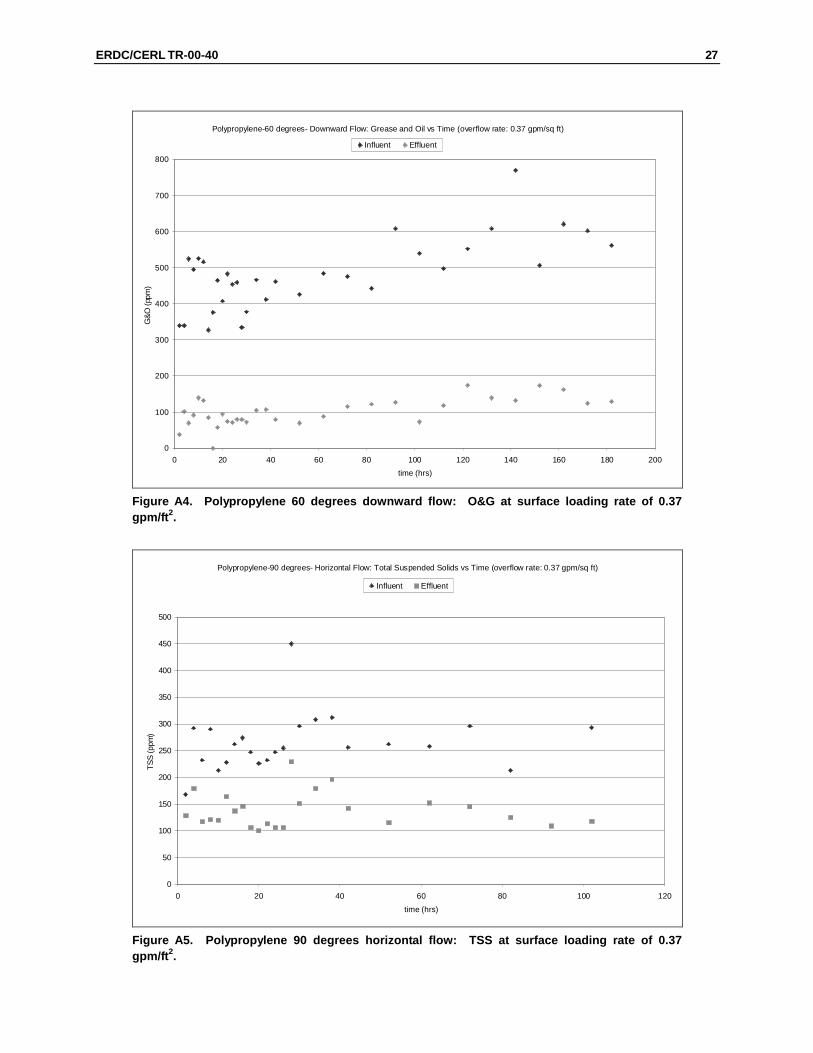
A4 Polypropylene 60 degrees downward flow: O&G at surface loading rate of 0.37 gpm/ft2 .........................................................................................................27
A5 Polypropylene 90 degrees horizontal flow: TSS at surface loading rate of 0.37 gpm/ft2 .........................................................................................................27
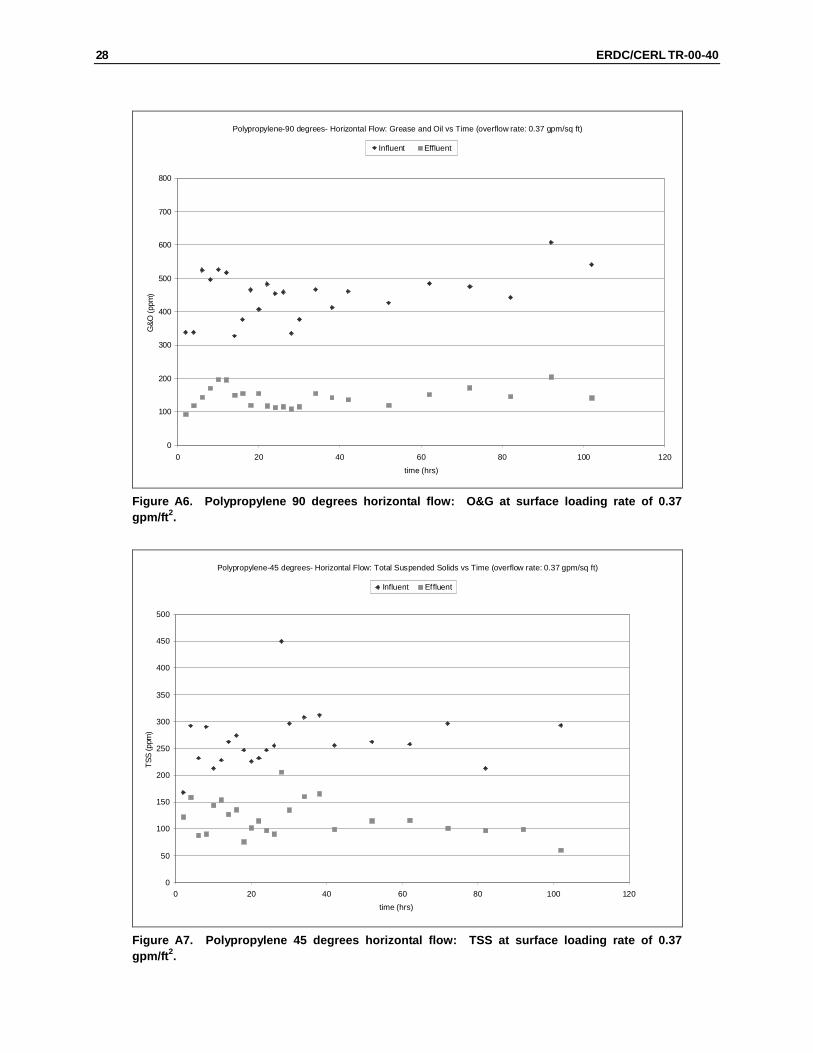
A6 Polypropylene 90 degrees horizontal flow: O&G at surface loading rate of 0.37 gpm/ft2 .........................................................................................................28
A7 Polypropylene 45 degrees horizontal flow: TSS at surface loading rate of 0.37 gpm/ft2 .........................................................................................................28
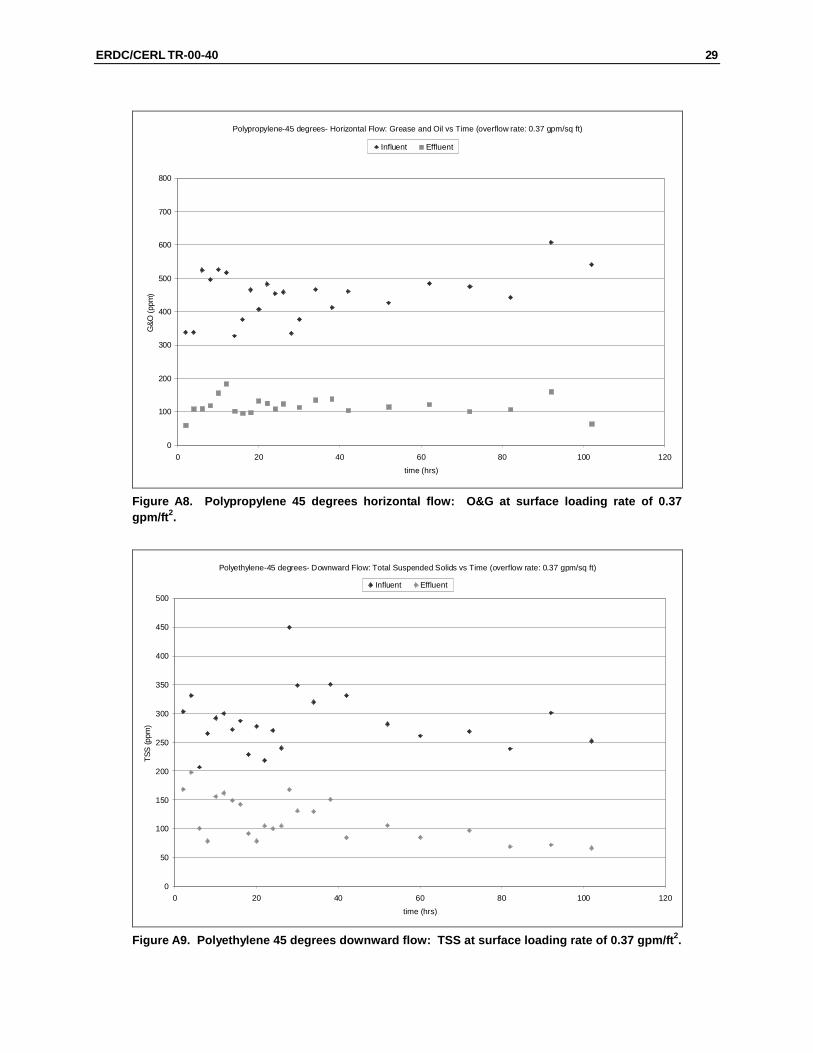
A8 Polypropylene 45 degrees horizontal flow: O&G at surface loading rate of 0.37 gpm/ft2 .........................................................................................................29
A9 Polyethylene 45 degrees downward flow: TSS at surface loading rate of 0.37 gpm/ft2 .........................................................................................................29
A10 Polyethylene 45 degrees downward flow: O&G at surface loading rate of 0.37 gpm/ft2 .........................................................................................................30
A11 Polyethylene 60 degrees downward flow: TSS at surface loading rate of 0.37 gpm/ft2 .........................................................................................................30
A12 Polyethylene 60 degrees downward flow: O&G at surface loading rate of 0.37 gpm/ft2 .........................................................................................................31
A13 Polyethylene 90 degrees horizontal flow: TSS at surface loading rate of 0.37 gpm/ft2 .........................................................................................................31
A14 Polyethylene 90 degrees horizontal flow: O&G at surface loading rate of 0.37 gpm/ft2 .........................................................................................................32
A15 Polyethylene 45 degrees horizontal flow: TSS at surface loading rate of 0.37 gpm/ft2 .........................................................................................................32
A16 Polyethylene 45 degrees horizontal flow: O&G at surface loading rate of 0.37 gpm/ft2 .........................................................................................................33
6 ERDC/CERL TR-00-40
A17 Corrugated angled ribs slanted away from flow: TSS at surface loading rate of 0.37 gpm/ft2..............................................................................................33
A18 Corrugated angled ribs slanted away from flow: O&G at surface loading rate of 0.37 gpm/ft2..............................................................................................34
A19 Corrugated angled ribs slanted toward flow: TSS at surface loading rate of 0.37 gpm/ft2 .....................................................................................................34
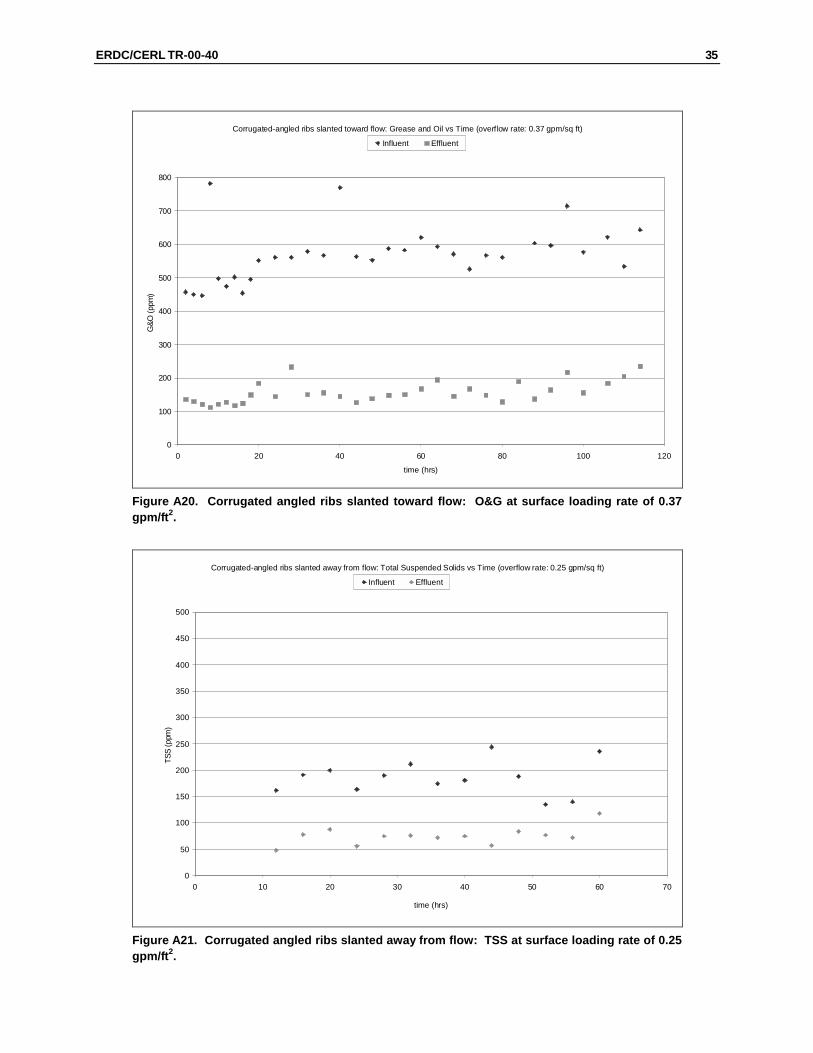
A20 Corrugated angled ribs slanted toward flow: O&G at surface loading rate of 0.37 gpm/ft2 .....................................................................................................35
A21 Corrugated angled ribs slanted away from flow: TSS at surface loading rate of 0.25 gpm/ft2..............................................................................................35
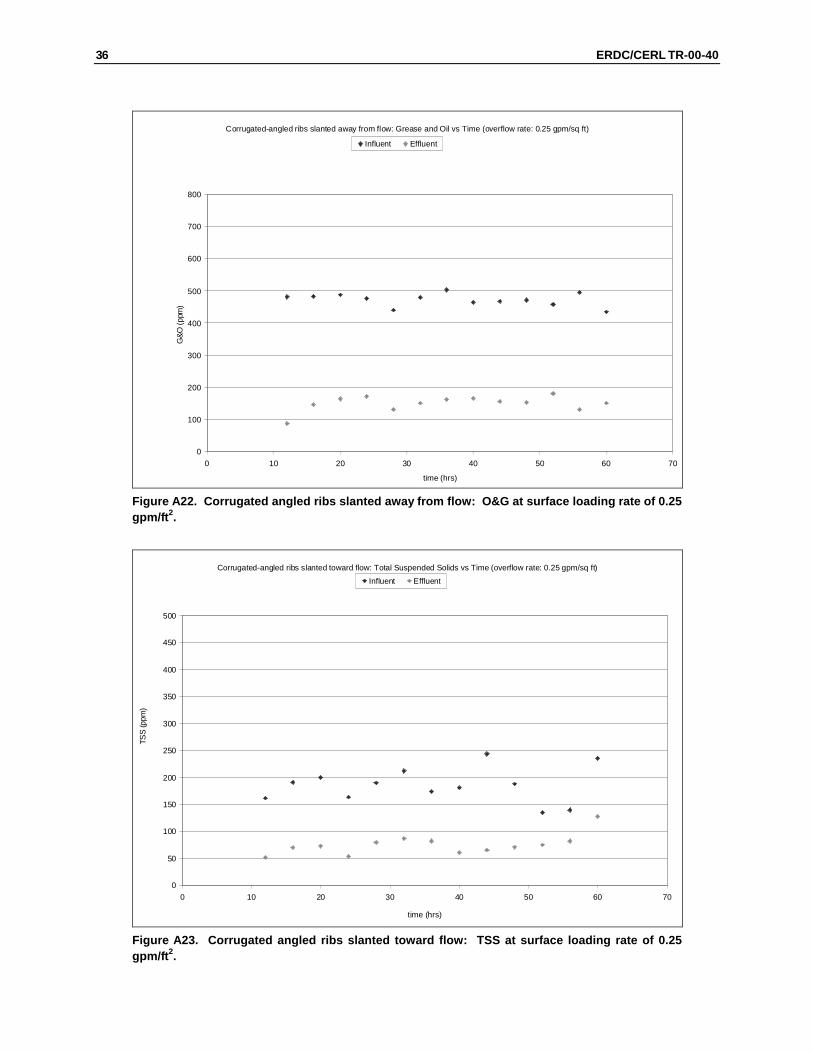
A22 Corrugated angled ribs slanted away from flow: O&G at surface loading rate of 0.25 gpm/ft2..............................................................................................36
A23 Corrugated angled ribs slanted toward flow: TSS at surface loading rate of 0.25 gpm/ft2 .....................................................................................................36
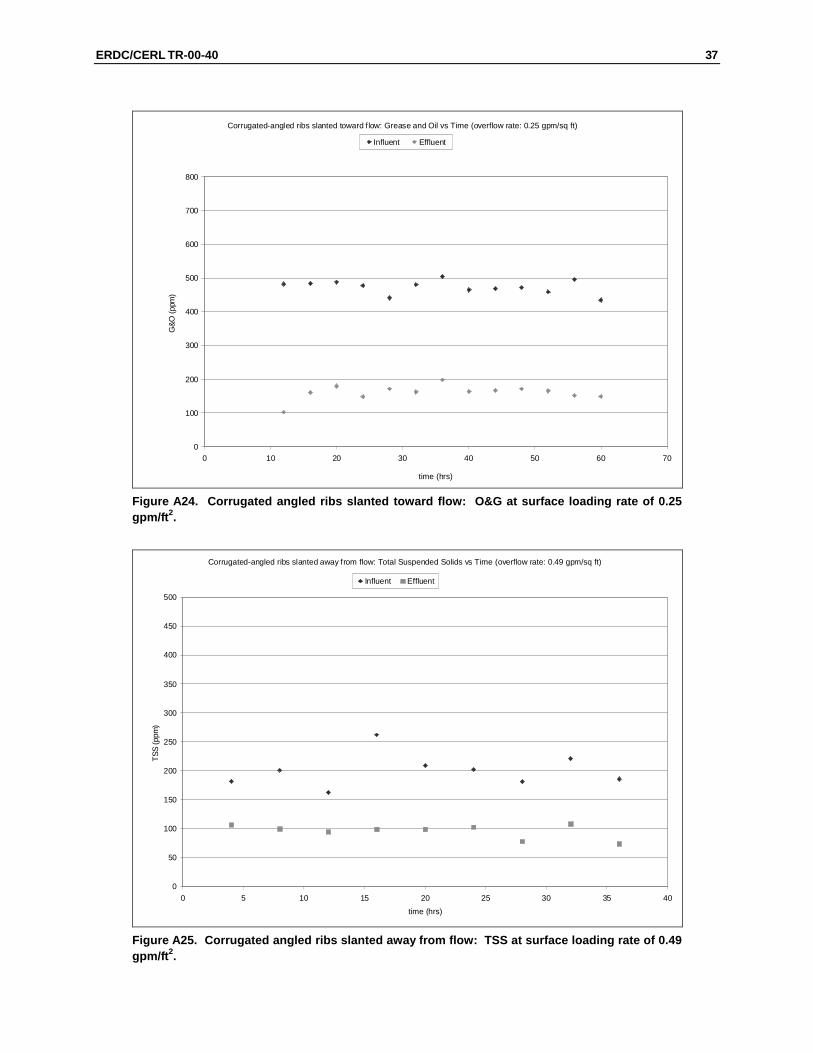
A24 Corrugated angled ribs slanted toward flow: O&G at surface loading rate of 0.25 gpm/ft2 .....................................................................................................37
A25 Corrugated angled ribs slanted away from flow: TSS at surface loading rate of 0.49 gpm/ft2..............................................................................................37
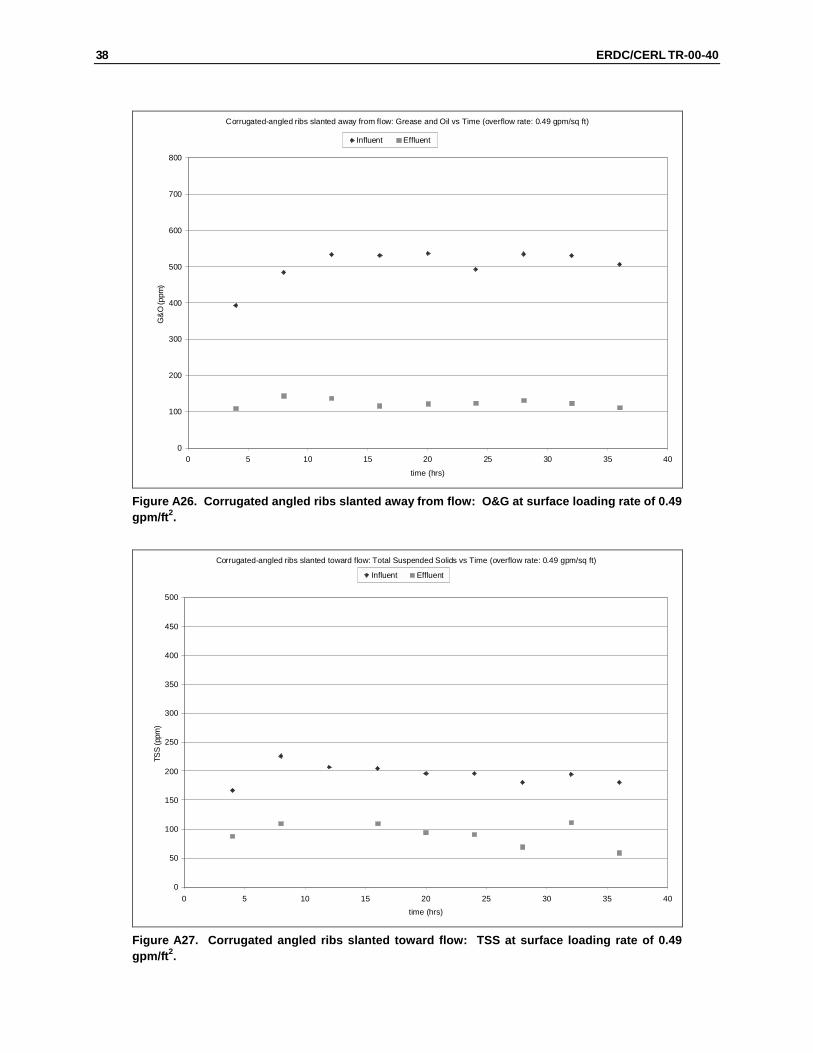
A26 Corrugated angled ribs slanted away from flow: O&G at surface loading rate of 0.49 gpm/ft2..............................................................................................38
A27 Corrugated angled ribs slanted toward flow: TSS at surface loading rate of 0.49 gpm/ft2 .....................................................................................................38
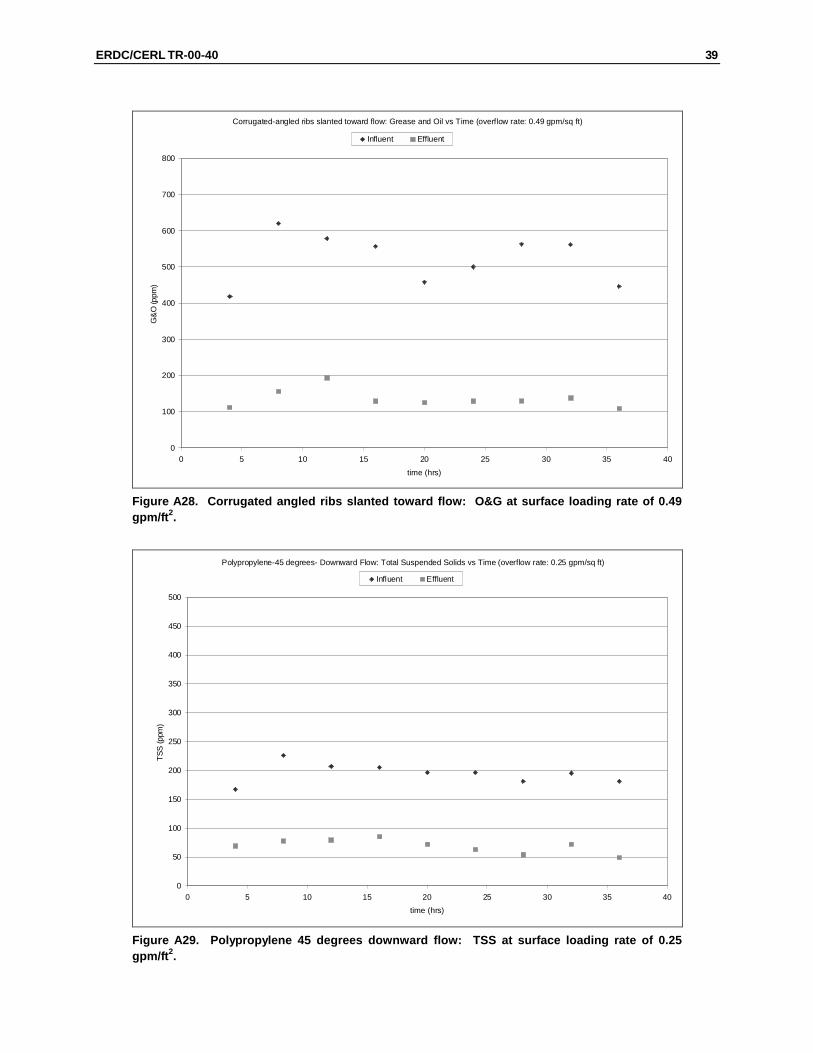
A28 Corrugated angled ribs slanted toward flow: O&G at surface loading rate of 0.49 gpm/ft2 .....................................................................................................39
A29 Polypropylene 45 degrees downward flow: TSS at surface loading rate of 0.25 gpm/ft2 .........................................................................................................39
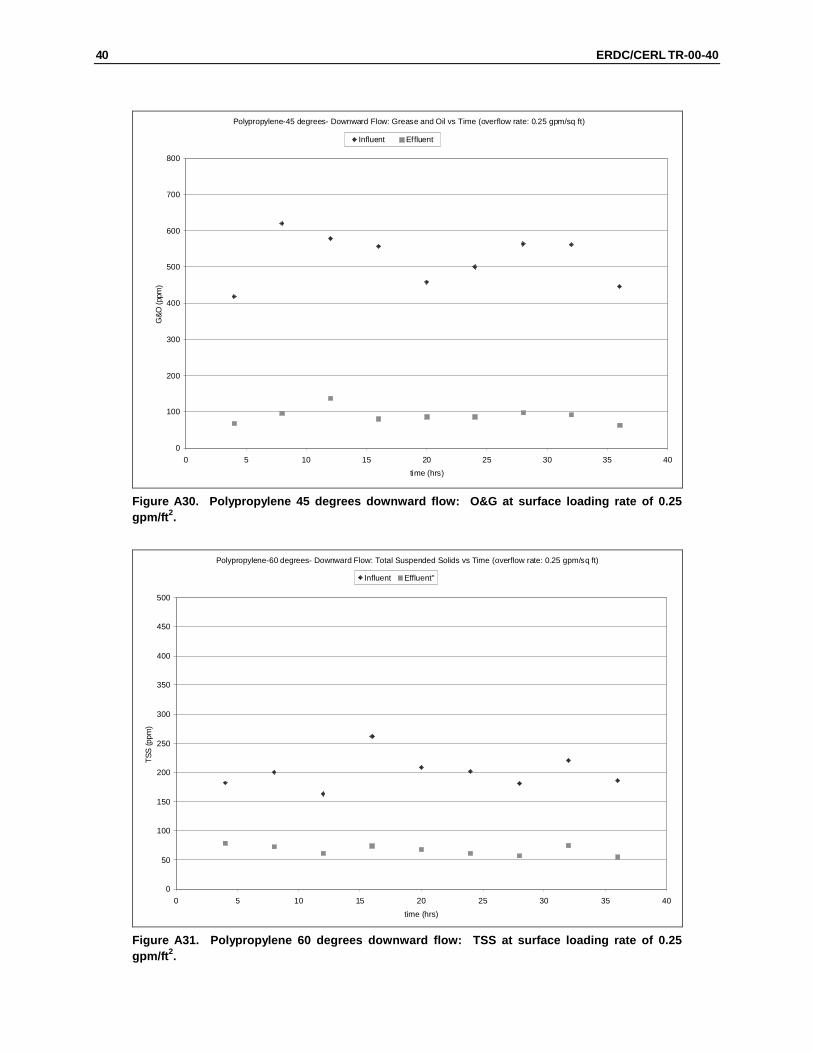
A30 Polypropylene 45 degrees downward flow: O&G at surface loading rate of 0.25 gpm/ft2 .........................................................................................................40
A31 Polypropylene 60 degrees downward flow: TSS at surface loading rate of 0.25 gpm/ft2 .........................................................................................................40
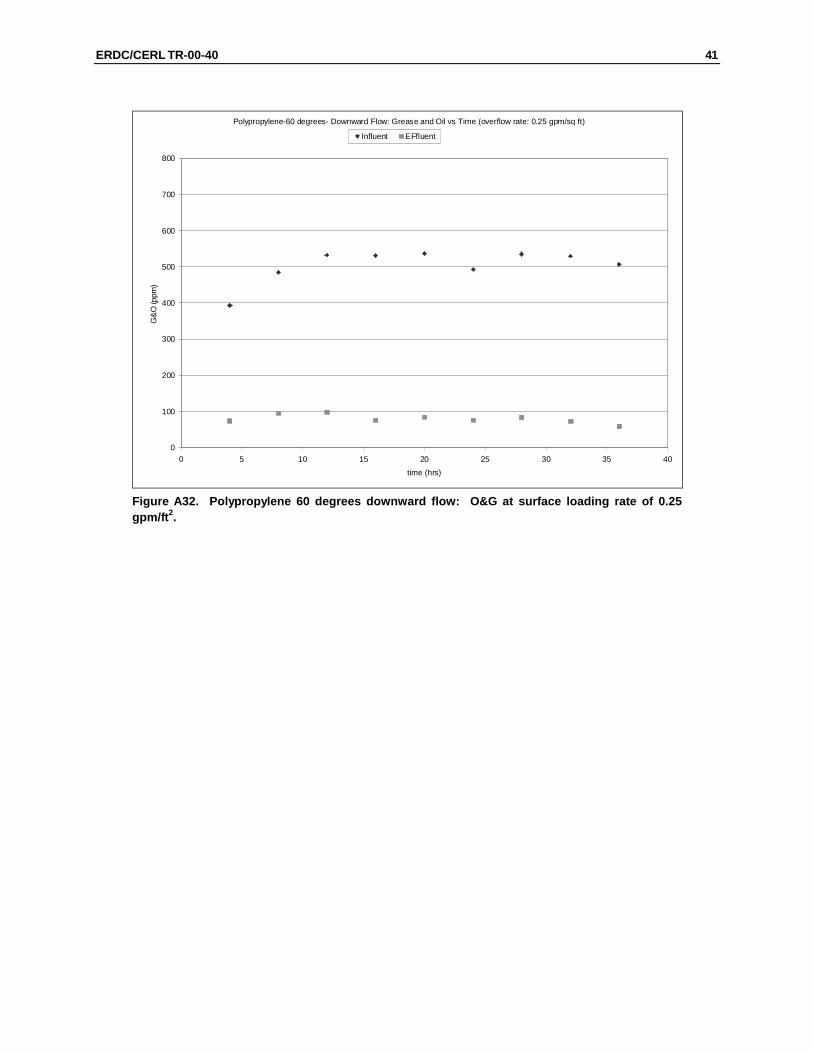
A32 Polypropylene 60 degrees downward flow: O&G at surface loading rate of 0.25 gpm/ft2 .........................................................................................................41
Tables
1 Summary of sampling data from 10 facilities ......................................................13 2 Summary of ASF wash water characterization data ...........................................13 3 Summary of AMSA wash water characterization data ........................................14 4 Summary of ECS wash water characterization data ..........................................14 5 Summary of OMS wash water characterization data..........................................15
ERDC/CERL TR-00-40 7
1 Introduction
Background
The U.S. Army has thousands of oil/water separators to treat wastewater from tactical vehicle washracks at active Army, Army Reserve, and Army National Guard facilities. The vast majority of these separators are used as pretreatment prior to discharge of waste wash water into a sanitary or industrial sewer. Exist-ing Army separators are typically below ground, cast-in-place concrete, simple gravity-type separators. Simple gravity separators consist of a chamber or chambers where the velocity of wastewater slows enough to allow free oil to rise to the surface. Cast-in-place concrete separators, however, are seldom con-structed anymore, and designers now specify/install off-the-shelf oil/water sepa-rators. Most off-the-shelf separators being installed currently are coalescing-type gravity separators. Facility designers choose coalescing separators because they are smaller, less expensive, and require less site work than the equivalent simple gravity separators. Many manufacturers now offer aboveground separa-tors that are significantly less expensive to install.
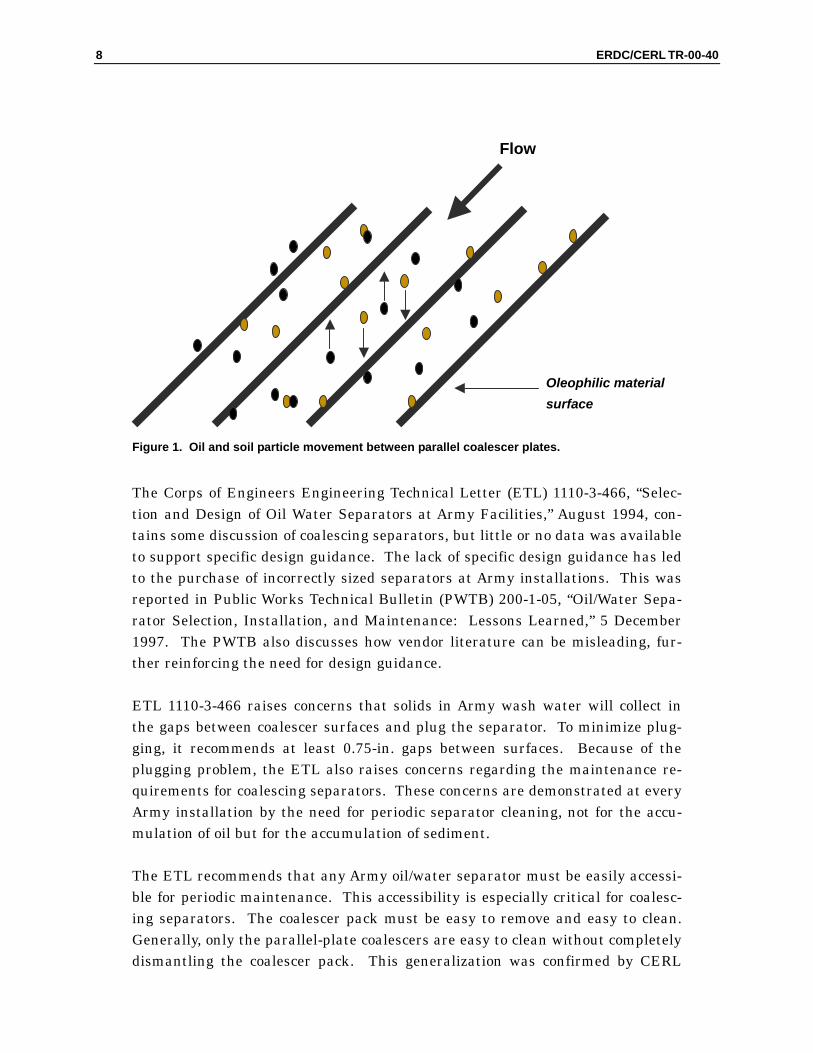
Oil/water separator manufacturers also incorporate coalescers in their designs to improve the performance. Because coalescing devices shorten the distance oil particles must rise, oil removal is quicker and may occur in a smaller separation chamber. Small oil particles rise to collect on the surfaces of the coalescer, com-bine to form larger globules (coalesce), and migrate to the water surface. The heavier soil particles sink to the lower coalescer surface, and eventually slide to the bottom of the separator. Figure 1 shows the schematic of particle movement in a simple parallel-plate coalescer.
Coalescers have many configurations, from simple arrays of parallel plates to honeycomb meshes. Recent trends in coalescer design are to cause many changes in the direction of flow as wastewater winds its way through the separa-tor. The intent is to cause non-laminar flow, thus increasing the probability that oil droplets will collide and coalesce.
8 ERDC/CERL TR-00-40
Figure 1. Oil and soil particle movement between parallel coalescer plates.
The Corps of Engineers Engineering Technical Letter (ETL) 1110-3-466, “Selec-tion and Design of Oil Water Separators at Army Facilities,” August 1994, con-tains some discussion of coalescing separators, but little or no data was available to support specific design guidance. The lack of specific design guidance has led to the purchase of incorrectly sized separators at Army installations. This was reported in Public Works Technical Bulletin (PWTB) 200-1-05, “Oil/Water Sepa-rator Selection, Installation, and Maintenance: Lessons Learned,” 5 December 1997. The PWTB also discusses how vendor literature can be misleading, fur-ther reinforcing the need for design guidance.
ETL 1110-3-466 raises concerns that solids in Army wash water will collect in the gaps between coalescer surfaces and plug the separator. To minimize plug-ging, it recommends at least 0.75-in. gaps between surfaces. Because of the plugging problem, the ETL also raises concerns regarding the maintenance re-quirements for coalescing separators. These concerns are demonstrated at every Army installation by the need for periodic separator cleaning, not for the accu-mulation of oil but for the accumulation of sediment.
The ETL recommends that any Army oil/water separator must be easily accessi-ble for periodic maintenance. This accessibility is especially critical for coalesc-ing separators. The coalescer pack must be easy to remove and easy to clean. Generally, only the parallel-plate coalescers are easy to clean without completely dismantling the coalescer pack. This generalization was confirmed by CERL
Oleophilic material surface
Flow
ERDC/CERL TR-00-40 9
personnel who inspected separators with mesh or vertical mesh tube-type coa-lescers. These coalescers seem to easily plug with vegetation debris commonly found in Army wash water. Only coalescing separators with the flat parallel plates can be recommended for Army use; therefore, they were the primary focus of this study.
Dirt washed off Army vehicles becomes suspended solid particles in the waste wash water. These particles attach to the oil droplets, thus interfering with the oil removal capacity of the separator. This process is described in the Corps ETL on separator design (USACE 1994) and Brincks (1996). It is also supported by observations of significant amounts of oil in the sediment of Army separators. Oil-soil agglomerations have a wide range of specific gravities, but always are more dense than oil droplets. Stoke’s Law is typically used to model the separa-tion of oil and water.
Stoke’s Law: Vp = 54.48 (ρp-ρw)dp
2 Velocity (Vp) is positive if particle is µ falling; negative if rising.
Stoke’s Law generally says that the velocity of rise (or fall) of a particle in water is proportional to: the specific gravity of the particle minus 1; the diameter of the particle; and the temperature of the water. As the specific gravity of the par-ticle approaches that of water (usually 1.0), the velocity of the particle ap-proaches zero. Therefore, when a particle of oil attaches to a soil particle, the velocity of rise decreases. If the soil particle is large enough, the oil-soil agglom-eration will sink.
For Stoke’s law to be applicable when modeling the oil separation from wastewa-ter laden with suspended solids, the distribution of oil particle and oil-soil parti-cle diameters and specific gravities must be known. Prior to this study, this dis-tribution was never characterized. Therefore, separator performance could not be predicted for Army wash water using Stoke’s Law.
Many vendors of off-the-shelf oil/water separators use Stoke’s law to predict the performance of their equipment for removing free oil. This can only be applica-ble for simple mixtures of free oil droplets in water. Thus, vendor literature can be misleading to persons responsible for purchasing separators for Army applica-tions. Because Army guidance did not exist, and vendor guidance is not applica-ble, this study was conducted so that installation personnel, as well as washrack designers, have specific guidance for the selection of off-the-shelf coalescing oil/water separators.
10 ERDC/CERL TR-00-40
Objectives
It was the objective of this study to develop design guidance that can be used by Army planners and designers when installing coalescing-type oil/water separa-tors to pretreat vehicle maintenance wash water. It was also an objective to characterize the oil-soil agglomerations that obviously form during the washing process.
Approach
The approach for this study had two thrusts: (1) characterize Army washrack wastewater, and (2) conduct bench-scale treatability studies to match coalescer design with Army wash water. The characterization study had to be completed before initiating the treatability study. Army wash water was recreated in the laboratory based on the contaminant loading measured at actual Army wash-racks. It was most important to know the concentrations of suspended solids and grease/oil in the water, since it is these contaminants that are removed from the wastewater in the oil/water separator.
Wash water was sampled and analyzed from several Army washracks, represent-ing a variety of vehicle washing scenarios. Chapter 2 of this report presents the results of this portion of the study.
The challenge to characterizing the oil-soil agglomerations that form during the washing process was that the wash water is a non-homogeneous mixture of oil droplets, soil particles, and oil-soil agglomerations. A method to differentiate these components during a particle size analysis could not be found. In particu-lar, a method to distinguish oil-soil agglomerations of various constituent ratios seemed impossible to devise. Further, there was no guarantee that particle iden-tification techniques would not alter the character of fragile oil-soil agglomera-tions during the analysis. It was concluded that characterizing the particle dis-tribution of Army wash water was not practical, and that the characterization of the wash water would rely entirely on measuring the concentrations of oil and solids. Note: Without particle size distribution and agglomeration characteriza-tion data, Stoke’s Law cannot be used to predict oil/water separator performance for Army wash water.
An array of test cells was constructed to conduct the treatability study. The test cells were constructed so that several coalescer configurations could be evaluated at the same time, using a common source of wastewater influent. The concentra-tions of oil and solids in the wastewater were set according to the results of the
ERDC/CERL TR-00-40 11
wash water sampling study. Chapter 3 of this report discusses the experimental parameters and test results.
A performance goal of 100 ppm oil and grease (O&G) in the test cell effluent was set. This goal represents a commonly used pretreatment requirement set by many Publicly Owned Treatment Works (POTW). The success of a given testing scenario is based on this performance goal.
The presence of solids in the wash water affects performance in ways besides their becoming tied up with the oil droplets. It was also suspected that solids would accumulate on the surface of the coalescer. This accumulation would negatively affect performance by narrowing the gap between the coalescer sur-faces, thus increasing the velocity of water through the coalescer and decreasing droplet removal. Solids could also negatively affect performance if they coated the oliophilic coalescer material, thus diminishing the available surface on which the oil droplets could coalesce. Evidence of these effects would have a bearing on both recommended design and maintenance requirements for coalescing separa-tors.
Mode of Technology Transfer
Information in this technical report will be provided to the U.S. Army Engineer District at Mobile, AL, for inclusion in the new Corps of Engineers’ “Guide Speci-fication for Prefabricated Oil-Water Separators for Military Applications.” It will also be provided to the DOD Clean Water Act Services Steering Committee — Oil/Water Separator Work Group for future update to in the “Oil/Water Separa-tor Guidance Manual,” which is currently under review prior to initial publica-tion.
Units of Weight and Measure
U.S. standard units of measure are used in this report. A table of conversion fac-tors for Standard International (SI) units is provided below.
SI conversion factors 1 gal = 3.78 L 1 ft2 = 0.093 m2
12 ERDC/CERL TR-00-40
2 Wash Water Characterization
The information in this chapter summarizes the data obtained during studies conducted by CERL during which sampling of oil/water separator influent was necessary. Headquarters, U.S. Army Reserve Command co-sponsored a CERL study to characterize wash water at various Reserve maintenance facilities. Results from the unpublished report of that study (Gerdes 1997) are included below. Data from two studies sponsored by the U.S. Army Environmental Center are also included, as well as data from a quick-release detergent study conducted by CERL for the (former) U.S. Army Corps of Engineers Center for Public Works (1997).
U.S. Army Reserve Study
Onsite sampling efforts generated data characterizing wastewater from several Army Reserve sources. CERL sampling teams visited 11 wastewater generators during the study. An average of eight samples were taken during a typical wash-ing event at each generator. Characteristics measured were: O&G, chemical oxygen demand (COD), total suspended solids (TSS), volatile suspended solids (VSS), and flow. Samples represented low-pressure cleaning, high-pressure cleaning, and cleaning with detergents. Sites for these studies included:
• Two Aviation Support Facilities (ASFs)
• Three Area Maintenance Support Activities (AMSAs)
• Two Equipment Concentration Sites (ECSs)
• Three Reserve Center Organizational Maintenance Shops (OMSs)
Influent Characterization: All Facilities
Table 1 summarizes the wash water analysis data from 10 sites visited. Flow at the 10 washracks summarized in the table ranged from 1.5 gpm to 19 gpm. Av-erage flow at those washracks is about 7 gpm.
ERDC/CERL TR-00-40 13
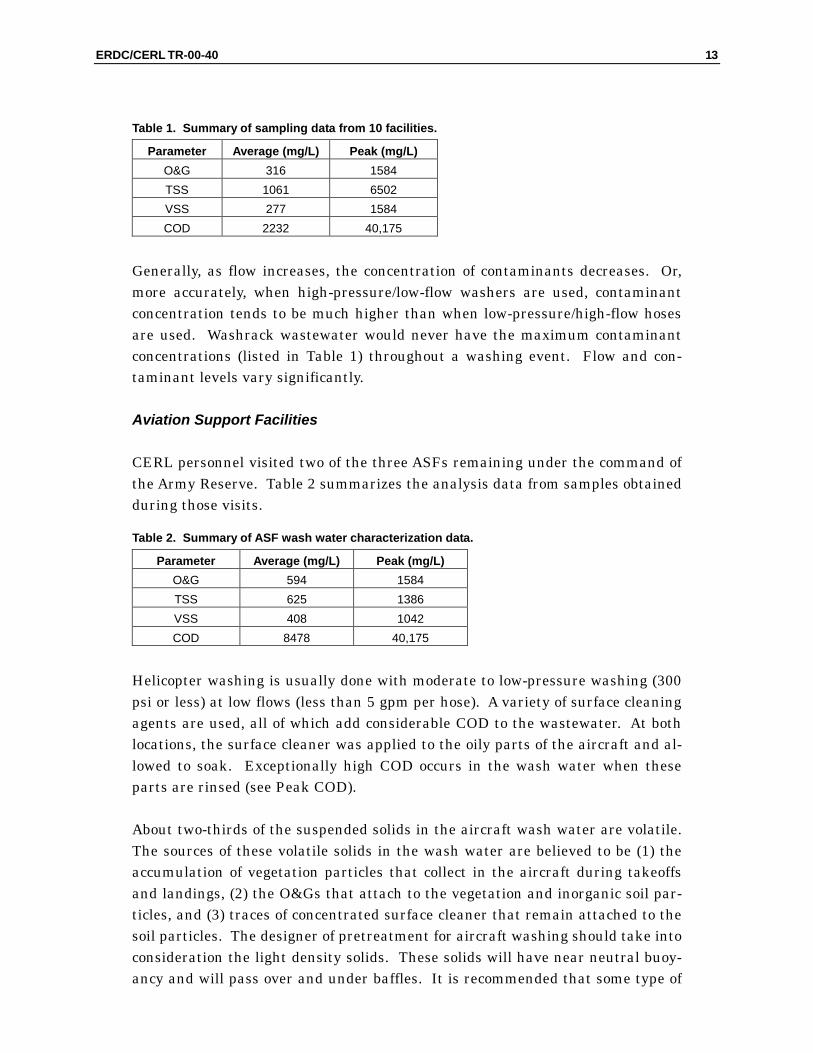
Table 1. Summary of sampling data from 10 facilities.
Parameter Average (mg/L) Peak (mg/L) O&G 316 1584 TSS 1061 6502 VSS 277 1584 COD 2232 40,175
Generally, as flow increases, the concentration of contaminants decreases. Or, more accurately, when high-pressure/low-flow washers are used, contaminant concentration tends to be much higher than when low-pressure/high-flow hoses are used. Washrack wastewater would never have the maximum contaminant concentrations (listed in Table 1) throughout a washing event. Flow and con-taminant levels vary significantly.
Aviation Support Facilities
CERL personnel visited two of the three ASFs remaining under the command of the Army Reserve. Table 2 summarizes the analysis data from samples obtained during those visits.
Table 2. Summary of ASF wash water characterization data.
Parameter Average (mg/L) Peak (mg/L) O&G 594 1584 TSS 625 1386 VSS 408 1042 COD 8478 40,175
Helicopter washing is usually done with moderate to low-pressure washing (300 psi or less) at low flows (less than 5 gpm per hose). A variety of surface cleaning agents are used, all of which add considerable COD to the wastewater. At both locations, the surface cleaner was applied to the oily parts of the aircraft and al-lowed to soak. Exceptionally high COD occurs in the wash water when these parts are rinsed (see Peak COD).
About two-thirds of the suspended solids in the aircraft wash water are volatile. The sources of these volatile solids in the wash water are believed to be (1) the accumulation of vegetation particles that collect in the aircraft during takeoffs and landings, (2) the O&Gs that attach to the vegetation and inorganic soil par-ticles, and (3) traces of concentrated surface cleaner that remain attached to the soil particles. The designer of pretreatment for aircraft washing should take into consideration the light density solids. These solids will have near neutral buoy-ancy and will pass over and under baffles. It is recommended that some type of
14 ERDC/CERL TR-00-40
screening be used to remove these solids from the waste stream. Such a screen could help protect coalescer surfaces in upstream oil/water separators from clog-ging. Screens would also benefit pretreatment at ground vehicle washracks where vehicle exteriors are washed.
Area Maintenance Support Activities
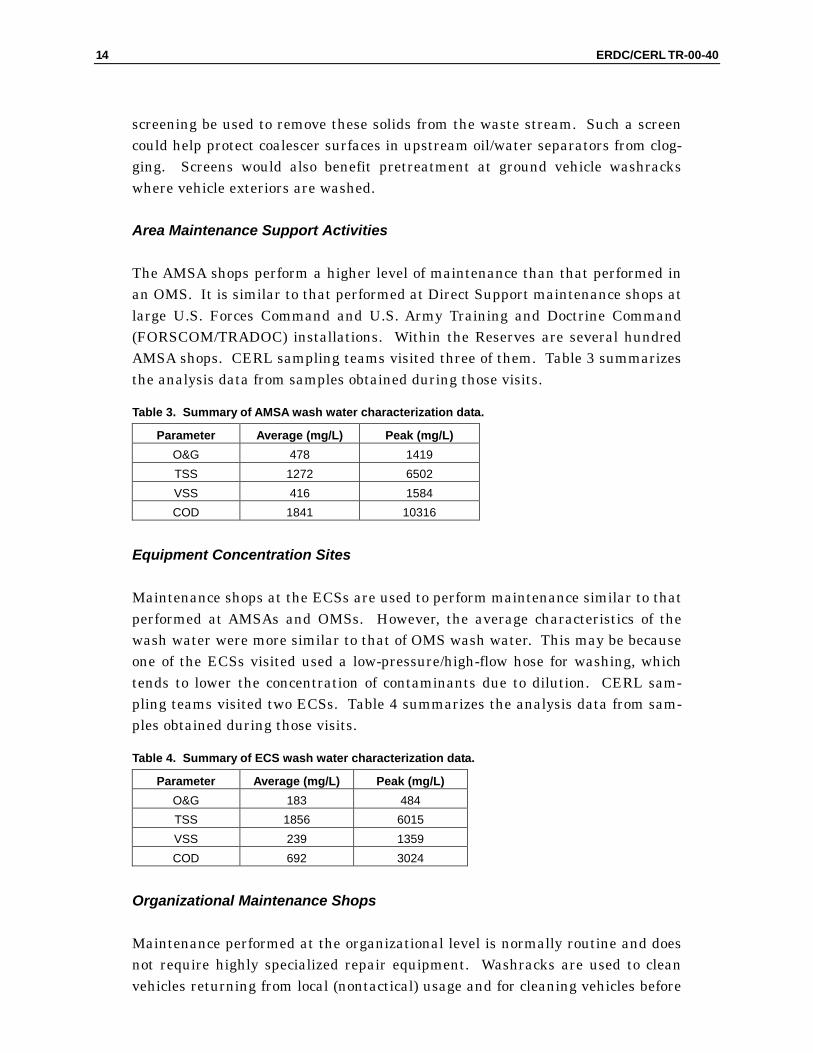
The AMSA shops perform a higher level of maintenance than that performed in an OMS. It is similar to that performed at Direct Support maintenance shops at large U.S. Forces Command and U.S. Army Training and Doctrine Command (FORSCOM/TRADOC) installations. Within the Reserves are several hundred AMSA shops. CERL sampling teams visited three of them. Table 3 summarizes the analysis data from samples obtained during those visits.
Table 3. Summary of AMSA wash water characterization data.
Parameter Average (mg/L) Peak (mg/L) O&G 478 1419 TSS 1272 6502 VSS 416 1584 COD 1841 10316
Equipment Concentration Sites
Maintenance shops at the ECSs are used to perform maintenance similar to that performed at AMSAs and OMSs. However, the average characteristics of the wash water were more similar to that of OMS wash water. This may be because one of the ECSs visited used a low-pressure/high-flow hose for washing, which tends to lower the concentration of contaminants due to dilution. CERL sam-pling teams visited two ECSs. Table 4 summarizes the analysis data from sam-ples obtained during those visits.
Table 4. Summary of ECS wash water characterization data.
Parameter Average (mg/L) Peak (mg/L) O&G 183 484 TSS 1856 6015 VSS 239 1359 COD 692 3024
Organizational Maintenance Shops
Maintenance performed at the organizational level is normally routine and does not require highly specialized repair equipment. Washracks are used to clean vehicles returning from local (nontactical) usage and for cleaning vehicles before
ERDC/CERL TR-00-40 15
they are sent to an AMSA or Depot for more intensive repair or rebuilding. There are more than 1000 Army Reserve Centers (ARCs), most of which have an OMS. CERL sampling teams visited three OMSs. Table 5 summarizes the analysis data from samples obtained during those visits.
The vehicles washed at the OMSs visited were not very dirty, but this seems to be typical of the soiling on vehicles washed at OMSs. Soaps and surface cleaners are seldom used and should not be used.
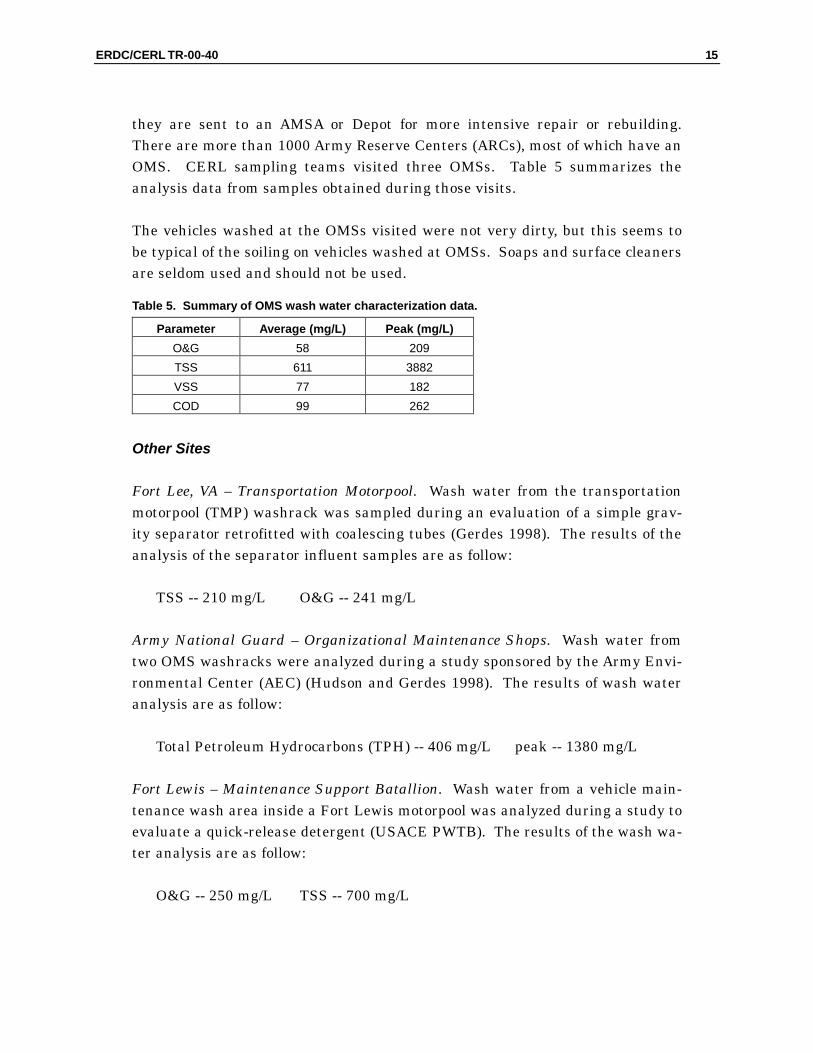
Table 5. Summary of OMS wash water characterization data.
Parameter Average (mg/L) Peak (mg/L) O&G 58 209 TSS 611 3882 VSS 77 182 COD 99 262
Other Sites
Fort Lee, VA – Transportation Motorpool. Wash water from the transportation motorpool (TMP) washrack was sampled during an evaluation of a simple grav-ity separator retrofitted with coalescing tubes (Gerdes 1998). The results of the analysis of the separator influent samples are as follow:
TSS -- 210 mg/L O&G -- 241 mg/L
Army National Guard – Organizational Maintenance Shops. Wash water from two OMS washracks were analyzed during a study sponsored by the Army Envi-ronmental Center (AEC) (Hudson and Gerdes 1998). The results of wash water analysis are as follow:
Total Petroleum Hydrocarbons (TPH) -- 406 mg/L peak -- 1380 mg/L
Fort Lewis – Maintenance Support Batallion. Wash water from a vehicle main-tenance wash area inside a Fort Lewis motorpool was analyzed during a study to evaluate a quick-release detergent (USACE PWTB). The results of the wash wa-ter analysis are as follow:
O&G -- 250 mg/L TSS -- 700 mg/L
16 ERDC/CERL TR-00-40
Summary
All of the values reported in this chapter (except peak values) are averages of the analyses of several samples taken over the course of one or more vehicle washing events. It is obvious that Army wash water contains a wide range in the concen-trations of O&G and TSS. The average concentration of O&G at the different types of washracks ranged from 58 mg/L to 594 mg/L. The peak concentrations measured ranged from 209 mg/L to 1584 mg/L. Average TSS concentrations ranged from 210 mg/L to 1272 mg/L. Peak TSS concentrations ranged from 1386 mg/L to 6502 mg/L.
ERDC/CERL TR-00-40 17
3 Treatability Study
Experiment Design
The overall purpose of the experiment was to determine how well various con-figurations of coalescers could treat fabricated Army wash water, and more spe-cifically, to determine if buildup of solids within the coalescer structure would negatively affect performance. Such a study has numerous parameters (i.e., con-centration of O&G, concentration of TSS, coalescer material, incline angle of coa-lescer surfaces, coalescer surface spacing, surface loading rate of the wash water, water temperature, and duration of the test runs). The resources available to the project limited the number of experimental configurations. Configurations were selected that would most efficiently achieve the goals of the project.
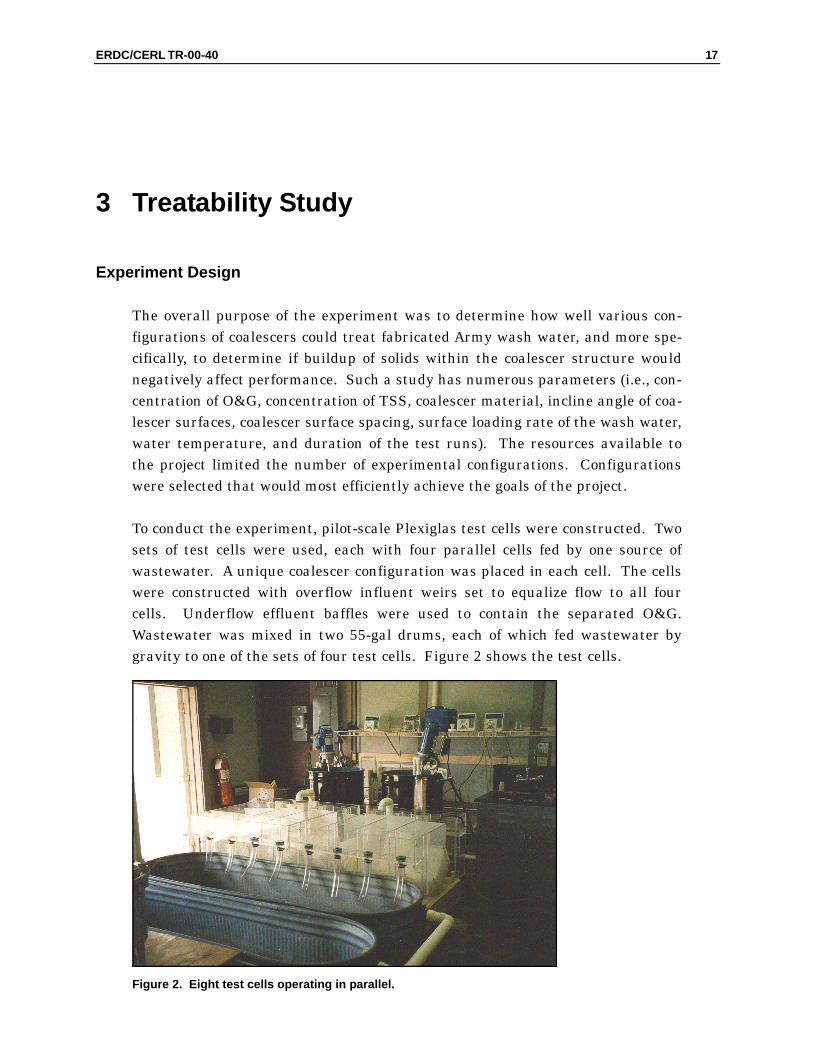
To conduct the experiment, pilot-scale Plexiglas test cells were constructed. Two sets of test cells were used, each with four parallel cells fed by one source of wastewater. A unique coalescer configuration was placed in each cell. The cells were constructed with overflow influent weirs set to equalize flow to all four cells. Underflow effluent baffles were used to contain the separated O&G. Wastewater was mixed in two 55-gal drums, each of which fed wastewater by gravity to one of the sets of four test cells. Figure 2 shows the test cells.
Figure 2. Eight test cells operating in parallel.
18 ERDC/CERL TR-00-40
Contaminants
The concentrations of O&G and TSS were not variable parameters during the study, and were kept as constant as possible. Instead, contaminant levels were used that represented the upper range of the levels measured during the charac-terization study. The concentration of oil in the test cell influent was kept close to the range of 450 to 500 mg/L. No attempt was made to keep the concentration of oil in the test cell influent constant, as a variable concentration was more rep-resentative of Army washrack wastewater. Used oil from Army maintenance shops, primarily a mixture of motor oil and hydraulic oil, was used when mixing the fabricated wastewater.
The concentration of TSS was kept close to a range of 150 to 250 mg/L. That con-centration is lower than what was measured during the characterization study. More than half of the solids in wash water are larger particles that tend to settle out in a grit basin or at the head end of a separator, and do not pass through the coalescer. Only fine silt and clay particles were mixed in the fabricated wastewater influent. Sediment from the effluent end of a centralized wash facility sedimentation basin was used as the source.
Clean tap water, oil, and a sediment slurry were fed into a mixing barrel to cre-ate the wastewater for the test cell experiments. As the components were fed into the barrel, they were constantly mixed with a motorized propeller. The wastewater overflowed by gravity into a trough, from which the wastewater passed over weirs into the individual test cells. Tap water flow into the mixing drum was constantly measured with a flow meter. Flow from each test cell was periodically measured manually. The oil and sediment were fed using parastallic metering pumps.
Coalescer Material
Two materials were used for the parallel plate coalescers — polypropylene and high density polyethylene. Polypropylene is the more oleophilic of the two plas-tics, and seems to be the most commonly used material in off-the-shelf oil/water separators. Some people in the industry believe that polypropylene is too oleo-philic and does not allow oil to migrate to the water surface. Polyethylene, an-other commonly used material, was chosen as an alternative material for com-parison.
ERDC/CERL TR-00-40 19
Coalescing Plate Angle of Incline
Separator manufacturers commonly use two angles of incline to the horizontal — 45 and 60 degrees. These two angles were used for most of the test cell configu-rations. The 45-degree angle was used in two configurations — one with the plates at a 45-degree angle to the horizontal inlet-to-outlet axis; and the other with the plates parallel to the horizontal inlet-to-outlet axis (looking like an in-verted V). During the first test period, one test cell had vertical plates parallel to the horizontal flow. During the second test period, two cells purchased for test-ing were configured with a waffle-shaped polyethylene coalescer, a proprietary design of Landa Water Cleaning Systems (Camas, WA).
Water Temperature
Due to resource restraints, water temperature was not used as a variable. Be-cause of the design of the wastewater mixing apparatus, the temperature of the test cell influent was consistent for all cells. The temperature in the test cells was close to that of the cold tap water source, and was assumed to be representa-tive of the water temperature at most outdoor Army washracks.
Configurations
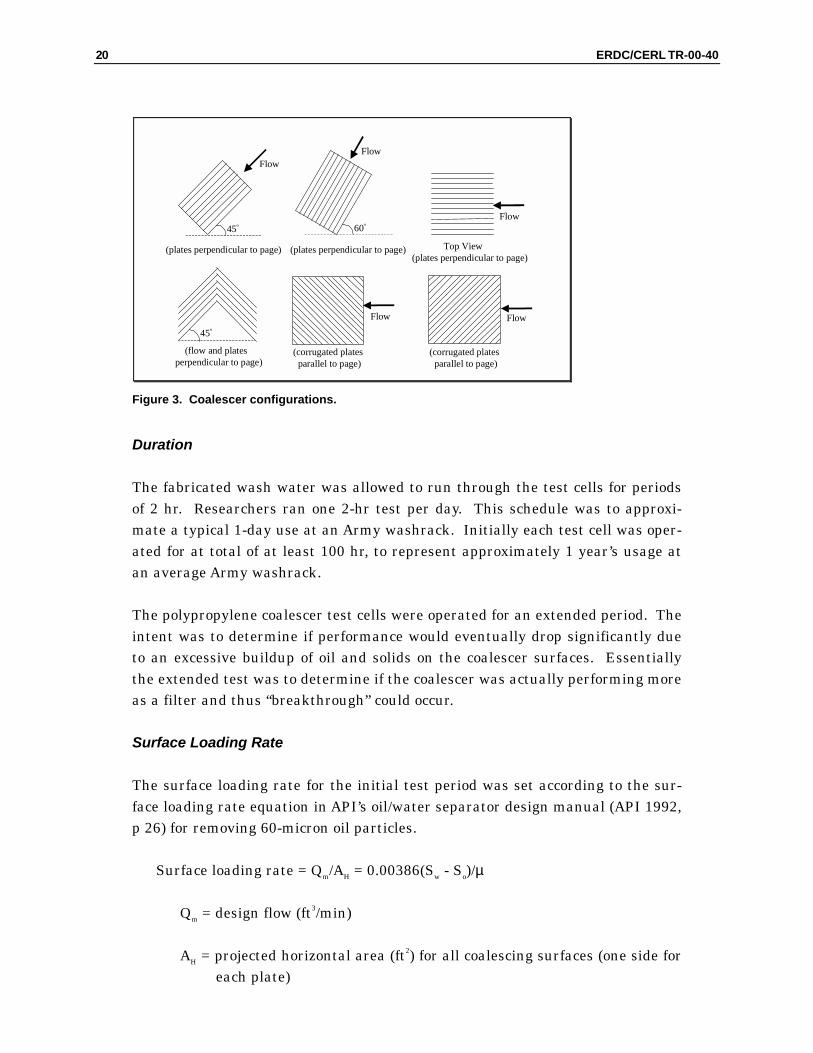
Figure 3 shows the six basic configurations used during this study. The plate positioning and flow direction of the individual test cells were as follows:
Polypropylene – 45o – Downward flow
Polyethylene – 45o – Downward flow
Polypropylene – 60o – Downward flow
Polyethylene – 60o – Downward flow
Polypropylene – 45o – Horizontal flow
Polyethylene – 45o – Horizontal flow
Polypropylene – 90o – Horizontal flow
Polyethylene – 90o – Horizontal flow
Landa waffle – angled ribs slanted toward the horizontal flow
Landa waffle – angled ribs slanted away from the horizontal flow
20 ERDC/CERL TR-00-40
Top View (plates perpendicular to page)
Flow
(corrugated plates parallel to page)
Flow
(corrugated plates parallel to page)
Flow
(plates perpendicular to page)
Flow
45º
(plates perpendicular to page)
Flow
60º
(flow and plates perpendicular to page)
45º
Figure 3. Coalescer configurations.
Duration
The fabricated wash water was allowed to run through the test cells for periods of 2 hr. Researchers ran one 2-hr test per day. This schedule was to approxi-mate a typical 1-day use at an Army washrack. Initially each test cell was oper-ated for at total of at least 100 hr, to represent approximately 1 year’s usage at an average Army washrack.
The polypropylene coalescer test cells were operated for an extended period. The intent was to determine if performance would eventually drop significantly due to an excessive buildup of oil and solids on the coalescer surfaces. Essentially the extended test was to determine if the coalescer was actually performing more as a filter and thus “breakthrough” could occur.
Surface Loading Rate
The surface loading rate for the initial test period was set according to the sur-face loading rate equation in API’s oil/water separator design manual (API 1992, p 26) for removing 60-micron oil particles.
Surface loading rate = Qm/AH = 0.00386(Sw - So)/µ
Qm = design flow (ft3/min)
AH = projected horizontal area (ft2) for all coalescing surfaces (one side for each plate)
ERDC/CERL TR-00-40 21
Sw = specific gravity of water
So = specific gravity of oil
µ = wastewater viscosity in poise
Design flow was set at 1.5 gpm (0.20 cfm) for each test cell. The projected hori-zontal area for the coalescer material in each test cell was approximately 4.08 ft2. The surface loading rate for the first test period was 0.37 gpm/ft2 (0.05 cfm/ft2). Surface loading rates of 0.25 gpm/ft2 and 0.49 gpm/ft2 were used for a few of the configurations in a later test period.
Sampling and Analysis
Influent and effluent composite samples were taken after every fifth 2-hr test cell operation run (i.e., after 10 hr of operation). Samples were taken more fre-quently at the beginning of each test cell experiment to adjust the contaminant feed pumps and establish the desired contaminant levels in the fabricated wash water. TSS analysis was done according to Standard Methods. Analysis for O&G was done according to a variation of EPA Method 1664, Revision A, devel-oped by 3M Company and sanctioned by the U.S. Environmental Protection Agency (USEPA). An independent study has shown that this test has equivalent or greater accuracy than the original Method 1664.
Test Start-up
At the beginning of each experiment, the coalescer material in each test cell was coated with oil. The intent was to “season” the surfaces in order to eliminate the initial period of oil accumulation, and thus allow oil removal in the test cells to achieve a steady state more quickly.
Results
Graphs showing all results of the test cell sampling analysis are shown in the appendix. The following paragraphs describe CERL’s interpretation of that data.
Oil and Grease Removal
During the first 100 hr of operation, the down-flow, 45 degree, polypropylene plates provided the best effluent quality at the overflow rate of 0.37 gpm/ft2. However, the oil concentration in the test cell influent was over 50 mg/L less
22 ERDC/CERL TR-00-40
than for the polyethylene test cells. During the second 100 hr of operation, the concentration of oil in the influent to the polypropylene plate cells was closer to the level going to the polyethylene plate test cells, and performance dropped be-low that of the down-flow, 60-degree, polyethylene.
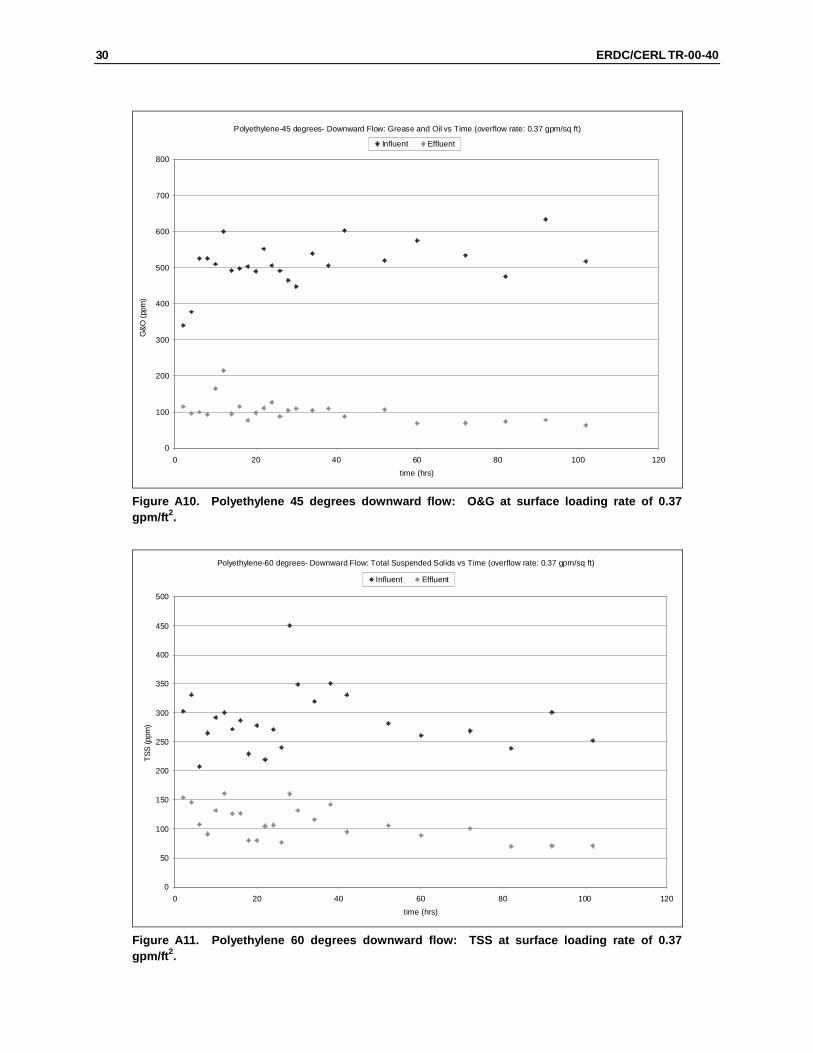
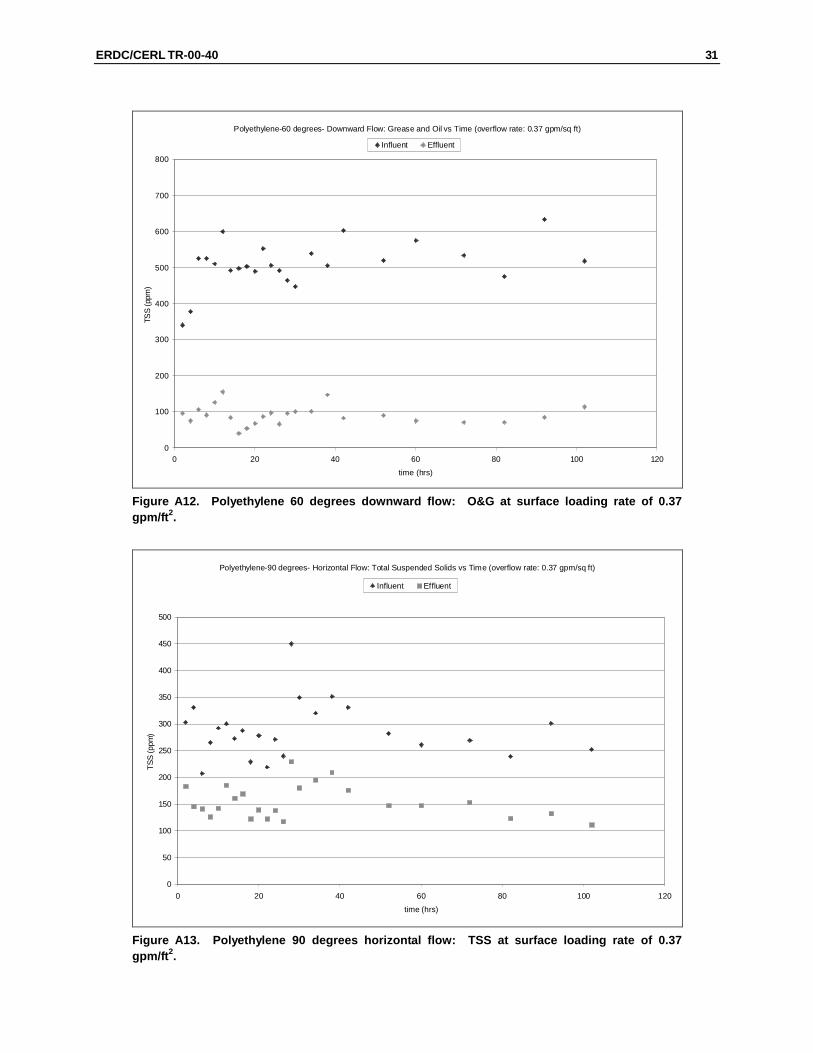
Only the 60-degree down-flow configuration of the polyethylene plates provided consistent treatment performance in achieving the target effluent level of 100 mg/L oil at the surface loading rate of 0.37 gpm/ft2. However, at a surface load-ing rate of 0.25 gpm/ft2, both the 45- and 60-degree, down-flow, polypropylene configurations provided consistent, acceptable treatment.
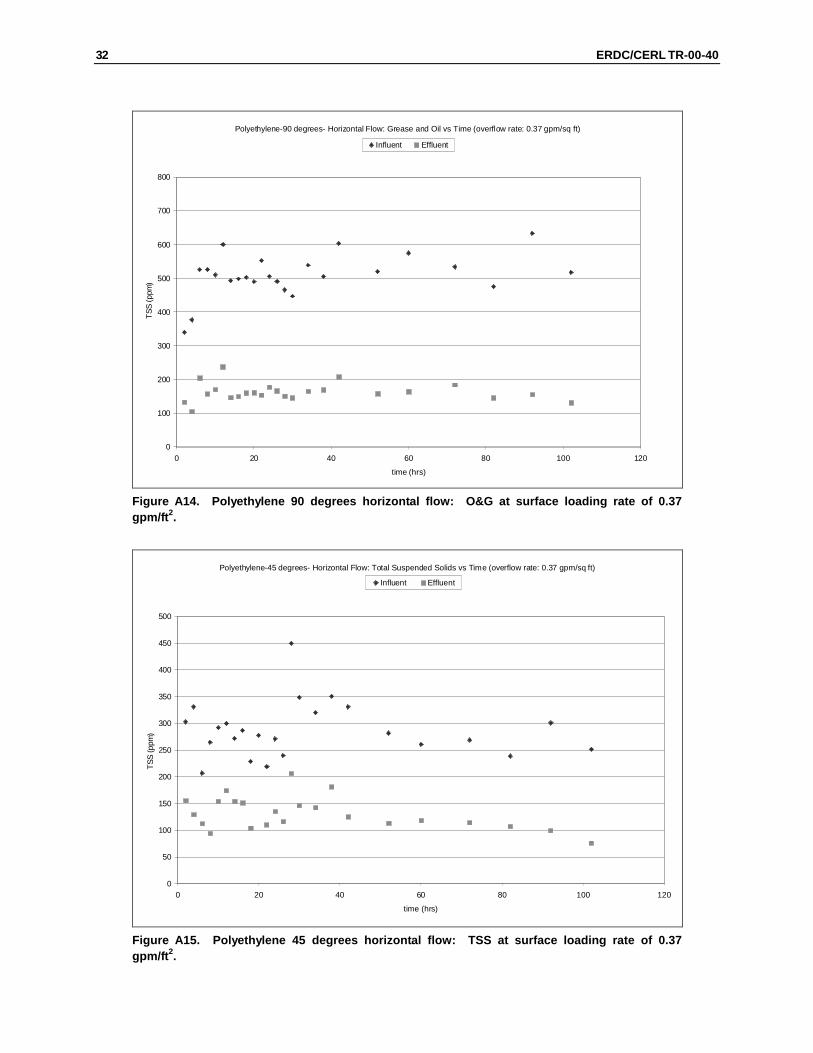
Polyethylene appeared to be the better of the two coalescer materials. There are other materials that could not be tested, however, due to limited resources, and it is possible that some of those perform as well or better than polyethylene.
Sediment Accumulation
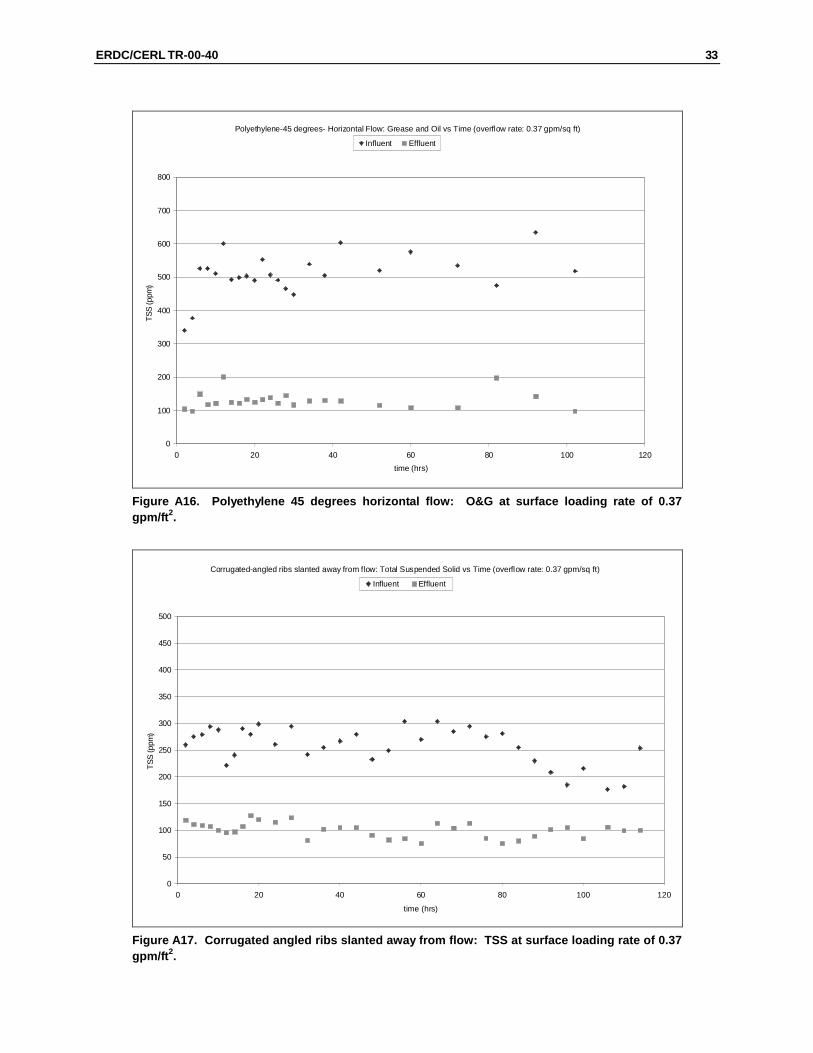
There was no visual evidence that sediment accumulation on the surface of the coalescer plates would have caused interference with the performance of the test cells. Sediment coated the top surface of each of the coalescer plates, but ap-peared to migrate to the bottom of the separation chamber before reaching a thickness of 0.1 in. The concentration of TSS in the effluent remained fairly con-stant for all configurations, and seemed to decrease slightly over time for a few of the configurations during the test period.
ERDC/CERL TR-00-40 23
4 Conclusions and Recommendations
Conclusions
1. The test cell configuration with polyethylene plates installed at a 60-degree angle and having a downward flow seemed to provide the best treatment at the loading rate of 0.37 gpm/ft2.
2. There was no evidence that, during the normal operation of an oil/water separator, a layer of sediment would collect on coalescer plates at a thickness that would interfere with flow through the coalescer, assuming the plate spacing was at least 0.75 in.
Recommendations
1. When specifying off-the-shelf, coalescing, oil/water separators, recommend the following:
• Coalescer plate material: Polyethylene
• Maximum surface loading rate: 0.37 gpm/ft2
• Coalescer plate angle: 60 degrees
• Direction of flow: Downward at 60 degrees to the horizontal
2. Coalescing separator designs must provide storage for solids removed within the coalescer.
24 ERDC/CERL TR-00-40
References
American Petroleum Institute (API), Monographs on Refinery Environmental Control - Manage-ment of Water Discharges; Design and Operation of Oil/Water Separators, API Publication 421, First Ed., February 1990 (revised November 1992).
Brincks, Richard, “Oil/Water Separators-Design & Selection,” Environmental Technology, May/June 1996, pp 44-46.
Gerdes, Gary, Trip Report for Fort Lee, VA, 31 March 1998.
Gerdes, Gary L., “Characterization of Oil/Water Separator Influent at U.S. Army Reserve Facili-ties”, U.S. Army Construction Engineering Research Laboratory (USACERL) Letter Report (unpublished), November 1997.
Hudson, Kenneth L. and Gary L. Gerdes, A Decision Tree for Improving Washrack Oil/Water Sepa-rator Operations, USAEC Report No. SFIM-AEC-ET-R-98003, January 1998.
U. S. Army Center for Public Works, “Oil/Water Separator Selection, Installation, and Mainte-nance: Lessons Learned,” Technical Bulletin No. 200-1-05, 5 December 1997.
U.S. Army Corps of Engineers (USACE), “Selection and Design of Oil/Water Separators at Army Facilities,” Technical Letter No. 1110-3-466, 26 August 1994.
USACE, “Effect of Quick Release Detergent on Oil/Water Separators,” Public Works Technical Bul-letin 420-49-28 (pending).
ERDC/CERL TR-00-40 25
Appendix: Results of Test Cell Sampling
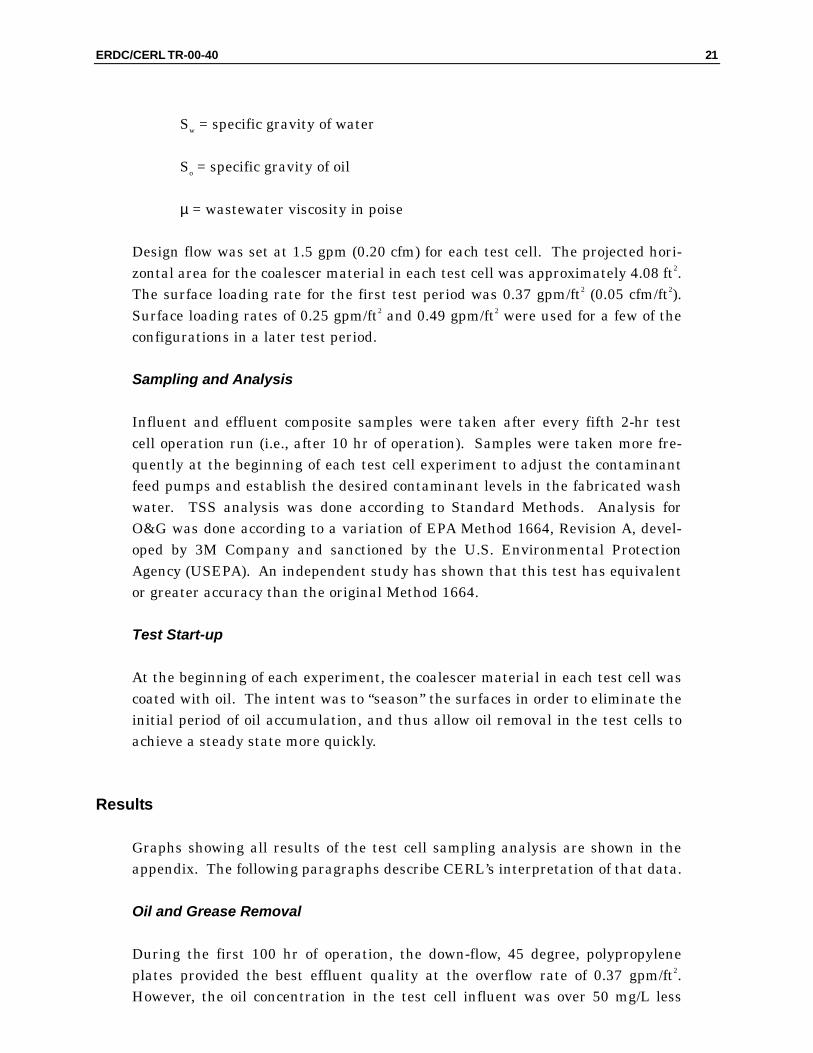
Polypropylene-45 degrees- Downward Flow: Total Suspended Solids vs Time (overflow rate: 0.37 gpm/sq ft)
0
50
100
150
200
250
300
350
400
450
500
0 20 40 60 80 100 120 140 160 180 200
time (hrs)
TSS
(ppm
)
Influent Effluent
Figure A1. Polypropylene 45 degrees downward flow: TSS at surface loading rate of 0.37 gpm/ft2.
26 ERDC/CERL TR-00-40
Polypropylene-45 degrees- Downward Flow: Grease and Oil vs Time (overflow rate: 0.37 gpm/sq ft)
0
100
200
300
400
500
600
700
800
0 20 40 60 80 100 120 140 160 180 200
time (hrs)
G&O
(ppm
)Influent Effluent
Figure A2. Polypropylene 45 degrees downward flow: O&G at surface loading rate of 0.37 gpm/ft2.
Polypropylene-60 degrees- Downward Flow: Total Suspended Solids vs Time (overflow rate: 0.37 gpm/sq ft)
0
50
100
150
200
250
300
350
400
450
500
0 20 40 60 80 100 120 140 160 180 200
time (hrs)
TSS
(ppm
)
Influent Effluent
Figure A3. Polypropylene 60 degrees downward flow: TSS at surface loading rate of 0.37 gpm/ft2.
ERDC/CERL TR-00-40 27
Polypropylene-60 degrees- Downward Flow: Grease and Oil vs Time (overflow rate: 0.37 gpm/sq ft)
0
100
200
300
400
500
600
700
800
0 20 40 60 80 100 120 140 160 180 200time (hrs)
G&O
(ppm
)Influent Effluent
Figure A4. Polypropylene 60 degrees downward flow: O&G at surface loading rate of 0.37 gpm/ft2.
Polypropylene-90 degrees- Horizontal Flow: Total Suspended Solids vs Time (overflow rate: 0.37 gpm/sq ft)
0
50
100
150
200
250
300
350
400
450
500
0 20 40 60 80 100 120time (hrs)
TSS
(ppm
)
Influent Effluent
Figure A5. Polypropylene 90 degrees horizontal flow: TSS at surface loading rate of 0.37 gpm/ft2.
28 ERDC/CERL TR-00-40
Polypropylene-90 degrees- Horizontal Flow: Grease and Oil vs Time (overflow rate: 0.37 gpm/sq ft)
0
100
200
300
400
500
600
700
800
0 20 40 60 80 100 120time (hrs)
G&O
(ppm
)Influent Effluent
Figure A6. Polypropylene 90 degrees horizontal flow: O&G at surface loading rate of 0.37 gpm/ft2.
Polypropylene-45 degrees- Horizontal Flow: Total Suspended Solids vs Time (overflow rate: 0.37 gpm/sq ft)
0
50
100
150
200
250
300
350
400
450
500
0 20 40 60 80 100 120time (hrs)
TSS
(ppm
)
Influent Effluent
Figure A7. Polypropylene 45 degrees horizontal flow: TSS at surface loading rate of 0.37 gpm/ft2.
ERDC/CERL TR-00-40 29
Polypropylene-45 degrees- Horizontal Flow: Grease and Oil vs Time (overflow rate: 0.37 gpm/sq ft)
0
100
200
300
400
500
600
700
800
0 20 40 60 80 100 120time (hrs)
G&O
(ppm
)Influent Effluent
Figure A8. Polypropylene 45 degrees horizontal flow: O&G at surface loading rate of 0.37 gpm/ft2.
Polyethylene-45 degrees- Downward Flow: Total Suspended Solids vs Time (overflow rate: 0.37 gpm/sq ft)
0
50
100
150
200
250
300
350
400
450
500
0 20 40 60 80 100 120time (hrs)
TSS
(ppm
)
Influent Effluent
Figure A9. Polyethylene 45 degrees downward flow: TSS at surface loading rate of 0.37 gpm/ft2.
30 ERDC/CERL TR-00-40
Polyethylene-45 degrees- Downward Flow: Grease and Oil vs Time (overflow rate: 0.37 gpm/sq ft)
0
100
200
300
400
500
600
700
800
0 20 40 60 80 100 120time (hrs)
G&O
(ppm
)Influent Effluent
Figure A10. Polyethylene 45 degrees downward flow: O&G at surface loading rate of 0.37 gpm/ft2.
Polyethylene-60 degrees- Downward Flow: Total Suspended Solids vs Time (overflow rate: 0.37 gpm/sq ft)
0
50
100
150
200
250
300
350
400
450
500
0 20 40 60 80 100 120time (hrs)
TSS
(ppm
)
Influent Effluent
Figure A11. Polyethylene 60 degrees downward flow: TSS at surface loading rate of 0.37 gpm/ft2.
ERDC/CERL TR-00-40 31
Polyethylene-60 degrees- Downward Flow: Grease and Oil vs Time (overflow rate: 0.37 gpm/sq ft)
0
100
200
300
400
500
600
700
800
0 20 40 60 80 100 120time (hrs)
TSS
(ppm
)Influent Effluent
Figure A12. Polyethylene 60 degrees downward flow: O&G at surface loading rate of 0.37 gpm/ft2.
Polyethylene-90 degrees- Horizontal Flow: Total Suspended Solids vs Time (overflow rate: 0.37 gpm/sq ft)
0
50
100
150
200
250
300
350
400
450
500
0 20 40 60 80 100 120time (hrs)
TSS
(ppm
)
Influent Effluent
Figure A13. Polyethylene 90 degrees horizontal flow: TSS at surface loading rate of 0.37 gpm/ft2.
32 ERDC/CERL TR-00-40
Polyethylene-90 degrees- Horizontal Flow: Grease and Oil vs Time (overflow rate: 0.37 gpm/sq ft)
0
100
200
300
400
500
600
700
800
0 20 40 60 80 100 120
time (hrs)
TSS
(ppm
)Influent Effluent
Figure A14. Polyethylene 90 degrees horizontal flow: O&G at surface loading rate of 0.37 gpm/ft2.
Polyethylene-45 degrees- Horizontal Flow: Total Suspended Solids vs Time (overflow rate: 0.37 gpm/sq ft)
0
50
100
150
200
250
300
350
400
450
500
0 20 40 60 80 100 120
time (hrs)
TSS
(ppm
)
Influent Effluent
Figure A15. Polyethylene 45 degrees horizontal flow: TSS at surface loading rate of 0.37 gpm/ft2.
ERDC/CERL TR-00-40 33
Polyethylene-45 degrees- Horizontal Flow: Grease and Oil vs Time (overflow rate: 0.37 gpm/sq ft)
0
100
200
300
400
500
600
700
800
0 20 40 60 80 100 120time (hrs)
TSS
(ppm
)Influent Effluent
Figure A16. Polyethylene 45 degrees horizontal flow: O&G at surface loading rate of 0.37 gpm/ft2.
Corrugated-angled ribs slanted away from flow: Total Suspended Solid vs Time (overflow rate: 0.37 gpm/sq ft)
0
50
100
150
200
250
300
350
400
450
500
0 20 40 60 80 100 120
time (hrs)
TSS
(ppm
)
Influent Effluent
Figure A17. Corrugated angled ribs slanted away from flow: TSS at surface loading rate of 0.37 gpm/ft2.

34 ERDC/CERL TR-00-40
Corrugated-angled ribs slanted away from flow: Grease and Oil vs Time (overflow rate: 0.37 gpm/sq ft)
0
100
200
300
400
500
600
700
800
0 20 40 60 80 100 120
time (hrs)
G&O
(ppm
)Influent Effluent
Figure A18. Corrugated angled ribs slanted away from flow: O&G at surface loading rate of 0.37 gpm/ft2.
Corrugated-angled ribs slanted toward flow: Total Suspended Solids vs Time (overflow rate: 0.37 gpm/sq ft)
0
50
100
150
200
250
300
350
400
450
500
0 20 40 60 80 100 120time (hrs)
TSS
(ppm
)
Influent Effluent
Figure A19. Corrugated angled ribs slanted toward flow: TSS at surface loading rate of 0.37 gpm/ft2.
ERDC/CERL TR-00-40 35
Corrugated-angled ribs slanted toward flow: Grease and Oil vs Time (overflow rate: 0.37 gpm/sq ft)
0
100
200
300
400
500
600
700
800
0 20 40 60 80 100 120
time (hrs)
G&O
(ppm
)Influent Effluent
Figure A20. Corrugated angled ribs slanted toward flow: O&G at surface loading rate of 0.37 gpm/ft2.
Corrugated-angled ribs slanted away from flow: Total Suspended Solids vs Time (overflow rate: 0.25 gpm/sq ft)
0
50
100
150
200
250
300
350
400
450
500
0 10 20 30 40 50 60 70
time (hrs)
TSS
(ppm
)
Influent Effluent
Figure A21. Corrugated angled ribs slanted away from flow: TSS at surface loading rate of 0.25 gpm/ft2.
36 ERDC/CERL TR-00-40
Corrugated-angled ribs slanted away from flow: Grease and Oil vs Time (overflow rate: 0.25 gpm/sq ft)
0
100
200
300
400
500
600
700
800
0 10 20 30 40 50 60 70
time (hrs)
G&O
(ppm
)
Influent Effluent
Figure A22. Corrugated angled ribs slanted away from flow: O&G at surface loading rate of 0.25 gpm/ft2.
Corrugated-angled ribs slanted toward flow: Total Suspended Solids vs Time (overflow rate: 0.25 gpm/sq ft)
0
50
100
150
200
250
300
350
400
450
500
0 10 20 30 40 50 60 70
time (hrs)
TSS
(ppm
)
Influent Effluent
Figure A23. Corrugated angled ribs slanted toward flow: TSS at surface loading rate of 0.25 gpm/ft2.
ERDC/CERL TR-00-40 37
Corrugated-angled ribs slanted toward flow: Grease and Oil vs Time (overflow rate: 0.25 gpm/sq ft)
0
100
200
300
400
500
600
700
800
0 10 20 30 40 50 60 70
time (hrs)
G&O
(ppm
)
Influent Effluent
Figure A24. Corrugated angled ribs slanted toward flow: O&G at surface loading rate of 0.25 gpm/ft2.
Corrugated-angled ribs slanted away from flow: Total Suspended Solids vs Time (overflow rate: 0.49 gpm/sq ft)
0
50
100
150
200
250
300
350
400
450
500
0 5 10 15 20 25 30 35 40time (hrs)
TSS
(ppm
)
Influent Effluent
Figure A25. Corrugated angled ribs slanted away from flow: TSS at surface loading rate of 0.49 gpm/ft2.
38 ERDC/CERL TR-00-40
Corrugated-angled ribs slanted away from flow: Grease and Oil vs Time (overflow rate: 0.49 gpm/sq ft)
0
100
200
300
400
500
600
700
800
0 5 10 15 20 25 30 35 40
time (hrs)
G&O
(ppm
)
Influent Effluent
Figure A26. Corrugated angled ribs slanted away from flow: O&G at surface loading rate of 0.49 gpm/ft2.
Corrugated-angled ribs slanted toward flow: Total Suspended Solids vs Time (overflow rate: 0.49 gpm/sq ft)
0
50
100
150
200
250
300
350
400
450
500
0 5 10 15 20 25 30 35 40time (hrs)
TSS
(ppm
)
Influent Effluent
Figure A27. Corrugated angled ribs slanted toward flow: TSS at surface loading rate of 0.49 gpm/ft2.
ERDC/CERL TR-00-40 39
Corrugated-angled ribs slanted toward flow: Grease and Oil vs Time (overflow rate: 0.49 gpm/sq ft)
0
100
200
300
400
500
600
700
800
0 5 10 15 20 25 30 35 40time (hrs)
G&O
(ppm
)
Influent Effluent
Figure A28. Corrugated angled ribs slanted toward flow: O&G at surface loading rate of 0.49 gpm/ft2.
Polypropylene-45 degrees- Downward Flow: Total Suspended Solids vs Time (overflow rate: 0.25 gpm/sq ft)
0
50
100
150
200
250
300
350
400
450
500
0 5 10 15 20 25 30 35 40time (hrs)
TSS
(ppm
)
Influent Effluent
Figure A29. Polypropylene 45 degrees downward flow: TSS at surface loading rate of 0.25 gpm/ft2.
40 ERDC/CERL TR-00-40
Polypropylene-45 degrees- Downward Flow: Grease and Oil vs Time (overflow rate: 0.25 gpm/sq ft)
0
100
200
300
400
500
600
700
800
0 5 10 15 20 25 30 35 40time (hrs)
G&O
(ppm
)
Influent Effluent
Figure A30. Polypropylene 45 degrees downward flow: O&G at surface loading rate of 0.25 gpm/ft2.
Polypropylene-60 degrees- Downward Flow: Total Suspended Solids vs Time (overflow rate: 0.25 gpm/sq ft)
0
50
100
150
200
250
300
350
400
450
500
0 5 10 15 20 25 30 35 40time (hrs)
TSS
(ppm
)
Influent Effluent"
Figure A31. Polypropylene 60 degrees downward flow: TSS at surface loading rate of 0.25 gpm/ft2.
ERDC/CERL TR-00-40 41
Polypropylene-60 degrees- Downward Flow: Grease and Oil vs Time (overflow rate: 0.25 gpm/sq ft)
0
100
200
300
400
500
600
700
800
0 5 10 15 20 25 30 35 40time (hrs)
G&O
(ppm
)
Influent EFfluent
Figure A32. Polypropylene 60 degrees downward flow: O&G at surface loading rate of 0.25 gpm/ft2.
42 ERDC/CERL TR-00-40
CERL Distribution
Chief of Engineers ATTN: CEHEC-IM-LH (2) ATTN: HECSA Mailroom (2) ATTN: CECC-R ATTN: CECW-EW Engineer Research and Development Center (Libraries) ATTN: ERDC, Vicksburg, MS ATTN: Cold Regions Research, Hanover, NH ATTN: Topographic Engineering Center, Alexandria, VA Defense Tech Info Center 22304 ATTN: DTIC-O 10 6/00
REPORT DOCUMENTATION PAGE Form Approved OMB No. 0704-0188
Public reporting burden for this collection of information is estimated to average 1 hour per response, including the time for reviewing instructions, searching existing data sources, gathering and maintaining the data needed, and completing and reviewing this collection of information. Send comments regarding this burden estimate or any other aspect of this collection of information, including suggestions for reducing this burden to Department of Defense, Washington Headquarters Services, Directorate for Information Operations and Reports (0704-0188), 1215 Jefferson Davis Highway, Suite 1204, Arlington, VA 22202-4302. Respondents should be aware that notwithstanding any other provision of law, no person shall be subject to any penalty for failing to comply with a collection of information if it does not display a currently valid OMB control number. PLEASE DO NOT RETURN YOUR FORM TO THE ABOVE ADDRESS. 1. REPORT DATE (DD-MM-YYYY)
12-2000 2. REPORT TYPE
Final3. DATES COVERED (From - To)
5a. CONTRACT NUMBER 5b. GRANT NUMBER
4. TITLE AND SUBTITLE Designing Coalescing Oil/Water Separators for Use at Army Washracks
5c. PROGRAM ELEMENT NUMBER 5d. PROJECT NUMBER 62720A896 5e. TASK NUMBER
6. AUTHOR(S) Gary L. Gerdes, Angelo DeGuzman, and Jeffrey Grubich
5f. WORK UNIT NUMBER TB0 8. PERFORMING ORGANIZATION REPORT
NUMBER 7. PERFORMING ORGANIZATION NAME(S) AND ADDRESS(ES) U.S. Army Engineer Research and Development Center (ERDC) Construction Engineering Research Laboratory (CERL) P.O. Box 9005 Champaign, IL 61826-9005
ERDC/CERL TR-00-40
9. SPONSORING / MONITORING AGENCY NAME(S) AND ADDRESS(ES) 10. SPONSOR/MONITOR’S ACRONYM(S) CECW-EW U.S. Army Corps of Engineers
20 Massachusetts Avenue, NW. Washington, DC 20314-1000
11. SPONSOR/MONITOR’S REPORT NUMBER(S)
12. DISTRIBUTION / AVAILABILITY STATEMENT Approved for public release; distribution is unlimited.
13. SUPPLEMENTARY NOTES Copies are available from the National Technical Information Service, 5285 Port Royal Road, Springfield, VA 22161.
14. ABSTRACT
The U.S. Army has thousands of oil/water separators to treat wastewater from tactical vehicle washracks at active Army, Army Re-serve, and Army National Guard facilities. The Army continues to purchase and install new separators when existing separators must be replaced, and when new vehicle maintenance facilities are being constructed. Most off-the-shelf separators being installed currently are coalescing-type gravity separators.
No Army guidance exists, however, to help environmental and Directorate of Public Works personnel purchase coalescing separators that are applicable to the high solids wash water at a typical Army washrack. Because Army guidance did not exist, and vendor guid-ance is not applicable, this study was conducted so that installation personnel, as well as washrack designers, have specific guidance for the selection of off-the-shelf coalescing oil/water separators.
This research concluded in the following specifications for off-the-shelf, coalescing, oil/water separators: coalescer plate material – polyethylene; maximum surface loading rate – 0.37 gpm/ft2; coalescer plate angle – 60 degrees; direction of flow – downward at 60 degrees to the horizontal.
15. SUBJECT TERMS oil/water separators, washrack, vehicle maintenance, tactical equipment maintenance, coalescers, waste water
16. SECURITY CLASSIFICATION OF: 17. LIMITATION OF ABSTRACT
18. NUMBER OF PAGES
19a. NAME OF RESPONSIBLE PERSON Gary L. Gerdes
a. REPORT Unclassified
b. ABSTRACT Unclassified
c. THIS PAGE Unclassified
SAR
44
19b. TELEPHONE NUMBER (in-clude area code)
(217)398-5430 Standard Form 298 (Rev. 8-98) Prescribed by ANSI Std. 239.18