Embed Size (px)
Citation preview
Designing Automated Vehicle Location Systems for Archived Data Analysis
Peter G. Furth, Thea H. J. Muller, James G. Strathman, and Brendan Hemily
Automatic vehicle location (AVL) and other automated data collection
systems can provide a rich and extensive database that can be analyzed to improve transit management and performance. In the past, many such systems have failed to provide a good data archive, while others have had success. Through the use of an extensive survey and in-depth case studies of nine transit agencies, the key issues in system design that help determine whether a data collection system will provide the useful data archive that many agencies desire are examined. In issues related to
design of the data collection system itself, the focus is on five different levels of spatial detail. Issues related to database design are also discussed, as are organizational issues.
Imagine a transit agency with an automatic vehicle location (A VL) system in which buses radio in their location every minute; at the control center, service managers can see in real time how far off schedule each bus is. But this A VL system doesn't store data in a way that makes it possible to query historic data, so when management wants to know on-time performance or the running time distribution on a particular route, checkers must go out into the field. So, although an automated system is collecting data 365 days a year, management decisions are being made on the basis of meager manual samples.
This situation, unfortunately common to many U.S. cities (1), underscores the point made by Kemp (2) that off-line analysis of historic data places different demands on data systems than real-time applications. Thanks to the ongoing technology boom, automated data-gathering systems on buses are proliferating. However, their design has been dominated mostly by real-time applications such as computer-aided dispatching, "next stop" announcements, and "next arrival" displays. Technologically, those systems can be made capable of prodncing a rich and immense database on operations and passenger activity that can be analyzed off-line. However, that promise has often gone unfulfilled because planning and design for the system failed to include key features that facilitate the capture, archival, and analysis of operations data. A classic example is an A VL system that didn't archive data at all until a creative service analyst discovered that the A VL messages were being written to a temporary database (meant for diagnostic purposes) that was overwritten every
P G. Furth. Department of Civil and Environmental Engineering. 400 SN. 360 Huntington Avenue, Northeastern University. Boston, MA 02115. 1. H. J. Muller, Department of CiVil Engineering and the Geosciences. Delft University of Tech· nology. P.O, Box 5048, 2600 GA Delft, Netherlands, J. G. Strathman, Center for Urban Studies. Portland State University, Room URBN 350·C, P.O. Box 751CUS, Portland, OR 97207. B. Hemily, 107 Chester Avenue. Toronto. Ontario M4K 2Z8. Canada.
Transportation Research Record: Journal of the Transportation Research Board, No. 1887, TRB, National Research Council. Washington. D.C., 2004, pp. 62-70,
2 min. He wrote a program that copies the contents of the temporary database every 2 min to a permanent database from which trip trajectories could be reproduced (3).
Fortunately, in some cities, data archiving has been designed into the system; every day's data are archived in a convenient format and analyzed regularly to improve schedules, planning, and control policy and otherwise support a host of management functions. The goal was to identify and examine the key issues that enable an automatic data collection system to fulfill the promise of a rich archive of operations and passenger activity data that can be fruitfully used to improve transit performance and management by studying these successes-as well as some failures.
This paper begins with two sections that summarize of the state of practice based on a broad scan of the industry and case studies of nine transit agencies. Then, it addresses the most critical issue identified in this survey: the level of geographic detail of automatically collected data, which are presented in a hierarchy from eventindependent, random-location records to records that offer detail about timepoints, stops, and events between stops. A brief section summarizes current and potential uses of archived A VL and automatic passenger counter (APC) data, and finds that the more detailed levels of data are more valuable. The following three sections discuss system design issues, database design issues, and organizational issues that affect the ability of AVL and APC systems to deliver useful data and data analyses.
SURVEY OF PRACTICE
In 2001, the Transit Cooperative Research Program contracted with Northeastern University for Project H-28, Uses of Archived AVL-APC Data to Improve Transit Performance and Management, This paper is based on Phase I of that project, which concluded with an interim report (4). To survey the state of practice, that project included
• A literature search and mail survey that gathered information on AVL and APC systems (planned as well as used) at 122 U,S., 14 Canadian, and 26 European transit agencies;
• Telephone interviews with 20 U.S. and 14 Canadian agencies; • Case studies, which have been published by Furth et al. (4), of
9 transportation agencies (5 American, 2 Canadian, and 2 Dutch); and • A day-long workshop attended by representatives of9 vendors,
8 transit agencies, and several consultants and researchers.
The survey focused on which data were captured, how data capture related to system design, how data were archived and analyzed, and in what functions the data were used. The case studies were particularly informative. Objectives, constraints, practices, and experience
62
63 Furth, Mulier, Strathman, and Hemily
vary so widely around this topic that it is hard to design a survey that will capture the relevant infonnation.
ONBOARD TECHNOLOGIES
For many years, the only kinds of automated data collection systems providing both time- and location-stamped data were A VL and APC systems. They were generally stand-alone systems, each with its own location and (if available) schedule referencing system. Traditionally, A VL meant data being sent over the air through the radio system, and APC meant data being stored on board and uploaded at the end of the day. More recently, some AVL systems have begun to provide onboard data storage, and other types of automated systems have appeared that can provide much of the same kind of operations data as traditional APC and A VL systems. For example,
• Event recorder. It can be thought of as an A VL without the radio or an APC without a passenger counter. Events such as door opening and closing are recorded in an onboard computer for later analysis. The function and benefits of the event recorder system used by the Hermes agency in Eindhoven, the Netherlands, have been examined (4, 5).
• Stop announcement system. This kind of system requires a bus to know which stop it is about to serve. If the system also makes a record of the arrival and departure at each stop, it doubles as an event recorder. Installation of such a system is under way at the Chicago Transit Authority (CT A; Chicago, lllinois).
• Fare collection equipment. The latest generation of fareboxes makes time-stamped records of each transaction. To date, none has been integrated with a location system, but it is certainly technologically feasible for a system to make transaction records stamped with both time and location information. Although fare transaction records don't indicate where people exit and therefore don't permit exact knowledge of passenger load, algorithms have been developed to estimate load on the basis of historic boarding counts in the reverse direction (6). Fare media that include passenger identification permit the estimation of not only alighting location but also linked trips and transfers from information including the passenger's earlier and subsequent boarding locations and elapsed time (7). Metro Transit (Minneapolis, Minnesota) plans to integrate such asystem (based on smart cards) in 2004. As fare transaction records become a more important source of operations data, they may dampen demand for passenger counters.
" As intelligent devices are integrated on board, the distinction '. between system types (A VL, APC, or event recorder) breaks down.
Many recent installations use the "smart bus" design in which a primary onboard computer tracks location, usually using global 'positioning, so that devices such as passenger counters do not need
'their own location-tracking ability. The function of such a system . depends on which devices are attached to the onboard computer,
usually serves as event recorder. The systems of the case study sites are illustrative examples. ,
.•' The Tri-Met (Portland, Oregon) system features A VL, APC, 'event recording. Its onboard computer, supplied by the A VL
writes an event at each stop that includes stop information, "._.. 0 ••••--, latitude, door open moment, dwell (i.e., door open) dura
moment of exiting a 30-m radius around the stop, indicators of opening and lift use, and maximum speed since the previous
stop. More than one-half of the buses have passenger counters; their stop records also include on-and-off counts. Location and status are radioed to the control center on an exception basis (Le., when more than a predetermined deviation from schedule or when off route). Operator-initiated coded radio messages (e.g., "road blocked by train," "pass-up") are recorded in the onboard computer with time and location stamps. The onboard computer is also connected to a traffic signal priority request emitter, triggered only when the bus is behind schedule.
• A stop announcement system currently being installed at the CTA features event recording on all buses. On buses with passenger counters (15% of the fleet), stop event records will include onand-off counts. At the same time, an independent 1995-vintage AVL system sends radio messages every 40 to 70 s. Unfortunately, this data stream is not suitable for routine operations analysis.
• At New Jersey Transit (NJ Transit; Newark, New Jersey), an A VL vendor supplied the onboard computer with location tracking function, even though NJ Transit's system is not connected to a radio. It features event recording with passenger counts and was designed to be later integrated with the radio and other devices through a 11708 network.
• At Metro Transit, the A VL vendor supplied the onboard computer, which is connected to passenger counters (on 12% of the fleet) and the radio. The radio carries both round robin polling data (bus location when polled) and event messages, including timepoint messages. Stop messages are sent only by buses with passenger counters and only if the buses actually stop. During periods of radio failure, event messages are recorded on board, uploaded at the end of the day, and inserted into the' radio message database. The round robin polling data are saved only for incident investigation and are not prepared for routine off-line analysis.
• OC Transpo (Ottawa, Ontario, Canada) and Societe de Transport de Montreal (STM; Montreal, Quebec, Canada) have standalone APCs. King County Metro (Seattle, Washington) has both A VL and APC systems that share log-in infonnation and signposts but are otherwise independent. The A VL system sends timepoint messages as well as perfonning round robin polling; like Metro Transit, only the timepoint event messages are used for routine off-line analysis.
• The Haagsche Tramweg Maatschappij (HTM; The Hague, the Netherlands) system is like Tri-Met's, featuring onboard event recording at every stop, passenger counts on a fraction of the fleet (in this case, about 25%), radio transmission of real-time location to central control, and traffic signal priority requests.
LEVELS OF SPATIAL DETAIL
The most essential issue affecting the usefulness of an automated data collection system for off-line analysis is what data it captures. This research identified a hierarchy of levels of location detail, with five levels labeled A-E in order of increasing value and detail.
Level A: Round Robin Polling Data
Level A, the least level of detail, consists of round robin polling, the most common approach to AVL. Vehicles report their location at the moment they are polled, rather than at specific locations of interest; therefore, Level A data can be called location-at-time data. The typical polling interval is 40 to 120 s.
I
64
Level B: Timepoint Records
Level B consists of timepoint records, which, unlike Level A, contain time-at-Iocation information. To create timepoint records, the bus has to know when it leaves a timepoint. In newer A VL systems, it is done by putting intelligence on the bus; the onboard computer tracks location against a base map. King County Metro devised a clever way to get timepoint records from its older A VL system in which the central computer tracks vehicle location using signpost and odometer data received from buses. About 3 min of travel time before a timepoint, the central computer calculates and transmits to the bus the expected odometer reading at the next timepoint; when the odometer reaches that value, the bus records time and location and transmits a timepoint message.
Level C: Stop Records
Stop records are characteristic of APC and stop announcement systems but also can be made by A VL systems (without passenger counts). Systems that create stop records often include door sensors and therefore measure the times at which doors open and close. OC Transpo's APC stop records include, along with passenger counts, stop time (using odometer pulses to detect when the wheels stop and start again) and dwell time (from door opening to the last passenger detection).
Level D: Segment Performance Summary Added to Stop Record
Level D complements Level C by adding summary information about bus performance between stops. Because the segment information is summarized, this level of data lends itself to the same database structure as Level C, with one record per stop module that includes a stop and the segment preceding it. At Hermes and HTM, the on board computer notes the time at which bus speed crosses a threshold crawl speed (say, 5 km/h) and accumulates time occurring below crawl speed; the accumulated value is saved as segment delay time. Tri-Met records the maximum speed the bus attained on each segment.
Level E: Detailed Event Data
In the finest level of detail, a host of operation events are recorded. A record might be made for each door opening and closing, for crossing a crawl speed threshold or a high speed threshold, or for a heading change, as at NJ Transit. Some systems designed mainly for Level C or Level 0 data also have a learning mode that records position and heading every few seconds.
USES OF ARCHIVED DATA
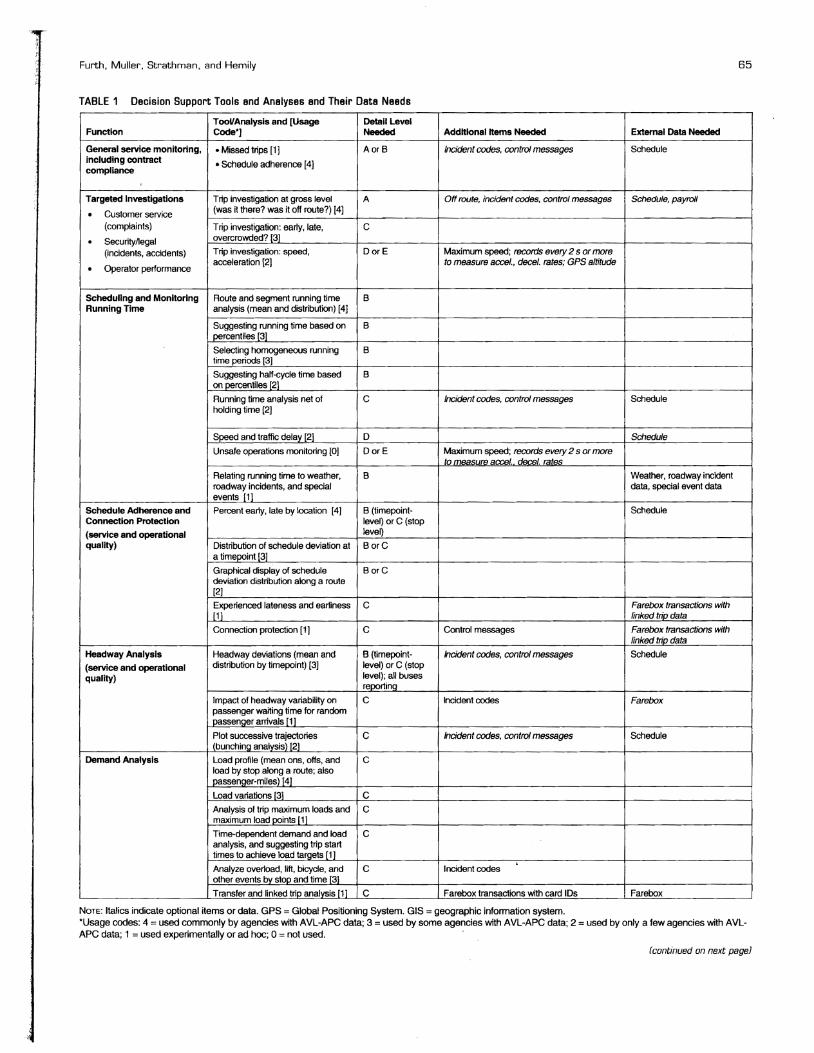
The analyses and tools that might use data related to archived location are listed in Table I. For each analysis or tool shown, the table indicates the level of spatial detail needed, the extent to which the tool is already in use, and the nonstandard data items that must also be captured. Space limitations forbid a discussion of each item; however, key items are discussed in the following section as they affect system design.
Transportation Research Record 1887
One of the key findings of this summary is the small number of analyses that can be done using Level A spatial detail and the small number requiring Level E detail. Most analyses require Level B (timepoint) or Level C (stop) data; the more complex the analysis, the greater the need for detail Levels C and D.
SYSTEM DESIGN ISSUES
Level of Spatial Detail Issues
Time-at-Location or Location-at-Time?
Location-at-time (Level A) data are fine for locating a bus in real time during an emergency; for analysis of historic data, however, they are clearly inferior to stop and timepoint records. Measuring running time and schedule adherence requires knowledge of departure time from timepoints. Polling data therefore introduces interpolation error, whose magnitude depends on the polling interval. More serious, though, is the problem of imprecise matching, particularly in periods of traffic congestion, when it can be difficult to distinguish whether a bus is reporting coordinates close to those of a stop, is in a queue waiting to reach the stop, is at the stop with its doors open, or has left the stop and is waiting in a traffic queue.
This survey did not find any transit agency routinely using Level A data for operation analyses. Researchers used such a data stream from Ann Arbor, Michigan, for some operational analyses (8), but the process of going from raw poll messages to trajectories matched to route and schedule was too involved to become routine. As mentioned, the three case study agencies with round robin polling data do not use it off-line except for incident investigation using playback. King County Metro's AVL enhancement to enable Level B data has been enthusiastically received by staff members in scheduling and in service analysis who use the timepoint data to analyze running time and on-time performance. Also, these surveys indicate that all of the traditional A VL suppliers, even if they still use polling to support real-time applications, include timepoint records in their data streams as well.
However, a relatively new entry to the market is stand-alone "next arrival" systems that track bus location using polling. Like earlier A VL systems, they are designed around a real-time application, and according to the vendor interviewed, they use polling data because it minimizes the amount of equipment installed in the vehicles, making the system less expensive. This vendor claims to have obtained good test results using the data stream for off-line analysis of on-time performance. The data stream includes predicted arrival time (based on the vendor's proprietary algorithms), and it stands to reason that as buses get closer to a stop, predicted arrival time should become rather accurate, especially if the polling cycle is short, because predicting arrival time is their core business. However, given the limitations of the data stream, some interpolation (or, in this case, extrapolation) error is bound to persist, and identifying arrival or departure time when traffic congestion can slow service to a crawl near bus stops is likely to remain a problem. "
Time- and distance-based records can be useful as a supplement to stop-level records to help understand what is going on between stops when the time between stops is large. For example, OC Transpo logs an "idle time" event when a bus has not moved for 45 s; it helps identify points of serious traffic delay and gives positive information about layover processes. At King County Metro, to help track buses on express routes, an APe record is written if the
65 Furth, Muller, Strathman, and Hemily
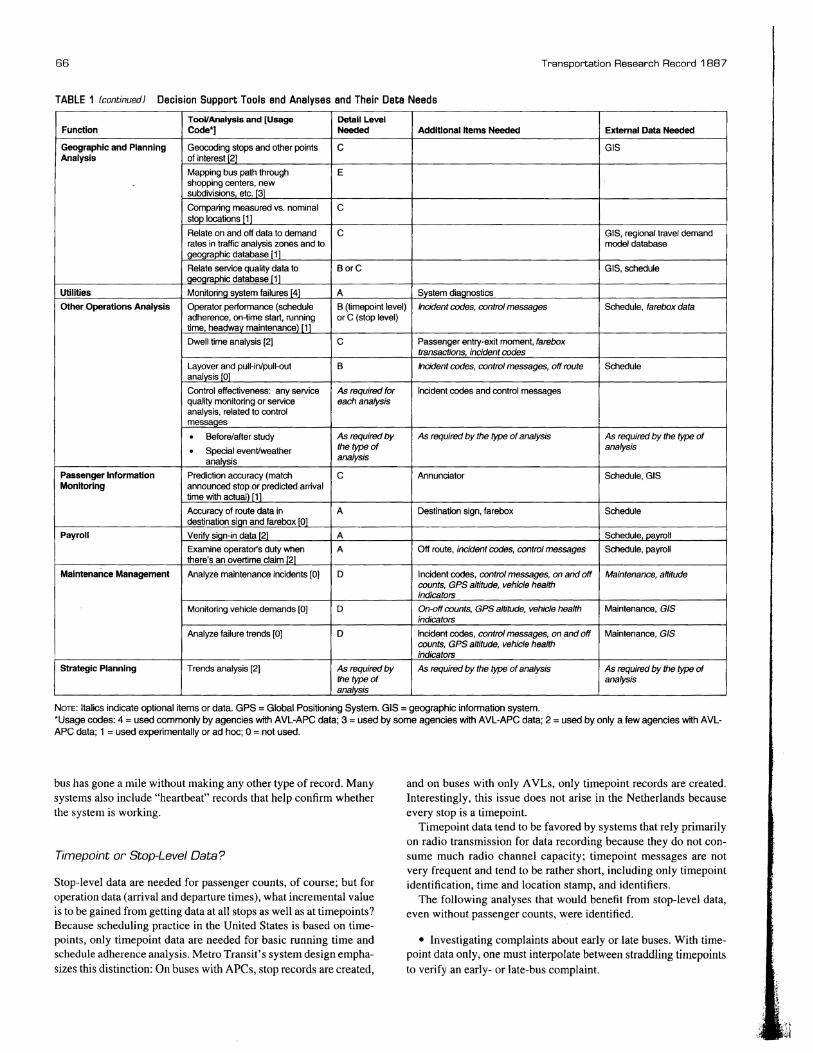
TABLE 1 Decision Support Tools end Anelyses end Their Data Needs
TooVAnalysis and [Usage Detail Level Function Code"] Needed Additional Items Needed External Data Needed
General service monitoring, • Missed trips [1 J AorB Incident codes, control messages Schedule including contract compliance
• Schedule adherence [4J
Targeted Investigations Tlip investigation at gross level A Off route, incident codes, control messages Schedule, payroll (was it there? was it off route?) [4] · Customer service
(complaints) Trip investigation: early, late, C overcrowded? [3J· SecurityJ1egal
(incidents, accidents) Trip investigation: speed, DarE Maximum speed; recoms every 2 5 or more acceleration [2) to measure accel., decel. rates; GPS altitude · Operator performance
Scheduling and Monitoring Route and segment running time B Running Time analySis (mean and distribution) [4J
Suggesting running time based on B (lIlfcentilesill Selecting homogeneous running B time periods [3J
Suggesting half-cycle time based B on percentiles [2J .
Running time analysis net of C Incident codes, control messages Schedule holding time [2]
Speed and traffic delay [2] D Schedule
Unsafe operations monnoring [0] DorE Maximum speed; records every 2 s or more JQ I1JJHlSUlJULccel.. decel. rates
Relating running time to weather. B Weather, roadway incident roadway incidents, and special data, special event data events '[11
Schedule Adherence and Percent early, late by location [4] B (timepoint- Schedule Connection Protection level) or C (stop
level)(service and operational quality) Distribution 01 schedule deviation at BorC
a timepoint [3J
Graphical display 01 schedule BorC deviation distribution along a route [2J
Experienced lateness and earliness C Farebox transactions with [11' linked trip data
Connection protection [1 J C Control messages Farebox transactions with linked trio data
Headway Analysis Headway deviations (mean and B (timepoint- Incident codes, control messages Schedule distribution by limepoint) [3J level) or C (slop
level); all buses (service and operational quality)
reportinQ
Impact of headway variability on C Incident codes Farebox passenger wailing time for random passenger anivals [1 J
Plot successive trajectories C Incident codes, control messages Schedule (bunchinq analysis) [2]
Demand Analysis Load profile (mean ons, offs, and C load by stop along a route; also passenger-milesf [4]
Load variations [3] C
Analysis of trip maximum loads and C maximum load points [1]
Time-dependent demand and toad C analysis, and suggesting trip start times to achieve load tarQets [11 . Analyze overload, lift. bicycfe, and C I ncident codes other events ~stop and time m Transfer and linked triP analvsis [11 C Farebox transactions with card IDs Farebox
NOTE: Italics indicate optional items or data. GPS =Global Positioning System_ GIS =geographic inlonnation system. 'Usage codes: 4 =used commonly by agencies with AVL-APC data; 3 =used by some agencies with AVL-APC data; 2 =used by only a few agencies with AVLAPC data; 1 = used experimentally or ad hoc; 0 = not used.
(continued on next page]
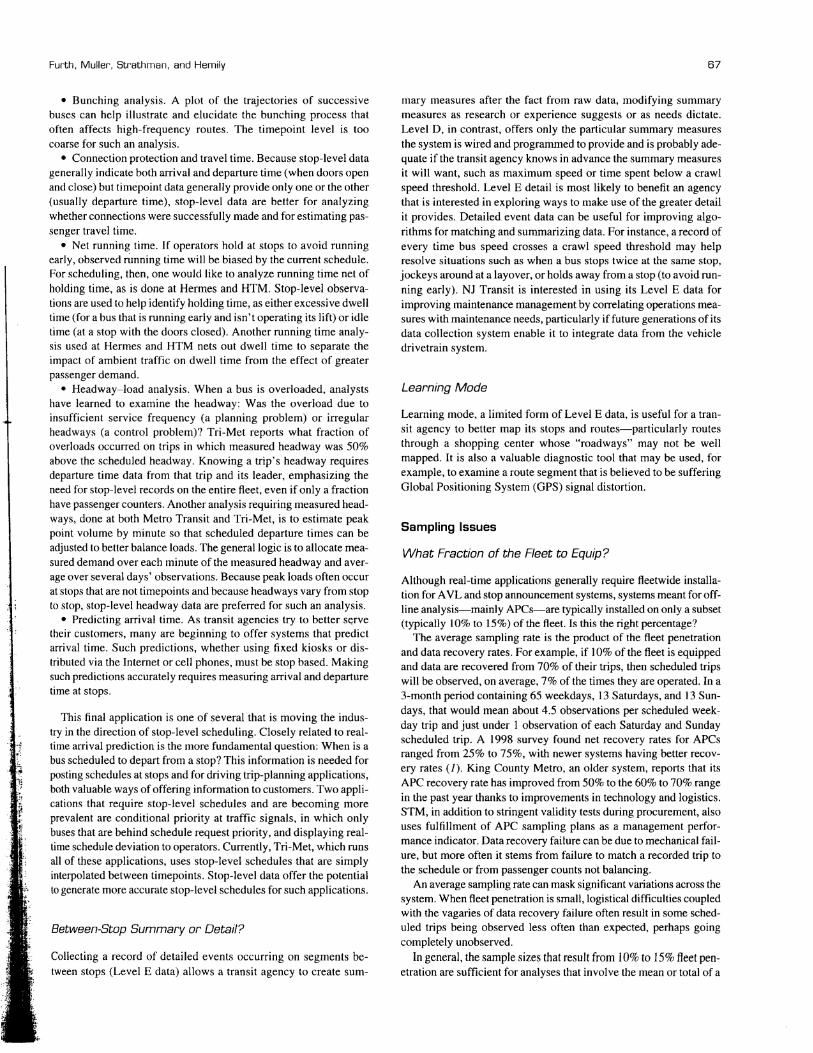
66 Transportation Research Record 1 BB7
TABLE 1 (continued) Decision Support Tools and Analyses and Their Dete Neads
TooVAnalysls and [Usage Detail Level Function Code·] Needed Additional Items Needed External Data Needed
Geographic and Planning Geocoding stops and other points C GIS Analysis of interest -[2]
Mapping bus path through E shopping centers, new subdivisions etc. [3]
Comparing measured vs. nominal C stop locations [11
Relate on and off data to demand C GIS, regional travel demand rates in traffic analysis zones and to model database geographic database [1]
Relate service quality data to BorC GIS, schedule geographic database [11
Utilities Monnoring system failures [41 A System diagnostics
Other Operations Analysis Operator performance (schedule B (timepoint level) Incident codes, control messages Schedule, farebox data adherence, on-time start, running or C (stop level) time, headway maintenancE!) [If Dwell time analysis [21 C Passenger entry-exit moment, farebox
transac~ons mOdentcodes
Layover and pull-inlpull-out B Incident codes, control messages, off route Schedule analysis [01
Control effectiveness: any service As required for Incident codes and control messages quality monnoring or service each analysis analysis, related to control messages . Before/after study . Special evenVweather
analYSis
As required by the type of analysis
As required by the type of analysis As required by the type of analysis
Passenger Infonnation Prediction accuracy (match C Annunciator Schedule, GIS Monltorlng announced stop or predicted arrival
time with aetuail [1]
Accuracy of route data in A Destination sign, farebox Schedule destination sign and farebox [01
Payroll Verify sign-in data [21 A Schedule, payroll
Examine operator's duty when A Off route, incident codes, control messages Schedule, payroll there's an overtime claim [21
Maintenance Management Analyze maintenance incidents [OJ 0 Incident codes, control messages, on and off Maintenance, altitude counts, GPS altitude, vehicle health indicators
Monitoring vehicle demands [0] 0 On-off counts, GPS altitude, vehicle health Maintenance, GIS indicators
Analyze failure trends [OJ D Incident codes, control messages, on and off Maintenance, GIS counts, GPS altitude, vehicle health indicators
Strategic Planning Trends analysis [2J As required by As required by the type of analysis As required by the type of the type of analysis analysis
NOTE: Italics indicate optional items or data. GPS = Global POSitioning System. GIS = geographic information system. 'Usage codes: 4 = used commonly by agencies with AVL-APC data; 3 = used by some agencies with AVL-APC data; 2 = used by only a few agencies with AVLAPC data; 1 = used experimentally or ad hoc; 0 =not used.
bus has gone a mile without making any other type of record. Many systems also include "heartbeat" records that help confirm whether the system is working.
Timepoint or Stop-Level Data?
Stop-level data are needed for passenger counts, of course; but for operation data (arrival and departure times), what incremental value is to be gained from getting data at all stops as well as at timepoints? Because scheduling practice in the United States is based on timepoints, only timepoint data are needed for basic running time and schedule adherence analysis. Metro Transit's system design emphasizes this distinction: On buses with APCs, stop records are created,
and on buses with only A VLs, only timepoint records are created. Interestingly, this issue does not arise in the Netherlands because every stop is a time point.
Timepoint data tend to be favored by systems that rely primarily on radio transmission for data recording because they do not consume much radio channel capacity; timepoint messages are not very frequent and tend to be rather short, including only timepoint identification, time and location stamp, and identifiers.
The following analyses that would benefit from stop-level data, even without passenger counts, were identified.
• Investigating complaints about early or late buses. With timepoint data only; one must interpolate between straddling timepoints to verify an early- or late-bus complaint.
67 Furth. Muller. Strathman. and Hemily
• Bunching analysis. A plot of the trajectories of successive buses can help illustrate and elucidate the bunching process that often affects high-frequency routes. The timepoint level is too coarse for such an analysis.
• Connection protection and travel time. Because stop-level data generally indicate both arrival and departure time (when doors open and close) but timepoint data generally provide only one or the other (usually departure time), stop-level data are better for analyzing whether connections were successfully made and for estimating passenger travel time.
• Net running time. If operators hold at stops to avoid running early, observed running time will be biased by the current schedule. For scheduling, then, one would like to analyze running time net of holding time, as is done at Hermes and HTM. Stop-level observations are used to help identify holding time, as either excessive dwell time (for a bus that is running early and isn't operating its lift) or idle time (at a stop with the doors closed). Another running time analysis used at Hermes and HTM nets out dwell time to separate the impact of ambient traffic on dwell time from the effect of greater passenger demand.
• Headway-load analysis. When a bus is overloaded, analysts have learned to examine the headway: Was the overload due to insufficient service frequency (a planning problem) or irregular headways (a control problem)? Tri-Met reports what fraction of overloads occurred on trips in which measured headway was 50% above the scheduled headway. Knowing a trip's headway requires departure time data from that trip and its leader, emphasizing the need for stop-level records on the entire fleet, even ifonly a fraction have passenger counters. Another analysis requiring measured headways, done at both Metro Transit and Tri-Met, is to estimate peak point volume by minute so that scheduled departure times can be adjusted to better balance loads. The general logic is to allocate measured demand over each minute of the measured headway and average over several days' observations. Because peak loads often occur at stops that are not timepoints and because head ways vary from stop to stop, stop-level headway data are preferred for such an analysis.
• Predicting arrival time. As transit agencies try to better Serve their customers, many are beginning to offer systems that predict arrival time. Such predictions, whether using fixed kiosks or distributed via the Internet or cell phones, must be stop based. Making such predictions accurately requires measuring arrival and departure time at stops.
This final application is one of several that is moving the industry in the direction of stop-level scheduling. Closely related to realtime arrival prediction is the more fundamental question: When is a bus scheduled to depart from a stop? This information is needed for posting schedules at stops and for driving trip-planning applications, both valuable ways ofoffering information to customers. Two applications that require stop-level schedules and are becoming more prevalent are conditional priority at traffic signals, in which only buses that are behind schedule request priority, and displaying realtime schedule deviation to operators. Currently, Tri-Met, which runs all of these applications, uses stop-level schedules that are simply interpolated between timepoints. Stop-level data offer the potential to generate more accurate stop-level schedules for such applications.
Between-Stop Summary or Detail?
Collecting a record of detailed events occurring on segments between stops (Level E data) allows a transit agency to create sum
mary measures after the fact from raw data, modifying summary measures as research or experience suggests or as needs dictate. Level D, in contrast, offers only the particular summary measures the system is wired and programmed to provide and is probably adequate if the transit agency knows in advance the summary measures it will want, such as maximum speed or time spent below a crawl speed threshold. Level E detail is most likely to benefit an agency that is interested in exploring ways to make use of the greater detail it provides. Detailed event data can be useful for improving algorithms for matching and summarizing data. For instance, a record of every time bus speed crosses a crawl speed threshold may help resolve situations such as when a bus stops twice at the same stop, jockeys around at a layover, or holds away from a stop (to avoid running early). NJ Transit is interested in using its Level E data for improving maintenance management by correlating operations measures with maintenance needs, particularly if future generations of its data collection system enable it to integrate data from the vehicle drivetrain system.
Learning Mode
Learning mode, a limited form of Level E data, is useful for a transit agency to better map its stops and routes-particularly routes through a shopping center whose "roadways" may not be well mapped. It is also a valuable diagnostic tool that may be used, for example, to examine a route segment that is believed to be suffering Global Positioning System (GPS) signal distortion.
Sampling Issues
What Fraction of the Fleet to Equip?
Although real-time applications generally require fleetwide installation for A VL and stop announcement systems, systems meant for offline analysis-mainly APCs-are typically installed on only a subset (typically 10% to 15%) of the fleet. Is this the right percentage?
The average sampling rate is the product of the fleet penetration and data recovery rates. For example, if 10% of the fleet is equipped and data are recovered from 70% of their trips, then scheduled trips will be observed, on average, 7% of the times they are operated. In a 3-month period containing 65 weekdays, 13 Saturdays, and 13 Sundays, that would mean about 4.5 observations per scheduled weekday trip and just under 1 observation of each Saturday and Sunday scheduled trip. A 1998 survey found net recovery rates for APCs ranged from 25% to 75%, with newer systems having better recovery rates (1). King County Metro, an older system, reports that its APC recovery rate has improved from 50% to the 60% to 70% range in the past year thanks to improvements in technology and logistics. STM, in addition to stringent validity tests during procurement, also uses fulfillment of APC sampling plans as a management performance indicator. Data recovery failure can be due to mechanical failure, but more often it stems from failure to match a recorded trip to the schedule or from passenger counts not balancing.
An average sampling rate can mask significant variations across the system. When fleet penetration is small, logistical difficulties coupled with the vagaries of data recovery failure often result in some scheduled trips being observed less often than expected, perhaps going completely unobserved.
In general, the sample sizes that result from 10% to 15% fleet penetration are sufficient for analyses that involve the mean or total of a
68
quantity, such as total passenger nliles (required for FfA National Transit Database reporting), mean boardings, and mean running time. They also are sufficient for analyses that involve considerable aggregation, such as boardings per revenue-hour (for route economic performance analysis) and stop-level demand by route, direction. and period (for service planning).
Larger and even complete fleet penetration for APCs has advantages, however, that help offset the costs. First, it provides the larger sample size needed for analyses involving variability, extreme values, and proportions. Examples are 95th percentile running time (which might be used to help determine needed recovery time), proportion of trips with load greater than capacity, and proportion of departures that are on time. The passenger count measure most in need of a large sample size is load on busy routes. A transit agency commonly faces the contradiction of load data that indicate that a route has plenty of capacity on average, yet customers complain about overloads. Tri-Met, with about 65% of its fleet instrumented with APCs, can analyze what fraction of days in each 3-month period each scheduled trip was over capacity. For decades, industry practice has been to schedule head ways on busy routes based on average peak load, ignoring variability; however, this practice is really an accommodation to data scarcity. On routes with large load variability, smaller average peak loads are needed to limit overloads; on routes with little load variability, average peak load can be greater without risking much overloading.
Leader-follower or headway analysis is particularly sensitive to data recovery and fleet management practice because it requires valid observations of consecutive pairs of trips. The number of valid headways one can expect to observe is proportional to the square of the data recovery rate and the correct assignment rate. For example, if the data recovery rate is 70% and if a request to instrument a given route results in 90% of the trips on that route having an instrumented bus, one can expect to observe only (0.7)2(0.9)2 = 40% of the day's headways on that route.
A large fleet penetration rate allows more timely analysis of datathat is, a shorter period of time is needed to accumulate the sample size needed for a given analysis. Also, with complete penetration, the significant logistical hassles over circulating instrumented buses disappear. Maintenance and political factors (e.g., spread the new buses, or put the new buses on this side of town) often determine where instrumented buses are garaged, complicating data collection. For these reasons, as well as the sampling reasons described earlier, TriMet decided a few years ago that all new bus purchases would include APC. Because their APC system shares the A VL system's location, schedule matching, and communication facilities, the marginal cost of installing APC in a bus has decreased to only $1,000.
Exception Reporting, Yes; Exception Recording. No
Exception reporting is a valuable tool for reports and radio messages to prevent information overload. Exception radio messages can also aid dispatchers in real time by bothering them only when something needs attention. For example, Tri-Met uses three different thresholds for lateness: for signal priority, 2 min; for historical performance reports, 5 min; and for a "late alarm" radio message to dispatchers, 8 min.
However, most analyses require that data be recorded on all trips, not only exceptions. Researchers at Morgan State University in Baltimore, Maryland, tried to analyze schedule deviation and running time using exception data gathered by Baltimore's 1995-vintage
Transportation Research Record 1887
A VL system, in which buses within an on-time window (I min early to 5 min late) send back only a "status OK" message, which is not archived; the only archived timepoint records are from buses outside that window (9). The researchers had to guess the schedule deviation of buses within the on-time window. Still worse, trips that were never outside the on-time window didn't appear at all in the database, just like trips that were missing or had malfunctioning radios. The transit agency has since discontinued attempts to analyze data from that A VL system.
Connections to Capture Other Data Items
Tying an A VL or APC to other devices can create valuable data synergies. One valuable connection already mentioned is to the farebox, by means of which location-stamped fare transaction records could allow one to estimate load, reconstruct linked trips, and analyze transfers based on actual transfer rates.
Making the Most of Control Communications
In radio-integrated A VL systems, the event stream usually includes coded radio messages initiated by the operator. Useful codes for data analysis include those for pass-ups (when a waiting customer can't be picked up due to overload), fare evasion, fare dispute, or blockage at a railroad crossing or drawbridge. However, the value of such event records depends on operator compliance. For example, when Tri-Met's service analysis group analyzed fare evasion event records to show locations of high rates offare evasion, the analysis was received with skepticism because it was generally believed that most fare evasion goes unreported.
Also of value, but not yet applied in an A VL system to the authors' knowledge, would be records of communications initiated by the control center, such as instructions to hold or detour.
DATABASE DESIGN ISSUES
Integrating with Enterprise Databases
Integrating A VL with the scheduling database has proven to be a large but sunnountable obstacle for many transit agencies. Because of difficulties brokering the development of the schedule interface between the scheduling software contractor and the A VL contractor in an earlier procurement, CTA's recent procurement puts the coordination responsibility on the stop announcement contractor, who had to budget for subcontracting to the scheduling software vendor. Complicating matters for A VL vendors is the fact that scheduling databases often have custom features that hinder the transferability of an interface from one agency to another, even if both have the same schedule software.
Route and stop databases are rarely perfect because before automated data collection and analysis, they didn't have to be (2). An AVL system can be qesigned to help improve those databases with such features as learning mode and analysis of measures versus scheduled stop location.
Data Cleansing
In a real-time only system, bad data are often just a momentary blip that people in the control room learn to ignore. When archived, how
69 Furth, Mulier, Strathman, and Hemily
ever, bad data can interfere with many analyses (2). Because of the huge sample size afforded by automated data, a lot of data can be thrown out. Therefore, the first step in data cleansing is to throw out data that is out of range. A classic example is on-and-off counts whose totals don't agree (to a certain tolerance).
A related problem is balancing on-and-off counts. The main issue is preventing errors from accumulating. Best practice is to identify known points of zero load (layover terminals), force the load there to be zero, and make small adjustments between such points, avoiding negative loads.
One common problem that results in erroneous data in the database is the difficulty in resolving end-of-line activity. A bus in a terminal area may open its doors or move several times between ending one trip and starting the next; a system sometimes mistakes such intervening movements as arrivals and departures. For this reason, many agencies don't trust running time analysis on first and final segments of a route, limiting the usefulness of A VL data. King County Metro has improved its end-of-line matching by ignoring bus movements after anival at terminal and more than 3 min before scheduled departure. Greater detail in the data stream (e.g., stop records or Level E data detail) can help eliminate many end-of-line ambiguities.
The transit agencies that have made the greatest progress with archived data show a strong ongoing commitment to improve data quality. Staff members ensure that the data are received properly; note how much data were rejected and why; look for patterns in matching failures; and develop improved algorithms for matching, editing, and analyzing the data.
Analysis and Report Options
On the basis of this survey, transit agencies want three levels of analysis and report options. At one end of the spectrum, they want flexibility to query and analyze the data in any way. Some of the larger agencies with A VL systems have skilled analysts able to do just that. At the other end of the spectrum, they want standard reports that can be run by various users without programming or database skills.
The middle option is standard procedures that may involve complex programming producing tables that can then be custom formatted using standard report-generating software. Tri-Met's service analyst follows this path: He uses a powerful statistical package to perform data selection and calculation logic, which result in large tables, then a standard database package for functions such as formatting and sorting. This two-stage method offers the possibility of standard sets of analysis procedures that might be transferred between different transit agencies.
ORGANIZATIONAL ISSUES
Effective use of automated data requires complete transformation of an organization. It is not surprising, then, that organizational issues often have hindered its development. A summary of some of the key lessons learned from these surveys follows .
Improving Quality of Operator-Generated Data
Operator-generated data can be an important part of the data stream, but their value depends on high accuracy and compliance rates. Several things can be done to improve the quality of such data.
The first is to minimize the need for operator-generated data. Rather than requiring the operator to enter a code for wheelchair lift use, many systems have a lift sensor. To minimize erroneous operator login data, Tri-Met and Metro Transit generate log-in data automatically from the results of the overnight bus assignment process; operators then only have to verify that their block numbers are correct.
NJ Transit at first designed a system that would run with no operator input at all. However, they later found that verifying that a day's service on a bus followed the block number entered by the operator turned out to be a far more efficient way of schedule matching than ignoring the operator 's input.
Real-time monitoring of operator inputs, when it can be arranged, can improve data quality. For example, some systems will check that the identification entered by the operator is valid. In systems integrated with the radio, when an operator doesn't log in properly, a supervisor is likely to visit the bus (because one isn't supposed to operate without a functioning radio). For this reason, erroneous login data are rare at King County Metro, except on trippers (one- or two-run pieces of work). Enforcement based on public complaints is less effective but still better than nothing. For example, if operators are disciplined for failing to report a pass-up if a customer later complains, operator compliance in reporting pass-up events will likely improve.
Avoiding Labor Opposition
Suspicion of "the spy in the cab" or "big brother" is natural. If transit operators resent being monitored, they can sabotage the system, either physically or by otherwise rendering its data useless, especially if they believe that the system is unfair or inaccurate.
For the most part, transit agencies that have adopted A VL and APC have avoided incapacitating labor opposition. Communicating the security benefits of A VL helps build operator support. (APCs generally don't engender opposition, probably because their name suggests that they're counting only passengers.) Most agencies avoid directly challenging operators with A VL or APC data. TriMet has a formal agreement with the labor union preventing discipline on the basis of A VL data. However, they still analyze the data to identify patterns of abuse (e.g., returning late to the garage when the last trip ended on time) or poor performance (e.g., starting late, even though the previous trip ended on time) and alert supervisors as to where and when problems are likely to occur.
What's the Benefit?
Perhaps the biggest organizational obstacle is convincing management of the benefit of archived data analysis. Thus one is presented with a version of the chicken-and-egg problem: The benefits of an archived data system cannot be easily proven until it has been applied, but management won't provide the needed system features, support, and staffing unless it believes that the system's benefit will be worth its costs.
This survey suggests that the benefits of archived A VL-type data are still far from being realized at any agency. Most often, data systems are still immature. Even where data systems are producing well, the schedulers, planners, supervisors, and staff members with other functions can take a long time to adjust their practices to a data-rich environment when practices developed for a data-poor environment are well entrenched.
70
Nevertheless, this survey offers plenty of information to support the concept that the benefits of archived A VL-type data will indeed be substantial. Consider the following:
• Scheduling systems prove their worth by finding efficiencies that reduce operating costs by a small fraction, often 1 % or 2%. Analysis of loads and running times will likely offer similar if not greater benefits, such as making decisions about needed running time, recovery time, and headway based on a large, reliable sample rather than a meager manual sample. Several transit agencies report that this area is where they find the greatest benefit of their A VL system.
• On Line 1 in Eindhoven, when extensive data analysis was combined.with signal priority to make operations reliably on time, ridership increased 25%. Granted, some of that increase is due to faster running times offered by signal priority (trip time reduced from 23 to 21 min), and a significant part of the increase is attributed to improvements in the route's on-time performance, which could occur only with schedule adjustments based on extensive data analysis.
• Throughout the business world, measurements help improve quality; one should expect transit operations to be no different. At STM, garage managers are held accountable for the on-time performance of their divisions, enforced through APC measurements. Upper management, in establishing this program, certainly believes that garage managers can and will improve service quality if held accountable. At Tri-Met, an analysis of on-time performance by operator has revealed that much of the problem is operator specific (10). This analysis compares each operator's performance to the average performance of operators on the same route, direction, and period. These data are passed on to supervisors, who can use it to target supervision and training efforts (because they cannot discipline an operator directly from A VL or APC data).
• When service is contracted out, service quality is often ensured through the use of penalties and incentives in the contract relating to specific, measurable items such as on-time performance. A VL with data archiving offers the necessary means of data collection to enforce such a provision.
• Conditional signal priority is one of the most promising means for improving transit service. However, it demands a finely tuned schedule of arrival time at every intersection, set so that about onehalf if the buses arrive early and one-half arrive late. Only automated data collection, archiving, and analysis can provide the finely tuned schedules needed to make conditional priority work.
• Transit agencies need the cooperation of traffic management authorities to improve transit speed and reliability. Archived A VL data provide the information needed to make a convincing case for and assess the impact of traffic management interventions.
Transportation Research Record 1887
CONCLUSION
The usefulness and benefit of archived data derived from an automated data collection system depend on the system's design. This paper has discussed key issues related to design of the data collection system itself and of its database as well as related organizational issues. The authors hope that this research will help guide the development of automated data collection systems.
REFERENCES
I. Furth, P. G. Synthesis ofTransit Practice 34: Data Analysisfor Bus Planning and Monitoring. TRB, National Research Council, Washington, D.C., 2000.
2. Kemp, J. Lessons Learned-Things You Didn't Need to Think About When It Was Just Automatic Vehicle Location. Presented at the 81st Annual Meeting of the Transportation Research Board, Washington, D.C.. 2002.
3. Cevallos, F. Using dBASE to Collect A VL Data. The dBase Developer's Bulletin, Vol. 16, July 2002. www.dbase.com/Knowledgebase/ dbulletinlbu 16_.htm.
4. Furth, P. G., B. J. Hemily, T. H. J. Muller, and J. G. Strathman. TCRP Web Document 23: Uses ofArchived AVL-APC Data to Improve Transit Perfonnanceand Management-Review and Potential. Project H-28, Contractor Final Report. TRB, National Research Council, Washington. D.C., June 2003. gulliver.trb.orglpublications/tcrp/tcrp_ webdoc_23.pdf.
5. Muller, T. H. J., and P. G. Furth. Trip Time Analyzers: Key to Service Quality. In Transportation Research Record: Journal of the Transportation Research Board, No. 1760, TRB, National Research Council, Washington, D.C., 2001, pp. 10-19.
6. Navick, D. S., and P. G. Furth. Estimating Passenger Miles, OriginDestination Patterns, and Loads with Location-Stamped Farebox Data. In Transportation Research Record: Journal ofthe Transportation Research Board, No. 1799, TRB, National Research Council, Washington, D.C., 2002, pp. 107-113.
7. Barry, 1. J., R. Newhouser, A. Rahbee, and S. Syeda. Origin and Destination Estimation in New York City with Automated Fare System Data. In Transportation Research Record: Journal ofthe Transportation Research Board, No. 1817, TRB, National Research Council, Washington. D.C., 2002, pp. 183-187.
8. Levine, 1. Evaluation of the Advanced Operating System of the Ann Arbor Transit Authority: Transfer and On-Time Performance StudyBefore and After AOS Implementation. Intelligent Transportation Systems Office, U.S. Department of Transportation, 2000, modified 2001 . www.its.dot.govIEVAUdocs_transitmgt.htm.
9. Lee, Y.-J., K. S. Chon, D. L. Hill, and N. Desai. Effect of Automatic Vehicle Location on Schedule Adherence for Mass Transit Administration Bus System. In Transportation Research Record: Journal of the Transportation Research Board, No. 1760, TRB, National Research Council, Washington, D.C., 2001, pp. 81-90.
10. Strathman, J., K. Dueker, T. Kimpel, R. Gerhart, and S. Callas. Evaluation of Transit Operations: Data Applications of Tri-Met's Automated Bus Dispatch System. Transportation, Vol. 29, 2002, pp. 321-345.
Publication of this paper sponsored by Transit Management and Performance Committee.