Embed Size (px)
Citation preview
A revised final version of this paper will appear in the Winter 2013 issue of Inquiry.
1
Designing and Regulating Health Insurance Exchanges: Lessons from Massachusetts Keith M. Marzilli Ericson and Amanda Starc *
This Draft: September 2012
Abstract: The Massachusetts health care reform provides preliminary evidence on the function of
health insurance exchanges and individual insurance markets. We describe the type of products
consumers choose and the dynamics of consumer choice. Evidence shows that choice architecture
affects choice, including product standardization and the use of heuristics (rules of thumb). In addition,
while consumers often choose less generous plans in the exchange than in traditional employer-
sponsored insurance, there is considerable heterogeneity in consumer demand, as well as some
evidence of adverse selection. We examine the role of imperfect competition between insurers, and
document the impact of pricing and product regulation on the level and distribution of premiums. Given
our extensive choice data, we synthesize the evidence on the Massachusetts exchange to inform the
design and regulation on other exchanges.
* Keith M. Marzilli Ericson, Ph.D. is an Assistant Professor of Markets, Public Policy, and Law at the
Boston University School of Management. Email: [email protected]. Amanda Starc, Ph.D. is an Assistant
Professor of Health Care Management at the Wharton School of the University of Pennsylvania. Email:
[email protected]. We acknowledge funding from Lab for Economic Applications and Policy
(LEAP) at Harvard University.
A revised final version of this paper will appear in the Winter 2013 issue of Inquiry.
2
1. Introduction
Exchanges are transforming the way consumers purchase health insurance, by lowering
transaction costs and providing a new regulatory framework for insurance purchased directly by
households from insurers. As a result of the 2010 Affordable Care Act (ACA), individual states and the
federal government will set up a number of health insurance exchanges (HIEs). HIEs play a crucial role in
health reform, and will provide coverage for a projected 20 million people (CBO 2012).
While the broad outlines of exchanges are set by the ACA, many regulations are in flux. States
have substantial latitude in shaping how exchanges operate and the way consumers make decisions.1
Yet because exchanges are new, exchange designers have been forced to rely on intuition rather than
evidence. While most evidence on health insurance choice comes from decision in the context of
employer-sponsored insurance, exchanges are different. Employers bargain with insurance companies
and act as price setters and gatekeepers. On the exchanges, insurance companies will price and market
directly to individuals, and the exchanges will offer a wider range of choice than most employers.
Moreover, the regulation of prices and how they can vary will differ on the exchanges, as will be the
structure of the subsidies individuals receive.
The Massachusetts health insurance exchange offers the first look at health insurance
exchanges in operation.2 Much can be learned from the Massachusetts experience, since the federal
reform roughly parallels the 2006 Massachusetts health reform: both include a mandate, and both rely
on health insurance exchanges to facilitate households’ insurance purchase. We have studied the
1 Exchanges can differ in how they are regulated. For example, while the ACA specifies a 3:1 maximum allowable age rating band in the individual health insurance exchanges, states can impose more strict regulation. For example, Maryland has chosen a price ratio of 2.8. Similarly states can shape the user interface of the exchange (e.g. the website). 2 Utah also operates a smaller health insurance exchange that provides an alternative model for a minimally regulated exchange. Enrollment in the Utah exchange is smaller, and its insurance regulatory environment differs from the environment that will be set up by the ACA.
A revised final version of this paper will appear in the Winter 2013 issue of Inquiry.
3
unsubsidized Massachusetts health insurance exchange (“the Connector”) in depth, focusing on
particular issues such as the use of heuristics (or, “rules of thumb,” Ericson and Starc 2012a), the role of
imperfect competition and pricing regulation (Ericson and Starc 2012b),and the effect of product
standardization (Ericson and Starc 2012c). This paper provides a synthesis of that evidence.
2. Background on the Massachusetts HIE
The Massachusetts unsubsidized health insurance exchange (a program called Commonwealth
Choice, run by the Commonwealth Connector Authority) performs both retail and regulatory functions.
It was created as a result of the 2006 Massachusetts health reform law, which had the goal of providing
universal coverage for state residents. A key feature of this reform was the individual mandate, which
required all Massachusetts residents to purchase a minimal level of health insurance coverage
("minimum creditable coverage"), or face a penalty equal to half of the premium of the lowest cost
health insurance plan offered through the exchange. In addition to the individual mandate, there was
also an employer mandate: employers with eleven or more employees were required to make a "fair
and reasonable" contribution to employees' health insurance costs. The reform has succeeded in
reducing uninsurance to 2.6% (Long and Phadera 2009). Increases in the insured came via individuals
purchasing insurance through the unsubsidized exchange, through increased offering of employer-
provided health insurance, and through expansions in subsidized coverage (Gruber 2011). As a result of
the reform, hospitalizations for preventable illnesses decreased (Kolstad and Kowalski 2010) and visits of
children to emergency room decreased (Miller 2012), with corresponding increases in outpatient care.
The state established the Commonwealth Choice unsubsidized health insurance exchange for
those residents above 300% of the poverty line who were not offered employer-sponsored insurance.
We examine this unsubsidized exchange, as it is most similar to the exchanges created through the ACA:
it offers plans of varying generosities offered by competing insurers. Subsidies in Massachusetts look

A revised final version of this paper will appear in the Winter 2013 issue of Inquiry.
4
very different than in the ACA. Massachusetts offered coverage to lower income residents either
through expanded public coverage (Medicaid) or through a separate subsidized market, called
Commonwealth Care. Individuals in the subsidized Commonwealth Care market do not choose what
level of insurance plan to enroll in, but are assigned to a plan tier based on their income; they can,
however, choose between insurers. Moreover, in contrast to the unsubsidized exchange and the ACA,
insurance premiums in Commonwealth Care do not vary by age of enrollee. In fact, about half the
enrollees in Commonwealth Care pay no premium regardless of which insurer they pick.
The Massachusetts environment that we examine differs in some ways from the ACA. Under
both the Massachusetts reform and the ACA, prices are set in a modified community rating framework:
prices can vary by only certain enrollee characteristics and only within certain ranges. For instance,
prices can vary by age, but the maximum allowable price ratio between different ages is stricter in
Massachusetts (2:1) than in the ACA (3:1). Additionally, minimum medical loss ratio (MLR) regulation is a
feature of the federal, but not the Massachusetts, reform. Finally, the subsidies in the federal reform
are extended to more consumers (up to 400% of the FPL).3 Nonetheless, Massachusetts still provides
the best possible laboratory for studying the design and regulation of exchanges.
On the exchange, competing insurers offer various plans, grouped into tiers of generosity
(bronze, silver, and gold) and, in certain time periods, subtiers (low, medium, and high). Prices also vary
by geographic location and age. Even holding age and location constant, there is substantial variation
between brands for plans with similar or identical financial characteristics: in Jan. 2010, the monthly
premium for a “Silver-Low” plan design for a 30-year old resident of Boston was $410 from Fallon
Community Health Plan and $287 from Tufts Health Plan. This variation can arise because consumers
perceive quality differences in provider networks, or because they believe brand signals some other
3 As a result, once the ACA comes into full effect, some enrollees in the currently unsubsidized Massachusetts HIE would be eligible for federal subsidies.
A revised final version of this paper will appear in the Winter 2013 issue of Inquiry.
5
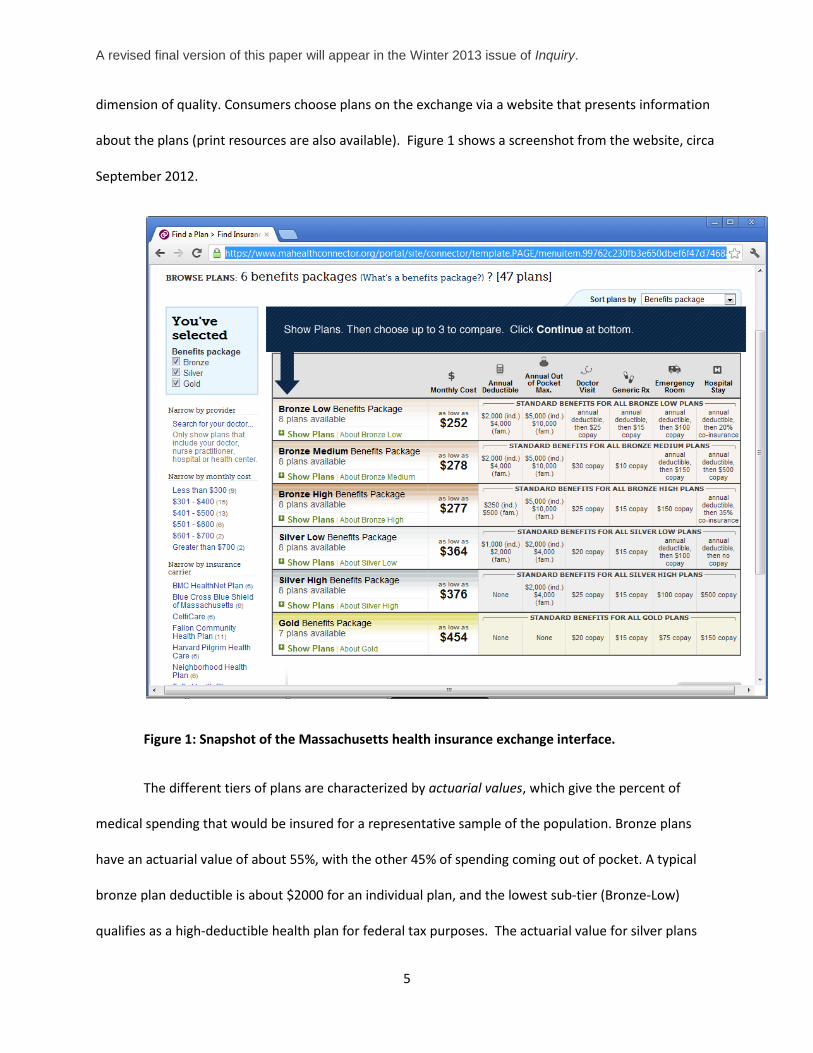
dimension of quality. Consumers choose plans on the exchange via a website that presents information
about the plans (print resources are also available). Figure 1 shows a screenshot from the website, circa
September 2012.
Figure 1: Snapshot of the Massachusetts health insurance exchange interface.
The different tiers of plans are characterized by actuarial values, which give the percent of
medical spending that would be insured for a representative sample of the population. Bronze plans
have an actuarial value of about 55%, with the other 45% of spending coming out of pocket. A typical
bronze plan deductible is about $2000 for an individual plan, and the lowest sub-tier (Bronze-Low)
qualifies as a high-deductible health plan for federal tax purposes. The actuarial value for silver plans
A revised final version of this paper will appear in the Winter 2013 issue of Inquiry.
6
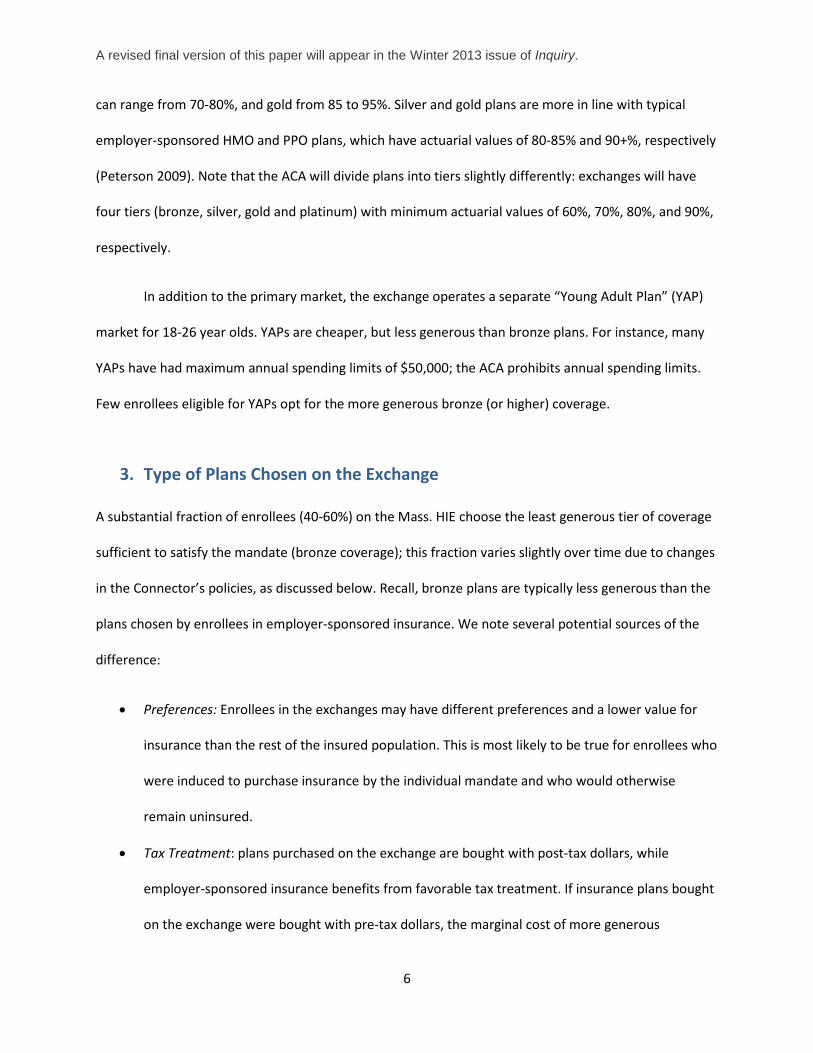
can range from 70-80%, and gold from 85 to 95%. Silver and gold plans are more in line with typical
employer-sponsored HMO and PPO plans, which have actuarial values of 80-85% and 90+%, respectively
(Peterson 2009). Note that the ACA will divide plans into tiers slightly differently: exchanges will have
four tiers (bronze, silver, gold and platinum) with minimum actuarial values of 60%, 70%, 80%, and 90%,
respectively.
In addition to the primary market, the exchange operates a separate “Young Adult Plan” (YAP)
market for 18-26 year olds. YAPs are cheaper, but less generous than bronze plans. For instance, many
YAPs have had maximum annual spending limits of $50,000; the ACA prohibits annual spending limits.
Few enrollees eligible for YAPs opt for the more generous bronze (or higher) coverage.
3. Type of Plans Chosen on the Exchange
A substantial fraction of enrollees (40-60%) on the Mass. HIE choose the least generous tier of coverage
sufficient to satisfy the mandate (bronze coverage); this fraction varies slightly over time due to changes
in the Connector’s policies, as discussed below. Recall, bronze plans are typically less generous than the
plans chosen by enrollees in employer-sponsored insurance. We note several potential sources of the
difference:
• Preferences: Enrollees in the exchanges may have different preferences and a lower value for
insurance than the rest of the insured population. This is most likely to be true for enrollees who
were induced to purchase insurance by the individual mandate and who would otherwise
remain uninsured.
• Tax Treatment: plans purchased on the exchange are bought with post-tax dollars, while
employer-sponsored insurance benefits from favorable tax treatment. If insurance plans bought
on the exchange were bought with pre-tax dollars, the marginal cost of more generous
A revised final version of this paper will appear in the Winter 2013 issue of Inquiry.
7
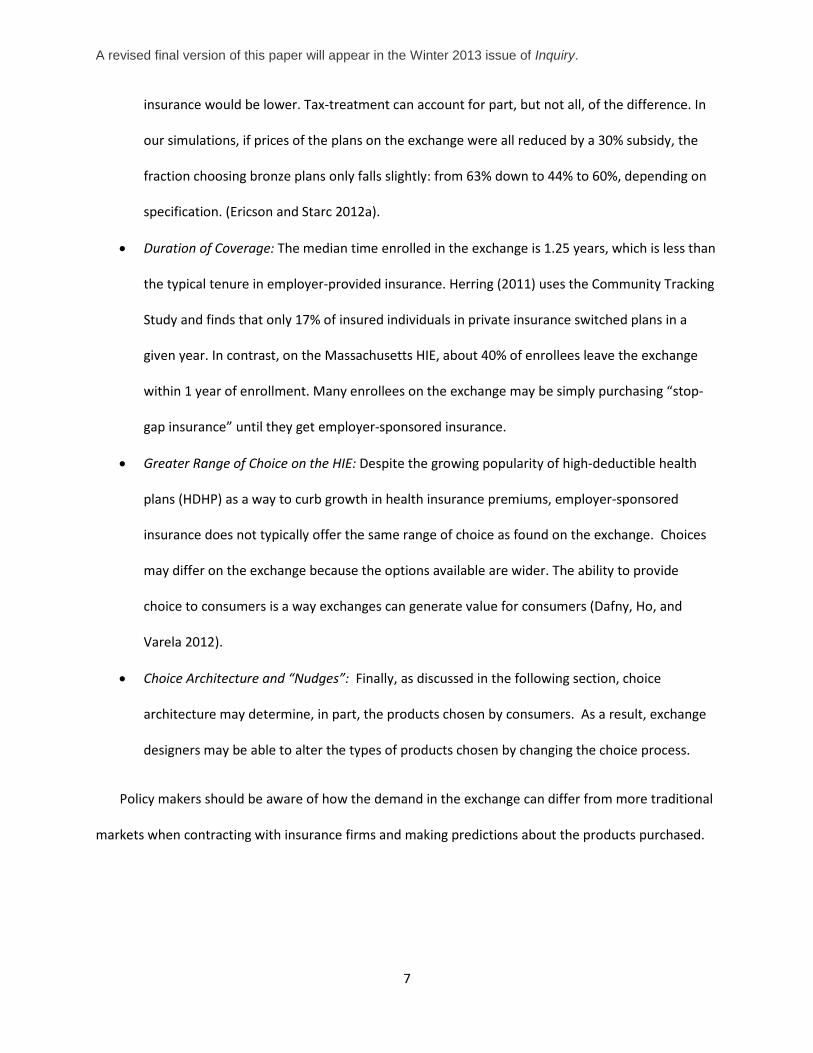
insurance would be lower. Tax-treatment can account for part, but not all, of the difference. In
our simulations, if prices of the plans on the exchange were all reduced by a 30% subsidy, the
fraction choosing bronze plans only falls slightly: from 63% down to 44% to 60%, depending on
specification. (Ericson and Starc 2012a).
• Duration of Coverage: The median time enrolled in the exchange is 1.25 years, which is less than
the typical tenure in employer-provided insurance. Herring (2011) uses the Community Tracking
Study and finds that only 17% of insured individuals in private insurance switched plans in a
given year. In contrast, on the Massachusetts HIE, about 40% of enrollees leave the exchange
within 1 year of enrollment. Many enrollees on the exchange may be simply purchasing “stop-
gap insurance” until they get employer-sponsored insurance.
• Greater Range of Choice on the HIE: Despite the growing popularity of high-deductible health
plans (HDHP) as a way to curb growth in health insurance premiums, employer-sponsored
insurance does not typically offer the same range of choice as found on the exchange. Choices
may differ on the exchange because the options available are wider. The ability to provide
choice to consumers is a way exchanges can generate value for consumers (Dafny, Ho, and
Varela 2012).
• Choice Architecture and “Nudges”: Finally, as discussed in the following section, choice
architecture may determine, in part, the products chosen by consumers. As a result, exchange
designers may be able to alter the types of products chosen by changing the choice process.
Policy makers should be aware of how the demand in the exchange can differ from more traditional
markets when contracting with insurance firms and making predictions about the products purchased.
A revised final version of this paper will appear in the Winter 2013 issue of Inquiry.
8
4. Decision Process and Enrollee Choices
Consumers often lack “health literacy”— the ability to understand basic health-related information
to make informed decisions (Paasche-Orlow et al. 2005). For instance, when the elderly chose
prescription drug plans in the Medicare Part D, they overweighed salient plan features such as price and
underweighted other relevant features, such as expected out-of-pocket costs and risk protection.
Abaluck and Gruber (2011). Health insurance is an complex product, and the various coverage
characteristics of insurance are hard to tradeoff (e.g. lower coinsurance versus higher deductible or
copayments). Thus, on the HIEs, consumers may rely on simplified decision rules—heuristics, or rules of
thumb— as they make choices.
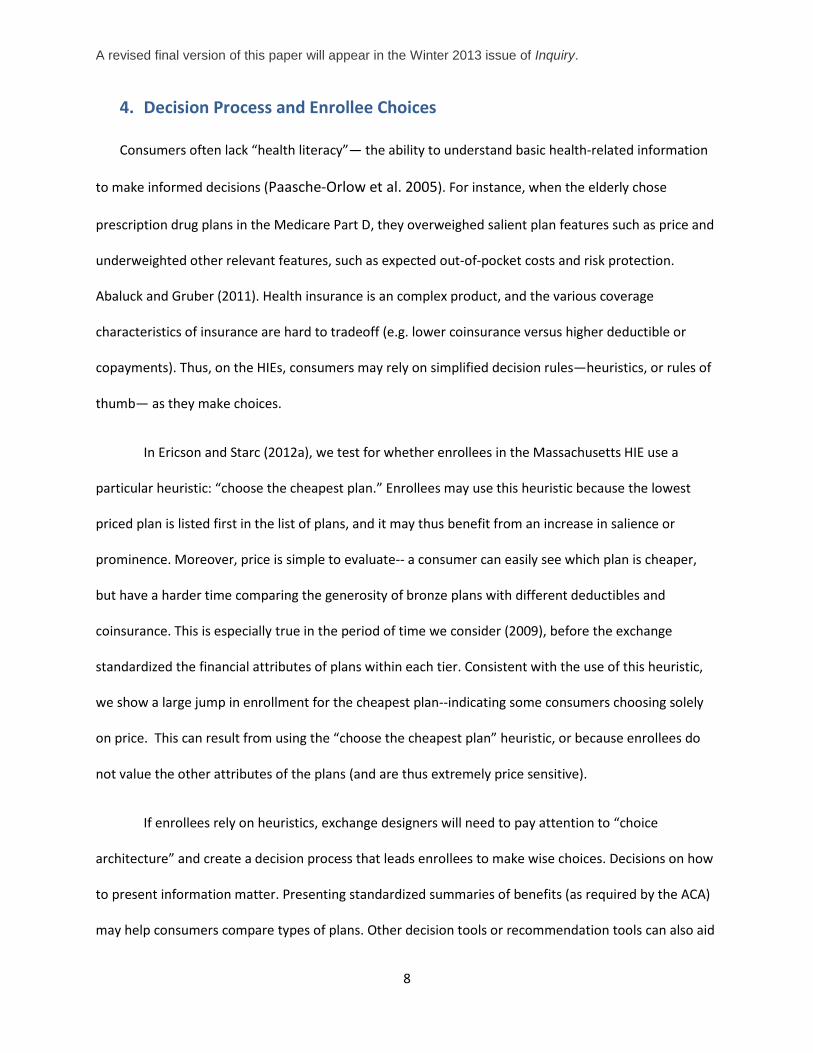
In Ericson and Starc (2012a), we test for whether enrollees in the Massachusetts HIE use a
particular heuristic: “choose the cheapest plan.” Enrollees may use this heuristic because the lowest
priced plan is listed first in the list of plans, and it may thus benefit from an increase in salience or
prominence. Moreover, price is simple to evaluate-- a consumer can easily see which plan is cheaper,
but have a harder time comparing the generosity of bronze plans with different deductibles and
coinsurance. This is especially true in the period of time we consider (2009), before the exchange
standardized the financial attributes of plans within each tier. Consistent with the use of this heuristic,
we show a large jump in enrollment for the cheapest plan--indicating some consumers choosing solely
on price. This can result from using the “choose the cheapest plan” heuristic, or because enrollees do
not value the other attributes of the plans (and are thus extremely price sensitive).
If enrollees rely on heuristics, exchange designers will need to pay attention to “choice
architecture” and create a decision process that leads enrollees to make wise choices. Decisions on how
to present information matter. Presenting standardized summaries of benefits (as required by the ACA)
may help consumers compare types of plans. Other decision tools or recommendation tools can also aid
A revised final version of this paper will appear in the Winter 2013 issue of Inquiry.
9
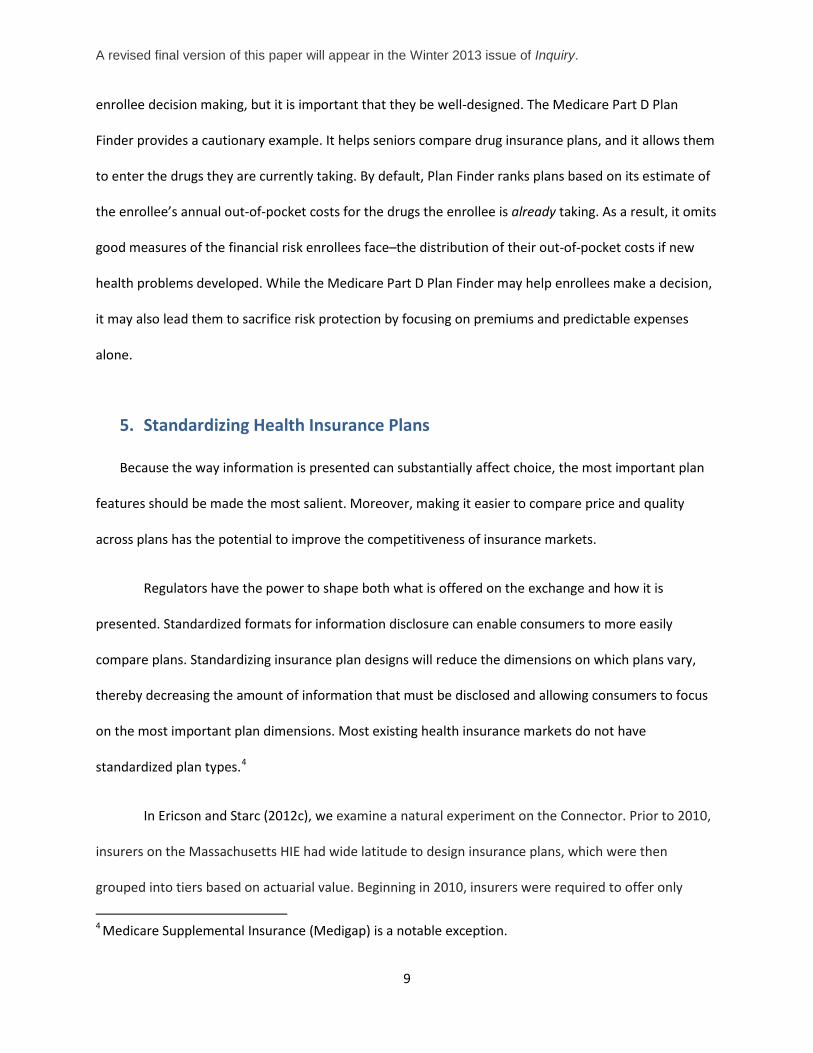
enrollee decision making, but it is important that they be well-designed. The Medicare Part D Plan
Finder provides a cautionary example. It helps seniors compare drug insurance plans, and it allows them
to enter the drugs they are currently taking. By default, Plan Finder ranks plans based on its estimate of
the enrollee’s annual out-of-pocket costs for the drugs the enrollee is already taking. As a result, it omits
good measures of the financial risk enrollees face–the distribution of their out-of-pocket costs if new
health problems developed. While the Medicare Part D Plan Finder may help enrollees make a decision,
it may also lead them to sacrifice risk protection by focusing on premiums and predictable expenses
alone.
5. Standardizing Health Insurance Plans
Because the way information is presented can substantially affect choice, the most important plan
features should be made the most salient. Moreover, making it easier to compare price and quality
across plans has the potential to improve the competitiveness of insurance markets.
Regulators have the power to shape both what is offered on the exchange and how it is
presented. Standardized formats for information disclosure can enable consumers to more easily
compare plans. Standardizing insurance plan designs will reduce the dimensions on which plans vary,
thereby decreasing the amount of information that must be disclosed and allowing consumers to focus
on the most important plan dimensions. Most existing health insurance markets do not have
standardized plan types.4
In Ericson and Starc (2012c), we examine a natural experiment on the Connector. Prior to 2010,
insurers on the Massachusetts HIE had wide latitude to design insurance plans, which were then
grouped into tiers based on actuarial value. Beginning in 2010, insurers were required to offer only
4 Medicare Supplemental Insurance (Medigap) is a notable exception.
A revised final version of this paper will appear in the Winter 2013 issue of Inquiry.
10
seven defined plans each—for instance, all “bronze-low” plans have the same deductible, copayments,
and coinsurance parameters.5 There remained differences among insurers in provider network, but
financial comparisons became easier.
Standardization mattered for market outcomes: it shifted consumers into more generous
products. Post-standardization, the fraction of enrollees in a high-deductible health plan drops from 54%
to 29%, and the fraction of enrollees in bronze plans drops from 63% to 44%. There are similarly large
shifts in insurer market share: as a result of standardization, some insurers introduced (or removed)
relatively popular plans. While the exact reasons for these changes in choice are still speculative, one
effect of standardization was to make financial generosity easier to observe and therefore value. As a
result, consumers can be confident that they really are getting a more generous plan when they choose
a plan in a higher tier. Product standardization is often touted as a way to strengthen the power of
competition, leading to lower prices. However, we do not find a major effect of standardization on the
price level of insurers (though it can be difficult to distinguish any effect of standardization from other
trends in pricing). Moreover, because consumers chose more generous plans, the average premium paid
actually rose by a few dollars a month— largely because more generous plans are expensive, despite
any change in competitive pressure.. We do see that standardization changed the relative weights
consumers placed on plan features. Post-standardization, consumers place higher weight on clearly
financially relevant characteristics, such as deductibles.
Standardization of products matters for choice. Standardization has the potential to improve
outcomes for consumers—with some caveats. The exchange designers could pick the wrong
standardized plans, either due to lack of knowledge or lobbying. In addition, standardizing plans can
limit insurer innovation in plan design. Innovation in the Massachusetts HIE has continued post-
5 The Silver Medium tier was later discontinued due to lack of demand.
A revised final version of this paper will appear in the Winter 2013 issue of Inquiry.
11
standardization— “limited network” plans were introduced as a potentially cost-saving tool—but
insurers face additional barriers to the introduction of potentially innovative benefit designs. Indeed, the
exchange has recently considered allowing insurers to offer new plan types, so long as they continue
offering the standardized plans as well. As more exchanges are set up under the ACA, cross-state
variation in plan menus can shed additional light on the costs and benefits of standardization.
6. Dynamics and the Choice of Open Enrollment Periods
Consumer choices have a dynamic component: they can choose when to enroll in the coverage
through the exchange, and how long they stay enrolled. Dynamic behavior matters for insurers, since
their profits depend not only on market share, but also on how long consumers are enrolled. Length of
time enrolled in a plan can be correlated with an enrollee’s cost to the insurer, with short-term enrollees
potentially having higher average health costs (if they time their entry to coincide with needed episodes
of care) or lower average health costs (if sicker individuals have higher switching costs). Moreover,
turnover itself may be costly due to administrative expenses.
Prompted by complaints from insurers that short-term enrollees (enrolled less than 1 year) had
higher than average health costs, the exchange changed when enrollees can enroll in the coverage.6
Beginning in 2011, consumers were limited purchasing coverage on the exchange during defined open
enrollment periods (initially every 6 months, now every year), unless they fell under an exemption
6 Using claims data provided by insurers, Wyman, Welch, and Giesa (2010) examined how the ratio of health costs to premiums varied by duration enrolled in health plans. They find that the relative cost of short-term enrollees increased after the 2007 implementation of the Massachusetts health reform, which was interpreted as consumers gaming the system when they could enroll at any time. However, the report did not examine whether the characteristics of the short-term enrollees changed post-reform. Since health reform induced different types of people to buy coverage (e.g. via the mandate), a change in the type of enrollees who were short-term provides an alternative explanation for these results.

A revised final version of this paper will appear in the Winter 2013 issue of Inquiry.
12
category (such as losing alternative coverage). Previously, consumers could purchase coverage in the
exchange each any month.
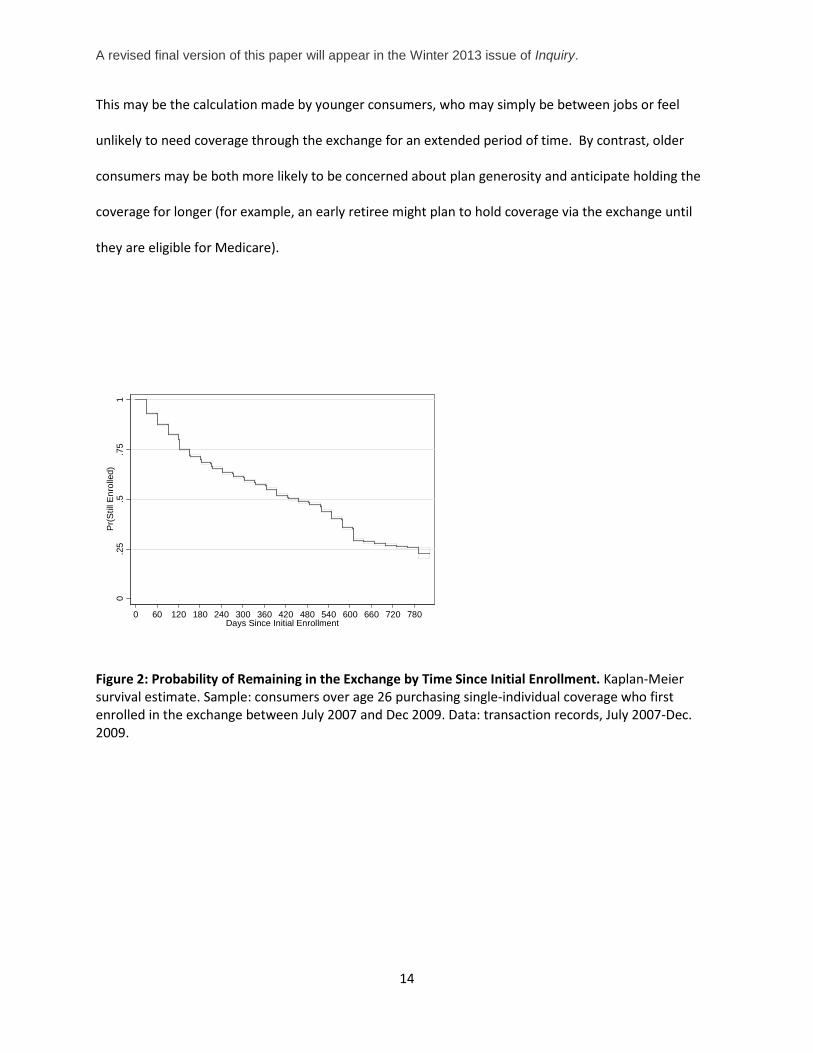
The goal of these open enrollment periods is to curb gaming by consumers. Understanding the
impact of such policies requires information on the behavior of enrollees—how does length of time
enrolled vary with types of coverage chosen, or observable demographic characteristics? To begin to
describe the dynamics of coverage through the exchange, Figure 2 gives the Kaplan-Meier graph for
enrollment in the exchange—how the probability an individual is still enrolled in the exchange varies
with time since enrollment. The median consumer is enrolled in a plan on the exchange for
approximately 1.25 years (455 days).7 However, there is also significant variation in duration of coverage
that is related to observable characteristics.
We estimate how the probability of leaving the exchange varies with observable characteristics
using Cox proportional hazard models in Table 1.8 Hazard ratios that are greater than one indicate
someone is more likely to exit the exchange; less than one, less likely to exit. Table 1 finds that older
consumers tend to be covered for longer periods than younger consumers. Consumers over fifty-five
are almost half as likely to exit the exchange at any point in time, compared than their counterparts
under thirty. This could be because they have higher demand for medical services or are less likely to be
budget-constrained (more able to afford insurance). In addition, female consumers are more likely to
leave the Connector than male consumers.
Yet despite significant variation in enrollment duration by demographic characteristics, there is little
variation across plan types. The hazard ratios in Table 1, column 2, shows that compared to enrollees in 7 We define enrollment duration as time between first entrance into the exchange and the last transaction (i.e. a payment), plus 30 days—this may not precisely correspond to the date their coverage was terminated. Our estimates account for censoring at the end of the data (i.e. we do not see when someone who joins in the last month of our data ends coverage.) 8 Consumers are counted as staying within the exchange if they switch plans in the exchange. Their hazard rate will depend on the plan they are currently enrolled in.

A revised final version of this paper will appear in the Winter 2013 issue of Inquiry.
13
gold plans, the exit rate for consumers enrolled in bronze plans are not statistically different. In fact, the
point estimate (0.96) indicates that bronze enrollees are less likely to leave the exchange. Similarly,
enrollees in silver plans are also less likely to leave the exchange, compared to enrollees in gold plans.
A limitation of these models is that they don’t take into account that the relationship between
enrollment duration and tier of plan chosen might not be constant over time—for instance, perhaps
gold enrollees leave very quickly. Indeed, behavior at very short horizons might be different. We ran a
probit regression for the probability an enrollee exits the exchange within 95 days of entry; 14% of
individuals in our sample exit this quickly. A probit model shows that conditional on other observables,
bronze and silver enrollees are slightly less likely to exit this quickly, approximately 2 percentage points
(p=0.01).
These results suggest that gaming the system (adverse selection based on expected time enrolled in
plans) is not a major driver of length enrolled in the exchange. Given the high deductibles of the bronze
plans, an individual expecting high medical spending and a short enrollment duration should instead
enroll in gold (or potentially silver) plans. Since the extent of dynamic adverse selection seems limited,
the cost of less flexibility in the insurance marketplace from enrollment restrictions can outweigh the
gains from preventing the limited instances of gaming. The Massachusetts policy of having defined open
enrollment periods, but allowing individuals who lose alternative coverage to purchase anytime on the
exchange, balances costs and benefits by limiting the most egregious abuses while still providing access
to the exchange for those whose circumstance have changed.
Dynamic behavior and consumer price sensitivity are related. Younger consumers are more likely to
exit coverage and are also significantly more price-sensitive. It is plausible that these two facts are
related. Some consumers may be unconcerned with the quality of their coverage because they do not
anticipate holding that coverage for very long. Such consumers are likely to be highly sensitive to price.
A revised final version of this paper will appear in the Winter 2013 issue of Inquiry.
14
This may be the calculation made by younger consumers, who may simply be between jobs or feel
unlikely to need coverage through the exchange for an extended period of time. By contrast, older
consumers may be both more likely to be concerned about plan generosity and anticipate holding the
coverage for longer (for example, an early retiree might plan to hold coverage via the exchange until
they are eligible for Medicare).
Figure 2: Probability of Remaining in the Exchange by Time Since Initial Enrollment. Kaplan-Meier survival estimate. Sample: consumers over age 26 purchasing single-individual coverage who first enrolled in the exchange between July 2007 and Dec 2009. Data: transaction records, July 2007-Dec. 2009.
0.2
5.5
.75
1P
r(S
till E
nrol
led)
0 60 120 180 240 300 360 420 480 540 600 660 720 780Days Since Initial Enrollment

A revised final version of this paper will appear in the Winter 2013 issue of Inquiry.
15
Table 1: Hazard Ratio for Leaving the Massachusetts HIE, by Demographic Characteristics and Plan Type Chosen.
(1) (2) (3) Panel A: Demographics
Age 27-29 (Comparison Category) Age 30-34 0.825*** 0.831*** 0.859*** (0.0255) (0.0258) (0.0279) Age 35-39 0.727*** 0.732*** 0.755*** (0.0259) (0.0259) (0.0278) Age 40-44 0.705*** 0.711*** 0.728*** (0.0248) (0.0252) (0.0269) Age 45-49 0.637*** 0.642*** 0.659*** (0.0221) (0.0224) (0.0242) Age 50-54 0.629*** 0.634*** 0.652*** (0.0230) (0.0233) (0.0251) Age 55+ 0.626*** 0.632*** 0.654*** (0.0189) (0.0193) (0.0210) Female 1.171*** 1.173*** 1.179*** (0.0220) (0.0221) (0.0225)
Panel B: Plan Characteristics Bronze 0.962 (0.0268) Silver 0.904*** (0.0281) Gold (Comparison Category) Fixed effects
geographic, date of enroll.
geographic, date of enroll.
geographic, date of enroll., plan chosen
N 18,083 18,083 18,083 Note: Cox Proportional Hazard Model. Sample: consumers over age 26 purchasing single-individual coverage who first enrolled in the exchange between July 2007 and Dec 2009. Data: transaction records, July 2007-Dec. 2009. Data: transaction records, July 2007-Dec 2009.
A revised final version of this paper will appear in the Winter 2013 issue of Inquiry.
16
7. Adverse Selection into non-Mandated Benefits
When insurance plans vary in coverage level, more generous plans are likely to attract consumers with
higher costs: adverse selection. A case study of demand for prescription drug coverage in Young Adult
plans illustrates the danger of adverse selection in exchanges. In the exchange’s Young Adult market,
plans are less generous (and cheaper) than coverage available in the regular market. In particular,
Young Adult plans are offered both with and without prescription drug coverage; in contrast, all tiered
plans must offer drug coverage. Young Adult plans with prescription drug coverage are about
$25/month more expensive than such plans without prescription drug coverage.
We find that the type of consumer who chooses a young adult plan is the type of consumer more
likely to use prescription drugs, as predicted by theories of adverse selection. (Lacking claims data, we
cannot directly measure prescription drug use in this sample.) Enrollment data show that nearly 80% of
female consumers choose plans with prescription drug coverage, compared to only 65% of male
consumers. Women are known to use prescription drugs at a higher rate (Roe, McNamara, and
Motheral 2002; Kaufman et al. 2002). In particular, for this age group, women are three times more
likely than men to fill prescriptions for antidepressants and have higher rates of use for dermatologic
agents, ulcer drugs, and oral contraceptives. (Roe, McNamara, and Motheral 2002). Moreover, even
though insurers are not permitted to price differently by gender, insurance companies may still be able
to price discriminate when setting the price of plans that disproportionally attract women versus men.
We return to this theme when we discuss age-based pricing in the next section.
In the presence of adverse selection, more choice is not always a good thing: plans with prescription
drug coverage cost more not only because prescription drug coverage is a valuable benefit, but because
consumers who choose this coverage are likely to expect to spend more on prescription drugs. There is a
tradeoff between value of additional choice and cost of the adverse selection. In other contexts,

A revised final version of this paper will appear in the Winter 2013 issue of Inquiry.
17
allowing more choice has led to a death spiral of more generous coverage; see Cutler and Reber 1998.
The cost of adverse selection can be mitigated by an effective risk-adjustment scheme, in which firms
receive higher payments for more costly enrollees. The ACA exchanges will contain a risk adjustment
scheme—Massachusetts does not during this time period— but designing an effective risk adjustment
program is difficult. (For instance, Brown, Duggan, Kuziemko, and Woolston 2011 argue that the
Medicare Advantage risk adjustment system is ineffective.)
8. Imperfect Competition and Pricing Regulation
Insurance markets are not perfectly competitive: market concentration has contributed to price
increases (Dafny, Duggan, Ramanarayanan 2009) and there is substantial price variation for essentially
identical products (see Starc 2011 and Maestas, Schroeder, and Goldman 2009 on the Medigap market).
In the Massachusetts HIE, plans from different insurers are not perfect substitutes, even after the
financial characteristics of plans in each tier were standardized. Beyond contractual features, the plans
are differentiated in a number of ways: first, plans still vary in their network of physicians, even among
standardized plans. Consumers may value the range of choice in one network over another, or may have
a preference for continuing to see their current physician. Moreover, some consumers may value the
brand name and reputation of the various insurers.
Because products are not perfect substitutes, price variation among plans on the Massachusetts
HIE remains high. On average, for a given plan design, the most expensive plan costs about 50% more
than the least expensive plan, holding constant the zip code and age of the enrollee. The ratio of the
price of the most expensive to cheapest plan is relatively constant across ages and geographies. As a
result, in dollar terms , price dispersion is largest for the oldest enrollees and most generous plans—a
$270/month range of prices for a gold plan for a 60 year-old, versus a $109/month range for a bronze-
low plan for a 30 year old.
A revised final version of this paper will appear in the Winter 2013 issue of Inquiry.
18
In a perfectly competitive market, insurers would not have the ability to price above marginal
cost. However, under imperfect competition, a profit-maximizing insurer will set price equal to cost plus
an additional markup term that is inversely related to the elasticity of demand for its product. Thus, if
firms face very elastic demand (enrollment is very sensitive to price) they will charge low markups, but
when demand is inelastic, high markups will result.
Insurers in the exchanges are allowed to price differentially based on age, and the existing
literature assumes that this differential pricing will result from cost-differences by age. However,
insurers can charge markups over cost, and the level of this markup will depend on how sensitive
consumers are to price. Because older consumers are less price sensitive, insurers will be able to charge
higher prices for older consumers even apart from differences in costs. In Ericson and Starc (2012b), we
show that there is substantial variation in consumer preferences and that this variation is closely related
to age. Younger consumers much more responsive to higher premiums than older consumers: a $1
change in premium on the average consumer under age 45 has the same effect on choice as a $3.50
price change on a consumer over age 45.
Moreover, because of modified community rating pricing regulations, premiums for different
ages are linked. Massachusetts allows prices vary only within 2:1 bands, while the ACA will allow for an
up to 3:1 ratio. Our research shows that consumers’ differential response to price by age implies that
the ratio of premiums of the oldest to youngest will exceed the ratio of these groups’ healthcare costs.
The extent to which the age-based pricing regulation will be binding depends not only on costs, but
preferences and markups.
In simulations in Ericson and Starc (2012b), we find that compared to unrestricted prices,
modified community rating has the potential to improve outcomes for consumers in this market. When
insurers with market are limited in how they can vary prices across different groups of consumers, they
A revised final version of this paper will appear in the Winter 2013 issue of Inquiry.
19
set prices based on the marginal consumers who will change their decisions, rather than the average
consumer. Because younger consumers are more likely to opt out their plans than older consumers,
when restricted by modified community rating, insurers set prices that are lower overall than they
would be if insurers could price entirely separately to different age groups. There is, however, a trade-
off: younger consumers still face higher prices, even as average prices fall. This raises prices for younger
consumers by approximately 8%, which is a considerable cost. Despite this trade-off, we find
restrictions on age-based pricing increase total consumer welfare in the presence of an effective
mandate to purchase insurance. We find that when age-bands are narrower (1:1 or 2:1, versus 3:1), the
overall consumer surplus is higher—but so is the transfer away from younger consumers. However, in
the absence of a mandate, substantial unraveling can occur under age-based pricing restrictions since
younger consumers derive less benefit from holding insurance.
Modified community rating will also interact with other pricing and product regulation. Because
minimum medical loss ratio regulations limit the extent to which insurers can charge markups, they can
hold down prices for even younger consumers.9 While Massachusetts had no loss ratio regulation, the
ACA does. Our simulations show that the ACA regulation will reduce the transfers from the young to the
old that result from the restrictions in modified community rating, while keeping still creating price
pressure on insurers by making young consumers the marginal consumer to whom prices are set.
Finally, we note that the definition of minimum creditable coverage is crucial, given that consumer
demand is cluster at the lowest tier of generosity. Moreover, the absence of a mandate would lead to
much higher premiums, especially for younger consumers, due to selection out of the market.
9 The ACA’s minimum medical loss ratio regulation requires insurers to payout at least 80% of premiums on health care claims .

A revised final version of this paper will appear in the Winter 2013 issue of Inquiry.
20
9. Conclusion
Health insurance exchange designers have many decisions to make, at both the legislative and agency
level. Making wise decisions are crucial for the functioning of the market: the potential consequences of
poor regulation are large, as insurance markets can fail to function without appropriate regulation.
Fortunately, the Massachusetts HIE can shed light on consumer behavior, firm strategies, and the
interaction of regulation on exchanges.
We have touched on a number of themes in this review of the Massachusetts evidence that will
be revisited by exchange designers in other states. Consumers have difficulty trading-off attributes of
complex insurance products, and so may rely on heuristics. Choice architecture will affect the market,
and exchange designers can improve consumer satisfaction by providing an interface that simplifies and
clarifies the tradeoffs. Standardization of benefits has the potential to intensify market competition, but
it can also go wrong if the wrong plans are chosen. The dynamics of enrollee behavior provide
information on the role exchanges play: are enrollees just choosing stop-gap coverage for brief periods,
or do they rely on the exchanges as long-term sources of insurance? Insurance markets are imperfectly
competitive, so more information than health costs is necessary when forecasting the level of prices and
how prices vary between groups—preferences matter as well. Understanding how insurance firms price
to preferences is crucial to understanding the effects of modified community rating and minimum
medical loss ratio regulations.
States have substantial latitude in how the exchanges are designed and regulated. The
Massachusetts HIE provides one model that has proven largely successful, even as it continues to
evolve. Yet the Massachusetts insurance landscape differs from that in other states, as it had lower
rates of uninsurance prior to reform. As other states develop their own versions of the exchanges, our
understanding of exchange design will develop. Examining how variation between state exchange
A revised final version of this paper will appear in the Winter 2013 issue of Inquiry.
21
regulations relates to outcomes can help refine our knowledge of insurance markets and improve
regulations, but states should not neglect the power of running their own experiments within an
exchange.
References
Abaluck, J.T. and J. Gruber. 2011. Choice inconsistencies among the elderly: Evidence from plan choice in the Medicare Part D program. American Economic Review 101(3):1180–1210.
Brown, J. et al., 2011. How does Risk Selection Respond to Risk Adjustment? Evidence from the Medicare Advantage Program. NBER Working Paper 16977.
Congressional Budget Office. 2012. Updated Estimates for the Insurance Coverage Provisions of the Affordable Care Act. http://cbo.gov/publication/43076.
Culter, D.M. and S.J . Reber. 1998. Paying for Health Insurance: The Trade-Off between Competition and Adverse Selection. The Quarterly Journal of Economics 113(2):433―466.
Dafny, L., M. Duggan and S. Ramanarayanan. 2009. Paying a Premium on Your Premium? Consolidation in the U.S. Health Insurance Industry. NBER Working Paper 15434. Cambridge, Mass.: National Bureau of Economic Research (NBER).
Ericson, K.M. and A. Starc. 2012a. Heuristics and Heterogeneity in Health Insurance Exchanges: Evidence from the Massachusetts Connector. American Economic Review 102(3):493-497.
Ericson, K.M. and A. Starc. 2012b. Age-Based Heterogeneity and Pricing Regulation on the Massachusetts Health Insurance Exchange. NBER Working Paper 18089. Cambridge, Mass.: National Bureau of Economic Research (NBER).
Ericson, K.M. and A. Starc. 2012c. How Product Standardization Affects Choice: Evidence from the Massachusetts Health Insurance Exchange. Boston University Working Paper. Boston, Mass.: Boston University.
Gruber, J. 2011. Massachusetts Points the Way to Successful Health Care Reform. Journal of Policy Analysis and Management 30(1):184–192.
Herring, B. 2010. Suboptimal provision of preventive healthcare due to expected enrollee turnover among private insurers. Health Economics 19(4):438–448.
Kaufman D.W., J.P. Kelly, L. Rosenberg , T.E. Anderson, and A.A. Mitchell. 2002. Recent patterns of medication use in the ambulatory adult population of the United States. JAMA: The Journal of the American Medical Association 287(3):337.
Kolstad J.T. and A.E. Kowalski. 2010. The Impact of Health Care Reform On Hospital and Preventive Care: Evidence from Massachusetts. NBER Working Paper 16012. Cambridge, Mass.: National Bureau of Economic Research (NBER).
A revised final version of this paper will appear in the Winter 2013 issue of Inquiry.
22
Long, S. and L. Phadera. 2009. Estimates of health insurance coverage in Massachusetts from the 2009 Massachusetts Health Insurance Survey. Report. Washington, D.C.: Urban Institute.
Maestas, M., M. Schroeder, and D.P. Goldman. 2009. Price Variation in Markets with Homogeneous Goods: The Case of Medigap. NBER Working Paper 14679. Cambridge, Mass.: National Bureau of Economic Research (NBER).
Miller, S. 2012. The Impact of the Massachusetts Health Care Reform on Health Care Use among Children. American Economic Review 102(3):502–07.
Paasche-Orlow, M., R. Parker, J. Gazmararian, L. Nielsen-Bohlman, and R. Rudd. 2005. The prevalence of limited health literacy. Journal of General Internal Medicine 20(2):175–184.
Peterson, Chris. 2009. “Setting and Valuing Health Insurance Benefits”. Congressional Research Service. Report R4049. April 6, 2009.
Roe C.M., A.M. McNamara, and B.R. Motheral . 2002. Gender-and age-related prescription drug use patterns. The Annals of Pharmacotherapy 36(1):30-39.
Starc, A. 2011. Insurer Pricing and Consumer Welfare: Evidence from Medigap. University of Pennsylvania Working Paper. Philadelphia, Penn.: University of Pennsylvania.
Wyman, O., D. Welch, and K. Giesa. 2010. Analysis of Individual Health Coverage in MA Before and After the July 1 2007 Merger of the Small Group and Nongroup Health Insurance Markets. Report to the Health Care Access Bureau of the Massachusetts Division of Insurance.