Embed Size (px)
Citation preview

Designing An Information Commons for Sustainability Science: Lessons Learned from a World Data Center
Marc LevyCIESIN
Earth Institute, Columbia University
Presentation to International Workshop on Designing Global Information Commons for Innovation in Frontier Sciences
8-10 November 2007Tokyo, Japan
World Data Center for Human Interactions in the Environment

Evolution of the Data Provider Model
Researcher
Researcher
Repository
Public
ResearcherResearcher
Public
Researcher
Researcher
Data
Cyberinfrastructure
Research community
Decision-making community

Data Domain Understanding (What do these data mean? Are they suitable for my use?)
Access
Linkage Understanding (How do these data relate to other data?)
DiscoveryReliability and continuity
Catalogs
Documentation, visualization
Integration
On-line databasesStewardship
Interoperability
Standards; georeferencing; time-stamping

Data Domain Understanding (What do these data mean? Are they suitable for my use?)
Access
Linkage Understanding (How do these data relate to other data?)
DiscoveryReliability and continuity
Interoperability
What data communities provide

Dynamics of Human-Environment Interactions
OpportunityEconomic loss
Complex change
Equilibrium

This is our world• Multiple stresses
– Economic– Demographic– Political– Change in land cover– Water scarcity– Soil fertility problems
• Complex outcomes– Livelihoods– Health– Equity– Security– Culture

Helping Users Make Wise Choices is Hard!
Presumed Practical Competence of Group as Function of Number of Disciplines
0
5
10
15
20
25
1 2 3 4 5
Disciplines
Ph.D
B.A.
High School
5th
Grade
Traditional Documentation not enough
Multi-faceted approach requiredComparative Guides
Visualizations
Common Pitfalls
Examples
Citations
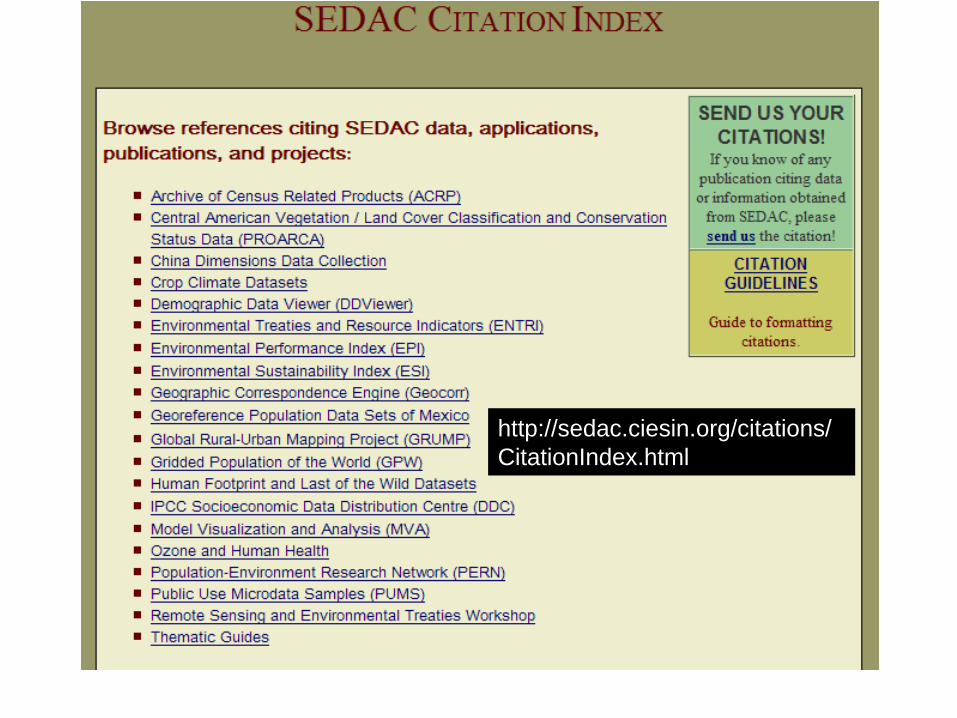
http://sedac.ciesin.org/citations/ CitationIndex.html

, , , , g , , j , , , , , ( ) gPoor Livestock Keepers at the Global Level for Research and Development Targeting. Land Use Policy, 20(4): 311-322.
Tobler, W., Deichmann, U., Gottsegen, J., and Maloy, K. (1997) World Population in a Grid of Spherical Quadrilaterals. International Journal of Population Geography, 3: 203-225.
van Lieshout, M., Kovats, R.S., Livermore, M.T.J., and Martens, P. (2004) Climate Change and Malaria: Analysis of the SRES Climate and Socio-Economic Scenarios. Global Environmental Change, 14(1): 87-99.
Vassolo, S. and Döll, P. (2005) Global-scale Gridded Estimates of Thermoelectric Power and Manufacturing Water Use. Water Resources Research, 41.
Verburg, P.H., and Chen, Y. (2000) Multiscale Characterization of Land-Use Patterns in China. Ecosystems, 3(4): 369-385.
Viviroli, D. and Weingartner, R. (2004) The Hydrological Significance of Mountains: from Regional to Global Scale. Hydrology and Earth System Science, 8(6): 1016-1029.
Vorosmarty, C.J., Green, P., Salisbury, J., and Lammers, R.B. (2000) Global Water Resources: Vulnerability From Climate Change Acid Population Growth. Science, 289(5477): 284-288.
Vorosmarty, C.J., and Sahagian, D. (2000) Anthropogenic Disturbance of the Terrestrial Water Cycle. Bioscience, 50(9): 753-765.
White, M.A., Hoffman, F., Hargrove, W.W., and Nemani, R.R. (2005) A Global Framework for Monitoring Phenological Responses to Climate Change. Geophysical Research Letters, 32(L04705): 4pp.
White, M.A., Nemani, R.R., Thornton, P.E., and Running, S.W. (2002) Satellite Evidence of Phenological Differences Between Urbanized and Rural Areas of the Eastern United States Deciduous Broadleaf Forest. Ecosystems, 5(3): 260-273.
Wilson, S.J., Steenhuisen, F., Pacnya, J.M., and Pacnya, E.G. (2006) Mapping the Spatial Distribution of Global

Source: Vörösmarty et al. 2000
• 80% of future stress frompopulation
& development, not climate change!
• Future distortions of thewater cycle are inevitable
• Issue gaining momentum in global policy fora
(e.g. Millennium Assessment, World Water Assessment
Programme, MDGs)
Water Stress Changes to 2025
UNH
Less stressNo changeMore stress
•

Information on data quality is critical to judging goodness of fit

It shouldn’t even be this hard


Helping users make wise choices is a
community-building and community-
strengthening task

Moore’s Law Benefits Data Collection Processes Unequally
=/
0
2
4
6
8
10
12
14
16
18
1950 1960 1970 1980 1990 2000
Cen
sus
cost
(per
per
son,
199
0 do
llars
0.01
0.1
1
10
100
1000
10000
100000
1000000
Pro
cess
or c
ost (
$ pe
r 10
00 c
alcu
latio
ns),
log
scal
e
Census costProcessor cost
Pace of progress across data domains is very uneven.
Greater the divergence, greater the Integration Frustration

Environmentalvariability &change
Variability &change in human conditions
Exposure
Sensitivity Resilience
Adjustments & Adaptations
Resilience
System Responses
Socioeconomic Conditions
Biophysical conditions
∆
Risks & impacts
Coupled System
Exposure
Structure-functionbiosphere & change
Structure-functionpolitical economy& change
Temporal and spatial dynamics omitted
Perturbations &Stresses[environmental & socioeocnomic; kinds & sequencing
Turner, Matson, Kasperson and Kasperson, 2002
These are frequently missing links

Identify and Fill Gaps!
CIESIN, Gridded Population of the World, 350,000 census input units

73 M people. Largest urban extent

Exposure to Multiple Natural Hazards
Seismic hazards include earthquakes and volcanoes; hydrological hazards include floods, cyclones, and landslides


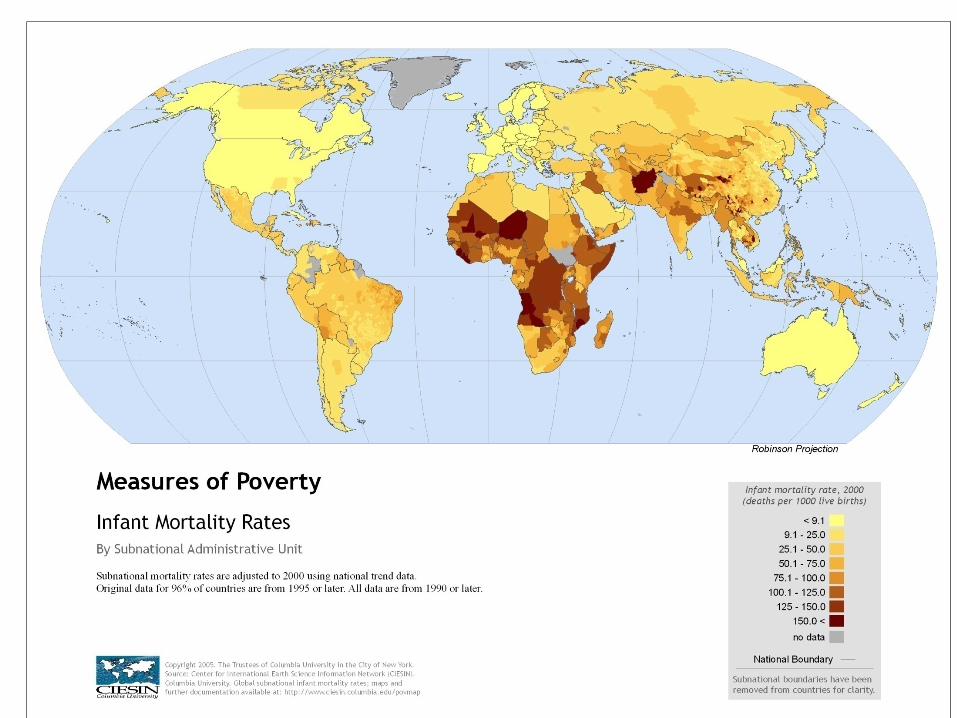
Growing Season and DroughtDistribution of non-poor population
Distribution of poor and extremely poor population

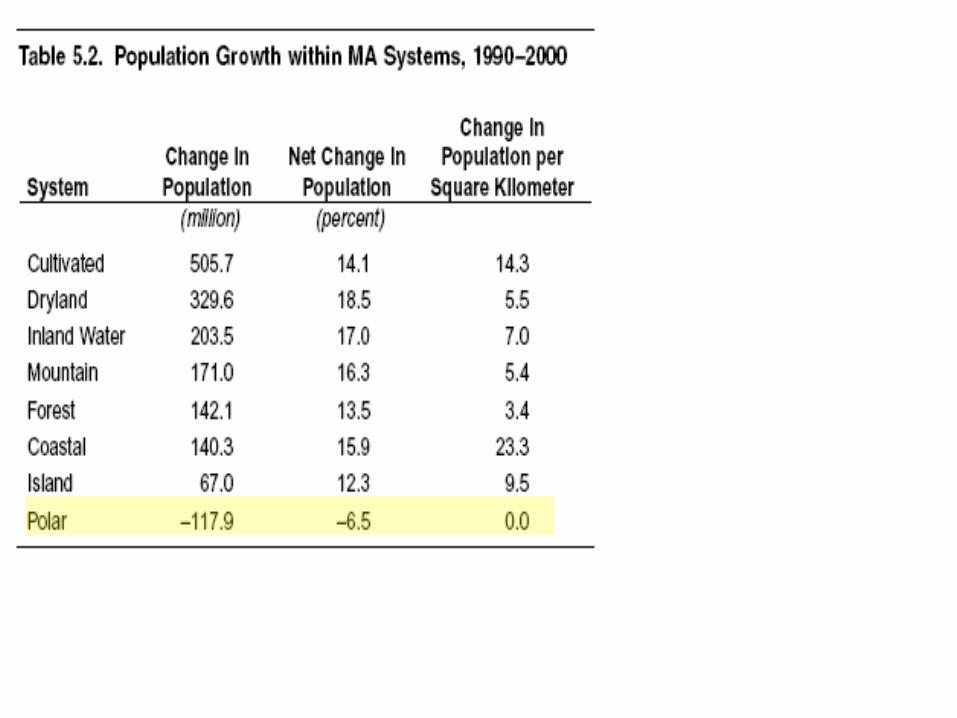
Millennium Ecosystem Assessment, 2005

Many more gaps to fill!• Roads • Migration• Time-series spatial data on population,
urbanziation• Spatial economic data• Soil fertility• Spatial health data
Prioritize
Assign roles
Be transparent
Persevere!

Challenge of model data
Input data sets
Harmonized data sets Model
Output data sets
ConclusionsClear ExplanationIncomprehensible
ExplanationTOUGHEST NUT
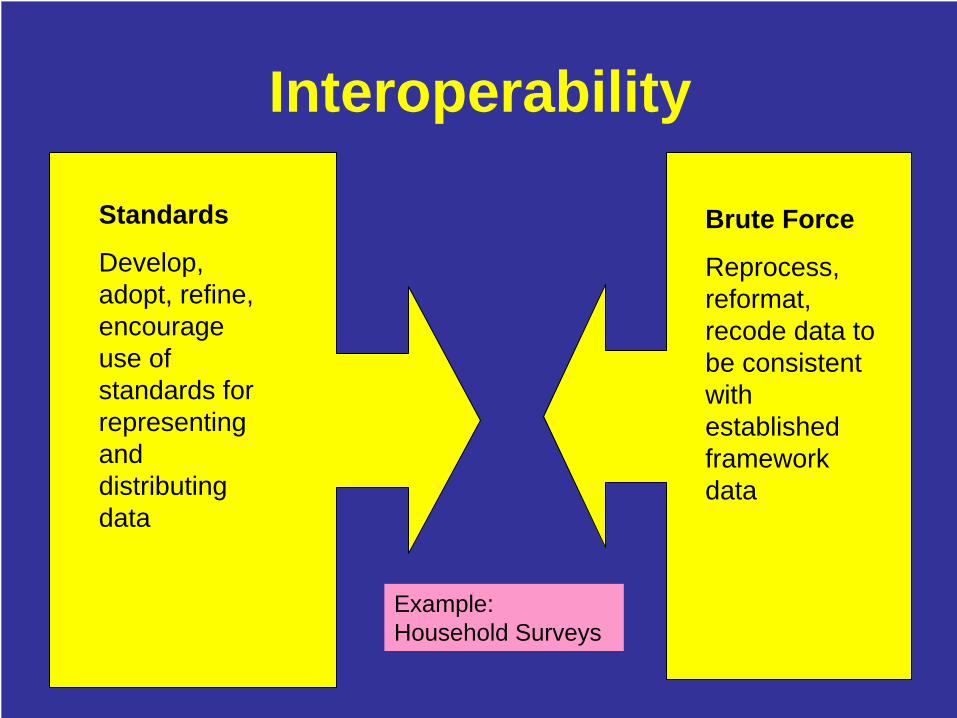
Interoperability
Standards
Develop, adopt, refine, encourage use of standards for representing and distributing data
Brute Force
Reprocess, reformat, recode data to be consistent with established framework data
Example: Household Surveys
Stewardship
• Almost always under-provided• Everyone underestimates the speed by
which data becomes invisible or unintelligible
• Inter-disciplinary, problem-oriented data especially vulnerable

Data Domain Understanding (What do these data mean? Are they suitable for my use?)
Access
Linkage Understanding (How do these data relate to other data?)
DiscoveryReliability and continuity
Catalogs
Documentation, visualization
Integration
On-line databasesStewardship
Interoperability
Standards; georeferencing; time-stamping

Conclusions• We don’t know how to do everything yet, but we
know a lot more now than a decade ago• The investments show positive economies of
scale– each step forward getting the data questions right
generates more research and policy return than previous steps
• But what remains is going to require sustained, focused effort– There’s a lot of hard stuff yet to do
• Historically, funders don’t like this kind of work– That seems to be changing

Plan for the issue-cycle
Hype
Growth
Despair
Consolidation
Origin


![Designing for Sustainability [Infographic]](https://img.pdfslide.us/doc/110x75/55a982df1a28ab6f458b479f/designing-for-sustainability-infographic.jpg)