Embed Size (px)
Citation preview
(2016). Designing an automated assessment of public speaking skills using multimodal cues . Journal of Learnin g An a ly t ic s, 3 (2 ), 2 61–2 8 1.
http://dx.doi.org/10.18608/jla.2016.32.13
ISSN 1929-7750 (online). The Journal of Learning Analytics works under a Creative Commons License, Attribution - NonCommercial-NoDerivs 3.0 Unported (CC BY-NC-ND 3.0)
261
Designing an Automated Assessment of Public Speaking Skills Using
Multimodal Cues
Lei Chen Educational Testing Service (ETS)
Princeton, New Jersey, USA
Gary Feng Educational Testing Service (ETS)
Princeton, New Jersey, USA
Chee Wee Leong Educational Testing Service (ETS)
Princeton, New Jersey, USA
Jilliam Joe Educational Testing Service (ETS)
Princeton, New Jersey, USA
Christopher Kitchen Educational Testing Service (ETS)
Princeton, New Jersey, USA
Chong Min Lee Educational Testing Service (ETS)
Princeton, New Jersey, USA
ABSTRACT: Traditional assessments of public speaking skills rely on human scoring. We report a n
initial study on the development of an automated scoring model for public speaking performances using multimodal technologies. Task design, rubric development, and human rating were conducted according to standards in educational assessment. An initial corpus of 17 speakers with four speaking tasks was collected using audio, video, and 3 -D motion capturing
devices. A scoring model based on basic features in speech content, speech delivery, and hand, body, and head movements significantly predicts human rating, suggesting the feasibil ity of using multimodal technologies in the assessment of public speaking skills.
Keywords: Automated assessment, multimodal sensing, Kinect, motion tracking, public speaking
(2016). Designing an automated assessment of public speaking skills using multimodal cues . Journal of Learnin g An a ly t ic s, 3 (2 ), 2 61–2 8 1.
http://dx.doi.org/10.18608/jla.2016.32.13
ISSN 1929-7750 (online). The Journal of Learning Analytics works under a Creative Commons License, Attribution - NonCommercial-NoDerivs 3.0 Unported (CC BY-NC-ND 3.0)
262
1 INTRODUCTION
Oral communication is recognized as one of the most highly valued skills for success in the workplace (cf.
Kyllonen, 2012) and school. Public speaking is widely known to be the most feared form of oral
communication (Pull, 2012) but is often overlooked in educational assessment. A successful public
speaking performance is distributed across multiple modalities — e.g., the speech content, voice and
intonation, facial expressions, head poses, hand gestures, and body postures.
While most current rubrics for evaluating public speaking performance attend to both verbal and non -
verbal aspects, virtually all existing assessments in practice require human rating (Ward, 2013;
Schreiber, Paul, & Shibley, 2012; Carlson & Smith-Howell, 1995). In this article, we describe research
using multimodal sensing — namely motion tracking, head tracking, and speech processing — toward
developing an assessment system for automated scoring of presentation skills.
The article is organized as follows: Section 2 reviews previous research on a) analyzing presentation
performance using oral and multimodal cues and b) multimodal corpora using the Kinect tracking
device. Section 3 describes the multimodal presentation corpus we created, including tasks, data
recording methods, and the human scoring process. Section 4 describes experiments predicting
presentation skills using multimodal features extracted from audio, video, and moti on data. Finally,
Section 5 summarizes the findings of the paper and discusses future research directions.
2 PREVIOUS RESEARCH
There is an emerging body of literature on using audio and video cues to evaluate presentation skill s. In
their patent publication, Silverstein and Zhang (2003) depict the use of audio analysis techniques to
provide evaluation feedback for real-time oral presentations. Audio alone, however, does not address
other modalities of the performance. Rosenberg and Hirschberg (2005) analyzed lexical and prosodic
cues for charisma, the ability to command authority based on personal qualities. By using a political
speech corpus, they found that human raters could rate charisma quite consistently. A set of features,
such as F0, speaking rate, and the number of first person pronouns, were found useful in predicting
charisma. This suggests the possibility of using simple acoustics and lexical cues for predicting
paralinguistic related aspects of public speaking.
Scherer, Layher, Kane, Neumann, and Campbell (2012) conducted an audio/visual analysis on a political
speech corpus and found some cues related to the rating of speaking performance. Among visual cues,
motion energy1 was found to be correlated with speaking performance. The study also used an eye-
tracker to analyze subjects’ gaze patterns. Kurihara, Goto, Ogata, Matsusaka, and Igarashi (2007)
1 The details of computing motion energy were provided in Section 3.2 in Scherer, Layher, Kane, Neumann, & Campbell (2012).
(2016). Designing an automated assessment of public speaking skills using multimodal cues . Journal of Learnin g An a ly t ic s, 3 (2 ), 2 61–2 8 1.
http://dx.doi.org/10.18608/jla.2016.32.13
ISSN 1929-7750 (online). The Journal of Learning Analytics works under a Creative Commons License, Attribution - NonCommercial-NoDerivs 3.0 Unported (CC BY-NC-ND 3.0)
263
developed a presentation coaching system using Automatic Speech Recognition (ASR), prosody analysis,
and image processing. A marker-based computer vision object-tracking method was used for head
tracking. However, marker-based and video-only methods for tracking body movements tend to be
cumbersome and error-prone.
With the introduction of 3-D sensing devices such as Microsoft Kinect, tracking human movements has
become increasingly easy and accurate for multimodal research (Zhang, 2012). Swift et al. (2012)
created a multimodal corpus for research on learning everyday tasks, which included audio, video,
Kinect RGB-Depth video and object-touch data while subjects demonstrated how to make a cup of tea.
Anvil (Kipp, 2012), a very popular video annotation tool, has been updated to include a Kinect recording
cookbook and support for displaying Kinect 3-D tracking results.
Kinect devices have been utilized for analyzing speakers’ full body behaviours during their presentations.
For example, in a brief report, Nguyen, Chen, and Rauterberg (2012) proposed building a public speaking
evaluation system. Students participating in a scientific presentation course were recorded using a
Kinect device. Body posture and hand gestures were analyzed using Laban Movement Analysis (LMA), a
coding scheme widely used in dance analysis. A more comprehensive approach to public speaking
performance evaluation is illustrated by Batrinca, Stratou, Shapiro, Morency, and Scherer (2013), who
created a public speaking skill training system with a combination of advanced multimodal sensing and
virtual human technologies. In particular, MultiSense (Scherer, Stratou, & Morency, 2013) was use d to
record and recognize a set of the multimodal behaviours of presenters. Meanwhile, a virtual audience
would respond to the quality of the presentation in real time to provide feedback and training
opportunities. Two Toastmaster club members were asked to rate a set of low-level observations about
presentation performance, such as speaking rate, pace, and so on. On such low-level observations, quite
high inter-rater agreements were reported.
Recently, a dataset of oral presentations, including slides and corresponding multimodal recordings, was
provided in the Multimodal Learning Analytics (MLA) 2014 grand challenge and workshop. This dataset,
known as the Oral Presentation Quality Corpus (ESPOL, 2014), was collected in Ecuador as part of a
college level course. Students formed groups of up to six people and developed a presentation (in either
PowerPoint or PDF format), before delivering their presentations individually. In total, 441 multimodal
presentations (approximately 19 hours of multimodal data, i.e., audio, video, and depth data) were
recorded using a video camera and a Kinect for Xbox device. The presentations were rated on several
dimensions. ESPOL (2014) has released all of the videos, Kinect motion trace files, and associated human
scores as part of the MLA 2014 Grand Challenge.
Using this data from the MLA ’14 grand challenge, researchers have conducted several initial
investigations on the automatic evaluation of the quality of presentations and slides. A summary of
these studies can be found in Ochoa, Worsley, Chiluiza, and Luz (2014). In particular, Luzardo, Guamn,
Chiluiza, Castells, and Ochoa (2014) investigated using audio cues — i.e., the speaking rate, as estimated
(2016). Designing an automated assessment of public speaking skills using multimodal cues . Journal of Learnin g An a ly t ic s, 3 (2 ), 2 61–2 8 1.
http://dx.doi.org/10.18608/jla.2016.32.13
ISSN 1929-7750 (online). The Journal of Learning Analytics works under a Creative Commons License, Attribution - NonCommercial-NoDerivs 3.0 Unported (CC BY-NC-ND 3.0)
264
from audio files, and some basic prosodic analysis — to judge delivery performance. Echeverría,
Avendaño, Chiluiza, Vásquez, and Ochoa (2014) investigated using Kinect motion traces for measuring
body language performance during presentations. Chen, Leong, Feng, and Lee (2014) used a
combination of speech, motion, and head tracking features to predict presentation scores. They first
reduced the 9-dimension human scores using the Principal Component Analysis (PCA), resulting in two
principal components (PCs) — one for presentation delivery and another for the quality of the slides.
Chen, Leong, et al. (2014) demonstrated that a scoring model based on automatically extracted
multimodal features can significantly predict human scores in both principal components.
Although the OPQC corpus contains 441 multimodal presentations, it has several drawbacks with its
recording setup and human scoring. For example, since the data were collected from real classrooms,
sometimes there were issues with noticeable device shaking and the synchronization between video and
motion traces. As for human scoring, discrete score bands were not utilized, and there was n o double -
scoring effort. Finally, the data were exclusively open to the participants of the MLA ’14 challenge.
Chen, Feng, et al. (2014) is a preliminary study in this direction. Similar to Batrinca et al. (2013) and
ESPOL (2014), a public speaking corpus has been created using a Kinect device for Microsoft to record
speakers’ full body movements. Based on the motion traces tracked by Kinect, several velocity -re lated
motion features were extracted for inferring speakers’ performance. Chen, Feng, et al. (2014) suggested
that both speech and visual features play useful roles for automatically predicting presentation human -
rated scores.
Two observations can be drawn from the literature. Regarding the technology, a combination of 3-D
sensors such as Kinect and high quality audio/video recording has been widely used for evaluating
presentation performances. Regarding applications, there is much interest in designing interactive
systems for training presentation skills. We believe that multimodal technology can transform
traditional human-scored public speaking assessments (Schreiber et al., 2012) and make them more
reliable and cost-efficient.
Our primary research question, therefore, is whether machine -generated multimodal features can
predict human scores in a standardized performance-based public speaking assessment. The
aforementioned multimodal research (Nguyen et al., 2012; Batrinca et al., 2013; Ochoa et al., 2014) has
so far been based on non-standardized scoring rubrics and human scoring processes, leaving it
vulnerable to reliability threats. One contribution of the current research is to bring technologies and
techniques developed in learning and training applications to educational assessment, which places
more emphasis on the standardization of task design and scoring rubrics (Joe, Kitchen, Chen, & Feng, in
press). To this end, we conducted an initial study to design and prototype a public speaking test with the
goal of automated multimodal scoring.
(2016). Designing an automated assessment of public speaking skills using multimodal cues . Journal of Learnin g An a ly t ic s, 3 (2 ), 2 61–2 8 1.
http://dx.doi.org/10.18608/jla.2016.32.13
ISSN 1929-7750 (online). The Journal of Learning Analytics works under a Creative Commons License, Attribution - NonCommercial-NoDerivs 3.0 Unported (CC BY-NC-ND 3.0)
265
3 MULTIMODAL CORPUS
3.1 Tasks
The prototype assessment included five public speaking tasks. Task A was an icebreaker, in which the
speaker introduced him- or herself; this task is not analyzed due to the personally identifiable
information involved. Tasks B and C were modelled after prepared informational speeches, in which the
speaker was given a pre-prepared slide deck and up to 10 minutes to prepare for the presentation. Task
B was a business presentation, in which the speaker was to present a financial report. Task C was a
simulated teaching task on the topic targeting middle-school students. The other two tasks were
persuasive and impromptu speeches. Task D asked speakers to consider a movie that they did not l ike
but nonetheless recommend it to others. Task E asked speakers to consider a place inconvenient to l ive
in and discuss the benefits of living there. No visual aids were provided for Tasks D and E.
3.2 Multimodal Data Collection
A Microsoft Kinect for Windows Version 1 device was used to record 3-D body motions. Brekel Pro Body
Kinect tracking software (v1.30 64-bit version) was used to record 48 body joints and stored the motions
in the Biovision hierarchical data format (BVH). A JVC Everio GZ-HM35BUSD digital camcorder was used
for audio/video recording. The camcorder was mounted together with Kinect on a tripod. The raw video
resolution used the UXP high definition setting, which uses a 1920x1080i resolution and a bit rate of 24
Mbps on average, and was saved in the MTS format. Note that we did not use wireless microphones
that tend to provide clearer recordings compared to the built-in microphone on the camcorder. We
made this decision hoping to reduce the complexity of our hardware setup to make the developed
technology easier to use in practice. Both the Kinect and the camcorder were placed 6 feet away from
the front of the speaking zone, which was marked on the ground. For Tasks B and C, a SMART Board
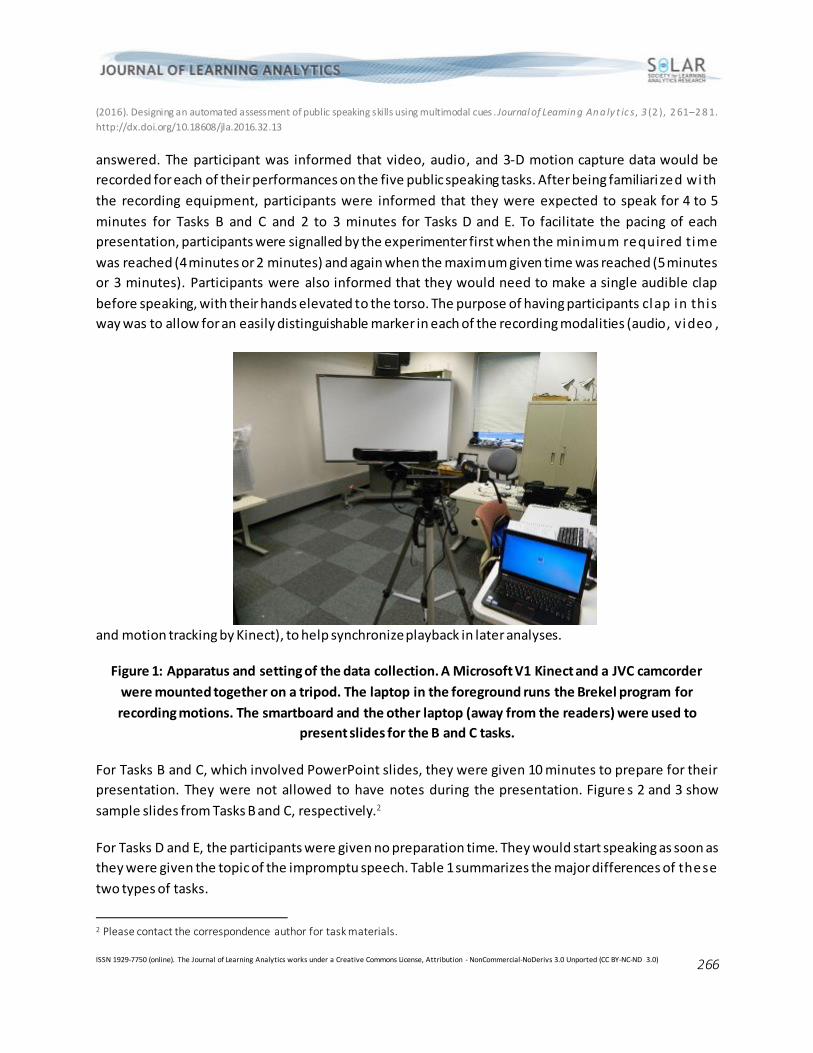
projector system was used to show the PowerPoint slides. Figure 1 shows the apparatus involved in the
data collection.
Speakers included 17 volunteers recruited from an education assessment company, with 10 male and 7
female participants. Seven of the participants were experienced public speakers from the Toastmasters
Club. The rest varied widely in their public speaking experience. The participants’ time was paid for by
the employer so they did not receive additional compensation. Before recording, participants completed
a 10-item initial background questionnaire related to prior experiences with and attitudes towards
public speaking. All participants indicated fluency in English and only two out of the 17 participants
reported English as a second or third language. Data from the background questionnaires show that the
participants as a whole had prior experience in public speaking: 68.8% of participants estim ated giving
professional presentations or prepared talks at least yearly and 37.5% at least monthly .
At the beginning of each structured laboratory recording session, the experimenter reviewed the
purpose of the study with the participant and offered an opportunity to have his/her questions
(2016). Designing an automated assessment of public speaking skills using multimodal cues . Journal of Learnin g An a ly t ic s, 3 (2 ), 2 61–2 8 1.
http://dx.doi.org/10.18608/jla.2016.32.13
ISSN 1929-7750 (online). The Journal of Learning Analytics works under a Creative Commons License, Attribution - NonCommercial-NoDerivs 3.0 Unported (CC BY-NC-ND 3.0)
266
answered. The participant was informed that video, audio, and 3-D motion capture data would be
recorded for each of their performances on the five public speaking tasks. After being familiarized with
the recording equipment, participants were informed that they were expected to speak for 4 to 5
minutes for Tasks B and C and 2 to 3 minutes for Tasks D and E. To facilitate the pacing of each
presentation, participants were signalled by the experimenter first when the minimum required time
was reached (4 minutes or 2 minutes) and again when the maximum given time was reached (5 minutes
or 3 minutes). Participants were also informed that they would need to make a single audible clap
before speaking, with their hands elevated to the torso. The purpose of having participants clap in this
way was to allow for an easily distinguishable marker in each of the recording modalities (audio, video ,
and motion tracking by Kinect), to help synchronize playback in later analyses.
Figure 1: Apparatus and setting of the data collection. A Microsoft V1 Kinect and a JVC camcorder
were mounted together on a tripod. The laptop in the foreground runs the Brekel program for
recording motions. The smartboard and the other laptop (away from the readers) were used to
present slides for the B and C tasks.
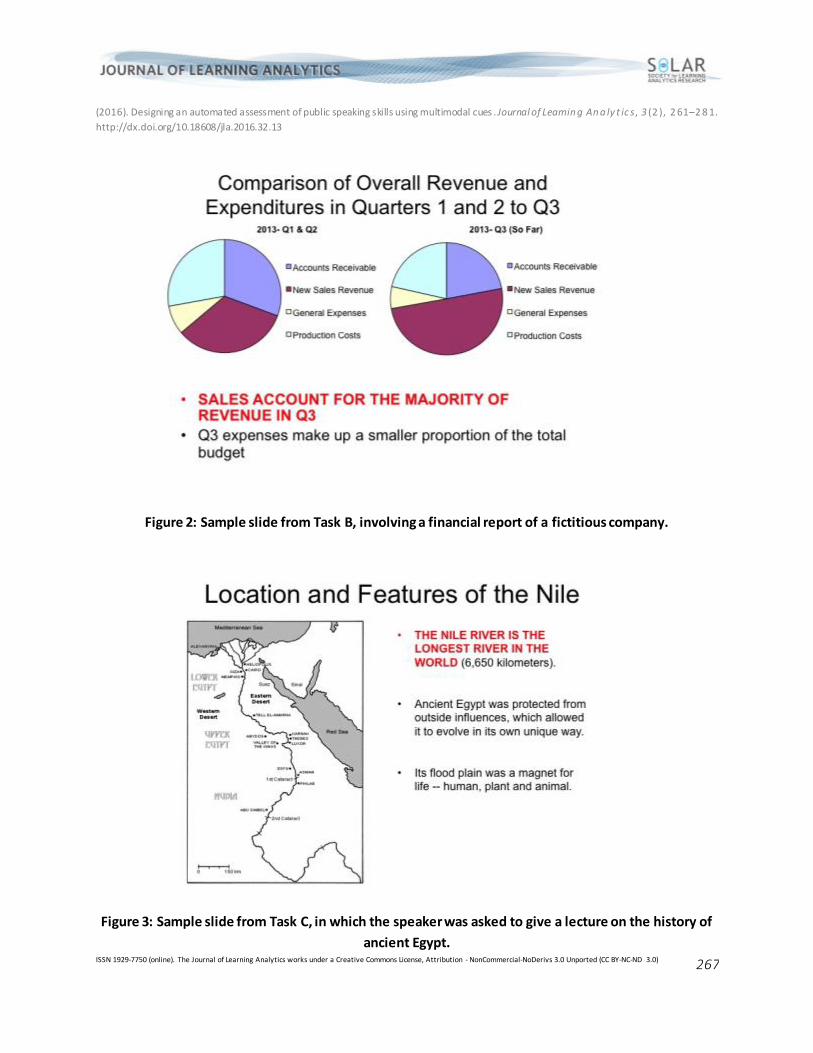
For Tasks B and C, which involved PowerPoint slides, they were given 10 minutes to prepare for their
presentation. They were not allowed to have notes during the presentation. Figure s 2 and 3 show
sample slides from Tasks B and C, respectively.2
For Tasks D and E, the participants were given no preparation time. They would start speaking as soon as
they were given the topic of the impromptu speech. Table 1 summarizes the major differences of these
two types of tasks.
2 Please contact the correspondence author for task materials.
(2016). Designing an automated assessment of public speaking skills using multimodal cues . Journal of Learnin g An a ly t ic s, 3 (2 ), 2 61–2 8 1.
http://dx.doi.org/10.18608/jla.2016.32.13
ISSN 1929-7750 (online). The Journal of Learning Analytics works under a Creative Commons License, Attribution - NonCommercial-NoDerivs 3.0 Unported (CC BY-NC-ND 3.0)
267
Figure 2: Sample slide from Task B, involving a financial report of a fictitious company.
Figure 3: Sample slide from Task C, in which the speaker was asked to give a lecture on the history of
ancient Egypt.
(2016). Designing an automated assessment of public speaking skills using multimodal cues . Journal of Learnin g An a ly t ic s, 3 (2 ), 2 61–2 8 1.
http://dx.doi.org/10.18608/jla.2016.32.13
ISSN 1929-7750 (online). The Journal of Learning Analytics works under a Creative Commons License, Attribution - NonCommercial-NoDerivs 3.0 Unported (CC BY-NC-ND 3.0)
268
Table 1: A summary of the two types of presentation tasks used in our data collection.
Task type Using Slides
Prep. Time (min)
Speaking Time (min)
Topics
Informative (B & C)
Yes 10 4 to 5 B: business C: history
Impromptu (D & E)
No 0 2 to 3 D: movie E: location
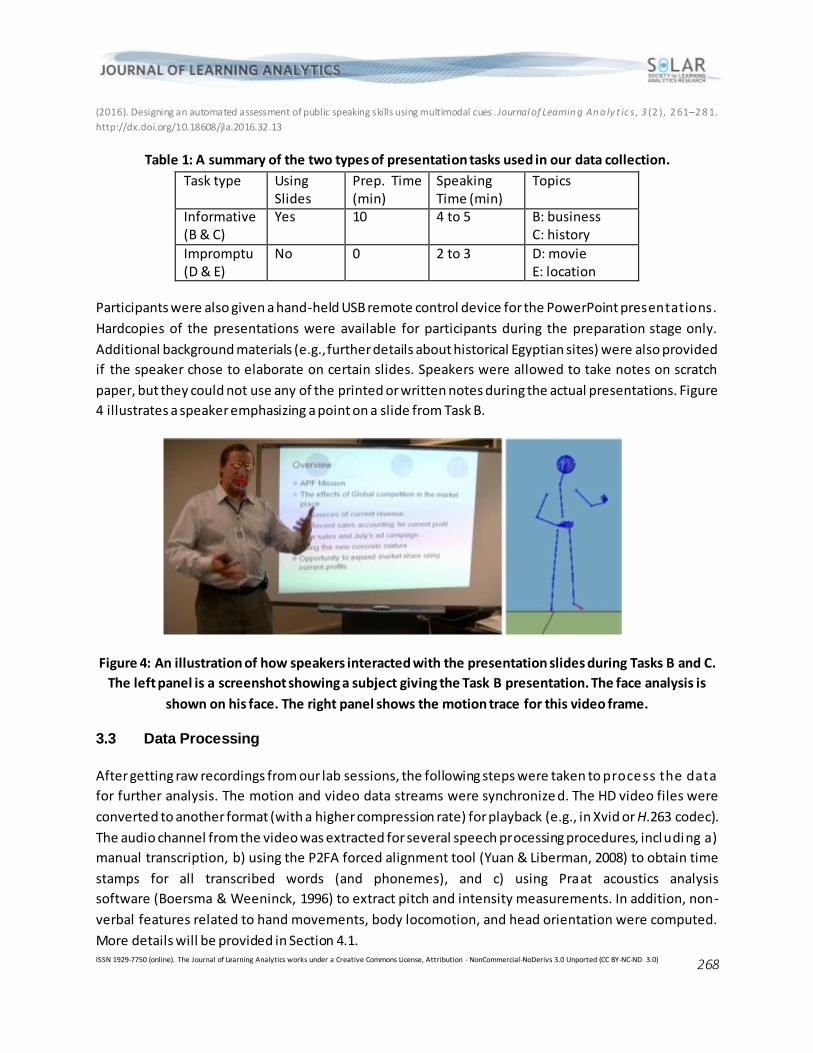
Participants were also given a hand-held USB remote control device for the PowerPoint presentations.
Hardcopies of the presentations were available for participants during the preparation stage only.
Additional background materials (e.g., further details about historical Egyptian sites) were also provided
if the speaker chose to elaborate on certain slides. Speakers were allowed to take notes on scratch
paper, but they could not use any of the printed or written notes during the actual presentations. Figure
4 illustrates a speaker emphasizing a point on a slide from Task B.
Figure 4: An illustration of how speakers interacted with the presentation slides during Tasks B and C.
The left panel is a screenshot showing a subject giving the Task B presentation. The face analysis is
shown on his face. The right panel shows the motion trace for this video frame.
3.3 Data Processing
After getting raw recordings from our lab sessions, the following steps were taken to process the data
for further analysis. The motion and video data streams were synchronize d. The HD video files were
converted to another format (with a higher compression rate) for playback (e.g., in Xvid or H.263 codec).
The audio channel from the video was extracted for several speech processing procedures, including a)
manual transcription, b) using the P2FA forced alignment tool (Yuan & Liberman, 2008) to obtain time
stamps for all transcribed words (and phonemes), and c) using Praat acoustics analysis
software (Boersma & Weeninck, 1996) to extract pitch and intensity measurements. In addition, non-
verbal features related to hand movements, body locomotion, and head orientation were computed.
More details will be provided in Section 4.1.
(2016). Designing an automated assessment of public speaking skills using multimodal cues . Journal of Learnin g An a ly t ic s, 3 (2 ), 2 61–2 8 1.
http://dx.doi.org/10.18608/jla.2016.32.13
ISSN 1929-7750 (online). The Journal of Learning Analytics works under a Creative Commons License, Attribution - NonCommercial-NoDerivs 3.0 Unported (CC BY-NC-ND 3.0)
269
The processed multimodal streams could be imported into Anvil (Kipp, 2012), which supports displaying
rich multimodal cues, including playing videos, showing time -aligned transcription, showing audio
waveform as well as prosody contours, and other contours, such as hand motion velocity. Therefore,
Anvil provides a tool for quickly visualizing this multimodal presentation corpus’s content.
3.4 Human Rating
A key emphasis of our research is a reliable, valid, comprehensive assessment of public speaking ski lls.
To this end, we designed a human rating process according to the standard practice in educational
assessment. We began with a construct analysis of the skills involved in public speaking and a review of
existing assessments and rubrics.
Public speaking is a multifaceted amalgamation of psychological, cognitive, linguistic, and paralinguistic
abilities. Assessing public speaking competence is no less complex. Raters process myriad aural and
visual behaviours as they evaluate a speaker’s public speaking competence. Generally, this process is
guided by a scoring rubric that structures the type of behaviours that should be considered and the
criteria by which to evaluate those behaviours. One of the challenges of assessing public speaking
competence is reliably and accurately detecting the true quality of a performance — filtering the
construct-irrelevant factors from the construct-relevant factors.
The final rubric was based on the Public Speaking Competence Rubric (PSCR) (Schreiber et al., 2012) due
to its psychometric properties. According to their study, using five trained faculty member raters on 45
speech presentations by college students, the intraclass correlation coefficients (ICCs; a measure of
variance in scores associated with raters) across the 10 items and holistic scores ranged from .37 to .93,
making it one of the most reliable human-scored instruments for assessing public speaking
performance. The original PSCR rubric contains 11 items: topic selection, introduction, organization,
supporting materials, conclusion, language, vocal expression, non-verbal behaviour, adaptation to
audience, visual aids, and persuasiveness. Of the 11 rubric dimensions described above, dimensions 2, 3,
and 5–9 were used for the purpose of the present study. The tasks administered did not provide the
opportunity for topic selection; the topic was given to the speaker (Dimension 1). Supporting materials
were not required (Dimension 4), because there was not enough preparation time given to speakers to
gather supporting materials. Dimension 10 was assessed only when the task required use of visual aids
(Tasks B and C). Dimension 11 was considered for all tasks even though only two were persuasive in
nature. A holistic evaluation component was added to the rubric.
The final scoring rubric adapted from PSCR contains the following items: introduction, organization,
conclusion, language, vocal expression, non-verbal behaviour, adaptation to audience, visual aids , and
persuasiveness, plus the overall holistic rating. For each item, a five-point Likert score (0 representing
the worst performance, 4 representing the best) was used.
(2016). Designing an automated assessment of public speaking skills using multimodal cues . Journal of Learnin g An a ly t ic s, 3 (2 ), 2 61–2 8 1.
http://dx.doi.org/10.18608/jla.2016.32.13
ISSN 1929-7750 (online). The Journal of Learning Analytics works under a Creative Commons License, Attribution - NonCommercial-NoDerivs 3.0 Unported (CC BY-NC-ND 3.0)
270
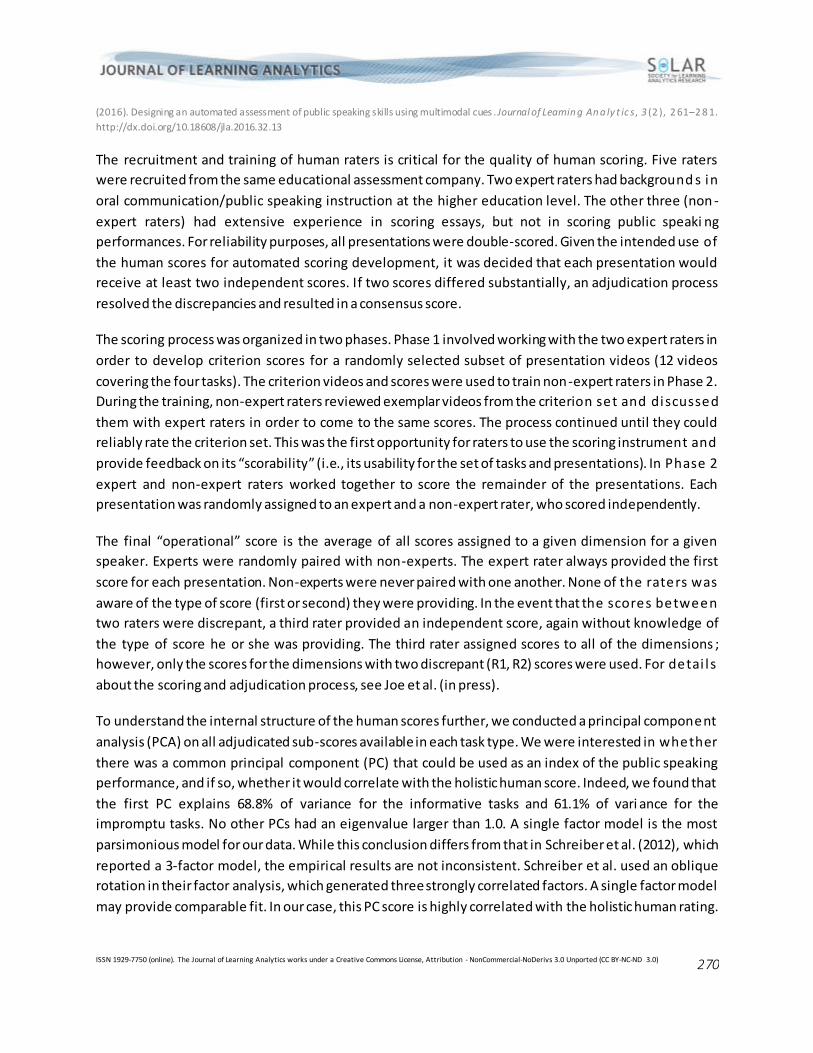
The recruitment and training of human raters is critical for the quality of human scoring. Five raters
were recruited from the same educational assessment company. Two expert raters had background s in
oral communication/public speaking instruction at the higher education level. The other three (non -
expert raters) had extensive experience in scoring essays, but not in scoring public speaki ng
performances. For reliability purposes, all presentations were double-scored. Given the intended use of
the human scores for automated scoring development, it was decided that each presentation would
receive at least two independent scores. If two scores differed substantially, an adjudication process
resolved the discrepancies and resulted in a consensus score.
The scoring process was organized in two phases. Phase 1 involved working with the two expert raters in
order to develop criterion scores for a randomly selected subset of presentation videos (12 videos
covering the four tasks). The criterion videos and scores were used to train non-expert raters in Phase 2.
During the training, non-expert raters reviewed exemplar videos from the criterion set and discussed
them with expert raters in order to come to the same scores. The process continued until they could
reliably rate the criterion set. This was the first opportunity for raters to use the scoring instrument and
provide feedback on its “scorability” (i.e., its usability for the set of tasks and presentations). In Phase 2
expert and non-expert raters worked together to score the remainder of the presentations. Each
presentation was randomly assigned to an expert and a non-expert rater, who scored independently.
The final “operational” score is the average of all scores assigned to a given dimension for a given
speaker. Experts were randomly paired with non-experts. The expert rater always provided the first
score for each presentation. Non-experts were never paired with one another. None of the raters was
aware of the type of score (first or second) they were providing. In the event that the scores between
two raters were discrepant, a third rater provided an independent score, again without knowledge of
the type of score he or she was providing. The third rater assigned scores to all of the dimensions ;
however, only the scores for the dimensions with two discrepant (R1, R2) scores were used. For detai l s
about the scoring and adjudication process, see Joe et al. (in press).
To understand the internal structure of the human scores further, we conducted a principal component
analysis (PCA) on all adjudicated sub-scores available in each task type. We were interested in whether
there was a common principal component (PC) that could be used as an index of the public speaking
performance, and if so, whether it would correlate with the holistic human score. Indeed, we found that
the first PC explains 68.8% of variance for the informative tasks and 61.1% of vari ance for the
impromptu tasks. No other PCs had an eigenvalue larger than 1.0. A single factor model is the most
parsimonious model for our data. While this conclusion differs from that in Schreiber et al. (2012), which
reported a 3-factor model, the empirical results are not inconsistent. Schreiber et al. used an oblique
rotation in their factor analysis, which generated three strongly correlated factors. A single factor model
may provide comparable fit. In our case, this PC score is highly correlated with the holistic human rating.
(2016). Designing an automated assessment of public speaking skills using multimodal cues . Journal of Learnin g An a ly t ic s, 3 (2 ), 2 61–2 8 1.
http://dx.doi.org/10.18608/jla.2016.32.13
ISSN 1929-7750 (online). The Journal of Learning Analytics works under a Creative Commons License, Attribution - NonCommercial-NoDerivs 3.0 Unported (CC BY-NC-ND 3.0)
271
The Pearson correlation r between the holistic scores with the single PC scores is 0.941 for the
informative task and 0.93 for the impromptu task.
Some data were lost due to equipment failure. In total, we obtained 56 presentations with complete
multimodal recordings. In the experiments described in Section 4, we focused on the final holistic scores
after the adjudication process. Regarding holistic scores, between human raters, ICC is 0.385 and
Pearson correlation is 0.385 from these 56 videos. Clearly, such ICC values between human raters are
quite low. There are many reasons causing such low ICCs. For example, the entire data set w as rated
through two rounds of ratings; non-expert raters were paired with expert raters in the second round. In
addition, compared to the essay/speech scoring task, the video scoring task is still very new and needs
more rigorous research on improving the rating reliability.
4 EXPERIMENTS
4.1 Multimodal Features
4.1.1 Textual features
Lexical and syntactic features were extracted using a syntactic complexity analyzer too l on the speech
transcripts (Lu, 2010). This is a crude first attempt because speech transcripts differ from written texts in
important ways. This tool counts the frequency of 9 types of syntactic structures, e.g., verb phrases (VP),
T-units (T), clauses (C), etc., and computes 14 syntactic complexity feature values, such as the mean
length of clause (MLC), number of verb phrases per T-unit (VP/T), and number of coordinate phrases
divided by number of T-units (CP/T). A complete list of the features can be found in Lu (2010). These
features measure syntactic complexity metrics, such as length of production unit, sentence complexity,
subordination, coordination, and particular structures.
4.1.2 Speech features
In Batrinca et al. (2013), some basic acoustic and prosodic features were extracted. However, the
proposed features relied on human annotation — counting hesitations and filled pauses, and used signal
processing that is hard for general users to understand. In this article, we took advantage of recent
developments in the automated speech scoring area (Eskenazi, 2009) to obtain effective features that
measure speech delivery and other related language skills.
Public speaking skills comprise multiple dimensions, including lexical usage, fluency, pronunciation,
prosody, and so on. For example, speaking rate and pause profile have been suggested as useful
features in several studies and even in commercial speech-scoring product implementations (Franco e t
al., 2010; Bernstein, Moere, & Cheng, 2010). A widely used feature for verifying pronunciation is the
Goodness of Pronunciation (GOP) tool and its derived features (Witt, 1999; Franco et al., 2010; Chen,
Zechner, & Xi, 2009). In particular, following the feature extraction method described in Chen et al.
(2016). Designing an automated assessment of public speaking skills using multimodal cues . Journal of Learnin g An a ly t ic s, 3 (2 ), 2 61–2 8 1.
http://dx.doi.org/10.18608/jla.2016.32.13
ISSN 1929-7750 (online). The Journal of Learning Analytics works under a Creative Commons License, Attribution - NonCommercial-NoDerivs 3.0 Unported (CC BY-NC-ND 3.0)
272
(2009), we used speech and transcription to generate a series of features on the multiple dimensions of
speaking skills, e.g., speaking rate, prosodic variations, pausing profile, and pronunciation.
4.1.3 Visual features
In previous research on virtual agents, multimodal dialogic systems, and affective computing, a set of
methods have been proposed to compute body-language related features for the purpose of either
analysis or synthesis. For example, Niewiadomski, Mancini, and Piana (2013) systematically summarized
the methods used for analyzing expressive gesture quality. They grouped the f eatures into the three
layers: a) low-level features, such as velocity; b) medium-level features, such as repetitive, symmetry;
and c) high-level features, such as gestures bearing emotional or social cues. Glowinski et al. (2011)
presented a framework for finding a minimal representation of affective gestures, in which head and
hand motion data were passed to an array of feature extraction modules, including energy, spatial
extent, smoothness, symmetry, head tilt, etc. Then, statistics such as the maximum, mean, and standard
deviation (SD) were derived from these basic features. Finally, a minimal set of feature representations
was obtained using PCA to reduce dimensionability.
Inspired by this previous research, we extracted a set of low/medium level visual features from Kinect
motion traces. We particularly focused on the hip, spine, left forearm, right forearm, left hand, and right
hand. Then, the following basic motion features were computed:
Spatial: for each data frame, a) the distance between the hands and the body (hands-spine ); b)
the distance between the arms and the body (arms-spine), and c) the distance between the two
hands (hands).
Temporal: the first order derivatives of the above spatial measurements; the corresponding
features’ names contain a special token “1dv.” For example, hands-spine-1dv indicates the fi rst
order derivative of hands-spine.
Power: second order derivatives of the above spatial measurements; the corresponding
features’ names contain a special token “2dv.” For example, hands-spine-2dv indicates the
second order derivative of hands-spine.
Energy: Kinetic Energy (KE; Niewiadomski et al., 2013) is computed based on the velocities of
the upper-body segments and their corresponding percentage of mass. KE is computed as
KE=0.5 i=0
n miv
2i
(2016). Designing an automated assessment of public speaking skills using multimodal cues . Journal of Learnin g An a ly t ic s, 3 (2 ), 2 61–2 8 1.
http://dx.doi.org/10.18608/jla.2016.32.13
ISSN 1929-7750 (online). The Journal of Learning Analytics works under a Creative Commons License, Attribution - NonCommercial-NoDerivs 3.0 Unported (CC BY-NC-ND 3.0)
273
where mi is the percentage of mass for the i−th body segment (e.g., left forearm, right hand, and
so on) and vi is the velocity of the i−th segment. Regarding the percentage weight, we used the
values in Plagenhoef, Evans, and Abdelnour (1983).3
Posture: Bounding Volume (BV), proposed in Niewiadomski et al. (2013), is the normalized
volume in a vertical, rectangular, cuboid shape minimally enclosing a speaker’s body. BV is
considered an approximation of the speaker’s degree of body “openness.”
Symmetry: for each time point i, for one axis (l) from X, Y, and Z, the symmetry (SI) as proposed
in Niewiadomski et al. (2013) was computed as
SIli=
(lB−lLi )−(lB−l
Ri )
lRi −l
Li
where lB is the coordinate of the centre of mass. lL and lR are the coordinates of a left joint and
corresponding right joint. The average of these symmetry values along the time l ine i s used as
the basic feature for each axis. We used two measurements, SIXY=(SIX+SIY)/2 and
SIXYZ=(SIX+SIY+SIZ)/3.
Then, for each basic feature f, a set of statistics were computed, including
mean: mean value, which is mean(f)
mmrt: ratio of the max value to the mean, which is computed as max(f)/mean(f)
mean-log: mean of log-scaled value, which is computed as mean(log(f))
mmrt-log: ratio of max log-scaled value to the mean of log-scaled value, which is computed as
max(log(f))/mean(log(f))
SD: standard deviation, which is computed as SD(f)
SD-log: standard deviation of log-scaled values, which is computed as SD(log(f))
The orientation of the head approximates the speaker’s attention to the audience. Head poses were
tracked using the GAVAM head tracker (Morency, Whitehill, & Movellan, 2010) from the video data.
Unreliable data (with confidence less than 7.0) were marked as missing. The head features consist of the
mean, SD, as well as mean/SD on the log scale, of the horizontal and vertical head movements, which
3 The va lues can be found from http://www.exrx.net/Kinesiology/Segments.html.
(2016). Designing an automated assessment of public speaking skills using multimodal cues . Journal of Learnin g An a ly t ic s, 3 (2 ), 2 61–2 8 1.
http://dx.doi.org/10.18608/jla.2016.32.13
ISSN 1929-7750 (online). The Journal of Learning Analytics works under a Creative Commons License, Attribution - NonCommercial-NoDerivs 3.0 Unported (CC BY-NC-ND 3.0)
274
were measured as the angle (in its absolute value) between the head orientation to the zero degree
position — the position of squarely facing the camera.
4.2 Feature Selection
The four tasks (B–E) used in our data collection can be grouped into two: Tasks B and C are prepared
speeches while Tasks D and E are impromptu speeches. In the first group, the subjects had time to
prepare their speeches, used the provided PowerPoint slides to support their speeches, and tended to
pace more in front of the Smartboard. In contrast, in the second group, the subjects needed to address
the asked questions immediately and had no other resource to refer to. Given these differences in the
two kinds of tasks, we anticipated that participants would use verbal and non-verbal cues di f ferently.
This speculation was also confirmed by a regression analysis done on our human rated scores. The
regression used holistic scores as the independent variable and other dimension scores as dependent
variables. Such analysis helps to shed light on the information sources (approximately corresponding to
several dimensional scores) used by human raters when making their holistic ratings. Our analysis
suggests that different information sources were used for the two task types. For example, the raters
gave more weight to non-verbal behaviour and persuasiveness in the impromptu tasks (Tasks D and E) .
Therefore, we analyzed the results separately for the two groups of tasks, reported in Section 4.3.
Regarding the feature selection, since many features were extracted from different modalities by using
different tools, we first ran an unsupervised feature reduction approach to remove one of the features
from a pair whose inter-correlation is higher than 0.7. This function is provided by the R caret
package (Kuhn, 2008). Next, on the remaining features that are more independent from each other, we
selected the features from the speech and body language areas based on their correlation to human
judged holistic scores. Since there are only 28 responses for each group, we only picked the features
whose correlation magnitude to the final holistic scores was more than 0.38, corresponding to a
significant correlation (p<0.05).4 Tables 2 and 3 report the selected multimodal features, their
corresponding category and brief descriptions, as well as the absolute Pearson correlation values to
human judged final holistic scores.
Table 2: A list of multimodal features selected for the prepared speech tasks. Pearson correlations
(|rHS|s) between the features and human rated holistic scores are shown in the last column.
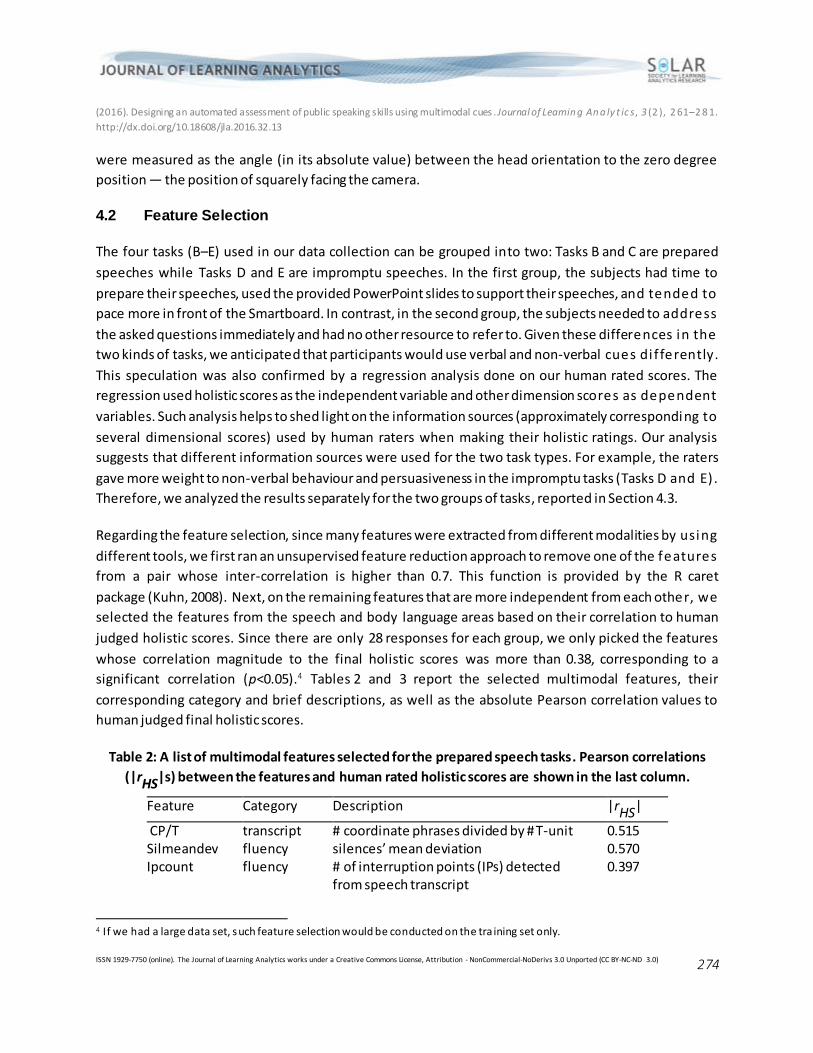
Feature Category Description |rHS|
CP/T transcript # coordinate phrases divided by # T-unit 0.515 Silmeandev fluency silences’ mean deviation 0.570 Ipcount fluency # of interruption points (IPs) detected
from speech transcript 0.397
4 If we had a large data set, such feature selection would be conducted on the tra ining set only.
(2016). Designing an automated assessment of public speaking skills using multimodal cues . Journal of Learnin g An a ly t ic s, 3 (2 ), 2 61–2 8 1.
http://dx.doi.org/10.18608/jla.2016.32.13
ISSN 1929-7750 (online). The Journal of Learning Analytics works under a Creative Commons License, Attribution - NonCommercial-NoDerivs 3.0 Unported (CC BY-NC-ND 3.0)
275
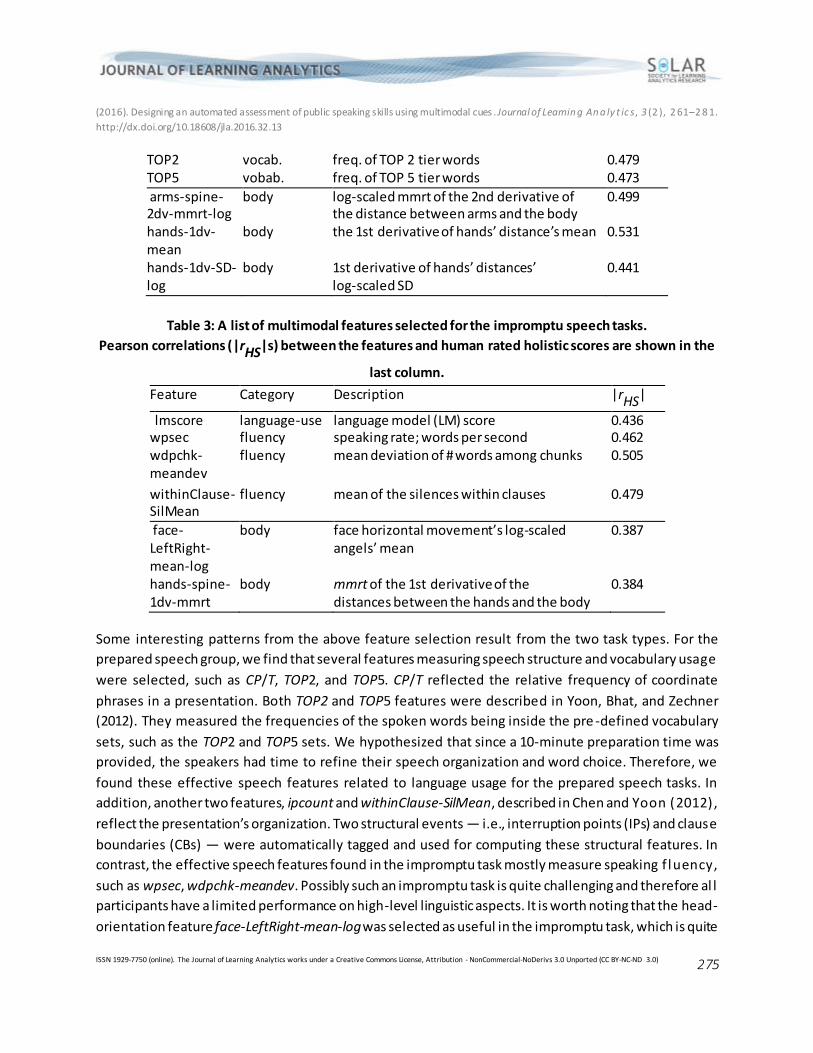
TOP2 vocab. freq. of TOP 2 tier words 0.479 TOP5 vobab. freq. of TOP 5 tier words 0.473
arms-spine-2dv-mmrt-log
body log-scaled mmrt of the 2nd derivative of the distance between arms and the body
0.499
hands-1dv-mean
body the 1st derivative of hands’ distance’s mean 0.531
hands-1dv-SD-log
body 1st derivative of hands’ distances’ log-scaled SD
0.441
Table 3: A list of multimodal features selected for the impromptu speech tasks.
Pearson correlations (|rHS|s) between the features and human rated holistic scores are shown in the
last column.
Feature Category Description |rHS|
lmscore language-use language model (LM) score 0.436 wpsec fluency speaking rate; words per second 0.462 wdpchk-meandev
fluency mean deviation of # words among chunks 0.505
withinClause-SilMean
fluency mean of the silences within clauses 0.479
face-LeftRight-mean-log
body face horizontal movement’s log-scaled angels’ mean
0.387
hands-spine-1dv-mmrt
body mmrt of the 1st derivative of the distances between the hands and the body
0.384
Some interesting patterns from the above feature selection result from the two task types. For the
prepared speech group, we find that several features measuring speech structure and vocabulary usage
were selected, such as CP/T, TOP2, and TOP5. CP/T reflected the relative frequency of coordinate
phrases in a presentation. Both TOP2 and TOP5 features were described in Yoon, Bhat, and Zechner
(2012). They measured the frequencies of the spoken words being inside the pre -defined vocabulary
sets, such as the TOP2 and TOP5 sets. We hypothesized that since a 10-minute preparation time was
provided, the speakers had time to refine their speech organization and word choice. Therefore, we
found these effective speech features related to language usage for the prepared speech tasks. In
addition, another two features, ipcount and withinClause-SilMean, described in Chen and Yoon (2012),
reflect the presentation’s organization. Two structural events — i.e., interruption points (IPs) and clause
boundaries (CBs) — were automatically tagged and used for computing these structural features. In
contrast, the effective speech features found in the impromptu task mostly measure speaking f luency,
such as wpsec, wdpchk-meandev. Possibly such an impromptu task is quite challenging and therefore al l
participants have a limited performance on high-level linguistic aspects. It is worth noting that the head-
orientation feature face-LeftRight-mean-log was selected as useful in the impromptu task, which is quite
(2016). Designing an automated assessment of public speaking skills using multimodal cues . Journal of Learnin g An a ly t ic s, 3 (2 ), 2 61–2 8 1.
http://dx.doi.org/10.18608/jla.2016.32.13
ISSN 1929-7750 (online). The Journal of Learning Analytics works under a Creative Commons License, Attribution - NonCommercial-NoDerivs 3.0 Unported (CC BY-NC-ND 3.0)
276
consistent with a) our expectations based on the knowledge of non-verbal communication and b) our
observations of the videos.
4.3 Predicting Human Holistic Scores
For each task type, i.e., prepared speech vs. impromptu speech, we ran a standard machine learning
experiment for using these multimodal features to predict human judged holistic scores. In part icular,
we ran a leave-one-out cross-validation among all subjects (n=14). In each fold, presentations from 13
subjects were used to train a regression model and then the trained model was applied to the
presentations from the remaining subjects. Two regression approaches were utilized, including a)
Support Vector Machine (SVM) using a polynomial kernel and b) glmnet (Friedman, Hastie, & Tibshirani,
2009), two popular models widely used in practical machine learning tasks. Glmnet fits a generalized
linear model via penalized maximum likelihood. It provides a very efficient solution to train for the
LASSO or elastic net regularized regression model. We used the implementations provided by the R
caret package (Kuhn, 2008). Hyper parameters of these machine-learning models were automatically
tuned by using a 5-fold cross-validation on the training set. The whole process was repeated 14 times to
obtain the machine predicted scores for all of the presentations. Three feature sets were used: a) Text +
Speech group, consisting of the textual features described in Section 4.1.1 and the speech features
described in Section 4.1.2; b) Visual group, consisting of the features computed from motion tracking
and head pose tracking outputs described in Section 4.1.3, and c) Multimodal group, a combination of
the above two groups. Table 4 reports on the correlation between the human rated holistic scores and
the machine predicted ones.
Table 4: Using multimodal features to predict final holistic scores on the two task types
Feature set SVM (poly) Glmnet
Prepared speech (Tasks B & C)
Text + Speech 0.571 0.652 Visual 0.581 0.431 Multimodal 0.750 0.765 Impromptu speech (Tasks D & E)
Text + Speech 0.156 0.324 Visual 0.378 0.399 Multimodal 0.525 0.592
By using the speech features from the recorded audio, transcript files, the visual features from the
videos, and the motions tracked by Kinect, we find that each modality provides information for
predicting overall presentation performance. Based on the text and speech features, we conclude that
adding visual features improves the performance of the multimodal model. On the prepared speech
tasks, the correlation increases from 0.571 to 0.750 for the SVM model and from 0.625 to 0.765 for the
glmnet model. On the impromptu speech tasks, the correlation increases from 0.156 to 0.525 for the
(2016). Designing an automated assessment of public speaking skills using multimodal cues . Journal of Learnin g An a ly t ic s, 3 (2 ), 2 61–2 8 1.
http://dx.doi.org/10.18608/jla.2016.32.13
ISSN 1929-7750 (online). The Journal of Learning Analytics works under a Creative Commons License, Attribution - NonCommercial-NoDerivs 3.0 Unported (CC BY-NC-ND 3.0)
277
SVM model and from 0.324 to 0.592 for the glmnet model. Across the two tasks, the automated
prediction results on the prepared speech are generally more accurate than on the impromptu tasks.
Overall, using multimodal features, the automated scoring models achieved encouraging performance in
terms of their correlation with human-rated scores.
5 DISCUSSION
In this paper, we reported a study with the goal of automatically assessing public-speaking performance
using a range of multimodal cues. The achievements in this study can be summarized as follows:
First, we developed four public speaking tasks to cover two different speech types, i.e., prepared speech
and impromptu speech. Seventeen subjects were recruited to perform these tasks. For data col lection,
we used a combination of Kinect for Windows version 1 and Brekel Pro Body software. This combination
proved to be a stable setup to support our 3-D motion tracking, which lasted for about 5 minutes.
Second, we ran a rigorous human scoring process on the collected presentations. Focusing on our tasks,
we tailored a particular rubric, the Public Speaking Competence Rubric (PSCR) (Schreiber et al., 2012), to
our needs. Then, a series of quality control approaches were utilized in our human rating process,
including pre-training, pairing expert and non-expert raters, score adjudication, etc.
Third, we extracted a set of features from speeches, transcripts, Kinect motions, and head tracking
results. Regarding the features from speeches and transcripts, we mostly utilized the ample research
results from the language-skill assessment area, which have not been widely utilized in the multimodal
sensing field. Our motion features were mostly inspired by previous research findings in such areas as
affective computing, virtual agents, etc.
Finally, we ran feature selection and machine learning tasks on a set of selected features to predict the
holistic scores judged by humans. Our feature selection results on the tw o types of tasks showed
interesting feature usage patterns that somehow reflect the tasks’ differences. From the research
reported in this paper, we find that the features extracted using NLP, speech processing, and
multimodal sensing are helpful for building automated assessment models. More importantly,
compared to the scoring model of only using speech features, adding the features from non -verbal
communication, such as hand gestures and head orientation, shows improved performance. Therefore,
it is very encouraging that a set of modern computational technologies, NLP, speech, and multimodal
sensing, provide strong support for the goal of automatically assessing public speaking ski l ls. With the
development of the technology described in this paper, we are confident in anticipating wider usage of
the technology being developed. For example, for many students, the developed technology could be
used as a formative assessment tool to support their training.
(2016). Designing an automated assessment of public speaking skills using multimodal cues . Journal of Learnin g An a ly t ic s, 3 (2 ), 2 61–2 8 1.
http://dx.doi.org/10.18608/jla.2016.32.13
ISSN 1929-7750 (online). The Journal of Learning Analytics works under a Creative Commons License, Attribution - NonCommercial-NoDerivs 3.0 Unported (CC BY-NC-ND 3.0)
278
As a study in the infancy stage of this line of research, the current research has several limitations. First,
the corpus used in this study is quite small — only 14 subjects with 56 presentations. Second, our data
collection setup has several internal issues. For example, videos and motion traces were recorded using
separate hardware/software and this made precisely synchronizing the two data streams challenging. In
addition, the brightness of the smartboard made it difficult to process the video-based head pose
tracking. Regarding the features, we mostly explored low/medium level features from the multimodal
data streams. It is likely that some high level features, such as disfluencies across multimodal channels,
gestures used for emphasizing important points, and so on, could be more meaningful for inferring
presentation performance. Also, most of our features used in the final scoring models are some type of
statistical value derived from the entire presentation. Although such computing provides some useful
features, we anticipate that more sophisticated approaches, such as considering the temporal structure
of feature contours, will be useful for more accurate modelling. It is worth noting that our current
multimodal features only cover part of the full construct. For example, the existing feature -set lacks
coverage of content organization.
Therefore, in our future studies, we will address the above-mentioned limitations. In particular, we wi l l
expand our corpus size, investigate extracting and utilizing some high-level non-verbal features bearing
more clear semantic and social cues, and explore using more features that reflect subtle local changes.
In addition, we will seek subject approval for releasing this data set to the research community.
ACKNOWLEDGMENTS
The authors are particularly thankful for ETS Research Allocation program’s support for providing the
needed funding for conducting this research. In addition, the authors are thankful to all those who
volunteered to participate, to ETS Toastmaster Club members for their help, to the internal reviewers
from ETS, to external reviewers for their valuable comments, and to several folks in the USC MultiComp
lab, particularly Dr. Morency and Dr. Scherer, for providing technical suggestions and introducing us to
PSCR.
REFERENCES
Batrinca, L., Stratou, G., Shapiro, A., Morency, L.-P., & Scherer, S. (2013). Cicero: Towards a multimodal
virtual audience platform for public speaking training. In R. Aylett et al. (Eds.), Proceedings of the
13th International Conference on Intelligent virtual agents (IVA), (Lecture Notes in Computer
Science), (Vol. 8108, pp. 116–128). Berlin/Heidelberg: Springer-Verlag.
http://dx.doi.org/10.1007/978-3-642-40415-3_10
Bernstein, J., Moere, A. V., & Cheng, J. (2010). Validating automated speaking tests. Language Testing,
27(3), 355–377. http://dx.doi.org/10.1177/0265532210364404 Boersma, P., & Weeninck, D. (1996). Praat, a System for Doing Phonetics by Computer. (Technical Report
No. 132). University of Amsterdam, Institute of Phonetic Science.
(2016). Designing an automated assessment of public speaking skills using multimodal cues . Journal of Learnin g An a ly t ic s, 3 (2 ), 2 61–2 8 1.
http://dx.doi.org/10.18608/jla.2016.32.13
ISSN 1929-7750 (online). The Journal of Learning Analytics works under a Creative Commons License, Attribution - NonCommercial-NoDerivs 3.0 Unported (CC BY-NC-ND 3.0)
279
Carlson, R. E., & Smith-Howell, D. (1995). Classroom public speaking assessment: Reliability and val idity
of selected evaluation instruments. Communication Education, 44(2), 87–97.
http://dx.doi.org/10.1080/03634529509379001
Chen, L., Feng, G., Joe, J., Leong, C. W., Kitchen, C., & Lee, C. M. (2014). Towards automated assessment
of public speaking skills using multimodal cues. Proceedings of the 16th International Conference
on Multimodal Interactions (ICMI ’14), 200–203. http://dx.doi.org/10.1145/2663204.2663265
Chen, L., Leong, C. W., Feng, G., & Lee, C. M. (2014). Using multimodal cues to analyze MLA ’14 oral
presentation quality corpus: Presentation delivery and slides quality. Proceedings of the 2014
ACM workshop on Multimodal Learning Analytics Workshop and Grand Challenge (MLA ’14), 45–
52. http://dx.doi.org/10.1145/2666633.2666640
Chen, L., & Yoon, S.-Y. (2012). Application of structural events detected on ASR outputs for automated
speaking assessment. Paper presented at the 13th Annual Conference of the International
Speech Communication Association (INTERSPEECH 2012), Portland, Oregon, USA.
Chen, L., Zechner, K., & Xi, X. (2009). Improved pronunciation features for construct-driven assessment
of non-native spontaneous speech. Proceedings of the North American Chapter of the
Association for Computational Linguistics – Human Language Technologies (NAACL-HLT 2009),
(pp. 442–449). Retrieved from http://www.aclweb.org/anthology/N09-1050
Echeverría, V., Avendaño, A., Chiluiza, K., Vásquez, A., & Ochoa, X. (2014). Presentation skills estimation
based on video and Kinect data analysis. Proceedings of the 2014 ACM workshop on Multimodal
Learning Analytics Workshop and Grand Challenge (MLA ’14), 53–60.
http://dx.doi.org/10.1145/2666633.2666641
Eskenazi, M. (2009). An overview of spoken language technology for education. Speech Communication,
51(10), 832–844. http://dx.doi.org/10.1016/j.specom.2009.04.005
ESPOL. (2014). Description of the oral presentation quality corpus [Description of the Data File].
Retrieved from http://www.sigmla.org/datasets/
Franco, H., Bratt, H., Rossier, R., Gadde, V. R., Shriberg, E., Abrash, V., & Precoda, K. (2010). EduSpeak: A
speech recognition and pronunciation scoring toolkit for computer-aided language learning
applications. Language Testing, 27(3), 401–418. http://dx.doi.org/10.1177/0265532210364408
Friedman, J., Hastie, T., & Tibshirani, R. (2009). glmnet: Lasso and Elastic-Net Regularized Generalized
Linear Models (R package, v. 1). [Computer Software]. Retrieved from https://cran.r-
project.org/web/packages/glmnet/index.html
Glowinski, D., Dael, N., Camurri, A., Volpe, G., Mortillaro, M., & Scherer, K. (2011). Toward a minimal
representation of affective gestures. IEEE Transactions on Affective Computing, 2(2), 106–118.
http://dx.doi.org/10.1109/T-AFFC.2011.7
Joe, J., Kitchen, C., Chen, L., & Feng, G. (2015). A Prototype Public Speaking Skills Assessment (ETS
Research Report RR-15-36). ETS Research Report Series, 1—22.
http://dx.doi.org/10.1002/ets2.12083
(2016). Designing an automated assessment of public speaking skills using multimodal cues . Journal of Learnin g An a ly t ic s, 3 (2 ), 2 61–2 8 1.
http://dx.doi.org/10.18608/jla.2016.32.13
ISSN 1929-7750 (online). The Journal of Learning Analytics works under a Creative Commons License, Attribution - NonCommercial-NoDerivs 3.0 Unported (CC BY-NC-ND 3.0)
280
Kipp, M. (2012). Annotation facilities for the reliable analysis of human motion. Proceedings of the
International Conference on Language Resources and Evaluation (LREC 2012), 21–27 May 2012,
Istanbul, Turkey (pp. 4103–4107).
Kuhn, M. (2008). Building predictive models in r using the caret package. Journal of Statistical Software,
28(5), 1–26.
Kurihara, K., Goto, M., Ogata, J., Matsusaka, Y., & Igarashi, T. (2007). Presentation sensei: A presentation
training system using speech and image processing. Proceedings of the 9th International
Conference on Multi-Modal Interfaces (ICMI ’07), 358–365.
http://dx.doi.org/10.1145/1322192.1322256
Kyllonen, P. C. (2012, May). Measurement of 21st century skills within the common core state standards.
Invitational Research Symposium on Technology Enhanced Assessments . K–12 Centre at ETS.
Retrieved from https://cerpp.usc.edu/files/2013/11/Kyllonen_21st_Cent_Skills_and_CCSS.pdf
Lu, X. (2010). Automatic analysis of syntactic complexity in second language writing. International
Journal of Corpus Linguistics, 15(4), 474–496. http://dx.doi.org/10.1075/ijcl.15.4.02lu
Luzardo, G., Guamn, B., Chiluiza, K., Castells, J., & Ochoa, X. (2014). Estimation of presentations skills
based on slides and audio features. Proceedings of the 2014 ACM workshop on Multimodal
Learning Analytics Workshop and Grand Challenge (MLA ’14), 37–44.
http://dx.doi.org/10.1145/2666633.2666639
Morency, L.-P., Whitehill, J., & Movellan, J. (2010). Monocular head pose estimation using general ized
adaptive view-based appearance model. Image and Vision Computing, 28(5), 754–761.
http://dx.doi.org/10.1016/j.imavis.2009.08.004
Nguyen, A.-T., Chen, W., & Rauterberg, M. (2012). Online feedback system for public speakers.
Proceedings of the IEEE symposium on E-learning, E-management and E-services (IS3e), 1–5.
http://dx.doi.org/10.1109/IS3e.2012.6414963
Niewiadomski, R., Mancini, M., & Piana, S. (2013). Human and virtual agent expressive gesture qual i ty
analysis and synthesis. In M. Rojc & N. Campbell (Eds.), Coverbal Synchrony in Human–Machine
Interaction (pp. 269–292). Boca Raton, FL: CRC Press.
Ochoa, X., Worsley, M., Chiluiza, K., & Luz, S. (2014). MLA ’14: Third multi-modal learning analytics
workshop and grand challenges. Proceedings of the 16th International Conference on
Multimodal Interactions (ICMI ’14), 531–532. http://dx.doi.org/10.1145/2663204.2668318
Plagenhoef, S., Evans, F. G., & Abdelnour, T. (1983). Anatomical data for analyzing human motion.
Research Quarterly for Exercise and Sport, 54, 169–178.
http://dx.doi.org/10.1080/02701367.1983.10605290
Pull, C. B. (2012). Current status of knowledge on public-speaking anxiety. Current Opinion in Psychiatry,
25(1), 32–38. http://dx.doi.org/10.1097/YCO.0b013e32834e06dc
Rosenberg, A., & Hirschberg, J. B. (2005). Acoustic/prosodic and lexical correlates of charismatic speech.
Proceedings of the 6th INTERSPEECH 2005 and 9th European Conference on Speech
Communication and Technology (EUROSPEECH 2005), (Vol. 1, pp. 512–515). Retrieved from
http://www1.cs.columbia.edu/~amaxwell/pubs/charisma-euro05-final.pdf
(2016). Designing an automated assessment of public speaking skills using multimodal cues . Journal of Learnin g An a ly t ic s, 3 (2 ), 2 61–2 8 1.
http://dx.doi.org/10.18608/jla.2016.32.13
ISSN 1929-7750 (online). The Journal of Learning Analytics works under a Creative Commons License, Attribution - NonCommercial-NoDerivs 3.0 Unported (CC BY-NC-ND 3.0)
281
Scherer, S., Layher, G., Kane, J., Neumann, H., & Campbell, N. (2012). An audiovisual political speech
analysis incorporating eye-tracking and perception data. Proceedings of the International LREC
Workshop on Multimodal Corpora for Machine Learning (LREC 2012), (pp. 1114–1120).
Scherer, S., Stratou, G., & Morency, L.-P. (2013). Audiovisual behavior descriptors for depression
assessment. Proceedings of the 15th ACM International Conference on Multimodal Interaction
(ICMI ’13), 135–140. http://dx.doi.org/10.1145/2522848.2522886
Schreiber, L. M., Paul, G. D., & Shibley, L. R. (2012). The development and test of the public speaking
competence rubric. Communication Education, 61(3), 205–233.
http://dx.doi.org/10.1080/03634523.2012.670709
Silverstein, D., & Zhang, T. (2003, Oct). System and method of providing evaluation feedback to a
speaker while giving a real-time oral presentation (Patent No. US20030202007 A1). Retrieved
from http://www.google.com/patents/US20030202007
Swift, M., Ferguson, G., Galescu, L., Chu, Y., Harman, C., Jung, H., Kautz, H. (2012). A multimodal corpus
for integrated language and action. Proceedings of the International LREC Workshop on
Multimodal Corpora for Machine Learning (LREC 2012), 14–17.
Ward, A. E. (2013). The assessment of public speaking: A pan-European view. Proceedings of the 12th
International Conference on Information Technology Based Higher Education and Training
(ITHET 2013), 1–5. http://dx.doi.org/10.1109/ITHET.2013.6671050
Witt, S. M. (1999). Use of speech recognition in computer-assisted language learning (Unpublished
doctoral dissertation, University of Cambridge). Retrieved from http://svr-
www.eng.cam.ac.uk/reports/svr-ftp/auto-pdf/witt_thesis.pdf
Yoon, S.-Y., Bhat, S., & Zechner, K. I. (2012). Vocabulary profile as a measure of vocabulary
sophistication. Proceedings of the 7th Workshop on Innovative Use of NLP for Building
Educational Applications (NAACL-HLT 2012), (pp. 180–189). Retrieved from
https://aclweb.org/anthology/W/W12/W12-2021.pdf
Yuan, J., & Liberman, M. (2008). Speaker identification on the SCOTUS corpus. The Journal of the
Acoustical Society of America, 123(3878), 5687–5690. http://dx.doi.org/10.1121/1.2935783
Zhang, Z. (2012). Microsoft Kinect sensor and its effect. Multimedia, IEEE, 19(2), 4–10.
http://dx.doi.org/10.1109/MMUL.2012.24