Embed Size (px)
Citation preview

1
Designing a Process
Measurement Program
as a part of Measurement & Analysis Process Area
of CMMI Level 2
Afrooz Ghalambor
Madeleine Latifi
This thesis comprises 30 ECTS credits and is a compulsory part in the Master of Science
with a Major in Quality and Environment Management – 60 ECTS credits
No. 17/2009

2
Designing a Process Measurement Program, as a part of Measurement & Analysis
Process Area of CMMI Level 2.
Afrooz Ghalambor, [email protected]
Madeleine Latifi, [email protected]
Master thesis
Subject Category: Technology
University College of Borås
School of Engineering
SE-501 90 BORÅS
Telephone +46 033 435 4640
Borås University Examiner: Roy Andersson
Borås University Supervisor,name: Djoko Setijono
Chalmers University Examiner: Sverker Alänge
Chalmers University Supervisor,name: Sverker Alänge
Supervisor from Volvo 3P: Fredrik Westin
Date: September 2009
Keywords:
Process Measurement Program,
Measurement Program, Process
Measurement

3
Acknowledgement
This is a 30-credit master thesis within Measurement and Analysis as a part of a CMMI at
Volvo 3P (Electrical & Electronics Gothenburg), which is conducted from 2009.02.07 to
2009.06.25
We hereby would like to thank all people who somehow helped us to achieve this result.
First, we would like to thank Fredrik Westin as a supervisor from Volvo 3P for his
unconditional help and accessibility during this project. Mr. Westin’s effort towards creating a
valuable network of related people at Volvo 3P is highly acknowledged.
We hereby thank Sverker Alänge as our supervisor at Chalmers University of Technology as
well as Roy Andersson and Djoko Setijono as supervisors from the University of Borås for
their presence and great leadership.
We shall thank all people at the EEEG department (Volvo 3P) specially Kjell Gustafsson,
Niklas Vännman, Sofia Karlsten, for their attention and great helps in order to reach the right
information during this diploma work.
We would like to take this opportunity to thank Navid Hariri at Volvo 3P who made it
possible for us to conduct this project. His friendly help is highly appreciated.
In the end, we would like to thank our family and friends who supported us during the whole
education and this thesis.

4
Acronyms
EEEG: Electrical & Electronics Gothenburg
GEEE: Global Electrical and Electronics Engineering
CMMI: Capability Maturity Model Integration
MA: Measurement and Analysis
GDP: Global Development Process
CPI: Continual Process Improvement
QDCF: Quality, Delivery, Cost, Feature
GQM: Goal Question Metrics
KPI: Key Performance Indicator
KRI: Key Result Indicator
KSI: Key Success Indicator
PDCA: Plan Do Check Act
GPM: General Process Measurement
BAM: Business Activity Monitoring
SW-CMM: Software Capability Maturity Model
SA-CMM: Software Acquisition Capability Maturity Model
P-CMM: People Capability Maturity Model
DoD: Department of Defence
SG: Specific Goal
SP: Specific Practice
GG: Generic Goal
GP: Generic Practice
SDCR: Storing – Documenting – Reporting – Communicating
IDCAE: Identify-Define-Collect-Analyze-Evolve

5
List of tables
Tab.1 Comparison of Capability and Maturity Levels
Tab.2 Specific Goals and Practices
Tab.3 Generic Goals and Practices
Tab.4 List of Interviewees
Tab.5 Link between the measurement program and the PDCA
List of figures
Fig.1 Organization’s Three Critical Dimensions
Fig.2 Continuous Representation
Fig.3 Staged Representation
Fig.4 Goal Question Metric
Fig.5 PDCA (Plan-Do-Check-Act)
Fig.6 The ETVX
Fig.7 Three Types of Performance Measures
Fig.8 IDCAE (Identify-Define-Collect-Analyze-Evolve)
Fig.9 Application of ETVX in IDCAE
Fig.10 The Inductive Phase
Fig.11 The Deductive Phase
Fig.12 Reliability point of view
Fig.13 Structuring-Standardizing Relation
Fig.14 Designing a Measurement Program
The ETVX
Fig.15 Scope Identification
Fig.16 Defining the Process
Fig.17 Data Collection
Fig.18 Data Analysis
Fig.19 Process Evolvement
Fig.20 Five Phases of Measuring the Process
Fig.21 Implementation of Measurement Program
Fig.22 Implementation steps
Fig.23 SDRC (Storing – Documenting – Reporting – Communicating)
Fig.24 Volvo Version Template
Fig.25 Volvo Version Specification

6
Abstract
This master’s dissertation stands as a guideline for defining a measurement program for
GEEE that can be piloted at the Gothenburg site EEEG. The measurement program is based
on the “CMMI process area Measurements and Analysis, Level 2”.
The proposed measurement program is designed in such a way that is applicable for
repeatable process measurement with potential minor alters depending on the nature of the
process being examined.
Major effort has been made on creating a program that not only collects the numerical data
but also delivers substantial results in terms of goal setting, data analysis and decision
making.
Designing a process for measurement facilitate organizational strategy toward process
improvements.
This measurement program is designed with the help of some well-known methods such as:
GQM (Goal-Question-Metric), PDCA (Plan-Do-Check-Act) and ETVX (Entry-Task-
Validation- Exit) where five major phases are resulted, namely; Identify, Define, Collect data,
Analysis, Evolve, thereafter embedded in a template-shaped tool.
The whole template, after a complete fulfillment, would provide the organization with a
guideline to achieve the organizational objectives.
It is vital to mention that this template itself does not improve the processes. It only shows the
status of the chosen project/process after having the filled template executed. What this
template generates is to provide the stakeholders with necessary information and basis to
make informed decision afterwards in order to improve the chosen processes/projects.
Since the processes in “Maturity Level 2 of CMMI” are project based, it is important the
status of processes can be measured and communicated. This procedure plays a crucial role in
creating a platform for moving to the next maturity level.

7
Table of Contents
Acknowledgement ...................................................................................................................... 3
Acronyms ................................................................................................................................... 4
Abstract ...................................................................................................................................... 6
1. Introduction ...................................................................................................................... 10
1.1 Aim ............................................................................................................................ 10
1.2 Research Issues .............................................................................................................. 10
1.3 Delimitation .................................................................................................................... 11
1.4 Outline of the thesis ................................................................................................... 11
2. Company Introduction .......................................................................................................... 12
2.1 Volvo 3P within AB Volvo ............................................................................................ 12
2.2 An Introduction to Global Electrical and Electronics Engineering (GEEE) .................. 12
2.3 Problem Area .................................................................................................................. 13
2.3.1 An Introductory to CMMI (Capability Maturity Model Integration) As a Process
Improvement Method ....................................................................................................... 13
2.3.1.1 Overall View on CMMI ................................................................................... 14
2.3.1.2 History of CMMI: ............................................................................................ 15
2.3.2 Definitions ........................................................................................................... 15 2.3.2.1 Continuous representation ................................................................................ 16 2.3.2.2 Staged representation ....................................................................................... 17
2.3.2.3 Understanding Maturity Levels ........................................................................ 19 2.3.2.4 Process Area Definition ................................................................................... 20
2.3.3 Measurement and Analysis Process Area ............................................................... 21
2.3.3.1 Purpose ............................................................................................................. 21 2.3.3.2 Requirements .................................................................................................... 21
3. Theoretical Frame of Reference ........................................................................................... 23
3.1 Main Frame of References ............................................................................................. 23
3.1.1 GQM Definition ...................................................................................................... 23
3.1.2 PDCA Definition ..................................................................................................... 24
3.1.3 ETVX (Entry-Task-Validation-Exit) ...................................................................... 25
3.1.4 General Process Measurement ................................................................................ 26
3.1.5 KPI .......................................................................................................................... 26
3.1.6 Communicators ....................................................................................................... 29
3.2 The reference method application (the logic behind the measurement program) .......... 29
4. Method ................................................................................................................................. 31
4.1 Research Methods .......................................................................................................... 31
4.1.1 Research phase ........................................................................................................ 31
4.1.2 Inductive .................................................................................................................. 32
4.1.3 Deductive ................................................................................................................ 33

8
4.2 Work form and Arrangement ......................................................................................... 34
4.2.1 Qualitative and quantitative investigation ............................................................... 34
4.3 Reliability ....................................................................................................................... 34
4.3.1 Validity .................................................................................................................... 34
4.3.2 Reliability ................................................................................................................ 35
4.4 Information Gathering .................................................................................................... 36
4.4.1 Primary Data ........................................................................................................... 36
4.4.1.1 Interview ........................................................................................................... 36 4.4.1.2. Meeting ............................................................................................................ 38
4.4.1.3 Literature Study ................................................................................................ 39
4.5 Method Criticism ............................................................................................................ 39
4.6 Structure ......................................................................................................................... 40
4.7 Reflection on Methodology, Theory and Industry Usage .............................................. 41
5. Development of the Measurement Program ......................................................................... 42
5.1 Measurement program .................................................................................................... 42
5.1.1 Objectives ................................................................................................................ 42
5.1.2 Target group ....................................................................................................... 43
5.1.3 Overview ............................................................................................................ 43
5.2 Designing a Process Measurement Program .................................................................. 44
5.2.1 Developing a Measurement Program ...................................................................... 46
5.2.2 Planning the program .............................................................................................. 47
5.2.2.1 Scope Identification .......................................................................................... 47
5.2.2.2 Defining the Process ......................................................................................... 50 5.2.2.3 Overview on Scope Identification and Definition tasks ................................... 53
5.2.2.4 Data Collection ................................................................................................. 54 5.2.2.5 Data analysis .................................................................................................... 55 5.2.2.6 Process Evolvement ......................................................................................... 56
6. Test and Iterative Process ..................................................................................................... 58
6.1 Measurement Program Result ........................................................................................ 58
6.1.1 Comprehensive Measurement Template ................................................................. 58
6.1.2 The Comprehensive Specification .......................................................................... 60
6.2 Measurement Program in Use ........................................................................................ 61
6.2.1 KPI Measurement Process ...................................................................................... 62
6.2.2 Project Management ................................................................................................ 62
6.2.3 Process Improvement .............................................................................................. 63
6.2.4 Data Aggregation .................................................................................................... 63
6.2.5 Dynamicity and flexibility ...................................................................................... 63
6.3 Starting the measurement program ................................................................................ 64
6.3.1 Focal Group Allocation ........................................................................................... 65
6.3.2 Objective Identification ........................................................................................... 65

9
6.3.3 Program Design ....................................................................................................... 65
6.3.3.1 Existing Capability Assessment ....................................................................... 65
6.3.3.2 Measurement Program Design ......................................................................... 66 6.3.4 Testing the program ................................................................................................ 66
6.3.5 Process Documentation ........................................................................................... 66
6.3.6 Program Implementation ......................................................................................... 67
6.3.7 Expanding the Measurement Program .................................................................... 67
7. Result Analysis and Discussion ........................................................................................... 68
7.1 Feasibility ................................................................................................................... 68
7.2 Adjustment on Demand .............................................................................................. 68
7.2.1 “Identify” Phase Transformation ............................................................................ 68
7.2.2 “Define” Phase Transformation .............................................................................. 69
7.2.3 SDRC (Storing, Documenting, Recording and Communicating) ........................... 69
7.3 The Volvo Version Template ......................................................................................... 70
7.4 Test and Evolution of the Instrument ............................................................................. 74
8. Conclusion ............................................................................................................................ 76
8.1 Final Reflection .............................................................................................................. 77
9. Recommendation .................................................................................................................. 79
10. Further Studies ................................................................................................................... 79
References ................................................................................................................................ 80
Appendices ............................................................................................................................... 83
Appendix 1: Comprehensive Measurement Template ......................................................... 83
Appendix 2: The Comprehensive Specification ................................................................... 87
Appendix 3: Example ........................................................................................................... 92
Appendix 4: CMMI Process Areas ...................................................................................... 93

10
1. Introduction
Organizations are trying their best these days to be differentiated from others by introducing a
faultless product to the market. One shall not forget the fact that there is a powerful process
behind every successful product/service. Those tangible products can be somewhat easily
measured by already existing measurement metrics e.g. length, volume, etc. where the
visibility of those measurement objectives has made it easier for the companies to assure the
quality of the final product.
The critical issue is to measure those intangible processes that are recognized to act as
cornerstones for the enterprise. The world these days has recognized the vitality of measuring
the effectiveness of the processes and has subjected them to the rigours of testing in order to
align the whole organizational activities with the overall goals which are to offer the best
possible product/services to the market.
Organizations are putting extra effort in designing their processes in such a manner that can
guarantee the effectiveness of the core and sub activities however, the effect of these
processes are hardly recognized during the design phase.
Volvo 3P is not an exception where the lack of process measurement which leads to an
unclear view on the process status within the organization is nowadays recognized to be one
major obstacle towards achieving the organizational objectives and goals.
1.1 Aim
The aim of this project is to design a measurement program which is aligned with the
CMMI (Capability Maturity Model Integration) objectives derived from the process area
“Measurements and Analysis”. These objectives are as follows:
Analyze the needs and objectives for measurements on the main processes at
GEEE and present them for stakeholders.
Out of interviews with stakeholders recommend a set of measurements to be
performed. Present recommendations with rationale in a written report and a
presentation for stakeholders.
Develop practices how to collect, analyze and store measurement data.
Document practices in a “How To” document
Develop practices on how to communicate measurements results
1.2 Research Issues
In order to achieve the aforementioned objectives aligned with the CMMI with the help of the
main frame of references of this dissertation, the following issues will be elaborated and
analyzed in different chapters of this project.
What kind of measurement program shall be designed?
What measurement objectives shall be included in this program?
What kind of result is expected from this measurement program?

11
1.3 Delimitation
The main limitation is the access to external and internal data for implemented measurement
methods. The thesis is also restricted to use available data in order to show consequences of
the already existing measurement methods at GEEE within the decided time frame. In
addition to these limitations, it has in some areas been difficult to gain access to available data
bases and/or other information systems.
The initial intention of the authors was to measure one or several specific processes
introduced to them by the GEEE department at Volvo 3P but this intention was changed
already in the start phase as meetings with the industry supervisor broadened the scope of this
thesis meaning that this measurement program should not be limited to any specific process
but is to be usable for any kind of process that resulted in some changes in terms of time
plans, design strategy and choice of main frame of references and methods.
1.4 Outline of the thesis
This master’s thesis begins with an introduction on the importance of process measurement
within organizations, having major focus on Volvo 3P, where CMMI is also introduced as an
improvement tool aiming at increasing the maturity of the organization by fulfilling a set of
process area requirements.
One measurement program is then designed as a part of “Measurement and Analysis” process
area of CMMI level 2.
This measurement program is designed with the help of the main frame of reference including
some well-known concepts such as GQM (Goal-Question-Metric), PDCA (Plan-Do-Check-
Act) and ETVX (Entry-Task-Validation-Exit).
In order to align this measurement program with the organizational objectives and the culture
at Volvo 3P, interviews, meetings and literature studies have been conducted as a set of
research methods introduced in details in section 4 (Method).
Based on the above-mentioned tools and methods, the process measurement activities are then
framed in a template-shaped program (The Comprehensive Version).
Feedbacks and reflections from both Volvo 3P stakeholders and university supervisors led to
a constructive discussion that resulted into an adjusted template for the industry use (The
Volvo Version).
This template is then tested by the university teacher in order to find out whether this template
is applicable in other fields than only industry. (This example is available in the appendices)
Final recommendations based on managerial implications within the organization are also
included in this master’s thesis.
At the end, some fields for further studies are also introduced for the potential future
improvement activities.

12
2. Company Introduction
2.1 Volvo 3P within AB Volvo
Volvo 3P is a Business Unit within the Volvo Group. It combines the resources of the four
truck companies in the areas of Product Development, Product Planning, Purchasing and
Product Range Management. Volvo 3P works in partnership with the four truck companies to
ensure a powerful and strong competitive offer for each brand. It offers its customers
innovative and customized solutions that make optimum use of the size, volumes and
resources of the truck companies while at the same time preserving the unique distinction and
characteristics of each brand.
2.2 An Introduction to Global Electrical and Electronics Engineering (GEEE)
Global Electrical & Electronics Engineering (GEEE) creates electronic platforms capable of
satisfying both high feature demands from our brand customers as well as utilizing the scale
effects to reach high component volumes. It is strived for highest possible quality and
reliability both for hardware and software systems. Their engineering skills are continuously
developed to maintain world class level in the trucking industry.
The Strategic Business Plan shows where the division is today and where they are going. It
provides them with a common vision and steer their efforts in the same direction. The Volvo
3P strategic business plan is systematically broken down to all levels within the company:
Product Development, Global Electrical & Electronics, local sites, sections and groups.
Vision
“The goal is to get all employees within Global EEE involved in operational development
work around a selected strategic focus area! By directing all the energy and competence we
have within our organization to one strategic focus area, we are convinced that we will be
able to realize the strategic objectives in the business plan and reach the operative vision.”
(Volvo 3P internal website)
Mission
Global Electrical & Electronics mission statement details their business concept, their reason
for being:
“To propose and develop profitable electrical and electronics products,
hardware and/or software, built upon a common EE architecture with
shared technology to ensure strong competitive offers for each truck company.
We shall do this by working in a global and multicultural environment
characterized by our corporate culture, The Volvo Way, while
upholding the corporate values of the Volvo Group and each Brand’s Core Values.”
(Volvo 3P internal website)
In order to achieve the vision, mission, a clear strategy is needed. At Global Electrical &
Electronics Engineering the focus is on three key areas Product, People and Process where
they constantly strive to achieve an optimum balance in between the areas in order to reach
customer satisfaction.

13
2.3 Problem Area
Global Electrical and Electronics Engineering (GEEE) at Volvo 3P has chosen to use the
Capability Maturity Model Integration (CMMI) as an approach to improve on quality,
delivery precision, cost and features (QDCF).
The CMMI is a model and set of best practices that provides organizations with the essential
elements of effective processes. It can be used to guide process improvement across a project,
a division, or an entire organization. CMMI helps in setting process improvement goals and
priorities, provides guidance for quality processes, and provides a means of appraising current
processes.
GEEE has selected the staged representation of the CMMI. In the staged model there are
seven process areas to be addressed in order to reach CMMI level 2. One of them is the
process area Measurement and Analysis (MA). MA deals with how to build up a
measurement capability that supports stakeholder information needs which will be the focus
of this master thesis.
2.3.1 An Introductory to CMMI (Capability Maturity Model Integration) As a Process Improvement Method
Producing high-quality, cheap products and delivering faster and better services have always
been the main goals for the companies.
This cannot be effortless in the high technology environment where organizations’ products
and services being more and more complex and multiplex every day, also most of the
components are provided from other producers and must be integrated into company’s
product/ service to finalize it.
Managing and controlling this complex development and maintenance process should be in
such a way that effectively manages an integrated approach to their development activities to
achieve the organizational objectives.
Organizations might find different standards, methodologies, guidelines and maturity models
helpful to improve their business. However, the majority of available improvement
approaches are focusing on a specific part of a business instead a holistic view which leads
organization to face some obstacles.
Capability Maturity Model Integration (CMMI) on the other hand provides organizations with
integrated models that transcend disciplines which give the organization the opportunity to
eliminate obstacles.
Three critical dimensions that organizations are based on are people, procedures and method,
tools and equipments. But more important, the element that accommodates everything
together and aligns the way of doing the business in the organization is “process”.
By focusing on process business trends would be scalable and improvable.
CMMI focuses on the process improvement to develop product and service quality.

14
Fig.1 Organization’s Three Critical Dimensions (Chrissis, M.B. & Konrad, M. & Shrum, S.,
2007)
2.3.1.1 Overall View on CMMI
Capability Maturity Model Integration (CMMI) is a process improvement maturity model for
the development of products and services. This model consists of transcending disciplines by
offering the best practices through pointing out development and maintenance programmes
covering the whole life cycle of the product from the very early phase (conceptualization) to
the very end (delivery and maintenance). Therefore this system is recognized as a reference
model that covers those development and maintenance activities.
CMMI acts a manual development model as well as a guideline for process improvement by
addressing the best practices in terms of product/service processes. It is an improvement
framework in the pursuit of enterprise-wide process improvement.
This program includes a great deal of well-tested content that can be used to guide the
creation of high-performance processes, being able to be interpreted into organizational terms
that lead to quality products.
Processes can be categorized in a variety of groups depending on the needs of the related
organization. One of those categories is “the maturity”. Processes can be either mature or
immature processes. CMMI deals with both types as follows:
Procedures &
methods
defining the
relationship of tasks
Tools and
equipments
People with
skills, training
and motivation
Process

15
CMMI turns:
Mature processes into processes with improved quality and effectiveness
Immature processes into disciplined ones
2.3.1.2 History of CMMI:
Principles of Statistical quality control for process improvement were developed by Walter
Shewhart in 1930s (Shewhart 1931).These principles were thereafter extended and reshaped
by others such as W.Edwards Deming (Deming 1986) where Watts Humphrey, Ron Radice
and others took these principles one step futher and applied them to software process
improvement at IBM and SEI ( Humphrey 1989).
Mike Phillips elaborates on the creation of CMM in the book, CMMI Giudelines for Process
Integration and Product Improvement (page 9), as follows:
“Models with levels of improvement go back to the emphasis on manufacturing quality
expressed by Philip Crosby. Shortly after the creation of the SEI, the U.S., Air force asked the
SEI to identify key practices that a contractor has to perform to deliver software-intensive
systems reliably. By 1991, this tracking of practices, and measurement across a stepped
approach for improvement like that pioneered by Crosby, had matured into the Capability
Maturity Model for software (SW-CMM).”
Some other aspects of CMM were also created such as SA-CMM, Acquisition Capability
maturity Model, as well as P-CMM, People Capability Maturity Model in 1995.
Having all these efforts made, the need for an integrated model that could support “the
concurrent engineering practices” for product development CMM became now more obvious.
Accordingly, all the efforts were merged into an integrated model that is now called CMMI
(Capability Maturity Model Integration) with the sponsorship of the U.S. Department of
Defense (DoD).
This unitive model (CMMI) aims at improving the potential usage of maturity models by
covering all different application areas of CMM under one roof.
The initial version of CMMI was released in 2000 known as v1.02. Version 1.2, CMMI for
Development, followed in August 2006.
2.3.2 Definitions
Continuous vs. Staged Representations of CMMI:
CMMI defines two different approaches that can assist organizations to address process
improvement activities, namely; “Continuous Representation” and “Staged Representation”.

16
2.3.2.1 Continuous representation
Continuous representation is used when the organization put the focus on one specific process
area (or a group of process areas) trying to improve that specific process area (and the process
areas related to it) using “capability levels” to characterize improvement of that certain
process area (or certain group of process areas).
Process Areas
Specific Goals
Specific Practices
Generic Goals
Generic Practices
Capability Levels
Fig.2 Continuous Representation (Chrissis et. al 2007)
“Capability levels” (applied in continuous representation) are defined as means of
incremental improvement for a given process area and includes six capability levels,
numbered 0 through 5.

17
2.3.2.2 Staged representation
Staged representation on the other hand, is to be implemented on pre-defined sets of process
areas within the organization trying to improve those sets of process areas using “maturity
levels” to characterize improvement of those pre-defined sets of process areas.
Process Areas
Specific Goals
Specific Practices
Generic Goals
Generic Practices
Maturity Levels
Fig.3 Staged Representation (Chrissis et. al 2007)
Maturity levels” (applied in staged representation) are defined as a means of process
improvement achievement in multiple process areas including five maturity levels numbered
1 through 5.

18
The table below elaborates on the comparison of the two aforementioned levels:
Comparison of Capability and Maturity Levels
Level
Countinious Representation
Capability levels
Staged Representation
Maturity levels
Level 0 Incomplete N/A
Level 1 Performed Initial
Level 2 Managed Managed
Level 3 Defined Defined
Level 4 Quantitatively Managed Quantitatively Managed
Level 5 Optimizing Optimizing
Tab.1 Comparison of Capability and Maturity Levels (Chrissis et. al 2007)
Different companies choose different representations based on the nature of their core
activities, resources and business model.
The “Staged representation” is being used at Volvo 3P as a process improvement method
therefore; the authors of this report recognize the necessity of introducing this model in
details to the readers.
Staged Representation
The staged presentation is a systematic approach towards process improvement one stage at
a time. Fulfilling the requirements in order to reach each stage acts as a stable platform for
the next stage. One logical pre-defined path is to be followed in this staged model in which
the improvement order is prescribed from the very first level (Initial) to the final level
(Optimizing).
The approach strategy in this model ensures a stable foundation before entering the next
maturity level as all requirements are to be fulfilled in advance to the entry to the next
maturity level (an incremental improvement approach).
This model also contributes to summarizing the result form the improvement of the
processes in a very simple frame in terms of the numbers (a single maturity-level number).

19
2.3.2.3 Understanding Maturity Levels
A maturity level includes a set of well-defined generic and specific practices in order to
reach a set of pre-defined process areas that are aiming at improving the overall
organizational performance. Maturity levels are also to be measured and this measurement
would be done by the help of some specific and generic goals aligned with those
aforementioned set of process areas.
There are five maturity levels (Tab.1), each one acting as a fundamental layer of the overall
ongoing improvement activities of the organization designated by the numbers 1 through 5.
The authors of the dissertation have tried to elaborate on each level as below:
Maturity Level 1: Initial
Processes at this stage are mostly chaotic, unstable and ad hoc. No stable atmosphere (from
the organization) is provided for the processes to operate in. There is often a sign of process
abandonment while encountering crisis where the success repetition is rather impossible
(due to the instability of the processes).
Maturity Level 2: Managed
Processes are aligned and executed with the overall policy of the organization where right
resources as well as the right competence are assigned, controlled and reviewed. Process
deliverables are usually delivered to the managers/project managers in accordance to the
pre-set milestones as commitments are more clarified and established among the relative
parties.
Maturity Level 3: Defined
Processes at this stage are more characterized, standardized and understood. One somehow
stable basis is now created as to act an improvement platform for the maturity level 3.
Maturity Level 4: Quantitatively Managed
Quantitative objectives (for the process performance) are now established in order to be
used as process management criteria. These objectives are to be established according to
the needs of the end users, different parts of the organization, process owners, etc.
Maturity Level 5: Optimizing
At this final level, the organization aims at continuously improving its processes built upon
a common understanding of those quantitative objectives set in level 4. This level mostly
shifts its focus towards incremental process improvements (after going through the 4 first
levels). This incremental improvement is continuously reviewed, revised and improved.
20
2.3.2.4 Process Area Definition
“Process area is a cluster of related practices in an area that, when implemented
collectively, satisfy a set of goals considered important for making improvement in that
area” (Chrissis, Konrad and Shrum 2007).
Process areas are divided and grouped according to the maturity level. This means that each
maturity level has a set of process areas that are to be implemented in order to achieve total
fulfillment at that level that allows the organization to move to the next maturity level.
Process areas have different aims and belong to different maturity levels e.g. Measurement
and Analysis (belongs to Maturity level 2), Validation (belongs to Maturity level 3),
Quantitative Project Management (belongs to Maturity level 4) and Organizational
Innovation and Deployment (belongs to Maturity level 5).
Generic and Specific Goals
Specific Goals (SG)
“A specific goal describes the unique characteristics that must be present to satisfy the
process area. It is used an appraisals to help determine whether a process area is satisfied.”
(Chrissis, et. al 2007).
Generic Goals (GG)
“A generic goal describes the characteristics that must be present to institutionalize thec
processes that implement a process area. It is used in appraisals to determine whether a
process area is satisfied. “(Chrissis et. al 2007)
Generic and Specific Practices
Specific Practices (SP)
“A specific practice is the description of an activity that is considered important in
achieving the associated specific goal. The specific practices describe the activities that are
expected to result in achievement of the specific goals of a process area.” (Chrissis et. al
2007)
Generic Practices (GP)
“A generic practice is the description of an activity that is considered important in
achieving the associated generic goal.” (Chrissis et. al 2007)
Each process area includes some Specific and Generic Goals that are to be fulfilled through
their own Generic and Specific Practices. The next section elaborates on the Measurement
and Analysis Process Area and thereafter highlights its Generic Goals, Specific Goals,
Generic Practices and Specific Practices.

21
2.3.3 Measurement and Analysis Process Area
Measurement and Analysis is recognized as a support process area within maturity level 2
of CMMI process improvement method. The allocation of this process area is shown in
appendix 4.
2.3.3.1 Purpose
The main purpose for fulfilment of this process area is to empower the enterprise with a
measurement capability in order to stabilize the processes aiming at providing the
stakeholders with appropriate information that would lead to informed decision-making and
corrective actions. This process area aims mainly at the project level while the information
provided might be of use across the whole organization.
In order to support the functionality of this process area, the measurement activities are to
be contributing to the information need at various levels including all or everything broad
in the organizational-wide scope; e.g. business level, project management level and
operational level; being the most comprehensive of its class.
2.3.3.2 Requirements
As explained in the previous sections of this report each process area has some generic and
specific goals as well as some generic and specific practices.
Specific Goals and Practices
SG1 Align Measurement and Analysis Activities
SP 1.1 Establish Measurement Objectives
SP 1.2 Specify Measures
SP 1.3 Specify Data Collection and Storage Procedures
SP 1.4 Specify Analysis Procedure
SG2 Provide Measurement Results
SP 2.1 Collect Measurement Data
SP 2.2 Analyse Measurement data
SP 2.3 Store Data and Result
SP 2.4 Communicate Results
Tab.2 Specific Goals and Practices

22
Generic Goals and Practices
GG 1 Achieve Specific Goals
GP 1.1 Perform Specific Practices
GG 2 Institutionalize a Managed Process
GP 2.1 Establish an Organizational Policy
GP 2.2 Plan the Process
GP 2.3 Provide Resources
GP 2.4 Assign Responsibility
GP 2.5 Train people
GP 2.6 Manage Configurations
GP 2.7 Identify and Involve Relevant Stakeholders
GP 2.8 Monitor and Control the Process
GP 2.9 Objectively Evaluate Adherence
GP 2.10 Review Status with Higher Level Management
GG3 Institutionalize a Defined Process
GP 3.1 Establish a Defined Process
GP 3.2 Collect Improvement Information
GG 4 Institutionalize a Quantitatively Managed Process
GP 4.1 Establish Quantitative Objectives for the Process
GP 4.2 Stabilize Sub-Process Performance
GG 5 Institutionalize and Optimizing Process
GP 5.1 Ensure Continuous Process Improvement
GP 5.2 Correct Root-Causes of Problems
Tab.3 Generic Goals and Practices
These specific and generic goals and practices are then acting as a foundation for further
efforts on designing the five phases on the measurement template which in turn is
developed based on the Deming cycle (PDCA).
Note: Going through the details of goals and practices is way beyond the scope of this
master thesis; however the whole designed template is completely built upon these goals
and practices.

23
3. Theoretical Frame of Reference
3.1 Main Frame of References
A literature study has been done in order to find the most appropriate and well-confirmed
concepts related to the measurement needs and qualifications required to design a
measurement program presented as a thesis work at the EEEG department of Volvo 3P.
The following concepts will provide the readers with the main frame of references used as a
foundation to this diploma work.
3.1.1 GQM Definition
Goal-oriented measurement points out that the existence of the explicitly stated goal is of
the highest importance for improvement programs. GQM presents a systematic approach
for integrating goals to models of the software processes, products and quality perspectives
of interest based upon the specific needs of the project and the organization. (Basili et al,
1994). This means that in order to improve processes you have to define measurement
goals, which will be, after applying GQM method, refined into questions and consecutively
into metrics which will supply all the necessary information for answering those questions.
The GQM method provides a measurement plan that deals with the particular set of
problems and the set of rules for obtained data interpretation. The interpretation gives us the
answer if the project goals were attained. The GQM approach provides a framework
involving three steps:
The major goals of the development project.
Questions derived from goals that must be answered in order to determine if the
goals are achieved.
Measurements that provide the most appropriate information for answering the
questions.
Goal 1 Goal 2
Question1 Question2 Question3 Question4
Metrics1 Metrics2 Metrics3 Metrics4 Metrics5
Fig. 4 Goal Question Metric (Basili 1988)

24
3.1.2 PDCA Definition
Deming’s Plan-Do-Check-Act cycle is a well known model for CPI (Continuous process
improvement) and can be applied to practically anything.
It is also a basic foundation for the various repetitious and spiral process improvement
methods in project management in the respect of planning a change, making a change,
studying the effect of the change and then acting on those results. For continuous
improvement, one needs to run through this cycle multiple times.
Plan: To identify a problem, break it down, select a unit for improvement, choose a method
and solution. The critical factor in this phase is establishing a correct Metrics through
which we can measure the factors cause the problem right.
Do: Testing the chosen method on experimental basis or small scale in order to find out
the actual impact of the change on regular process, mitigating the likelihood of any risk.
Check: the evaluation of the test based on certain metrics would carry on. In project
management terminology, this phase is assessing key performance indicators with the
help of the results from experimental changes in a practical setting.
Act: The implementation of the proposed and approved changes to the regular business
processes.
Fig.5 Plan -Do-Check-Act (Deming, 1986)

25
3.1.3 ETVX (Entry-Task-Validation-Exit)
One of the methods that is of great benefit for organizations would be the Entry-Task-
Validation-Exit (ETVX). This method assists the organization to:
evaluate the entry conditions of the project/process
describe the tasks to be executed
validate those specified tasks and;
examine the exit conditions
One important function of ETVX is to help the organizations with process planning and
process documentation. ETVX is illustrated in the figure below:
yhytyhhhgfhh
Entry criteria to
start the process
- Traceability of
the activity
- Status of the
required inputs
Exit criteria to
complete the
process
- The output status
towards the process traceability
Validation
- Verifying the progress of the executed tasks
Task description
- The Organizational roles - Procedures
Fig.6 The ETVX (1996-2002 Mike Tarrani)
ETVX is mostly used as a “process definition” method and aims at utilizing the
measurement methods being implemented to evaluate the status of the project. This
operational concept can then be tailored to be used in other processes being executed within
the organizations.
It is of crucial importance that the processes are documented and communicated in a
captive language that enables the result to be presented in operational terms. Once being
communicated in operational terms, one concrete pattern on measurement process can be
created to thereafter act as a guideline for the organization to measure its processes by:
identifying the type of the data required to be collected,
specifying the collection method as well as the reporting system
data analysis
inserting the analyzed data to the process of decision-making
process improvement and development
start over through measurement process adjustment (if needed)

26
3.1.4 General Process Measurement
Measurement usually associated with collecting data, which are mostly numerical data, and
reporting them. However the main purpose of this method is focusing more on setting
goals, analyzing data that leads to informed decisions-making.
The objectives of this method are to:
• Provide the Organization with guidelines for designing process measurement that:
- Create a strong band between measurement and organizational goals and objectives;
- Defines a clear and accurate measurement;
- Collects and analyzes data to track process improvement towards achieving goals; and
- Evolves and improves as the process steps toward maturity.
• Identify the steps that when taken help an organization to implement and sustain a
measurement program.
3.1.5 KPI
Key performance indicators (KPI), also known as Key Success Indicators (KSI) are
financial and non-financial measure or metrics that help the organization to define and
assess how successful it is to achieve organizational goals. KPIs act as a measure of
progress toward goals while the organization has analyzed its mission, identified all
stakeholders and set organizational goals. KPI used as a performance management tool and
gives everyone in the organization a clear picture of what is important.
It is important for the companies to specify correct and relevant measures. Many of the
identified measures (by the company) are sometimes termed as Key Performance Indicators
(KPIs) while they are not the real KPIs, therefore, companies are to investigate this matter
carefully and rigorously in order to achieve the best result in terms of process/project
progress.
Key performance indicators define a set of values used to be measured accordingly. These
set of values which called indicators are the raw input to the systems to give the
summarized information as a result, the indicators could be classified as bellow:
Quantitative indicators: showing the results in numbers.
Practical indicators: showing existing company processes.
Directional indicators: showing the status of the company if it is improving.
Actionable indicators: showing organization's control to effect change.
KPIs are recognized as measures that focus on most critical aspects of the organizational
performances that are influential for the companies both current and future position.
Performance measures are divided into three main categories, as follows (Parmenter 2007):
1. Key Result Indicators (KRIs) tell you how you have done in a perspective.

27
2. Performance Indicators (PIs) tell you what to do.
3. Key Performance Indicators KPIs tell you what to do to increase performance
dramatically.
Fig.7 Three Types of Performance Measures (David Parmenter, 2007)
David Parmenter (2007) then elaborates on the figure above as stated below:
“An onion analogy can be used to describe the relationship of these three measures. The
outside skin describes the overall condition of the onion, the amount of sun, water, and
nutrients it has received; how it has been handled from harvest to supermarket shelf.
However, as we peel the layers off the onion, we find more information. The layers
represent the various performance indicators, and the core, the key performance
indicators.”
It might happen that the KRIs are by mistake used instead of KPIs. KRIs are those
measures that have to do with e.g. customer satisfaction, profitability of customers,
satisfaction among employees, etc.
Both KPIs and KRIs are resulted from a set of complex actions showing the status of the
project, process or objects being measures. The organization, however, has to be aware of
the fact that these two measures do not bring any solution in terms of improvements to the
system.
KRIs are often considered as long-term indicators where KPIs are mostly reviewed on short
interval basis (daily or weekly).
Organizations can profoundly bring a better reporting method in the system by clearly
distinguishing between the two aforementioned performance indicators.
28
Seven KPI characteristics are presented in the list below according to an extensive analysis
based on workshops with over 1,500 participants (Parmenter 2007):
1. Nonfinancial measures (not expressed in dollars, yen, pounds, euros, etc.)
2. Measured frequently (e.g., daily or 24/7)
3. Acted on by the CEO and senior management team
4. Understanding of the measure and the corrective action required by all staff
5. Ties responsibility to the individual or team
6. Significant impact (e.g., affects most of the core critical success factors [CSFs] and
more than one BSC perspective)
7. Positive impact (e.g., affects all other performance measures in a positive way)
Measurement methods and their results are mostly considered as managerial devices for
controlling the system including processes, projects, products, etc. It is therefore important
that the reporting procedure of result from the measurement methods is designed in such a
way that has the ability of converting the result into a decision-based reporting format in
order to facilitate the informed-decision making procedure for the management (based on
the result derived from the measurement methods used in the organization).
As a managerial device, KPIs reports should lead to actions taken in an aligned direction
with the overall business strategy of the organization at a right time. This reporting system
is therefore, to be informative, focused and brief.
Since the management team/board mostly makes decisions based on the report from the
result of the KPIs, it is also vital for the enterprise to define a clear set of activities,
considered as KPIs, within the focus area of the management/board.
Key Performance Indicators are valuable for teams, managers, and businesses to evaluate
quickly the progress made against measurable goals. Delivering answers to the following
questions:
What am I ahead or behind on?
How far ahead or behind am I?
What is the minimum I have completed?
From the functional point of view, Key Performance Indicators are objectives to be targeted
that would add value to the organization. For performing such designation, KPIs are to be
aligned with the organization’s strategy methods.

29
3.1.6 Communicators
Application of Key performance indicators (KPI), provide organization with a high-level,
real-time understanding of the progress of the processes by visually displaying vital
statistical information about that process which the end user can easily notice in a glance .
No matter how the results are shown; cockpit, spreadsheets, trend over time or other
displays, the health of the process would be quantifiable.
One well-known method that is currently being used by Toyota is the A3 method (Liker M.
& Morgan J. 2006). “A3 is a standardized technical writing methodology to create a report
on one side of a standard size piece of a paper to guide problem solving and achieve clear
communication across functional specialities.” (Morgan J.M., Liker J. K., 2006)
This method helps the organization to visualise their reports, documentations and results in
a standardized communication format that has the ability of expressing the complex
problem-solving procedures in a single sheet of A3 paper in an easy way understandable for
the target group. A3 method is also recommended as a further study of this master’s thesis
in order to optimize the usage of the proposed template.
The A3 method would also increase the trustworthiness of the reports, the templates and the
documentations since the A3s are owned by the functional organizations that create them.
(Kennedy M., Harmon K., Minnock E., 2008)
3.2 The reference method application (the logic behind the measurement program)
Measurement and Analysis Process Area within CMMI deals with how to build up a
measurement capability to support stakeholders information needs which would lead to an
informed decision -making.
Those related parties to the process i.e. process owners, process stakeholders, process
managers, etc, are to be provided with the necessary data that has the ability to monitor the
process improvement activities by directing the attention of the stakeholders towards a
realistic insight a process status namely; the amount of executed activities vs. the remaining
amount of tasks to be executed.
In accordance with the abovementioned statements, demonstrated based on the current
needs at EEEG department of Volvo 3P, the authors of this diploma work has tried to
represent a measurement program and thereafter a measurement “Template” as a tool to
fulfil the measurement program objectives.
The readers of this report can find the logical application of the main frame of references
(GQM, PDCA, IDCAE, ETVX) that has been used in conceptualization phase of the
Measurement program/Template as follows:
The overall strategy behind this measurement program is built upon the systematic method
called GQM.
The systematic thinking behind the Goal Question Metric method has led the authors of this
report towards creating a template in which the “process Status” is set as a goal, where a set
of questions are to be answered by the aid of the metrics. The result from the GQM
thinking (the designed template) acts as an informative basis that reports the process status
in terms of the related parties’ interest (s).

30
Taking one step forward in the template design procedure, these metrics are then derived
from a chosen set of steps namely; IDCAE (Identify, Define, Collect, Analyse, Evolve).
These steps are originated from the specific and generic practices of the process area M&A
categorized into the five mentioned phases called IDCAE.
It is to be reminded that the IDCAE are the five phases of the template ordered based on the
Deming cycle (PDCA) while being adjusted and redefined in accordance to the
achievement of the overall measurement program goals. These goals are the very same
“Specific and Generic Goals” of the “Measurement and Analysis Process Area” fulfilled
through those “Specific and Generic Practices”. According to those generic and specific
goals are to be fulfilled through the designed template where the specific and generic
practices are transformed into a question-shaped while the answers of these questions point
out the operational plan to be conducted in order to meet those generic and specific goals.
Fig. 8 IDCAE (Identify, Define, Collect, Analyse, Evolve)
One consistent pattern, ETVX, is then executed in all phases as to create a connection point
between phases in such a way that the exit point (output) of phase one would act as an entry
point (input) for the phase two and so on.
The transformation procedure of the entry of each phase to exit of the same phase is done
with the aid of task (to be executed) and validations (the internal activities in each phase).

31
Fig. 9 Application of ETVX in IDCAE
4. Method
This chapter intends to give a picture of the method’s basic outlook discussed in the project.
Furthermore, the chapter's function is to give the reader an insight into those conditions and
assumptions, which are as cornerstones for the results that are presented. This chapter will
stand as a foundation for a scientific basis requirement where interviews with stakeholders,
attending meetings, historical trend observation and literature study has been executed in
order to have the holistic view and comprehend the process performance procedures.
4.1 Research Methods
The work is characterized by the authors’ position on the problem. How the authors see the
matter of quality has its origin (Chapter 3) back in the literature studies and in interviews
and meetings during the work.
4.1.1 Research phase
A researcher can approach a study item in different ways, in the form of induction or
deduction. A researcher can seldom disregard the fact that the researcher can affect the
results.

32
The researcher's understanding, as been added through own experiences or through the
literature that describes second experience, comes more or less to influence those
interpretations and choices that the researcher come to do. This position is called
hermeneutic
(Johansson-Lindfors, 1993)
This work commutes theory and empiric in order to improve the knowledge, which is
applied in the project, which means that one hermeneutist approach will be used in the
report
4.1.2 Inductive
Induction means that the researcher goes from the general to the specific. Thus, conclusions
are formulated from experiences. Induction requires often ability to express itself in figures;
i. e. used measurements and quantitative methods (Bengtsson & Bengtsson, 1995). The
matter is tackled without any hypothesis and with an unclear issue. This happens to get a
comprehensive picture of the matter.
Fig.10 The Inductive Phase

33
4.1.3 Deductive
Deduction means to go “proving road” that is based on the basis of general principles and
theories to draw conclusions of each individual phenomena (Patel& Davidsson, 1994).
Without doing pretensions in the result part to present general conclusions, it is
characterized as an inductive attack way.
It means that the researcher approaches available literature within the current problem area
and derives thereby new consequence kits about specific phenomena. One hypothesis
examination can then happen throughout the empirical studies.
This diploma work is built to a large extent on a deductive run-up then it aims at analyzing
quality within the company and then comparing the analysis with the theory. In order to
achieve this result the basis is upon the already existing theories.
Fig. 11 The Deductive Phase

34
4.2 Work form and Arrangement
The report's sets-ups clarified in this chapter.
4.2.1 Qualitative and quantitative investigation
It is usually talked about qualitative and quantitative methods in a research work. The
choice between quantitative or a qualitative survey depends on how the problem is
formulated and specified.
A qualitative study focuses on a few study items and is based on non-quantified data like
attitudes and values. The focus would be on various ways to collect information in order to
get a deeper understanding of the study items. Qualitative surveys are built on interviews
and observations where a phenomenon is being investigated deeply.
Quantitative study is based on information gathering from a large number of study items
that can be quantified. The quantitative surveys require the concepts that can be made
measurable and that general conclusions can be drawn on the basis of these. This gives a
general validity in research, but the deep understanding which can be approached by the
qualitative method can be lost (Holm& Solvang, 1991)
In the same way as qualitative methods, quantitative methods are also built on conditions
that concerns knowledge. Therefore it is important to clarify what these conditions mean
(Holm &
Slovang, 1991)
In this diploma work, a qualitative survey is carried out.
4.3 Reliability
4.3.1 Validity
The concept validity is used in order to describe whether the selected measurement method
actually functions as been intended. In connection with smaller projects that does not act on
testing or to measure something in a strict way, it is seldom necessary to deepen the
discussion in the technical aspect of validity (Bell, 1995)
In order to achieve high validity in this work, interview questions are formulated so that
they are in agreement with the survey's aim and what is intended to be measured is
measured and nothing more.

35
4.3.2 Reliability
Reliability states how effective measurement method withstands the hazard's effect. Low
reliability of interviews and questionnaires can for example depend on:
- Personal status (health, fatigue, motivation and stress)
- Comfort factors (environment and in cash with interviewer)
- Formulation factors (variation of interviews)
A good way to reach high reliability is to use clear questions. Let a person who is
interviewed take enough time. Interviews should also take place in an environment where
the interviewed person finds is comfortable. Do not interview in groups so that the
presentation anxiety can arise.
Reliability is easier to theoretically establish than validity which can be calculated or be
established with the aid of probability based reasons (Bell, 1995)
It is not possible to avoid errors while gathering information in a process. Such errors can
arise in connection with many different factors that exist with each process. The picture
below (fig.12) shows some stages that can give low reliability (Holm & Solvang, 1994)
Fig.12 Reliability point of view (Holme & Solvang 1994)

36
4.4 Information Gathering
In checking how the information is gathered the primary concepts - and secondary data are
used. While gathering primary data, new data, different techniques such as interviews and
meetings are used. Secondary data is the data that come from literature studies, magazines
and information search on internet.
4.4.1 Primary Data
Gathering of primary data can be divided into three classes; observations, opinion
investigation and interviews (Dahström, 1996). The first and last classes are of interests for
this diploma work.
What question formulating to chose depends on which area is to be intended. For a statistic
survey the questions should be standardized and formulated so that only few alternatives
are left to reply. Qualitative surveys can be more appropriate with open questions with free
scope for spontaneous consequence questions.
One respondent can in this case moreover be submitted with larger scope for own
interpretation of questions.
Interviews at Volvo 3P and with people linked to process measurement have taken place
continuously with relevant key persons. Interviews and questions have occurred with
reflections around problems and actual information gathering.
4.4.1.1 Interview
An interview situation in general means a communication between three types of operators:
Interviewer, respondent (interview items) and possible spectators. One research interview
lacks spectators.
Research interviews can be carried out in several ways. An interview can be categorized
with the aid of the following two dimensions, structural and standardization (Andersson,
1994)
Fig.13 Structuring-Standardizing Relation (Andersson, 1994)

37
An introduction in the two dimensions of standardization and structure gives four possible
interview types (see character 4). An interview of;
Type 1 is common within scientific research and can be compared to a person-to-person
questionnaire that aims at giving replies on some specific cases.
Type 2 is used when the interview items' knowledge is varying within the suitable area.
This method opens opportunities for interesting and unexpected information to turn up,
what possibly difficult to anticipate by more governed questions.
Type 3 is called also focal point interview, through changing the question wording and
question order a problem can be approached from different directions. This type is common
in market surveys.
Type 4 is used often when the interview aims at getting fundamental information about an
area, i. e. at preliminary research studies.
Usually, interviews happen only “one by one”, a variant is group interviews, or group
discussions. These usually consist of 8-10 persons and a tutor or interview leader. Surveys
show that a group interview of two hours disclose as equal majority requirements and needs
as two one-man interviews each about an hour (Ulrich&Eppinger, 1995)
All four types of interviews mentioned above are used in this diploma work in order to have
a better understanding of the reality of the organization as the different stakeholders might
have different manner towards the organizational matter.

38
4.4.1.2. Meeting
After interviewing different related people, it was found who to choose in order to arrange
different meetings to get some feedback to approach one step closer to the aim of this
project. Each part of this project needed different people at different meetings.
Each meeting was aimed at discussing a logical process behind the physical process
running in the company.
Logical processes are drawn after having interviews and these logical processes were
discussed on each meeting with the responsible people of each division.
Name
Title
Fredrik Westin Global Process Manager - Electrical & Electronics
Kjell Gustafsson Chief Engineering
Sofia Karlsten Project Manager
Anders Henriksson Manager Embedded Software Development
Henrik Granath DNV Consultant
Katarina Borg Group Manager
Fredrik Hallgren Quality & Technical Support
Renart Guillaume Global Quality Manager, Electrical and Electronics
Niklas Vännman Section Manager Project & Quality Management
Lars Lindell Project Quality Support
Tab.4 List of interviewees

39
4.4.1.3 Literature Study
In order to add more pure scientific flavor to this dissertation, a literature study has been
done. Different sources of literature have been investigated as well as the company’s
internal information in case there is a lack of scientific-based literature to support the
internal terms of the company.
4.5 Method Criticism
On the road from wording of aim and problems to conclusions and results being presented,
many different stages in a survey would be passed. In all of these stages during the work
process, a risk that errors arise exists.
It is possible to divide following types of errors, which may arise during each project.
(Lekvall&Walbin, 1993)
- Wrong aim; if the aim with the project is incorrectly formulated, this can lead to the fact
that the entire study becomes misleading. Apart from the aid of this effort, it is tried to
avoid this through having a continuous dialogue with the process stakeholders at Volvo 3P
so that the risk of this type to arise would be minimized.
-Wrong direction and contents; these errors can arise when one fails with specifying the
project information in a correct way. Another reason for these errors can also be the fact
that one does not consider the time factor when formulating the delimitations which can
lead to the fact that one disregards questions that are relevant for the aim. Therefore, great
efforts have been made in order to present a detailed set of delimitations as well as a
concrete project specification.
- Inference error; Inference errors can arise when one tries to generalize and draw
conclusions from a chosen objective population. This can for example be a consequence of
an incorrect selection procedure from the author's side. The authors have presented this
matter in the method chapter, so it’s up to the reader to assess these.
- Measuring errors; these errors arise when the applied measurement procedure does not
give the correct result; i. e. the measurement method affects the result. Consequently,
received measurement values can differ from the real values. This can depend on that the
interview persons do not want to or cannot reply honestly, or because of that, the interview
arena influences him/her with a certain direction for example through the appearance or
through the way the questions are set.
All interviews in this project has aimed at lifting the level of validity and therefore to be
used as a basis for further researches and results.
If the person who interviews considers the interview item errors, it results in the so called
interviewer effect. The interviewer must intend in formulating the sensitive and conductive
questions clearly otherwise, the questions can be interpreted in a different/wrong way
(Instrument error).
Instrument error has, as long as possible, been tried to avoid using branches own
terminology.
40
Furthermore, interview questions have in several cases been given repeatedly, but with
different wording and at different occasions, to the same respondent.
All interviews are held in closed locals. The positive effect of this is partly that the
interviewee would have courage to speak freely without being disturbed by other
colleagues, partly means the safety since the interviewee find him/herself in his/her normal
environment.
Although sensible parts of the interviews have been both under structure and standardized
all interviewees may voice their opinion relatively freely around selected matters. It can
mean that sensible risk exists for the interview to be directed totally different from the way
it was meant to.
-Processing error; arises when the researcher processes computer material in such a way
that wrong conclusions would be drawn. This work builds above all on interpretation of
qualitative data which means that the risk for the data to be miss-leaded tried to be low.
4.6 Structure
Much has been written about process measurement and process improvement methods
during the recent years. Many concepts have been discussed to elaborate this matter.
Different methods and different models that can affect the process measurement have been
described in the theoretical frame of reference. It is important to discuss theories around
process measurement in order to be able to achieve a clear picture of the matter and to link
the theory to the empiric.
General theories and partly theories around this concept are being discussed in the work.
The first step in this project is to find the problem(s) and then a discussion about the
problem(s) will follow in order to approach the aim of this project.
When the aim is being clarified, the material/information gathering begins. The hardest
issue in this project was to find the factors which are of importance in the analysis of the
concept “process measurement”.
Through a careful study of the theory and the study about the connection between the
different factors, a systematic analysis can be developed. Each area will be treated
individually in order to be linked together to a general analysis of the design of the
measurement program in the end. An important stage is when current factors will be set in
correct proportions with each other.
In order to give the work a scientific basis and in order to take part in the culture of the
company which is available within this subject, a literature study has been done during this
project work.
The literature study has also functioned as basis in order to plan and to implement the
work's interviews, with the intention to easily organize relevant and interesting questions
for the interviewees.
The result of the empiric, including interviews and visits, lies as a basis for the continued
work within the clarified area. This project finishes with implementation recommendations,
which are based on both the empiric and the theory parts.

41
4.7 Reflection on Methodology, Theory and Industry Usage
One important task while conducting a research is to recognize one’s role (as a researcher
during the whole process). As the authors of this report became more familiar with the
Volvo 3P environment and as the application of theory (along with the usage of
methodologies mentioned in this report) in the industry world seems to be sometimes
different than what is being taught in the academic world e.g. universities, it was crucial for
the authors to regularly return to the university in order to have the opportunity of looking
at the organization from outside (not losing the critical state of mind as those organizational
operations that has brought some potential doubts might become normal due to the
“regularity of use” ).
Having the theories and methods (introduced in the previous chapters) studied thoroughly
as well as having the industrial operations at Volvo 3P investigated and thereafter
understood, these two factors contributed to bridging the academic world to the industry.
This approach-strategy led to the ability of finding out more about the weak points
(improvement opportunities) in which studying the theory acted as a guideline for future
improvement and the fair understanding of the industrial application at Volvo 3P facilitated
the usage of the theory in the favor of the industrial world.
Major effort in terms of the right usage of the methodology e.g. meetings and interviews
with right people was therefore, required in order to find out about the main reasons behind
the condition/state of the theory usage in different circumstances depending on the nature of
the processes at the EEEG department at Volvo 3P.
Having the result of these interviews and meetings discussed and analyzed in the
environment of the university; in order to minimize the risk of losing that critical view
which might had happened in case of analyzing and discussing in the industrial
environment (were some factors would be eliminated due to the “regularity of use”); helped
the authors to constantly follow one logical manner while designing a measurement
program. This program is a result of a structure built upon some fundamental theories
(introduced in this report) as well as being adapted to the organizational needs and
objectives at Volvo 3P.

42
5. Development of the Measurement Program
This report is aiming at creating and establishing a process-measurement program as a vital
part of EEEG in order to contribute to the achievement of CMMI level 2. Great efforts have
been done to design a repeatable program which can be used in further studies as well as
different departments of the whole enterprise. Goal setting, measurement objectives from
related stakeholders, decision making and data analysis are among the important aspects of
this program. This report also acts as a basic guideline for the start-up of the measurement
process within EEEG by recognizing the organizational improvement strategy and trying to
design a supportive program which is aligned with this overall improvement strategy.
5.1 Measurement program
The major aim of each measurement program is to provide its respective organization with
a logical and rational insight into the organizational improvement processes as well as
contributing to a better and matured decision making that can facilitate the achievement of
the goal/goals derived from a pre-defined set of improvement processes. This report
therefore; stands not only as a measurement-framework, but also as a guideline that would
lead to a better integration of this measurement program with the overall improvement
processes held at this department.
5.1.1 Objectives
Measurement is often recognized as a set of numerical data gathered to be processed in
order to present numbers to the stakeholders and other related people in organization. So
many methods are therefore available to support this kind of measurement but the issue is
to create a measurement program that support the objectives and goals of the organization
in such an analytic manner that can analyze the given data with respect to those goals and
thereafter has the ability to create necessary basis for decision making.
The main objectives of this measurement program are as follows:
Create a framework that can be used to design a process-measurement program which
support the:
- Measurement alignment with the strategic goals and objectives of the company
- Consistency of the measurement program in terms of accuracy and definition
- Track of data analysis in order to create a common understanding of the status
of the processes in terms of progress made towards goal achievement
- Alignment and flexibility of the designed program as processes step towards
maturity
Primary outline of the measurement system for the start-up phase and even the
sustainability of the designed program.

43
5.1.2 Target group
This report is basically aiming at the department of EEEG or the related group/groups who
has been assigned to execute the measurement and analysis processes at this department.
However, as this measurement program is designed to assist the process-quantification;
which in its turn would contribute to a creation of an “informed decision-making” pattern;
any department involved with the process improvement would benefit from the
implementation of this measurement program as to be described in this report.
5.1.3 Overview
This master’s dissertation includes different chapters aiming at completing each other in order
for the company to take one step closer to the achievement of measurement and analysis
processes.
In this report it has been tried to present an architecture that comprises different activities
where each activity includes a series of action to be taken in terms of planning, development,
implementation and improvement of this measurement program. Some applications are also
illustrated in order to elaborate on the concept of measurement usage.
The readers will also be able to find some possible actions an enterprise could take to
establish a process measurement program.
Bearing in the mind that designing the measurement program is only one of the primary steps
to be taken under the path of Measurement & Analysis (M&A), the authors have also tried to
introduce some steps that can ensure the existence of the measurement strategy in place which
can recognize the need of designing this program which in turn can support this strategy.
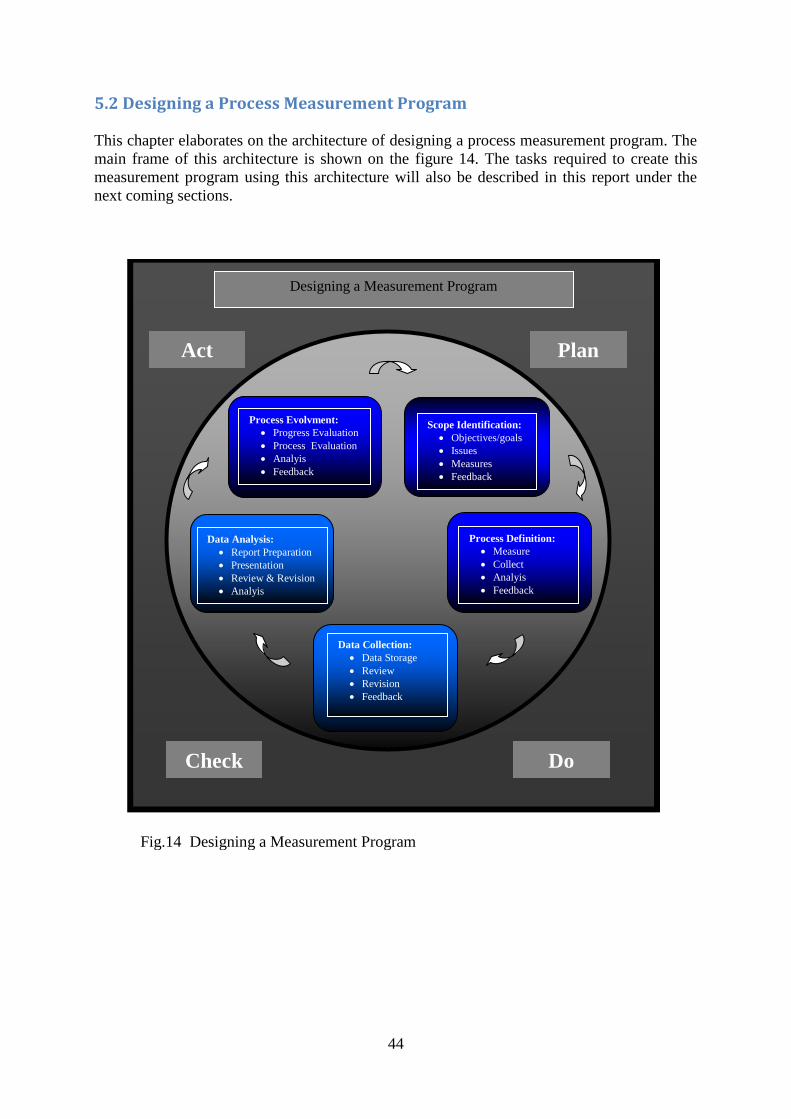
44
5.2 Designing a Process Measurement Program
This chapter elaborates on the architecture of designing a process measurement program. The
main frame of this architecture is shown on the figure 14. The tasks required to create this
measurement program using this architecture will also be described in this report under the
next coming sections.
Designing a Measurement Program
Do
Process Definition:
Measure
Collect
Analyis
Feedback
Data Collection:
Data Storage
Review
Revision
Feedback
Scope Identification:
Objectives/goals
Issues
Measures
Feedback
Data Analysis:
Report Preparation
Presentation
Review & Revision
Analyis
Feedback
Process Evolvment:
Progress Evaluation
Process Evaluation
Analyis
Feedback
Fig.14 Designing a Measurement Program
Check
Act Plan

45
It has been tried to design this program in such a generic way that makes it possible to be used
in different levels of the organization, e.g., project management level or organizational level.
The designed measurement program in this report finds its origins in the Goal-Question-
Metrics (GQM) approach by Basili and Rombach from the University of Maryland (Basili
1984, Basili & Rombach 1987). This main objective of this method is to link the measurement
activities to Product quantification, process quantification as well as resource quantification in
order to make decisions to meet project goals. Much has been written about the GQM. One
can claim that one shared principle is obvious among efforts done towards the GQM approach
and that would be the fact that the measurement program must be designed in a way that
enables the projects to align their measures with the organizational/business objectives .In
other words, those measurement objectives shall be derived from the strategic overall business
goals of the organization where the processes would identify the appropriate measurement
methods that address those pre-defined business objectives.
One important issue is to create such a program that enables the measurement procedure to be
continuously evolved, developed and improved as the processes matures within the
organization as shown in figure 14, where this principle is addressed.
The program shown in figure 14 is based on the Shewhart/Deming Cycle recognized as to be
fundamental for quality control. This cycle is also recognized as Plan-Do-Check-Act (PDCA)
cycle.
One rational link between the process measurement (shown in figure 14) and the PDCA cycle
is shown below:
Plan-Do-Check-Act
(PDCA)
Components of the
Process Measurement
Program
Aim
Plan Scope Identification
Process Definition
Creating and confirming the aim, the
plan and the process of measurement
linked to the organizational objectives
Do Data Collection Implementing the plan in terms of data
collection
Check Data Analysis Data analysis in order to map the
progress towards the measurement
objectives
Act Process Evolvement Decision-making built upon the
achievement level towards the
objectives considering the
improvement activities executed on the
measurement program being applied.
Tab.5 Link between the measurement program and the PDCA
The alignment of the organizational processes with the measurement program, shown in the
figure above, enables the organization to collect the necessary data and analyze it in a way
that would contribute to one informed-decision making process considering both project and

46
organizational goals. One shall also recognize the importance of the feedbacks in this program
that would lead to considerable improvement of the measurement program itself.
5.2.1 Developing a Measurement Program
Program architecture was introduced in figure 14. This can be of benefit for organizational
measurement program development where the measurement program gradually becomes a
valuable asset for the enterprise.
This measurement program would not act independently but rather in cooperation with other
activities being executed in an/the organization. In other words this program would create a
somewhat standard pattern of measurement with high flexibility potentials (depending on the
type of the process being measured) by taking advantage of the organizational databases,
documentations, cost models and other related elements. The program itself also includes
some essential and fundamental blocks of elements that have the possibility to be tailored
based on the measurement objectives demanded to be measured.
The major focus of this master’s dissertation is on the constituent elements of the
measurement program. Each element of this measurement program includes a set of well-
defined tasks that are closely related to the overall goals of the organization. This project is
also aiming at introducing some methods that would facilitate the process of measurement
program creation. These elements are designed in a way that not only fit in the organizational
standards measurement processes but also fulfill the requirements that are demanded by major
stakeholders. The result of this measurement program would present the status of the process
to the relate stakeholder in terms of functionality and efficiency.
Creating a measurement program is both time and money consuming; therefore, it is
recommended to create a feasible program which can be used in different cases in association
with the pre-determined financial resources. The program presented in this report proposes
also on the concept of measurement template development that can be designed, used and
refined. These templates shall provide the organization with complete measurement
descriptions where there is space for modification and adjustments.

47
5.2.2 Planning the program
Planning the measurement program includes the following steps:
5.2.2.1 Scope Identification
This measurement program finds its origin in needs for measurement. These needs can vary in
size such as measuring the performance of inter-Departmental projects or assessing and
evaluating process improvements. Measurement demands usually involve different audience
with different perspectives. This is of great benefit for the measurement program as whole as
different functional groups would generate different inputs to the whole process which, at the
end, would lead to a result that would cover most aspects of the process/project being
measures. Therefore, it is important to recognize those measurement demands as well as the
audience who would receive the result of this measurement program.
The first step here would be to identify and establish those measurement demands/needs.
After having the demands identified, it is now time to accurately address and identify the
scope of the measurement program. The reason for this would be to establish the major
purpose of all measurement activities included in the program.
Scope identification would specify:
Those objectives that are to be supported by the measurement system
Those issues that would act as obstacles against meeting those objectives and,
Measures that would provide and insight into those obstacles
Figure 15 elaborates on the identification of the scope as well as the purpose of the
measurement activities included in the measurement program. This figure also contributes to
finding only those measures that are aligned with the overall goals which support the decision
making based on the objectives. The rest of the measurement process (data collection, etc.)
would be meaningless without this first step as the data collected might not provide related
basis for making informed decisions.
This figure (and all other figures that elaborate on different steps of the measurement
program) is based on the ETVX method trying to elaborate on the first step of the
measurement program.

48
Fig.15 Scope identification
Name:
Date:
Phase 1: Identify
Entry: The stakeholder(s) need to have an insight into the project processes in order to make informed decisions to achieve the organizational objectives. The measurement needs are totally depending on the nature of the
project. Task 1. Measurement need: Validation 1. Project managers need to have insight into project progress.
Task 2. Organizational objective(s):
Validation 2. Objectives are aligned with the GDP( Global Development Process).
Task 3. Methods:
Validation 3. Methods for achieving the objective.
Task 4. Measurement issues: (Actual versus estimated)
Validation 4. Recognizing the issues that should be managed, controlled, or observed.
Task 5. Measurement goal:
Validation 5. To monitor actual versus estimated issues in order to make decisions with respect to project plans, progress, and need for re-planning.
Task 6. Questions:
Validation 6. Making a set of questions for each goal that, when answered, will show if the status toward achieving the goal. What was the planned QDCF (Quality, Delivery, Cost, Feature) of the project? How much have we done? How much is left to do? When will it be complete?
Task 7. Things to be measured:
Validation 7. For each question, establish a set of things to be measured which could verify the answers to the questions.
Exit: A set of objectives to be measured which generate an overall view on the processes for informed decision-makings. These measures shall be confirmed in order for the process continues with the Define Procedures Activity (Phase 2).

49
The figure above follows a logical sequence of fulfilling some tasks in order to identify the
scope of the measurement process as follows:
1. Clarify the need for measurement: the need for measurement could vary within a
large range. It might be a need of providing a view on the organizational goal
achievement, or it could be in detail level such as providing a view on the changes
occurred in a specific project performance due to changed demand or new system
implementation. It is crucial to recognize all those stakeholders (audiences) that are
going to use the measurement data with different perceptions and from different
perspectives. Therefore, as mentioned before, it is of vital importance to identify those
related stakeholders that would receive the measurement results/reports. Not only it is
important to find the related stakeholders, but it is also important to find the
responsible people who are in charge of decision making as well as those who are in
charge of data provision.
2. Organizational Objectives: Having the measurement needs specified, provision of an
insight into those organizational objectives that are going to address those needs
become necessary. This should be done in order to ensure the fact that measurement
system is aligned with the business objectives of the organization and would provide a
stable platform for the decision making accordingly.
3. Methods: These methods shall be used as the aids that would help to achieve the
aforementioned objectives. Those objectives shall be feasible and these methods stand
as a guarantee of the existence of a guideline that would assure the achievement.
4. Measurement issues: These are the obstacles that shall be identified, managed and
controlled. These issues are to be both process-related and traceable.
5. Measurement Goals: Goals shall be measurable if they are to be used in the process
of decision making. Therefore, each measurement issue is to be translated into
quantifiable measurement goals. The main purpose of translating the goals into a
quantifiable form is to create a common understanding among the stakeholders to help
different related stakeholders communicate with each other, understand the
measurement program and make decision based on the well-understood result.
6. Questions: A set of related questions shall be listed where the answer to those
questions would clarify if the pre-defined goals of the process have been reached.
7. Things to be measured: In order to answer the stated questions in the task above, one
shall create a list of the things which are to be measured to be able to answer the
questions.
The logical sequence in figure 15 generates a set of measures to point out the need for
measurement. The activities involved in this template can be used as a guideline for
identifying the scope of the measurement program as well as supporting the process of
informed decision making in the organization.
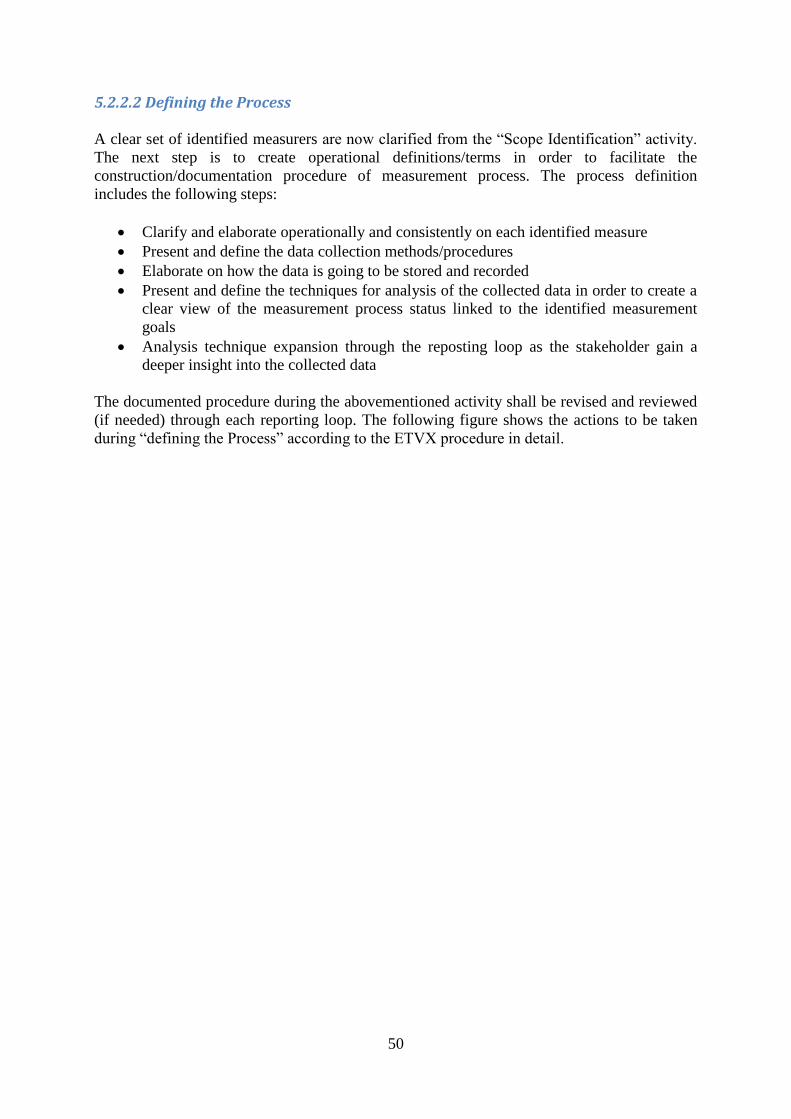
50
5.2.2.2 Defining the Process
A clear set of identified measurers are now clarified from the “Scope Identification” activity.
The next step is to create operational definitions/terms in order to facilitate the
construction/documentation procedure of measurement process. The process definition
includes the following steps:
Clarify and elaborate operationally and consistently on each identified measure
Present and define the data collection methods/procedures
Elaborate on how the data is going to be stored and recorded
Present and define the techniques for analysis of the collected data in order to create a
clear view of the measurement process status linked to the identified measurement
goals
Analysis technique expansion through the reposting loop as the stakeholder gain a
deeper insight into the collected data
The documented procedure during the abovementioned activity shall be revised and reviewed
(if needed) through each reporting loop. The following figure shows the actions to be taken
during “defining the Process” according to the ETVX procedure in detail.

51
Fig.16 Defining the Process
Name:
Date:
Phase 2: Define
Entry: Those approved objectives from phase 1 are to be used as inputs for phase 2 which leads to informed decision-making.
Task 1. Measures: Validation 1. A clear set of measures shall be listed. These measures shall follow systematic rules that state what might be included and excluded in each measure. Task 2. Counting Procedures:
Validation 2. Measures data collection documentation in a clear and repeatable manner. Task 3. Recording:
Validation 3. Standardizing the templates and reporting procedure. Task 4. Storing:
Validation 4. Database creation in order to investigate the trend in long term strategies.
Task 5. Analyzing: Validation 5. Define analysis methods and show how the measures can answer the goal related questions.
Task 6. Reporting:
Validation 6. Tables, charts, and graphs adequately summarize progress towards goals.
Task 7. Feedback:
Validation 7. Method improvement.
Exit: A primary measurement program is stabilized and approved.

52
In order to clarify the activities to be done during the measurement process, the following
items shall be documented.
1. Measures Definition: Measures such as QDCF (Quality, Delivery, Cost and Features)
shall be documented and considered as a major part of the measurement program
2. Counting Procedure Definition: As mentioned before. Measures shall be translated
into operational terms. Once it is done, the whole process for collecting each measure
shall be documented and stored in a clear and repeatable way containing the data
source, collection frequency, collection tools, etc. The collected data however shall be
approved and verified to ensure that the correct data are collected.
3. Record: Once the data is approved, a record procedure for the measures should be
constructed including administrative instructions e.g. project’s name, data from
configuration management and related responsible people for the data collection.
Moreover it is highly important to have the project staff involved in this process.
4. Create a Database to Store the Data: Creating a database would facilitate the data-
organizing procedure. It would also make it easier for the users to find the data in a
more organized way. One major advantage would be the fact that as the amount of the
stored data grows, one long-term trend of project performance can be created.
5. Analysis Technique Definition: This technique should also indicate the relation
between the measure and those questions that are related to the goals. An investigation
and afterwards an evaluation of the major events of the process being measured shall
be executed in order to create an appropriate basic analysis technique that explains
those events with the respect to the collected data. This analysis technique will
gradually be redefined and adjusted to the process needs (regarding the goals and
objectives that are to be measured) as the assigned people provide the measurement
program with more related data and knowledge. This adjustment might be aligned
with new issues and obstacles that are the inevitable part of each measurement
program. Therefore it is of vital importance for the analysis technique to cover those
potential and anticipated obstacles as much as possible such as the interaction between
the measures being previously identified.
6. Reporting: after having the steps above fulfilled, one reporting system is to be
constructed. This reporting system shall be designed in such a way that provides the
stakeholders and other related people with a strong communication system. As the
stakeholders might be from different departments with different interests, it is crucial
for the reporting system to be formatted according to those interests with a plane
language that is understandable for all partiers.
7. Feedback: A feedback mechanism should include the report’s status as well as how it
can affect the decision making process. This mechanism should also recognize the
importance of having regular meetings in order to present the result of the
measurement program in a systematic way in terms of the agenda, purpose of the
meetings, list of attendees, a well-defined process for feedback from the stakeholder,
etc.

53
5.2.2.3 Overview on Scope Identification and Definition tasks
Having the Process defined and the Scope identified, helps organizations to create a well-
documented and operational basis for the measurement process to move to the next level. Not
only should this plan clearly identify the scope of the measurement program but also has to
state the measurement effort aligned with clarified roles with respective responsibilities for
each role, schedule and the resources.
This procedure brings the opportunity of having a tailored and flexible measurement program
that can be implemented to most of the project/processes in the enterprise which in origin
follows the same tasks and rule. This documented plan also acts as a baseline that can be
reused on future iterations through the process measurement.
Since it is not possible to know/use all the necessary analysis methods in advance (needed to
be used in the process measurement depending on the nature of the project), this basis
measurement program would analyse the data as they are collected and would further present
an insight based on the successive steps taken through the whole procedure. This baseline
thereafter shall be reviewed and revised accordingly as the additional feedback would enter
the system from different steps of the measurement program.

54
5.2.2.4 Data Collection
After having the abovementioned steps executed, it’s now time to start with the data
collection procedure including data collection, data recording and data storage. In order to
fulfil as steps in this phase, the organisation shall validate the collected data and review them
for adequacy. The data collection procedure is however to be tailored and adapted in order to
suit the project/process being measured. The figure below outlines the activities required for
this phase.
Name :
Date:
Phase 3: Collect
Entry: An approved measurement program from phase 2.
Task 1. Collect data: Validation 1. Choosing the relevant data collection method depending on the nature of the project/process. Task 2. Record data:
Validation 2. Documentation procedure. Task 3. Store data:
Validation 3. Corresponding data is specified, verified and stored. Task 4. Review and revise procedures:
Validation 4. Discussion based on the appropriate chosen collection procedures.
Exit: Approved data which is related to the chosen project/process is now complete and ready to be uses as an input to the next phase.
Fig.17 Data Collection

55
5.2.2.5 Data analysis
This phase is the start phase for analyzing the collected data as well as preparing the first draft
of the reports. It is important to continue reviewing whole procedure so far for accuracy since
there might be a need for updating/changing the report structure in case it is not reflecting the
issues or the report does not provide the audience with a clear insight into the measurement
program as a whole. It is crucial that the report is understood by all parties who read it;
therefore the report should be subjected to the rigours of testing in terms of review and revise
based on the collected feedback.
Name:
Date:
Phase 4: Analyze
Entry: Approved data from phase 3.
Task 1. Analyze data: Validation 1. Discussion with related stakeholders and feedback.
Task 2. Prepare report:
Validation 2. Regular reports which provide the respective people the overview on the issues and the status of the projects/process Task 3. Present report :
Validation 3. Reports are being communicated and approved by the concerned stakeholders. Task 4. Review and revise procedures:
Validation 4. The chosen analysis method is being reviewed and potential changes are discussed.
Exit: The result of what has been done so far is communicated with relative stakeholders whom acts as an entry to the last phase.
Fig.18 Data Analysis
Those who are assigned to conduct the measurement program shall critically analyze the
collected data and find those objectives that are for example lagging the plan in terms of size,
effort, etc. Moreover they should find out about those issues that cause the slips in the
analysis phase. It is however necessary to recognize that some issues are no longer critical
(despite the fact that they do not meet the goals of the process) as the plans of the
process/project might not be realistic anymore. Therefore it is important for the measurement
program to be flexible in terms of having the ability to be updated according to the additional

56
information, issues and making an alternation to the pre-defined goals of the process under
measurement.
5.2.2.6 Process Evolvement
The figure below (fig.19) elaborates on the final phase of the measurement program. This
final phase provides the organizations with the ability of improving their processes as well as
the structured framework of handling those issues and obstacles encountered while making
effort on improving the processes.
The stakeholders, at this stage, would receive a measurement report that would lead to an
informed decision making according the result of the measurement program. The decisions
made by the stakeholders (after considering the result obtained) might include some
corrective actions, re-planning, changing measures and goals, etc.
At this step, the stakeholders would also generate feedback on the available data in terms of
some extra issues (raised to be added to those already existing ones), or an indication that
some specific data are not available anymore.
All feedbacks from all phases of the measurement program are to be addressed during the
“Evolvement Phase” in order to redefine the measurement program if needed. The collected
feedback shall be evaluated in order to make necessary changes in advance to the future
measurement program implementation as well as the reporting of the result of this program.
Name :
Date:
Phase 5: Evolve
Entry: Communicated draft measurement activities which is reviewed and revised.
Task 1. Evaluate insight into progress: Validation 1. The draft measurement is reviewed by the stakeholder in order to be confirmed (potential changes are executed). Task 2. Evaluate measurement process:
Validation 2. Issues and possible obstacles are addressed and identified.
Exit: Final results are reported, communicated and reviewed. Feedbacks have also been taken under consideration. The final measurement program is approved by all stake holders in terms of scope identification (objectives, issues and measures), procedure definition.
Fig.19 Process Evolvement

57
It is necessary for the stakeholders to determine if adequate data is in hand to track the
progress accordingly (whether the collected and analyzed data are to be used in their decision
making procedure).
After having the abovementioned phases implemented and fulfilled, the final measurement
report is to be confirmed by the stakeholders while feedbacks are obtained for the
measurement program evolvement.
Feedback in the whole program is playing an important role as it would minimize the risk of
potential inconsistencies of any kind raised during the measurement process. All feedbacks
should be addressed in order to facilitate the update procedure in terms of program
review/revise as well as reflecting any potential issue raised by the stakeholders during
different stages of the measurement program. Receiving feedbacks is an indication from the
stakeholder regarding their need for process measurement while not receiving any feedback at
all on the contrary might indicate the fact that the stakeholders may not need the measurement
at all.

58
6. Test and Iterative Process
6.1 Measurement Program Result
Considering all methods used as well as the needs in the EEEG department at Volvo 3P the
following template is resulted based on the “Measurement and Analysis” process area of
CMMI.
One “Comprehensive Measurement Template” is designed on a general basis, meaning that as
many processes as possible can be targeted by this measurement tool, as many stakeholders as
possible can benefit by the result from this measurement tool and as many
PIs/processes/projects as possible can be evaluated and measured in this measurement tool
where the result would address the current status of the processes.
Moreover, to add an educational aspect to this designed tool with the aim of facilitating the
usage procedure, one extensive and detailed specification is attached to this template for the
sake of “Self-Training” while being implemented across the organization.
6.1.1 Comprehensive Measurement Template
Figure 20 shows the five phases of the process measurement to be followed in the same order
as shown below:
Fig.20 Five Phases of Measuring the Process

59
These five phases (based on the Deming Cycle phases), all together, make one single template
namely, “The Comprehensive Template” which is available in the appendices.
Each process/procedure begins with an input and after being exposed to set or activities
(tasks), one or several outputs would result in one or several outputs. These results could be
the final results or they could act as new inputs for the next process/process step.
This measurement template follows the logic explained in chapter 3.2 using the exit (output)
of each phase as an entry (input) for the next phase. This approach explains the strong link
between these phases.
It is worthy to mention that this link does not only exist between the phases but also within
each phase where the procedure of the transforming the entry (input) to the exit (output) is
executed by the aid of some tasks and validations for those tasks.
There are some tasks to be executed in each phase in order to be able to step forward to the
next phase. Validation of the satisfactory fulfillment is also required before taking the next
action.
Having the GQM (Goal, Question, Metric) as another important underlying concept while
designing this measurement template, the goals of each phase is to be achieved through some
pre-defined tasks and validations (questions to be answered through related metrics).
The whole template, after a complete fulfillment would provide the organization with a
guideline to achieve the organizational objectives.
It is vital to mention that this template itself does not improve the processes. It only shows the
status of the chosen project/process after having the filled template executed. What this
template generates is to provide the stakeholders with necessary information and basis to
make informed decision afterwards in order to improve the chosen processes/projects.
This “Comprehensive Template” is available in appendix 1.

60
6.1.2 The Comprehensive Specification
One detailed specification is also provided as a complementary to the designed template in
order to assist the stakeholders while using the template.
The specification follows the order and structure as the comprehensive version equipped with
the necessary information needed for the stakeholders during the application procedure.
The ideal program (measurement program) would be the one that is self-instructive enough
which hardly needs any kind of specification during the application.
One cannot deny the fact that measurement programs might be complex and confusing.
Another issue is the “users’ lack of knowledge/experience” on how to apply the program (as it
might be newly designed or provided by external parties).
As having a concrete and accurate entry would play a crucial role while passing one phase
and moving to the next one, the necessary information on how to define the entry/input for
phase is included in the specification.
Having the exit/output from one phase acting as an entry/input for the next phase, through the
executed tasks and validation, this specification also directs the attention of the users towards
defining as concrete information as possible in order to minimize the risk for any
misunderstanding while taking actions within one phase as well as entering the next phase.
This comprehensive specification is available in the appendix 2.

61
6.2 Measurement Program in Use
The previous chapter outlined the measurement program in terms of design including
different steps and tasks. It has been tried in this chapter to illustrate different scenarios/areas
which the organization could implement the measurement program designed in the previous
chapter.
The main aim of this measurement program is to provide the organization with a deeper
insight into the processes so that it could better manage the achievement level of the pre-
defined goals for each measurement objective. The authors have tried to elaborate those
measurement areas in the figure below.
Fig.21 Implementation of Measurement Program
KPIs Measurement Process
Clear Communication
Basis for Decision Making
Project Management
Trend Creation
Estimation
Project Status
Process Improvement
Evaluation
Assessment
Improvement
Data Aggregation
Decision Making
Resource
Allocation
Dynamicity & Flexibility
Setting New Targets
Objectives Modification
Goals Redifinition
Measurement Program
Expansion

62
6.2.1 KPI Measurement Process
A successful measurement program should include a measurement of the KPIs and the level
of communication around those KPIs. The result from this measurement can be used by all
stakeholders across the organization as the KPIs directly influence the decision making in the
organization.
The designed measurement program in this dissertation can be used as a documented process
which most projects can take advantage of in order to communicate continuously in terms of
potential problems e.g. with quality, delivery, cost and feature, which are among the
fundamental measures addressed at Volvo 3P in order to track and thereafter improve the
products and processes. The discussion around the abovementioned measures are recognized
as the most common management objectives and issues in this organization. Therefore is has
been tried to design the measurement program in such a way that covers most aspects of the
most characteristics related to these measures such as the data collection procedure, the
review/revise mechanism, techniques for analyzing the collected data, etc. This measurement
program also contributes in creating a solid foundation in terms of collecting right data for the
addresses measures such as:
Quality issues which can be addressed through severity, priority, etc,
Delivery issues which can be addressed through the pre-determined schedule and
completion criteria,
Cost issues that can be addressed through man-hour and production cost,
Feature issues that can be addressed through functionality.
These four fundamental measures at Volvo 3P are used as a basis for the project management,
product description and the process improvement.
6.2.2 Project Management
This proposed measurement program is structured in such a repeatable way that provides the
managers with reliability so that they can manage and improve their project based on the
result of the four aforementioned basic measures along with the result form the corresponding
PIs’ (Performance indicators) measurement. The result from the measurement program helps
the project managers to create a database which in turn would establish a trend that would
help the organization recognize the capability of the currently used processes. The presented
result would also help the managers provide a realistic estimation for Quality, Delivery, Cost
and Features for the potential future projects operating upon the generated historical data.
Another important aspect is the fact the result of this program can be used as actual data
which in turn would compared against the planned data in order to evaluate the whereabouts
of the project performance (how much is done and how much is left to be done). This would
be a crucial basis for making decision concerning the resource allocation. It could even lead
to re-planning the whole project depending on the status-deviation and change in the pre-set
goals expected to be achieved by this project.

63
6.2.3 Process Improvement
Another common objective of managers is to improve the capability of the organization
(Humphrey 1989). In order to start a process improvement procedure the managers need to
perceive the measures used for their projects. The managers need to understand that the
measurement program is implemented in order to investigate and find out more about the root
causes of the obstacle and issues. Once these issues and problems are solved, the managers
can shift the focus on the process improvements and new targets to be reached through this
process improvement.
Not only the measurement program evaluates the current situation of the process, but it also
evaluates and assesses the progress of the taken improvement actions.
6.2.4 Data Aggregation
Having the measurement program implemented in the projects, managers would now have the
opportunity to aggregate data across all projects. The measurement program in this diploma
work is designed to assist the managers define objectives and thereafter identify
correspondent measures in order to make informed decision aligned with the organizational
business objectives. Data aggregation across the projects would provide managers with a
realistic trend that would increase the reliability of their prediction for the future actions to be
taken.
Reporting and communicating the result of the aggregated data is of crucial importance for
the managers as it would act as a platform for their decision-making process. Therefore one
strong documentation plan should be available in order to facilitate the communication of the
result and show what they precisely imply.
6.2.5 Dynamicity and flexibility
The organizations mature as its processes improve and become more stable. The existing
goals might be modified or even redefined as the new tools and technologies enter the
processes (new tools might require new measures to be defined). New goals and objectives
will be set, as new targets, as a result of the improvement activities.
This whole change/maturity in the organization would make the necessity of new insight into
the processes inevitable as the processes would also change accordingly. Moreover, new
groups might join the newly matured processes which make it a must-be to become a part of
the measurement program.
All scenarios above make it crucial for the managers to shift their focus and have a new
insight into the processes’ progress and make decision based on those new goals and
objectives.
The fig.21 elaborated on the measurement program usage in different occasions. However,
those occasions mostly do not come alone but they overlap and together create a situation
where all basic measures (Quality, Delivery, Cost and Features) along with specific PI’s
related to the project are included.

64
The usage expansion of the measurement program becomes obvious as the organization and
its processes mature. Therefore is becomes necessary for the stakeholders to gain a proper
insight into those dynamic measures, communication status and improvement activities.
6.3 Starting the measurement program
Some important aspects of designing the measurement program have so far been addressed.
The authors of this report has however, tried to design this program with substantial
consideration to the organizational aspects as well as the possible boundaries while making
effort on implementing this program in the system in the case of both new processes as well
as the existing ones aiming at improving their effectiveness. In any possible scenario, the
implementation phase shall be executed in a structured and well thought-out way.
This chapter would provide the readers with some guidelines as a means for measurement
program integration with the organization. The figure below shows some steps that are to be
taken while implementing the measurement program. These steps are based on a literature
study mostly from Grady (1987) and QSM (1992).
Fig.22 Implementation steps
Focal Group Allocation
Objectives Identification
Program Design
Testing the Program
Process Documentation
Program Implementation
Program Expansion
Time
Program Maturity

65
6.3.1 Focal Group Allocation
It is important that the organizations highly prioritize the resource allocation issue already in
the beginning of the process of the creation of the measurement program. Resources for the
measurement focal group shall be identified and allocated. This focal group can either be an
already existing group inside the company or it could be an external group/individuals of
specialists assigned to execute the program. This focal group should assess the commitment
as well as the involvement of the organization. Implementing the aforementioned steps
introduced before is another task of this focal group. This group also has the responsibility of
documenting the process and establishing an organizational database which includes the
successes made during this concept.
There might be a need for more resource expansion as the organization becomes more
familiar with the measurement program and recognizes the vitality of it.
6.3.2 Objective Identification
The first step in any process/program is to identify the objectives clearly. These objectives
shall be carefully subjected to testing and the managers should monitor the progress and the
performance of this program. The mentioned focal group, mentioned above, directly
cooperates with the management to turn those objectives into goals which are measurable in
order to be able to make necessary improvements.
One can claim that everybody is to be involved in the process of implementing the
measurement program. Those who are responsible for the decision-making must also have
full access to the collected and analyzed data in order to make informed decisions related to
the pre-defined objectives set by the organization. This manner of procedure would provide
the organization with a framework that can be reused in the future while being aligned with
the overall organizational goals.
6.3.3 Program Design
Data collection is often the first step taken in measurement processes. However, there might
be a risk that the collected data wouldn’t be used as a basis for decision making. This might
occur due to the fact that sometime the main aim of the measurement program is
misunderstood if not clarified correctly means that that amount of the collected data becomes
the focus instead of collecting and analyzing the related data which can provide that basis for
informed decision makings. Moreover the measurement program shall be designed in such a
way that recognizes the leverage capability of the organization while trying to utilize and
harmonize the already existing methods with the new measurement program.
6.3.3.1 Existing Capability Assessment
A successful Improvement measurement program is the one that totally understands and
recognizes the existing capability of the organization in terms of resource provision. It is
therefore important that the focal group put extra efforts of on understanding the existing
capabilities as well as the current measurement tools and methods for collecting data.
Accordingly, another important role of the focal group would be to understand how different
projects have used the existing measurement tools and data collection method as well as
investigating what the managers would want from the new measurement program.

66
6.3.3.2 Measurement Program Design
The measurement program shall be designed and thereafter documented. If the organization
does not pay enough attention to this matter, the program could hardly become adjusted to the
potential crisis which would lead to an unchanged performance.
The measurement program designed in this dissertation is grounded on the literature study
with focus on the Goal, Question, Metrics method (Basili 1984) in order to link the designed
program to this department’s business objectives. The program therefore includes PI
(Performance Indicator) identification which directly links the different projects to the
EEEG’s overall goals and thereafter improvements. The authors of this report have also tried
to create a measurement program that is built upon continuous feedback from the people
engaged with the process of data collection and data analysis.
6.3.4 Testing the program
Just like any other process/program, this designed measurement program should also be
tested. The best possible way would be to test the program on the current projects in order to
find out about improvement possibilities in advance to the implementation in the whole
organization.
Many of the focal group’s responsibilities have been introduced so far. Another role of this
group is to work with the current projects in order to help them understand the organizational
requirements and objectives that are to be measured through this measurement program.
They should also help the project managers to understand the actual project performance
considering the company’s goals and objectives.
6.3.5 Process Documentation
The result of the program testing should be communicated with the management, addressing
the advantages as well as the shortcomings. The management together with the focal group
should also go through the measurement objectives and goal to check whether they are to be
modified or not. Moreover, the management should monitor the level of the achievement of
the pre-defined measurement objectives.
The whole abovementioned actions should be documented as an important part of the
measurement program. The reason for the documentation is to gradually create a standard
process measurement system throughout the organization which can be used for several
processes and projects in the future. The documentation would also provide the organization
with list of clarified tasks as well as the responsibilities and roles of individuals being
involved in the whole procedure.

67
6.3.6 Program Implementation
Once the documentation procedure is fulfilled, the measurement program can be implemented
across the organization. One effective way to integrate the measurement program with the
system would be set up some workshops where all involved parties can learn, communicate
and discuss around the measurement program together. This would also help the project
managers to understand the need for the measurement while transferring knowledge in terms
of standards, organizational capabilities, policies and the existing measurement tools and
procedures.
6.3.7 Expanding the Measurement Program
Having the measurement program implemented, the management can now search for potential
opportunities to expand the measurement program into other parts of the organization. This
measurement program can act as an improvement tool in order to improve the project/process
performance across the whole organization if designed in a flexible manner that can be
adjusted and modified based on the specific needs of each process/project.
The GQM (Goal, Question, Metrics) plays an important role in helping the managers
recognize the need for measurement by introducing that needs in a question format (drawing
the attention of the managers to project/process status) followed by introducing the goals set
for each question which can be measured by the help of specific metrics aiming at measuring
those goals.
It is important that the involved groups in the measurement procedure publicize the result of
the investigation of the actual projects/processes in form of trends as well as the benefits
obtained from the measurement program. They should also develop measurement tools that
can help the project managers measure the projects and processes. These tools can then act as
standard procedures as the measurement program grows and becomes a part of the
organization.
So far one comprehensive version is developed. It is now time to discuss the designed
measurement template with the related stakeholders at Volvo 3P as well as the university
supervisors in order to take it to the next level. The result from this discussion will elaborated
in the following section.

68
7. Result Analysis and Discussion
The main reason for designing such a measurement tool was to cover most aspects of the
process performance in terms of “process status monitoring” which led to a very detailed and
accurate measurement program/template which finds its roots in the academic world and was
expected to operate perfectly in theory.
In spite of the appreciated logic of this measurement template, the implementation of this
suggested program was under question.
The reason why would be the fact that in the reality of the industrial world (Volvo 3P in this
case), time, clarity and simplicity play crucial roles especially for those with operational and
managerial responsibilities whose decisions are highly influential for the whole enterprise.
7.1 Feasibility
Among the feedbacks and impressions from the stakeholders, the following were outstanding
as major factors to be considered:
Briefness (in terms of time)
Concreteness
Understandable ( in terms of having a plain language)
Communicativeness
Applicability
7.2 Adjustment on Demand
After having the comprehensive template presented, the template was claimed to be time-
consuming and vast despite the fact that it, already from the very beginning, was demanded
by Volvo 3P to be a general program. After an investigation regarding this issue some
adjustment were considered to be necessary in order to make it more applicable for the
industry use.
7.2.1 “Identify” Phase Transformation
The word “Identify” is considered to be a very vast concept indicating innumerous amount
of information. The users of this template could not recognize a concrete/common
perception of this phase which could cause potential frictions. It is tend to put an emphatic
stress of the “Objective” identification in this phase, the word “identify” was therefore
decided to be transformed into “Objective” in order to highlight the importance of objective
identification.

69
7.2.2 “Define” Phase Transformation
In order to avoid the abovementioned mis-interpretation with the wording, another
transformation was made in terms of changing the word “Define” into “Measure” for the very
same reason as above.
The major requirement of the phase “Define” is to define those measures corresponding to the
objectives identified above. Therefore the word “Measure” was chosen to again highlight the
importance of this step.
7.2.3 SDRC (Storing, Documenting, Recording and Communicating)
Another substantial issue that aroused the attention of the stakeholders, while evaluating the
designed template was the repetition of the questions regarding the documentation procedure
in all phases. This was experienced as a repeated task.
Many times have the term “Trend” and “Trend Creation” been used in this dissertation upon
the preliminary requirements of the stakeholders in order to stabilizing the processes as well
as having the ability to forecast the process behaviors in the future to come.
This “trend Creation Procedure” is impossible without having consecutively and constantly
Storing, Documenting, Recording and Communicating the information.
In the importance of the steps mentioned above, it was decided to highlight this set of
operations that is to stand as the core of the 5-phase loop. This set of operations is a derivative
and subsidiary unit that operates on all five phases as shown in figure 23.
Fig.23 SDRC (Storing, Documenting, Recording and Communicating)

70
7.3 The Volvo Version Template
Based on the discussion and analysis in chapter 5 of this thesis work, the necessary changes
were entered and integrated into the design of this template and one practical version, “Volvo
version”, was then resulted from the transformation of the original comprehensive version as
shown in figure below.
Measurement Template
Project/ process: Date: Interviewee: Document number:
OBJECTIVES 1. Why is Measurement needed?
2. What are the project/process objectives?
3. What are the Measurement targets?
MEASURES 4. What are the measures (measurement methods, formula or Algorithms)?
COLLECTING DATA 5. What are the data collection methods?
ANALYSING 6. What are the analysing methods?
SDRC 7. What are the documentation procedures?
8. What are the storing data procedures and/or databases?
9. How should the documentation procedures be reviewed and revised?
10. How would the results be reported?
11. How would the report be communicated with relevant stakeholders?
EVALUATION 12. Is the measurement confirmed by the stakeholders?
13. How should the measurement process be improved?
Signature:
Fig.24 The Volvo Version Template

71
Just like the original comprehensive version, one further specification is developed for the
Volvo template version as well shown in figure 25.
As mentioned in chapter 6.1.2 (The Comprehensive Specification) measurement programs
might be experienced as complex and confusing due to the “users’ lack of
knowledge/experience” in how to apply the program.
Moreover, optimizing the result from the measurement program, the users need to be
“motivated” enough in order to deliver as high performance as possible. The higher the
performance is, the better result would be generated which in turn would lead to more
accurate data that would build a stable platform for the decisions to be made by the
stakeholders.
Having the two crucial factors mentioned above in mind, namely; “Users’ lack of
knowledge/experience and “Motivation” the authors decided to create a specification in such
a manner that covers both these two aspects by providing necessary information on how to fill
and validate each task as well as the motivation behind the need for executing and validating
each task.
However, those who use this template regularly might find the specification time-consuming
to go through and therefore would not use it any more.
Since the motivation for applying this program might fade away as the time goes by (due to
e.g. high work-load, repetition and lack of required resources, etc.), it is of benefit to have the
opportunity to return to the origins of the need for using the program which are embedded in
this specification.
Different department have different needs, objectives, goals and strategies. Accordingly, they
would have different motivations and measures to fulfill this measurement template. This
specification is however structured in a motivating-informing manner which makes in
applicable in different organizations, departments and sections with users with different
backgrounds and various knowledge levels.

72
Measurement specification
OBJECTIVES
1. Why Measurement is needed? The need for measurement could vary within a large range. It might be a need of providing a view on the organizational goal achievement, or it could be in detail. Such as providing a view on the changes occurred in a specific project performance due to changed demand or new system implementation. It is crucial to recognize all those stakeholders (audiences) that are going to use the measurement data with different perceptions and from different perspectives.
2. What are the project/process objectives? Having the measurement needs specified, provision of an insight into those organizational objectives that are going to address those needs become necessary. This should be done in order to ensure the fact that measurement system is aligned with the business objectives of the organization and would provide a stable platform for the decision making accordingly.
3. What are the Measurement targets? The measurement targets should be specified to monitor actual versus estimated issues in order to make decisions with respect to project plans, progress, and need for re-planning.
MEASURES
4. What are the measures (measurement methods, formula or Algorithms)? A clear set of measures shall be listed. These measures shall follow structured rules that state what is included and excluded in each measure.
COLLECTING DATA
5. What are the data collection methods? Choosing the relevant data collection method depends on the nature of the project/process. The data collection procedure is however to be tailored and adapted in order to suit the project/process being measured.
ANALYSING
6. What are the analysing methods? Those who are assigned to conduct the measurement program shall critically analyze the collected data and find those objectives that are for example lagging the plan in terms of cost, delivery, etc. Moreover they should find out about those issues that cause the slips on the analysis phase

73
SDRC
7. What are the documentation procedures? The techniques for documentation should be denoted in order to provide the organization with accessible realistic trend.
8. What are the storing data procedures and/or databases? Creating a database would facilitate the data-organizing procedure. It would also make it easier for the users to find the data in a more organized way. One major advantage would be the fact that as the amount of the stored data grows, one long-term trend of project performance can be created.
9. How will the procedures be reviewed and revised? In order to fulfil the steps in this phase, the organisation should validate the collected data and review them for adequacy. They should also review the whole procedure for accuracy; since there might be a need for updating/changing the report structure (in case it is not reflecting the issues or the report does not provide the audience with a clear insight into the measurement program as a whole).
10. How will the results be reported? Regular reports which provide the respective people the overview on the issues and the status of the projects/process is needed.
11. How will the report be communicated with relevant stakeholders? The reporting system shall be designed in such a way that provides the stakeholders and other related people with a strong communication system. As the stakeholders might be from different departments with different interests, it is crucial for the reporting system to be formatted according to those interests with a plane language that is understandable for all partiers.
EVALUATION
12. Is the draft measurement confirmed by the stakeholders? The draft measurement is reviewed by the stakeholder in order to be confirmed (potential changes are executed).It is necessary for the stakeholders to determine if adequate data is in hand to track the progress accordingly (whether the collected and analyzed data are to be used in their decision making procedure).
13. How the measurement process shall be improved? After having all the phases implemented and fulfilled, the final measurement report is to be confirmed by the stakeholders while feedbacks are obtained for the measurement program evolvement, issues and possible obstacles are addressed and identified.
Fig.25 The Volvo Version Specification

74
7.4 Test and Evolution of the Instrument
In order to verify the versatility of this template, it was decided to test the template beyond the
borders of the industrial thinking. As the academia and the industry world are recognized to
be two separate worlds, both trying to take process improvements to the next level and as they
sometimes have different approaches to improve the process performances, Chalmers
University of Technology was chosen as an example in order to find out if this template was
applicable in the academia world as well.
This example is available in the appendix 3, which is filled by one of the teachers at the
Chalmers University of Technology with the subject: “Course Development and Execution”.
“Course development and execution” was to be subjected to this measurement template in
order to receive feedback for improvement with the aim of creating learning opportunities for
master students.
After having this template filled out some discussions and reflections were raised:
Answers the questions and give a fair view both on the process status itself as well as
the systematic procedure that are to be executed for achieving the related goals of this
process.
Despite the fact that this final template was designed for Volvo, even named as
“Volvo version” using the Volvo language and terms, it became adapted and accepted
by the other organization (Chalmers University of Technology) with minor needs for
changes in terms of wording and ordering of the questions.
Some questions were not answered due to the ambiguity of some terms used in the
template. One of these questions is: Is the measurement confirmed by the
stakeholders? (Within the evaluation phase of the template). Different groups are
counted as the stakeholders of this process (teachers, university staff, alumni, current
student, next year students). Teachers and the university staff are recognized to be the
most eligible stakeholders that can affect the improvement; however, those other
stakeholders such as currents student have a substantial effect of the process
performance by providing the staff with the needed information for their future
informed decision-makings. The next-year students are also the stakeholders of this
process but they can not affect the improvement as they are not involved from the in
the early stages of this process. Therefore the decision of the choice of the eligibility
to confirm this measurement process was a discussion itself.
As mentioned in the previous point, the choice of the right stakeholders might be
difficult sometime depending on the nature of the process. Therefore the need for
having a concrete specification that can guide the users along the way become more
obvious here. The specification however, should leave some space for potential
changes accordingly.
No matter what the question is or in which part of the template it is located, briefness
and concreteness play crucial roles as the users might jump over some questions or
they might totally skip using the template.

75
The ideal design would be the design that can cover most aspects of the product (no matter if
the product is tangible, intangible or even a process). However in reality, hidden aspects and
failures are inevitable in the design phase. This example highlights the pros and cons that
cannot be predicted in the design phase.
One advantage of this measurement program is its flexibility and simplicity that makes it
possible to become tailor-made according to the organizational needs and users’ favour.
The discussion and reflections on the academia example are to be considered as adjustment
factors to be embedded in to the template for the ultimate result in that specific area.

76
8. Conclusion
The competitive atmosphere in the market puts higher and tougher demands on the
organizations to survive, therefore, organizations are, more than ever before, trying to equip
themselves with the latest and strongest well-proven concepts that can bring not only
competitive advantages but also stability, efficiency and effectiveness to the enterprise.
These methods would provide the organizations with a more stable platform based on which
one more “mature process” can be executed that would in turn lift the organizational
performances in different aspects. These methods also aim at providing the organization with
a systematic framework for “process improvements” from the early stage of conceptualization
to the final stages of full scale production.
Stability and maturity are among the most critical issues to be encountered by the managers
across the organizations. Volvo 3P is not an exception in that case. Despite the world-wide
reputation of the Volvo brand (bringing world-class products to the market); some beneficial
areas of interests should be considered in terms of increased collaboration with process
management, business mission and strategy.
This improvement opportunity is noticed by the managers at Volvo 3P which has resulted into
a high priority “need” classification. By more observations and investigation on the root
cause of this opportunity, the most appropriate method for process improvement is recognized
to be CMMI. This method is likely to fulfill most aspects of the abovementioned factors such
as stability and maturity.
One of the most important process areas to be considered in this method is the “Measurement
and Analysis” process area, as it would help the managers to comprehend the “Current
Process Status” as the basis for the process improvement steps to be taken in the future.
The challenge here is to find those “Performance Indicators” that best monitors and address
the “Current Process Status”. These PIs (Performance Indicators) are to be set and specified in
such a manner that can meet the requirements of different stakeholders as well as creating a
foundation for the further process improvement steps as a part of the CMMI method.
In order to accomplish the task, a measurement program was to be designed by the
contribution of some well-known process improvement tools as elaborated in the theoretical
frame of references which at end resulted into a design of a measurement template.
The users of this template must know exactly why they are using it and what results they are
expecting to achieve. One of the most important reasons for using this template is to find out
about the process status and thereafter come up with a framework on how to improve the
process performance.
Each framework/guideline should follow a rational path in order to generate the best result as
possible. This framework however is to be adapted to the organizational terms, language,
objectives, business model and etc.
On the other hand, measurement programs are mostly expensive and time consuming.
Therefore, great effort has been made in order to create and design a template that not only
embed the Volvo 3P GEEE terms and language but is also adaptable and usable in other parts
of the organization.

77
As to conclude, the authors would like to direct the attention of the readers towards the variety
within the frame of mind of the individuals being the target of this template (while filling the
template).
Individuals might have very different ways to handle this template depending on their status
of mind, output expectations, position against the process and responsibilities towards the
process. Therefore it is of vital importance for the organizations to clearly set their goals and
objectives in order to avoid possible deviation while implementing the measurement template
across the organization.
8.1 Final Reflection
Besides the result achieved from the designed template and its applications, the authors have
some reflections on this procedure as a whole considering the work atmosphere, company’s
attitude towards this new concept penetrating the system as well as the existing culture across
the organization as follows:
Operational activities in terms of projects and processes are started after meeting some
requirements where improvement actions are taken along as the process is already
being implemented. This procedure might increase the risk for sub-optimization due to
the lack of one coherent enterprise strategy for process improvement and
measurement.
Some indications on conservativeness are obvious in the system as the new concepts
and methods are not recognized as favourable aids for facilitating the working
procedures.
Abbreviations are highly appreciated across the organization (due to the lack of time
and patience to go through the whole matter in details)
The importance of informal meetings is not to be forgotten as some very useful
information is obtained during e.g. coffee breaks, launch meetings, etc.
Despite the fact that the company is provided with one simplified template (The Volvo
version), workshops are to be considered in order to spread the rational thinking
behind the template as well as expanding the usage of it across the whole organization.
One major challenge for the authors was to create a balance between the academia and
the industry in order to bridge the theories to the industry in a functional manner
approved by the university and applicable for the industry.
Some important theories such as PDCA, ETVX and GQM combined with a set of
methodologies such as literature study, meeting and interview have been used in this thesis
work.
The literature study gave the authors a general view on the implementation of the CMMI in
different companies as well as measurement programs but the problem is the fact that most of

78
these measurement programs were designed for software process improvements being
complex and computer-based. Volvo 3P on the other hand demanded a simpler version,
having the ability to be used for different processes (not only software processes).
Interviews and meetings are considered to be of great help by revealing the organizational
objectives as they facilitated the access to the unwritten data about the stakeholders needs for
process measurement.
The combination of the methodology (literature study, meetings and interviews) with the
theories (PDCA, GQM, ETVX) lead to one adapted measurement program that both meets the
CMMI requirements as well as the stakeholders’ information needs while following the
rationale of the theories introduced in this master’s thesis.

79
9. Recommendation
As mentioned on the conclusion chapter, the risk for non-aligned results stays while using this
template due to the lack of knowledge in:
Why using this template;
What to consider while using/filling this template;
How to use/fill this template.
Therefore, it is strongly recommended for the management to arrange workshops and
interactive meetings in order to train the related people/stakeholders, despite the fact that the
personnel are provided with one detailed specification for the sake of self-training.
Another recommendation would be to consider one PI (Performance Indicator) at a time while
applying the template in order to keep the staff focused on the main subject so that a concrete
result would be generated.
10. Further Studies
After having this template accomplished, it might be time to make it a part of the
organizational culture.
Communication plays a crucial role while working with processes. Any method that would
facilitate this communication between the individuals as well as data with individuals is to be
highly appreciated to be set as a part of the organizational culture.
Visual communicators, such as the A3 method, could be one effective method to carry on this
measurement program to the next step as it would make the knowledge more understandable,
robust and visual.

80
References
Books & Articles:
Andersson, H. Vetenskapteori och Metodlär.a Lund: Studentlitteratur, 1994.
Basili,Victor R.; Weiss, David M. A Methodology for Collecting Valid Software
Engineering Data. IEEE Transactions on software Engineering Vol. SE-10, No.6 (November
1984), pp.728-738.
Basili, Victor R.; Rombach, H. Dieter. TAME: Integrating Measurement Into
Software Environments. College Park, MD:Dept. of Computer Science, University of
Maryland, 1987.
Bell, J. Introduktion till Forskningsmetodik. Lund: Studentlitteratur. 1995.
Bengtsson, H. & Bengtsson, B-A Forskningsboken- Om konsten att arbeta på ett
undersökande och kunskapande sätt. Uppsala: Almqvist & Wiksell Förlag AB, 1995.
Chrissis, M.B. & Konrad, M. & Shrum, S. CMMI Guidelines for Process Integration and
Product Improvement -2nd
ed. Boston MA, Pearson Education, Inc., 2007.
Dahström, K. Från Data Insamling till Rapport- Att göra en statistik undersökning. Lund:
Studentlitteratur, 1996.
Deming,W.Edwards. Out of the Crisis.Cambridge, MA: MIT Center for Advanced
Engineering, 1986.
Florac, William A. Software Quality Measurement: An Architecture for Counting Problems
and Defects, Software Engineering Institute, Carnrgie Mellon University, September
1992.
Goethert, Wolfhart B.; Bailey, Elizabeth K.; Busby, Mary B. Software Effort Measurement:
An Artichecture for counting Staff-Hours and Reporting Schedule information. Software
Engineering Institute, Carnrgie Mellon University, September 1992.
Grady, Robert B.; Caswell, Deborah L. Software Metrics: Establishing a company wide
program. Englewood Cliffs, NJ: Prentice-Hall,1987.

81
Holm & Solvang . Forskningsmetodik – Om kvalitativa och kvantitativa metoder. 1991.
Hope, Jeremy and Fraser, Robin. Beyond Budgeting: How Managers Can Break Free from
the Annual Performance Trap. Boston: Harvard Business School Press, 2003.
Humphrey, Watts S. Managing the Software Process. Reading, MA: Addison-Wesley, 1989.
Johansson-Lindfors, M.B Att Utveckla Kkunskap. Lund: Studentlitteratur, 1993.
Kaplan, Robert S. and Norton, David P. The Balanced Scorecard: Translating Strategy into
Action. Boston: Harvard Business School Press, 1996.
Kaplan Robert S. and Norton David P. Strategy Maps: Converting Intangible Assets into
Tangible Outcomes. Boston: Harvard Business School Press, 2004.
Kennedy Michael, Harmon Kent, Minnock Ed. Ready, Set, Dominate: Implement Toyota’s
Set-Based Learning for Developing Proiducts and Nobody Can Catch You. Virginia: The
Oaklea Press, 2008.
Lekvall & Walbin. Information för Marknadsföringsbeslut. Göteborg: IHM Förlag AB,1993.
Linda Westfall, 12 Steps to Useful Software Metrics. The Westfall Team, 2005.
McAndrews, D.R. Establishing a Software Measurement Process. Pittsburgh, Pennsylvania:
Software Engineering Institute, Carnegie Mellon University, july 1993.
Morgan James M., Liker Jeffery K. The Toyota Product Development System: Integrating
People, Process, and Technology. NY: Productivity Press, 2006.
Park, Robert E. Software Size Measurement: An Architecture for counting Source
Statements. Pittsburgh, PA: Software Engineering Institute, Carnegie Mellon University,
September 1992.
Parmenter, David. Key Performance Indicators: Developing, and Using Winning KPIs,
Hoboken, N.J: J.Wiley, C 2007.
Patel, R. & Davidsson, B. Forskningsmetodikens Grunder. Lund: Studentlitteratur, 1994.
Paulk, Mark C.; Weber , Charles V.; Garcia, Suzanne M.; Chrissis, Mary Beth; Bush,
Marilyn. Key Practices of the Capability Maturity Model, Version 1.1. Pittsburgh, PA:
Software Engineering Institute, Carnegie Mellon University, September 1992.

82
Shewhart, Walter A. Economic Control of Quality of Manufactured Product. New York:
Van Nostrand, 1931.
Shewhart, Walter A. Statistical Method From the viewpoint of Quality Control, “2d ed. New
Yourk, NY: Dover Publications,Inc.,1986.
Ulrich, K. & Eppinger, S. Product Design and Development. New York: Mc Graw-Hill,
1995.
Electronic References
http://ivs.cs.uni-magdeburg.de/sw-eng/us/java/GQM/link4.shtml
http://management.about.com/cs/generalmanagement/a/keyperfindic.htm
http://www.visitask.com/key-performance-indicators.asp
http://www.informationbuilders.com/kpi-key-performance-indicators.html
http://www.visitask.com/PDCA-cycle.asp
http://organicdesign.co.nz/ETVX
http://books.google.se/books?id=-
Tf2y2NsPgAC&pg=PA29&lpg=PA29&dq=etvx+process&source=bl&ots=DU1c9UxeNJ&si
g=mD3up3AT_-
V2abHWOkH2ldM9YV4&hl=en&ei=lyUxSrzrN5mu_AbXp8DYBQ&sa=X&oi=book_result
&ct=result&resnum=9#PPA31,M1
http://www.tarrani.net/mike/ETVXSummary.pdf (1996-2002 Mike Tarrani)
Volvo 3P’s internal resources

83
Appendices
Appendix 1: Comprehensive Measurement Template
Name :
Date:
Measurement Template
Phase 1: Identify
Entry:
Task 1. Measurement need: Validation 1.
Task 2. Organizational objective(s):
Validation 2.
Task 3. Methods:
Validation 3.
Task 4. Measurement issues: (Actual versus estimated)
Validation 4.
Task 5. Measurement goal:
Validation 5.
Task 6. Questions:
Validation 6.
Task 7. Things to be measured:
Validation 7.
Exit:

84
Name:
Date:
Measurement Template
Phase 2: Define
Entry:
.
Task 1. Measures: Validation 1.
Task 2. Counting Procedures:
Validation 2
Task 3. Recording:
Validation 3.
Task 4. Storing:
Validation 4.
Task 5. Analyzing: Validation 5.
Task 6. Reporting:
Validation 6.
Task 7. Feedback:
Validation 7.
Exit:

85
Name :
Date:
Measurement Template
Phase 3: Collect
Entry:
Task 1. Collect data: Validation 1.
Task 2. Record data:
Validation 2.
Task 3. Store data:
Validation 3.
Task 4. Review and revise procedures:
Validation 4.
Exit:

86
Name:
Date:
Measurement Template
Phase 4: Analyze
Entry:
Task 1. Analyze data: Validation 1.
Task 2. Prepare report:
Validation 2. Task 3. Present report :
Validation 3. Task 4. Review and revise procedures:
Validation 4.
Exit:
Name :
Date:
Measurement Template
Phase 5: Evolve
Entry:
Task 1. Evaluate insight into progress: Validation 1.
Task 2. Evaluate measurement process:
Validation 2. Exit:

87
Appendix 2: The Comprehensive Specification
Specification
Phase 1: Identify
Entry:
The stakeholder(s) need to have an insight into the project processes in
order to make informed decisions to achieve the organizational
objectives. The measurement needs are totally depending on the nature of
the project.
Task 1. Measurement need: Validation 1. Project managers need to have insight into project progress.
Task 2. Organizational objective(s):
Validation 2. Objectives are aligned with the GDP.
Task 3. Methods:
Validation 3. Methods for achieving the objective.
Task 4. Measurement issues: (Actual versus estimated)
Validation 4. Recognizing the issues that should be managed, controlled, or observed.
Task 5. Measurement goal:
Validation 5. To monitor actual versus estimated issues in order to make decisions with respect to project
plans, progress, and need for re-planning.
Task 6. Questions:
Validation 6. Identify a list of questions for each goal that, when answered, will determine if the goal is
being achieved.
What was the planned QDCF of the project?
How much have we done?
How much is left to do?
When will it be complete?
Task 7. Things to be measured:
Validation 7. For each question, establish a set of things to be measured which could verify the answers to
the questions.
Exit: A set of objectives to be measured which generate an overall view on the processes for
informed decision-makings. These measures shall be confirmed in order for the process
continues with the Define Procedures Activity (Phase 2).

88
Specification
Phase 2: Define
Entry:
Those approved objectives from phase 1 are to be used as inputs for phase
2 which leads to informed decision-making.
Task 1. Measures: Validation 1. A clear set of measures shall be listed. These measures shall follow systematic rules that
state what might be included and excluded in each measure.
Task 2. Counting Procedures:
Validation 2. Measures data collection documentation in a clear and repeatable manner.
Task 3. Recording:
Validation 3. Standardizing the templates and reporting procedure.
Task 4. Storing:
Validation 4. Database creation in order to investigate the trend in long term strategies. Task 5. Analyzing: Validation 5. Define analysis methods and show how the measures can answer the goal related questions. Task 6. Reporting:
Validation 6. Tables, charts, and graphs adequately summarize progress towards goals.
Task 7. Feedback:
Validation 7. Method improvement. Exit: A primary measurement program is stabilized and approved.

89
Specification
Phase 3: Collect
Entry:
An approved measurement program from phase 2.
Task 1. Collect data: Validation 1. Choosing the relevant data collection method depending on the nature of the project/process.
Task 2. Record data:
Validation 2. Documentation procedure.
Task 3. Store data:
Validation 3. Corresponding data are specified, verified and stored.
Task 4. Review and revise procedures:
Validation 4. Discussion based on the appropriate chosen collection procedures.
Exit: Those approved data which are related to the chosen project/process is now complete and
ready to be uses as an input to the next phase.

90
Specification
Phase 4: Analyze
Entry: Approved data from phase 3.
Task 1. Analyze data: Validation 1. Discussion with related stakeholders and feedbacks. Task 2. Prepare report:
Validation 2. Regular reports which provide the respective people the overview on the issues and the
status of the projects/process.
Task 3. Present report :
Validation 3. Reports are being communicated and approved by the related stakeholders. Task 4. Review and revise procedures:
Validation 4. The chosen analysis method is being reviewed and potential changes are discussed.
Exit: The result of what has been done so far is communicated with relative stakeholders which
acts as an entry to the last phase.

91
Specification
Phase 5: Evolve
Entry:
Communicated draft measurement activities which is reviewed and
revised.
Task 1. Evaluate insight into progress: Validation 1. The draft measurement is reviewed by the stakeholder in order to be confirmed (potential
changes are executed).
Task 2. Evaluate measurement process:
Validation 2. Issues and possible obstacles are addressed and identified. Exit: Final results are reported, communicated and reviewed. Feedbacks have also been taken
under consideration. The final measurement program is approved by all stake holders in
terms of scope identification (objectives, issues and measures), procedure definition.

92
Appendix 3: Example
Measurement Template
Project/ process: Course development and Execution Date: 2009.05.21 Interviewee: Chalmers Teacher Document number:
OBJECTIVES 1. Why Measurement is needed? In order to get feedback for improvement.
2. What are the project/process objectives? Creating learning opportunities for master students
3. What are the Measurement targets? Learning for action-in practice
MEASURES 4. What are the measures (measurement methods, formula or Algorithms)? Number of students, grade distribution on different activities, demonstrate abilities to use tools
COLLECTING DATA 5. What are the data collection methods? Internet, final exam ,interactive exam term paper, seminar participation, interview, group meeting, class discussion, alumni interview
ANALYSING 6. What are the analysing methods? Quantitative descriptive statistics complied, qualitative group discussion, Exam results, team paper results, interactive exam results
SDRC 7. What are the documentation procedures? descriptive statistics, Minutes from group meeting and final report
8. What are the storing data procedures and/or databases? In teachers files to plan for the next course
9. How the documentation procedures should be reviewed and revised?
10. How the results would be reported? Group discussion, final reports on homepage or in file, in division meeting and master program meeting
11. How the report would be communicated with relevant stakeholders? To next year students at the course start
EVALUATION 12. Is the measurement confirmed by the stakeholders?
13. How the measurement process shall be improved? Always include alumni
Signature:
Chalmers Teacher

93
Appendix 4: CMMI Process Areas