Embed Size (px)
Citation preview
INDUSTRIAL SOLUTIONS 701
INTERNATIONAL DESIGN CONFERENCE - DESIGN 2002 Dubrovnik, May 14 - 17, 2002.
DESIGNING 2D AND 3D TEXTILES USING YARN ENGINEERING AND VR
Zoran Stjepanovic and Anton Jezernik
Keywords: Yarn Engineering, 2D and 3D Textiles, Machine Learning, Virtual Reality
1. Introduction Virtual reality presents a promising technology that can be treated as a potential enrichment of conventional computer aided technologies. The contribution gives an overview of the application of yarn engineering and virtual reality for designing linear and flat textile structures, as well as clothing products. Modern textile and garment manufacturers will be soon able to use the entire range of conventional CAD/CAM systems together with virtual reality and Internet-based technologies in order to strengthen their position on the market building a completely new electronic-business offer. Numerous researches from theory and technology of spinning have shown how we can influence the mechanical properties and regularity of a yarn as well as significantly reduce the number of yarn faults using the appropriate raw material and suitable mixing proportion. In the first part of this contribution the influence of quality characteristics of cotton fibres and constructional parameters of a yarn on the most important properties of cotton yarn are presented. The achieved results have been used for determination of optimised cotton fibre blends regarding the quality of price of a cotton yarn. The second part of a paper discusses the possibilities to use the results of yarn engineering for setting-up the complex system for virtual fabric and garment development, which, together with the intelligent textile and garment manufacture, can be treated as the most important parts of the Global Retailing Concept.
2. Engineered yarn production A complex procedure of cotton fibre blend determination significantly depends on suitable models for prediction of properties of resulting cotton yarns, in-depth knowledge of characteristics of cotton fibres and consideration of parameters of a production process [Steadman 1997]. The regression prediction model has been designed using one of artificial intelligence methods: the machine learning from examples. The obtained regression trees served as a basis for realisation of a model for optimisation of cotton fibre blends regarding the quality and price of resulted yarn. Special linear programming techniques, supplemented by specific spinning technology constraints have been used for this purpose [Stjepanovic 1997]. An entirely new method of analytic evaluation and graphical representation of a so-called Yarn “Total Quality Index – TQI” has been developed in order to enable the comparison between the predicted and measured properties of investigated properties of cotton yarns [Stjepanovic 2000]. The graphical representation has a form of a control diagram and because of its clearness provides a potential for a referential document of a modern spinning mill. Furthermore, it can be successfully used for establishing the indubitable dialogue between a spinning mill and its customers.
702 INDUSTRIAL SOLUTIONS
2.1 Fibres and yarns data sets The system for automatic induction of regression trees RETIS [Karalic 1997] was used for the construction of several regression trees with different pruning degrees. Regression trees are similar to classification trees, with the difference that while classification trees are used to classify objects into discrete classes, regression trees are used when the class is continuous. The attributes - fibre quality characteristics – were used to predict the most important yarn properties for the weaving process. By learning regression trees these properties of cotton yarn were determined as a function of fibre properties. We can present the constructed regression trees in a textual or in graphical form. The graphical representation is preferred because of its logical and simple interpretation. To determine one of the properties of a new cotton mix, we simply follow the values of attributes in the appropriate tree and read the value in a leaf. A part of a learning example set - cotton fibre and yarn characteristics - is presented in Table 1.
Table 1. The learning examples set No. TP TEXM TWIST CROSS Y-STR F-STR MAT FIN M-L C-L %U10 W%U10 %AML T-C S-C 1 1 30.78 720.00 160.00 13.30 42.24 81.39 4.91 16.71 29.90 33.58 11.00 47.98 3.38 0.25 2 1 29.70 670.00 160.00 15.05 42.24 83.87 4.90 14.46 28.59 44.65 16.00 45.91 5.23 0.25 3 1 29.50 697.00 160.00 13.59 43.38 80.00 4.83 16.22 29.30 36.45 12.25 45.59 5.80 0.13 …
326 3 29.80 837.00 194.00 11.70 42.46 81.24 3.99 14.64 32.19 29.46 9.83 53.33 3.56 0.00
The basic partition of regression trees into subtrees, was made taking into account the main technological and constructional parameters: type of technological process of spinning, linear density of a yarn, and yarn twist. Properties of cotton fibres, used as components of cotton mixtures, were included into a separate file. A particular file was created also for properties of cotton mixtures, from which the yarns, included in learning examples, were produced. A part of mixture composition for yarns, included in learning examples, is given in Table 2.
Table 2. Cotton mixture composition LE Cons.No. % FT1 % FT2 % FT3 % FT4 % FT5 % FT6 % FT7 % FT8 % FT9 % FT10 Σ %
1-10 12.00 38.00 29.00 14.00 7 100
11-33 13.00 41.00 25.00 15.00 6 100
34-48 28.00 19.00 31.00 14.00 4.00 3.00 1 100
…
313-326 50.00 45.00 5 100
Remark: LE Cons.No means: Learning Example Consecutive Number from Table 1.
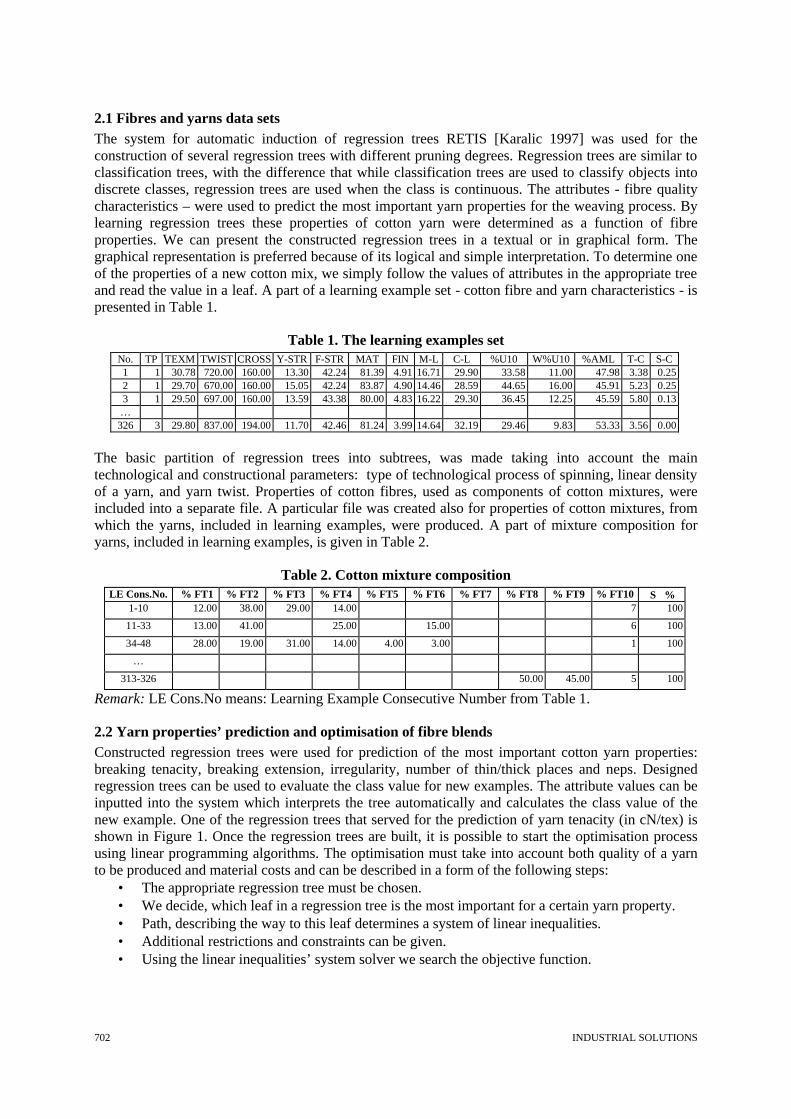
2.2 Yarn properties’ prediction and optimisation of fibre blends Constructed regression trees were used for prediction of the most important cotton yarn properties: breaking tenacity, breaking extension, irregularity, number of thin/thick places and neps. Designed regression trees can be used to evaluate the class value for new examples. The attribute values can be inputted into the system which interprets the tree automatically and calculates the class value of the new example. One of the regression trees that served for the prediction of yarn tenacity (in cN/tex) is shown in Figure 1. Once the regression trees are built, it is possible to start the optimisation process using linear programming algorithms. The optimisation must take into account both quality of a yarn to be produced and material costs and can be described in a form of the following steps:
• The appropriate regression tree must be chosen. • We decide, which leaf in a regression tree is the most important for a certain yarn property. • Path, describing the way to this leaf determines a system of linear inequalities. • Additional restrictions and constraints can be given. • Using the linear inequalities’ system solver we search the objective function.
INDUSTRIAL SOLUTIONS 703
Figure 1. Regression tree for prediction of yarn tenacity
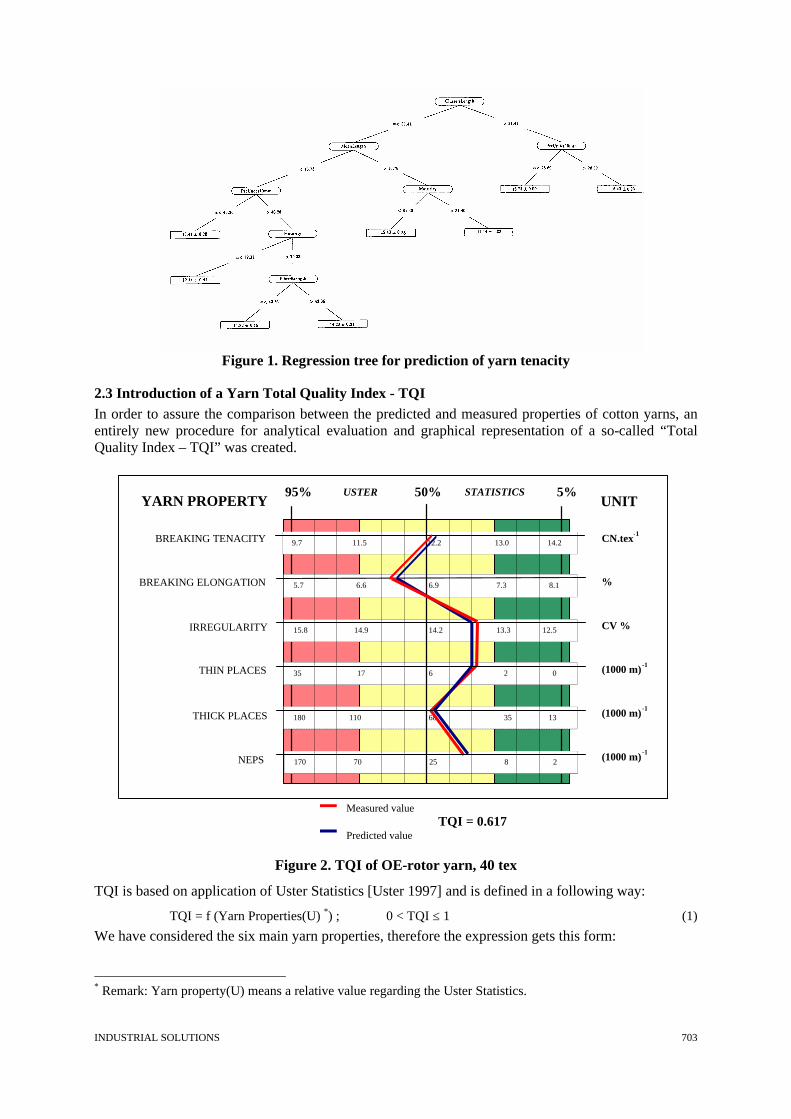
2.3 Introduction of a Yarn Total Quality Index - TQI In order to assure the comparison between the predicted and measured properties of cotton yarns, an entirely new procedure for analytical evaluation and graphical representation of a so-called “Total Quality Index – TQI” was created.
Figure 2. TQI of OE-rotor yarn, 40 tex
TQI is based on application of Uster Statistics [Uster 1997] and is defined in a following way:
TQI = f (Yarn Properties(U) *) ; 0 < TQI ≤ 1 (1)
We have considered the six main yarn properties, therefore the expression gets this form:
* Remark: Yarn property(U) means a relative value regarding the Uster Statistics.
BREAKING TENACITY
BREAKING ELONGATION IRREGULARITY THIN PLACES
THICK PLACES
NEPS
95% USTER 50% STATISTICS 5%
9.7 11.5 12.2 13.0 14.2 CN.tex - 1 % CV % (1000 m) - 1 (1000 m) - 1 (1000 m) - 1
5.7 6.6 6.9 7.3 8.1
15.8 14.9 14.2 13.3 12.5
35 17 6 2 0
180 110 68 35 13
170 70 25 8 2
Measured value TQI = 0.617
Predicted value
UNIT YARN PROPERTY
704 INDUSTRIAL SOLUTIONS
TQI = (Ytenacity(U)+Yelongation(U)+Yirregularity(U)+Ythick pl.(U)+ + Ythin pl.(U)+ Yno. of neps(U))/6 (2)
The higher TQI, the higher is estimated yarn quality. Above all the graphical representation of TQI enables a clear and quick insight into yarn quality regarding the most important yarn properties and can therefore also be used as a control/referential document of a modern spinning mill. Figure 2 presents the TQI for OE-rotor yarn having the linear density of 40 tex.
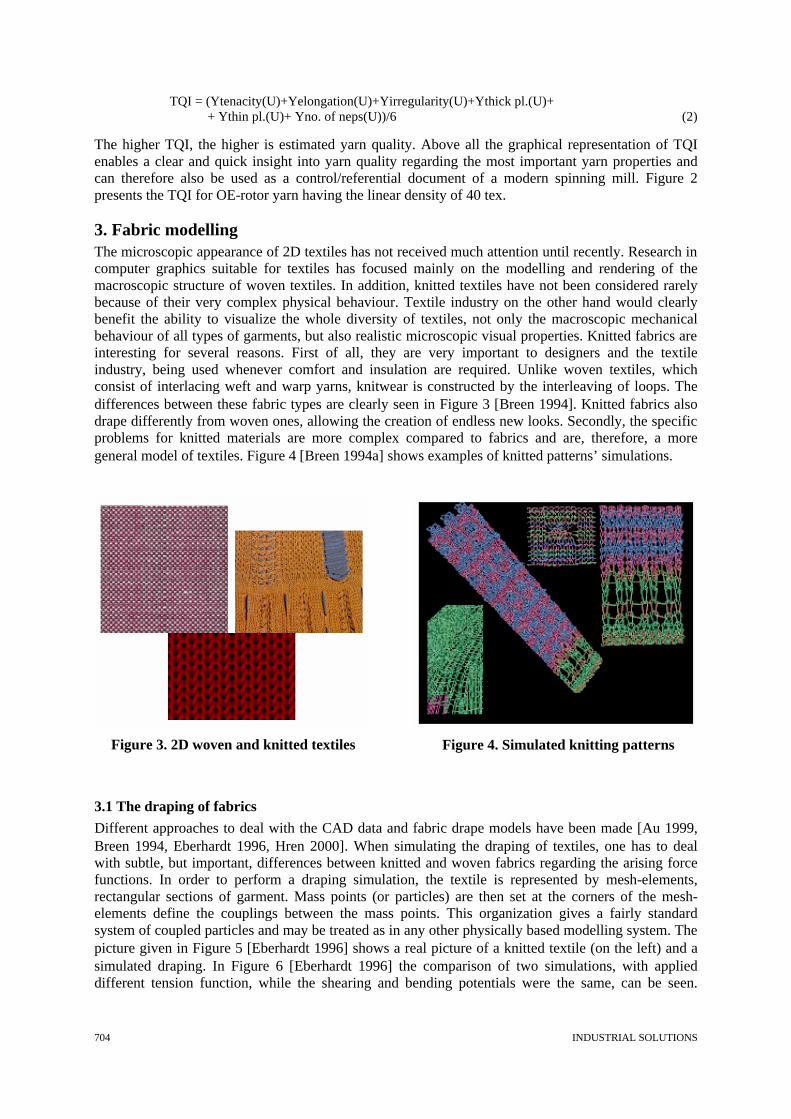
3. Fabric modelling The microscopic appearance of 2D textiles has not received much attention until recently. Research in computer graphics suitable for textiles has focused mainly on the modelling and rendering of the macroscopic structure of woven textiles. In addition, knitted textiles have not been considered rarely because of their very complex physical behaviour. Textile industry on the other hand would clearly benefit the ability to visualize the whole diversity of textiles, not only the macroscopic mechanical behaviour of all types of garments, but also realistic microscopic visual properties. Knitted fabrics are interesting for several reasons. First of all, they are very important to designers and the textile industry, being used whenever comfort and insulation are required. Unlike woven textiles, which consist of interlacing weft and warp yarns, knitwear is constructed by the interleaving of loops. The differences between these fabric types are clearly seen in Figure 3 [Breen 1994]. Knitted fabrics also drape differently from woven ones, allowing the creation of endless new looks. Secondly, the specific problems for knitted materials are more complex compared to fabrics and are, therefore, a more general model of textiles. Figure 4 [Breen 1994a] shows examples of knitted patterns’ simulations.
Figure 3. 2D woven and knitted textiles Figure 4. Simulated knitting patterns
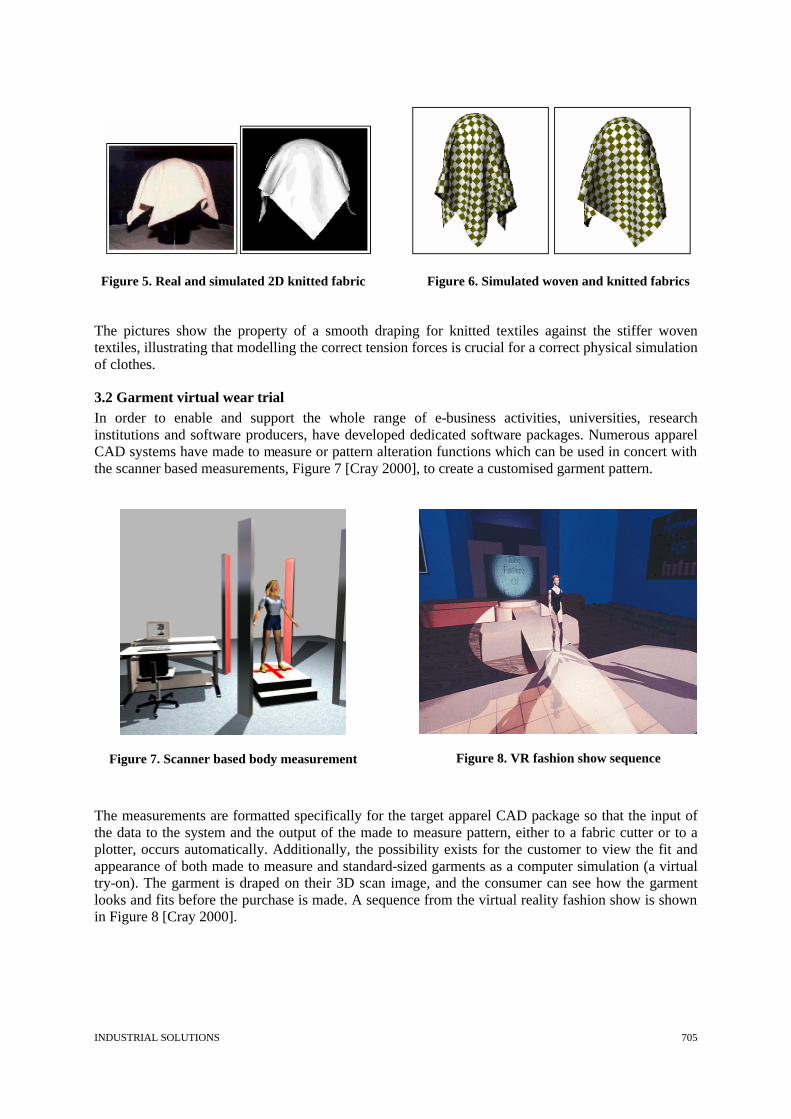
3.1 The draping of fabrics Different approaches to deal with the CAD data and fabric drape models have been made [Au 1999, Breen 1994, Eberhardt 1996, Hren 2000]. When simulating the draping of textiles, one has to deal with subtle, but important, differences between knitted and woven fabrics regarding the arising force functions. In order to perform a draping simulation, the textile is represented by mesh-elements, rectangular sections of garment. Mass points (or particles) are then set at the corners of the mesh-elements define the couplings between the mass points. This organization gives a fairly standard system of coupled particles and may be treated as in any other physically based modelling system. The picture given in Figure 5 [Eberhardt 1996] shows a real picture of a knitted textile (on the left) and a simulated draping. In Figure 6 [Eberhardt 1996] the comparison of two simulations, with applied different tension function, while the shearing and bending potentials were the same, can be seen.
INDUSTRIAL SOLUTIONS 705
Figure 5. Real and simulated 2D knitted fabric
Figure 6. Simulated woven and knitted fabrics The pictures show the property of a smooth draping for knitted textiles against the stiffer woven textiles, illustrating that modelling the correct tension forces is crucial for a correct physical simulation of clothes.
3.2 Garment virtual wear trial In order to enable and support the whole range of e-business activities, universities, research institutions and software producers, have developed dedicated software packages. Numerous apparel CAD systems have made to measure or pattern alteration functions which can be used in concert with the scanner based measurements, Figure 7 [Cray 2000], to create a customised garment pattern.
Figure 7. Scanner based body measurement
Figure 8. VR fashion show sequence
The measurements are formatted specifically for the target apparel CAD package so that the input of the data to the system and the output of the made to measure pattern, either to a fabric cutter or to a plotter, occurs automatically. Additionally, the possibility exists for the customer to view the fit and appearance of both made to measure and standard-sized garments as a computer simulation (a virtual try-on). The garment is draped on their 3D scan image, and the consumer can see how the garment looks and fits before the purchase is made. A sequence from the virtual reality fashion show is shown in Figure 8 [Cray 2000].
706 INDUSTRIAL SOLUTIONS
4. Conclusions A complex procedure of 2D and 3D textiles engineering and design significantly depends on suitable models and consideration of many influential parameters. In the first part of this contribution a model of cotton yarn engineering, which main components are regression model for prediction of properties of cotton ring and rotor yarns, and model for optimisation of cotton fibre blends was presented. The regression prediction model has been designed using one of artificial intelligence methods: the machine learning from examples. The obtained regression trees served as a basis for realisation of a model for optimisation of cotton fibre blends regarding the quality and price of a resulted yarn. A new method of analytical evaluation and graphical representation of a so-called Yarn “Total Quality Index – TQI” was introduced that enables the comparison between the predicted and measured properties of investigated properties of cotton yarns. The graphical representation has a form of a control diagram and because of its clearness provides a potential for a referential document of a modern spinning mill. A wide range of new technologies, above all virtual reality and feature based design, together with a new generation of computer based systems, provide the garment manufacturing companies with the ability to react extremely fast to the customer demands offering a quality and future-oriented services. This enables greater commercial presence and contributes to company’s better marketing position. The aim of the second part of this contribution was to give an overview of the recent researches regarding the modelling of virtual 2D and 3D textiles in order to fulfil the requirements for virtualisation of products in textile and clothing engineering. The universities, research institutions and software producers apply nowadays the new technologies to create the advanced computer solutions that will in the future support the whole cycle starting from the virtual design of fabric and garments through automated production up to virtual merchandising.
References Steadman, R.G., “Cotton Testing”, Textile Progress, Vol. 27, No. 1, The Textile Institute, Manchester, 1997. Stjepanovic, Z., “Development of an Integrated System Environment for Cotton Yarn Engineering”, Proceedings of the 3rd International Conference on Design to Manufacture in Modern Industry, Portorož, Slovenia, 1997, University in Maribor, Faculty of Mechanical Engineering, 1997, pp 479-486. Karalic A. “Retis - A Knowledge Acquisition system”, IJS Ljubljana, 1997. Stjepanovic, Z. “Determination of Cotton Fibre Blends Using Artificial Intelligence Methods”, Doctoral Dissertation, University of Maribor, 2000. “Uster Statistics 1997”, Uster News Bulletin No. 40, Zellweger Uster Customer Information Service, 1997. Hren, G., Jezernik, A., Lukšic, S., “Experiences of CAD Implementation and Trends in Development at ADRIA Mobil Ltd.”, Journal of Mechanical Engineering, Vol. 46, No. 11/12, pp 770-779. Au, C.K., Yuen, M.M.F., “Feature-based reverse engineering of mannequin for garment design”, Computer-Aided Design, Vol. 31, No. 1, 1999, pp. 751-759. Breen, D.E., House, D.H., Wozny, M.J., “Predicting the drape of woven cloth using interacting particles”, Proceedings of SIGGRAPH '94, Orlando, Florida. Computer Graphics Proceedings, Annual Conference Series, ACM Press, 1994, pp. 365-372. Breen, D.E., House, D.H., Wozny, M.J., “A particle-based model for simulating the draping behaviour of woven cloth”. Technical Report ECRC-94-19, European Computer-Industry Research Centre, München, Germany, 1994a. Eberhardt, B., Weber, A., Strasser, W., “A fast, flexible, particle-system model for cloth draping”, IEEE Computer Graphics and Applications, Vol. 16 No. 5, 1996, pp. 52-60. TC2, http://www.tc2.com/, 2002. Cray, S.: Virtual reality in virtual fashion, http://www.spectrum.ieee.org/select/0298/vr.html/, 2000. Assist.Prof.Dr. Zoran Stjepanovic University of Maribor, Faculty of Mechanical Engineering, Department of Textiles Smetanova 17, SI-2000 Maribor, Slovenia Telephone: +686 220 7945 Telefax: +686 220 7990 Email: [email protected]


![MANUFACTURING STUDIES FOR 3D HYBRID YARN BASED …...The hybrid yarn textiles are heated to process temperature with infrared radiation (compare next chapter and [10]). Subsequently,](https://img.pdfslide.us/doc/110x75/5f52e6ccce7bae302f56f613/manufacturing-studies-for-3d-hybrid-yarn-based-the-hybrid-yarn-textiles-are.jpg)