Embed Size (px)
Citation preview

Design/Build vs. Traditional Construction User Delay Modeling: An Evaluation of the Cost Effectiveness of
Innovative Construction Methods for New Construction
Part 2
VISUM Online for Salt Lake, Davis, and Utah Counties
Peter T. Martin, Aleksandar Stevanovic
Ivana Vladisavljevic Dejan Jovanovic
University of Utah Traffic Lab Department of Civil and Environmental Engineering
122 South Central Campus Drive Room 104 Salt Lake City, Utah 84112
May 2007

Acknowledgements The authors acknowledge Mr. Doug Anderson of the Utah Department of Transportation (UDOT) for his management of this research project. Disclaimer The contents of this report reflect the views of the authors, who are responsible for the facts and the accuracy of the information presented. This document is disseminated under the sponsorship of the Department of Transportation, University Transportation Centers Program, in the interest of information exchange. The U.S. Government assumes no liability for the contents of use thereof.

TABLE OF CONTENTS 1 INTRODUCTION ......................................................................................................................... 1
1.1 Research Goal and Objectives .................................................................................................. 1 1.2 Work Tasks ............................................................................................................................... 1
2 BACKGROUND............................................................................................................................ 5
2.1 Online Traffic Estimation and Prediction ................................................................................. 5 2.2 Archived Data Management Systems....................................................................................... 6 2.3 Real-Time Traffic Management Systems ................................................................................. 6 2.4 Transportation Planning Model ................................................................................................ 7 2.5 VISUM Online Advantage ....................................................................................................... 7
3 VISUM-Online Structure ............................................................................................................. 9
3.1 Input .......................................................................................................................................... 9 3.1.1 Semi – Dynamic Data......................................................................................................... 9 3.1.2 Real – Time Data.............................................................................................................. 10
3.2 VISUM-Online Models .......................................................................................................... 10 3.2.1 Data completion using Equilibrium Assignment ............................................................. 11
3.3 Database.................................................................................................................................. 12 3.4 Output ..................................................................................................................................... 13
3.4.1 Current Condition............................................................................................................. 13 3.4.2 Short-term Forecasting ..................................................................................................... 14 3.4.3 Calibrated Networks and Calibrated Matrices ................................................................. 15 3.4.4 Visualization..................................................................................................................... 16
3.5 Benefits ................................................................................................................................... 17 4 VISUM-Online Installation ........................................................................................................ 19
4.1 Hardware requirements........................................................................................................... 19 4.2 Software requirements ............................................................................................................ 19 4.3 Servers configuration .............................................................................................................. 20
4.3.1 Database server................................................................................................................. 20 4.3.2 Application Server............................................................................................................ 20 4.3.3 Communication server ..................................................................................................... 21
4.4 LOS calculation ...................................................................................................................... 22 4.5 Installation Progress................................................................................................................ 23
5 Initial VISUM-Online Evaluation.............................................................................................. 25
5.1 Results..................................................................................................................................... 26 5.2 Conclusion .............................................................................................................................. 29
6 Proposed Future Work ............................................................................................................... 31 References .......................................................................................................................................... 33 Appendix A Traffic Viewer............................................................................................................... 35 Appendix B Hardware Specification................................................................................................ 47 Appendix C V-On's Features ............................................................................................................ 49

List of Figures Figure 3.1 VISUM-Online structure.................................................................................................... 9
Figure 3.2 Impact of road work on a single link................................................................................ 10
Figure 3.3 MONET estimation procedure ......................................................................................... 11
Figure 3.4 Measurement Propagation................................................................................................ 12
Figure 3.5 Process for calculating current conditions (without messages)........................................ 13
Figure 3.6 Short-term prediction ....................................................................................................... 14
Figure 3.7 Measurement of similarity................................................................................................ 15
Figure 3.8 Model calibration ............................................................................................................. 16
Figure 4.1 XML file configuration .................................................................................................... 22
Figure 5.1 Coefficient of correlation between volumes from V-On and from AADT ...................... 26
Figure 5.2 Volumes from V-On and from AADT for Station 347 North.......................................... 27
Figure 5.3 Coefficient of correlation between volumes from V-On and from AADT
for Station 347 North........................................................................................................ 28
Figure 5.4 PRE between volumes from V-On and from AADT for Station 347 North .................... 29
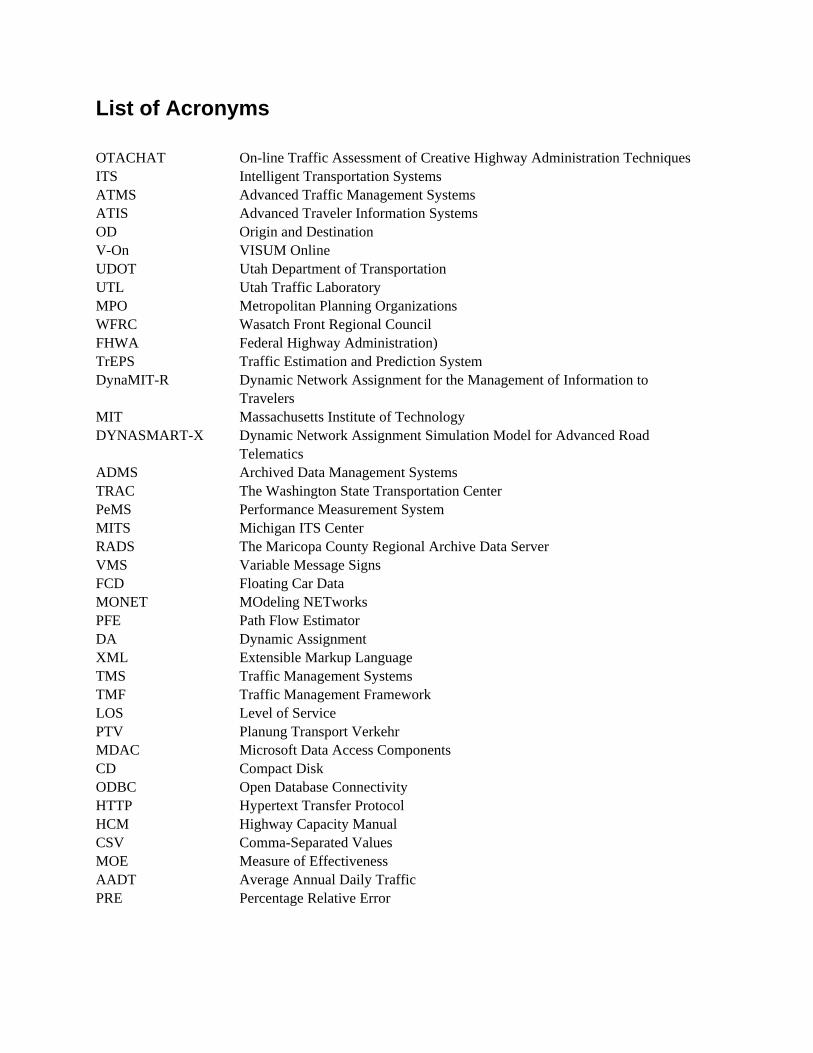
List of Acronyms OTACHAT On-line Traffic Assessment of Creative Highway Administration Techniques ITS Intelligent Transportation Systems ATMS Advanced Traffic Management Systems ATIS Advanced Traveler Information Systems OD Origin and Destination V-On VISUM Online UDOT Utah Department of Transportation UTL Utah Traffic Laboratory MPO Metropolitan Planning Organizations WFRC Wasatch Front Regional Council FHWA Federal Highway Administration) TrEPS Traffic Estimation and Prediction System DynaMIT-R Dynamic Network Assignment for the Management of Information to
Travelers MIT Massachusetts Institute of Technology DYNASMART-X Dynamic Network Assignment Simulation Model for Advanced Road
Telematics ADMS Archived Data Management Systems TRAC The Washington State Transportation Center PeMS Performance Measurement System MITS Michigan ITS Center RADS The Maricopa County Regional Archive Data Server VMS Variable Message Signs FCD Floating Car Data MONET MOdeling NETworks PFE Path Flow Estimator DA Dynamic Assignment XML Extensible Markup Language TMS Traffic Management Systems TMF Traffic Management Framework LOS Level of Service PTV Planung Transport Verkehr MDAC Microsoft Data Access Components CD Compact Disk ODBC Open Database Connectivity HTTP Hypertext Transfer Protocol HCM Highway Capacity Manual CSV Comma-Separated Values MOE Measure of Effectiveness AADT Average Annual Daily Traffic PRE Percentage Relative Error


ABSTRACT VISUM Online is a traffic management system for processing online traffic data. The system implements both a road network model and a traffic demand model. VISUM Online uses all available real-time and historic data to calculate current and forecasted traffic conditions, not only for detectorized links, but also for all the links on the network. VISUM Online has been installed in a few places around the world. This report describes the first VISUM Online installation in North America and presents the structure and components of the VISUM Online system. This report presents preliminary results of the VISUM Online validation. It compares traffic conditions estimated by VISUM Online to measured data. The results show that VISUM Online produces comparable traffic measures.

1
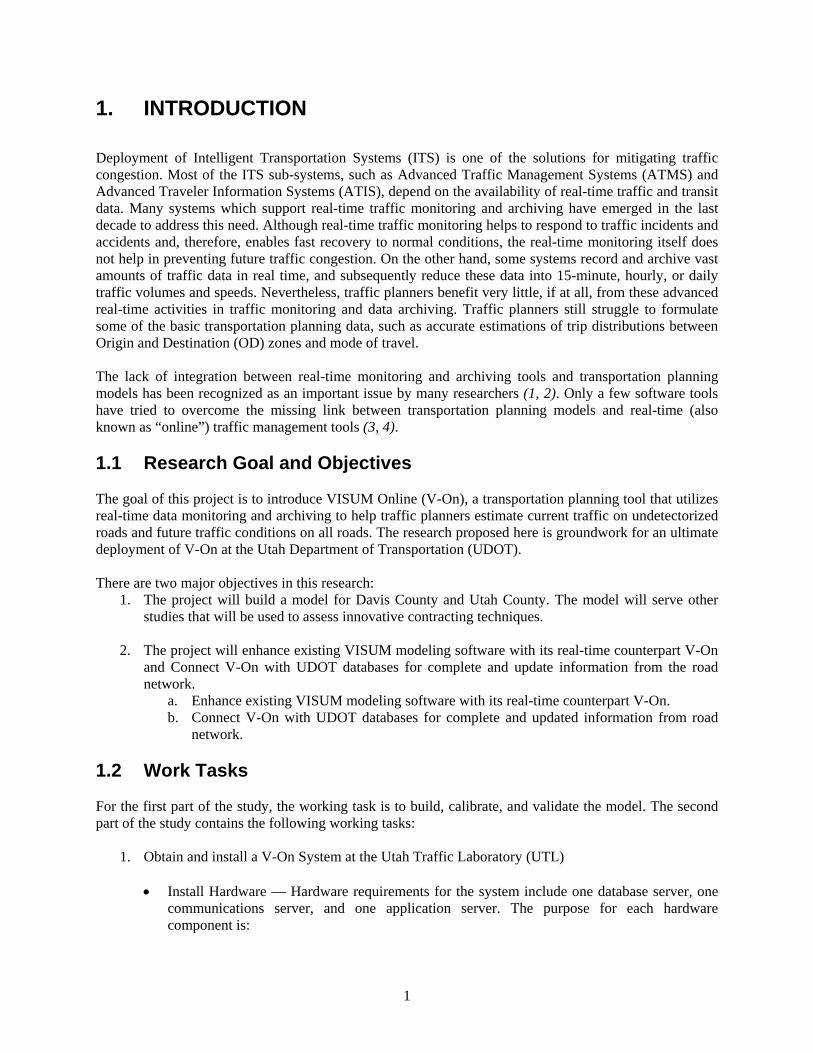
1. INTRODUCTION Deployment of Intelligent Transportation Systems (ITS) is one of the solutions for mitigating traffic congestion. Most of the ITS sub-systems, such as Advanced Traffic Management Systems (ATMS) and Advanced Traveler Information Systems (ATIS), depend on the availability of real-time traffic and transit data. Many systems which support real-time traffic monitoring and archiving have emerged in the last decade to address this need. Although real-time traffic monitoring helps to respond to traffic incidents and accidents and, therefore, enables fast recovery to normal conditions, the real-time monitoring itself does not help in preventing future traffic congestion. On the other hand, some systems record and archive vast amounts of traffic data in real time, and subsequently reduce these data into 15-minute, hourly, or daily traffic volumes and speeds. Nevertheless, traffic planners benefit very little, if at all, from these advanced real-time activities in traffic monitoring and data archiving. Traffic planners still struggle to formulate some of the basic transportation planning data, such as accurate estimations of trip distributions between Origin and Destination (OD) zones and mode of travel. The lack of integration between real-time monitoring and archiving tools and transportation planning models has been recognized as an important issue by many researchers (1, 2). Only a few software tools have tried to overcome the missing link between transportation planning models and real-time (also known as “online”) traffic management tools (3, 4). 1.1 Research Goal and Objectives The goal of this project is to introduce VISUM Online (V-On), a transportation planning tool that utilizes real-time data monitoring and archiving to help traffic planners estimate current traffic on undetectorized roads and future traffic conditions on all roads. The research proposed here is groundwork for an ultimate deployment of V-On at the Utah Department of Transportation (UDOT). There are two major objectives in this research:
1. The project will build a model for Davis County and Utah County. The model will serve other studies that will be used to assess innovative contracting techniques.
2. The project will enhance existing VISUM modeling software with its real-time counterpart V-On
and Connect V-On with UDOT databases for complete and update information from the road network.
a. Enhance existing VISUM modeling software with its real-time counterpart V-On. b. Connect V-On with UDOT databases for complete and updated information from road
network.
1.2 Work Tasks For the first part of the study, the working task is to build, calibrate, and validate the model. The second part of the study contains the following working tasks:
1. Obtain and install a V-On System at the Utah Traffic Laboratory (UTL)
• Install Hardware — Hardware requirements for the system include one database server, one communications server, and one application server. The purpose for each hardware component is:
2
o Database server — hosts the V-On database. This is the central place where all static (e.g. network description) and dynamic information (e.g., detector data, forecasting results) come together.
o Communications server — manages all the data exchange from and to the database (e.g., receives detector data, reformats them and writes them to the database.)
o Application server – hosts the detector analysis and forecasting procedures. • Install Software - The V-On system will be installed on the three servers. MS Windows will
be the operating system on the servers. Software installation will occur immediately after the hardware is installed.
• Interface V-On with Existing Systems - Once the hardware and software are in place, the next
step is to interface with the existing systems. The first interface requirement is for the detector data which V-On uses in its algorithms to estimate the traffic state and predict traffic conditions. If all detector data are provided by a single interface, no additional steps are needed at this stage.
• Develop VISUM Network – UTL has already developed a VISUM network of major roads
along the Wasatch Front. The network consists of four selected roadways within the study area. The lane geometry and features match those from the Metropolitan Planning Organizations (MPO) Wasatch Front Regional Council (WFRC) model (TP+). Field detector locations will be mapped to their precise location on the VISUM network.
2. Calibrate V-On
• Develop Calibration Procedures - A plan detailing the internal testing procedures will be developed. The document will address the following:
o Study periods for field data collection (e.g., AM-peak, PM-peak, Off-peak) o Subdivision of study area boundaries into sections with different detection densities.
This will occur once detection of the freeway system is added. o Field data collection procedures (e.g., floating car study, number of floating cars per
subinterval of each study period, data collection equipment, data reporting format, etc.)
o Calibration tolerances and statistical tests • Calibrate System
o Test field data will be compared with those predicted by V-On. o Statistical tests will be applied to estimate the confidence in V-On’s ability to predict
travel times. If the results are not within the specified tolerance ranges, a more detailed analysis of why the differences exist will be conducted. The results may show that the differences are only present within a given section of the study area.
o After understanding the reason for the differences, V-On can be calibrated to reflect the particular field condition causing the difference. If the results fall within the given tolerances, the calibration phase is complete.

3
3. Meet with UDOT’s TAC and present findings 4. Deliver final report
This report starts with an overview of similar software and previous research on online traffic estimation and prediction tools. Next, it gives a detailed description of V-On, followed by its first North American installation and deployment at the UTL. A discussion of the installation progress, along with V-On’s features that could be most beneficial to UDOT, is provided. The report concludes with initial calibration efforts in adjusting V-On to reflect real-world traffic demand.

4
5
2. BACKGROUND V-On is a software suite which integrates the transportation planning model, VISUM, with a set of traffic estimation and propagation models and real-time traffic data. The software is used to improve:
• Online traffic prediction • Traffic data archival • Traffic management • Transportation planning
Various types of software are commonly used for the four traffic concepts listed in the previous paragraph. However, traffic management tools are rarely used for transportation planning. Therefore, a review of the existing software is provided separately for each of the four distinct concepts. 2.1 Online Traffic Estimation and Prediction In 1995, the Federal Highway Administration (FHWA) initiated use of Dynamic Traffic Assignments for traffic prediction in order to address complex traffic control and management issues (5). Two parallel research projects were funded to develop a real-time Traffic Estimation and Prediction System (TrEPS). By 1998, two prototypes from this research were developed:
• Dynamic Network Assignment for the Management of Information to Travelers (DynaMIT-R) by the Massachusetts Institute of Technology (MIT)
• Dynamic Network Assignment Simulation Model for Advanced Road Telematics
(DYNASMART-X) by the University of Texas at Austin with follow-up development and support at the University of Maryland.
• Both of these prototypes do the following: • Provide predictive traffic information (while the previous plan is in the implementation phase,
new estimates are made – “rolling horizon”): o speed o density o queues/flows
• Support real-time operations:
o data synchronization o self-calibration of system parameters o self-correction of system states
• The differences between these two systems are: • representation of traffic network and traffic in the models • driver response to ATIS and ATMS • approach to real time data synchronization
6
• system design and integration Both prototypes were tested in offline mode during the last few years and they both showed potential for real time application (4, 6, 7). 2.2 Archived Data Management Systems A wide area of roads is already covered with detectors that transmit traffic data in short intervals. Archiving and managing traffic data, as a part of Archived Data Management Systems (ADMS), can help develop operational strategies, plan for operations, make long-term plans, and make decisions about policy and investment. This section lists some of the existing ADMS (1); more ADMS deployments are underway.
• The Washington State Transportation Center (TRAC) archives and analyzes freeway and ramp-metering data. The major disadvantage of this system is that it does not automatically generate new data to replace missing, bad, or suspect data.
• The Freeway Performance Measurement System (PeMS) was developed in 2002 to help the California Department of Transportation (Caltrans) monitor system performance and manage congestion. Travel delays are based on volumes and lane occupancy data. The system is frequently used for quick analysis during major transportation events.
• The Michigan ITS Center (Detroit MITS) provides raw and aggregated data. Its main purpose is to provide traffic information to Michigan Department of Transportation (MDOT) planners.
• The Minnesota Traffic Management Center (TMC) manages traffic in real-time and provides real-time road condition information to motorists.
• The Maricopa County Regional Archive Data Server (RADS) is not operational yet, but has plans to collect and store data from the various systems in Maricopa County, Arizona, in a centralized archive data server. Data will be available to users through a common Web interface.
• The King County Metro supports transit operations and service planning. It also saves data and publishes automatic vehicle location data to the Internet, but only for transit vehicles.
2.3 Real-Time Traffic Management Systems Many metropolitan areas have created TMCs with various sources of data information. In addition to managing traffic operations, TMCs inform travelers about traffic conditions via radio, television, the Internet, and variable message signs (VMS) along the roadways. UDOT – Commuter Link (8), Georgia DOT – Navigator (9), and Traffic.com (40 metropolitan areas) (10) are examples of web-based interfaces intended for travelers. A major disadvantage of TMCs is that they only provide information for major roads, not for arterials. Also, there is no information about future conditions, which is the most pertinent information for most users.

7
2.4 Transportation Planning Model Macroscopic simulation models are usually used in transportation planning to analyze the effects of various transportation improvements. Since V-On contains the transportation macrosimulation software, VISUM, V-On’s results can be used for transportation planning. Transportation planning used in conjunction with a real-time system will produce more accurate results because V-On can be used to calibrate OD matrices for every hour of the day. It is these OD matrices that often represent the biggest source of error in transportation planning models. 2.5 VISUM Online Advantage The advantages of all the previously described models plus some unique features are included in V-On. Table 2.1 shows the capabilities of the previously described systems and V-On. Table 2.1 also compares these systems. Table 2.1 Comparison of Existing Systems System Feature TR
AC
PeM
S
Det
roit
MIT
S
Min
neso
ta T
MC
The
Mar
icop
a C
ount
y R
AD
S
Kin
g C
ount
y M
etro
UD
OT
Com
mut
er L
ink
and
sim
ilar
Dyn
aMIT
DY
NA
SMA
RT
VIS
UM
Onl
ine
Data archiving x x x x x x x x Data propagation x Fill up the data that is missing, considered bad or suspect
x x x x1 *2 … *2 *2 *2 x
Providing information to the travelers
x x x x x x x
Incident information x x x x
Incidents affect assignment x x x
Short term prediction (approximately next hour)
x x x x
Long term prediction (next coming days)
x
1 Depends on the agency 2 Information about this feature is not available

8
9
3. VISUM-Online Structure
Source: PTV AG
Measurements
Incidents
Probes/FCD
OD Matrices
Networks
Real - Time Data
Semi – Dynamic Data
Input
Measurements
Incidents
Probes/FCD
OD Matrices
Networks
Real - Time Data
Semi – Dynamic Data
Measurements
Incidents
Probes/FCD
OD Matrices
Networks
Measurements
Incidents
Probes/FCD
Measurements
Incidents
Probes/FCD
Measurements
Incidents
Probes/FCD
OD Matrices
Networks
OD Matrices
Networks
OD Matrices
Networks
Real - Time Data
Semi – Dynamic Data
Input
VISUM Online Models
Database
VISUM Online Models
VISUM Online Models
DatabaseDatabaseDatabase
Output
Calibrated Matrices
Current Conditions
Calibrated Networks
Short -Term Forecast
Output
Calibrated Matrices
Current Conditions
Calibrated Networks
Short -Term Forecast
Output
Calibrated Matrices
Current Conditions
Calibrated Networks
Short -Term Forecast
Calibrated Matrices
Current Conditions
Calibrated Networks
Short -Term Forecast
Current Conditions
Calibrated Networks
Short -Term Forecast Traveler
Government
Benefits
Traveler
Government
Benefits
Traveler
Government
Benefits
Figure 3.1 VISUM-Online structure
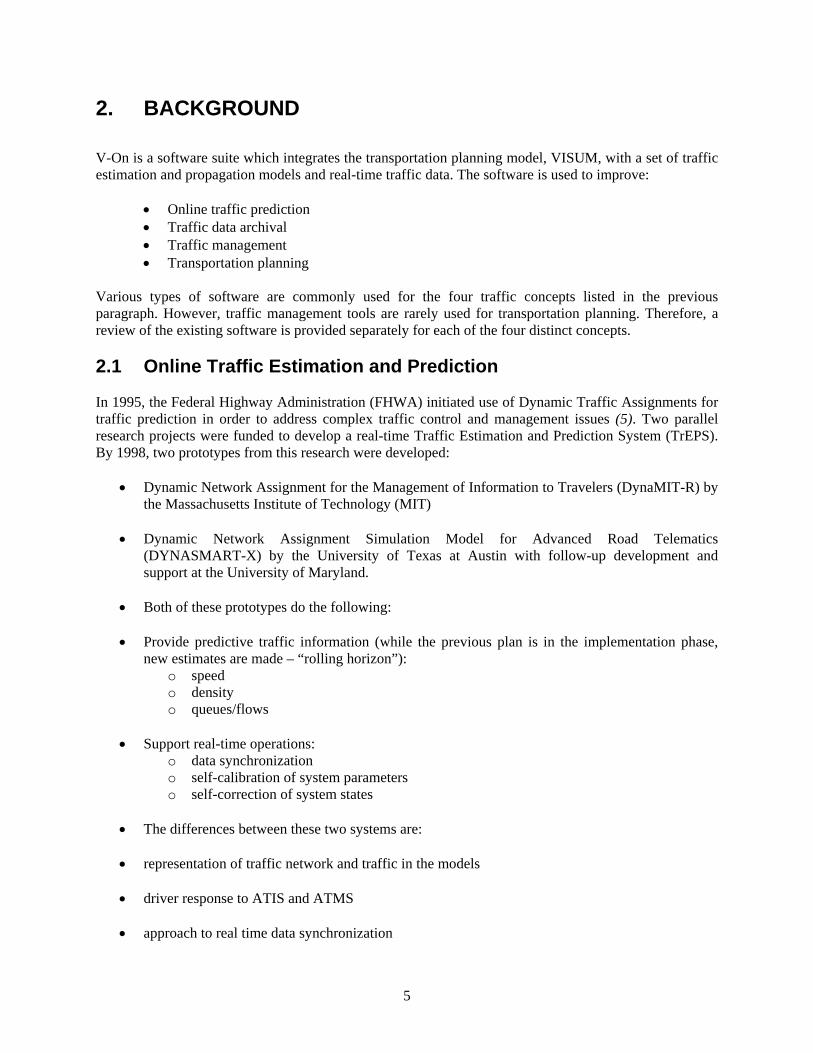
Figure 3.1 shows a simplified representation of the V-On structure. There are numerous models and modules not included in Figure 3.1 that enable V-On to perform all of its functions. The most notable are those in the VISUM Online Models box, which contains the traffic assignment, detector propagation, forecasting, message handling, etc. 3.1 Input Inputs in V-On consist of a supply side and a demand side (11). The supply side is the traffic infrastructure (i.e. the roads, how they are controlled, and the impacts of any current traffic messages). The demand side is the number of trips from one zone to the other during a certain time interval, given in the form of OD matrices. In addition to the matrices, real-time counts are propagated through the system. 3.1.1 Semi – Dynamic Data Network – The comprehensive information about the road network and infrastructure (i.e., measurement sites, the location of signalized intersections) are entered and edited through VISUM’s graphical user interface (12). The UTL uses the WRFC travel network. The network consist of 14,282 links, 6,331 nodes, 1,500 zones, 4,107 connectors, and 506 freeway loop detectors.
OD Matrices – OD matrices describe travel demand within the network. They are updated regularly as a result of the detector measurements during system operation. Currently, V-On runs 24 one-hour matrices. However, as the system grows in archival data, the time interval of the data may be adjusted to 15 minutes.

10
3.1.2 Real-Time Data Measurements – Online measurement data come from traffic flow detectors (i.e., loops, transponders, etc.) (12). V-On can prepare and process this data from different sources. Only a few other real-time systems have this capability. There is a module-based architecture, which provides the possibility to connect every kind of detector to the system. There are modules which are able to fusion other information like FCD or other information to the propagation result.
Traffic messages about incidents – Traffic messages provide information about incidents (e.g., road works) or traffic conditions (e.g. 2 km of congestion). V-On responds to traffic messages about incidents in two ways (11). First, it posts messages about the incidents that are accessible to users. Second, it is “sensitive to measures.” This means that V-On is capable of adapting its traffic assignment and propagation methods to the incidents as they occur. In other words, users can find updated information on the corresponding links regarding travel times, volumes, and route choice. The updated information not only includes the calculation of current conditions, but it also includes short-term forecasts (for known incidents). Furthermore, each message category has different development and result times. For example, a message about an accident will have a gradual effect as road users become aware of it, but a message regarding road construction will have an immediate effect because road users are informed about the work in advance.
(a) (b)
Source: PTV AG
Figure 3.2 Impact of road work on a single link
Figure 3.2 shows the impact of road work on congestion when the road work is on a link without detectors situated between two detectorized links. Two cases are shown: part (a) of the figure shows the detection-based information system approach, and part (b) shows the V-On approach. In the V-On approach, the information from the traffic message is used to estimate congestion on related links. Even without detected data, congestion effects can be estimated from traffic message information. 3.2 VISUM-Online Models MOdeling NETworks (MONET) is a simulation module, which generates traffic conditions and performs short-term forecasts (13, 14). MONET was the pilot project for V-On and represents the core calculation algorithm. The main purpose of MONET is to predict traffic volumes on road networks by processing data and information from various sources. It can display present or future traffic conditions or it can calculate OD flows. MONET uses various models.

11
Source: PTV AG Figure 3.3 MONET estimation procedure
Figure 3.3 illustrates MONET’s estimation procedure. It shows how historical data are combined with measured and estimated values to calculate the actual conditions. For the future conditions, Cluster processes must be added. There are two primary processes to MONET: Traffic Assignment and Detector Data Propagation. 3.2.1 Data completion using Equilibrium Assignment Data completion means filling the information gap on roads without detection-providing information about traffic for links which are not covered by measurements. V-On is the only online traffic prediction software that has data completion. The traffic assignment uses an approximate (historical) OD matrix as the basis of an equilibrium assignment. V-On then propagates real-time traffic data to compute the most likely traffic situation in real time.
12
80 %
20 %
80 %
20 %
50 %
50 %
50 %
50 % M
MM
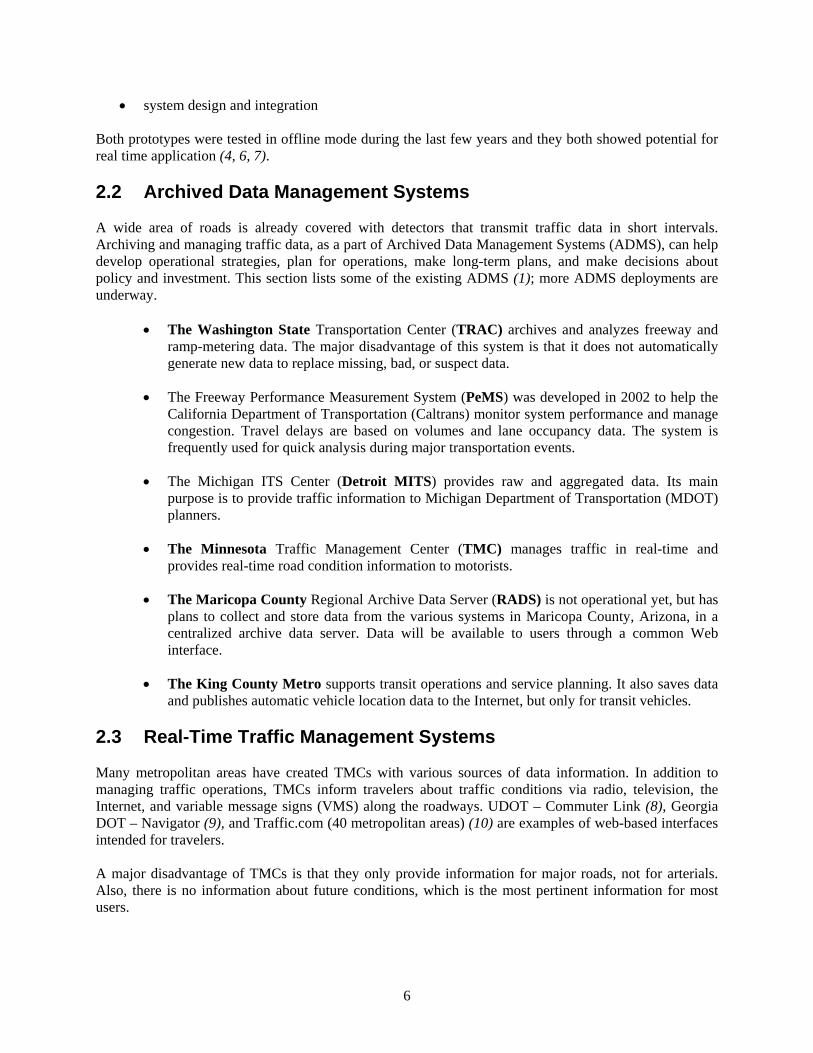
Source: PTV AG Figure 3.4 Measurement propagation
Figure 3.4 shows an example of propagation of measured traffic volumes along routes in the network. The rectangles with the letter M represent measurement sites, and the other rectangles are propagated values of traffic volumes. The primary short-term forecasting method is based on the traffic state, the messages and a cluster analysis method, and gives results for user-defined time periods such as 15 minutes. 3.3 Database The VISUM-Online Database (15) is the core of the V-On system. It is the central place where all static (e.g., network description) and dynamic information (e.g. detector data, forecasting results) come together. It also hosts necessary software for database archiving. V-On uses a System Manager to run the system. The System Manager consists of a Service Manager and a System Monitor. The Service Manager allocates the request to the server that will perform the task. Thus, it works like a dispatcher within the hardware system. The System Monitor supervises all processes within the system. There are over 500 freeway loop detectors in the Salt Lake Metropolitan Region. The traffic data from all of these detectors are stored in the centralized V-On archive Oracle database. The data include information about traffic volumes, speeds, and incidents. V-On collects the data via a secured internet connection from a UDOT server. Almost three gigabytes of traffic data in Extensible Markup Language (XML) format is stored every day.
13
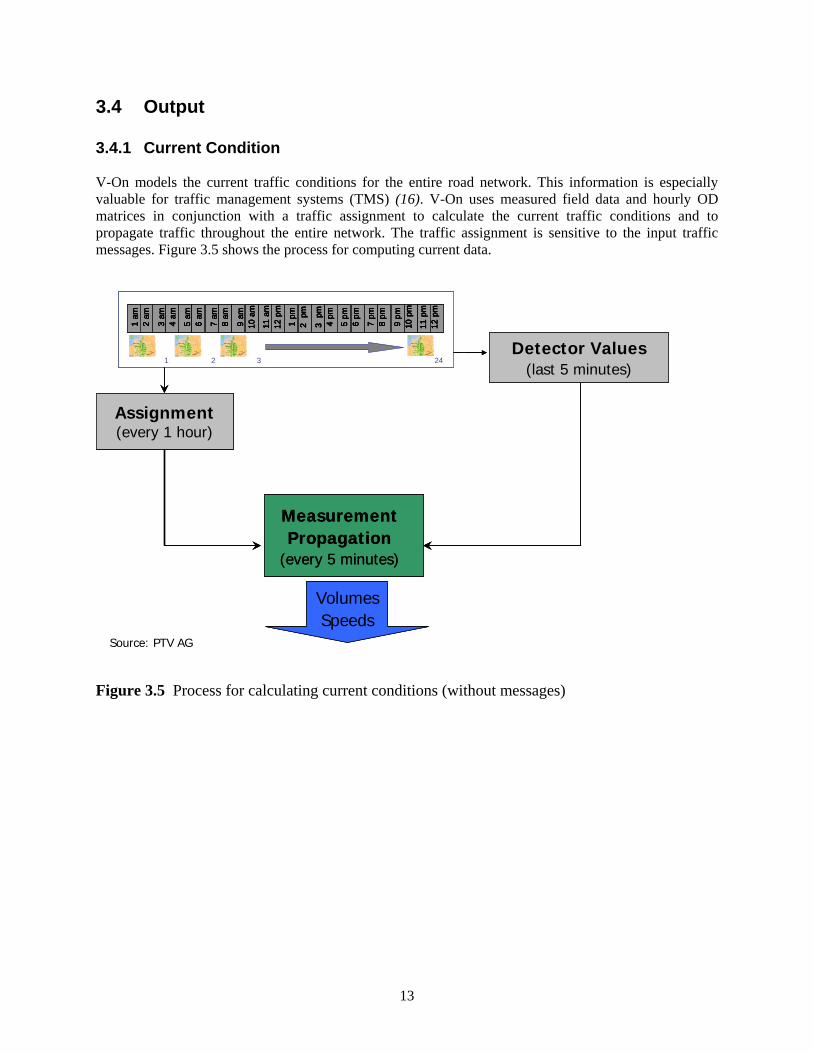
3.4 Output 3.4.1 Current Condition V-On models the current traffic conditions for the entire road network. This information is especially valuable for traffic management systems (TMS) (16). V-On uses measured field data and hourly OD matrices in conjunction with a traffic assignment to calculate the current traffic conditions and to propagate traffic throughout the entire network. The traffic assignment is sensitive to the input traffic messages. Figure 3.5 shows the process for computing current data.
VolumesSpeedsVolumesSpeeds
MeasurementPropagation
(every 5 minutes)
MeasurementPropagation
(every 5 minutes)
MeasurementPropagation
(every 5 minutes)
1 am
2 am
3 am
4 am
5 am
6 am
7 am
8 am
9 am
10 a
m
11 a
m12
pm
1 pm
2 p
m
3 p
m4
pm
5 pm
6 pm
7 pm
8 pm
9 pm
10 p
m
11 p
m12
pm
1 2 3 24
1 am
2 am
3 am
4 am
5 am
6 am
7 am
8 am
9 am
10 a
m
11 a
m12
pm
1 am
2 am
3 am
4 am
5 am
6 am
1 am
2 am
1 am
2 am
3 am
4 am
3 am
4 am
5 am
6 am
5 am
6 am
7 am
8 am
9 am
10 a
m
11 a
m12
pm
7 am
8 am
7 am
8 am
9 am
10 a
m9
am10
am
11 a
m12
pm
11 a
m12
pm
1 pm
2 p
m
3 p
m4
pm
5 pm
6 pm
7 pm
8 pm
9 pm
10 p
m
11 p
m12
pm
1 pm
2 p
m
3 p
m4
pm
5 pm
6 pm
1 pm
2 p
m1
pm2
pm
3 p
m4
pm3
pm
4 pm
5 pm
6 pm
5 pm
6 pm
7 pm
8 pm
9 pm
10 p
m
11 p
m12
pm
7 pm
8 pm
7 pm
8 pm
9 pm
10 p
m9
pm10
pm
11 p
m12
pm
11 p
m12
pm
1 2 3 24
Assignment(every 1 hour)Assignment(every 1 hour)
Source: PTV AG
Detector Values(last 5 minutes)
Detector Values(last 5 minutes)
Figure 3.5 Process for calculating current conditions (without messages)
14
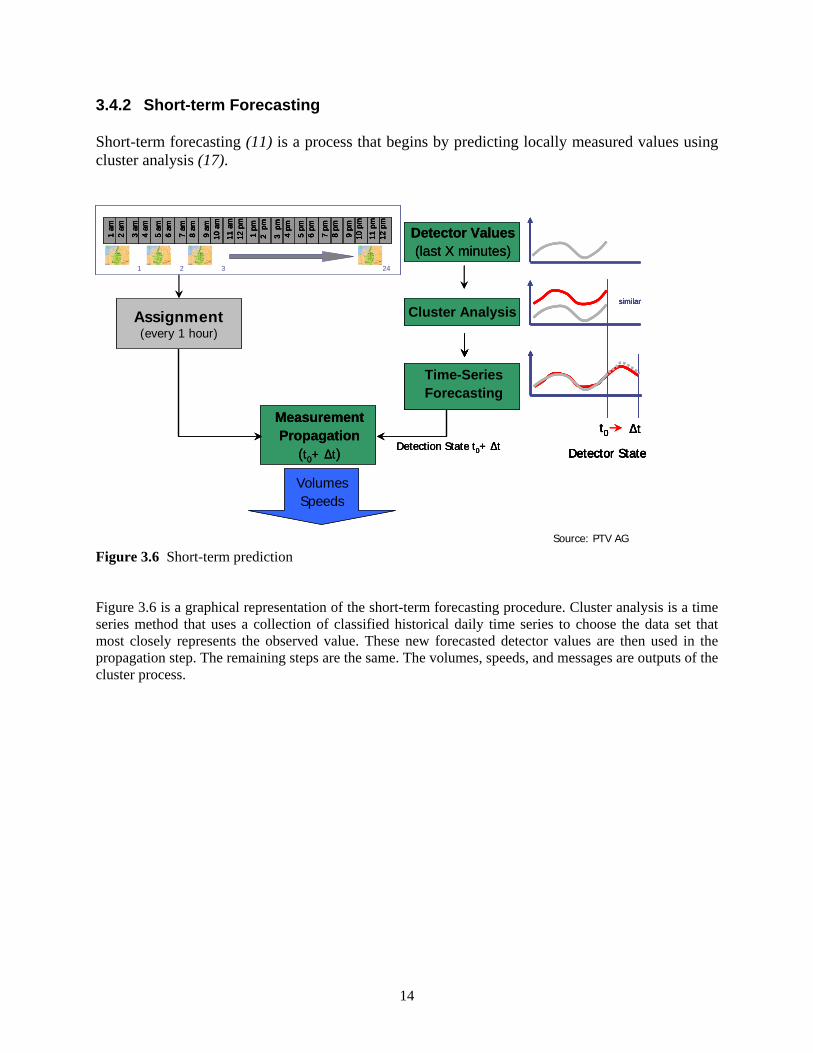
3.4.2 Short-term Forecasting Short-term forecasting (11) is a process that begins by predicting locally measured values using cluster analysis (17).
Detector Values(last X minutes)
Detector Values(last X minutes)
Detector Values(last X minutes)
VolumesSpeedsVolumesSpeeds
similarCluster Analysis
similarCluster Analysis
similarsimilarCluster Analysis Cluster Analysis
MeasurementPropagation
(t0+ Δt) Detection State t0+ Δt
MeasurementPropagation
(t0+ Δt) Detection State t0+ Δt
MeasurementPropagation
(t0+ Δt) Detection State t0+ Δt
1 am
2 am
3 am
4 am
5 am
6 am
7 am
8 am
9 am
10 a
m
11 a
m12
pm
1 pm
2 p
m
3 p
m4
pm
5 pm
6 pm
7 pm
8 pm
9 pm
10 p
m
11 p
m12
pm
1 2 3 24
1 am
2 am
3 am
4 am
5 am
6 am
7 am
8 am
9 am
10 a
m
11 a
m12
pm
1 am
2 am
3 am
4 am
5 am
6 am
1 am
2 am
1 am
2 am
3 am
4 am
3 am
4 am
5 am
6 am
5 am
6 am
7 am
8 am
9 am
10 a
m
11 a
m12
pm
7 am
8 am
7 am
8 am
9 am
10 a
m9
am10
am
11 a
m12
pm
11 a
m12
pm
1 pm
2 p
m
3 p
m4
pm
5 pm
6 pm
7 pm
8 pm
9 pm
10 p
m
11 p
m12
pm
1 pm
2 p
m
3 p
m4
pm
5 pm
6 pm
1 pm
2 p
m1
pm2
pm
3 p
m4
pm3
pm
4 pm
5 pm
6 pm
5 pm
6 pm
7 pm
8 pm
9 pm
10 p
m
11 p
m12
pm
7 pm
8 pm
7 pm
8 pm
9 pm
10 p
m9
pm10
pm
11 p
m12
pm
11 p
m12
pm
1 2 3 24
Assignment(every 1 hour)
Assignment(every 1 hour)
Δtt0
Detector State
Time-SeriesForecasting
Δtt0
Detector State
Time-SeriesForecasting
Δtt0
Detector State
Time-SeriesForecasting
Δtt0
Detector State
Time-SeriesForecasting
t0
Detector State
Time-SeriesForecastingTime-SeriesForecastingTime-SeriesForecastingTime-SeriesForecasting
Source: PTV AG Figure 3.6 Short-term prediction Figure 3.6 is a graphical representation of the short-term forecasting procedure. Cluster analysis is a time series method that uses a collection of classified historical daily time series to choose the data set that most closely represents the observed value. These new forecasted detector values are then used in the propagation step. The remaining steps are the same. The volumes, speeds, and messages are outputs of the cluster process.
15
similar
different
Shape: correlation coefficient
Position: mean relative similarity
similar
different
similar
different
Shape: correlation coefficient
similar
different
Shape: correlation coefficient
similarsimilar
different
Shape: correlation coefficient
Position: mean relative similarity
similar
different
Position: mean relative similarity
similar
different
Source: PTV AG
Figure 3.7 Measurement of similarity
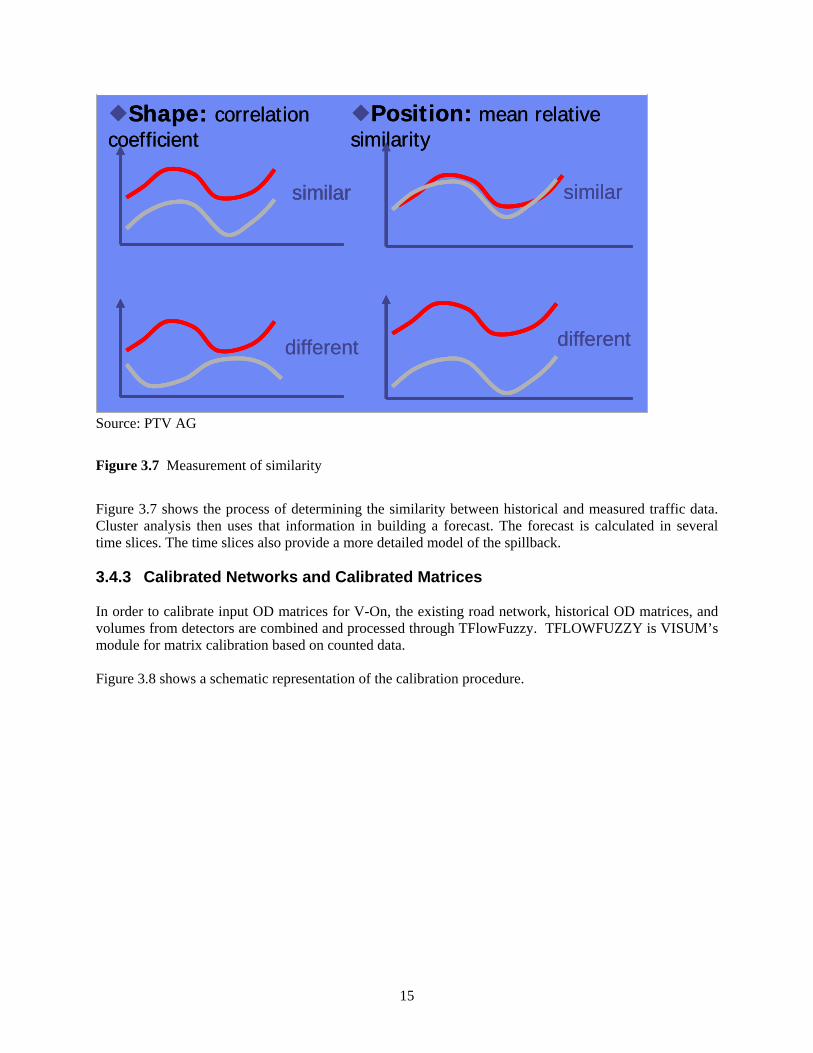
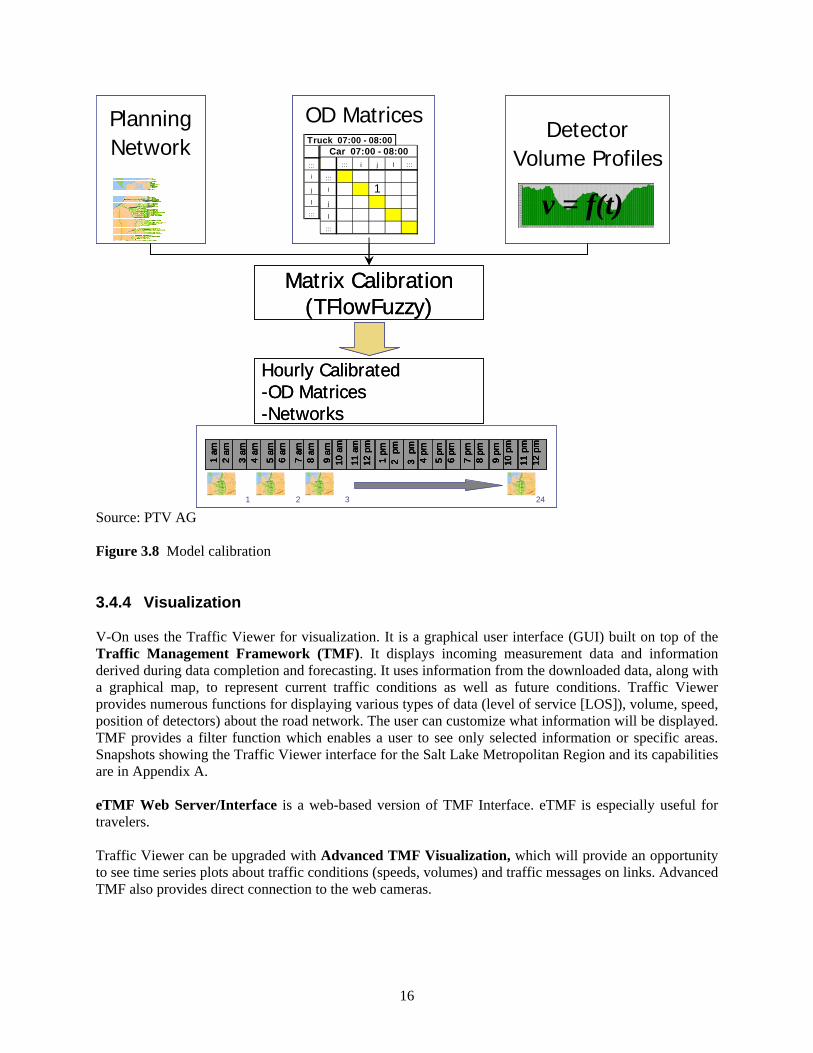
Figure 3.7 shows the process of determining the similarity between historical and measured traffic data. Cluster analysis then uses that information in building a forecast. The forecast is calculated in several time slices. The time slices also provide a more detailed model of the spillback. 3.4.3 Calibrated Networks and Calibrated Matrices In order to calibrate input OD matrices for V-On, the existing road network, historical OD matrices, and volumes from detectors are combined and processed through TFlowFuzzy. TFLOWFUZZY is VISUM’s module for matrix calibration based on counted data.
Figure 3.8 shows a schematic representation of the calibration procedure.
16
v = f(t)
DetectorVolume Profiles
PlanningNetwork ::: i j l :::
:::
i xj
l
:::
Truck 07:00 - 08:00
::: i j l :::
:::
i 1j
l
:::
Car 07:00 - 08:00
OD Matrices
v = f(t)
DetectorVolume Profiles
PlanningNetwork ::: i j l :::
:::
i xj
l
:::
Truck 07:00 - 08:00
::: i j l :::
:::
i 1j
l
:::
Car 07:00 - 08:00
OD Matrices
v = f(t)
DetectorVolume Profiles
v = f(t)v = f(t)
DetectorVolume Profiles
PlanningNetwork ::: i j l :::
:::
i xj
l
:::
Truck 07:00 - 08:00
::: i j l :::
:::
i 1j
l
:::
Car 07:00 - 08:00
OD Matrices::: i j l :::
:::
i xj
l
:::
Truck 07:00 - 08:00
::: i j l :::
:::
i 1j
l
:::
Car 07:00 - 08:00
OD Matrices
Matrix Calibration(TFlowFuzzy)
Hourly Calibrated-OD Matrices-Networks
Matrix Calibration(TFlowFuzzy)
Hourly Calibrated-OD Matrices-Networks
1 am
2 am
3 am
4 am
5 am
6 am
7 am
8 am
9 am
10 a
m
11 a
m12
pm
1 pm
2 p
m
3 p
m4
pm
5 pm
6 pm
7 pm
8 pm
9 pm
10 p
m
11 p
m12
pm
1 2 3 24
1 am
2 am
3 am
4 am
5 am
6 am
7 am
8 am
9 am
10 a
m
11 a
m12
pm
1 am
2 am
3 am
4 am
5 am
6 am
1 am
2 am
1 am
2 am
3 am
4 am
3 am
4 am
5 am
6 am
5 am
6 am
7 am
8 am
9 am
10 a
m
11 a
m12
pm
7 am
8 am
7 am
8 am
9 am
10 a
m9
am10
am
11 a
m12
pm
11 a
m12
pm
1 pm
2 p
m
3 p
m4
pm
5 pm
6 pm
7 pm
8 pm
9 pm
10 p
m
11 p
m12
pm
1 pm
2 p
m
3 p
m4
pm
5 pm
6 pm
1 pm
2 p
m1
pm2
pm
3 p
m4
pm3
pm
4 pm
5 pm
6 pm
5 pm
6 pm
7 pm
8 pm
9 pm
10 p
m
11 p
m12
pm
7 pm
8 pm
7 pm
8 pm
9 pm
10 p
m9
pm10
pm
11 p
m12
pm
11 p
m12
pm
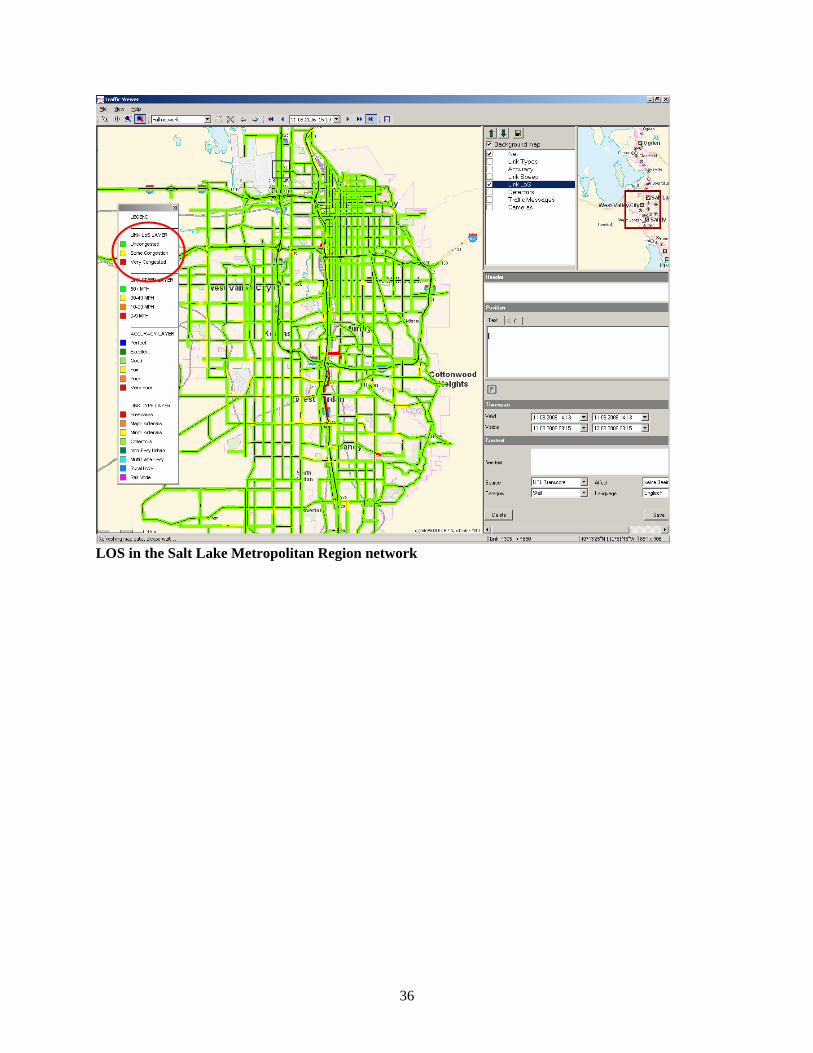
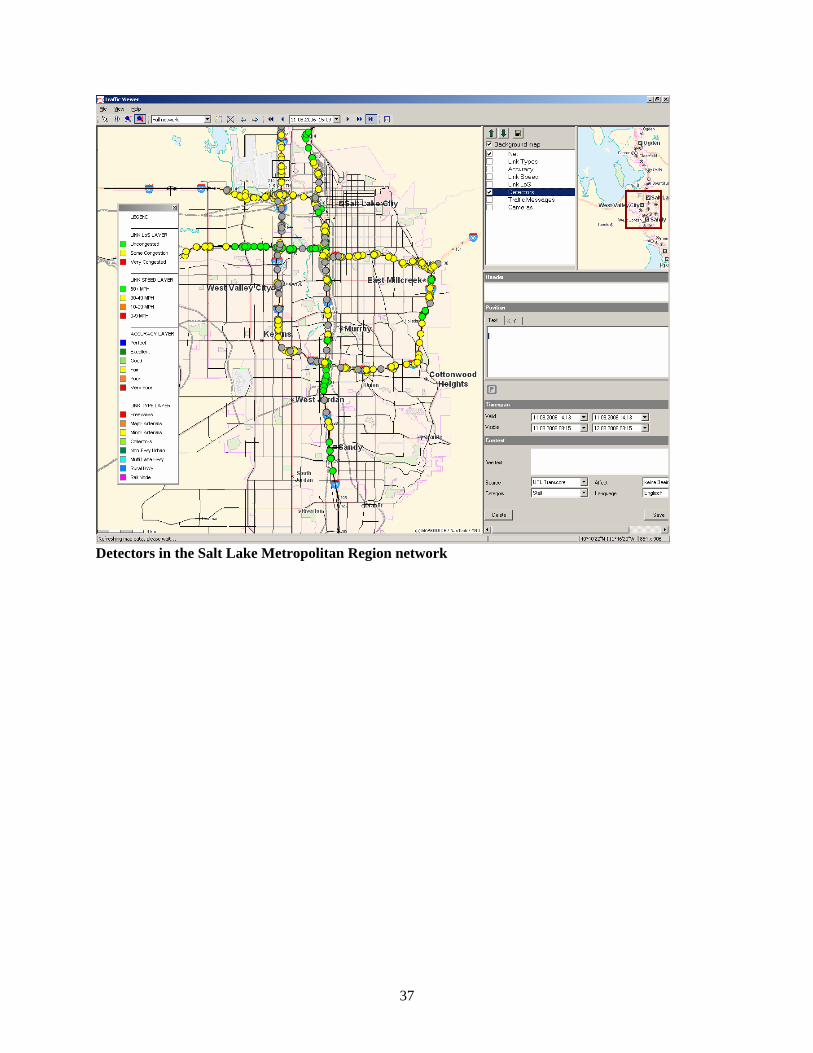
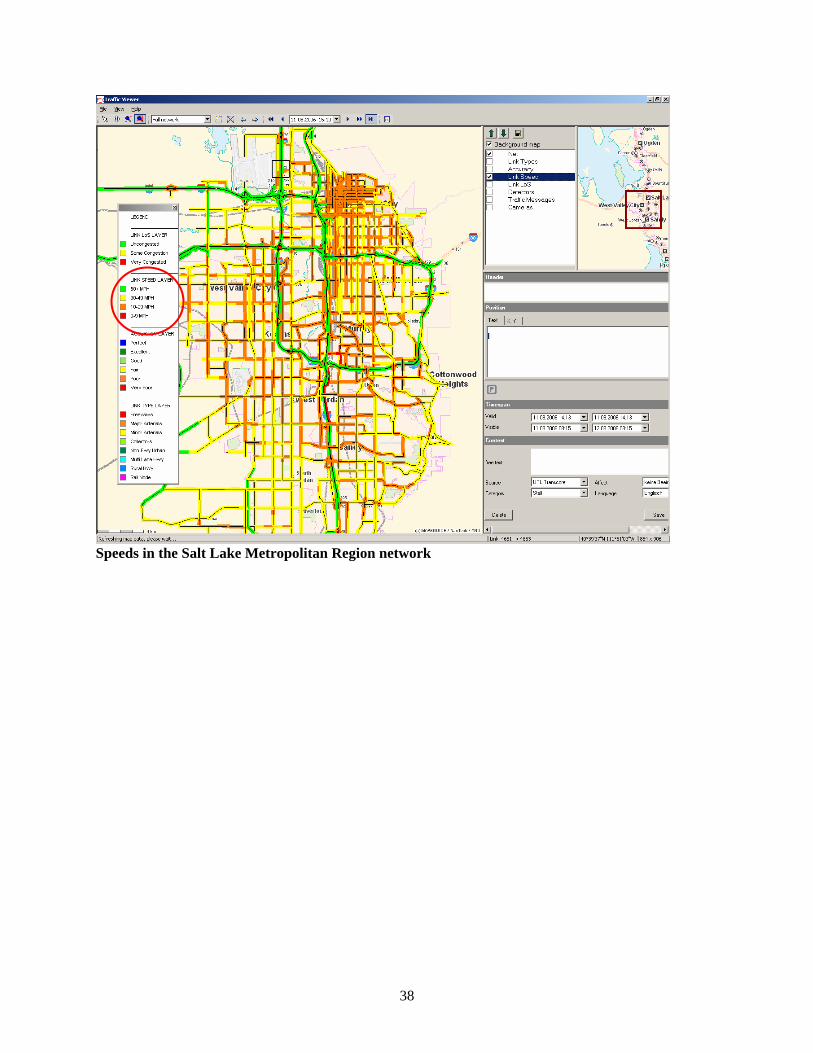
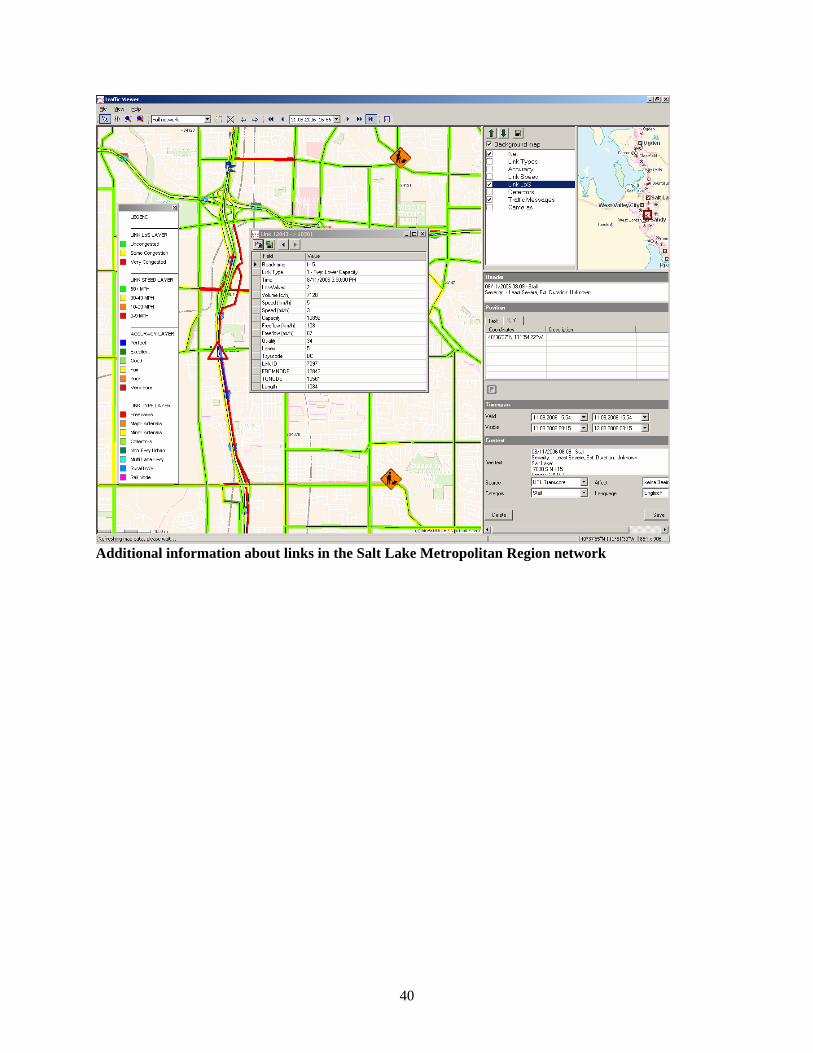
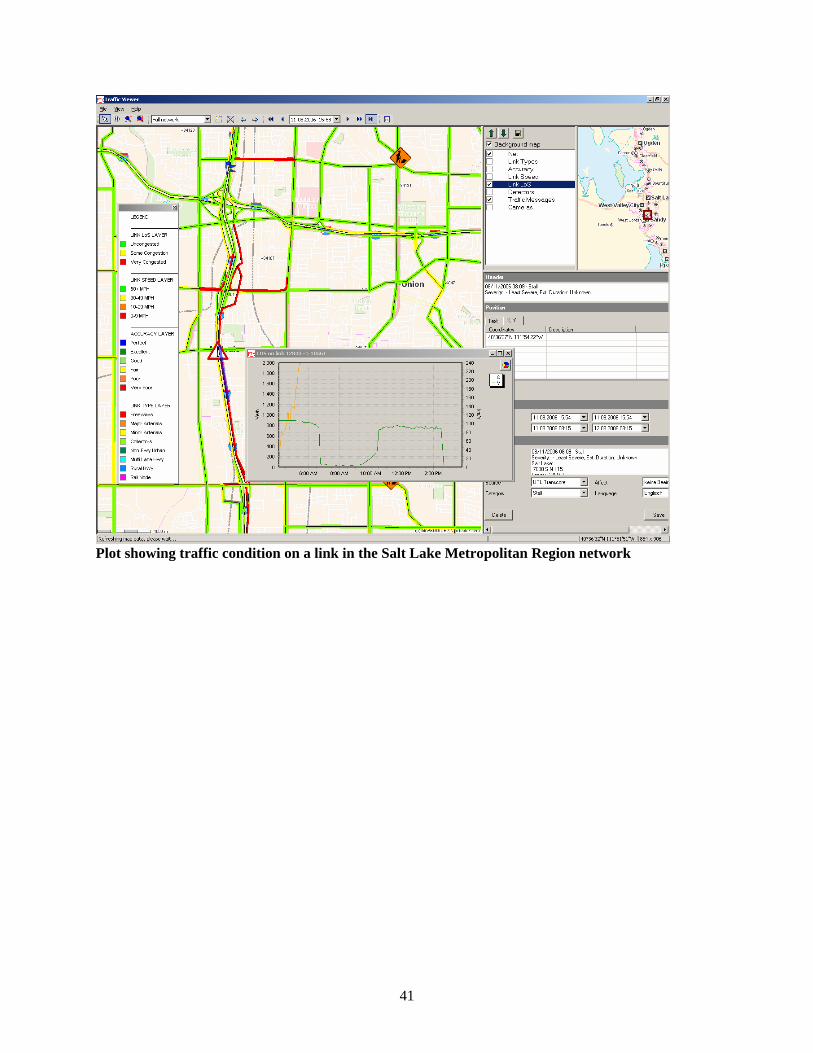
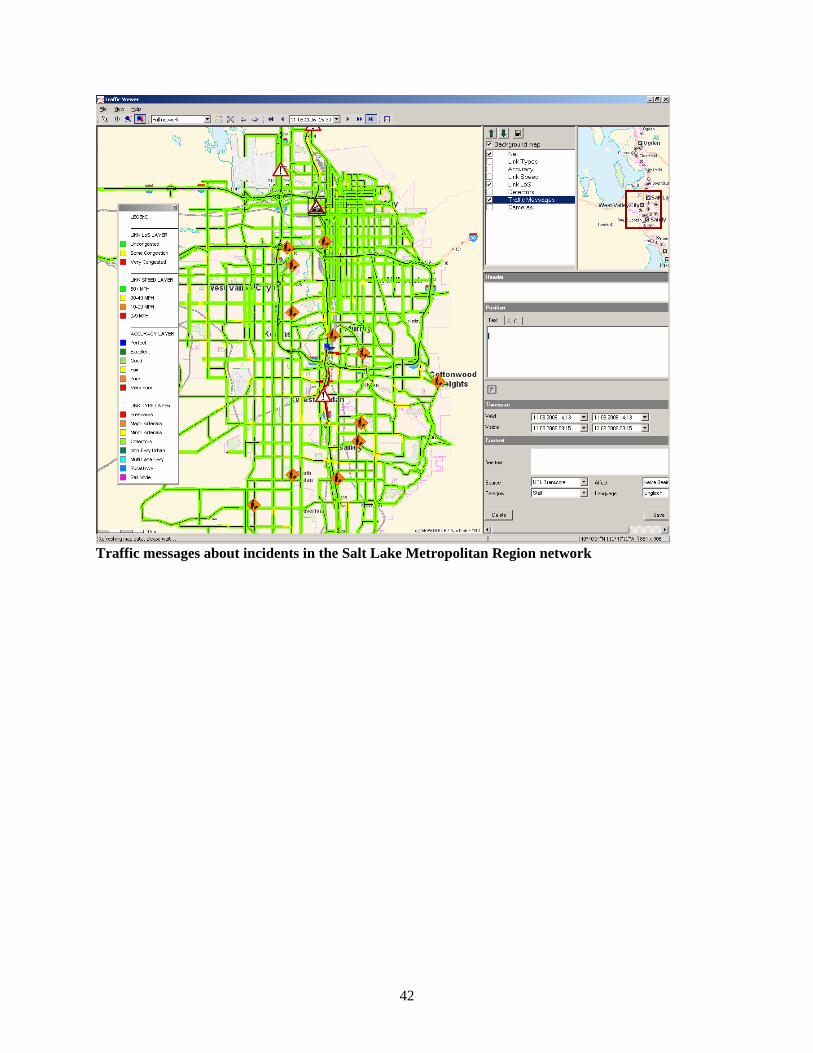
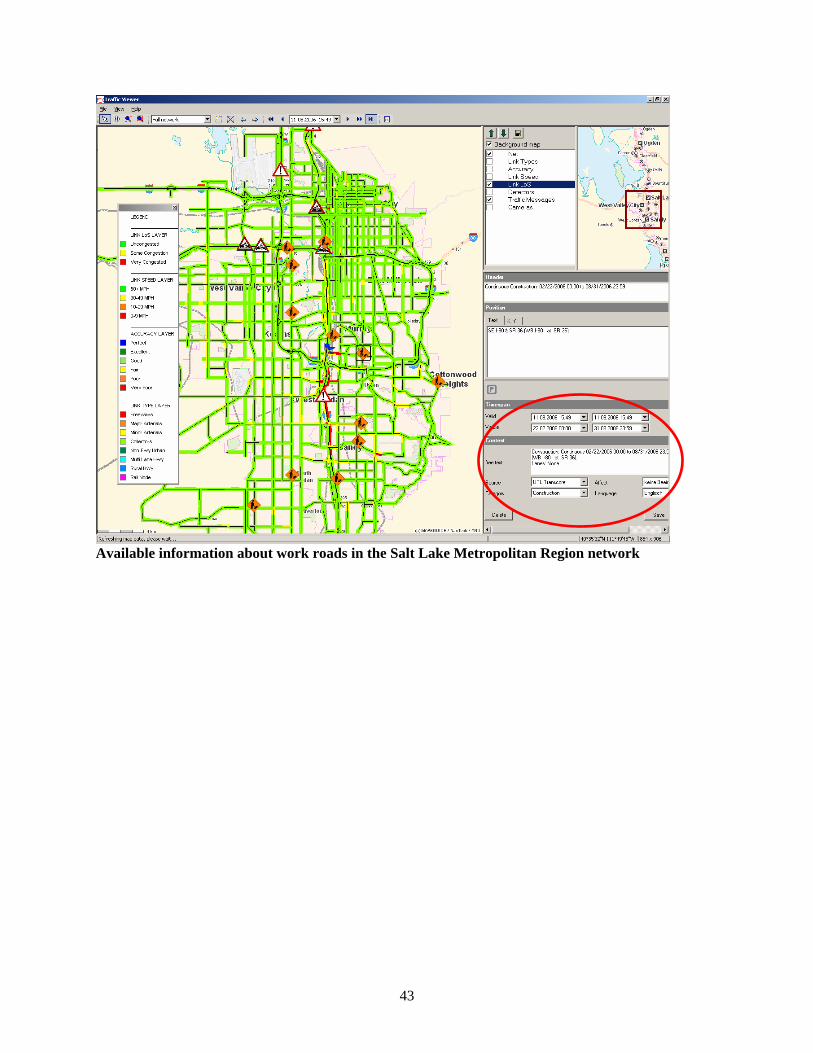
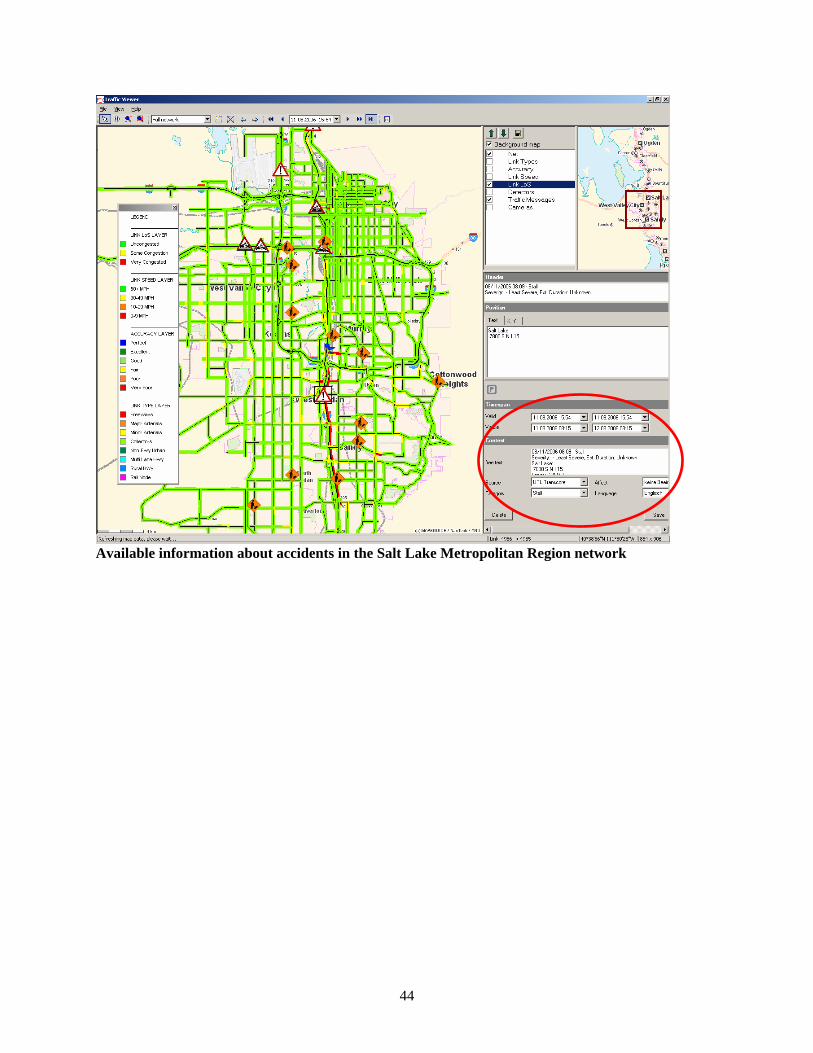
1 2 3 24 Source: PTV AG Figure 3.8 Model calibration 3.4.4 Visualization V-On uses the Traffic Viewer for visualization. It is a graphical user interface (GUI) built on top of the Traffic Management Framework (TMF). It displays incoming measurement data and information derived during data completion and forecasting. It uses information from the downloaded data, along with a graphical map, to represent current traffic conditions as well as future conditions. Traffic Viewer provides numerous functions for displaying various types of data (level of service [LOS]), volume, speed, position of detectors) about the road network. The user can customize what information will be displayed. TMF provides a filter function which enables a user to see only selected information or specific areas. Snapshots showing the Traffic Viewer interface for the Salt Lake Metropolitan Region and its capabilities are in Appendix A. eTMF Web Server/Interface is a web-based version of TMF Interface. eTMF is especially useful for travelers. Traffic Viewer can be upgraded with Advanced TMF Visualization, which will provide an opportunity to see time series plots about traffic conditions (speeds, volumes) and traffic messages on links. Advanced TMF also provides direct connection to the web cameras.
17
Google Earth/Map Interface provides a more realistic background image. Its photographic image enables users to easily navigate through the network. It also allows real-time visualization of V-On results in Google Earth KML format, which can be easily viewed with the free Google Earth client. 3.5 Benefits V-On can have at least six primary user groups (each deriving distinct benefits from V-On):
• TMCs can use V-On for real-time traffic management and control strategies, to observe current traffic conditions, and to predict future conditions. V-On is an excellent data source for traffic signal timing plan development. TMCs can expect reduced congestion as a result of better utilization of roadway capacity through optimum distribution over all alternative routes and/or peak spreading.
• Planners (for example, in local MPOs) can use V-On to evaluate the best transportation alternatives more reliably than traditional static traffic assignment techniques. In addition, they can use hourly calibrated OD matrices produced by V-On for their analyses.
• Researchers will be able to explore and develop innovative ITS strategies. They can use archived data to perform extensive statistical analyses that may lead to new discoveries.
• Traffic Engineers can use V-On to evaluate a variety of traffic control strategies (traditional or advanced ITS strategies) in a simulated environment.
• Travel Information Service Providers can translate predictive real-time traffic data into traveler information. Traveler information is useful for pre-trip planning (mode choice, departure time, route of the trip) and for directing an en-route vehicle to avoid a congested area.
• Travelers receive information supplied by Travel Information Service Providers or via the internet. For example, they can obtain precise arrival time (on-trip info) via the Short Message Service (SMS) for a small usage fee, or an estimated arrival time (free of charge via the Internet). V-On web-based service provides a single point of access for multi-modal and intermodal traveler information.

18
19
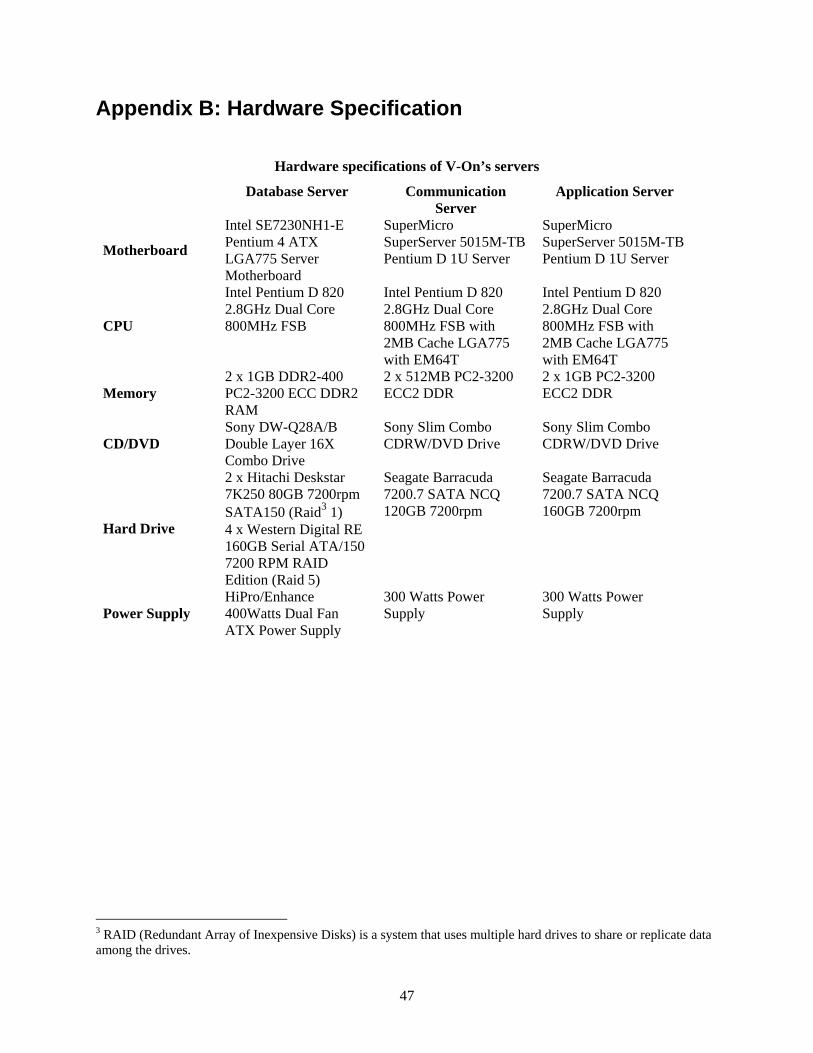
4. VISUM-Online Installation Since January 2006, the Planung Transport Verkehr (PTV) and UTL teams have worked together on the first North American installation of V-On. All of the obstacles that emerged during this project were overcome by a joint effort between PTV and UTL. These difficulties can serve as a lesson for future V-On installations. This section lists important facts regarding V-On installation at the UTL. This installation can be useful to UDOT if they eventually decide to install V-On. 4.1 Hardware requirements V-On is a complex system that consists of three separate servers, each with its own task:
• Database server • Communications server • Application server
The recommended hardware for the system includes separate computers for each server because each server requires substantial computing resources to complete its tasks. Hardware specifications are included in Appendix B. 4.2 Software Requirements The software required for V-On to function properly are:
• Oracle database • Oracle client – enables connection to the database • WinZip 8 or higher – archiving software • WinZip command line extension – enables data archiving as a background process • Microsoft .Net Framework 1.1 – compiler • Microsoft Data Access Components (MDAC) – a package of database drivers from Microsoft • for connecting client PCs to the server database • Traffic platform – for downloading data from the web server and transferring it to the database
Traffic Viewer enables visualisation of the data (current traffic conditions and estimated traffic conditions). This program is not mandatory. However, it was installed at the UTL because of its useful features (graphical representation of speeds, LOS, etc). At this point, only TMF Interface and Advanced TMF Visualization (e.g., time series plots, traffic messages) are functional.
20
4.3 Servers Configuration Oracle Client enables communication among servers and between the database server and any other computer in the network. Thus, it must be installed on all computers that will use the V-On system. 4.3.1 Database server The database server hosts the V-On database. Oracle Version 10.1.0.2 provides the standard functionality of Oracle for archiving, sorting, and retrieving data. The Oracle database software should not be installed directly from compact discs (CDs), but the content of CDs should be stored in the temporary directories (e.g., D:\tmp\CD1, D:\tmp\CD2, D:\tmp\CD3) on the hard disk or a network drive. Otherwise, potential read errors or related setup errors, or even cancellation of the whole setup process, can occur. The Oracle Database Configuration Assistant helps in creating the database entity. A user name and password are created during database configuration. A user name and password will connect other servers to the database. The installation procedure is intuitive because parameters are set up by default. Oracle NET Listener is a type of software within Oracle that enables other computers to connect to the database server by telling the database server to “listen” to the network and allow the new computer to access the database. 4.3.2 Application Server Before installing V-On, the following software has to be installed on the application server:
• Oracle Client 10.1.0.2 (administrator version) • WinZip 8 or higher • WinZip command line extension • Microsoft .Net Framework 1.1 • MDAC • Open Database Connectivity (ODBC) protocol – used to access the Oracle database
The application server hosts the detector analysis and forecasting procedures. In other words, V-On modules (18) operate on the application server. Some of these modules include:
• System Monitor – starts, monitors, and terminates all V-On services.
• System Configurator – starts or terminates individual services.
• Database Archiver – copies data to the archive database. After zipping archived data, it deletes the archived data records from the original and archived database.
• File Archiver – compresses, shifts, copies, or deletes files.
• Detector Aggregator – has three functions: spatial data aggregation, temporal data aggregation to time intervals of 5, 15, and 60 minutes, and generating a raw time series for time series clustering and forecast based on the clustered time series. Currently, the Data Aggregator in the UTL performs all of its functions except the functions related to forecasting. It is expected to become fully operable in the near future.

21
• MONET Data Completer – offers a multitude of complex functions (the functions are described in the section about data completion).
The processes listed are currently operable at the UTL. More processes will become available as V-On installation continues. 4.3.3 Communication server A communications server manages all of the data exchange from and to the database, e.g., receives detector data, reformats them, and writes them to the database.
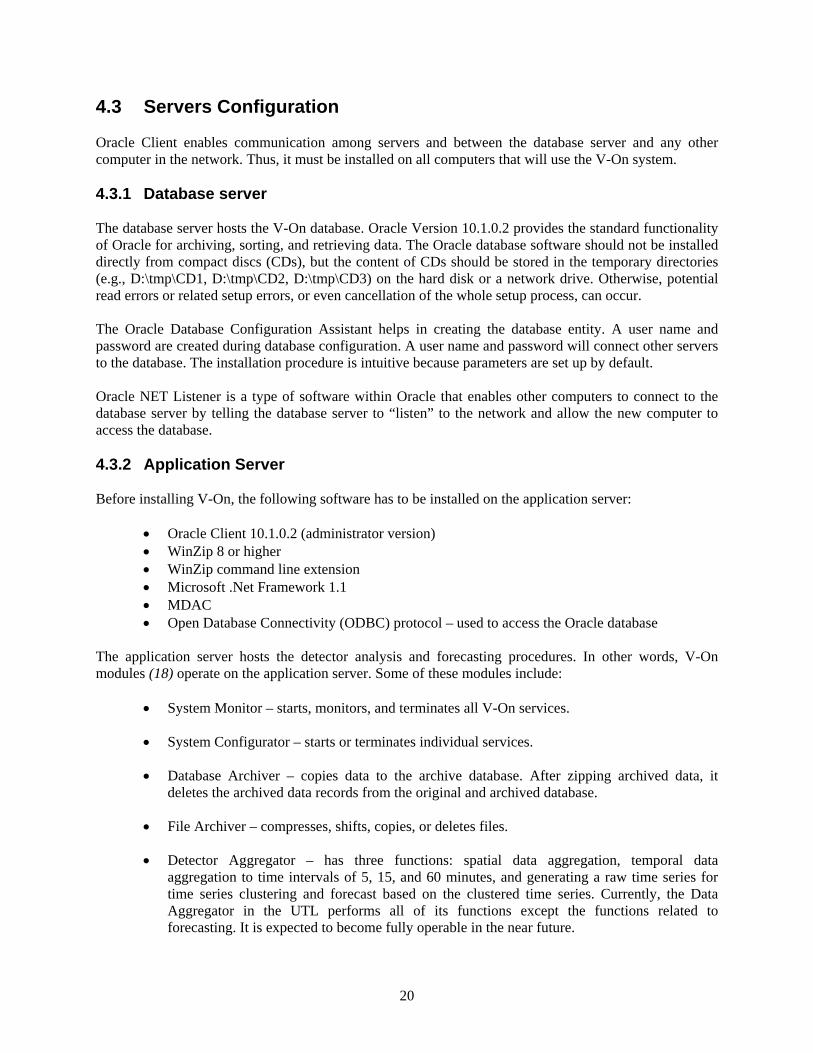
The most important advantage of using an XML Web service is that it can be accessed by any system that uses Internet standards (XML and Hypertext Transfer Protocol [HTTP]). By using an XML Web service for transmitting data, both the client and the service provider only need knowledge about inputs, outputs, and location. The UTL’s version of V-On uses the OP_ShareTrafficDetectorData method (19) interface for transmitting dynamic traffic data through the SOAP interface. The Traffic Importer uses a Jboss Java importer to download data from the web server database. Downloaded data are in the XML format and include information about traffic conditions in the region. Data are stored and archived on the database server. Jboss downloads XML files from the web server every 20 seconds. Using this tool, UTL has already downloaded almost six months of data. V-On will use the archived data for short- and long-term forecasting. An XML string contains the following data:
• network-id • start-time • measurement-duration • station-id • lane-vehicle-count (for detectors that support volume counts) • occupancy (for detectors that supply occupancy) • lane-vehicle-speed
22
Figure 4.1 XML file configuration
Figure 4.1 is a part of the XML file which contains information about current traffic counts from detectors. 4.4 LOS calculation V-On can use three different methods for calculating level of service (LOS) (18). The system in the UTL uses the Siemens LOS Calculator. LOS is reported through the volume/capacity (v/c) ratio as defined in Table 4.1. Table 4.1 LOS determined by vehicle occupancy Occupancy LOS Display Colour 0.000 - 0.799 0 Green 0.800 – 1.349 1 Yellow 1.350 – 9,999 2 Red Otherwise 3 –

23
Like other features in V-On, it is possible to change the method of calculating LOS. For example, V-On can calculate and display LOS according to the Highway Capacity Manual (HCM) (20) definition, which is more commonly used in practice. 4.5 Installation Progress The next section discusses V-On features that would be useful to UDOT personnel and have already been installed. A complete list of V-On’s features, completion status, and the annual PTV license prices are found in Appendix C. The road network of the Salt Lake Metropolitan Region and traffic data, collected from the detectors and stored in a database, can be used for transportation planning. A V-On store collected data from detectors and then aggregated the detector data for the links. This data is propagated to the entire network. In addition to manipulating raw detector data, V-On also saves VISUM version files every five minutes. Those files can be used to analyze a traffic condition in detail for any particular time of day or to estimate a future condition. Using version files from V-On instead of always using the same VISUM model will produce more robust and accurate results. Traditionally, different OD matrices are used only for peak periods, and the traffic volumes for every other hour during the day are assumed to be equal. On the contrary, V-On gives hourly OD matrices that can be used for more detailed transportation planning. For a quick overview of traffic conditions, text output files can help analyze link speeds and volumes. Currently, the TMF interface works similarly to UDOT’s Commuter link. It displays speeds, shows messages about incidents and constructions, gives access to cameras, etc. V-On performs the same tasks for all of the links on the detailed road network, not just for freeways and major arterials. Thus, traffic operation personnel have better insight about their road network. Python script converts estimated data from TXT into a comma-separated values (CSV) format. The CSV format is easier to use for analysis.

24

25
5. Initial VISUM-Online Evaluation V-On is still in the implementation process at the UTL. The first evaluation of V-On’s capability in predicting field traffic data is performed in conjunction with the installation of some of the V-On features. This initial evaluation is intended to help in calibrating V-On. Since V-On is a complex system, a lot of care and effort is necessary for proper calibration. Calibrating the original OD matrices must be a joint effort between the PTV and UTL teams. PTV knows how the system works in detail, while UTL researchers have dealt with local traffic conditions for years. Therefore, the UTL can help the PTV team understand the specifics of the Salt Lake Metropolitan Region network. UTL researchers also conduct necessary statistical analyses that help establish where problems occur. The accuracy of the estimation and prediction procedures will be based on how well the V-On system output compares with the real data. Hourly volumes have been chosen as the measure of effectiveness (MOE) for evaluating V-On. The idea is to compare volumes from the V-On with the field-measured volumes for the same links and for the same time period. The ideal case scenario would consist of field data collection for various time periods (e.g., AM-peak, PM-peak, Off-peak, Friday PM-peak outbound, Sunday afternoon peak inbound). Also, the study area would be divided into sections with different detection densities. However, it is good to start with laboratory tests since field tests are time and money consuming. When the laboratory tests show good results, then one can proceed with field data collection. Therefore, a substitute was used for the field data. As a substitute, the Average Annual Daily Traffic (AADT) from the local MPO, WFRC, for the year 2004 was used. A number of obstacles were dealt with in order to use this data, which is a common occurrence when working with raw data. The first obstacle overcome was matching valid links from V-On with those from the WFRC. Only 3,177 links, out of more than 12,000, could be used for comparison. Most of the other links did not have any AADT data, or it was impossible to find matching links in the V-on network. The second obstacle was converting available daily traffic to hourly volumes. Ideally, 15-minute volumes (or even 5-minute volumes) would be compared instead of hourly volumes because V-On gives volumes every 5 minutes. However, it was challenging enough converting daily volumes to hourly volumes, and by dividing volumes into smaller time slices the possibility of error could have increased. In order to assign hourly volumes from daily volumes, we used results from the 1996 data collection that we had for 37 stations. However, only 24 of those 37 stations exist in V-On. We did not use volumes from 1996 because the data is too old and would not represent current conditions. Those volumes were only used to calculate hourly coefficients. For example, the hourly coefficient for the period from 7 to 8 o’clock is: Hourly coefficient 7-8 = (Volume 7-8) / (Volume 0-24) The end result of the calculation was 24×24×7 hourly coefficients – for every station, for every hour, and for all seven days of the week. By multiplying those coefficients with AADT for a particular day, we were able to produce hourly volumes (“field volumes”).

26
5.1 Results First, we compared the daily volumes from V-On with AADT in order to create a broad picture of how V-On volumes fit into the field data. We used volumes just for one day in the week − Thursday. The reason we chose just one day is that volumes were very similar compared to other weekdays. We excluded Monday and Friday as non-representative days for analysis.
y = 1.7109x + 0.6325R2 = 0.7257
0
50
100
150
200
250
0 20 40 60 80 100 120
Volume from VISUM Online (thousand veh/h)
Volu
me
from
AA
DT
(thou
sand
veh
/h)
Figure 5.1 Coefficient of correlation between volumes from V-On and from AADT Figure 5.1 shows a comparison of daily volumes. The regression line, its equation and coefficient of correlation, are also shown in Figure 5.1. Volumes from V-On are approximately 40% less than the values calculated from AADT. One link was selected to show a possible procedure for calibrating V-On. This is a very detailed and in-depth procedure. When analyzing large networks, this procedure should only be applied to selected links and not for all links in the network. Links can be selected on various bases, e.g., the links that produce the highest difference between field-measured volumes and volumes from the model, or links from the specific spatial area (the arterial used by locals to avoid congestion). We used a link on I-15−5900 South overpass, that has a detector on it.

27
0
2,000
4,000
6,000
8,000
10,000
12,000
14,000
0-1
1-2
2-3
3-4
4-5
5-6
6-7
7-8
8-9
9-10
10-1
1
11-1
2
12-1
3
13-1
4
14-1
5
15-1
6
16-1
7
17-1
8
18-1
9
19-2
0
20-2
1
21-2
2
22-2
3
23-2
4
Time of day (h)
Volu
me
(veh
/h)
VISUM Onlinefield volumes
Figure 5.2 Volumes from V-On and from AADT for Station 347 North
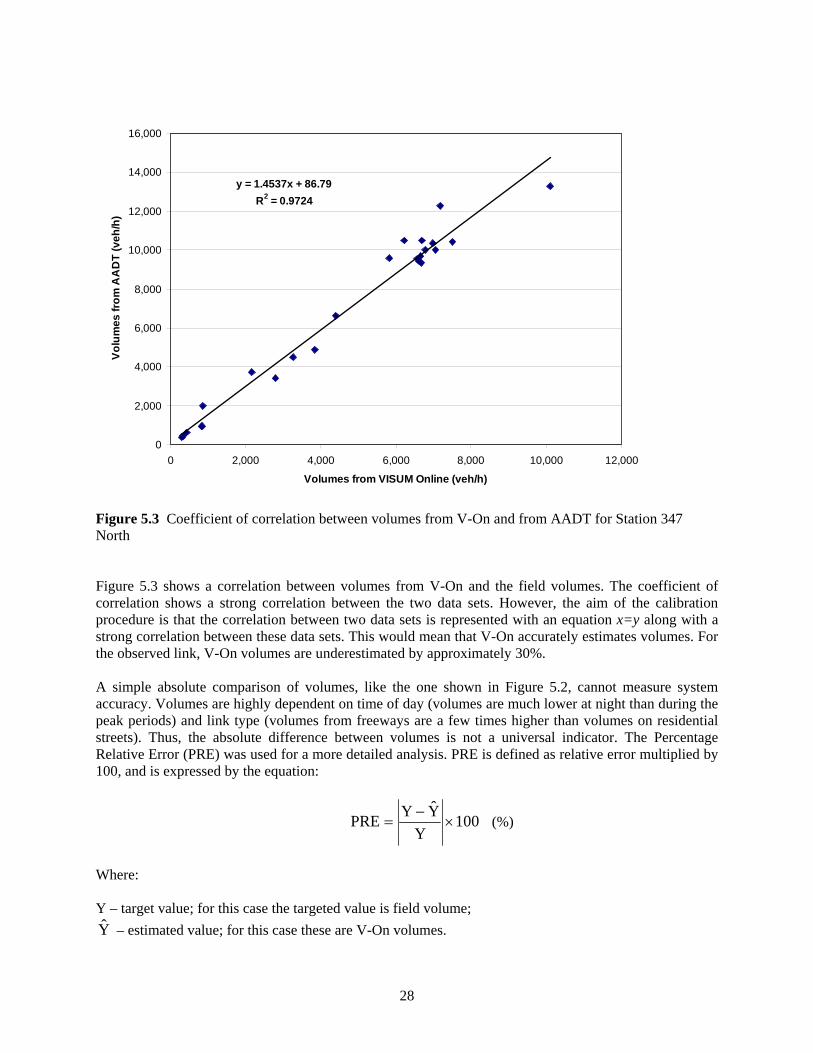
Figure 5.2 shows the first step in the analysis: a comparison of volumes from V-On with field volumes on the observed link for the whole day. By looking only at Figure 5.2, one would conclude that V-On gives accurate volumes for the night hours (from midnight until 6 a.m.). For the morning peak period, volumes are lower in V-On than they were in the field measurement, but the shape corresponds to the shape of field volumes.
28
y = 1.4537x + 86.79R2 = 0.9724
0
2,000
4,000
6,000
8,000
10,000
12,000
14,000
16,000
0 2,000 4,000 6,000 8,000 10,000 12,000
Volumes from VISUM Online (veh/h)
Vol
umes
from
AA
DT
(veh
/h)
Figure 5.3 Coefficient of correlation between volumes from V-On and from AADT for Station 347 North Figure 5.3 shows a correlation between volumes from V-On and the field volumes. The coefficient of correlation shows a strong correlation between the two data sets. However, the aim of the calibration procedure is that the correlation between two data sets is represented with an equation x=y along with a strong correlation between these data sets. This would mean that V-On accurately estimates volumes. For the observed link, V-On volumes are underestimated by approximately 30%. A simple absolute comparison of volumes, like the one shown in Figure 5.2, cannot measure system accuracy. Volumes are highly dependent on time of day (volumes are much lower at night than during the peak periods) and link type (volumes from freeways are a few times higher than volumes on residential streets). Thus, the absolute difference between volumes is not a universal indicator. The Percentage Relative Error (PRE) was used for a more detailed analysis. PRE is defined as relative error multiplied by 100, and is expressed by the equation:
100Y
YYPRE ×−
= (%)
Where: Y – target value; for this case the targeted value is field volume; Y – estimated value; for this case these are V-On volumes.
29
0
10
20
30
40
50
60
0-1
1-2
2-3
3-4
4-5
5-6
6-7
7-8
8-9
9-10
10-1
1
11-1
2
12-1
3
13-1
4
14-1
5
15-1
6
16-1
7
17-1
8
18-1
9
19-2
0
20-2
1
21-2
2
22-2
3
23-2
4
Time of day (h)
PRE
(%)
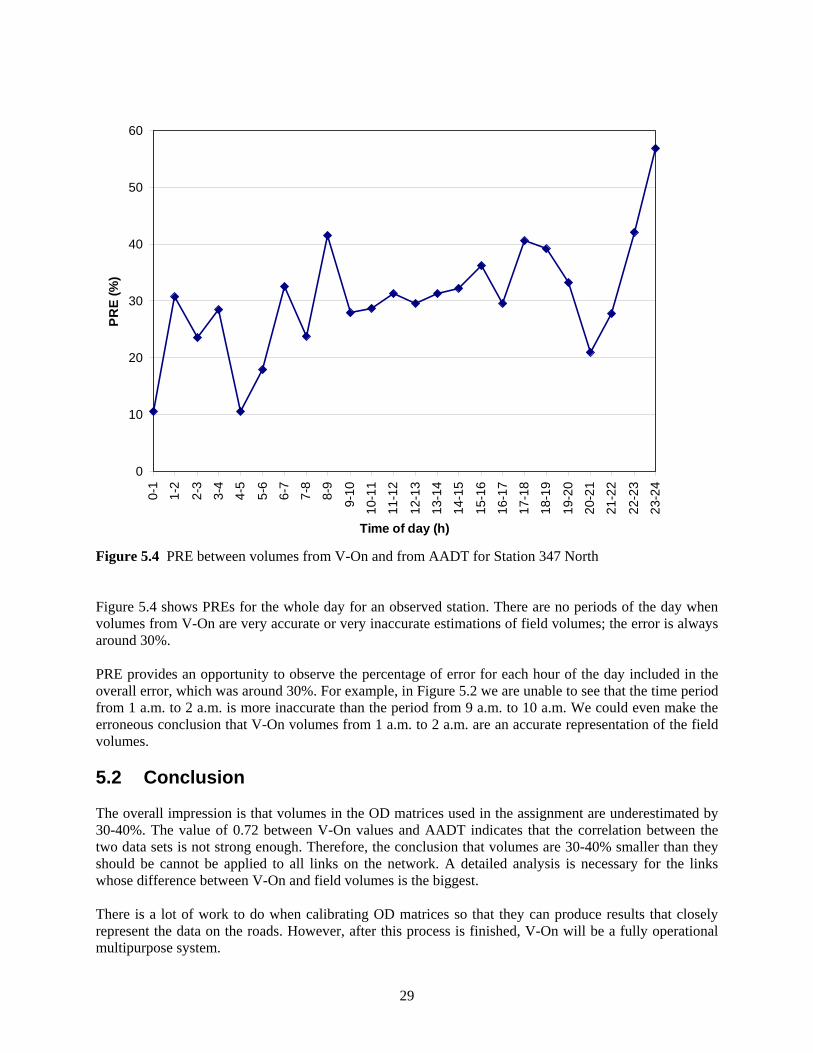
Figure 5.4 PRE between volumes from V-On and from AADT for Station 347 North Figure 5.4 shows PREs for the whole day for an observed station. There are no periods of the day when volumes from V-On are very accurate or very inaccurate estimations of field volumes; the error is always around 30%. PRE provides an opportunity to observe the percentage of error for each hour of the day included in the overall error, which was around 30%. For example, in Figure 5.2 we are unable to see that the time period from 1 a.m. to 2 a.m. is more inaccurate than the period from 9 a.m. to 10 a.m. We could even make the erroneous conclusion that V-On volumes from 1 a.m. to 2 a.m. are an accurate representation of the field volumes. 5.2 Conclusion The overall impression is that volumes in the OD matrices used in the assignment are underestimated by 30-40%. The value of 0.72 between V-On values and AADT indicates that the correlation between the two data sets is not strong enough. Therefore, the conclusion that volumes are 30-40% smaller than they should be cannot be applied to all links on the network. A detailed analysis is necessary for the links whose difference between V-On and field volumes is the biggest. There is a lot of work to do when calibrating OD matrices so that they can produce results that closely represent the data on the roads. However, after this process is finished, V-On will be a fully operational multipurpose system.

30
31
6. Proposed Future Work Data propagation for current and future traffic conditions is a unique feature that only V-On has. PTV and UTL teams have to do more work on calibrating OD matrices because accurate OD matrices are the basis for further development. The calibration process requires data collection from various sites and from various times of day. Detailed statistical tests for comparing the results from V-On with field data have to follow data collection. After V-On is calibrated, its unique possibility to propagate data along the whole network for current and future conditions will become fully functional. For example, UDOT would have speeds and travel times not just for freeways, but also for all roads. Moreover, those travel times would not be based only on the current average speed, but on expected speeds when a certain vehicle comes to that particular link. This information would be easily accessible by both TMC personnel and travelers. A web version of TMF will give access to all of the useful features of TMF to road users. Sometimes information about traffic conditions on minor arterial streets is more important to road users than information about traffic conditions on freeways. For example, information about an incident on a minor arterial street that some travelers use to access the freeway is valuable because it tells travelers that they should find an alternative route. Travelers do not benefit from knowing the speed on the freeway if they cannot access it. It seems that the most interesting features of V-On are those which provide short- and long-term forecasting; not because they will provide expected travel time, but because V-On will provide that information for all links on the network. Moreover, because V-On is sensitive to real-time traffic messages, it is able to incorporate all incidents into its calculations. Thus, calculated travel times will not be based on current speeds, but on expected speeds because all delays caused by accidents or road work will be added. UDOT currently displays expected travel times on variable message signs (VMS) along the freeways, and is planning to expand this to arterials. V-On will enable accurate travel time calculations for all links on the network. Hourly calibrated OD matrices and calibrated network files are especially useful in transportation planning. Installation of more V-On processes would provide more useful features, such as:
• A Detector Management module, which will enable user-friendly editing and creating of the detectors.
• A time-series Cluster - necessary for forecasting procedure.
• A MONET Exporter - useful to UDOT personnel because it converts estimated data from TXT into XML format. UDOT is already using downloaded data from detectors in XML format, and it is a good practice to keep all data archived in the same format. Also, their personnel are familiar with XML format.
Furthermore, V-On will help cut the costs of data collection. Instead of paying a number of people to stand on the streets, UDOT personnel will be able to retrieve various pieces of information from the V-On database. Furthermore, when using V-On, it is possible to customize reports – every UDOT section can create a report which is customized to meet specific needs. Thus, the information relevant only to that section can be displayed.

32

33
References
1. Archived Data Management Systems, A Cross-Cutting Study, Linking Operations and Planning Data. Publication FHWA-JPO-05-044. FHWA, U.S. Department of Transportation, 2005.
2. Dahlgren, J., S. Turner, R. C. Garcia. Collecting, Processing, Archiving and Disseminating Traffic Data to Measure and Improve Traffic Performance. Presented at 81st Annual Meeting of the Transportation Research Board, Washington, D.C., 2002.
3. Ben-Akiva, M., M. Bierlarire, H. Koutsopoulos and R. Mishalani. DynaMIT: a simulation-based system for traffic prediction. Presented at the DACCORD Short Term Forecasting Workshop, Delft, The Netherlands, 1998.
4. Mahmassani, H. S., X. Qin and X. Zhou. DYNASMART-X Evaluation For Real-Time TMC Application: Irvine Test Bed. Maryland Transportation Initiative, University of Maryland, College Park, Maryland, 2004. http://www.dynasmart.umd.edu/documents/1.5B-Irvine_REPORT.pdf. Accessed July 27, 2006.
5. Federal Highway Administration, U.S. Department of Transportation. Potential Projects for 2006. TMC Update, Vol. 1, No. 2, 2005.
6. Mehta, M. Design and Implementation of an Interface for the Integration of DynaMIT with the Traffic Management Center. MS thesis, Massachusetts Institute of Technology, Cambridge, MA, 2001.
7. Park B. B., B. L. Smith, J. Lee, D. Pampati, M. Ben-Akiva and R. Balakrishnan. Evaluation of DynaMIT – A Prototype Traffic Estimation and Prediction System. Report Number UVACTS-15-11-71. Center for Transportation Studies, University of Virginia, Charlottesville, VA, 2006.
8. Utah Department of Transportation. http://www.commuterlink.utah.gov/ie.htm. Accessed July 30, 2006.
9. Georgia Department of Transportation. http://www.georgia-navigator.com/. Accessed July 30, 2006.
10. Traffic.com, Inc. http://www.traffic.com/. Accessed July 30, 2006.
11. Vortisch, P., Estimating Real-Time Urban Traffic States in VISIM-Online – Methodology, PTV AG, Karlsruhe. 2005.
12. VISUM-Online: Traffic Flow Prediction for Transportation Management Centers – System Architecture. PTV AG and Innovative Transportation Concepts, LLC, 2001.
13. SITRAFFIC MONET, Siemens AG, Munich, 2003, http://www.siemens.fi/CMStswww.nsf/B03A0266B0D8E9BAC225700E00377C37/$file/detail_verkehrstelematik_monet_en.pdf. Accessed July 27, 2006.
34
14. Vortisch, P. Use of PTV-Software in the traffic management centre (VMZ) Berlin. Presented at the 11th PTV Vision User Group Meeting, Berlin, Germany, 2001
15. Bauer, T. ITS Innovative Idea Program-VISUM-online Proposal. Prepared for Minnesota Department of Transportation / Minnesota Guidestar. PTV America, Inc. March 2004.
16. PTV Vision, VISUM Online – the Intelligent Traffic Platform. http://www.english.ptv.de/download/traffic/software/Visum-Online_Einleger_2005_e.pdf. Accessed July 27, 2006.
17. Anderson, D. A., D. J. Sweeney, and T. A. Williams, Statistics for Business and Economics, Sixth Edition. West Publishing Company, St. Paul, MN, 1996.
18. PTV AG, VISUM Online 1.1. PTV Documentation, 2005.
19. TransSuite ATMS Data Sharing Subtask 3.2.6. Interface Specification, TransCore. Prepared for Utah Department of Transportation, 2005.
20. Highway Capacity Manual (Transportation Research Board, Washington, D.C., 2000)

35
Appendix A: Traffic Viewer
Salt Lake Region network
36
LOS in the Salt Lake Metropolitan Region network
37
Detectors in the Salt Lake Metropolitan Region network
38
Speeds in the Salt Lake Metropolitan Region network

39
Road type in the Salt Lake Metropolitan Region network
40
Additional information about links in the Salt Lake Metropolitan Region network
41
Plot showing traffic condition on a link in the Salt Lake Metropolitan Region network
42
Traffic messages about incidents in the Salt Lake Metropolitan Region network
43
Available information about work roads in the Salt Lake Metropolitan Region network
44
Available information about accidents in the Salt Lake Metropolitan Region network
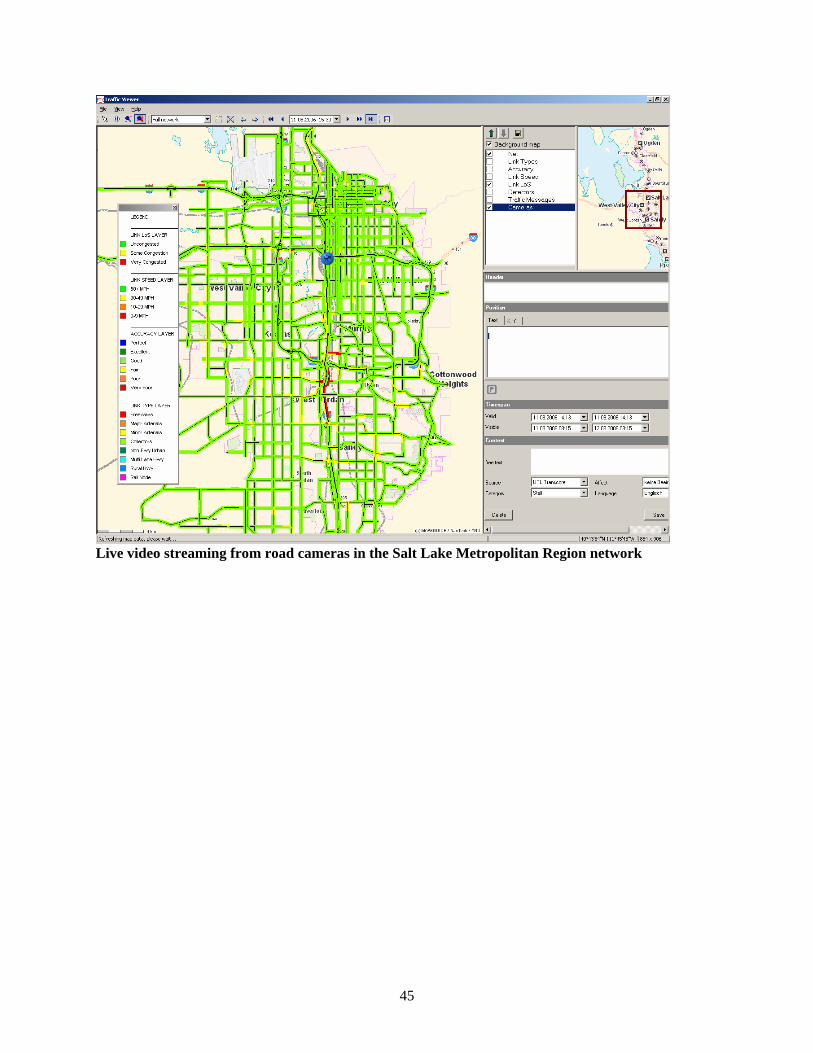
45
Live video streaming from road cameras in the Salt Lake Metropolitan Region network

46
47
Appendix B: Hardware Specification
Hardware specifications of V-On’s servers
Database Server Communication Server
Application Server
Motherboard
Intel SE7230NH1-E Pentium 4 ATX LGA775 Server Motherboard
SuperMicro SuperServer 5015M-TB Pentium D 1U Server
SuperMicro SuperServer 5015M-TB Pentium D 1U Server
CPU
Intel Pentium D 820 2.8GHz Dual Core 800MHz FSB
Intel Pentium D 820 2.8GHz Dual Core 800MHz FSB with 2MB Cache LGA775 with EM64T
Intel Pentium D 820 2.8GHz Dual Core 800MHz FSB with 2MB Cache LGA775 with EM64T
Memory 2 x 1GB DDR2-400 PC2-3200 ECC DDR2 RAM
2 x 512MB PC2-3200 ECC2 DDR
2 x 1GB PC2-3200 ECC2 DDR
CD/DVD Sony DW-Q28A/B Double Layer 16X Combo Drive
Sony Slim Combo CDRW/DVD Drive
Sony Slim Combo CDRW/DVD Drive
2 x Hitachi Deskstar 7K250 80GB 7200rpm SATA150 (Raid3 1)
Hard Drive 4 x Western Digital RE 160GB Serial ATA/150 7200 RPM RAID Edition (Raid 5)
Seagate Barracuda 7200.7 SATA NCQ 120GB 7200rpm
Seagate Barracuda 7200.7 SATA NCQ 160GB 7200rpm
Power Supply HiPro/Enhance 400Watts Dual Fan ATX Power Supply
300 Watts Power Supply
300 Watts Power Supply
3 RAID (Redundant Array of Inexpensive Disks) is a system that uses multiple hard drives to share or replicate data among the drives.

48
49
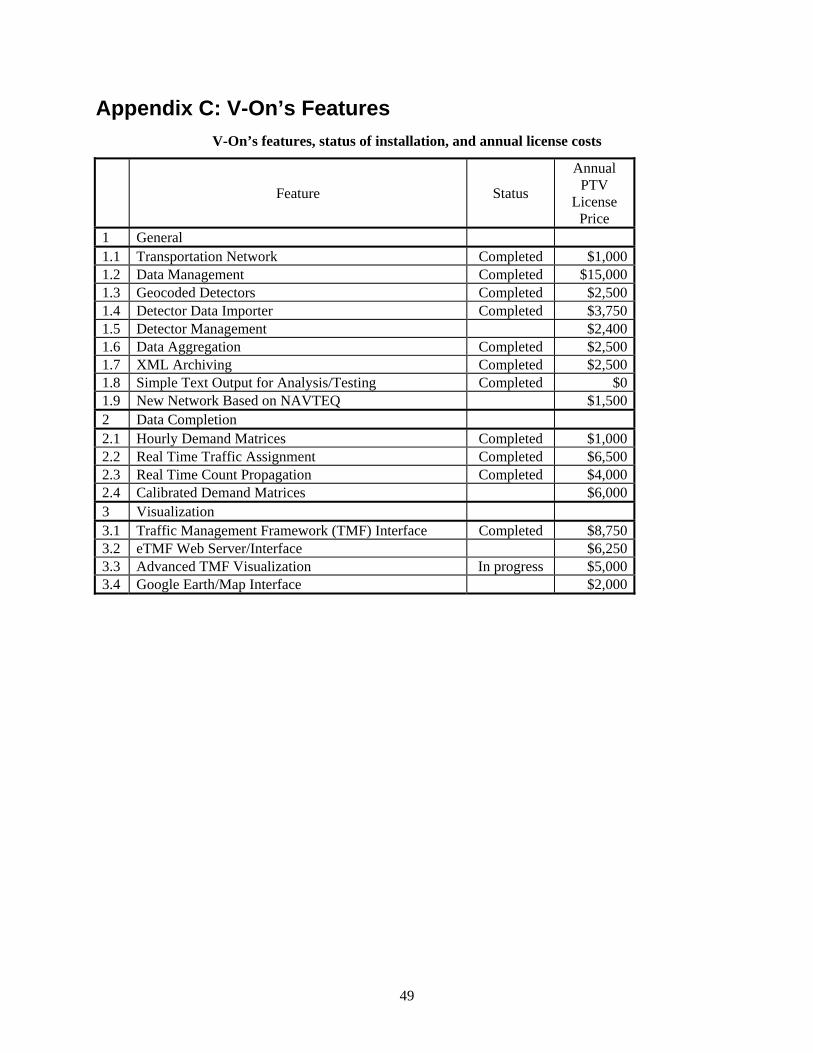
Appendix C: V-On’s Features V-On’s features, status of installation, and annual license costs
Feature Status
Annual PTV
License Price
1 General 1.1 Transportation Network Completed $1,000 1.2 Data Management Completed $15,000 1.3 Geocoded Detectors Completed $2,500 1.4 Detector Data Importer Completed $3,750 1.5 Detector Management $2,400 1.6 Data Aggregation Completed $2,500 1.7 XML Archiving Completed $2,500 1.8 Simple Text Output for Analysis/Testing Completed $0 1.9 New Network Based on NAVTEQ $1,500 2 Data Completion 2.1 Hourly Demand Matrices Completed $1,000 2.2 Real Time Traffic Assignment Completed $6,500 2.3 Real Time Count Propagation Completed $4,000 2.4 Calibrated Demand Matrices $6,000 3 Visualization 3.1 Traffic Management Framework (TMF) Interface Completed $8,750 3.2 eTMF Web Server/Interface $6,250 3.3 Advanced TMF Visualization In progress $5,000 3.4 Google Earth/Map Interface $2,000

50
V-On’s features, status of installation, and annual license costs - Continued
Feature Status
Annual PTV
License Price
4 Forecasting 4.1 Short-Term Forecaster $12,500 4.2 Dynamic Routing $6,500 5 Messages 5.1 Traffic Message Importer Completed $3,750 5.2 Traffic Message Management In progress $8,750 5.3 Data Completion Sensitivity $2,500 6 Count Management 6.1 Traffic Count Management Module $18,750 6.2 Custom Importers $12,500 6.3 Custom Reports $8,750 7 Databese 7.1 Queryable Oracle database Completed $xxx


![IEEE TRANSACTIONS ON PARALLEL AND DISTRIBUTED …. IP-Geolocation Mapping for... · Traditional IP-geolocation mapping schemes [14], [16], [17], [18] are primarily delay-measurement](https://img.pdfslide.us/doc/110x75/6009ca9b879ab56bc74495b5/ieee-transactions-on-parallel-and-distributed-ip-geolocation-mapping-for.jpg)