Embed Size (px)
Citation preview
Page 1 of 25
Designated Housing Plan
For the Boston Housing Authority
Date of Submission: April 29, 2015
Prepared By:
Boston Housing Authority 52 Chauncy Street Boston, MA 02111
Submitted To:
U.S. Department of Housing and Urban Development Office of Public and Indian Housing Public Housing Management and Occupancy Division Room 4208 451 7th Street, S.W. Washington, D.C. 20410
Page 2 of 25
I. Introduction
The Boston Housing Authority (“BHA”) last submitted a Designated Housing Plan (“DHP” or “Plan”) to
the U.S. Department of Housing and Urban Development (“HUD”) in 2007. HUD approved BHA’s DHP in
June 2007, as well as two subsequent two-year renewals in 2012 and 2014. This submission is meant to
replace BHA’s 2007 DHP.1
This Plan sets the percentage of elderly to non-elderly disabled residents at 80% elderly/20% non-elderly
disabled at all of BHA’s 36 federal elderly/disabled housing developments. The 165 wheelchair units at
these developments are not included in this Plan and will become undesignated if this Plan is approved.
In conjunction with the shift to 80% elderly/20% non-elderly disabled, BHA will make 300 Housing
Choice Vouchers available specifically for non-elderly disabled public housing applicants who otherwise
would have received unit offers. In addition, BHA will continue to award non-elderly disabled applicants
preference points for both family public housing and Housing Choice Voucher programs.
The decision to submit a new DHP is based primarily on three broad factors, all of which are supported
in greater detail throughout this Plan and its Exhibits:
1. Serving the growing need for affordable, age-appropriate housing among Boston’s low-income
elderly population;
2. Balancing the needs of the elderly, who have seen no increase in available units, with the non-
elderly disabled, who have seen an increase in available units due to a variety of programs and
preferences that place them ahead of standard elderly applicants; and
3. Aligning BHA’s elderly/non-elderly disabled percentages with HUD-approved designations across
the region and nation-wide to ensure adequate supply of housing for the elderly.
The Plan has been subject to a full public process with notice to the Resident Advisory Board, Local
Tenant Organizations, the Monitoring Committee, elected officials, advocates for the elderly and the
disabled, as well as a public hearing. Please see Exhibit A for additional details.
II. Background and Supporting Information
A. Justification for Designation
The Plan meets the needs of the low-income population of Boston by providing adequately for both the
elderly and non-elderly disabled based on population trends, emerging demand, and available
resources. This Plan is consistent with the City’s Consolidated Plan and recent publications.2 The Mayor’s
report, “Housing A Changing City – Boston 2030,” describes meeting the needs of seniors as “one of the
1 In preparing this Plan, BHA worked extensively with a pro bono firm, Valadus Consulting. Graphs created by Valadus are included throughout this Plan and more detailed presentations by Valadus are included in the Exhibits. 2 The City of Boston Consolidated Plan 2013-2018 has limited data on Boston’s elderly population and almost no data on the city’s non-elderly disabled population. For this reason, two recent City-affiliated reports, “Housing a Changing City” and “Aging in Boston,” are relied on extensively throughout this Plan for data and priorities. The Consolidated Plan is available at https://dnd.cityofboston.gov/#page/plans_report_notices.
Page 3 of 25
greatest challenges between now and 2030.”3 The report also identifies 5,739 low-income4 seniors who
are not in subsidized housing as “a priority for attention and action.”5 In addition, the Boston City
Council passed a unanimous resolution in support of this Plan on February 25, 2015. The following
section details the primary justifications for this Plan.
1. Boston’s elderly population is rapidly increasing in absolute and relative terms while the
disabled population is not significantly increasing.
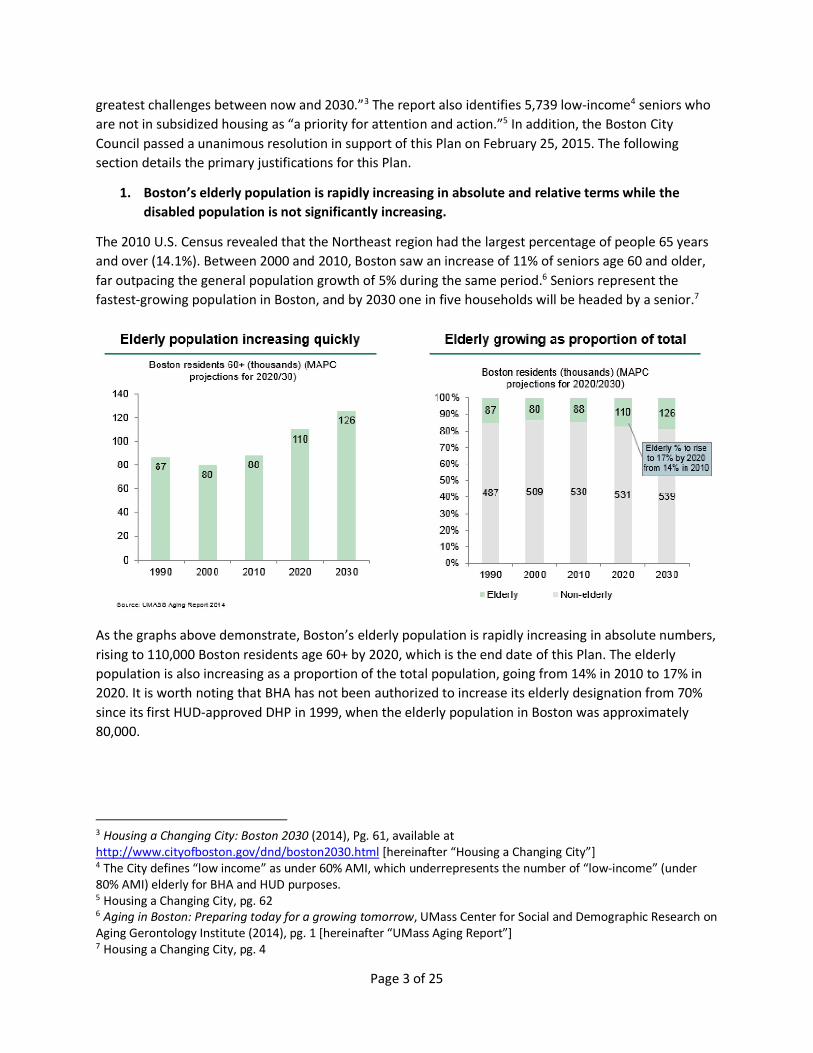
The 2010 U.S. Census revealed that the Northeast region had the largest percentage of people 65 years
and over (14.1%). Between 2000 and 2010, Boston saw an increase of 11% of seniors age 60 and older,
far outpacing the general population growth of 5% during the same period.6 Seniors represent the
fastest-growing population in Boston, and by 2030 one in five households will be headed by a senior.7
As the graphs above demonstrate, Boston’s elderly population is rapidly increasing in absolute numbers,
rising to 110,000 Boston residents age 60+ by 2020, which is the end date of this Plan. The elderly
population is also increasing as a proportion of the total population, going from 14% in 2010 to 17% in
2020. It is worth noting that BHA has not been authorized to increase its elderly designation from 70%
since its first HUD-approved DHP in 1999, when the elderly population in Boston was approximately
80,000.
3 Housing a Changing City: Boston 2030 (2014), Pg. 61, available at http://www.cityofboston.gov/dnd/boston2030.html [hereinafter “Housing a Changing City”] 4 The City defines “low income” as under 60% AMI, which underrepresents the number of “low-income” (under 80% AMI) elderly for BHA and HUD purposes. 5 Housing a Changing City, pg. 62 6 Aging in Boston: Preparing today for a growing tomorrow, UMass Center for Social and Demographic Research on Aging Gerontology Institute (2014), pg. 1 [hereinafter “UMass Aging Report”] 7 Housing a Changing City, pg. 4
Page 4 of 25
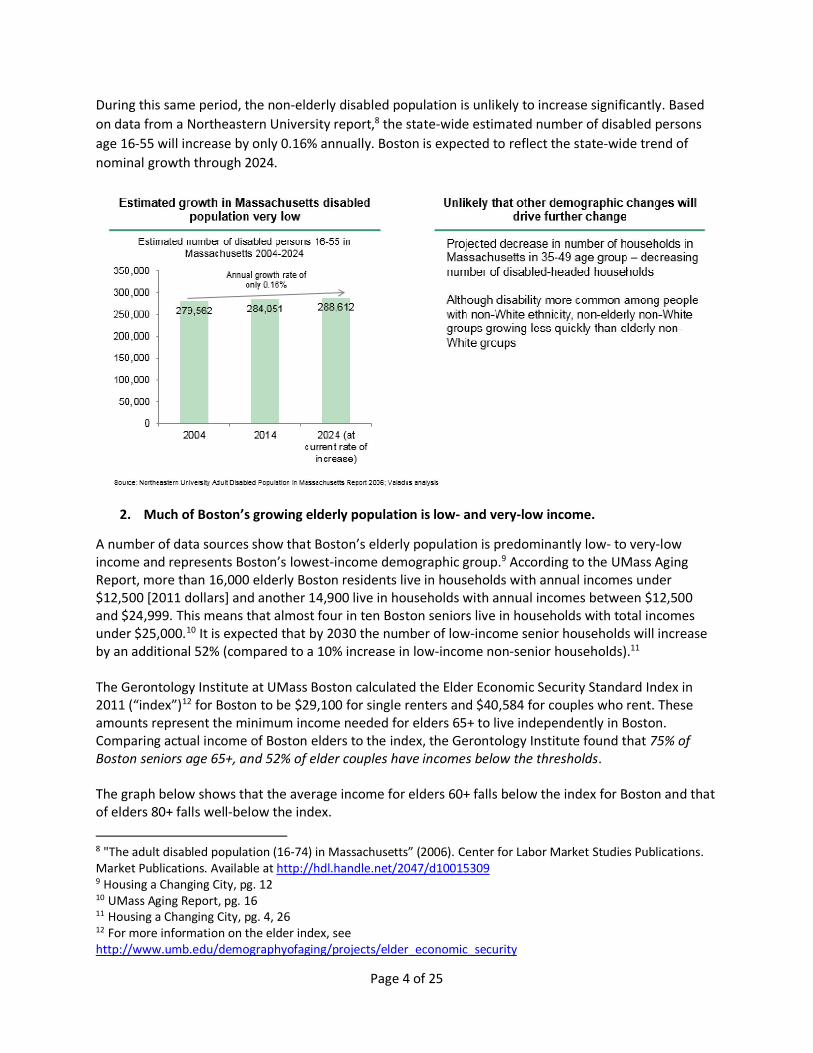
During this same period, the non-elderly disabled population is unlikely to increase significantly. Based
on data from a Northeastern University report,8 the state-wide estimated number of disabled persons
age 16-55 will increase by only 0.16% annually. Boston is expected to reflect the state-wide trend of
nominal growth through 2024.
2. Much of Boston’s growing elderly population is low- and very-low income.
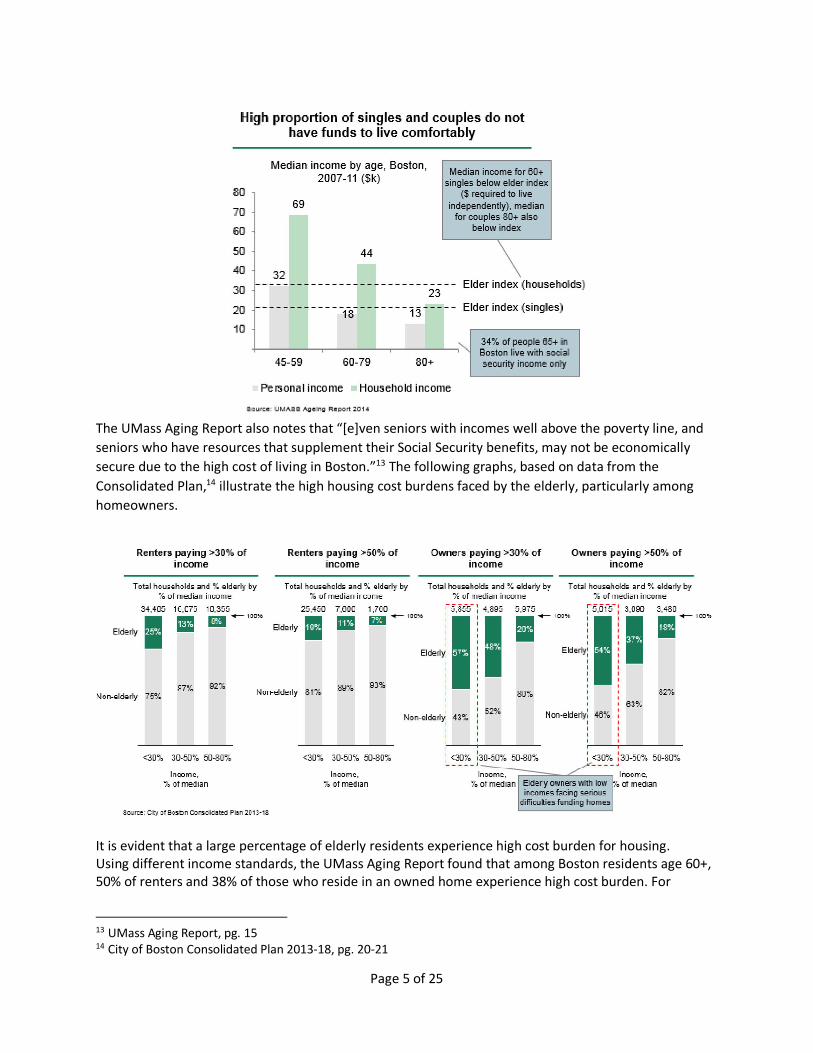
A number of data sources show that Boston’s elderly population is predominantly low- to very-low income and represents Boston’s lowest-income demographic group.9 According to the UMass Aging Report, more than 16,000 elderly Boston residents live in households with annual incomes under $12,500 [2011 dollars] and another 14,900 live in households with annual incomes between $12,500 and $24,999. This means that almost four in ten Boston seniors live in households with total incomes under $25,000.10 It is expected that by 2030 the number of low-income senior households will increase by an additional 52% (compared to a 10% increase in low-income non-senior households).11 The Gerontology Institute at UMass Boston calculated the Elder Economic Security Standard Index in 2011 (“index”)12 for Boston to be $29,100 for single renters and $40,584 for couples who rent. These amounts represent the minimum income needed for elders 65+ to live independently in Boston. Comparing actual income of Boston elders to the index, the Gerontology Institute found that 75% of Boston seniors age 65+, and 52% of elder couples have incomes below the thresholds. The graph below shows that the average income for elders 60+ falls below the index for Boston and that of elders 80+ falls well-below the index.
8 "The adult disabled population (16-74) in Massachusetts” (2006). Center for Labor Market Studies Publications. Market Publications. Available at http://hdl.handle.net/2047/d10015309 9 Housing a Changing City, pg. 12 10 UMass Aging Report, pg. 16 11 Housing a Changing City, pg. 4, 26 12 For more information on the elder index, see http://www.umb.edu/demographyofaging/projects/elder_economic_security
Page 5 of 25
The UMass Aging Report also notes that “[e]ven seniors with incomes well above the poverty line, and
seniors who have resources that supplement their Social Security benefits, may not be economically
secure due to the high cost of living in Boston.”13 The following graphs, based on data from the
Consolidated Plan,14 illustrate the high housing cost burdens faced by the elderly, particularly among
homeowners.
It is evident that a large percentage of elderly residents experience high cost burden for housing. Using different income standards, the UMass Aging Report found that among Boston residents age 60+, 50% of renters and 38% of those who reside in an owned home experience high cost burden. For
13 UMass Aging Report, pg. 15 14 City of Boston Consolidated Plan 2013-18, pg. 20-21
Page 6 of 25
individuals age 80 and over, 41% of owners and more than half of those who live in a rented home pay greater than 30% of their incomes for housing.15
3. Many of Boston’s elderly are also disabled and require units with universal design features,
particularly as they age in place.
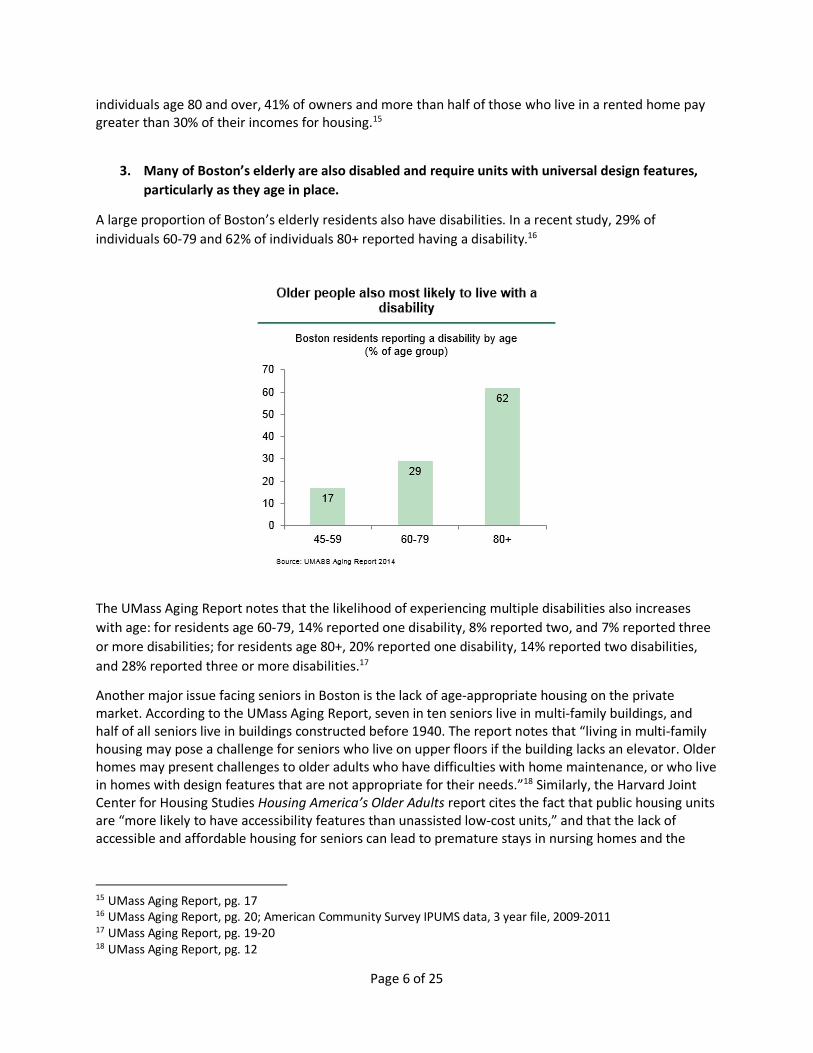
A large proportion of Boston’s elderly residents also have disabilities. In a recent study, 29% of
individuals 60-79 and 62% of individuals 80+ reported having a disability.16
The UMass Aging Report notes that the likelihood of experiencing multiple disabilities also increases
with age: for residents age 60-79, 14% reported one disability, 8% reported two, and 7% reported three
or more disabilities; for residents age 80+, 20% reported one disability, 14% reported two disabilities,
and 28% reported three or more disabilities.17
Another major issue facing seniors in Boston is the lack of age-appropriate housing on the private market. According to the UMass Aging Report, seven in ten seniors live in multi-family buildings, and half of all seniors live in buildings constructed before 1940. The report notes that “living in multi-family housing may pose a challenge for seniors who live on upper floors if the building lacks an elevator. Older homes may present challenges to older adults who have difficulties with home maintenance, or who live in homes with design features that are not appropriate for their needs.”18 Similarly, the Harvard Joint Center for Housing Studies Housing America’s Older Adults report cites the fact that public housing units are “more likely to have accessibility features than unassisted low-cost units,” and that the lack of accessible and affordable housing for seniors can lead to premature stays in nursing homes and the
15 UMass Aging Report, pg. 17 16 UMass Aging Report, pg. 20; American Community Survey IPUMS data, 3 year file, 2009-2011 17 UMass Aging Report, pg. 19-20 18 UMass Aging Report, pg. 12
Page 7 of 25
inability to return home after a hospital stay.19 The Harvard study cites accessible and well-located housing as critical for seniors with disabilities as it can determine whether they continue living independently or are forced to move to a nursing home.20 The unit features at many of BHA’s elderly/disabled developments are well-suited to a rapidly aging population. The universal design movement in housing focuses on five features that promote accessibility: no-step entry; single-floor living; extra-wide hallways and doors; accessible electrical controls; and lever-style handles on doors and faucets.21 Only 12% of homes in the northeast have three or more accessibility features, a far lower rate than any other region.22 In addition, recipients of HUD assistance age 65+ are “more likely to have chronic health conditions that require accessibility features and services.”23 The vast majority of BHA elderly/disabled units feature no-step entry, accessible hallways, doors, single-floor living, and electrical controls. BHA would like to allocate its units to those who need the unit features the most. The elderly or non-elderly disabled who need or will need such features should occupy these units, whereas the non-elderly disabled who do not require universal design features will be well served through Section 8 mobile vouchers, family public housing, and other available housing opportunities that provide options as to unit location and amenities. Those non-elderly disabled applicants who require a wheelchair unit will not be disadvantaged by this Plan; in fact, they are more likely to receive a unit offer once these units are undesignated.
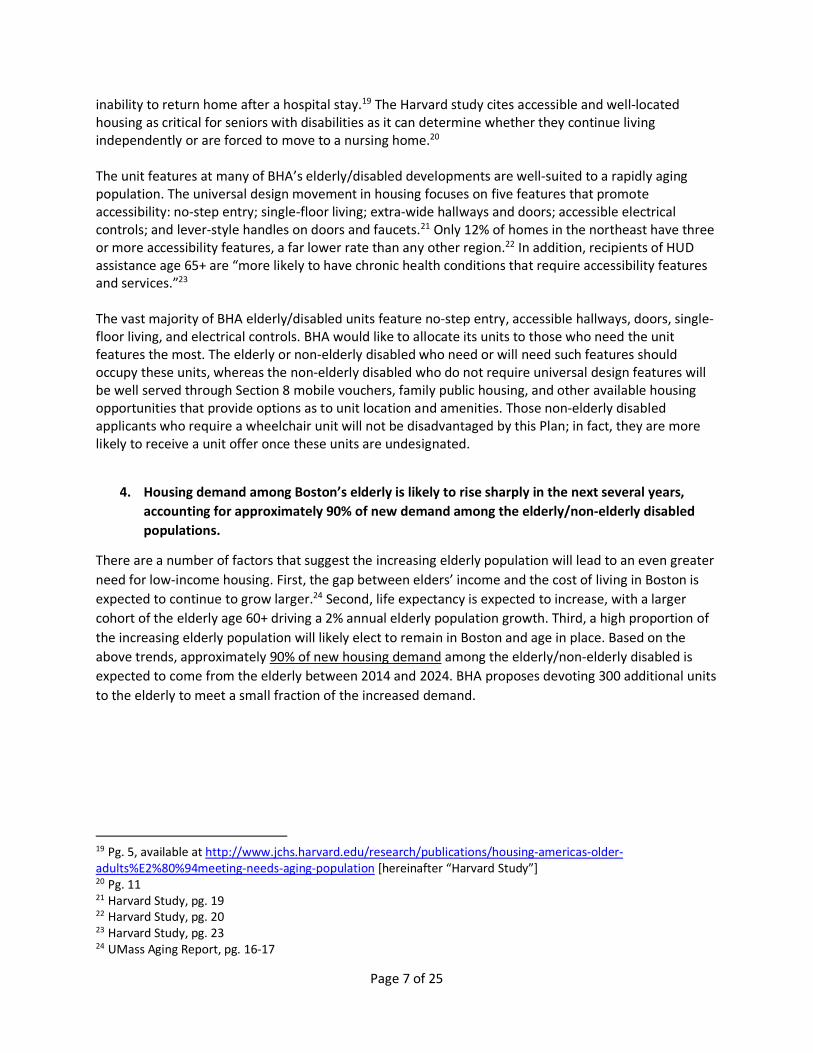
4. Housing demand among Boston’s elderly is likely to rise sharply in the next several years,
accounting for approximately 90% of new demand among the elderly/non-elderly disabled
populations.
There are a number of factors that suggest the increasing elderly population will lead to an even greater
need for low-income housing. First, the gap between elders’ income and the cost of living in Boston is
expected to continue to grow larger.24 Second, life expectancy is expected to increase, with a larger
cohort of the elderly age 60+ driving a 2% annual elderly population growth. Third, a high proportion of
the increasing elderly population will likely elect to remain in Boston and age in place. Based on the
above trends, approximately 90% of new housing demand among the elderly/non-elderly disabled is
expected to come from the elderly between 2014 and 2024. BHA proposes devoting 300 additional units
to the elderly to meet a small fraction of the increased demand.
19 Pg. 5, available at http://www.jchs.harvard.edu/research/publications/housing-americas-older-adults%E2%80%94meeting-needs-aging-population [hereinafter “Harvard Study”] 20 Pg. 11 21 Harvard Study, pg. 19 22 Harvard Study, pg. 20 23 Harvard Study, pg. 23 24 UMass Aging Report, pg. 16-17
Page 8 of 25
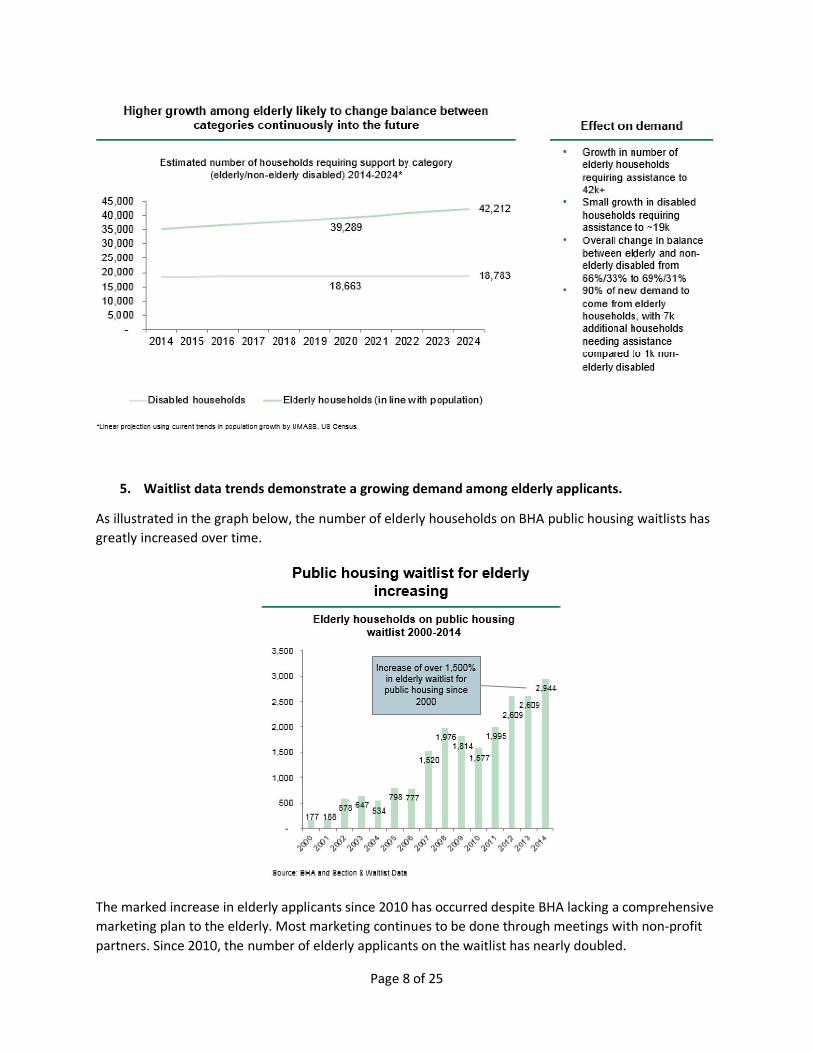
5. Waitlist data trends demonstrate a growing demand among elderly applicants.
As illustrated in the graph below, the number of elderly households on BHA public housing waitlists has
greatly increased over time.
The marked increase in elderly applicants since 2010 has occurred despite BHA lacking a comprehensive
marketing plan to the elderly. Most marketing continues to be done through meetings with non-profit
partners. Since 2010, the number of elderly applicants on the waitlist has nearly doubled.
Page 9 of 25
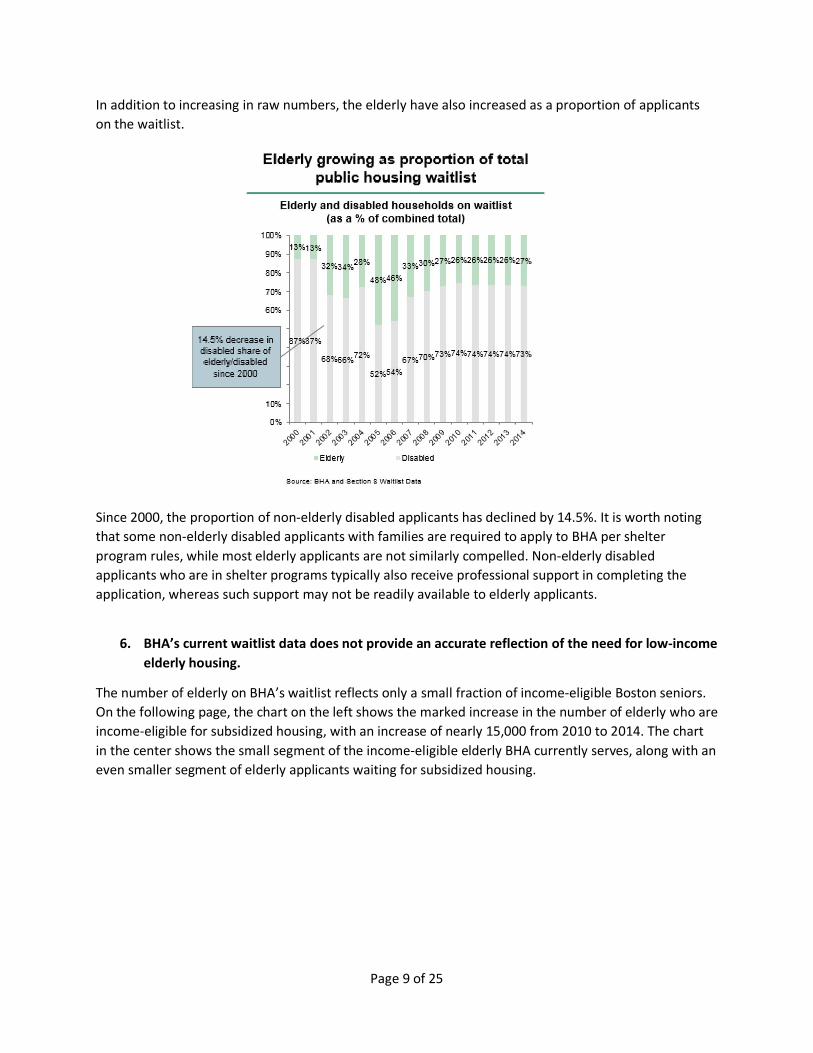
In addition to increasing in raw numbers, the elderly have also increased as a proportion of applicants
on the waitlist.
Since 2000, the proportion of non-elderly disabled applicants has declined by 14.5%. It is worth noting
that some non-elderly disabled applicants with families are required to apply to BHA per shelter
program rules, while most elderly applicants are not similarly compelled. Non-elderly disabled
applicants who are in shelter programs typically also receive professional support in completing the
application, whereas such support may not be readily available to elderly applicants.
6. BHA’s current waitlist data does not provide an accurate reflection of the need for low-income
elderly housing.
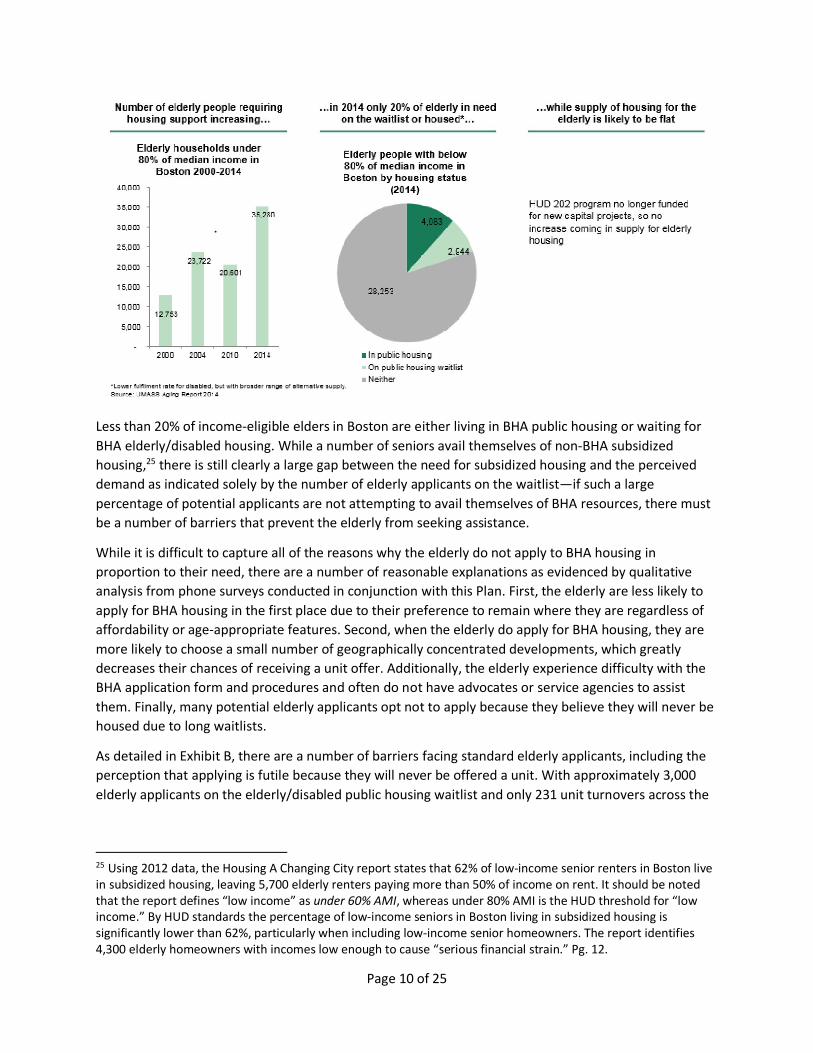
The number of elderly on BHA’s waitlist reflects only a small fraction of income-eligible Boston seniors.
On the following page, the chart on the left shows the marked increase in the number of elderly who are
income-eligible for subsidized housing, with an increase of nearly 15,000 from 2010 to 2014. The chart
in the center shows the small segment of the income-eligible elderly BHA currently serves, along with an
even smaller segment of elderly applicants waiting for subsidized housing.
Page 10 of 25
Less than 20% of income-eligible elders in Boston are either living in BHA public housing or waiting for
BHA elderly/disabled housing. While a number of seniors avail themselves of non-BHA subsidized
housing,25 there is still clearly a large gap between the need for subsidized housing and the perceived
demand as indicated solely by the number of elderly applicants on the waitlist—if such a large
percentage of potential applicants are not attempting to avail themselves of BHA resources, there must
be a number of barriers that prevent the elderly from seeking assistance.
While it is difficult to capture all of the reasons why the elderly do not apply to BHA housing in
proportion to their need, there are a number of reasonable explanations as evidenced by qualitative
analysis from phone surveys conducted in conjunction with this Plan. First, the elderly are less likely to
apply for BHA housing in the first place due to their preference to remain where they are regardless of
affordability or age-appropriate features. Second, when the elderly do apply for BHA housing, they are
more likely to choose a small number of geographically concentrated developments, which greatly
decreases their chances of receiving a unit offer. Additionally, the elderly experience difficulty with the
BHA application form and procedures and often do not have advocates or service agencies to assist
them. Finally, many potential elderly applicants opt not to apply because they believe they will never be
housed due to long waitlists.
As detailed in Exhibit B, there are a number of barriers facing standard elderly applicants, including the
perception that applying is futile because they will never be offered a unit. With approximately 3,000
elderly applicants on the elderly/disabled public housing waitlist and only 231 unit turnovers across the
25 Using 2012 data, the Housing A Changing City report states that 62% of low-income senior renters in Boston live in subsidized housing, leaving 5,700 elderly renters paying more than 50% of income on rent. It should be noted that the report defines “low income” as under 60% AMI, whereas under 80% AMI is the HUD threshold for “low income.” By HUD standards the percentage of low-income seniors in Boston living in subsidized housing is significantly lower than 62%, particularly when including low-income senior homeowners. The report identifies 4,300 elderly homeowners with incomes low enough to cause “serious financial strain.” Pg. 12.
Page 11 of 25
elderly/disabled developments in 2014, the demand for units far exceeds available inventory, and the
belief that a unit offer may never come is in many instances justified by the numbers.
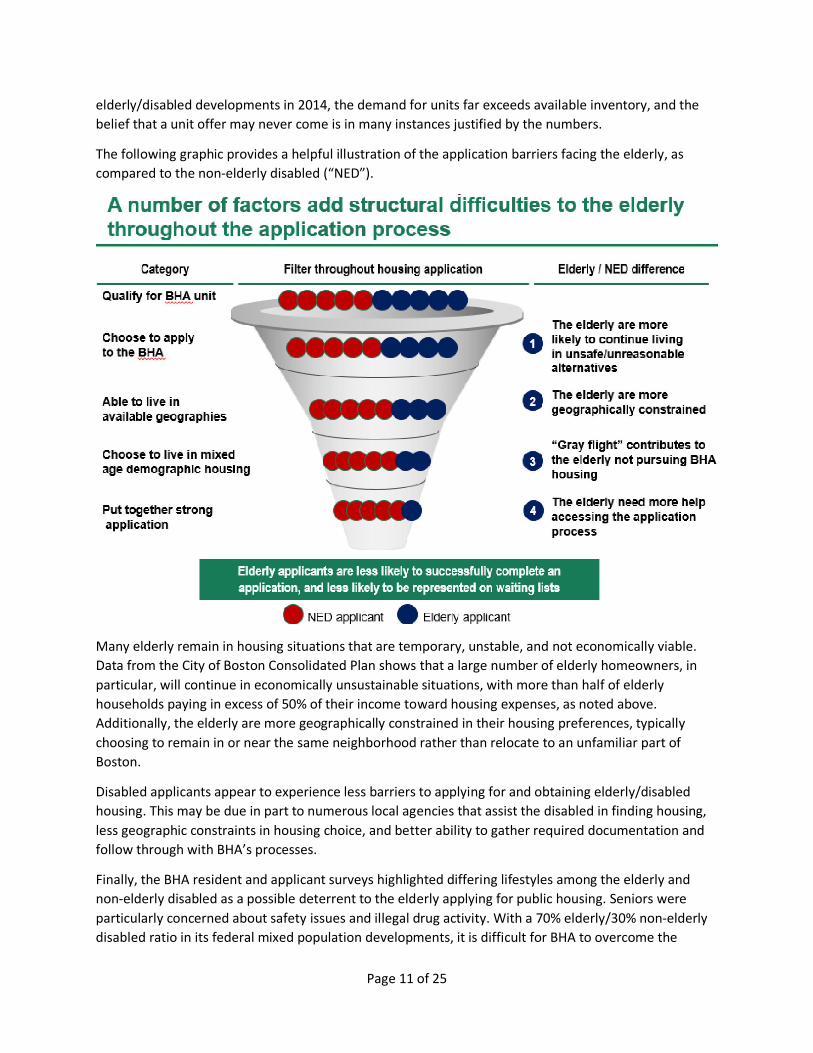
The following graphic provides a helpful illustration of the application barriers facing the elderly, as
compared to the non-elderly disabled (“NED”).
Many elderly remain in housing situations that are temporary, unstable, and not economically viable.
Data from the City of Boston Consolidated Plan shows that a large number of elderly homeowners, in
particular, will continue in economically unsustainable situations, with more than half of elderly
households paying in excess of 50% of their income toward housing expenses, as noted above.
Additionally, the elderly are more geographically constrained in their housing preferences, typically
choosing to remain in or near the same neighborhood rather than relocate to an unfamiliar part of
Boston.
Disabled applicants appear to experience less barriers to applying for and obtaining elderly/disabled
housing. This may be due in part to numerous local agencies that assist the disabled in finding housing,
less geographic constraints in housing choice, and better ability to gather required documentation and
follow through with BHA’s processes.
Finally, the BHA resident and applicant surveys highlighted differing lifestyles among the elderly and
non-elderly disabled as a possible deterrent to the elderly applying for public housing. Seniors were
particularly concerned about safety issues and illegal drug activity. With a 70% elderly/30% non-elderly
disabled ratio in its federal mixed population developments, it is difficult for BHA to overcome the
Page 12 of 25
perception among the elderly that they would be living among a significant number of younger
individuals, many of whom have very different lifestyles than the elderly. As a result, BHA believes that
80% elderly and 20% non-elderly disabled is a more manageable ratio that will help minimize lifestyle
differences. For a more detailed presentation of the barriers facing elderly applicants, including direct
responses from BHA residents, BHA applicants, and professionals serving both groups, see Exhibit B.
The City of Boston recently proposed establishing a Senior Housing Assistance Network, which would
assist seniors with housing search and applications.26 BHA expects this new resource for the elderly to
increase the number of elderly applicants placed on the waiting list.
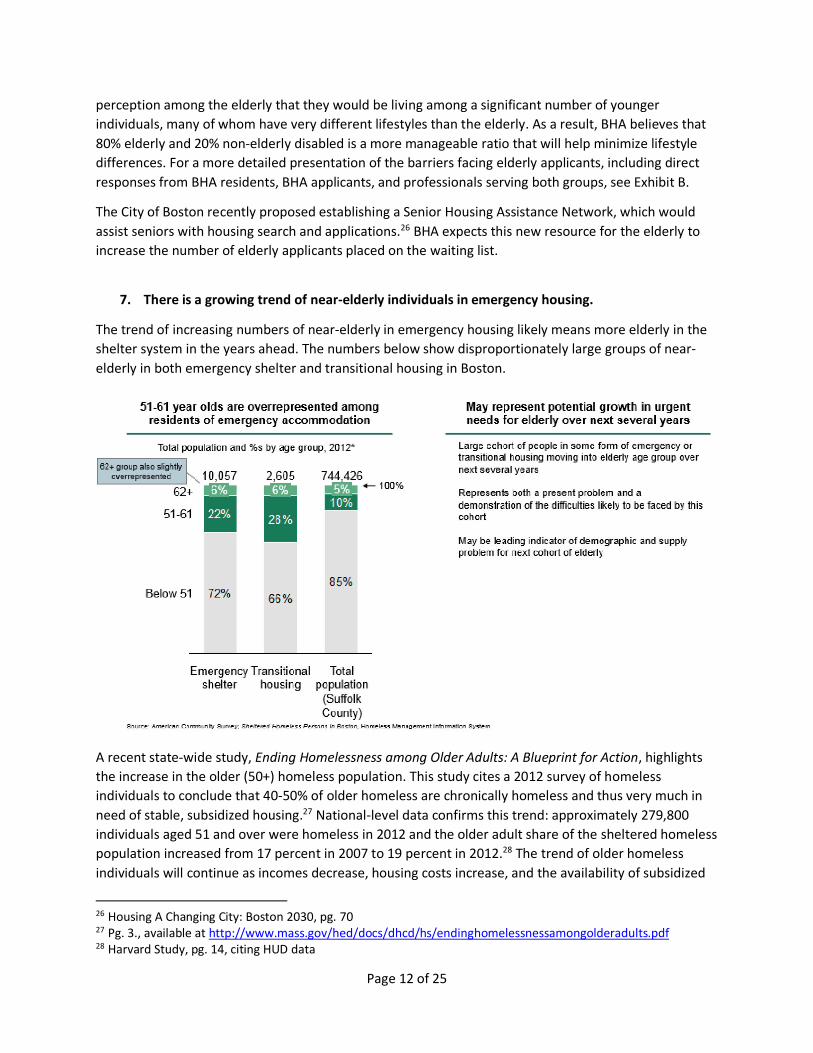
7. There is a growing trend of near-elderly individuals in emergency housing.
The trend of increasing numbers of near-elderly in emergency housing likely means more elderly in the
shelter system in the years ahead. The numbers below show disproportionately large groups of near-
elderly in both emergency shelter and transitional housing in Boston.
A recent state-wide study, Ending Homelessness among Older Adults: A Blueprint for Action, highlights
the increase in the older (50+) homeless population. This study cites a 2012 survey of homeless
individuals to conclude that 40-50% of older homeless are chronically homeless and thus very much in
need of stable, subsidized housing.27 National-level data confirms this trend: approximately 279,800
individuals aged 51 and over were homeless in 2012 and the older adult share of the sheltered homeless
population increased from 17 percent in 2007 to 19 percent in 2012.28 The trend of older homeless
individuals will continue as incomes decrease, housing costs increase, and the availability of subsidized
26 Housing A Changing City: Boston 2030, pg. 70 27 Pg. 3., available at http://www.mass.gov/hed/docs/dhcd/hs/endinghomelessnessamongolderadults.pdf 28 Harvard Study, pg. 14, citing HUD data
Page 13 of 25
units becomes scarcer.29
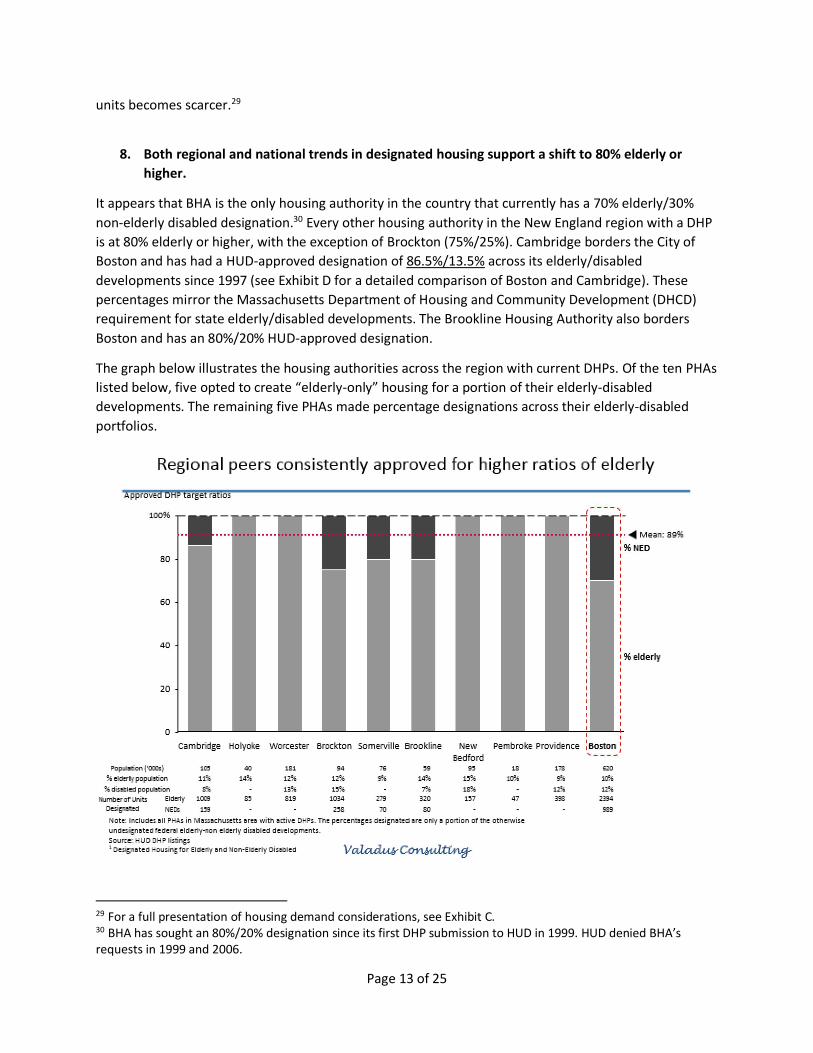
8. Both regional and national trends in designated housing support a shift to 80% elderly or
higher.
It appears that BHA is the only housing authority in the country that currently has a 70% elderly/30%
non-elderly disabled designation.30 Every other housing authority in the New England region with a DHP
is at 80% elderly or higher, with the exception of Brockton (75%/25%). Cambridge borders the City of
Boston and has had a HUD-approved designation of 86.5%/13.5% across its elderly/disabled
developments since 1997 (see Exhibit D for a detailed comparison of Boston and Cambridge). These
percentages mirror the Massachusetts Department of Housing and Community Development (DHCD)
requirement for state elderly/disabled developments. The Brookline Housing Authority also borders
Boston and has an 80%/20% HUD-approved designation.
The graph below illustrates the housing authorities across the region with current DHPs. Of the ten PHAs
listed below, five opted to create “elderly-only” housing for a portion of their elderly-disabled
developments. The remaining five PHAs made percentage designations across their elderly-disabled
portfolios.
29 For a full presentation of housing demand considerations, see Exhibit C. 30 BHA has sought an 80%/20% designation since its first DHP submission to HUD in 1999. HUD denied BHA’s requests in 1999 and 2006.
Page 14 of 25
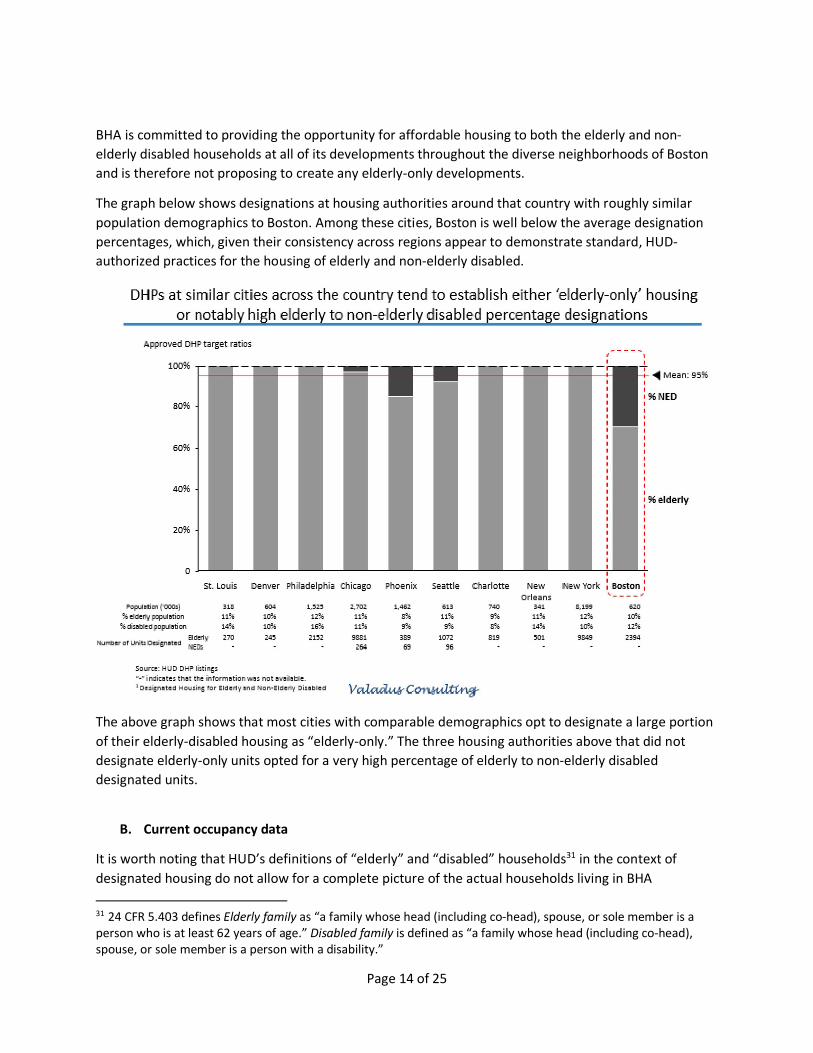
BHA is committed to providing the opportunity for affordable housing to both the elderly and non-
elderly disabled households at all of its developments throughout the diverse neighborhoods of Boston
and is therefore not proposing to create any elderly-only developments.
The graph below shows designations at housing authorities around that country with roughly similar
population demographics to Boston. Among these cities, Boston is well below the average designation
percentages, which, given their consistency across regions appear to demonstrate standard, HUD-
authorized practices for the housing of elderly and non-elderly disabled.
The above graph shows that most cities with comparable demographics opt to designate a large portion
of their elderly-disabled housing as “elderly-only.” The three housing authorities above that did not
designate elderly-only units opted for a very high percentage of elderly to non-elderly disabled
designated units.
B. Current occupancy data
It is worth noting that HUD’s definitions of “elderly” and “disabled” households31 in the context of
designated housing do not allow for a complete picture of the actual households living in BHA
31 24 CFR 5.403 defines Elderly family as “a family whose head (including co-head), spouse, or sole member is a person who is at least 62 years of age.” Disabled family is defined as “a family whose head (including co-head), spouse, or sole member is a person with a disability.”
Page 15 of 25
elderly/disabled developments. Because any head of household age 62 or older is classified as “elderly,”
regardless of disability status, the number of disabled households is underrepresented for purposes of
tracking units devoted to the disabled. This aspect of designated housing is important to note because
while BHA proposes increasing its elderly percentage to 80%, the real percentage of disabled families
living in the developments will always be far above 20%.
BHA has operated under a DHP since 1999, and during that period hundreds of applicants who were
initially housed as “non-elderly disabled” have reached the age of 62 and therefore their status has
changed to “elderly.” This obviously pushes the composition of elderly/disabled developments toward
increasing numbers of disabled households well beyond the designated percentages. In fact, 22% of
current “elderly” households were “non-elderly disabled” households at the time of admission. Currently,
approximately 5% of BHA non-elderly disabled heads of household are 60-61 years old. This means that
within the next two years, over 170 additional non-elderly disabled households will be reclassified as
elderly households (see Exhibit E for development-by-development breakdowns). During the 5-year-
period of this Plan over 400 non-elderly disabled households will be similarly reclassified as elderly.
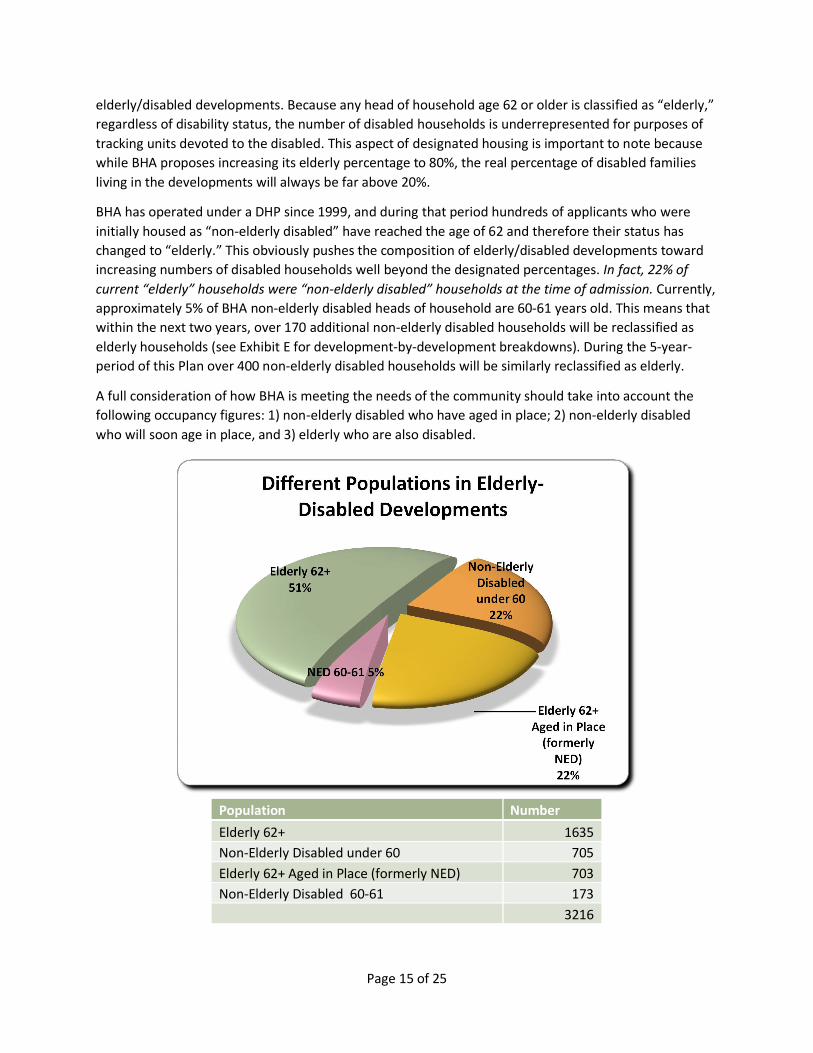
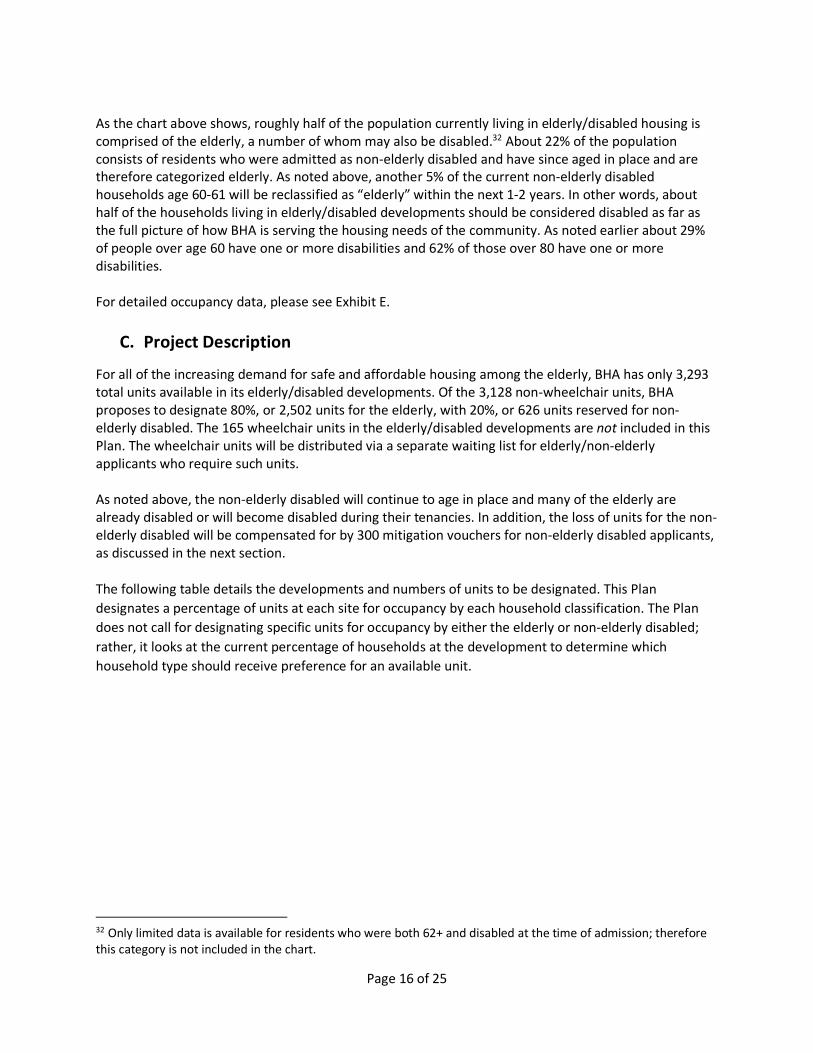
A full consideration of how BHA is meeting the needs of the community should take into account the
following occupancy figures: 1) non-elderly disabled who have aged in place; 2) non-elderly disabled
who will soon age in place, and 3) elderly who are also disabled.
Population Number
Elderly 62+ 1635
Non-Elderly Disabled under 60 705
Elderly 62+ Aged in Place (formerly NED) 703
Non-Elderly Disabled 60-61 173
3216
Elderly 62+51%
Non-Elderly Disabled under 60
22%
Elderly 62+ Aged in Place
(formerly NED)22%
NED 60-61 5%
Different Populations in Elderly-Disabled Developments
Page 16 of 25
As the chart above shows, roughly half of the population currently living in elderly/disabled housing is comprised of the elderly, a number of whom may also be disabled.32 About 22% of the population consists of residents who were admitted as non-elderly disabled and have since aged in place and are therefore categorized elderly. As noted above, another 5% of the current non-elderly disabled households age 60-61 will be reclassified as “elderly” within the next 1-2 years. In other words, about half of the households living in elderly/disabled developments should be considered disabled as far as the full picture of how BHA is serving the housing needs of the community. As noted earlier about 29% of people over age 60 have one or more disabilities and 62% of those over 80 have one or more disabilities. For detailed occupancy data, please see Exhibit E.
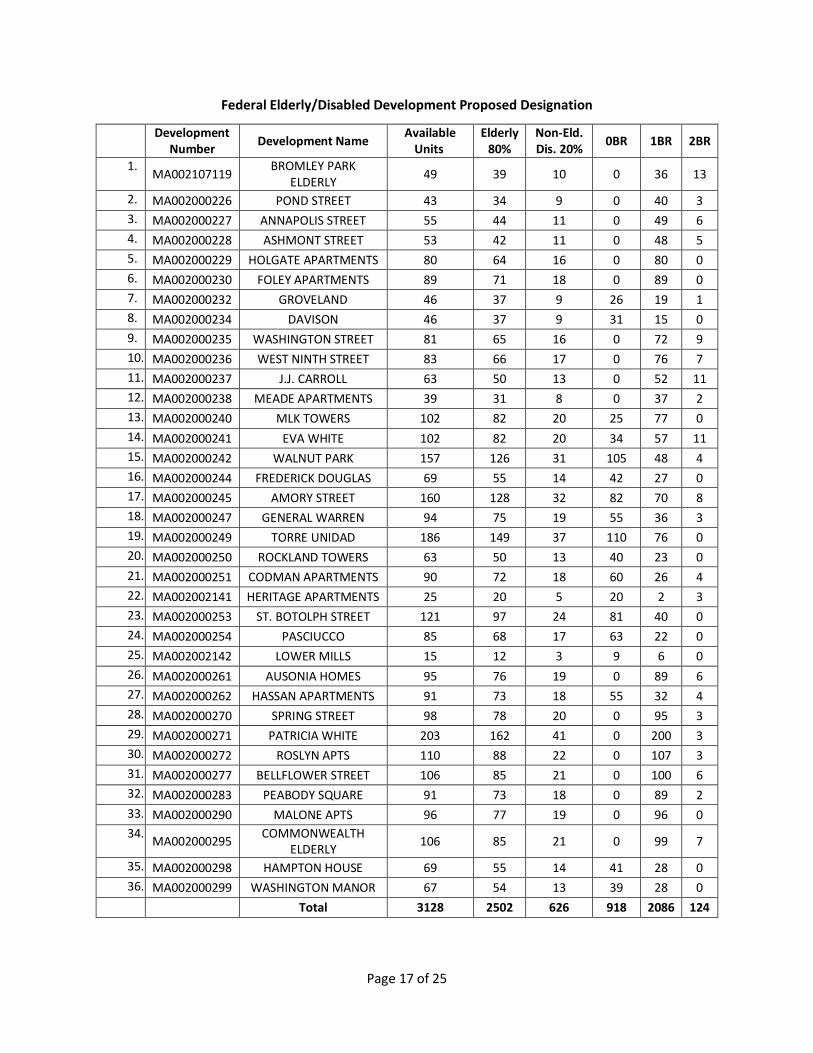
C. Project Description
For all of the increasing demand for safe and affordable housing among the elderly, BHA has only 3,293 total units available in its elderly/disabled developments. Of the 3,128 non-wheelchair units, BHA proposes to designate 80%, or 2,502 units for the elderly, with 20%, or 626 units reserved for non-elderly disabled. The 165 wheelchair units in the elderly/disabled developments are not included in this Plan. The wheelchair units will be distributed via a separate waiting list for elderly/non-elderly applicants who require such units. As noted above, the non-elderly disabled will continue to age in place and many of the elderly are already disabled or will become disabled during their tenancies. In addition, the loss of units for the non-elderly disabled will be compensated for by 300 mitigation vouchers for non-elderly disabled applicants, as discussed in the next section. The following table details the developments and numbers of units to be designated. This Plan
designates a percentage of units at each site for occupancy by each household classification. The Plan
does not call for designating specific units for occupancy by either the elderly or non-elderly disabled;
rather, it looks at the current percentage of households at the development to determine which
household type should receive preference for an available unit.
32 Only limited data is available for residents who were both 62+ and disabled at the time of admission; therefore this category is not included in the chart.
Page 17 of 25
Federal Elderly/Disabled Development Proposed Designation
Development Number
Development Name Available
Units Elderly
80% Non-Eld. Dis. 20%
0BR 1BR 2BR
1. MA002107119
BROMLEY PARK ELDERLY
49 39 10 0 36 13
2. MA002000226 POND STREET 43 34 9 0 40 3
3. MA002000227 ANNAPOLIS STREET 55 44 11 0 49 6
4. MA002000228 ASHMONT STREET 53 42 11 0 48 5
5. MA002000229 HOLGATE APARTMENTS 80 64 16 0 80 0
6. MA002000230 FOLEY APARTMENTS 89 71 18 0 89 0
7. MA002000232 GROVELAND 46 37 9 26 19 1
8. MA002000234 DAVISON 46 37 9 31 15 0
9. MA002000235 WASHINGTON STREET 81 65 16 0 72 9
10. MA002000236 WEST NINTH STREET 83 66 17 0 76 7
11. MA002000237 J.J. CARROLL 63 50 13 0 52 11
12. MA002000238 MEADE APARTMENTS 39 31 8 0 37 2
13. MA002000240 MLK TOWERS 102 82 20 25 77 0
14. MA002000241 EVA WHITE 102 82 20 34 57 11
15. MA002000242 WALNUT PARK 157 126 31 105 48 4
16. MA002000244 FREDERICK DOUGLAS 69 55 14 42 27 0
17. MA002000245 AMORY STREET 160 128 32 82 70 8
18. MA002000247 GENERAL WARREN 94 75 19 55 36 3
19. MA002000249 TORRE UNIDAD 186 149 37 110 76 0
20. MA002000250 ROCKLAND TOWERS 63 50 13 40 23 0
21. MA002000251 CODMAN APARTMENTS 90 72 18 60 26 4
22. MA002002141 HERITAGE APARTMENTS 25 20 5 20 2 3
23. MA002000253 ST. BOTOLPH STREET 121 97 24 81 40 0
24. MA002000254 PASCIUCCO 85 68 17 63 22 0
25. MA002002142 LOWER MILLS 15 12 3 9 6 0
26. MA002000261 AUSONIA HOMES 95 76 19 0 89 6
27. MA002000262 HASSAN APARTMENTS 91 73 18 55 32 4
28. MA002000270 SPRING STREET 98 78 20 0 95 3
29. MA002000271 PATRICIA WHITE 203 162 41 0 200 3
30. MA002000272 ROSLYN APTS 110 88 22 0 107 3
31. MA002000277 BELLFLOWER STREET 106 85 21 0 100 6
32. MA002000283 PEABODY SQUARE 91 73 18 0 89 2
33. MA002000290 MALONE APTS 96 77 19 0 96 0
34. MA002000295
COMMONWEALTH ELDERLY
106 85 21 0 99 7
35. MA002000298 HAMPTON HOUSE 69 55 14 41 28 0
36. MA002000299 WASHINGTON MANOR 67 54 13 39 28 0
Total 3128 2502 626 918 2086 124
Page 18 of 25
For current occupancy data for these developments, please see Exhibit E.
BHA has 8,632 total available federal public housing units as of October 2014. The total number of
available units in each public housing program is as follows: 5,339 family and 3,293 elderly/disabled for
a total of 8,632 units. An additional 1,566 units are available at HOPE VI sites. Exhibit E2 provides a
detailed listing of total available public housing units by program type and bedroom size. The number of
units to be designated for the elderly (2,502) represents 25% of the total number of units available, and
the number of units to be designated for the non-elderly disabled (626) represents 6% of the total
number of units available.
The supportive services at BHA’s elderly/disabled developments are very limited due to budget cuts.
Whereas in the past, BHA employed eight full-time service coordinators that provided case management
and referrals in each of the developments, these positions were eliminated in 2013. BHA is unable to
provide supportive services to residents of the elderly/disabled developments due to lack of funding and
this is unlikely to change during the period of the Plan. Exhibit F provides a detailed description of each
of the developments. As previously noted, many of the elderly/disabled properties have design features
suited to the elderly and mobility-impaired populations, including ramps, elevators, pull cords, resident
custodians, and front desk security 24-hours per day. BHA is able to provide supportive services in a
number of its Section 8 Project-Based Voucher and Moderate Rehabilitation sites, both of which serve
large non-elderly disabled populations.
The BHA has a number of units with accessible features in both its federal family and federal
elderly/disabled portfolio. Some of these units are Uniform Federal Accessibility Standards (UFAS)-
compliant, some are American National Standards Institute (ANSI) units, and others are classified as
special features units (units with some adapted features). See Exhibit H for a description of the location,
number, and bedroom size of UFAS units in the BHA’s federal and state elderly/disabled and family
portfolios. Once again, this Plan does not include the wheelchair units in federal elderly/disabled
developments. Chapter 6 of BHA’s Admissions and Continued Occupancy Policy for Public Housing
Programs (ACOP) contains additional information about occupancy of accessible units.
BHA will increase the percentage of the elderly from 70% to 80% by continuing to apply its HUD-
approved Designated Housing Preference. At any elderly/disabled development where the elderly
occupancy percentage is less than 80%, elderly applicants will receive 100 additional preference points.
This preference proved effective in reaching the 70% elderly/30% non-elderly goals of BHA’s 2007 DHP.
At any elderly/disabled development where the percentage of elderly occupants exceeds 80%, non-
elderly disabled applicants will receive 100 additional preference points (see Exhibit L for proposed
revisions to the ACOP).
It is important to note that the Designated Housing Preference for the elderly is not an absolute
preference as it will only be triggered when a particular development is under 80% elderly occupied. In
other words, the elderly preference only exists when the DHP 80/20 goals are not being met at a
particular development. BHA monitors the elderly/non-elderly disabled percentages on an ongoing basis
and when the percentage of elderly households at a particular development reaches 75%, the
Page 19 of 25
development will be flagged so that each subsequent offer of housing will be reviewed by a Manager in
the Occupancy Department. As in the past, BHA will not hold units vacant if they cannot be readily filled
by elderly or non-elderly disabled applicants when targeting either the 80% elderly or 20% non-elderly
disabled occupancy percentages. When the percentage of elderly households at a development reaches
80%, BHA will stop awarding designated housing preference points to elderly applicants for that
particular development. Similarly, when the percentage of non-elderly disabled households at a
development reaches 20%, BHA will stop awarding the designated housing preference points to non-
elderly disabled applicants for that particular development.
D. Alternative Resources
1) Resources within BHA
a. Mitigating Resource: 300 New Housing Choice Vouchers for Non-Elderly Disabled
Applicants
One of the core components of this Plan is the commitment to provide three hundred (300) new
Housing Choice Vouchers (hereinafter referred to as “mitigation vouchers”) to non-elderly disabled
applicants as a mitigating resource in conjunction with this Plan. HUD guidance on balancing the needs
of the community states that offering Housing Choice Vouchers to the non-designated group is one
appropriate means of mitigating the impact of a designation. PIH 2005-2 (HA) states that “a PHA’s
demonstration that it will make reasonable efforts to provide housing choice voucher assistance or other
appropriate resources to the non-designated group is sufficient basis for designation.”33 BHA already
operates 200 designated housing vouchers for the non-elderly disabled, as well as 300 Mainstream
Housing Vouchers for the non-elderly disabled. With the addition of 300 mitigation vouchers, BHA will
provide up to 800 mobile vouchers specifically to the non-elderly disabled. By comparison, BHA will have
no housing choice vouchers set aside specifically for the elderly (outside of the Section 8 project-based
voucher program).
The number of mitigation vouchers will balance out the loss of units that otherwise would have gone to
non-elderly disabled applicants under BHA’s prior 70% elderly/30% non-elderly disabled designation.
BHA will award mitigation vouchers pursuant to revised procedures to its Administrative Plan (see
Exhibit L, which also contains proposed revisions to the ACOP). Non-elderly disabled households will
become eligible for a mitigation voucher when bypassed on the waiting list in order for a unit offer to be
made to an elderly household placed lower on the list. Once eligible, those households must still apply
for a mitigation voucher. This procedure will be explained in a letter that serves as the documentation of
household eligibility for the mitigation voucher (see Exhibit L for a draft of the letter). Mitigation
33 Emphasis added. Elsewhere in PIH 2005-2 (HA), HUD states that “documentation of the unavailability of a comparable level of housing resources [for the non-designated group] would demonstrate that these PHAs have made reasonable efforts.” Rather than attempt to document the unavailability of additional resources for the non-elderly disabled, BHA is proactively developing resources for the non-elderly disabled in the form of mitigation vouchers.
Page 20 of 25
vouchers will be awarded to applicants placed on a separate waiting list based on the date BHA receives
their application for a mitigation voucher.34
BHA has analyzed its Housing Choice Voucher (HCV) Program turnover rates, budget authority
utilization, and the turnover rate for its federal elderly/disabled developments and determined that it
can sustain this set-aside. Over the past year, the HCV program averaged an attrition of approximately
50 vouchers per month. This number far exceeds the potential demand for mitigation vouchers as the
average turnover in the elderly/disabled portfolio is approximately 20 units per month. BHA anticipates
issuing the vast majority of the 300 mitigation vouchers during the first and second years of the Plan. By
the third year of the Plan, all of the elderly/disabled developments will be at or near the targeted
percentages.
BHA has secured commitments from a number of housing search agencies to offer assistance to non-
elderly disabled applicants who receive mitigation vouchers. If this Plan is approved, BHA will endeavor
formalize these partnerships and refer recipients of mitigation vouchers to whichever housing search
agency best meets their needs.
b. Program-wide move-in rates indicate non-elderly disabled are housed at significantly
higher rates than the elderly; specifically, a 2:1 ratio over the past two years.
BHA operates a number of housing programs that benefit the non-elderly disabled, who are housed at
twice the rate of the elderly. From October 1, 2012 to September 30, 2014, BHA housed a total of 925
non-elderly disabled households and 468 elderly households across all of its housing programs. In other
words, nearly twice as many non-elderly disabled households moved into subsidized housing through
BHA programs as did elderly households. Given that BHA is not changing anything other than the
percentage of its designation in the federal elderly/disabled portfolio, the trend of housing far more
non-elderly disabled than elderly applicants is expected to continue. See below and Exhibit G for a
detailed breakdown of BHA move-ins.
c. BHA operates a number of housing programs outside of federal elderly/disabled
public housing that serve the non-elderly disabled in significant numbers.
As mentioned above, BHA administers 200 NED vouchers and 300 Mainstream vouchers, which together
serve 500 non-elderly disabled households. In addition, the BHA administers the following programs
(please refer to Exhibit E2 and G and for more information):
1) Federal family public housing. Almost 1,300 non-elderly disabled households are currently
housed in federal family public housing, comprising 25% of all households. From October 2012
through September 2014, 172 non-elderly disabled households moved into family
developments, accounting for 27% of move-ins, while only 23 elderly households moved into
family developments, accounting for just 3% of move-ins. Elderly households make up only 20%
of households in federal family public housing. Non-elderly disabled applicants receive
34 BHA’s approach to mitigation vouchers is modeled on Brookline Housing Authority’s successfully implemented DHP from 2013.
Page 21 of 25
preference points in the federal and state-aided family programs that standard elderly
applicants do not.
2) Section 8 Project-Based Vouchers (PBV). BHA administers a total of 1,458 PBVs. Many PBV sites
include supportive services. The current occupancy rates of elderly and non-elderly disabled in
PBV units are approximately the same. In 2013-14, however, non-elderly disabled obtained 50%
of all PBV units while the elderly obtained only 19% of PBV units. The difference is mainly due to
the fact that many non-elderly disabled households obtain priority one applicant status as they
are more likely to meet the homeless priority criteria. Since 2012 the BHA has added a total of
43 units to the PBV portfolio with an additional 65 PBV units in the pipeline. It is expected that
the trend of housing significant numbers of non-elderly disabled in PBV units will continue.35
3) Section 8 Moderate Rehabilitation Program (Mod Rehab). BHA administers a total of 746 Mod
Rehab vouchers. The majority of Mod Rehab units are single-room occupancy and many sites
include supportive services. Over the past two years, the non-elderly disabled received 45% of
moderate rehabilitation units while the elderly received only 7%. Again, the non-elderly disabled
are more likely to qualify as priority one applicants and are therefore housed more rapidly.
Currently twice as many non-elderly disabled households occupy Mod Rehab units as elderly
households.
4) Housing Choice Vouchers (HCV). BHA administers approximately 14,140 HCVs. The BHA HCV
waiting list has been closed to all but priority one applicants since 2008. Far more non-elderly
disabled are housed through Housing Choice Vouchers than the elderly, primarily due to
qualifying for priority one applicant status. From October 2012 to September 2014, four times as
many HCVs went to non-elderly disabled as the elderly. Currently non-elderly disabled
households utilize 30% of HCVs while elderly households utilize 20% of HCVs.
5) Massachusetts Rental Voucher Program (MRVP). BHA administers 740 MRVP vouchers issued
by the state. This program also serves the non-elderly disabled in far greater numbers than the
elderly, with 44% of vouchers going to non-elderly vs. 7% going to the elderly in 2013-14.
6) High Utilizers of Emergency Services (HUES) to Home initiative. BHA has made another
commitment of 20 vouchers per year for 3 years (a total of 60 vouchers) for this Boston Public
Health Commission program. This program finds permanent supportive housing options for
homeless individuals who use hospital emergency rooms as a regular shelter option. Again, the
primary target population is non-elderly disabled.
d. BHA will continue to offer non-elderly disabled preference points in its federal and state family public housing and single non-elderly disabled preference points in its Housing Choice Voucher and Moderate Rehabilitation Voucher programs.
35 There are currently six PBV sites that have elderly designations: 1) Heritage, 2) Lower Mills, 3) Morville, 4) Building 104, 5) Central Boston Elder Service, and 6) Quincy Commons.
Page 22 of 25
The Appendix to HUD PIH 2005-2 (HA) notes that “a PHA preference given to the non-designated group for the remaining public housing units is a housing resource.” BHA will continue two preference categories created in conjunction with its 2007 DHP. These preference categories are as follows:
a) Non-Elderly Disabled Preference: Non-elderly disabled applicants to a state or federal family
public housing development receive additional preference points when applying to any
bedroom size unit. The implementation of this preference significantly increased housing
opportunities for non-elderly disabled households in both the state and federal family programs,
as indicated by the move-in data discussed above and detailed in Exhibit G. Both Single Disabled
Persons and Single Elderly receive preference points in BHA’s HCV program.
b) BHA will also continue to offer Priority Status for transfers for non-elderly disabled public
housing residents living in the elderly/disabled developments who wish to voluntarily transfer to
the Family Program. Non-Elderly disabled public housing residents who wish to voluntarily
transfer under this category will be relocated at the expense of the BHA as outlined in Section F
of this Plan.
Please see Exhibit I, which outlines the current BHA priority categories and preferences, including examples of the assignment of points.
2) Resources Outside of BHA: Alternative Housing Supply Database
As part of this Plan, BHA compiled a database of non-BHA subsidized housing available throughout
Boston. The Alternative Housing Supply Database, Exhibit J, lists all subsidized properties located in
Boston and includes the building name, address, number of units, type of subsidy, and, where available,
occupancy rates as of April 2014. The database shows the number and variety of subsidized housing
opportunities throughout the City of Boston.
Outside of BHA programs, Boston has approximately 22,000 housing units with rental subsidies for non-
senior households.36 Annual turnover for these units is approximately 5%, amounting to 1,100-1,250
subsidized units becoming available per year.37
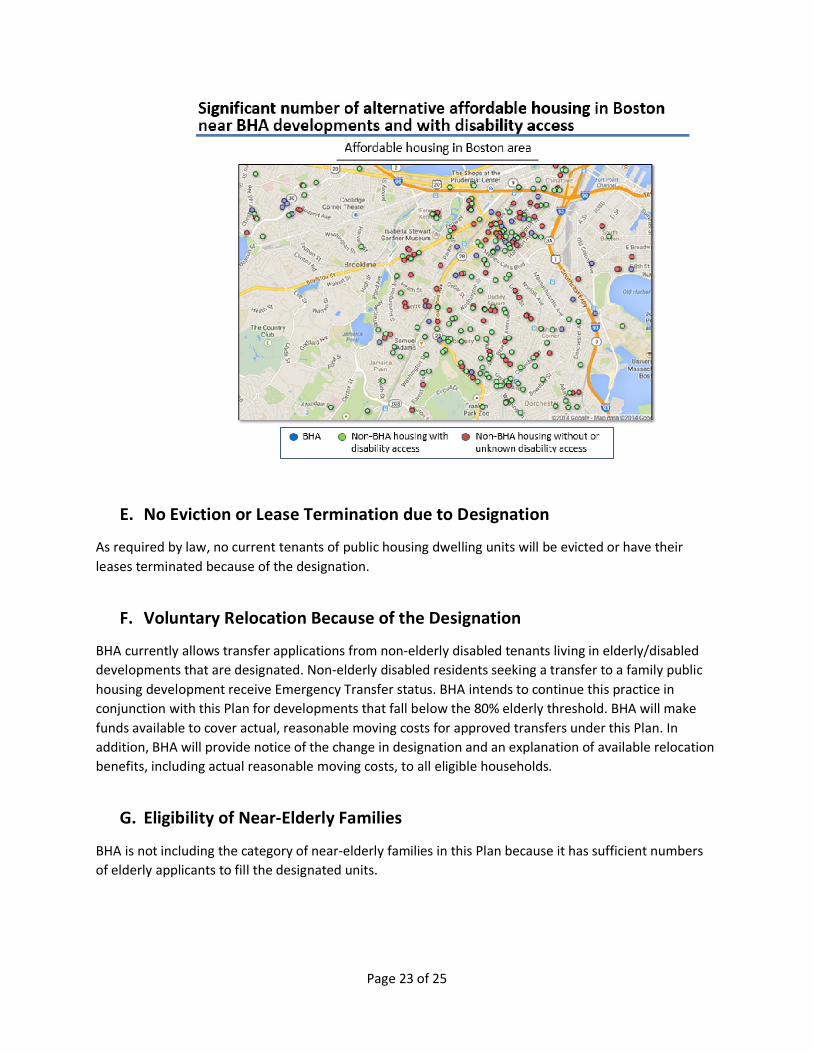
The following map provides a snapshot of both BHA and non-BHA subsidized housing opportunities
throughout central Boston. Please refer to Exhibits J and K for more information.
36 Housing a Changing City: Boston 2030, pg. 27; Valadus Alternative Housing Supply Presentation, Exhibit K 37 Housing a Changing City: Boston 2030, pg. 27
Page 23 of 25
E. No Eviction or Lease Termination due to Designation
As required by law, no current tenants of public housing dwelling units will be evicted or have their
leases terminated because of the designation.
F. Voluntary Relocation Because of the Designation
BHA currently allows transfer applications from non-elderly disabled tenants living in elderly/disabled
developments that are designated. Non-elderly disabled residents seeking a transfer to a family public
housing development receive Emergency Transfer status. BHA intends to continue this practice in
conjunction with this Plan for developments that fall below the 80% elderly threshold. BHA will make
funds available to cover actual, reasonable moving costs for approved transfers under this Plan. In
addition, BHA will provide notice of the change in designation and an explanation of available relocation
benefits, including actual reasonable moving costs, to all eligible households.
G. Eligibility of Near-Elderly Families
BHA is not including the category of near-elderly families in this Plan because it has sufficient numbers
of elderly applicants to fill the designated units.
Page 24 of 25
H. HUD DHP Review Checklist Items
The following information is provided to answer questions in the HUD Review of Designated Housing
Plans checklist not addressed elsewhere in this Plan.
1) The BHA does not have any outstanding court orders, Voluntary Compliance Agreements, or
Section 504 Letters of Findings at this time.
2) Regarding fair housing, the proposed designation in this Plan will not increase minority
concentrations as the elderly/non-elderly disabled population percentages apply at all of BHA’s
elderly/disabled developments.
3) BHA operates site-based waiting lists for all of its public housing developments. Please see
Exhibit E1 for site-specific information, including a breakdown of applicants by development as
well as the number and percentage of elderly and non-elderly disabled applicants. BHA is not
including waiting list data for its HOPE VI sites as each operate independently and HOPE VI units
are not a part of this Plan.
III. Request for Approval
The BHA requests that HUD approve this application for a new Designated Housing Plan as follows:
1. BHA will provide 80% of units to elderly applicants and 20% to non-elderly disabled applicants in all developments included in this Plan, for a total of 2502 elderly and 626 non-elderly disabled designated units. The 165 wheelchair units in the elderly/disabled portfolio are undesignated.
2. BHA will retain preference points for persons with disabilities in state and federal family public housing and for single non-elderly disabled in the Housing Choice Voucher and Moderate Rehabilitation Voucher Programs.
3. BHA will continue to administer its existing DHP-related vouchers while providing 300 new DHP
mitigation vouchers in conjunction with this Plan, and will, where available, seek additional vouchers for the non-elderly disabled.
Page 25 of 25
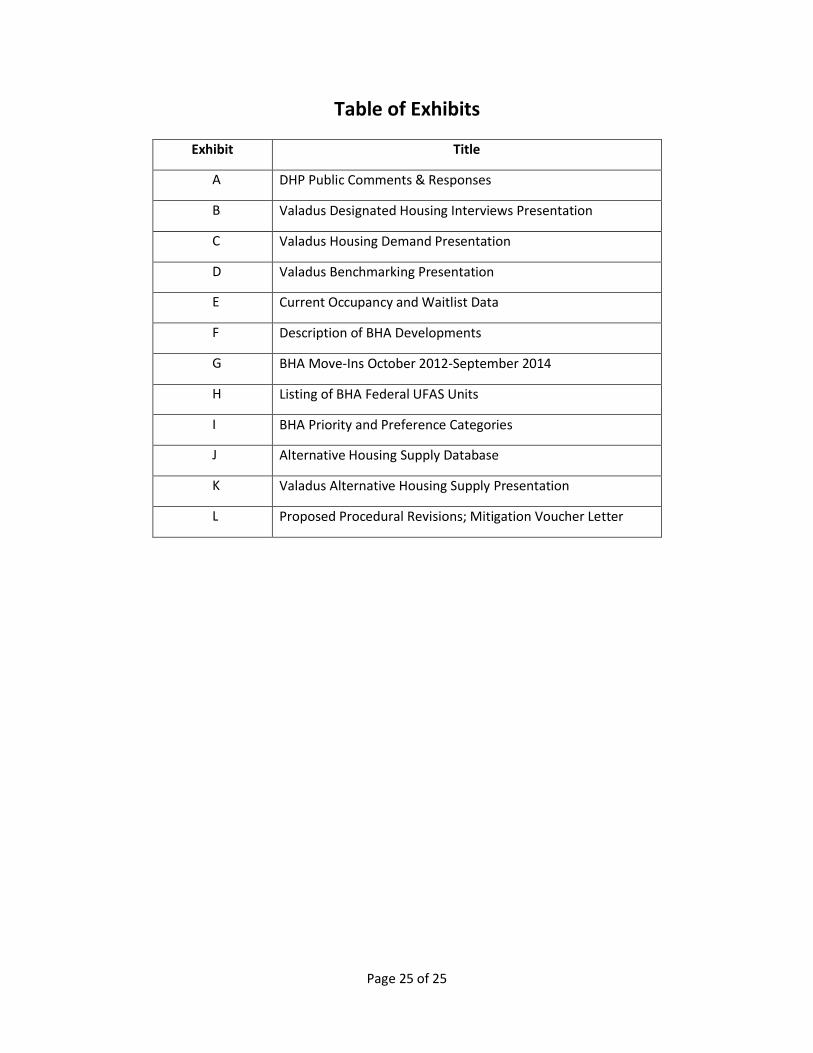
Table of Exhibits
Exhibit Title
A DHP Public Comments & Responses
B Valadus Designated Housing Interviews Presentation
C Valadus Housing Demand Presentation
D Valadus Benchmarking Presentation
E Current Occupancy and Waitlist Data
F Description of BHA Developments
G BHA Move-Ins October 2012-September 2014
H Listing of BHA Federal UFAS Units
I BHA Priority and Preference Categories
J Alternative Housing Supply Database
K Valadus Alternative Housing Supply Presentation
L Proposed Procedural Revisions; Mitigation Voucher Letter