Embed Size (px)
Citation preview
Proceedings of the 2016 International Conference on Industrial Engineering and Operations Management Kuala Lumpur, Malaysia, March 8-10, 2016
Design Simulation and Information Dashboard for Manufacturing Control Using Systematic Approach: a
Case Study of Hospital Beds Production
Susanto Sudiro Magister Teknik Mesin
Universitas Pancasila Jakarta Jl Borobudur No 07 Menteng , Jakarta Pusat 10320,Indonesia
Sha’ri Mohd Yusof Razak School of Engineering and Advanced Technology
Universiti Teknologi Malaysia Kuala Lumpur Level 7, Razak Tower Jalan Sultan Yahya Petra 54100 Kuala Lumpur
Revino Post Graduate Program
Institut Sains dan Teknologi Nasional Jakarta Jalan Duren Tiga Pasarminggu, Jakarta Selatan 12760, Indonesia
oniver10@yahoo. com
Abstract—This study is being conducted in a hospital bed industry which uses a special workbench to assemble the beds. This papers outlines the efforts taken to setup manufacturing information system which is use mode D min 1 WIP buffer production scenario. The main objective of the study is to design production planning simulation tool to implements mode D min 1 WIP buffer production scenario and manufacturing control dashboard as feed back of the manufacturing control system. The study conducted to a company which is implemented ERP SAP R/3 enterprise with the module used are FI, CO, SD, PP and MM. The ERP SAP system only effective on the company level but in the production floor does not. The production floor consist of multistage of production, the SAP system cannot reach information of production floor in every production stage. Every production stage has their own system to make production schedule and activity run. Not one system integrated production information for each of stage production. The system not able to make succeed supply chain system to supply components complete in the right time for every stage of production. This study provide dashboard with information of production in every stage production with their production status, to assure availability of components to build products complete . To solve the problems implemented systematic approach method to define the overall function of the production information system and then breakdown overall function to the function structure. For every function structure can be describe input variable and the output expected. Using matlab to setup function as describe in the function structure to define the output. The output shown in dashboard is base on windows display using GUI system which is available in matlab environment. Prototype of dashboard has been built to give production information of incoming part to welding plant, paint shop and in the assembly line. The dashboard has ability to show production status in every production stage real time. This dashboard able to cover the lose of ERP SAP system with giving feed back to management
Keywords— D minus 1, Systematic Approach, Hospital Beds, ERP SAP, Manufacturing Control Dashboard
I. INTRODUCTION
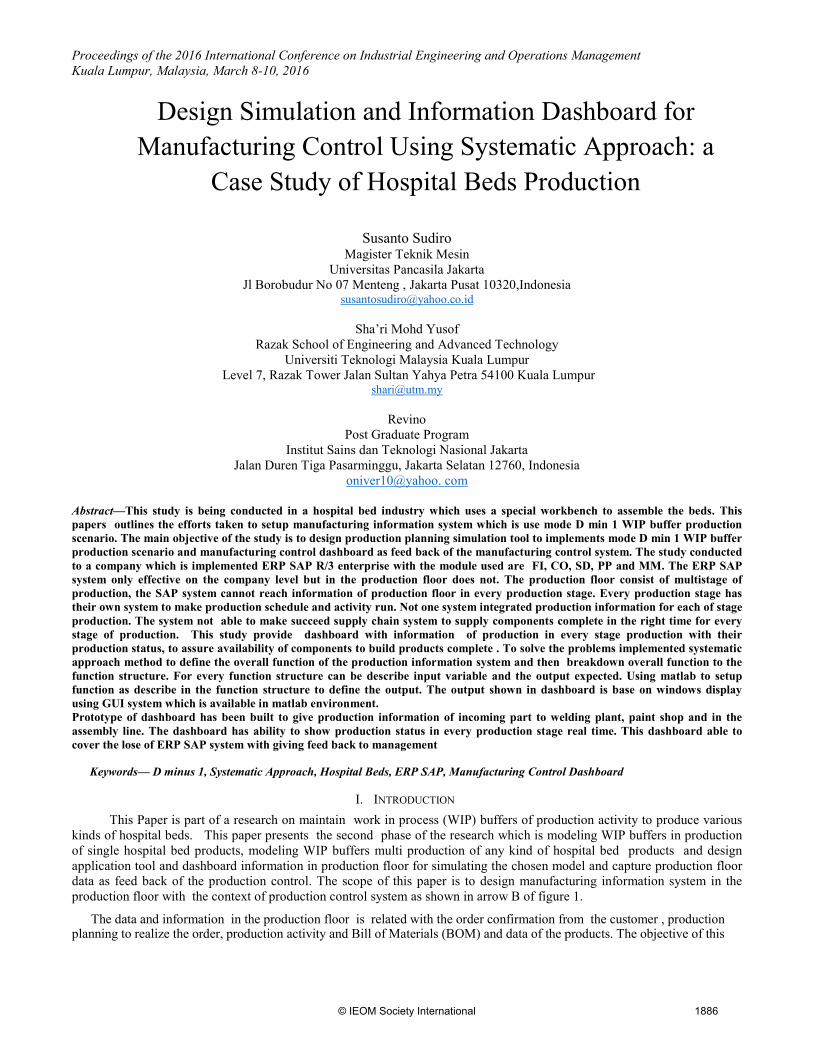
This Paper is part of a research on maintain work in process (WIP) buffers of production activity to produce various kinds of hospital beds. This paper presents the second phase of the research which is modeling WIP buffers in production of single hospital bed products, modeling WIP buffers multi production of any kind of hospital bed products and design application tool and dashboard information in production floor for simulating the chosen model and capture production floor data as feed back of the production control. The scope of this paper is to design manufacturing information system in the production floor with the context of production control system as shown in arrow B of figure 1.
The data and information in the production floor is related with the order confirmation from the customer , production planning to realize the order, production activity and Bill of Materials (BOM) and data of the products. The objective of this
1886© IEOM Society International
Proceedings of the 2016 International Conference on Industrial Engineering and Operations Management Kuala Lumpur, Malaysia, March 8-10, 2016
research is to support model D minus 1 production scenario[1] to succeed produce the goods as planned and on time delivery to the customers.
Model D minus 1 production scenario is shown in fig 2 .The ” Day 0” being time scheduled to assembly the finished goods. Day -1 is day scheduled on the upstream buffer WIP materials supply, consecutively implemented for every upper stream of the workstations buffer. Raw components supplied in lot and downsize in batch in WIP buffer to supply the welding stations, welding buffer in batch supply to paint shop and feed queuing in hanger. Coming out from paint shop, the components are arranged in racks, trolley or box in batch of WIP buffer.This batch materials is sent to assembly station together with standard components supply from warehouse arranged in kiting form.
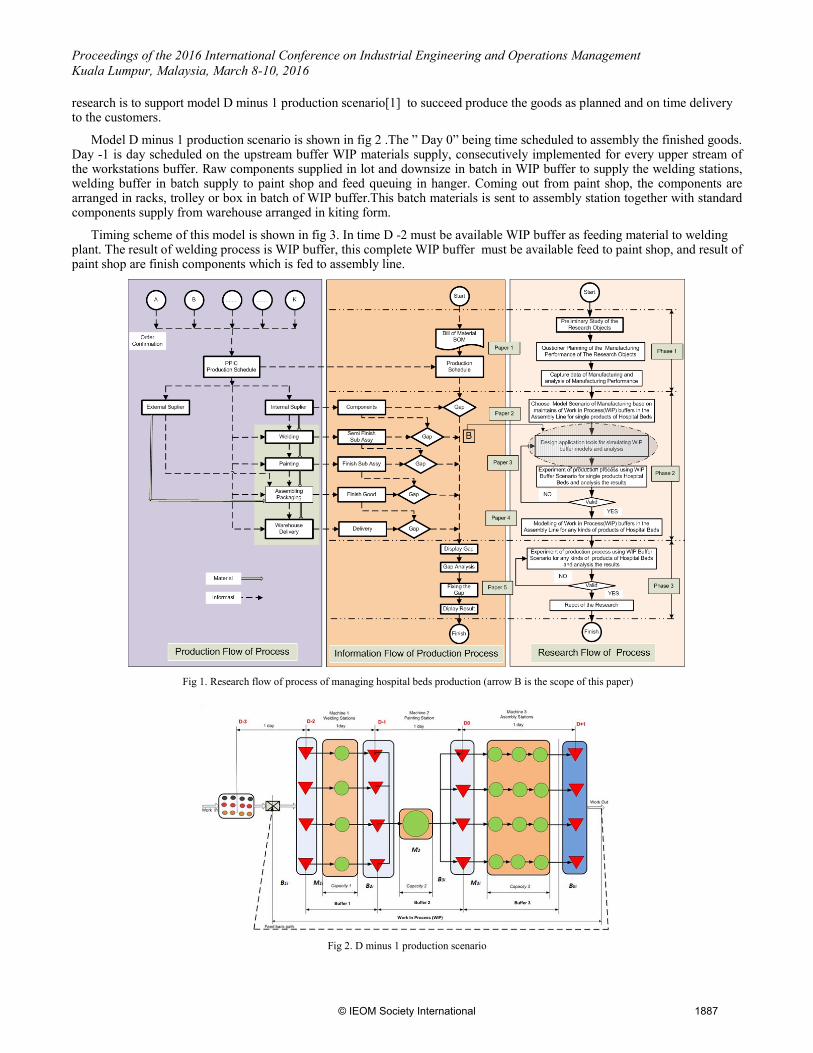
Timing scheme of this model is shown in fig 3. In time D -2 must be available WIP buffer as feeding material to welding plant. The result of welding process is WIP buffer, this complete WIP buffer must be available feed to paint shop, and result of paint shop are finish components which is fed to assembly line.
Fig 1. Research flow of process of managing hospital beds production (arrow B is the scope of this paper)
Fig 2. D minus 1 production scenario
1887© IEOM Society International
Proceedings of the 2016 International Conference on Industrial Engineering and Operations Management Kuala Lumpur, Malaysia, March 8-10, 2016
Fig 3. Timing scheme of D minus 1
The case study where the D minus 1 production scenario implemented is in a company which is use ERP SAP R/3 Enterprise with the module used :
1. Financial Accounting(FI) 2. Controlling(CO) 3. Sales and Distribution(SD) 4. Materials Managements(MM) 5. Production Planning(PP)
The ERP SAP is acronym of Enterprise Resource Planning(ERP) and Systems, Applications and Products(SAP). The company implemented ERP SAP System went live since July 2013, the result of implementation is not as well as expected. Especially in the production floor , information of every aspects of production in production floor not real time available. The information always late and the impact is waste in the production floor rise up drastically, also frustrate of administration people which operating ERP SAP system because administration of operating the ERP SAP system slower then production time. The components have been reach assembly station but the information of the components still left behind, no data of the components have been issued or received in SAP data base , even the finish good have been receive in the ware house but without transaction document.
Some time the ware house operators distribute the product to the customer as scheduled using manual documentation for product shipment, but not use directly documented out from SAP system, the result is billing could not be send to the customer although the goods have been received by customers. The worst case is in the end of the years, financial departments can not close the report because the huge differences of the stock on all production unit and very difficult to balance this stock differences. This potentially make huge loses for the company.
II. METHODOLOGY OF SIMULATION AND INFORMATION DASHBOARD DESIGN One of performance indicators of production floor is the ability of the production floor to deliver the product on time,
which is related with the production capacity and customer demand. This relation is about the closeness of cycle time to finish a product with the takt time that is demand time to finish a product of the total customer order in the such time available to produce the product. For example cycle time of a product is 24 minute, for a day customer demand is 40 units , available time for one shift production is 8 hours(480 minute), the output from production floor need takt time 480/40=12 minute for 1 units. Cycle time higher than takt time it is mean failure to deliver the product because capacity of production floor is only 480/24= 20 units lower than customer demand.
To solve this problems, difference between cycle time must be balance, the scenario of production must provide available time higher . To provide higher available time there are two solution that is use double shift of production or make double of line production. For this example if use double shift , then available time is 960 min and takt time 24 minute, it is balance with cycle time.
For multi stage production the need of balance time must be done in all production stage to assure the flow of material is one pieces flow . Condition unbalance is call as bottle neck, if this happen output of the production floor lower than target, the impact is product can not deliver on time even in the worst case the company failure to deliver product to customers.
Beside the time balance, some factor affecting delivery performance is disturbance in the system mainly is supply components. If the supply chain system can not supply or late supply components complete with the right quality and in the right time it is make failure of delivery of the goods to customers. For this reason, in the production floor must be available tools to make process simulation to show the balance of cycle time and takt time before make production schedule also must be available production information about condition of components supply, and for this reason the objectives of this study is:
1888© IEOM Society International
Proceedings of the 2016 International Conference on Industrial Engineering and Operations Management Kuala Lumpur, Malaysia, March 8-10, 2016
1. To develop tool to simulate production planning in the production floor to make balance between capacity with the customer demand. 2. To develop manufacturing control dashboard in every production stage to control manufacturing process.
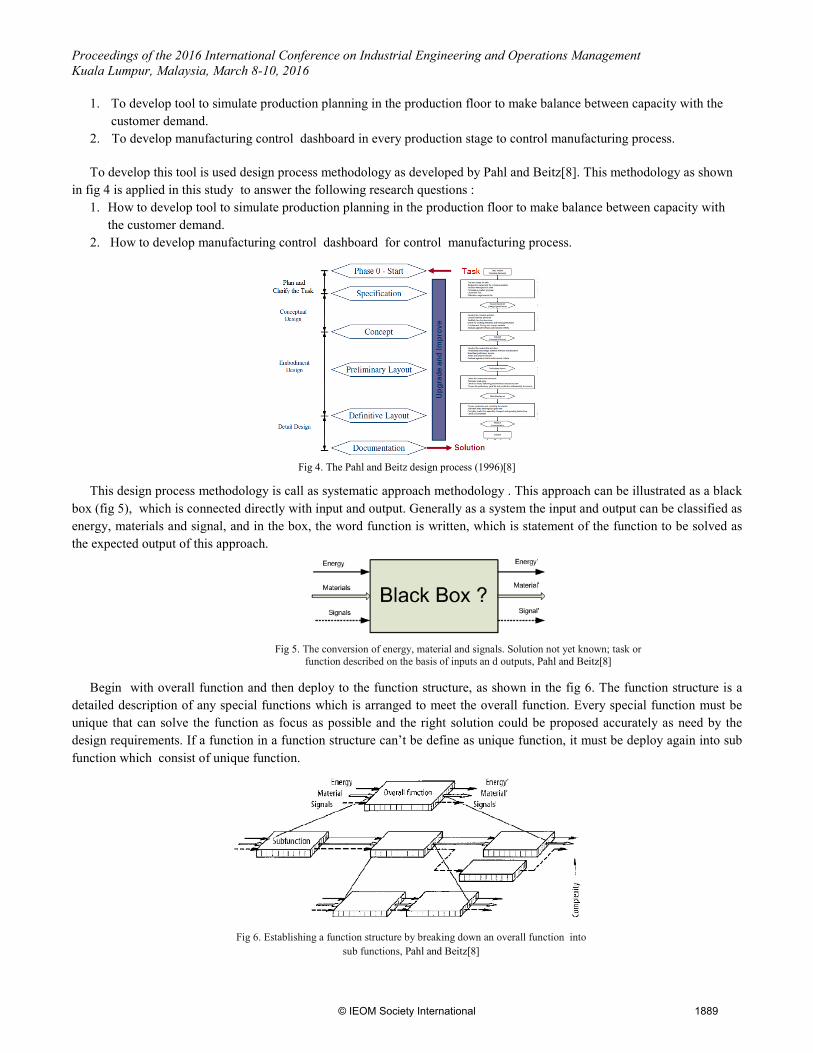
To develop this tool is used design process methodology as developed by Pahl and Beitz[8]. This methodology as shown in fig 4 is applied in this study to answer the following research questions :
1. How to develop tool to simulate production planning in the production floor to make balance between capacity with the customer demand.
2. How to develop manufacturing control dashboard for control manufacturing process.
Fig 4. The Pahl and Beitz design process (1996)[8]
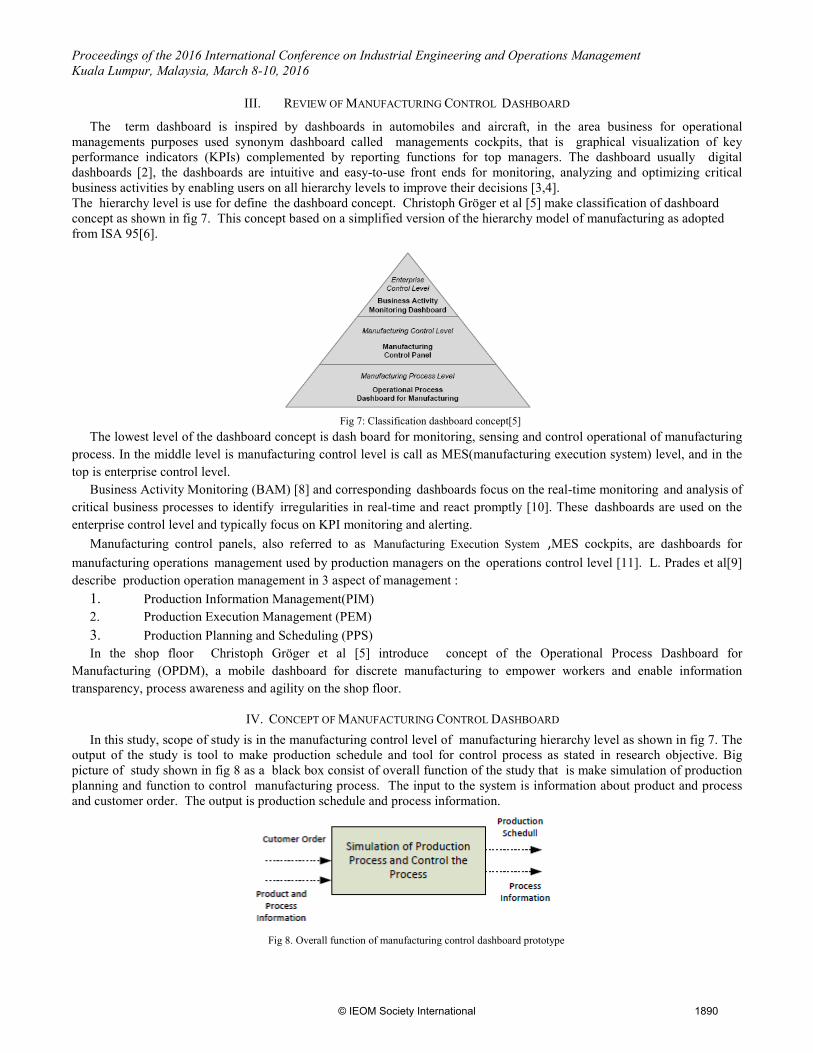
This design process methodology is call as systematic approach methodology . This approach can be illustrated as a black box (fig 5), which is connected directly with input and output. Generally as a system the input and output can be classified as energy, materials and signal, and in the box, the word function is written, which is statement of the function to be solved as the expected output of this approach.
Fig 5. The conversion of energy, material and signals. Solution not yet known; task or
function described on the basis of inputs an d outputs, Pahl and Beitz[8]
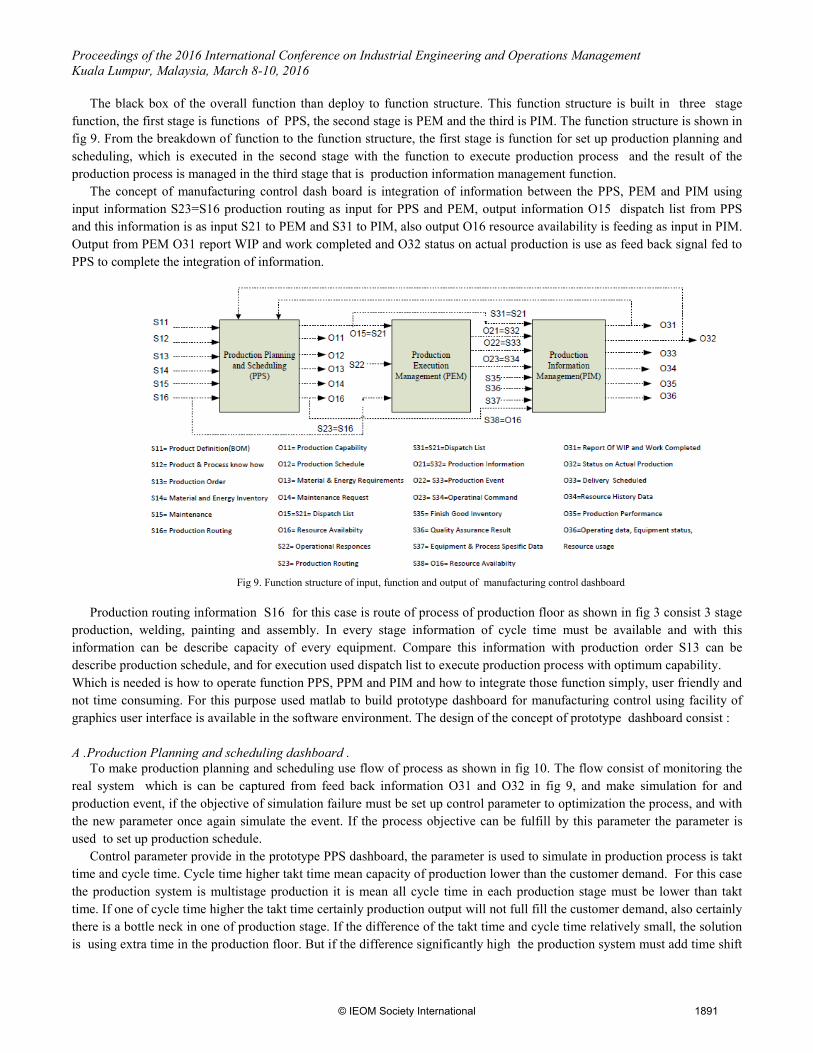
Begin with overall function and then deploy to the function structure, as shown in the fig 6. The function structure is a detailed description of any special functions which is arranged to meet the overall function. Every special function must be unique that can solve the function as focus as possible and the right solution could be proposed accurately as need by the design requirements. If a function in a function structure can’t be define as unique function, it must be deploy again into sub function which consist of unique function.
Fig 6. Establishing a function structure by breaking down an overall function into
sub functions, Pahl and Beitz[8]
1889© IEOM Society International
Proceedings of the 2016 International Conference on Industrial Engineering and Operations Management Kuala Lumpur, Malaysia, March 8-10, 2016
III. REVIEW OF MANUFACTURING CONTROL DASHBOARD
The term dashboard is inspired by dashboards in automobiles and aircraft, in the area business for operational managements purposes used synonym dashboard called managements cockpits, that is graphical visualization of key performance indicators (KPIs) complemented by reporting functions for top managers. The dashboard usually digital dashboards [2], the dashboards are intuitive and easy-to-use front ends for monitoring, analyzing and optimizing critical business activities by enabling users on all hierarchy levels to improve their decisions [3,4]. The hierarchy level is use for define the dashboard concept. Christoph Gröger et al [5] make classification of dashboard concept as shown in fig 7. This concept based on a simplified version of the hierarchy model of manufacturing as adopted from ISA 95[6].
Fig 7: Classification dashboard concept[5]
The lowest level of the dashboard concept is dash board for monitoring, sensing and control operational of manufacturing process. In the middle level is manufacturing control level is call as MES(manufacturing execution system) level, and in the top is enterprise control level.
Business Activity Monitoring (BAM) [8] and corresponding dashboards focus on the real-time monitoring and analysis of critical business processes to identify irregularities in real-time and react promptly [10]. These dashboards are used on the enterprise control level and typically focus on KPI monitoring and alerting.
Manufacturing control panels, also referred to as Manufacturing Execution System ,MES cockpits, are dashboards for manufacturing operations management used by production managers on the operations control level [11]. L. Prades et al[9] describe production operation management in 3 aspect of management :
1. Production Information Management(PIM) 2. Production Execution Management (PEM) 3. Production Planning and Scheduling (PPS) In the shop floor Christoph Gröger et al [5] introduce concept of the Operational Process Dashboard for
Manufacturing (OPDM), a mobile dashboard for discrete manufacturing to empower workers and enable information transparency, process awareness and agility on the shop floor.
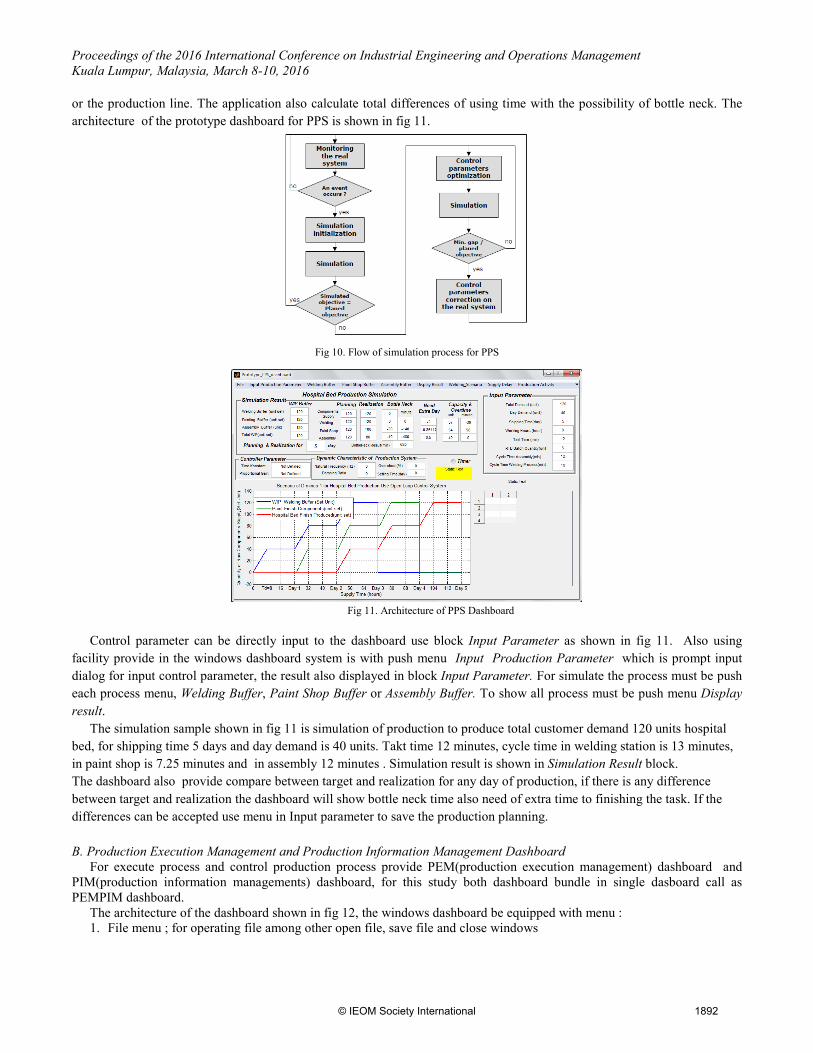
IV. CONCEPT OF MANUFACTURING CONTROL DASHBOARD In this study, scope of study is in the manufacturing control level of manufacturing hierarchy level as shown in fig 7. The
output of the study is tool to make production schedule and tool for control process as stated in research objective. Big picture of study shown in fig 8 as a black box consist of overall function of the study that is make simulation of production planning and function to control manufacturing process. The input to the system is information about product and process and customer order. The output is production schedule and process information.
Fig 8. Overall function of manufacturing control dashboard prototype
1890© IEOM Society International
Proceedings of the 2016 International Conference on Industrial Engineering and Operations Management Kuala Lumpur, Malaysia, March 8-10, 2016
The black box of the overall function than deploy to function structure. This function structure is built in three stage function, the first stage is functions of PPS, the second stage is PEM and the third is PIM. The function structure is shown in fig 9. From the breakdown of function to the function structure, the first stage is function for set up production planning and scheduling, which is executed in the second stage with the function to execute production process and the result of the production process is managed in the third stage that is production information management function.
The concept of manufacturing control dash board is integration of information between the PPS, PEM and PIM using input information S23=S16 production routing as input for PPS and PEM, output information O15 dispatch list from PPS and this information is as input S21 to PEM and S31 to PIM, also output O16 resource availability is feeding as input in PIM. Output from PEM O31 report WIP and work completed and O32 status on actual production is use as feed back signal fed to PPS to complete the integration of information.
Fig 9. Function structure of input, function and output of manufacturing control dashboard
Production routing information S16 for this case is route of process of production floor as shown in fig 3 consist 3 stage
production, welding, painting and assembly. In every stage information of cycle time must be available and with this information can be describe capacity of every equipment. Compare this information with production order S13 can be describe production schedule, and for execution used dispatch list to execute production process with optimum capability. Which is needed is how to operate function PPS, PPM and PIM and how to integrate those function simply, user friendly and not time consuming. For this purpose used matlab to build prototype dashboard for manufacturing control using facility of graphics user interface is available in the software environment. The design of the concept of prototype dashboard consist : A .Production Planning and scheduling dashboard .
To make production planning and scheduling use flow of process as shown in fig 10. The flow consist of monitoring the real system which is can be captured from feed back information O31 and O32 in fig 9, and make simulation for and production event, if the objective of simulation failure must be set up control parameter to optimization the process, and with the new parameter once again simulate the event. If the process objective can be fulfill by this parameter the parameter is used to set up production schedule.
Control parameter provide in the prototype PPS dashboard, the parameter is used to simulate in production process is takt time and cycle time. Cycle time higher takt time mean capacity of production lower than the customer demand. For this case the production system is multistage production it is mean all cycle time in each production stage must be lower than takt time. If one of cycle time higher the takt time certainly production output will not full fill the customer demand, also certainly there is a bottle neck in one of production stage. If the difference of the takt time and cycle time relatively small, the solution is using extra time in the production floor. But if the difference significantly high the production system must add time shift
1891© IEOM Society International
Proceedings of the 2016 International Conference on Industrial Engineering and Operations Management Kuala Lumpur, Malaysia, March 8-10, 2016
or the production line. The application also calculate total differences of using time with the possibility of bottle neck. The architecture of the prototype dashboard for PPS is shown in fig 11.
Fig 10. Flow of simulation process for PPS
Fig 11. Architecture of PPS Dashboard
Control parameter can be directly input to the dashboard use block Input Parameter as shown in fig 11. Also using facility provide in the windows dashboard system is with push menu Input Production Parameter which is prompt input dialog for input control parameter, the result also displayed in block Input Parameter. For simulate the process must be push each process menu, Welding Buffer, Paint Shop Buffer or Assembly Buffer. To show all process must be push menu Display result.
The simulation sample shown in fig 11 is simulation of production to produce total customer demand 120 units hospital bed, for shipping time 5 days and day demand is 40 units. Takt time 12 minutes, cycle time in welding station is 13 minutes, in paint shop is 7.25 minutes and in assembly 12 minutes . Simulation result is shown in Simulation Result block. The dashboard also provide compare between target and realization for any day of production, if there is any difference between target and realization the dashboard will show bottle neck time also need of extra time to finishing the task. If the differences can be accepted use menu in Input parameter to save the production planning. B. Production Execution Management and Production Information Management Dashboard
For execute process and control production process provide PEM(production execution management) dashboard and PIM(production information managements) dashboard, for this study both dashboard bundle in single dasboard call as PEMPIM dashboard.
The architecture of the dashboard shown in fig 12, the windows dashboard be equipped with menu : 1. File menu ; for operating file among other open file, save file and close windows
1892© IEOM Society International
Proceedings of the 2016 International Conference on Industrial Engineering and Operations Management Kuala Lumpur, Malaysia, March 8-10, 2016
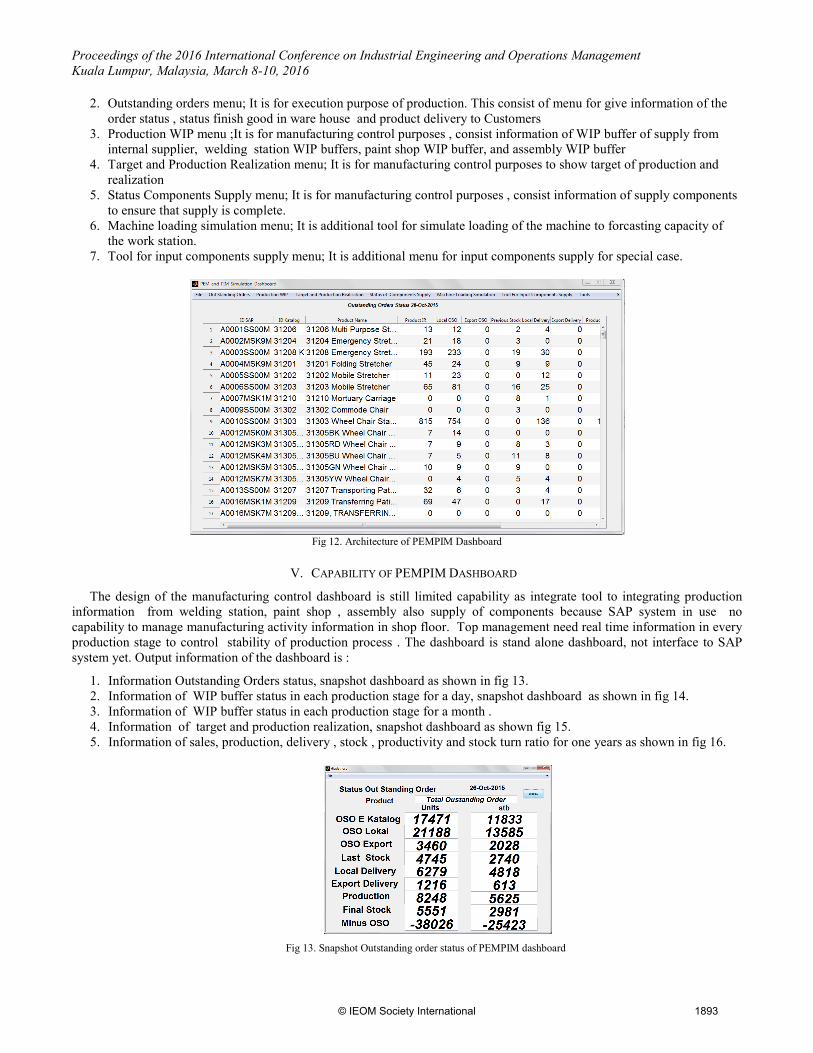
2. Outstanding orders menu; It is for execution purpose of production. This consist of menu for give information of the order status , status finish good in ware house and product delivery to Customers
3. Production WIP menu ;It is for manufacturing control purposes , consist information of WIP buffer of supply from internal supplier, welding station WIP buffers, paint shop WIP buffer, and assembly WIP buffer
4. Target and Production Realization menu; It is for manufacturing control purposes to show target of production and realization
5. Status Components Supply menu; It is for manufacturing control purposes , consist information of supply components to ensure that supply is complete.
6. Machine loading simulation menu; It is additional tool for simulate loading of the machine to forcasting capacity of the work station.
7. Tool for input components supply menu; It is additional menu for input components supply for special case.
Fig 12. Architecture of PEMPIM Dashboard
V. CAPABILITY OF PEMPIM DASHBOARD
The design of the manufacturing control dashboard is still limited capability as integrate tool to integrating production information from welding station, paint shop , assembly also supply of components because SAP system in use no capability to manage manufacturing activity information in shop floor. Top management need real time information in every production stage to control stability of production process . The dashboard is stand alone dashboard, not interface to SAP system yet. Output information of the dashboard is :
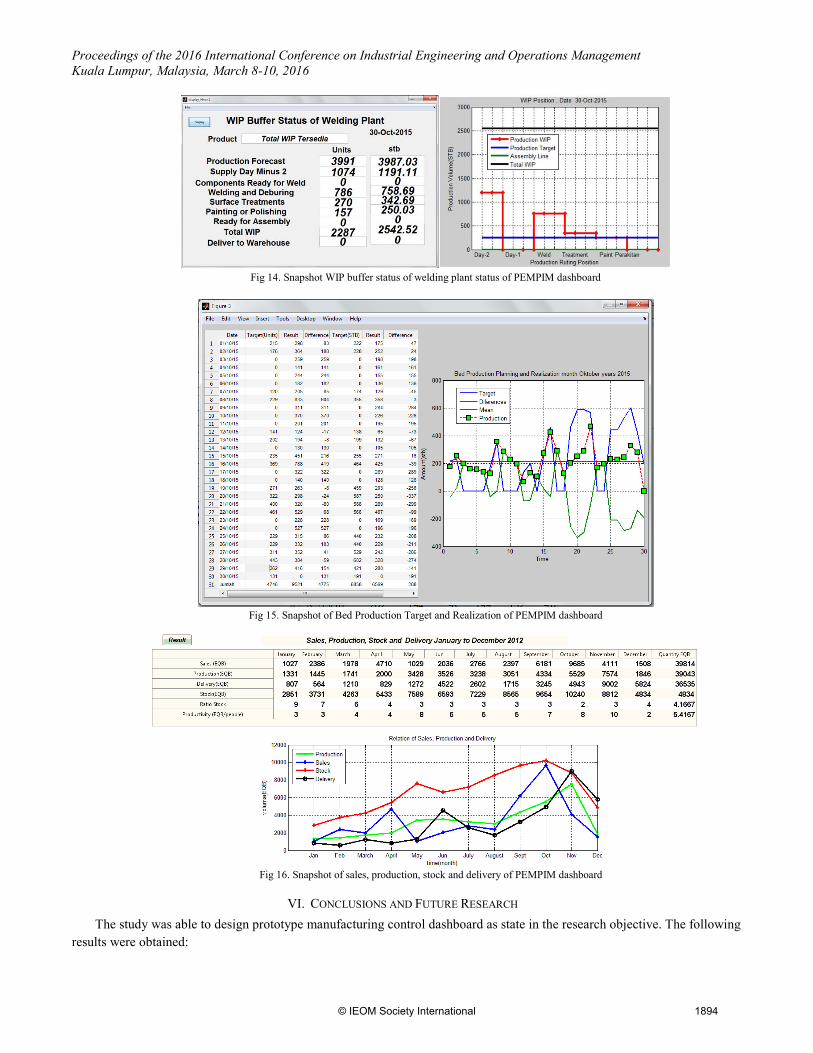
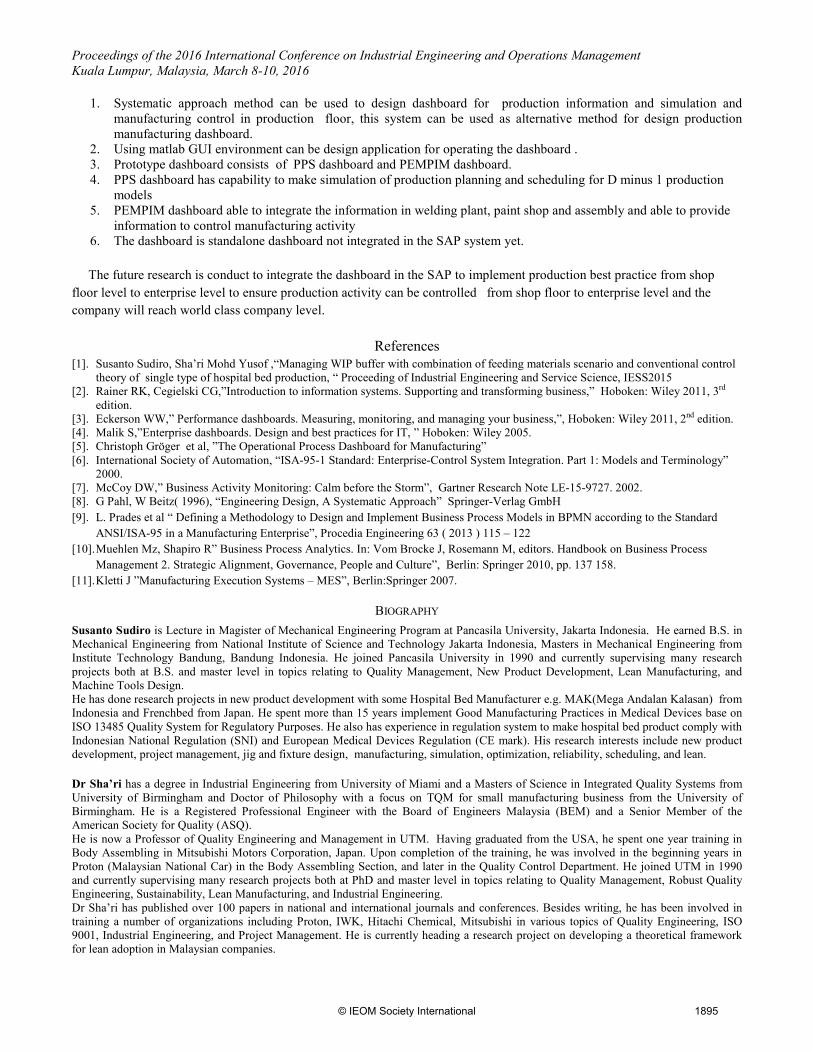
1. Information Outstanding Orders status, snapshot dashboard as shown in fig 13. 2. Information of WIP buffer status in each production stage for a day, snapshot dashboard as shown in fig 14. 3. Information of WIP buffer status in each production stage for a month . 4. Information of target and production realization, snapshot dashboard as shown fig 15. 5. Information of sales, production, delivery , stock , productivity and stock turn ratio for one years as shown in fig 16.
Fig 13. Snapshot Outstanding order status of PEMPIM dashboard
1893© IEOM Society International
Proceedings of the 2016 International Conference on Industrial Engineering and Operations Management Kuala Lumpur, Malaysia, March 8-10, 2016
Fig 14. Snapshot WIP buffer status of welding plant status of PEMPIM dashboard
Fig 15. Snapshot of Bed Production Target and Realization of PEMPIM dashboard
Fig 16. Snapshot of sales, production, stock and delivery of PEMPIM dashboard
VI. CONCLUSIONS AND FUTURE RESEARCH The study was able to design prototype manufacturing control dashboard as state in the research objective. The following results were obtained:
1894© IEOM Society International
Proceedings of the 2016 International Conference on Industrial Engineering and Operations Management Kuala Lumpur, Malaysia, March 8-10, 2016
1. Systematic approach method can be used to design dashboard for production information and simulation andmanufacturing control in production floor, this system can be used as alternative method for design productionmanufacturing dashboard.
2. Using matlab GUI environment can be design application for operating the dashboard .3. Prototype dashboard consists of PPS dashboard and PEMPIM dashboard.4. PPS dashboard has capability to make simulation of production planning and scheduling for D minus 1 production
models5. PEMPIM dashboard able to integrate the information in welding plant, paint shop and assembly and able to provide
information to control manufacturing activity6. The dashboard is standalone dashboard not integrated in the SAP system yet.
The future research is conduct to integrate the dashboard in the SAP to implement production best practice from shop floor level to enterprise level to ensure production activity can be controlled from shop floor to enterprise level and the company will reach world class company level.
References [1]. Susanto Sudiro, Sha’ri Mohd Yusof ,“Managing WIP buffer with combination of feeding materials scenario and conventional control
theory of single type of hospital bed production, “ Proceeding of Industrial Engineering and Service Science, IESS2015 [2]. Rainer RK, Cegielski CG,”Introduction to information systems. Supporting and transforming business,” Hoboken: Wiley 2011, 3rd
edition. [3]. Eckerson WW,” Performance dashboards. Measuring, monitoring, and managing your business,”, Hoboken: Wiley 2011, 2nd edition. [4]. Malik S,”Enterprise dashboards. Design and best practices for IT, ” Hoboken: Wiley 2005. [5]. Christoph Gröger et al, ”The Operational Process Dashboard for Manufacturing” [6]. International Society of Automation, “ISA-95-1 Standard: Enterprise-Control System Integration. Part 1: Models and Terminology”
2000. [7]. McCoy DW,” Business Activity Monitoring: Calm before the Storm”, Gartner Research Note LE-15-9727. 2002. [8]. G Pahl, W Beitz( 1996), “Engineering Design, A Systematic Approach” Springer-Verlag GmbH [9]. L. Prades et al “ Defining a Methodology to Design and Implement Business Process Models in BPMN according to the Standard
ANSI/ISA-95 in a Manufacturing Enterprise”, Procedia Engineering 63 ( 2013 ) 115 – 122 [10]. Muehlen Mz, Shapiro R” Business Process Analytics. In: Vom Brocke J, Rosemann M, editors. Handbook on Business Process
Management 2. Strategic Alignment, Governance, People and Culture”, Berlin: Springer 2010, pp. 137 158. [11]. Kletti J ”Manufacturing Execution Systems – MES”, Berlin:Springer 2007.
BIOGRAPHY Susanto Sudiro is Lecture in Magister of Mechanical Engineering Program at Pancasila University, Jakarta Indonesia. He earned B.S. in Mechanical Engineering from National Institute of Science and Technology Jakarta Indonesia, Masters in Mechanical Engineering from Institute Technology Bandung, Bandung Indonesia. He joined Pancasila University in 1990 and currently supervising many research projects both at B.S. and master level in topics relating to Quality Management, New Product Development, Lean Manufacturing, and Machine Tools Design. He has done research projects in new product development with some Hospital Bed Manufacturer e.g. MAK(Mega Andalan Kalasan) from Indonesia and Frenchbed from Japan. He spent more than 15 years implement Good Manufacturing Practices in Medical Devices base on ISO 13485 Quality System for Regulatory Purposes. He also has experience in regulation system to make hospital bed product comply with Indonesian National Regulation (SNI) and European Medical Devices Regulation (CE mark). His research interests include new product development, project management, jig and fixture design, manufacturing, simulation, optimization, reliability, scheduling, and lean.
Dr Sha’ri has a degree in Industrial Engineering from University of Miami and a Masters of Science in Integrated Quality Systems from University of Birmingham and Doctor of Philosophy with a focus on TQM for small manufacturing business from the University of Birmingham. He is a Registered Professional Engineer with the Board of Engineers Malaysia (BEM) and a Senior Member of the American Society for Quality (ASQ). He is now a Professor of Quality Engineering and Management in UTM. Having graduated from the USA, he spent one year training in Body Assembling in Mitsubishi Motors Corporation, Japan. Upon completion of the training, he was involved in the beginning years in Proton (Malaysian National Car) in the Body Assembling Section, and later in the Quality Control Department. He joined UTM in 1990 and currently supervising many research projects both at PhD and master level in topics relating to Quality Management, Robust Quality Engineering, Sustainability, Lean Manufacturing, and Industrial Engineering. Dr Sha’ri has published over 100 papers in national and international journals and conferences. Besides writing, he has been involved in training a number of organizations including Proton, IWK, Hitachi Chemical, Mitsubishi in various topics of Quality Engineering, ISO 9001, Industrial Engineering, and Project Management. He is currently heading a research project on developing a theoretical framework for lean adoption in Malaysian companies.
1895© IEOM Society International


![FinalThesis Suvarna Nandyal-0603PH0654OnlyTextshodhganga.inflibnet.ac.in/bitstream/10603/20652/... · 275 [7] Abdul Kadir, Lukito Edi Nugroho, Adhi Susanto, Paulus Insap Santosa,](https://img.pdfslide.us/doc/110x75/602cb72d3ed1873df8050501/finalthesis-suvarna-nandyal-0603ph06-275-7-abdul-kadir-lukito-edi-nugroho-adhi.jpg)