Embed Size (px)
Citation preview
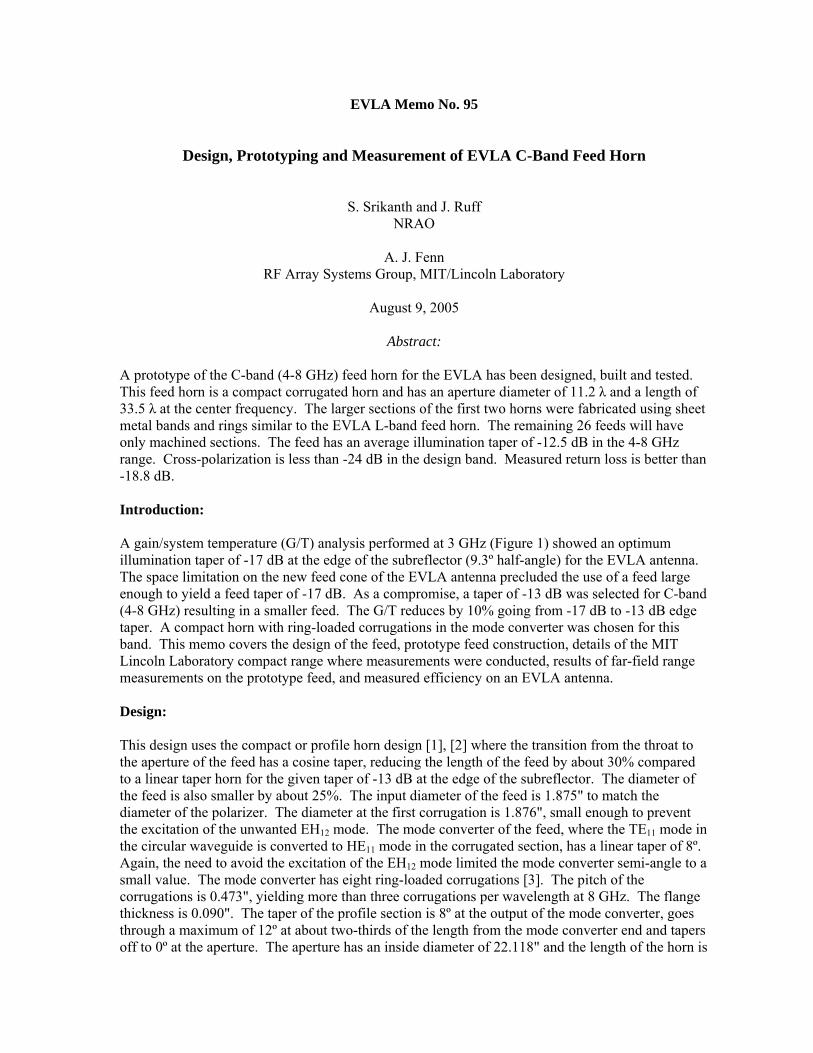
EVLA Memo No. 95
Design, Prototyping and Measurement of EVLA C-Band Feed Horn
S. Srikanth and J. Ruff NRAO
A. J. Fenn
RF Array Systems Group, MIT/Lincoln Laboratory
August 9, 2005
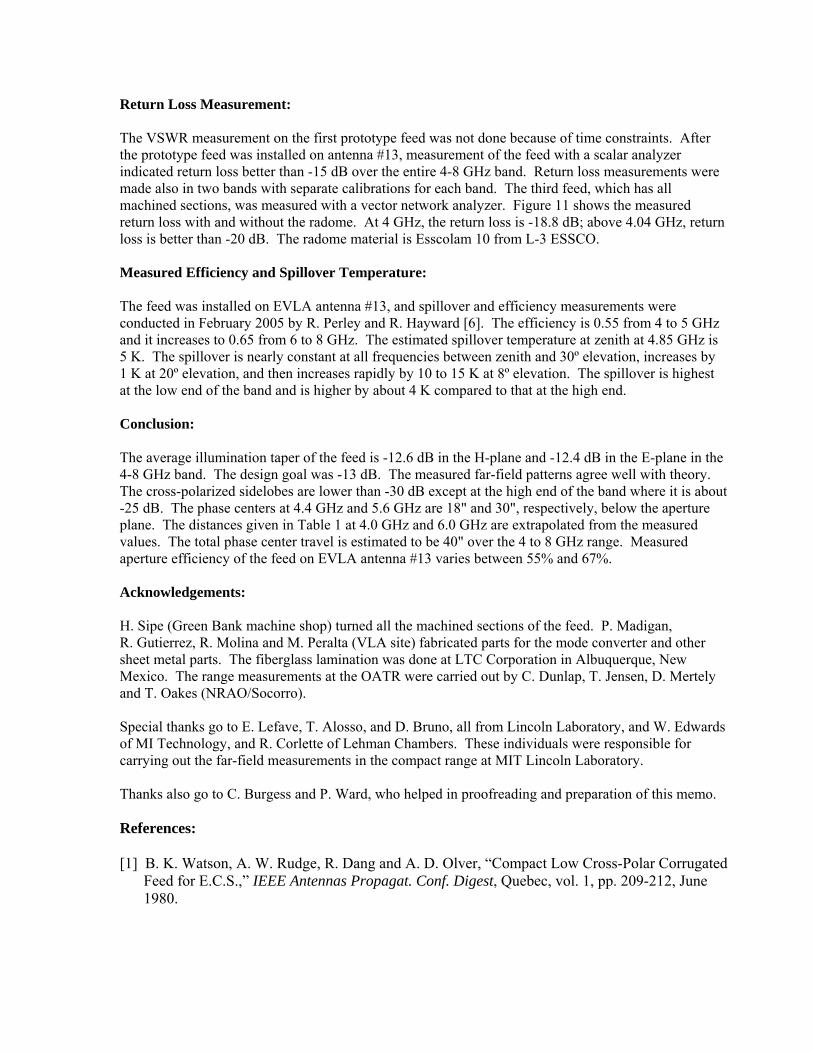
Abstract: A prototype of the C-band (4-8 GHz) feed horn for the EVLA has been designed, built and tested. This feed horn is a compact corrugated horn and has an aperture diameter of 11.2 λ and a length of 33.5 λ at the center frequency. The larger sections of the first two horns were fabricated using sheet metal bands and rings similar to the EVLA L-band feed horn. The remaining 26 feeds will have only machined sections. The feed has an average illumination taper of -12.5 dB in the 4-8 GHz range. Cross-polarization is less than -24 dB in the design band. Measured return loss is better than -18.8 dB. Introduction: A gain/system temperature (G/T) analysis performed at 3 GHz (Figure 1) showed an optimum illumination taper of -17 dB at the edge of the subreflector (9.3º half-angle) for the EVLA antenna. The space limitation on the new feed cone of the EVLA antenna precluded the use of a feed large enough to yield a feed taper of -17 dB. As a compromise, a taper of -13 dB was selected for C-band (4-8 GHz) resulting in a smaller feed. The G/T reduces by 10% going from -17 dB to -13 dB edge taper. A compact horn with ring-loaded corrugations in the mode converter was chosen for this band. This memo covers the design of the feed, prototype feed construction, details of the MIT Lincoln Laboratory compact range where measurements were conducted, results of far-field range measurements on the prototype feed, and measured efficiency on an EVLA antenna. Design: This design uses the compact or profile horn design [1], [2] where the transition from the throat to the aperture of the feed has a cosine taper, reducing the length of the feed by about 30% compared to a linear taper horn for the given taper of -13 dB at the edge of the subreflector. The diameter of the feed is also smaller by about 25%. The input diameter of the feed is 1.875" to match the diameter of the polarizer. The diameter at the first corrugation is 1.876", small enough to prevent the excitation of the unwanted EH12 mode. The mode converter of the feed, where the TE11 mode in the circular waveguide is converted to HE11 mode in the corrugated section, has a linear taper of 8º. Again, the need to avoid the excitation of the EH12 mode limited the mode converter semi-angle to a small value. The mode converter has eight ring-loaded corrugations [3]. The pitch of the corrugations is 0.473", yielding more than three corrugations per wavelength at 8 GHz. The flange thickness is 0.090". The taper of the profile section is 8º at the output of the mode converter, goes through a maximum of 12º at about two-thirds of the length from the mode converter end and tapers off to 0º at the aperture. The aperture has an inside diameter of 22.118" and the length of the horn is
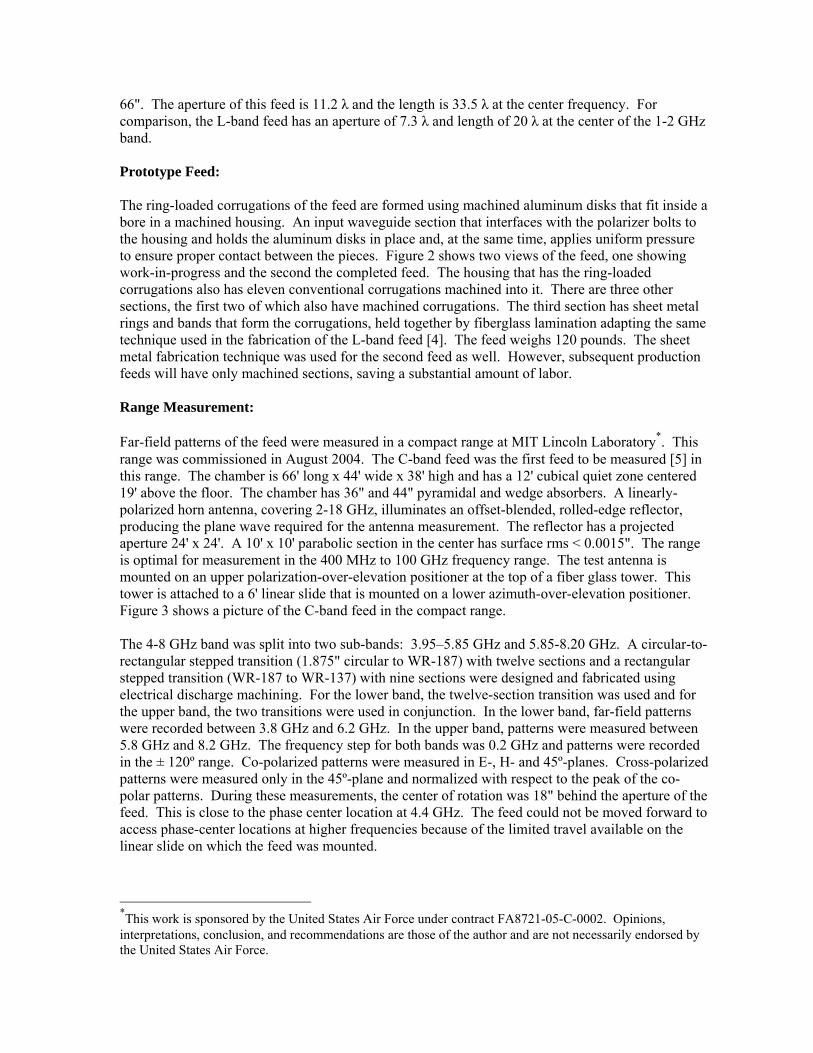
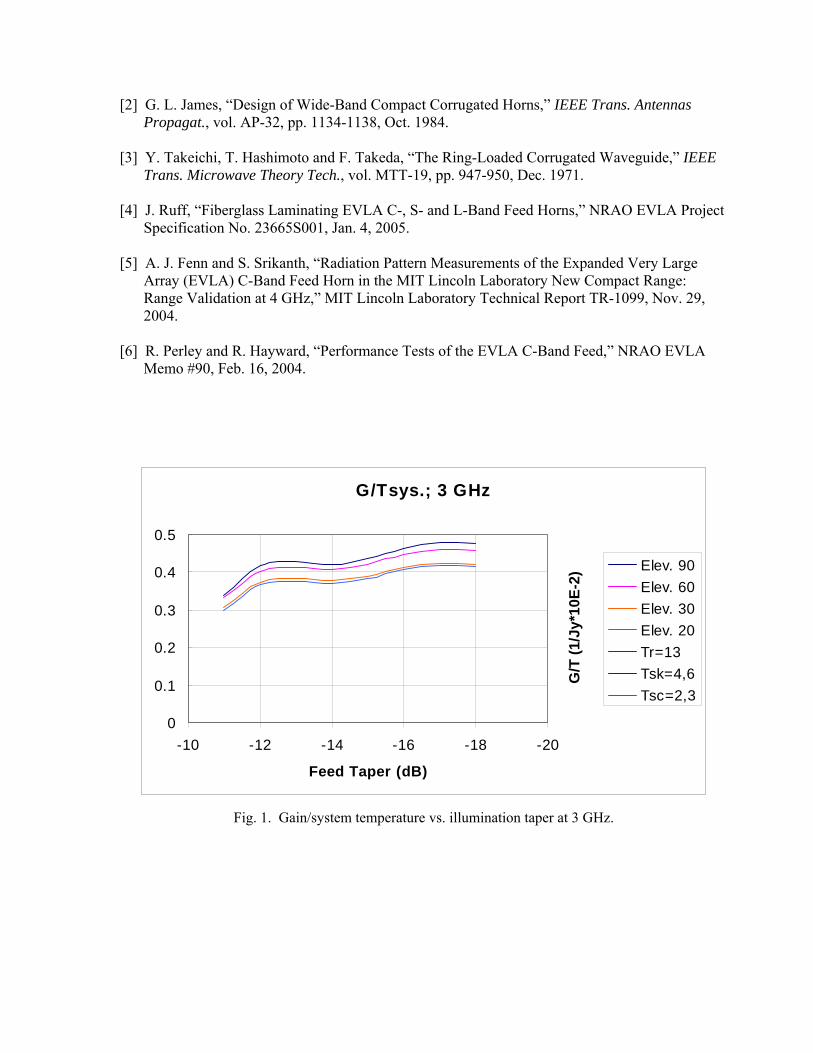
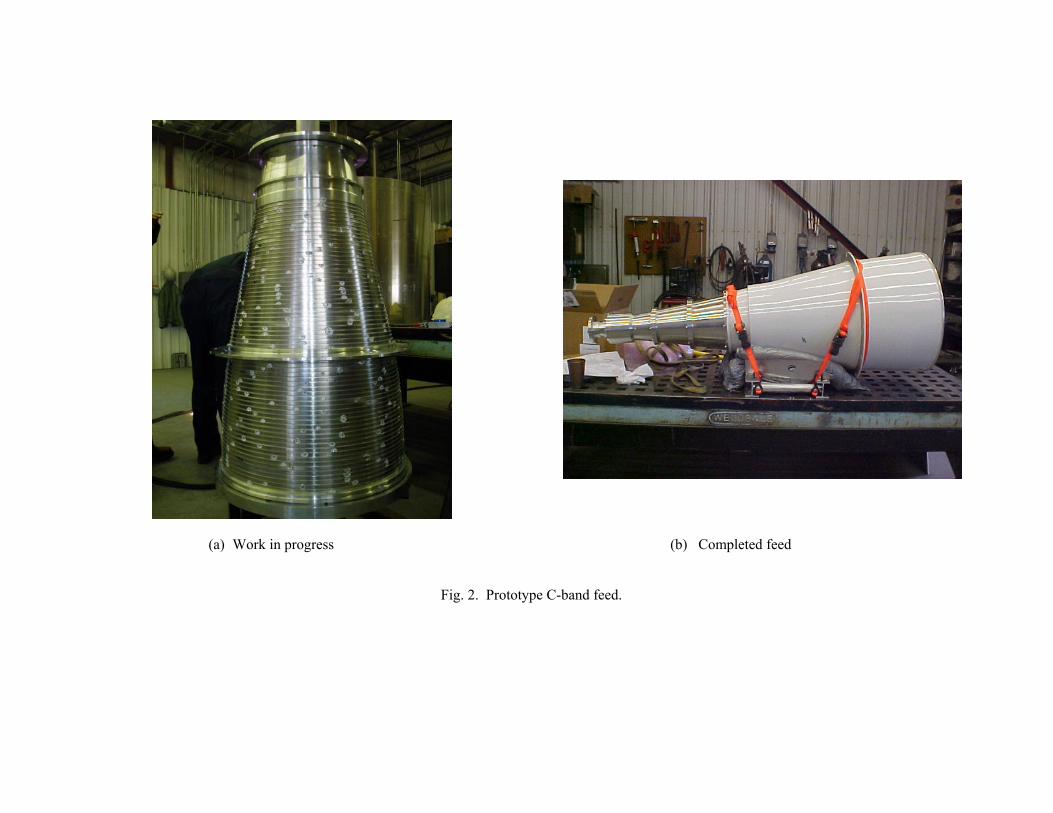
66". The aperture of this feed is 11.2 λ and the length is 33.5 λ at the center frequency. For comparison, the L-band feed has an aperture of 7.3 λ and length of 20 λ at the center of the 1-2 GHz band. Prototype Feed: The ring-loaded corrugations of the feed are formed using machined aluminum disks that fit inside a bore in a machined housing. An input waveguide section that interfaces with the polarizer bolts to the housing and holds the aluminum disks in place and, at the same time, applies uniform pressure to ensure proper contact between the pieces. Figure 2 shows two views of the feed, one showing work-in-progress and the second the completed feed. The housing that has the ring-loaded corrugations also has eleven conventional corrugations machined into it. There are three other sections, the first two of which also have machined corrugations. The third section has sheet metal rings and bands that form the corrugations, held together by fiberglass lamination adapting the same technique used in the fabrication of the L-band feed [4]. The feed weighs 120 pounds. The sheet metal fabrication technique was used for the second feed as well. However, subsequent production feeds will have only machined sections, saving a substantial amount of labor. Range Measurement: Far-field patterns of the feed were measured in a compact range at MIT Lincoln Laboratory*. This range was commissioned in August 2004. The C-band feed was the first feed to be measured [5] in this range. The chamber is 66' long x 44' wide x 38' high and has a 12' cubical quiet zone centered 19' above the floor. The chamber has 36" and 44" pyramidal and wedge absorbers. A linearly-polarized horn antenna, covering 2-18 GHz, illuminates an offset-blended, rolled-edge reflector, producing the plane wave required for the antenna measurement. The reflector has a projected aperture 24' x 24'. A 10' x 10' parabolic section in the center has surface rms < 0.0015". The range is optimal for measurement in the 400 MHz to 100 GHz frequency range. The test antenna is mounted on an upper polarization-over-elevation positioner at the top of a fiber glass tower. This tower is attached to a 6' linear slide that is mounted on a lower azimuth-over-elevation positioner. Figure 3 shows a picture of the C-band feed in the compact range. The 4-8 GHz band was split into two sub-bands: 3.95–5.85 GHz and 5.85-8.20 GHz. A circular-to-rectangular stepped transition (1.875" circular to WR-187) with twelve sections and a rectangular stepped transition (WR-187 to WR-137) with nine sections were designed and fabricated using electrical discharge machining. For the lower band, the twelve-section transition was used and for the upper band, the two transitions were used in conjunction. In the lower band, far-field patterns were recorded between 3.8 GHz and 6.2 GHz. In the upper band, patterns were measured between 5.8 GHz and 8.2 GHz. The frequency step for both bands was 0.2 GHz and patterns were recorded in the ± 120º range. Co-polarized patterns were measured in E-, H- and 45º-planes. Cross-polarized patterns were measured only in the 45º-plane and normalized with respect to the peak of the co-polar patterns. During these measurements, the center of rotation was 18" behind the aperture of the feed. This is close to the phase center location at 4.4 GHz. The feed could not be moved forward to access phase-center locations at higher frequencies because of the limited travel available on the linear slide on which the feed was mounted.
*This work is sponsored by the United States Air Force under contract FA8721-05-C-0002. Opinions, interpretations, conclusion, and recommendations are those of the author and are not necessarily endorsed by the United States Air Force.
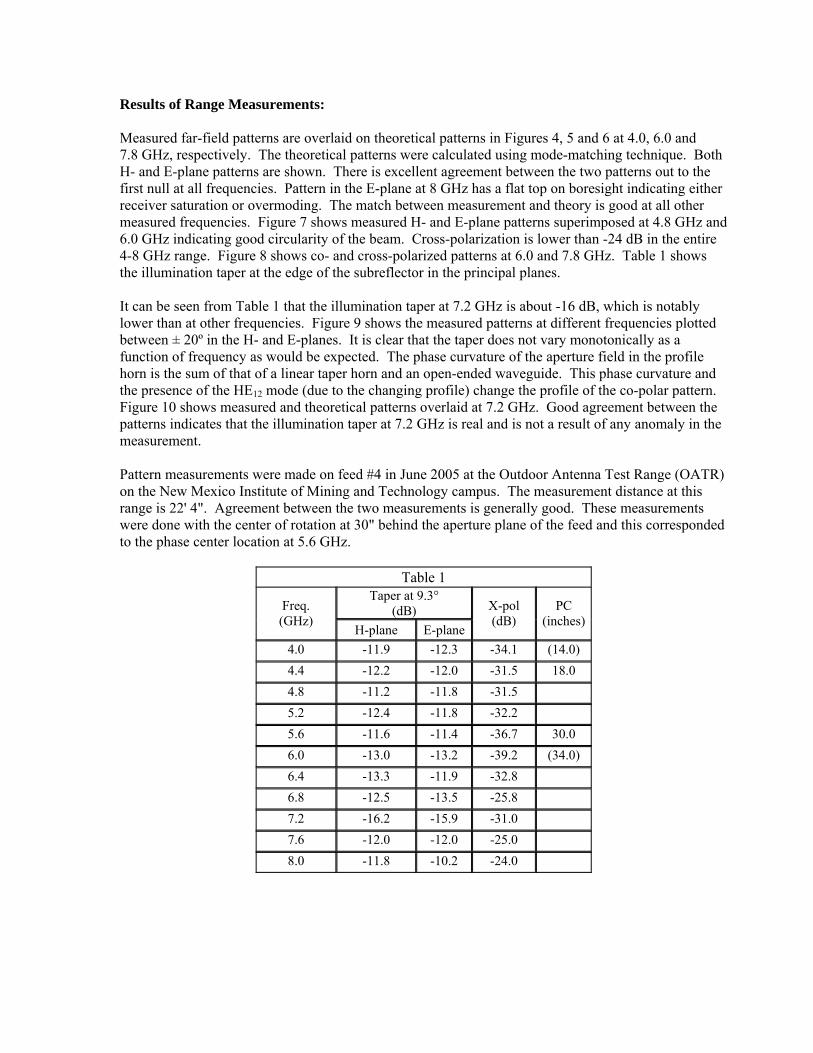
Results of Range Measurements: Measured far-field patterns are overlaid on theoretical patterns in Figures 4, 5 and 6 at 4.0, 6.0 and 7.8 GHz, respectively. The theoretical patterns were calculated using mode-matching technique. Both H- and E-plane patterns are shown. There is excellent agreement between the two patterns out to the first null at all frequencies. Pattern in the E-plane at 8 GHz has a flat top on boresight indicating either receiver saturation or overmoding. The match between measurement and theory is good at all other measured frequencies. Figure 7 shows measured H- and E-plane patterns superimposed at 4.8 GHz and 6.0 GHz indicating good circularity of the beam. Cross-polarization is lower than -24 dB in the entire 4-8 GHz range. Figure 8 shows co- and cross-polarized patterns at 6.0 and 7.8 GHz. Table 1 shows the illumination taper at the edge of the subreflector in the principal planes. It can be seen from Table 1 that the illumination taper at 7.2 GHz is about -16 dB, which is notably lower than at other frequencies. Figure 9 shows the measured patterns at different frequencies plotted between ± 20º in the H- and E-planes. It is clear that the taper does not vary monotonically as a function of frequency as would be expected. The phase curvature of the aperture field in the profile horn is the sum of that of a linear taper horn and an open-ended waveguide. This phase curvature and the presence of the HE12 mode (due to the changing profile) change the profile of the co-polar pattern. Figure 10 shows measured and theoretical patterns overlaid at 7.2 GHz. Good agreement between the patterns indicates that the illumination taper at 7.2 GHz is real and is not a result of any anomaly in the measurement. Pattern measurements were made on feed #4 in June 2005 at the Outdoor Antenna Test Range (OATR) on the New Mexico Institute of Mining and Technology campus. The measurement distance at this range is 22' 4". Agreement between the two measurements is generally good. These measurements were done with the center of rotation at 30" behind the aperture plane of the feed and this corresponded to the phase center location at 5.6 GHz.
Table 1 Taper at 9.3°
(dB) Freq. (GHz)
H-plane E-plane
X-pol (dB)
PC (inches)
4.0 -11.9 -12.3 -34.1 (14.0) 4.4 -12.2 -12.0 -31.5 18.0 4.8 -11.2 -11.8 -31.5 5.2 -12.4 -11.8 -32.2 5.6 -11.6 -11.4 -36.7 30.0 6.0 -13.0 -13.2 -39.2 (34.0) 6.4 -13.3 -11.9 -32.8 6.8 -12.5 -13.5 -25.8 7.2 -16.2 -15.9 -31.0 7.6 -12.0 -12.0 -25.0 8.0 -11.8 -10.2 -24.0
Return Loss Measurement: The VSWR measurement on the first prototype feed was not done because of time constraints. After the prototype feed was installed on antenna #13, measurement of the feed with a scalar analyzer indicated return loss better than -15 dB over the entire 4-8 GHz band. Return loss measurements were made also in two bands with separate calibrations for each band. The third feed, which has all machined sections, was measured with a vector network analyzer. Figure 11 shows the measured return loss with and without the radome. At 4 GHz, the return loss is -18.8 dB; above 4.04 GHz, return loss is better than -20 dB. The radome material is Esscolam 10 from L-3 ESSCO. Measured Efficiency and Spillover Temperature: The feed was installed on EVLA antenna #13, and spillover and efficiency measurements were conducted in February 2005 by R. Perley and R. Hayward [6]. The efficiency is 0.55 from 4 to 5 GHz and it increases to 0.65 from 6 to 8 GHz. The estimated spillover temperature at zenith at 4.85 GHz is 5 K. The spillover is nearly constant at all frequencies between zenith and 30º elevation, increases by 1 K at 20º elevation, and then increases rapidly by 10 to 15 K at 8º elevation. The spillover is highest at the low end of the band and is higher by about 4 K compared to that at the high end. Conclusion: The average illumination taper of the feed is -12.6 dB in the H-plane and -12.4 dB in the E-plane in the 4-8 GHz band. The design goal was -13 dB. The measured far-field patterns agree well with theory. The cross-polarized sidelobes are lower than -30 dB except at the high end of the band where it is about -25 dB. The phase centers at 4.4 GHz and 5.6 GHz are 18" and 30", respectively, below the aperture plane. The distances given in Table 1 at 4.0 GHz and 6.0 GHz are extrapolated from the measured values. The total phase center travel is estimated to be 40" over the 4 to 8 GHz range. Measured aperture efficiency of the feed on EVLA antenna #13 varies between 55% and 67%. Acknowledgements: H. Sipe (Green Bank machine shop) turned all the machined sections of the feed. P. Madigan, R. Gutierrez, R. Molina and M. Peralta (VLA site) fabricated parts for the mode converter and other sheet metal parts. The fiberglass lamination was done at LTC Corporation in Albuquerque, New Mexico. The range measurements at the OATR were carried out by C. Dunlap, T. Jensen, D. Mertely and T. Oakes (NRAO/Socorro). Special thanks go to E. Lefave, T. Alosso, and D. Bruno, all from Lincoln Laboratory, and W. Edwards of MI Technology, and R. Corlette of Lehman Chambers. These individuals were responsible for carrying out the far-field measurements in the compact range at MIT Lincoln Laboratory. Thanks also go to C. Burgess and P. Ward, who helped in proofreading and preparation of this memo. References: [1] B. K. Watson, A. W. Rudge, R. Dang and A. D. Olver, “Compact Low Cross-Polar Corrugated
Feed for E.C.S.,” IEEE Antennas Propagat. Conf. Digest, Quebec, vol. 1, pp. 209-212, June 1980.
[2] G. L. James, “Design of Wide-Band Compact Corrugated Horns,” IEEE Trans. Antennas Propagat., vol. AP-32, pp. 1134-1138, Oct. 1984.
[3] Y. Takeichi, T. Hashimoto and F. Takeda, “The Ring-Loaded Corrugated Waveguide,” IEEE
Trans. Microwave Theory Tech., vol. MTT-19, pp. 947-950, Dec. 1971. [4] J. Ruff, “Fiberglass Laminating EVLA C-, S- and L-Band Feed Horns,” NRAO EVLA Project
Specification No. 23665S001, Jan. 4, 2005. [5] A. J. Fenn and S. Srikanth, “Radiation Pattern Measurements of the Expanded Very Large
Array (EVLA) C-Band Feed Horn in the MIT Lincoln Laboratory New Compact Range: Range Validation at 4 GHz,” MIT Lincoln Laboratory Technical Report TR-1099, Nov. 29, 2004.
[6] R. Perley and R. Hayward, “Performance Tests of the EVLA C-Band Feed,” NRAO EVLA
Memo #90, Feb. 16, 2004.
G/Tsys.; 3 G
0
0.1
0.2
0.3
0.4
0.5
-16-14-12-10
Feed Taper (dB)
Hz
-20-18
G/T
(1/J
y*10
E-2)
Elev. 90Elev. 60Elev. 30Elev. 20Tr=13Tsk=4,6Tsc=2,3
Fig. 1. Gain/system temperature vs. illumination taper at 3 GHz.
(a) Work in progress (b) Completed feed
Fig. 2. Prototype C-band feed.
Fig. 3. Feed horn installed in the compact range at MIT/Lincoln Laboratory.
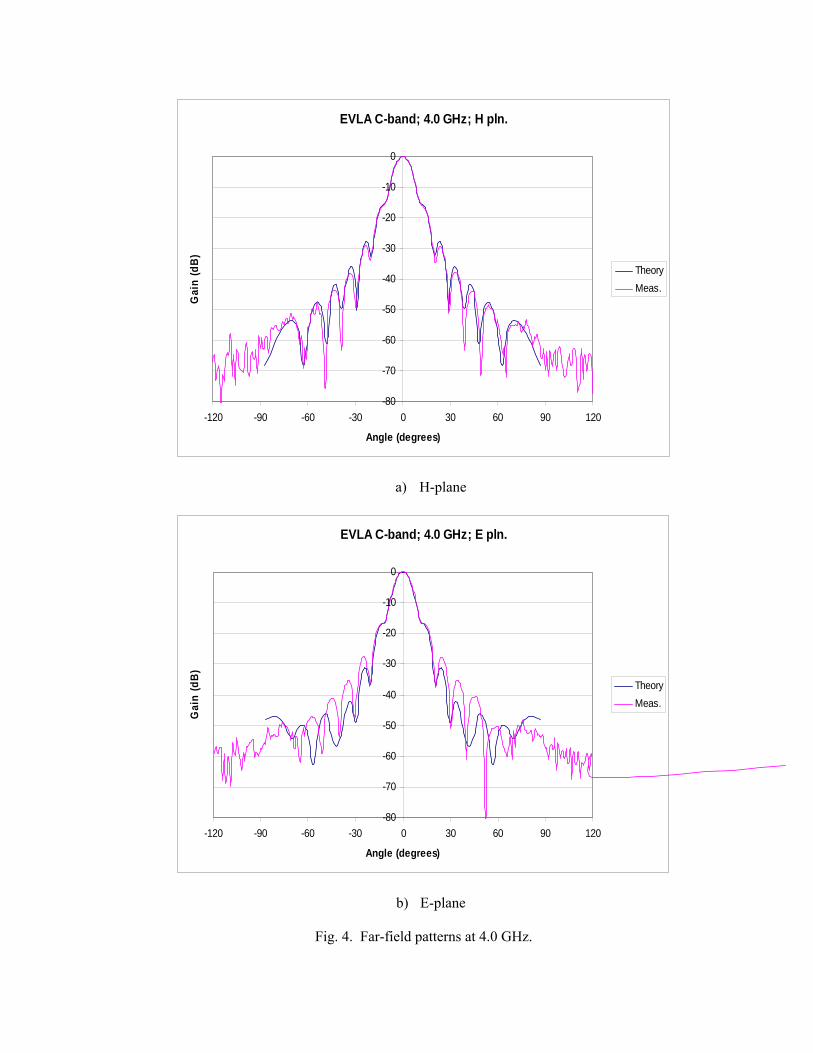
EVLA C-band; 4.0 GHz; H pln.
-80
-70
-60
-50
-40
-30
-20
-10
0
-120 -90 -60 -30 0 30 60 90 120
Angle (degrees)
Gai
n (d
B)
TheoryMeas.
a) H-plane
EVLA C-band; 4.0 GHz; E pln.
-80
-70
-60
-50
-40
-30
-20
-10
0
-120 -90 -60 -30 0 30 60 90 120
Angle (degrees)
Gai
n (d
B)
TheoryMeas.
b) E-plane
Fig. 4. Far-field patterns at 4.0 GHz.
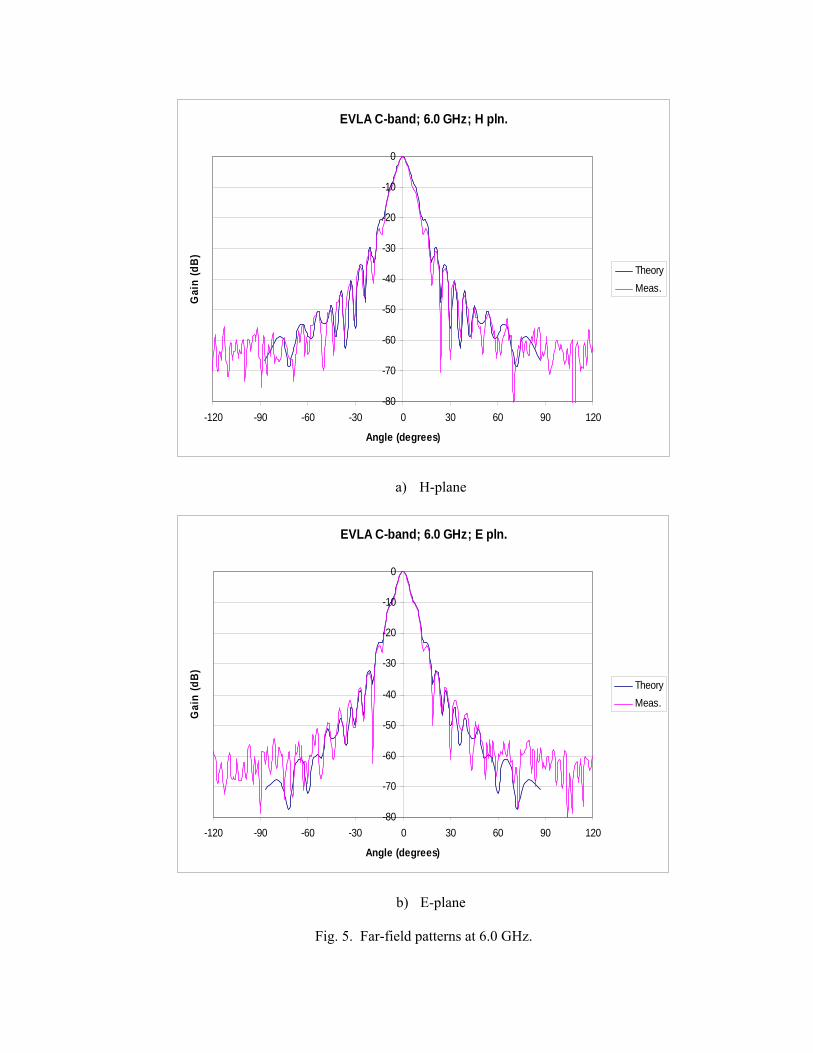
EVLA C-band; 6.0 GHz; H pln.
-80
-70
-60
-50
-40
-30
-20
-10
0
-120 -90 -60 -30 0 30 60 90 120
Angle (degrees)
Gai
n (d
B)
TheoryMeas.
a) H-plane
EVLA C-band; 6.0 GHz; E pln.
-80
-70
-60
-50
-40
-30
-20
-10
0
-120 -90 -60 -30 0 30 60 90 120
Angle (degrees)
Gai
n (d
B)
TheoryMeas.
b) E-plane
Fig. 5. Far-field patterns at 6.0 GHz.
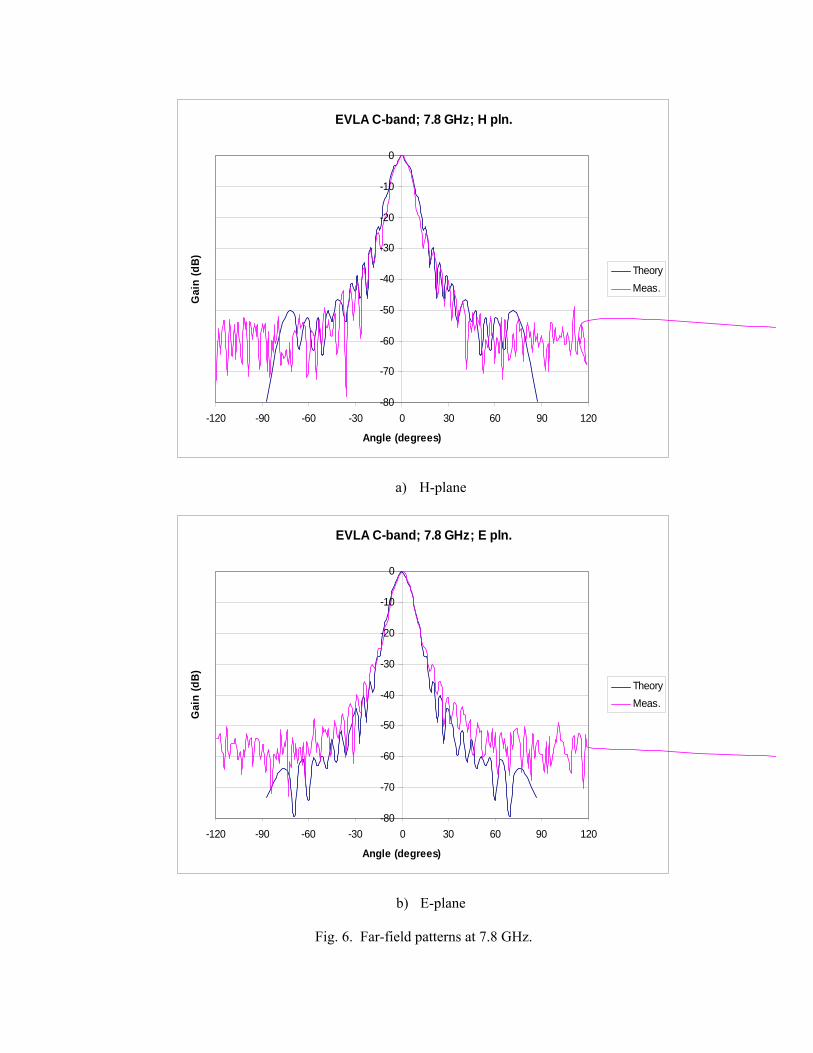
EVLA C-band; 7.8 GHz; H pln.
-80
-70
-60
-50
-40
-30
-20
-10
0
-120 -90 -60 -30 0 30 60 90 120
Angle (degrees)
Gai
n (d
B)
TheoryMeas.
a) H-plane
EVLA C-band; 7.8 GHz; E pln.
-80
-70
-60
-50
-40
-30
-20
-10
0
-120 -90 -60 -30 0 30 60 90 120
Angle (degrees)
Gai
n (d
B)
TheoryMeas.
b) E-plane
Fig. 6. Far-field patterns at 7.8 GHz.
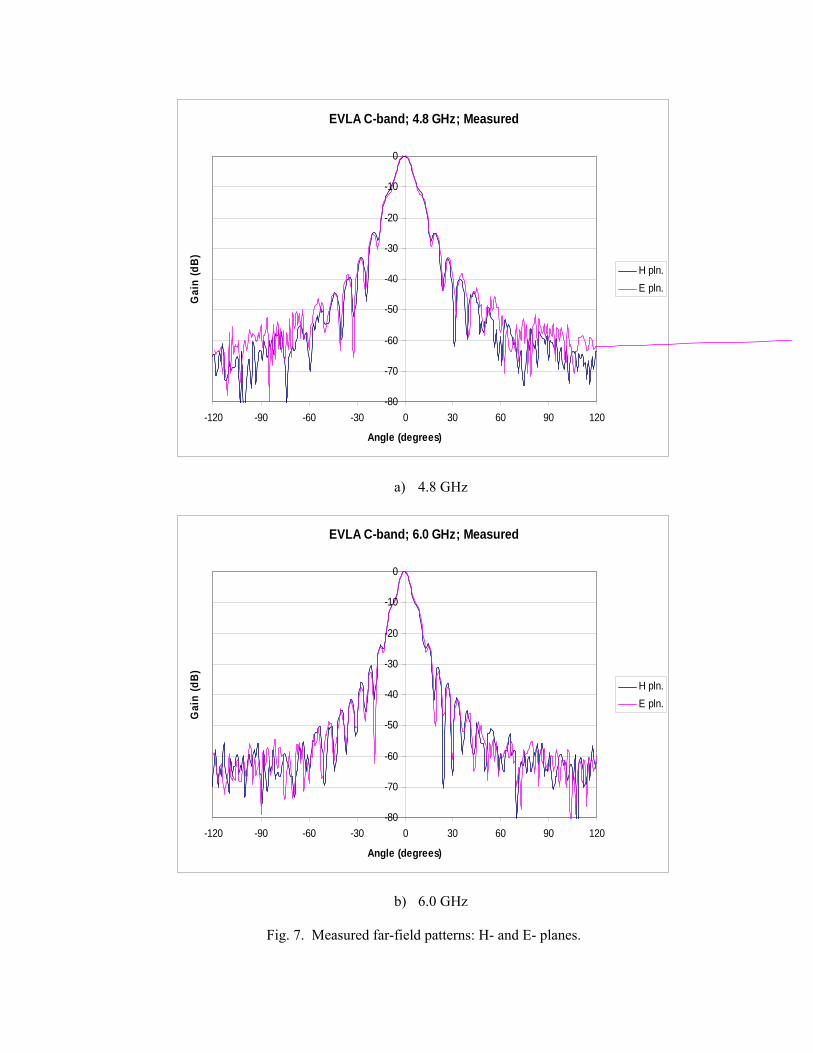
EVLA C-band; 4.8 GHz; Measured
-80
-70
-60
-50
-40
-30
-20
-10
0
-120 -90 -60 -30 0 30 60 90 120
Angle (degrees)
Gai
n (d
B)
H pln.E pln.
a) 4.8 GHz
EVLA C-band; 6.0 GHz; Measured
-80
-70
-60
-50
-40
-30
-20
-10
0
-120 -90 -60 -30 0 30 60 90 120
Angle (degrees)
Gai
n (d
B)
H pln.E pln.
b) 6.0 GHz
Fig. 7. Measured far-field patterns: H- and E- planes.
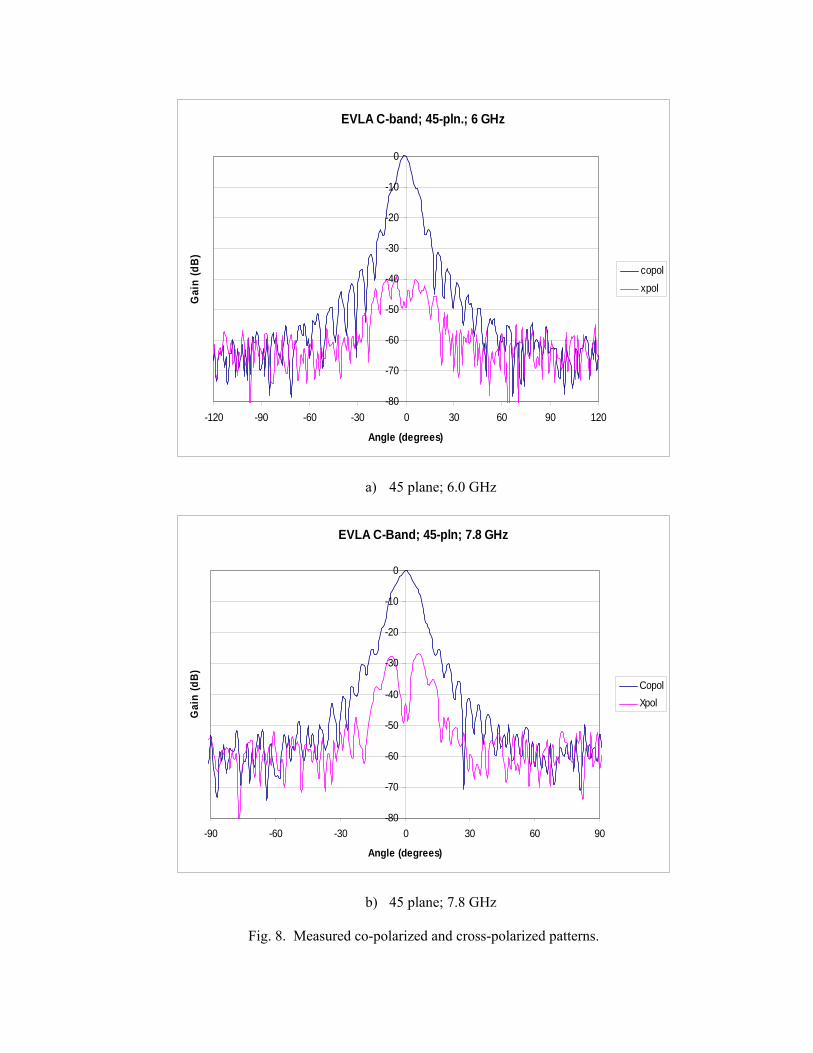
EVLA C-band; 45-pln.; 6 GHz
-80
-70
-60
-50
-40
-30
-20
-10
0
-120 -90 -60 -30 0 30 60 90 120
Angle (degrees)
Gai
n (d
B)
copolxpol
a) 45 plane; 6.0 GHz
EVLA C-Band; 45-pln; 7.8 GHz
-80
-70
-60
-50
-40
-30
-20
-10
0
-90 -60 -30 0 30 60 90
Angle (degrees)
Gai
n (d
B)
CopolXpol
b) 45 plane; 7.8 GHz
Fig. 8. Measured co-polarized and cross-polarized patterns.
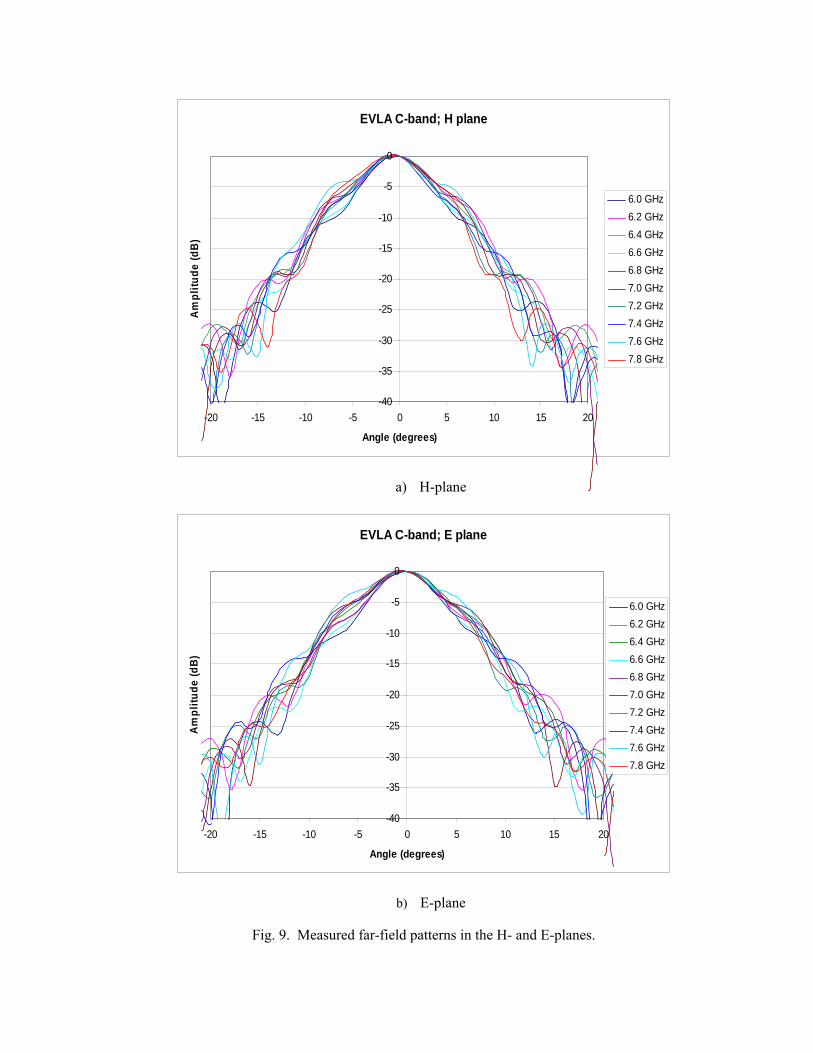
EVLA C-band; H plane
-40
-35
-30
-25
-20
-15
-10
-5
0
-20 -15 -10 -5 0 5 10 15 20
Angle (degrees)
Am
plitu
de (d
B)
6.0 GHz6.2 GHz6.4 GHz6.6 GHz6.8 GHz7.0 GHz7.2 GHz7.4 GHz7.6 GHz7.8 GHz
a) H-plane
EVLA C-band; E plane
-40
-35
-30
-25
-20
-15
-10
-5
0
-20 -15 -10 -5 0 5 10 15 20
Angle (degrees)
Ampl
itude
(dB)
6.0 GHz6.2 GHz6.4 GHz6.6 GHz6.8 GHz7.0 GHz7.2 GHz7.4 GHz7.6 GHz7.8 GHz
b) E-plane
Fig. 9. Measured far-field patterns in the H- and E-planes.
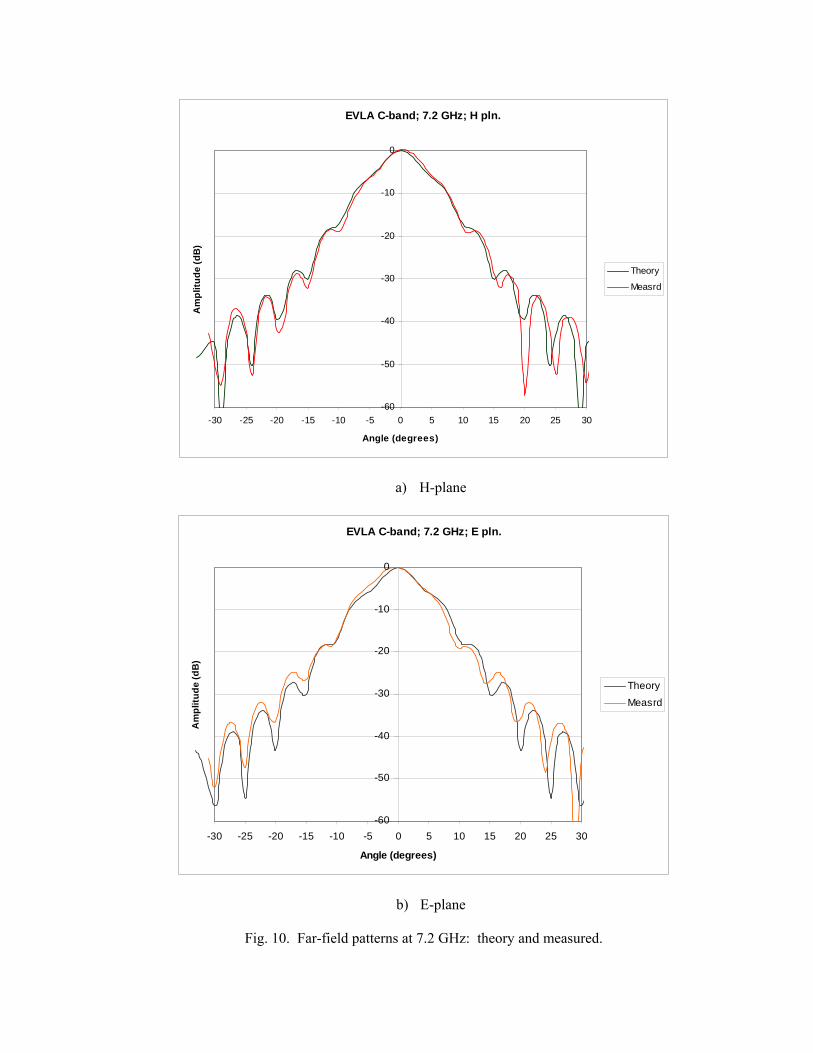
EVLA C-band; 7.2 GHz; H pln.
-60
-50
-40
-30
-20
-10
0
-30 -25 -20 -15 -10 -5 0 5 10 15 20 25 30
Angle (degrees)
Am
plitu
de (d
B)
Theory
Measrd
a) H-plane
EVLA C-band; 7.2 GHz; E pln.
-60
-50
-40
-30
-20
-10
0
-30 -25 -20 -15 -10 -5 0 5 10 15 20 25 30
Angle (degrees)
Am
plitu
de (d
B)
Theory
Measrd
b) E-plane
Fig. 10. Far-field patterns at 7.2 GHz: theory and measured.
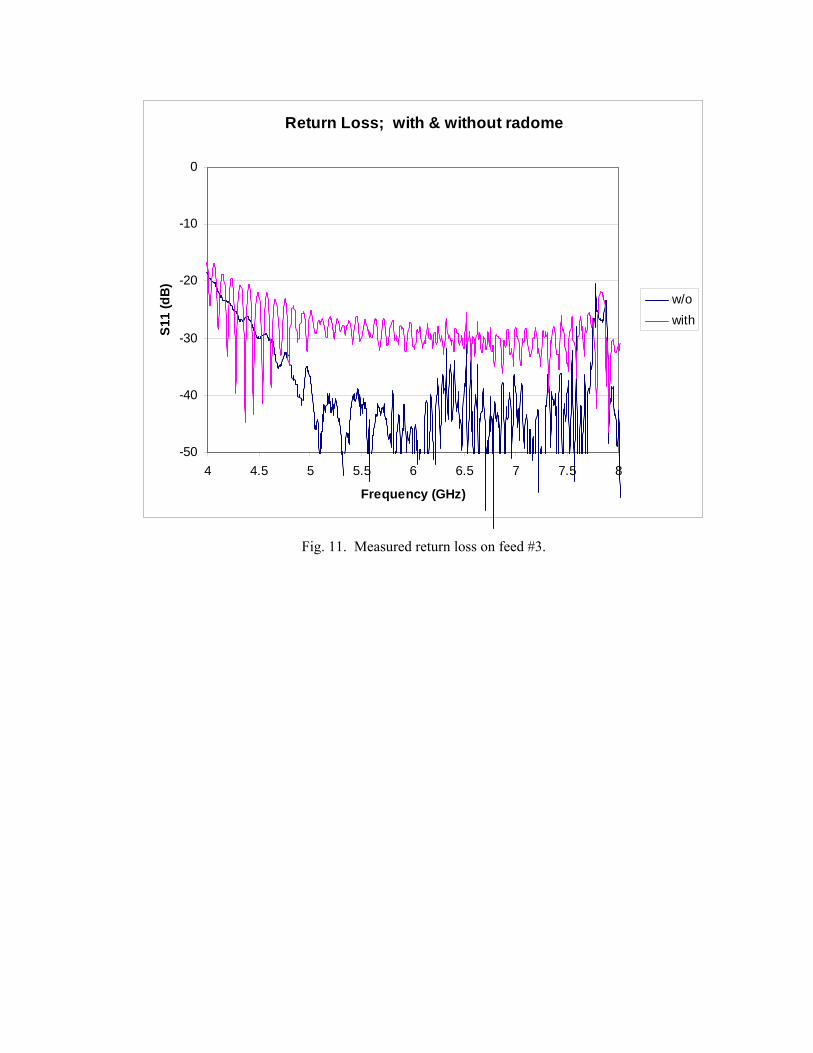
Return Loss; with & without radome
-50
-40
-30
-20
-10
0
4 4.5 5 5.5 6 6.5 7 7.5 8
Frequency (GHz)
S11
(dB
)
w/o with
Fig. 11. Measured return loss on feed #3.