Embed Size (px)
Citation preview
DESIGN OPTIMIZATION OF THE ROLLING PISTON TYPE
ROTARY COMPRESSOR
A Thesis
Presented to
the Faculty of the College of Science & Technology
Morehead State University
In Partial Fulfillment
of the Requirements for the Degree
Master of Science
by
Pavankumar Kurmagadda
March 31, 2009
Accepted by the faculty of the College of Science & Technology, Morehead State University, in partial fulfillment of the requirements for the Master of Science degree.
Director of Thesis
Master's Committee:
5) r---------,, -
Date
\
DESIGN OPTIMIZATION OF THE ROLLING PISTON TYPE
ROTARY COMPRESSOR
Director of Thesis:
Pavankurnar Kurmagadda, M.S. •
Morehead State University, 2009
The research titled Design Op imization of the Rotary Compressor involves the
process of converting a single cylinder Rotary compressor in to two- cylinder type
Rotary compressor. This was done by replacing the main counter weight of the
compressor in to another Rolling piston. It has also proved that the magnitudes of
stresses and vibration frequencies acting on the optimized double cylinder
compressor shaft are lesser than the magnitudes of stresses and vibration
frequencies acting over the shaft of a single cylinder rotary compressor.
Autodesk-Inventor 2009 was used to create a three dimensional models of the
rotary compressor adopted from Tecumseh, and the optimized model of two
cylinder rotary compressor.
Finite Element Analysis was also done in Autodesk-Inventor 2009, to validate the
optimized design.
Accepted by: /ll,nt a/ ~ea,/ , Chair 0
----
Acknowledgement
I would like to express gratitude to Dr. Ahamad Zargari, Chair Industrial
Engineering and Technology Department, for his valuable guidance towards
successful completion of my thesis.
I would be grateful to Dr. Greg Russell, Chair of Management, Marketing and
Real Estate department, for his guidance and support in helping me to make this
research a valuable experience.
I am grateful to Dr. Nilesh Joshi, Asst. Professor IET, for his valuable suggestions
and comments that added more value to my thesis.
I would like to thank Dr. Jaby Mohammad for his co-ordination and help in
conducting my thesis.
I am also thankful to my parents for encouraging me to earn a masters degree.
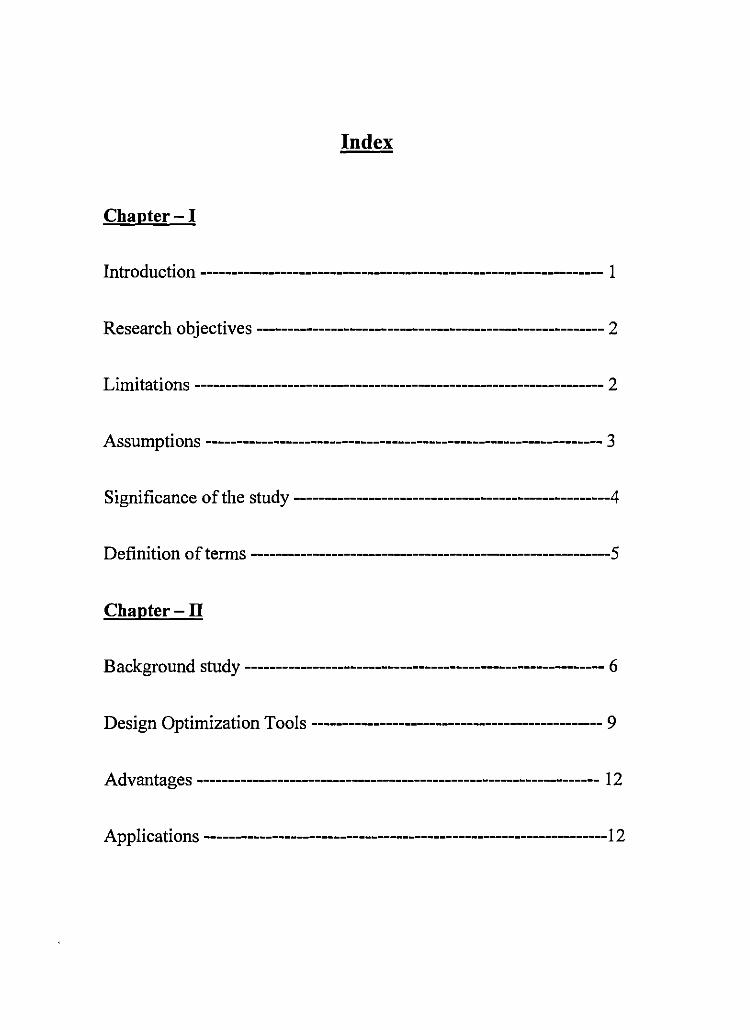
Index
Chapter-I
Introduction ----------------------------------------------------------------- 1
Research objectives -------------------------------------------------------- 2
L. . . 2 1m1tat1ons ------------------------------------------------------------------
Assumptions--------------------------------------------------------------- 3
Significance of the study ---------------------------------------------------4
Definition of terms --------------------------------------------------------5
Chapter-II
Background study ---------------------------------------------------------- 6
Design Optimization Tools ---------------------------------------------- 9
Advantages ----------------------------------------------------------------- 12
Applications -----------------------------------------------------------------12
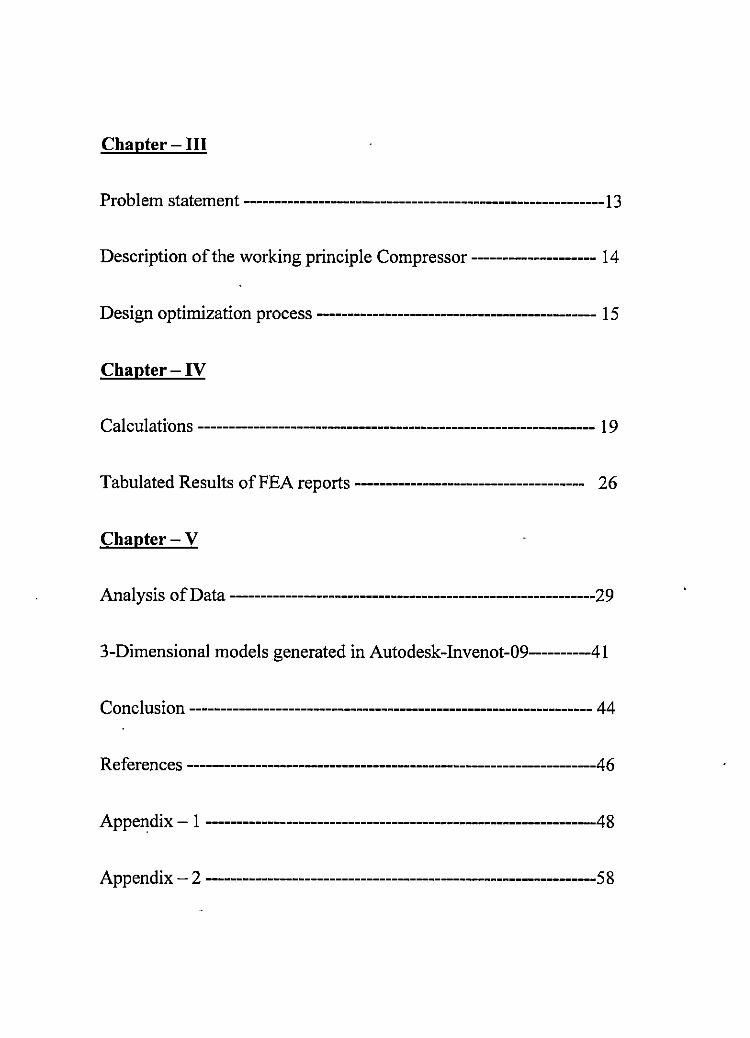
Chapter - III
Problem statement ------------------------------------------13
Description of the working principle Compressor ------------------- 14
Design optimization process ------------------------------------ 15
Chapter-IV
Calculations _________________________ , ______ , ________ 19
Tabulated Results ofFEA reports------------------·-------- 26
Chapter-V
Analysis of Data -----------------------·--------29
3-Dimensional models generated in Autodesk-Invenot-01'J.9---41
Conclusion ------------------------------------------------------ 44
References ------------------------------------·--------46
Appendix - 1 ---------------,-------------------------------48
Appendix - 2 --------------- ---------------------58
Appendix - 3 --------·--- --------------------------·----68
Appendix - 4 ------------------------- --------------78
Appendix - 5 ---------------------------------------------------------------88
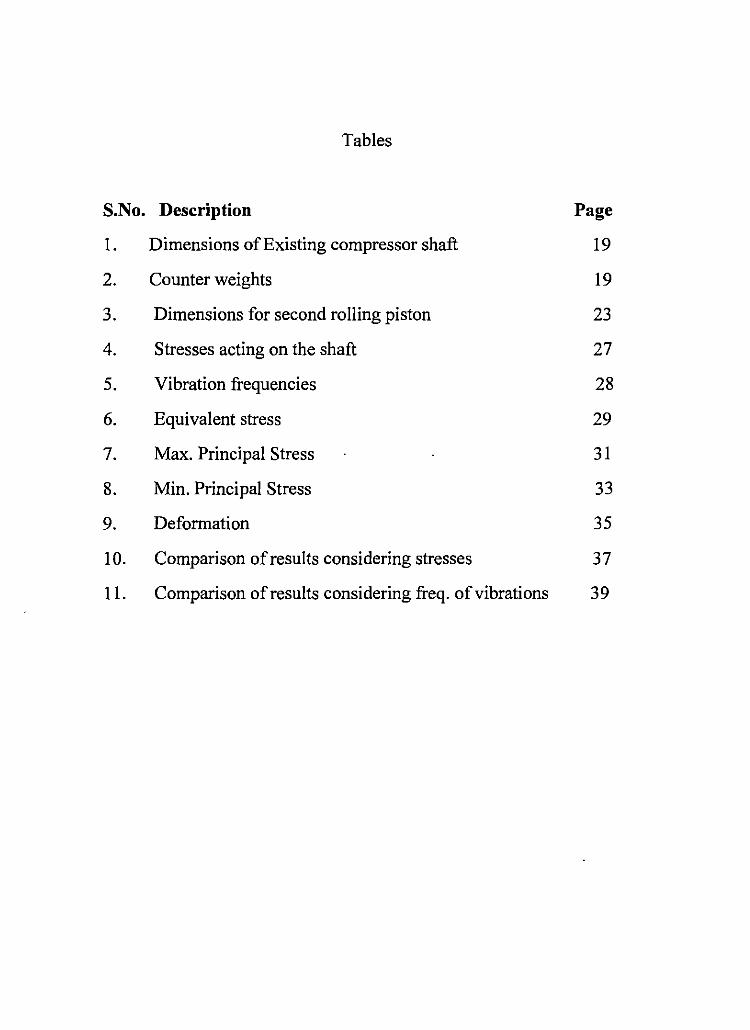
Tables
S.No. Description Page
1. Dimensions of Existing compressor shaft 19
2. Counter weights 19
3. Dimensions for second rolling piston 23
4. Stresses acting on the shaft 27
5. Vibration frequencies 28
6. Equivalent stress 29
7. Max. Principal Stress 31
8. Min. Principal Stress 33
9. Deformation 35
10. Comparison of results considering stresses 37
11. Comparison of results considering freq. of vibrations 39
Figures
S.No. Description Page
1. Cut open view of a single cylinder rotary compressor 14
2. Line diagram of a shaft with loads 16
3. Double cylinder compressor shaft 24
4. Double cylinder compressor shaft with loads 25
5. Equivalent stress distribution 29
6. Max. Principal stress distribution 31
7. Min. Principal Stress distribution 33
8. Deformation 35
9. Comparison of results considering stresses 37
10. Comparison of results considering freq. of vibrations 39
11. 3-Dimension model of a existing Rotary compressor 41
12. 3-D model of a Double Cylinder Rotary Compressor 42
13. Dynamic simulation of a Rotary Compressor 43
Chapter I
Introduction:
Energy saving is the vital issue now-a-days. In each and every field of
energy consumption, there is a query for the most optimal design generation. One
of the best examples for the energy consuming field is Refrigeration and Air
conditioning. There is a need for the design optimization in this field. In order to
save energy in this field compressor would play an important role.
1
Compressor is known to be the heart of Refrigeration and Air-conditioning
system, it is because compressor pumps the refrigerant gas (medium for heat
transfer) in the refrigerator or in an Air-conditioner like the heart pumps blood in
the body.
There are wide varieties of compressors available depending upon the
cooling requirements; Rotary compressor is one among them. Rotary compressors
are mostly used for Air-conditioning systems. It is because Rotary compressors
are known for their compactness, high performance, reliability and rigidity.
The process of compression in Rotary compressor is been done by the
rotation of the Eccentric ( cylindrical block) mounted eccentrically on the
compressor shaft. Due to the rotating eccentric mass an unbalanced centrifugal
force is been generated, which pulls the shaft away from its axis of rotation.
According to the Newton's law, the unbalanced centrifugal force is directly
2
proportional to the angular velocity of the rotating shaft. Two balancing counter
weight are attached to the rotating shaft in order to balance the shaft. So there is a
need to analyze various stresses and strains acting upon the compressor shaft, in
order to determine the best design that can be developed with the same constrains,
or to reduce the resultant stresses acting on the shaft.
Research Objectives:
To optimize the design of the single cylinder Rotary Compressor made by
Tecumseh and compares it with the existing single cylinder rotary compressor
made by Tecumseh. The research objective for this study is to design a double
cylinder compressor shaft using the existing single cylinder compressor shaft.
Such that;
( a) The stresses acting on the compressor shaft, due to the rotating unbalanced
masses would be reduced;
(b) The frequencies of vibration acting at different nodes of the compressor
shaft would be reduced.
Limitations:
Following are the limitations identified in the research:
I. · The design optimization process is completely based on the compressor
shaft. It is because, shaft is the only member which takes all the loads of
the balancing and unbalancing masses rotating around it.
2. The design optimization is based on virtual analysis made using the
software called Inventor 2009.
3. Comparison among the existing model and various optimized design is
been done based on the results obtained by the virtual analysis made in
Inventor 2009.
Assumptions:
The developed design optimization is based on following assumptions:
I. Compressor shaft is the only member, which is subjected to static and
dynamic loads.
2. Neglecting the loads acting on the reciprocating vane. Since½ Vane mass
is been added to the unbalanced masses.
3. Dimensions of the new design are derived from mass to volume ratio with
respect to the existing model.
3
Significance of the Study:
Design optimization is always a significant issue in any field of technology. In
this research, the design of the existing compressor made by Tecumseh is
optimized in such a way that it has the following advantages:
I. As the compressor is been made two cylinders by replacing one of the
counter weight, the efficiency of the compressor would increase in terms of
discharge versus power of the compressor.
4
2. In two cylinder rotary compressor, there would be two pressures acting on the
rolling piston (roller) with the phase difference of l 80degrees. Therefore, the
stresses developed by the unbalanced forces would be more balanced
compared to the existing design.
Definition of Terms:
Following are the definitions of terms that are used in this research:
I. Equivalent Stress: According to Autodesk Jnventor-09, when a unit
volume of material is subjected to repeated tensile and tensile-shear
loading, Equivalent stress is used to estimate the fatigue failure.
2. Principal Stresses: According to Autodesk Jnventor-09, from elastic
theory, a unit volume of material can be rotated. It shows only normal
stresses are present and all shear stresses are zero. All the normal stresses
that remain are called Principal stresses.
Among the three normal stresses the one which shows the maximum
magnitude of principal stress is called Maximum Principal Stress.
Among the three normal stresses the one which shows the minimum
magnitude of principal stress is called as Minimum Principal Stress.
-3. Deformation: It can be defined as the change in dimensions of the
material when subjected to the load.
4. Safety Factor: It can be defined as the ratio of yield stress to the
maximum equivalent stress.
5
Chapter II
Background study:
Kurmagadda (April-2006) developed a methodology to reduce the
unbalanced forces acting on the Rotary compressor shaft, (which was rotating at
3000rpm) and to reduce the material consumption for the same capacity and
higher capacity compressor.
Design Optimization of the single cylinder rotary compressor in
Kurmagadda 's (April-2006) was achieved in two phases.
First phase: 7.8% of the total unbalanced forces were reduced by increasing the
height of the roller by 5mm, thereby proportionately decreasing the diameter of
the roller and eccentric; keeping the swept volume constant.
Second phase: 27% of the swept volume of the compressor was increased by
increasing the eccentricity of the eccentric to the maximum limit, simultaneously
increasing the capacity of the compressor with the same material consumption.
In order to decrease the noise and vibrations, Ebara et al. (2001) increased
the cross-sectional area of the shaft ( connecting the two eccentrics that has phase
difference of 180 degrees between them), such that the thickness of the shaft
along the orthogonal direction is more than the thickness of the shaft along the
6
7
direction of the eccentric. This has helped to increase the rigidity and durability of
the rotating shaft.
Haggerty (August 26th 1980) proved that the Rolling Piston Type Rotary
Compressor can be made to deliver variable pressures as required by the system.
This was achieved by replacing the reciprocating vane with a hydraulic piston
imparting resilient force on the circumference of the rolling piston to permit some
of the non-compressible refrigerant to be accumulated varying the hydraulic
pressure to the hydraulic piston and cylinder arrangement, which permits to
deliver variable pressure while the rolling piston is been driven by the external
drive.
Kawaguchi, Susumu (April 30th 1993) increased the cooling capacity,
reliability, and performance of the Rotary Compressor without increasing the
volume of the Rotary compressor. This was done by installing oil cooled heat
exchangers adjacent to the compressor.
Muherjee in colalaboration with Dr.Edwards Company (April-June 2001)
developed a new design for a rotary compressor called OVR (Orbital Vane
Rotary) compressor. The unique feature of this design is that the sliding vanes are
constrained in both inwards and outward radial direction. So the vanes are
confined to move in defined orbit only. Therefore, OVR compressors can handle
high pressure refrigerants like CFC -R12, and HFC 134 a.
8
Suk Han, Hwang and Seo Koo 's applied the multibody dynamic analysis
to predict the vibrations produced by the compressor. After the analysis of the
change in acceleration with respect to the stiffness of the isolators made by
experimental set up and simulations, authors have stated that the tangential and
radial acceleration has very little effect (less than 10% ), when there is a difference
of stiffness between the two isolators of 200%. The authors have also found that
the mass of the counter weight has different effects on the magnitude of the
tangential and radial acceleration. The tangential acceleration has decreased as
mass of the counter weight was increased, and the radial acceleration has the
lowest value. They have also claimed that 60% of excitation of the tangential
acceleration is due to the compression, and 40% excitation is due to the rotating
parts.
Based the above literature review it is evident that one of the major problems
faced by the compressors is the noise produced due to unwanted vibrations. The
unwanted vibrations are produced due to the imbalance of various forces acting
on all the moving parts of a compressor. This can be eliminated by properly
balancing all the forces. The balancing in tum reduces the unwanted stresses and
increases the reliability and performance of the compressor.
Design Optimization Tools:
Design Optimization is the process of altering or modifying the design variables
such that the optimal objective functions are obtained. Design optimization is
usually applied in the early design stages, to develop a quality product with
nominal cost/weight, and to reduce other constraints such as mechanical and
thermal stresses. This can be done using traditional mathematical techniques, and
Modem Optimization Tools. In this research both traditional and modem design
optimization tools are discussed using a case study based on the design
optimization of a Rotary compressor.
Every mathematical design optimization problem has the following three steps:
• Objective function: Objective function is a goal of the optimization
process. That needs to be minimized or maximized, based on the
requirement. For example, ifa Design optimization of Rotary compressor
is considered, the objective function would be reduction of the magnitude
of stresses and.frequencies of vibrations acting on the compressor shaft at
various nodes.
• Evaluation of the set of design variables, which affects the Objective
function; Design variables are independent quantities, by integration of
which an Objective function is obtained. For example, in this project the
9
set of design variables would be the diameter of the shaft, and length of
the shaft.
10
• Set of Constraints which assigns certain values for the design variables. In
this Rotary Compressor design the constraints are the rotating unbalanced
masses. Which either needs to reduced or maintained at the same
magnitude.
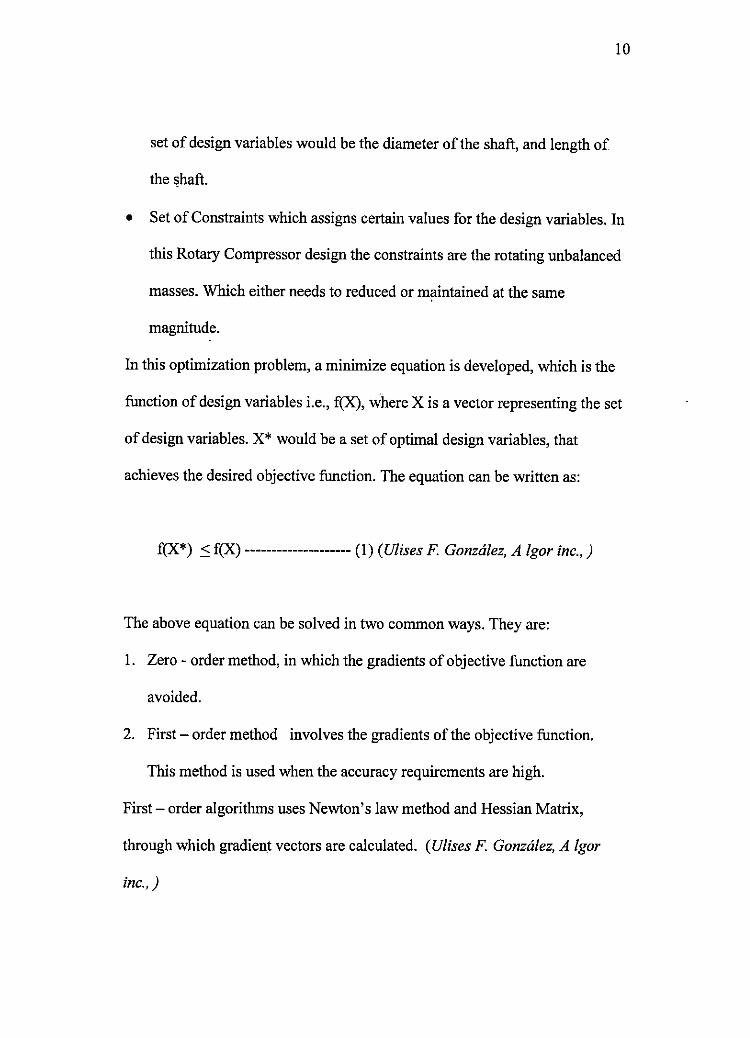
In this optimization problem, a minimize equation is developed, which is the
function of design variables i.e., f(X), where Xis a vector representing the set
of design variables. X* would be a set of optimal design variables, that
achieves the desired objective function. The equation can be written as:
f(X*) .::, f(X) ----- (1) (Ulises F. Gonzalez, A Igor inc.,)
The above equation can be solved in two common ways. They are:
1. Zero - order method, in which the gradients of objective function are
avoided.
2. First - order method involves the gradients of the objective function.
This method is used when the accuracy requirements are high.
First- order algorithms uses Newton's law method and Hessian Matrix,
through which gradient vectors are calculated. (Ulises F. Gonzalez, A Igor
inc.,)
11
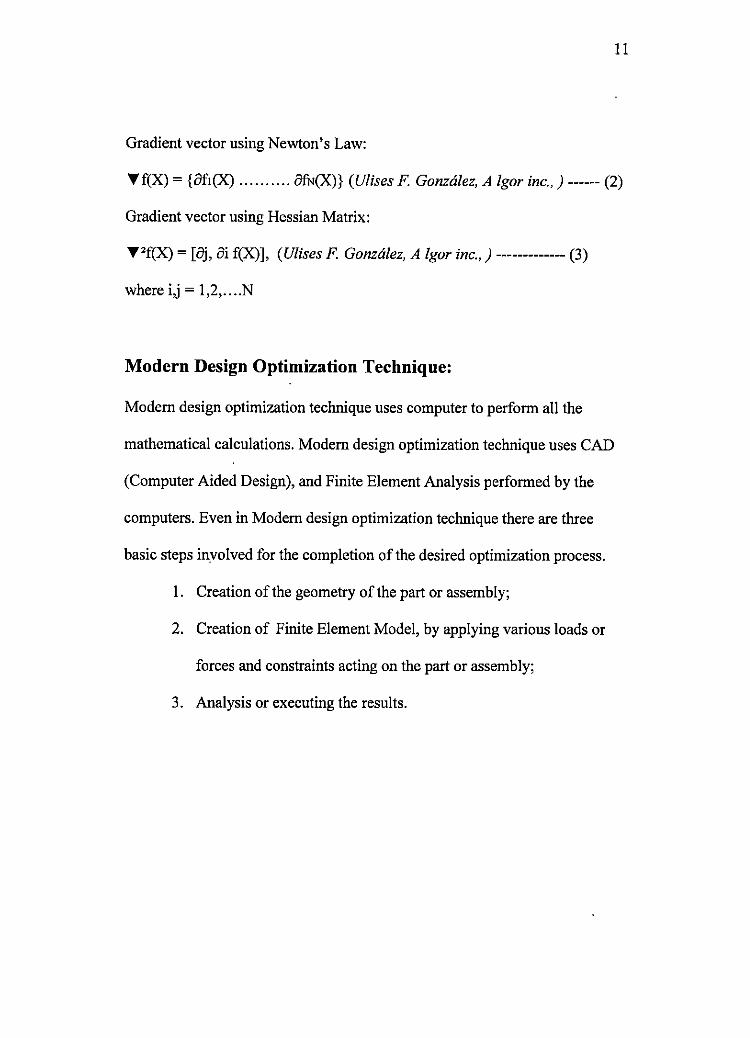
Gradient vector using Newton's Law:
'Yf(X) = {Bfi(X) .......... afN(X)} (Ulises F Gonzalez, A Igor inc.,)------ (2)
Gradient vector using Hessian Matrix:
'Y 2f(X) = [Bj, Bi f(X)], (Ulises F. Gonzalez, A Igor inc.,)---·--- (3)
where ij = 1,2, .... N
Modern Design Optimization Technique:
Modern design optimization technique uses computer to perform all the
mathematical calculations. Modern design optimization technique uses CAD
(Computer Aided Design), and Finite Element Analysis performed by the
computers. Even in Modern design optimization technique there are three
basic steps involved for the completion of the desired optimization process.
1. Creation of the geometry of the part or assembly;
2. Creation of Finite Element Model, by applying various loads or
forces and constraints acting on the part or assembly;
3. Analysis or executing the results.
12
Advantages of the Two Cylinder Rotary Compressor:
The following are advantages of using double cylinder rotary compressor when
compared to the single cylinder rotary compressor:
• Power consumption per unit work done is reduced.
• Design is more stable, as there are two phases of compression at the phase
difference of l SOdegrees.
• Compact in size per unit work done.
• Lower vibrations as compared to the reciprocating compressor.
Applications of Double cylinder Rotary Compressor:
The basic applications of the double cylinder compressor are as follows:
• Two cylinder Rotary compressor is used in room Air-conditioners
• It is used in Vapor Compression Refrigeration systems.
• It can be used as an Air-Compressor.
13
Chapter III
Problem Statement:
The major requirement for the design optimization in mechanical engineering is
to reduce the various stresses and vibrations acting on the optimized components.
Therefore, the following problem statements have been identified:
• To convert a single cylinder Rotary compressor made by Mis Tecumseh
Ltd., in to a two cylinder Rotary compressor by using Static and Dynamic
balancing techniques.
• To design and perform the stress analysis using Inventor software, and
determine the various stresses acting on various models of the compressor
shafts used in optimized design, such as Double cylinder compressor shaft
with diameter increased, double cylinder compressor shaft with length
increased, both diameter and length increased. Compare the results with
the existing design.
• To determine the best model among the designed models which has less
frequencies of vibration, and compare it with the existing compressor
model.
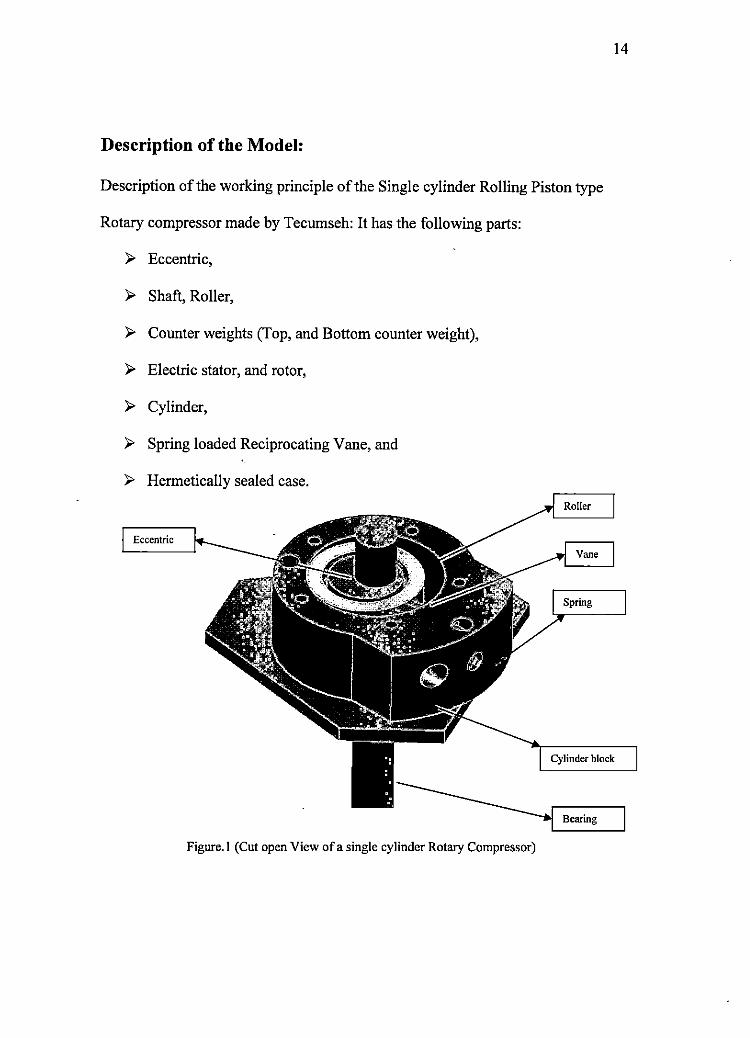
Description of the Model:
Description of the working principle of the Single cylinder Rolling Piston type
Rotary compressor made by Tecumseh: It has the following parts:
► Eccentric,
► Shaft, Roller,
► Counter weights (Top, and Bottom counter weight),
► Electric stator, and rotor,
► Cylinder,
► Spring loaded Reciprocating Vane, and
► Hermetically sealed case.
Roller
Eccentric Vane
14
Cylinder block
Bearing
Figure. I (Cut open View of a single cylinder Rotary Compressor)
15
As shown in the figure. I, an eccentric is loaded on the shaft with some
eccentricity ( eccentricity is the offset distance between the two axis). Due to the
eccentricity, and the spring loaded reciprocating vane (which is in continuous
contact with the Roller loaded over the Eccentric), the eccentric compresses the
vapor refrigerant when it is rotated by 360 degrees. Because of the rotating
eccentric, an unbalanced centrifugal force acts on the shaft. In order to balance the
unbalanced rotating mass two counter weights are attached to the shaft at
calculated distances.
Procedure for Design Optimization:
The goal of the research is to optimize the existing design Rotary compressor
made by Tecumseh. Optimization is been done in three phases:
• In the first phase, the main counter weight is replaced by another
eccentric, which would exert the same throw that was exerted by the main
counter weight.
This is done by considering two aspects of balancing, they are:
l. Static Balancing: It implies that the net dynamic forces acting on the
compressor shaft must be equal to zero, provided that all the center of
gravity of masses should be on the axis of the rotating compressor shaft.
F1 + Fc=F2
Centrifugal force, F = m * 002 * r
16
fill* CO2 * fl + me* CO2 * re= ITI2* CO2 * rz
fill * fl + file * re= ITI2* r2
(Since angular velocity co is same for all)
Where:
F, = Unbalanced centrifugal force acting over the first pump.
F,= Unbalanced centrifugal force acting over the second pump.
Fe = Centrifugal force exerted by the counter weight attached at the end of the
shaft
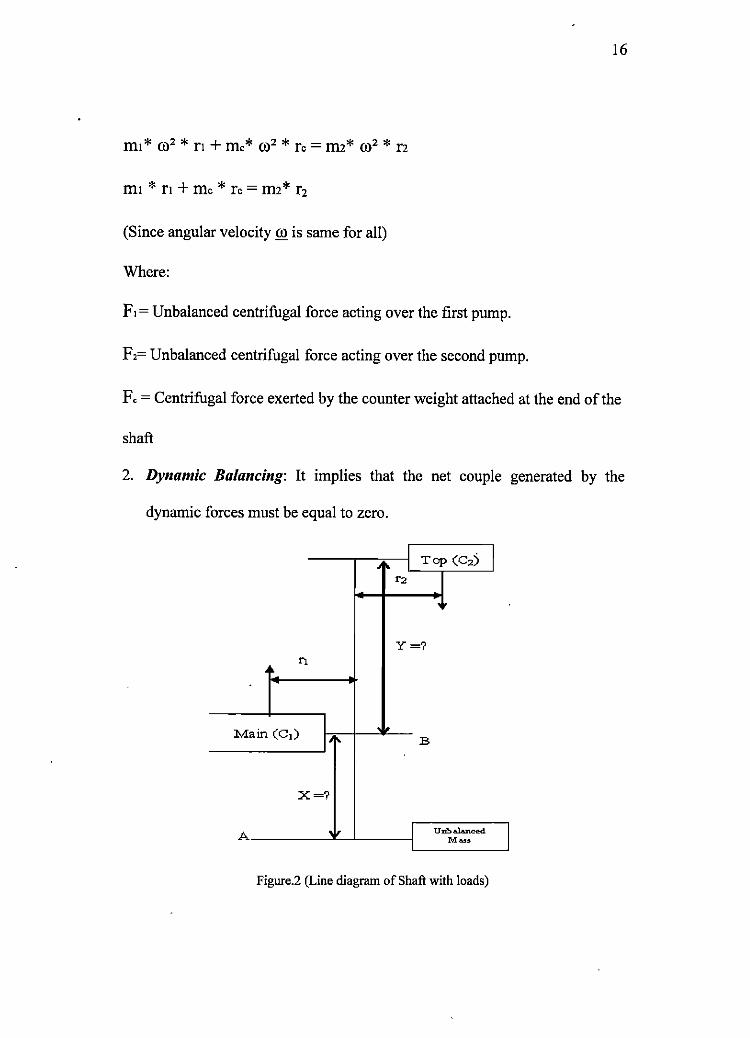
2. Dynamic Balancing: It implies that the net couple generated by the
dynamic forces must be equal to zero.
I Top (C2) I .. I
r2
,.
Y=? n
••
Main (C1) . ,.
I ~ B
X=?
A .~ I Unhalaneed
I I M~,
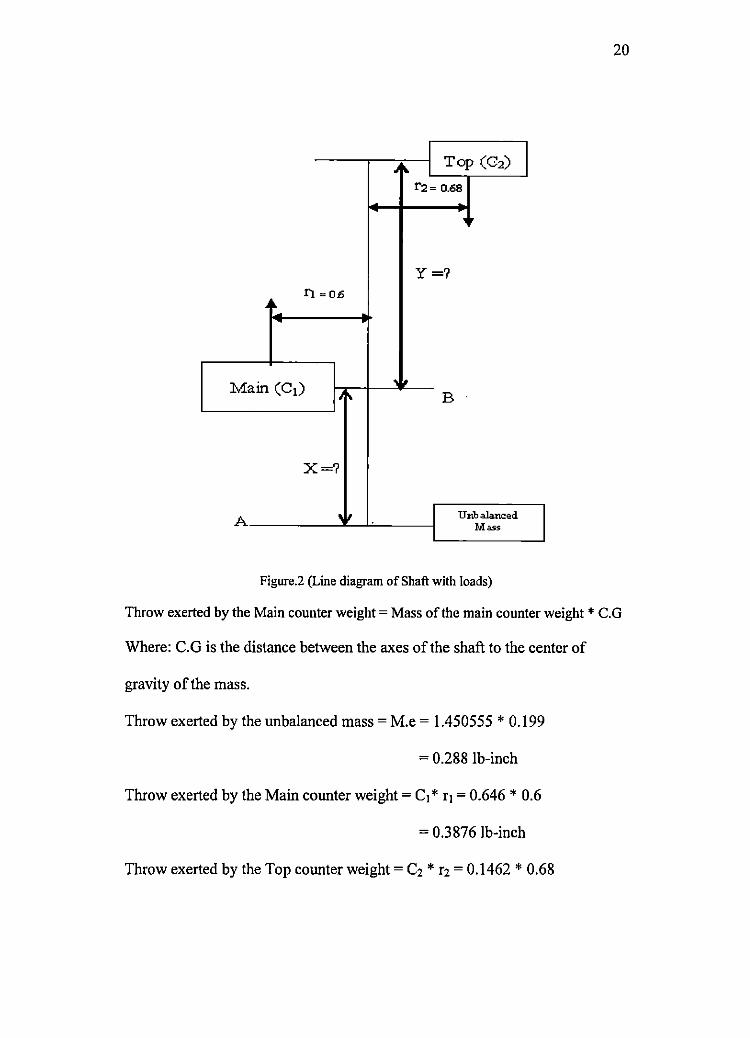
Figure.2 (Line diagram of Shaft with loads)
Net dynamic couple acting at the plane must be equal to zero. This implies
Fe* Y - F1 * X = 0 ------- 2
c::> Fe*Y=F1*X
c::> Fe* (Y+X)=F2 * X
From figure.2 line diagram of shaft with loads, F2 is the force acting
due to main counter weight.
c::> F2 * Y = F1 * (X+Y)
c::> me* re * Y = m1 * r1 * X
c::> m2* r2 * Y=m1 * r1 * (X+Y)
(Or)
c::> m2 * r2 * X = me * re * Y
c::> m2 = m1 * r1 * (X + Y) / (r2 * Y)
(Or)
c::> m2 = me * re * (X + Y) / (r2 * X)
17
• In the second phase using Inventor stress analysis module stress analysis
would be done on the compressor shaft of the optimized design and
existing design. The results are compared to check if there are any changes
in the stresses acting over the existing compressor shaft and double
cylinder compressor shafts.
• In the third·phase using Inventor's vibration analysis module vibration
analysis would be done on the shaft of the existing compressor model, and
18
also on different models of double cylinder compressor shaft. Such as
Double cylinder compressor shaft with diameter increased from 0.815 to
1inch, double cylinder compressor shaft with length increased to I inch.
The results obtained from the Inventor FEA report would be used to make
the comparison to check the model which has the lowest frequency of
vibrations at the common nodes.
19
Chapter IV
Calculations:
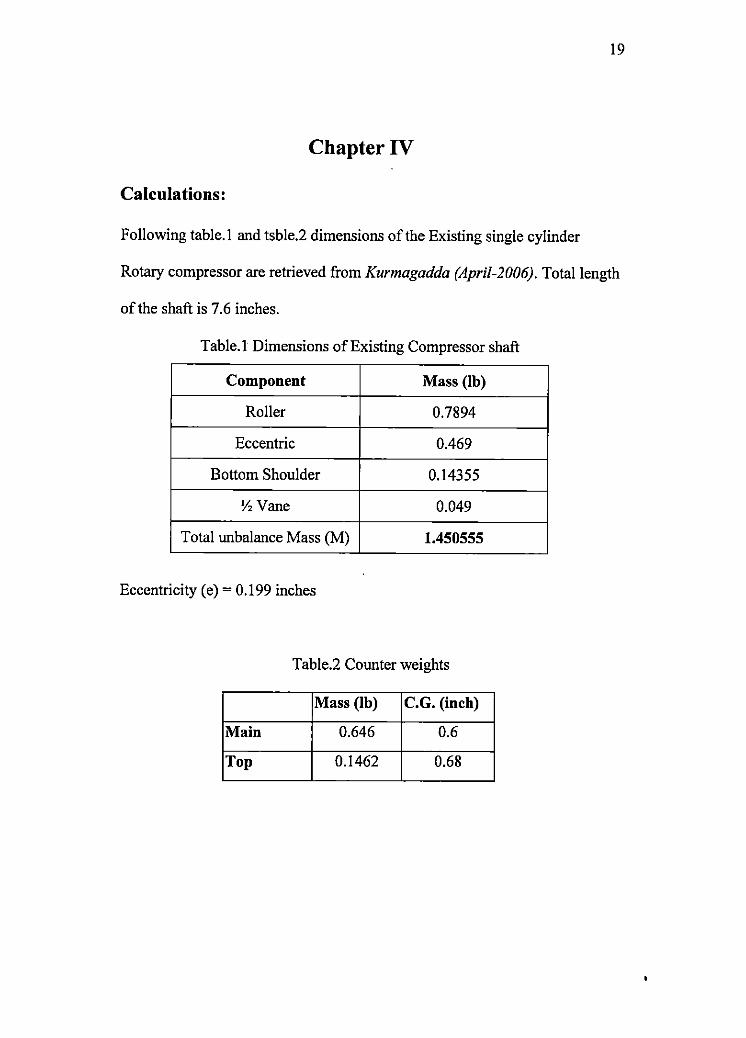
Following table.I and tsble.2 dimensions of the Existing single cylinder
Rotary compressor are retrieved from Kurmagadda (April-2006). Total length
of the shaft is 7.6 inches.
Table.I Dimensions of Existing Compressor shaft
Component Mass (lb)
Roller 0.7894
Eccentric 0.469
Bottom Shoulder 0.14355
½Vane 0.049
Total unbalance Mass (M) 1.450555
Eccentricity (e) = 0.199 inches
Table.2 Counter weights
Mass (lb) C.G. (inch)
Main 0.646 0.6
Top 0.1462 0.68
20
I Top (C2) I ' ~ I r2= o.68
'.
Y=? r:i =0.6 ..
Main (C1) '\ B
X=?
A ' , Unbah=ed Mas,
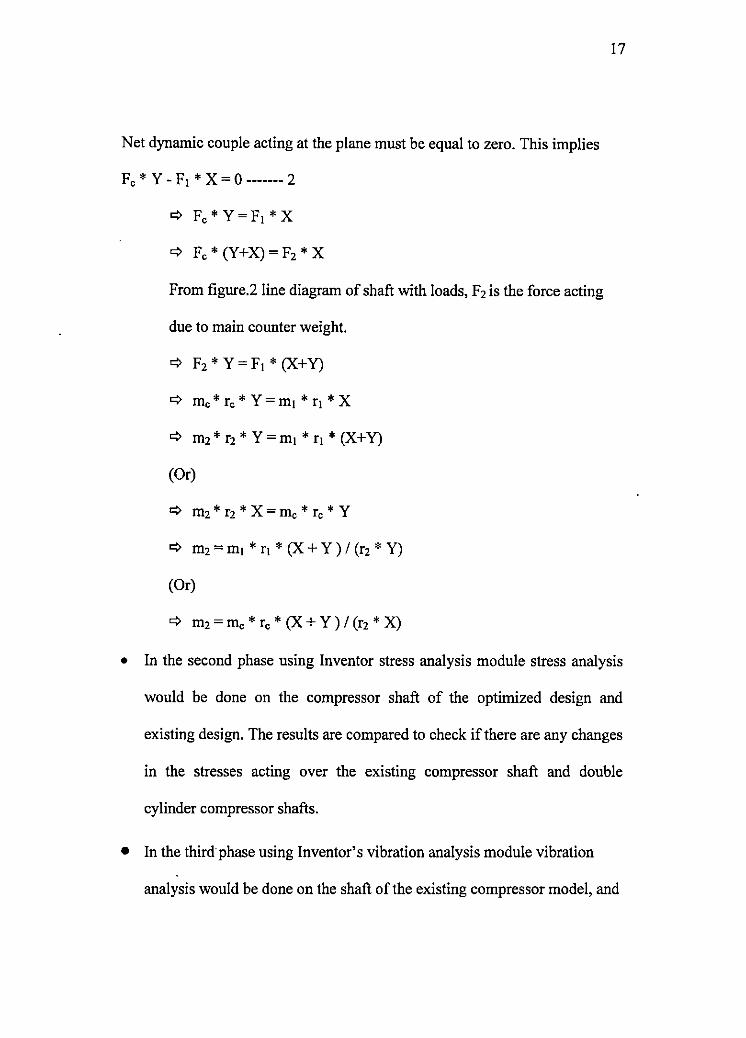
Figure.2 (Line diagram of Shaft with loads)
Throw exerted by the Main counter weight= Mass of the main counter weight • C.G
Where: C.G is the distance between the axes of the shaft to the center of
gravity of the mass.
Throw exerted by the unbalanced mass= M.e = 1.450555 * 0.199
= 0.288 lb-inch
Throw exerted by the Main counter weight= C1* r1 = 0.646 * 0.6
= 0.3876 lb-inch
Throw exerted by the Top counter weight= C2 * r2 = 0.1462 * 0.68
21
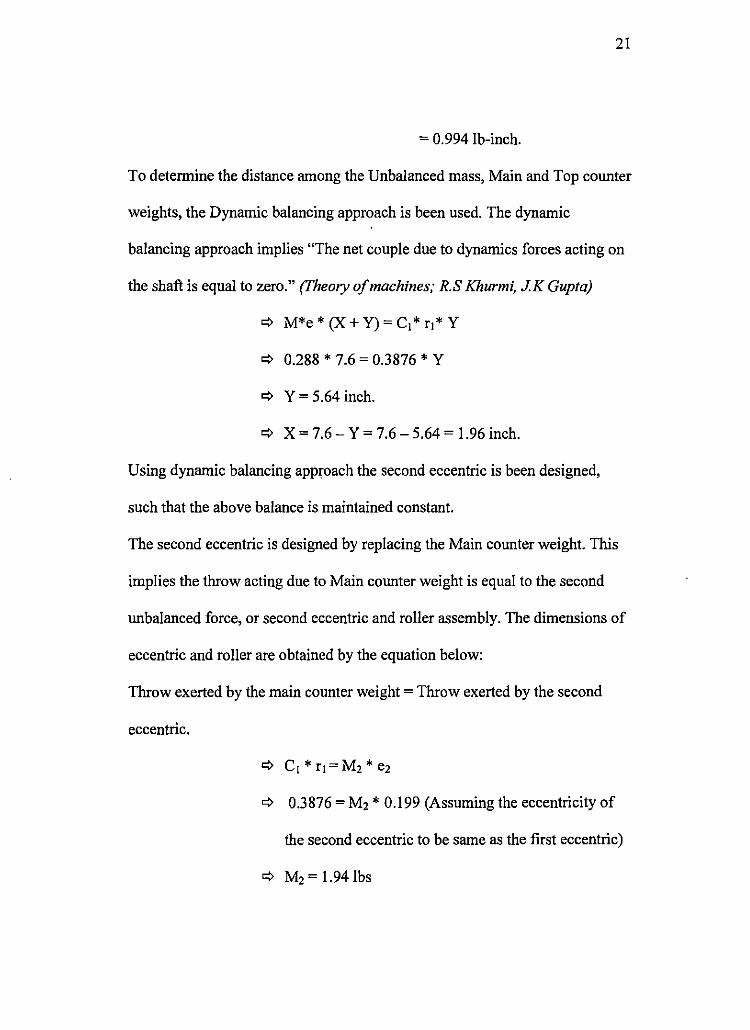
= 0.994 lb-inch.
To determine the distance among the Unbalanced mass, Main and Top counter
weights, the Dynamic balancing approach is been used. The dynamic
balancing approach implies "The net couple due to dynamics forces acting on
the shaft is equal to zero." (J'heory of machines; R.S Khurmi, J.K Gupta)
¢ M*e*(X+Y)=C1*r1*Y
¢ 0.288 * 7.6 = 0.3876 * Y
¢ Y = 5.64 inch.
¢ X = 7.6 - Y = 7.6 - 5.64 = 1.96 inch.
Using dynamic balancing approach the second eccentric is been designed,
such that the above balance is maintained constant.
The second eccentric is designed by replacing the Main counter weight. This
implies the throw acting due to Main counter weight is equal to the second
unbalanced force, or second eccentric and roller assembly. The dimensions of
eccentric and roller are obtained by the equation below:
Throw exerted by the main counter weight = Throw exerted by the second
eccentric.
¢ C1 * r1 = M2 * e2
¢ 0.3876 = M2 * 0.199 (Assuming the eccentricity of
the second eccentric to be same as the first eccentric)
¢ M2 = 1.94 lbs
22
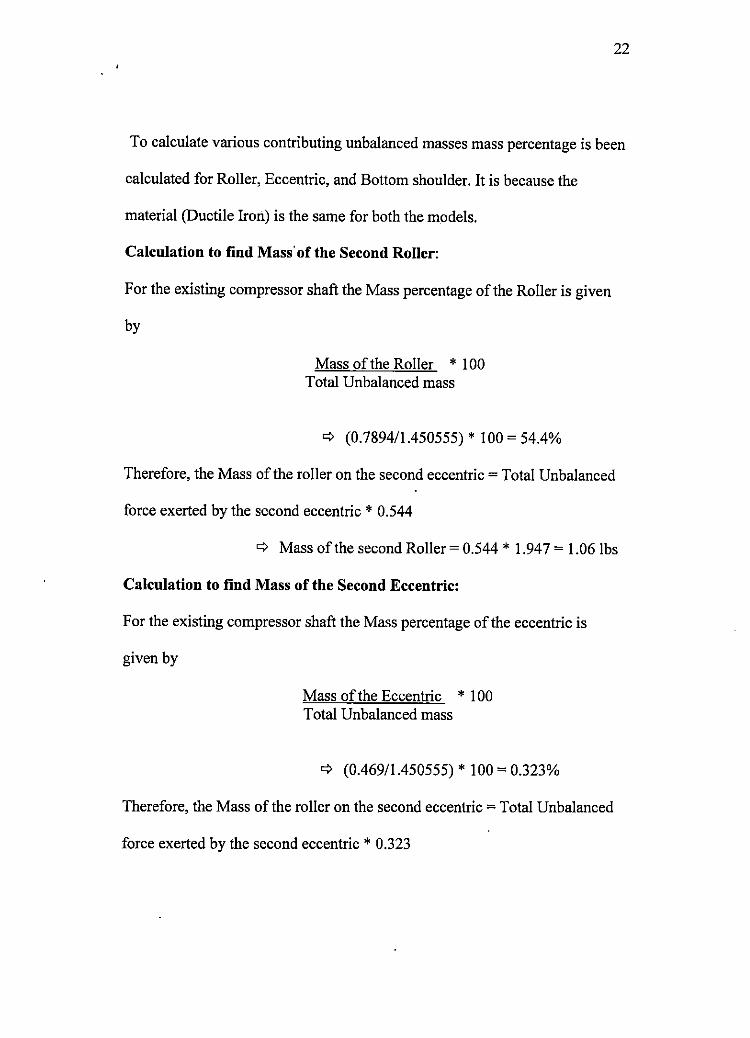
To calculate various contributing unbalanced masses mass percentage is been
calculated for Roller, Eccentric, and Bottom shoulder. It is because the
material (Ductile Iron) is the same for both the models.
Calculation to find Mass· of the Second Roller:
For the existing compressor shaft the Mass percentage of the Roller is given
by
Mass of the Roller * I 00 Total Unbalanced mass
c:::> (0.7894/1.450555) * 100 = 54.4%
Therefore, the Mass of the roller on the second eccentric= Total Unbalanced
force exerted by the second eccentric * 0.544
c:::> Mass of the second Roller= 0.544 * 1.947 = 1.06 lbs
Calculation to find Mass of the Second Eccentric:
For the existing compressor shaft the Mass percentage of the eccentric is
given by
Mass of the Eccentric * 100 Total Unbalanced mass
c:::> (0.469/1.450555) * 100 = 0.323%
Therefore, the Mass of the roller on the second eccentric= Total Unbalanced
force exerted by the second eccentric * 0.323
23
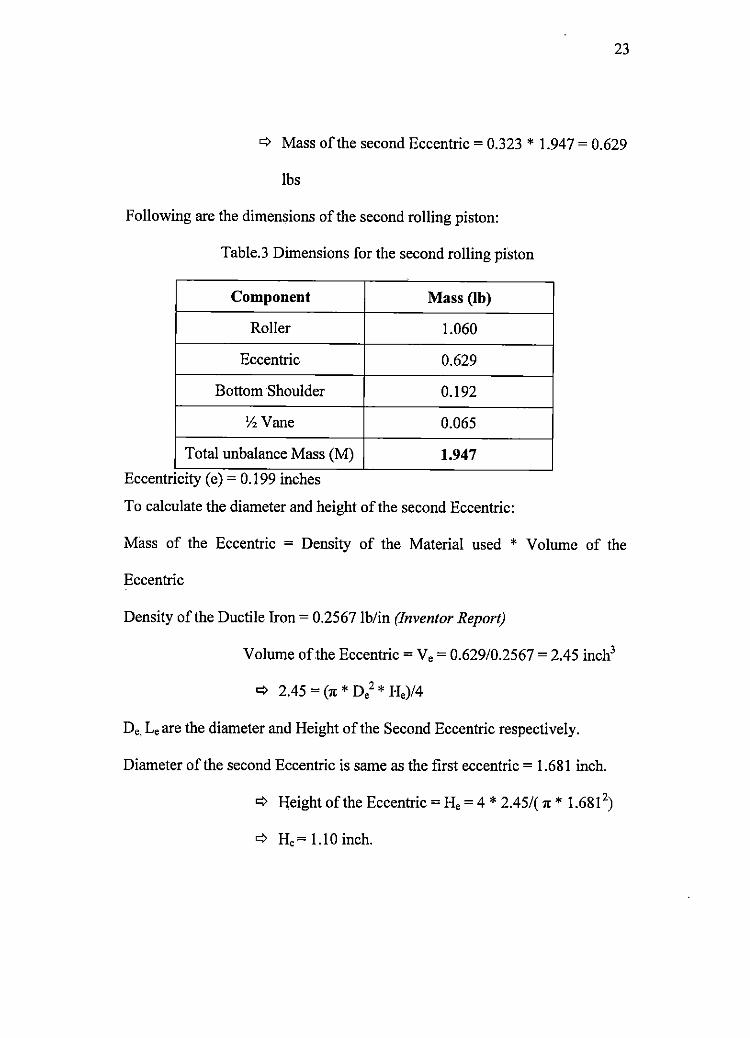
¢ Mass of the second Eccentric= 0.323 * 1.947 = 0.629
lbs
Following are the dimensions of the second rolling piston:
Table.3 Dimensions for the second rolling piston
Component Mass (lb)
Roller 1.060
Eccentric 0.629
Bottom Shoulder 0.192
½Vane 0.065
Total unbalance Mass (M) 1.947
Eccentnc1ty (e) = 0.199 mches
To calculate the diameter and height of the second Eccentric:
Mass of the Eccentric = Density of the Material used * Volume of the
Eccentric
Density of the Ductile Iron= 0.2567 lb/in (Inventor Report)
Volume of the Eccentric =Ve= 0.629/0.2567 = 2.45 inch3
¢ 2.45 = {1t * D/ * He)/4
De, Le are the diameter and Height of the Second Eccentric respectively.
Diameter of the second Eccentric is same as the first eccentric = 1.681 inch.
¢ Height of the Eccentric= He= 4 * 2.45/( 1t * 1.681 2)
¢ He= I.IO inch.
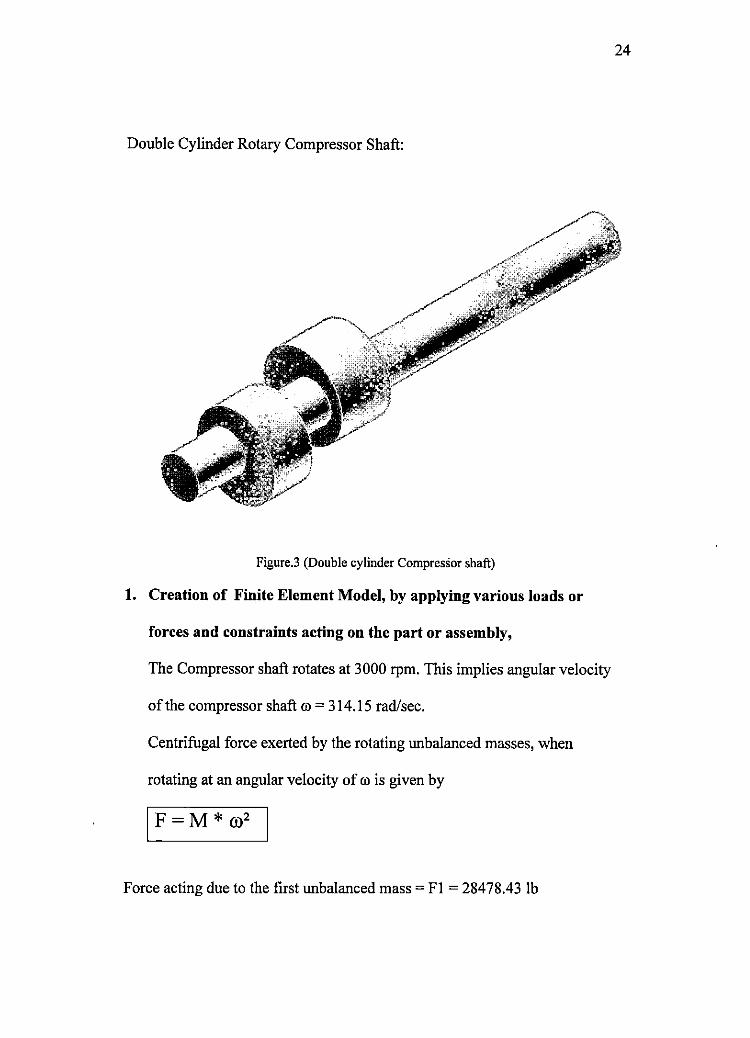
Double Cylinder Rotary Compressor Shaft:
Figure.3 (Double cylinder Compressor shaft)
1. Creation of Finite Element Model, by applying various loads or
forces and constraints acting on the part or assembly,
The Compressor shaft rotates at 3000 rpm. This implies angular velocity
of the compressor shaft co = 314.15 rad/sec.
Centrifugal force exerted by the rotating unbalanced masses, when
rotating at an angular velocity of co is given by
IF=M*ro2
Force acting due to the first unbalanced mass= Fl = 28478.43 lb
24
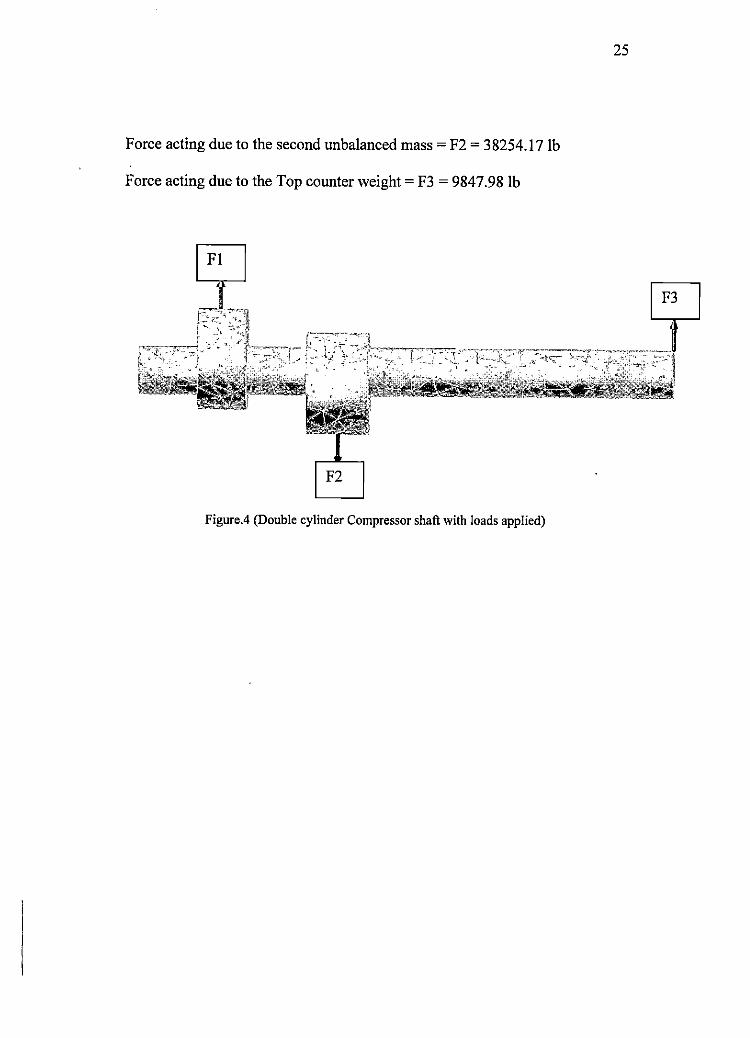
Force acting due to the second unbalanced mass= F2 = 38254.17 lb
Force acting due to the Top counter weight= F3 = 9847.98 lb
Figure.4 (Double cylinder Compressor shaft with loads applied)
25
26
Tabulated Results are obtained from the Finite Element
Analysis Reports generated by the Autodesk-Inventor-09.
(Detailed reports are presented in the Appendix 1 through 5)
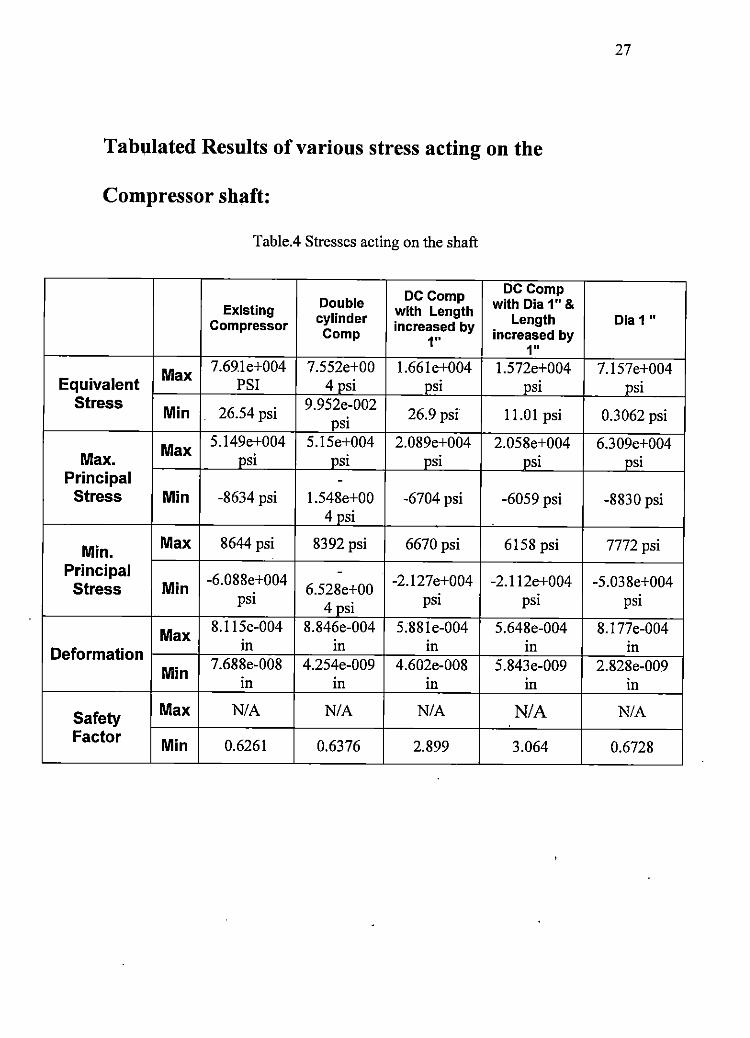
Tabulated Results of various stress acting on the
Compressor shaft:
Table.4 Stresses acting on the shaft
DC Comp DC Comp Double with Dia 1" & Existing cylinder with Length
Length Compressor Comp increased by
increased by 1" 1"
Max 7 .69.1 e+004 7.552e+00 1.661e+004 1.572e+004 Equivalent PSI 4 psi psi psi
Stress Min 26.54 psi
9.952e-002 26.9 psi 11.01 psi psi
Max 5.149e+004 5.15e+004 2.089e+004 2.058e+004 Max. psi psi psi psi
Principal -Stress Min -8634 psi l.548e+00 -6704 psi -6059 psi
4 Psi
Min. Max 8644 psi 8392 psi 6670 psi 6158 psi
Principal -6.088e+004
--2.127e+004 -2.112e+004 Stress Min 6.528e+00
psi 4 psi psi psi
Max 8.l 15e-004 8.846e-004 5.881e-004 5.648e-004
Deformation m m m m 7.688e-008 4.254e-009 4.602e-008 5.843e-009 Min
m m m in
Safety Max NIA NIA NIA NIA Factor Min 0.6261 0.6376 2.899 3.064
27
Dia 1 "
7.157e+004 psi
0.3062 psi
6.309e+004 psi
-8830 psi
7772 psi
-5.038e+004 psi
8.177e-004 m
2.828e-009 in
NIA
0.6728
28
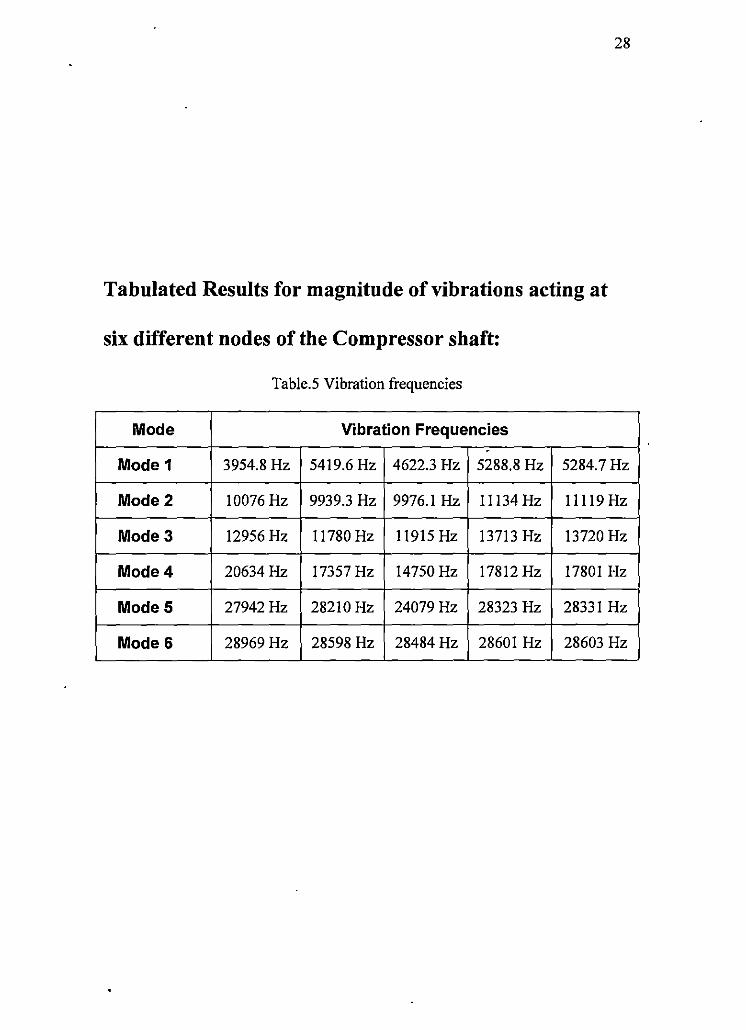
Tabulated Results for magnitude of vibrations acting at
six different nodes of the Compressor shaft:
Tab!e.5 Vibration frequencies
Mode Vibration Frequencies -
Mode 1 3954.8 Hz 5419.6 Hz 4622.3 Hz 5288.8 Hz 5284.7 Hz
Mode2 10076 Hz 9939.3 Hz 9976.1 Hz ll134Hz 11119Hz
Mode3 12956 Hz 11780 Hz 11915 Hz 13713 Hz 13720 Hz
Mode4 20634 Hz 17357 Hz 14750Hz 17812Hz 17801 Hz
Mode5 27942 Hz 28210 Hz 24079 Hz 28323 Hz 28331 Hz
Mode6 28969 Hz 28598 Hz 28484Hz 28601 Hz 28603 Hz
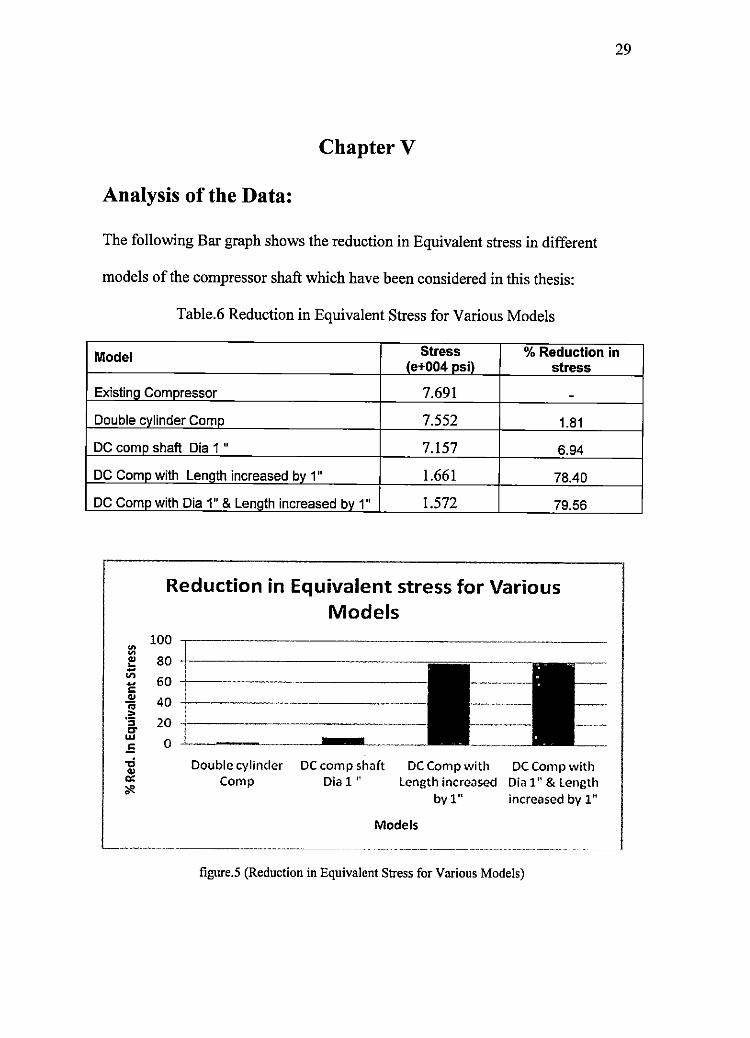
ChapterV
Analysis of the Data:
The following Bar graph shows the reduction in Equivalent stress in different
models of the compressor shaft which have been considered in this thesis:
Table.6 Reduction in Equivalent Stress for Various Models
29
Model Stress % Reduction in le+004 psi) stress
Existina Compressor 7.691 -Double cvlinder Comp 7.552 1.81
DC comp shaft Dia 1 " 7.157 6.94
DC Como with Lenath increased by 1" 1.661 78.40
DC Como with Dia 1" & Length increased bv 1" 1.572 79.56
Reduction in Equivalent stress for Various Models
100 ~ ~ (I) 80 ~ -"' 60 -C
"' 40 -;; > ·s 20 "" w
0 .E ,:; ., ex: 11?.
Double cylinder Comp
DC comp shaft Dial"
DC Comp with Length increased
byl"
Models
DC Comp with Dia 1" & Length increased by 1"
figure.5 (Reduction in Equivalent Stress for Various Models)
30
According to the Equivalent Stress distribution graph, the models DC compressor
shaft with diameter 1 inch and length increased to 1 inch and DC compressor
shaft with length increased by 1 inch has highest percentage of reduction in stress,
when compared to the other models, including the existing compressor. Therefore
the above two models are proved to be the optimal design.
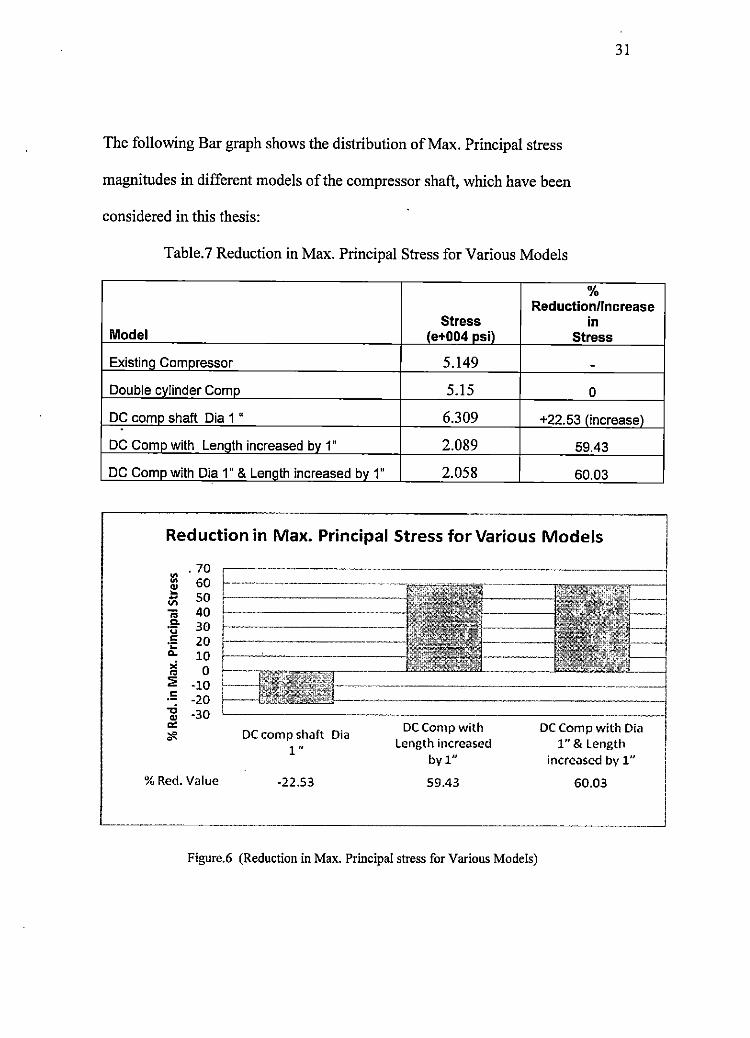
The following Bar graph shows the distribution of Max. Principal stress
magnitudes in different models of the compressor shaft, which have been
considered in this thesis:
Table.7 Reduction in Max. Principal Stress for Various Models
31
% Reduction/Increase
Stress in Model (e+004 psi) Stress
Existina Camaressor 5.149 -Double cvlinder Como 5.15 0
DC como shaft Dia 1 " 6.309 +22.53 (increase l
DC Coma with Lenoth increased bv 1" 2.089 59.43
DC Como with Dia 1" & Lenath increased bv 1" 2.058 60.03
Reduction in Max. Principal Stress for Various Models
"' "' "' ~ -"' ;;; 0. ·.:;
" ·;:: a..
" "' :;; .5 -.; "' "" ;ii.
. 70 60 50 40 30 20 10
0 -10 -20 -30
DC comp shalt Dia 1"
DC Comp with Length increased
byln
% Red. Value -22.53 59.43
Figure.6 (Reduction in Max. Principal stress for Various Models)
DC Comp with Dia 1" & Length
increased by 1"
60.03
32
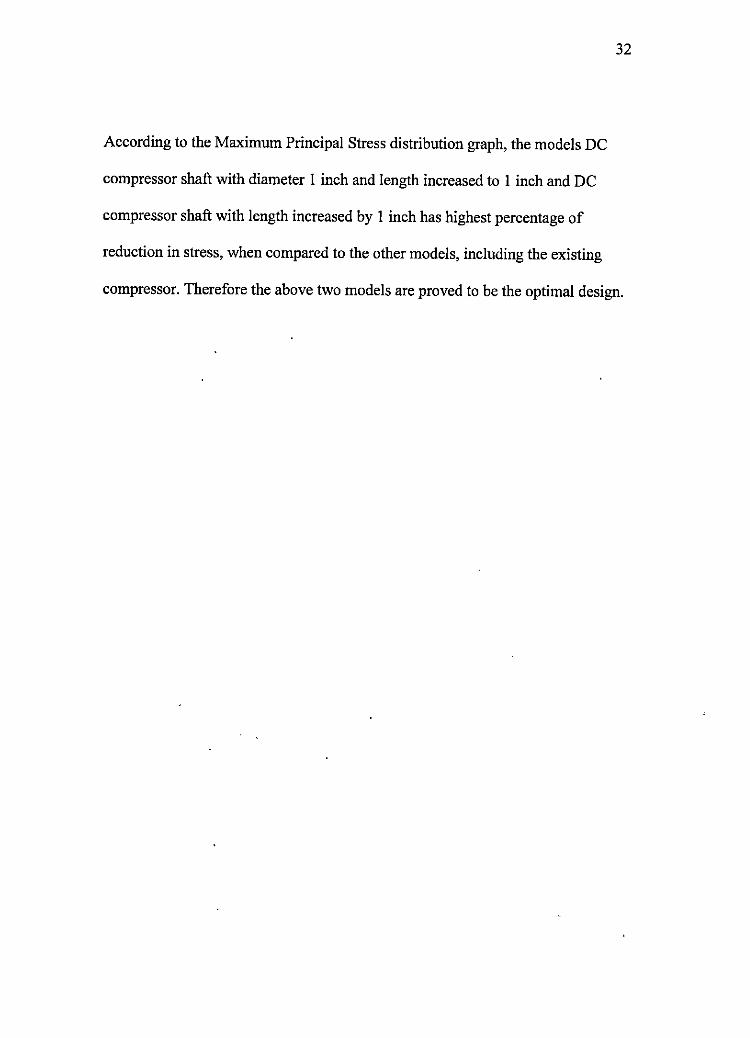
According to the Maximum Principal Stress distribution graph, the models DC
compressor shaft with diameter I inch and length increased to I inch and DC
compressor shaft with length increased by I inch has highest percentage of
reduction in stress, when compared to the other models, including the existing
compressor. Therefore the above two models are proved to be the optimal design.
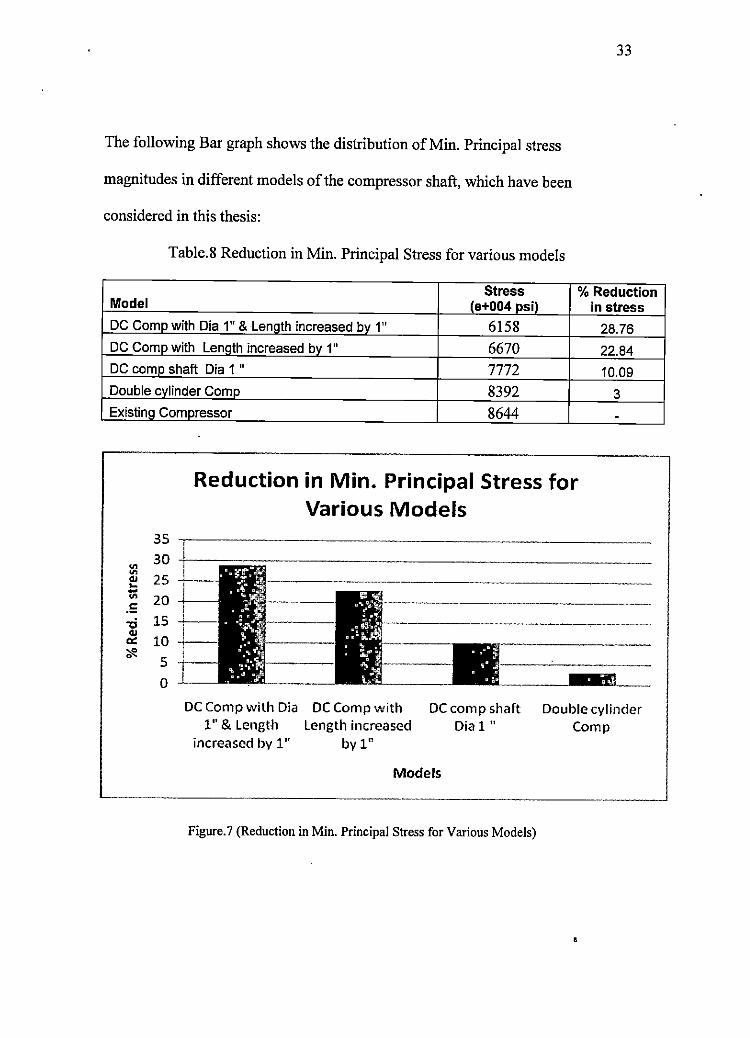
The following Bar graph shows the distribution of Min. Principal stress
magnitudes in different models of the compressor shaft, which have been
considered in this thesis:
Table.8 Reduction in Min. Principal Stress for various models
33
Stress % Reduction Model (e+004 osil in stress DC Comp with Dia 1" & Lenath increased by 1" 6158 28.76 DC Como with Length increased bv 1" 6670 22.84 DC comp shaft Dia 1 " 7772 10.09 Double cylinder Comp 8392 3
Existino Compressor 8644 -
Reduction in Min. Principal Stress for Various Models
35
"' 30
"' 25 "' .. -"' 20 .E -ti 15 "' a: 10 ~ 5
0
DC Comp with Dia DC Comp with DC comp shaft 1" & Length Length increased Dia 1 "
increased by 1" by 1"
Models
Figure.? (Reduction in Min. Principal Stress for Various Models)
---"••···---·-
Double cylinder Comp
34
According to the Minimum Principal Stress distribution graph, the models DC
compressor shaft with diameter I inch and length increased to 1 inch and DC
compressor shaft with length increased by 1 inch has highest percentage of
reduction in stress, when compared to the other models, including the existing
compressor. Therefore the above two models are proved to be the optimal design.
35
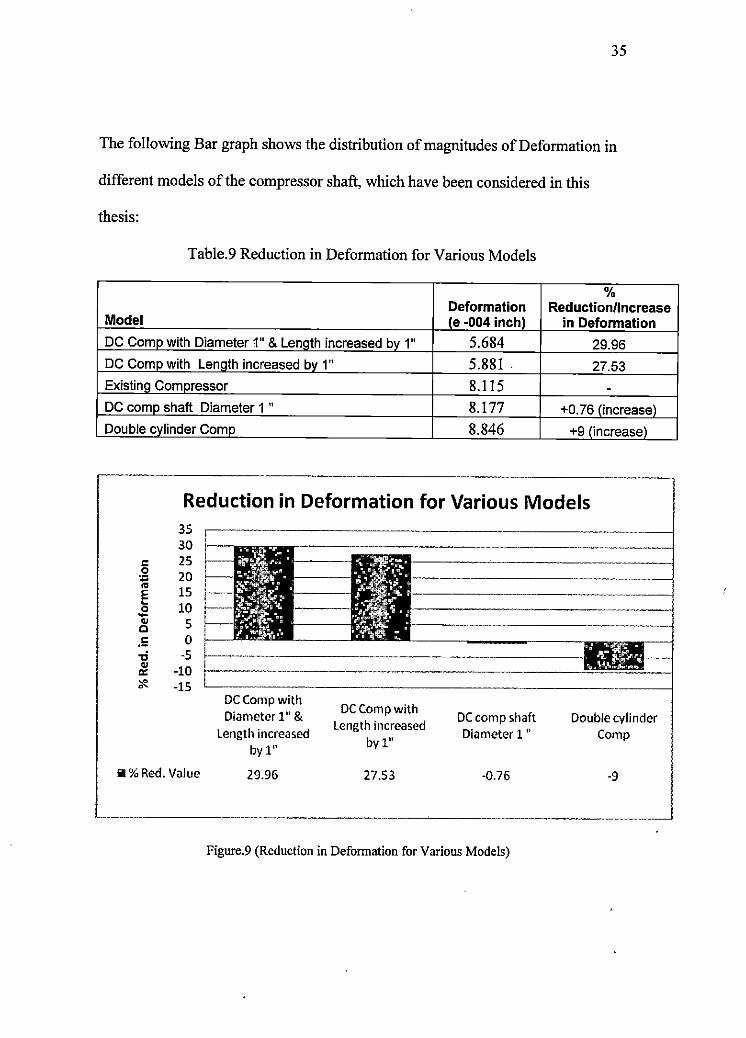
The following Bar graph shows the distribution of magnitudes of Deformation in
different models of the compressor shaft, which have been considered in this
thesis:
Table.9 Reduction in Deformation for Various Models
% Deformation Reduction/Increase
Model le -004 inchl in Deformation
DC Comp with Diameter 1" & Length increased bv 1" 5.684 29.96
DC Comp with Lenath increased bv 1" 5.881 . 27.53
Existina Comoressor 8.115 -DC comp shaft Diameter 1 " 8.177 +O. 76 (increase)
Double cvlinder Comp 8.846 +9 (increase)
Reduction in Deformation for Various Models 35 30
C 25 0
20 .:,
"' 15 E ~
10 0 -., 5 Q
.5 0 ,:j -5 .,
-10 a::
* -15
Iii% Red. Value
DC Comp with Diameter 1" &
Length increased by 1"
29.96
DC Comp with Length increased
by 1"
27.53
DC comp shaft Diameter 1"
-0.76
Figure.9 (Reduction in Defonnation for Various Models)
Double cylinder Comp
-9
According to the Deformation graph, the models DC compressor shaft with
diameter 1 inch and length increased to 1 inch and DC compressor shaft with
length increased by 1 inch has highest percentage of reduction in deformation,
when compared to the other models, including the existing compressor.
Therefore, the above two models are proved to be the optimal design.
36
37
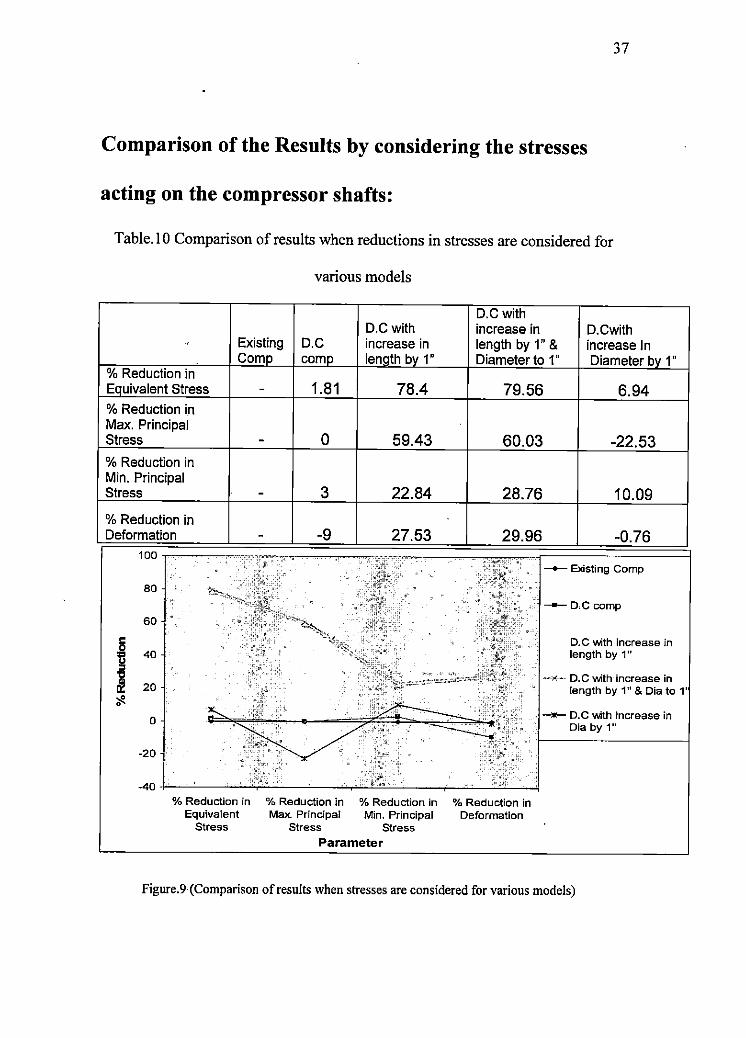
Comparison of the Results by considering the stresses
acting on the compressor shafts:
Table. IO Comparison of results when reductions in stresses are considered for
various models
D.Cwith D.C with increase in D.Cwith
Existing D. C length by 1" & increase In
% Reduction in E uivalent Stress
% Reduction in Max. Principal Stress
% Reduction in Min. Principal Stress
% Reduction in Deformation
100
80
60
40
20
0
-20
Com
% Reduction in Equivalent
Stress
1.81 78.4
0 59.43
3 22.84
-9 27.53
Diameter to 1" Diameter b 1"
79.56 6.94
60.03 -22.53
28.76
29.96
10.09
-0.76
~ Existing Comp
-D.Ccomp
D. C with Increase in length by 1 ••
-,+-- D. C with increase in length by 1" & Dia to 1'
-.- D.C Vvith increase in Dia by 1"
% Reduction in % Reduction in % Reduction in Max. Principal Min. Principal Deformation
Stress Stress Parameter
Figure.9 (Comparison ofresults when stresses are considered for various models)
38
According to the graph Comparison of results, when stresses are considered, the
models DC compressor shaft with diameter I inch and length increased to I inch
and DC compressor shaft with length increased by I inch has highest percentage
of reduction in stresses and deformation, when compared to the other models,
including the existing compressor. Therefore the above two models are proved to
be the optimal design.
39
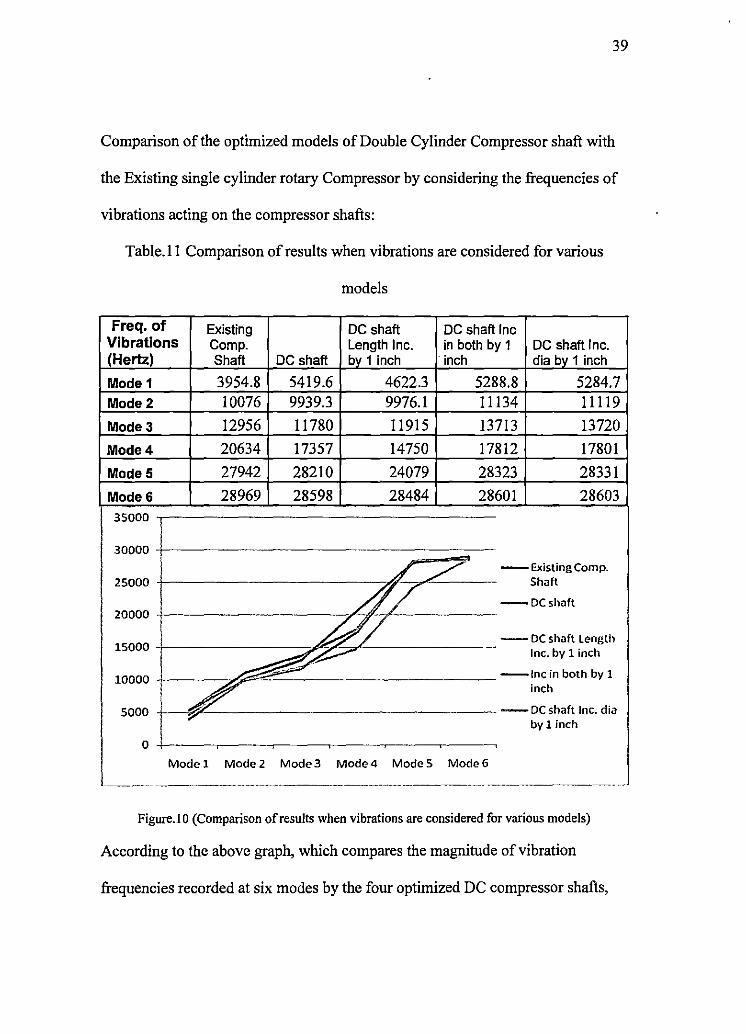
Comparison of the optimized models of Double Cylinder Compressor shaft with
the Existing single cylinder rotary Compressor by considering the frequencies of
vibrations acting on the compressor shafts:
Table. I I Comparison of results when vibrations are considered for various
Freq. of Vibrations Hertz)
Mode1 Mode2
Mode3
Mode4
Mode5
Mode& 35000
30000
25000
20000
15000
10000
5000
Existing Comp. Shafi
3954.8 10076 12956 20634 27942 28969
DC shaft
5419.6 9939.3 11780 17357 28210 28598
models
DC shaft DC shaft Inc Length Inc. in both by 1 DC shaft Inc. b 1 inch · inch dia b 1 inch
4622.3 5288.8 5284.7 9976.1 11134 11119 11915 13713 13720 14750 17812 17801 24079 28323 28331 28484 28601 28603
- Existing Comp. _,,c.____ Shaft
-DC shaft
-- DC shaft Length Inc. by 1 inch
:;:_ ____________ -Inc in both by 1
inch
"-----------------DC shaft Inc. dia by 1 inch
Mode 1 Mode 2 Mode 3 Mode 4 Mode 5 Mode 6
Figure.IO (Comparison ofresults when vibrations are considered for various models)
According to the above graph, which compares the magnitude of vibration
frequencies recorded at six modes by the four optimized DC compressor shafts,
including the existing compressor shaft. It can be observed that only one model
i.e., the DC compressor shaft with length increased by 1 inch has recorded very
less magnitudes of vibration of frequencies at six modes.
Summary of Data Analysis:
40
According to the graphs generated in the data analysis section, it is observed that
the models; when compared to the existing model of the single cylinder rotary
compressor shaft, Double cylinder compressor shaft with diameter increased to I
inch, and length increased to I inch is subjected to only 80 % Equivalent stress,
60% Max. Principal stress, 3 0% Min. principal, and Deformation is also been
reduced to about 30%. As it is also noticeable that the Double Cylinder
Compressor shaft model with length increased by l ", is also very close to the
Double Cylinder compressor shaft with length and diameter increased to l ".
When the magnitude of vibration frequencies are concerned, Double Cylinder
Compressor shaft with length increased by I inch has recorded the minimum
magnitude of vibration frequency at all the six modes compared to the other
models.
So it been observed by considering all the parameter of the Finite Element Report
generated by Inventor, that the Double cylinder compressor model with increased
length has more positive results.
41
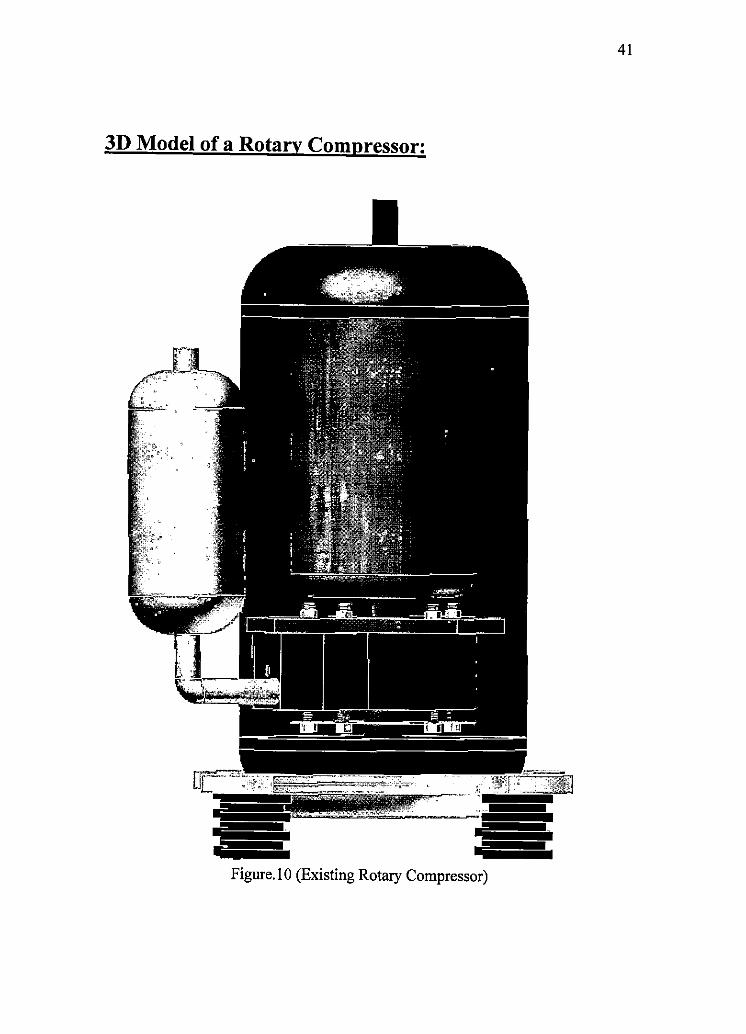
3D Model of a Rotary Compressor:
Figure. IO (Existing Rotary Compressor)
42
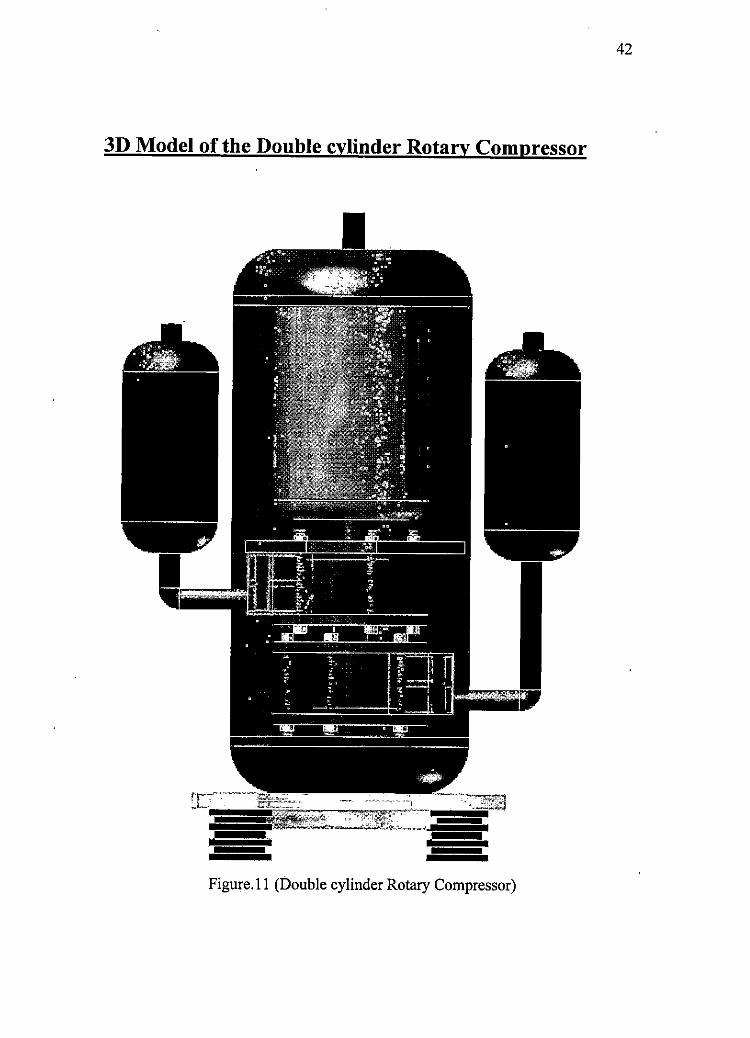
3D Model of the Double cylinder Rotary Compressor
Figure.11 (Double cylinder Rotary Compressor)
43
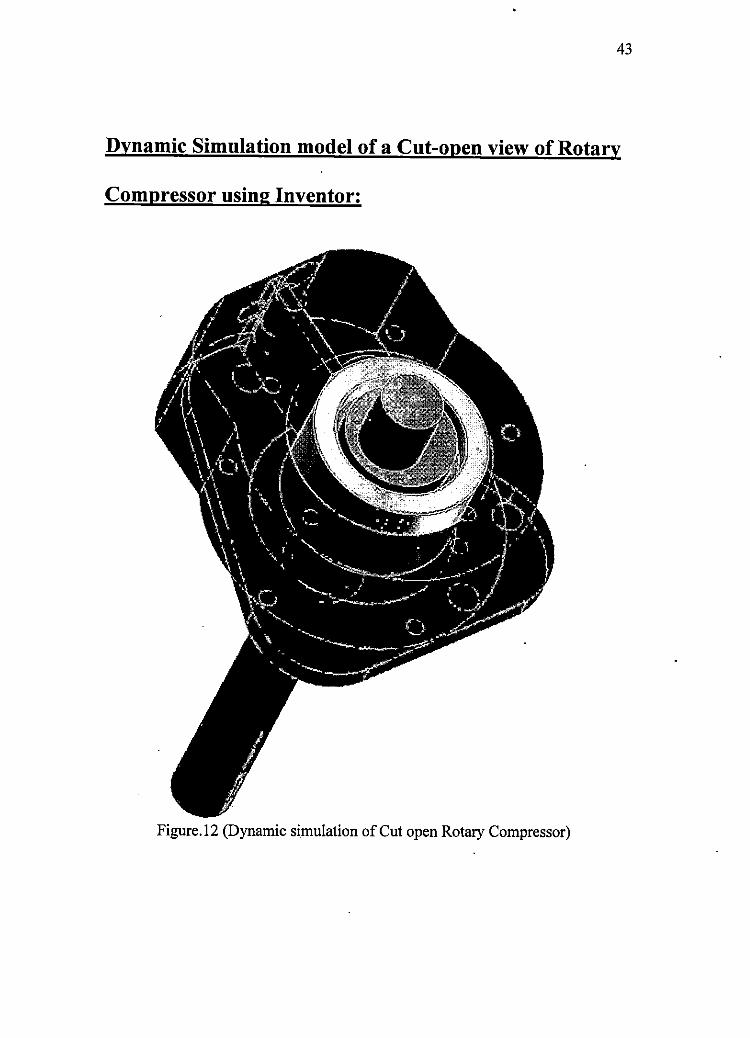
Dynamic Simulation model of a Cut-open view of Rotary
Compressor using Inventor:
Figure.12 (Dynamic simulation of Cut open Rotary Compressor)
44
Conclusion:
The thesis titled "Design optimization of a Rotary compressor" has been done to
convert a single cylinder rotary compressor in to two cylinder rotary compressor,
such that the aim of the study to improve the reliability and performance of the
existing single cylinder rotary compressor is fulfilled. This is done by replacing
the main counter weight of single cylinder rotary compressor with second rolling
piston.
A three dimensional model of the single cylinder rotary compressor, and
optimized design (Double cylinder rotary compressor) have been created using a
CAD software called Inventor.
According to the FEA reports generated by the Inventor and based on the Finite
Element Analysis done on both existing single cylinder and optimized double
cylinder shafts it is evident that the Double cylinder Rotary Compressor has many
advantages over the Existing single cylinder Rotary compressor.
The optimization of the shaft is been done in four different phases. They are
Double cylinder shaft, Double cylinder shaft with diameter increased from 0.815
to 1 inch, Double cylinder shaft with increase in length by 1 inch, and finally the
combination of 2, and 3, which is Double cylinder shaft with diameter increased
from 0.815 to 1 inch, and length of the shaft increased by 1 inch.
The third (Increase in length by 1 inch) model among the four optimized models
is been proved to be the most efficient model of the double cylinder Rotary
45
compressor shaft in terms of various stress acting on the shaft, and magnitudes of
frequency of vibration acting at six different nodes of the shaft. Therefore the
objectives of the thesis have been accomplished.
Future Research:
The future work for this thesis would be the application of Computational Fluid
Dynamic techniques, to check the imbalance created on the rotary compressor
shaft, when the process of compression of working fluid or refrigerant takes place.
46
References
Ebara, (November 20, 2001). Two-cylinder type two-stage compression rotary
compressor, retrieved on September 10, 2008, from:
http://www.patentstorm.us/patents/6318981/fulltext.html
Haggerty, (August 26th 1980), Rolling Piston Rotary Compressor. Retrieved
on September 10, 2008, from:
(http ://www.patentgenius.com/patent/ 4 219314 .html)
Sato, Kawaguchi, Susumu, (April 30th 1993), Enclosed Type Rotary
Compressor. Retrieved on September 12, 2008, from:
http://www.patentalpha.com/hermetically sealed motor pump unit c
1417 sc902/enclosed type rotary compressor 5328344.html
Muherjee, (April-June 2001), A New Design Rotary Compressor for Mobile
AC&R AppJications. Retrieved on September 13, 2008, from:
http://www.hvacindia.com/j ournals/2001 apr/article02.html
Han, Hwang and Koo, Vibration Analysis of a Rotary Compressor:
International Journal of Precision Engineering and Manufacturing
Vol.5, No.3, pp 43-53. Retrieved on September 15, 2008, from:
http://www.ijpem.org/j ournal/files/issues/2004-07-4 3-53. pdf
Khurmi & Gupta, Refrigeration & Air-Conditioning, S. Chand and Co. Ltd.,
pp 248-267.
Joseph E. Shigiley & Charles R. Mischke, Mechanical Engineering Design,
Tata McGraw Hill.
Khurmi & Gupta, Theory of Machines, S. Chand and Co. Ltd., pp 809-832.
Edvin P. Anderson, Home Refrigeration and Air Conditioning.
47
Ulises F. Gonzalez, A Igor inc -A Discussion on Modern Design optimization
Tools: Full Associativity of CAD, FEA and Event Simulators
http://www.algor.com/news pub/tech white papers/design optimizati on/default.asp
Kurmagadda, (April 2006), Design optimization of a Rotary compressor.
Retrived on September 18, 2008.
Websites:
http://dspace.mit.edu/handle/1721. l/9912
http:/ /books.google.com/books?id=zyOSA 7 xt4YC&pg=P A93&lpg=P A93&
dg=mass.+eccentricity,+rpm.+and+force+relation&source~eb&ots=GJOklg
pPeh&sig=RRo05jAAJ0yw2Lr31VQfBuETgTE&hl=en&sa=X&oi=book res
ult&resnum= I &ct=result#PP A98,Ml
48
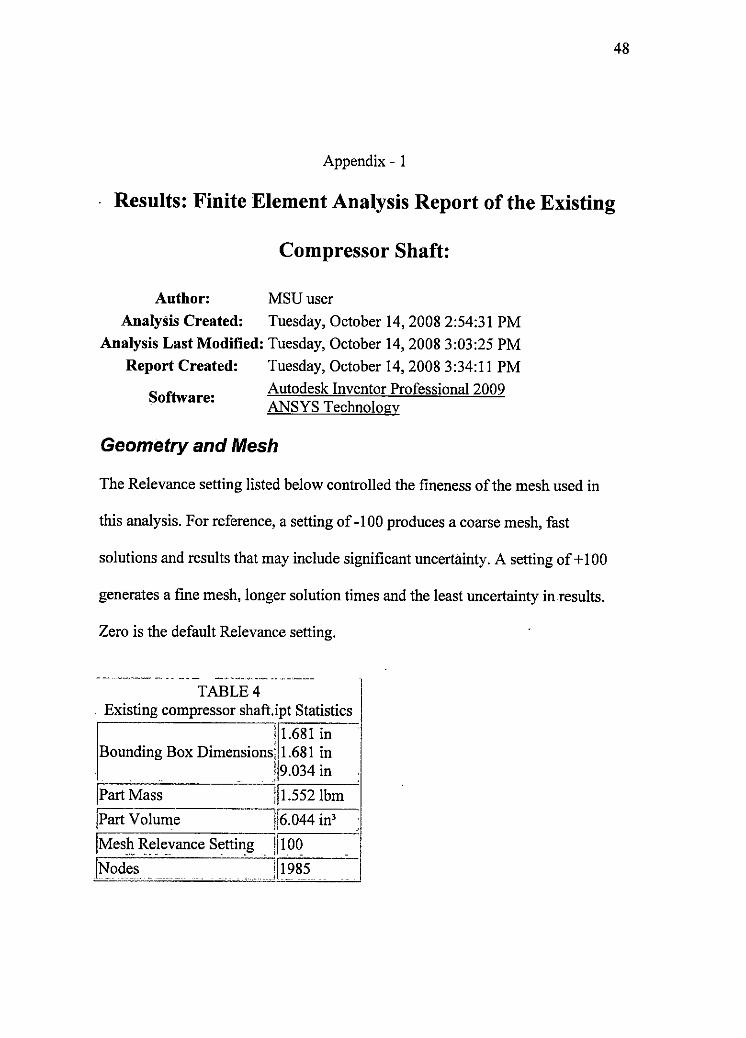
Appendix - 1
Results: Finite Element Analysis Report of the Existing
Compressor Shaft:
Author: MSU user
Analysis Created: Tuesday, October 14, 2008 2:54:31 PM
Analysis Last Modified: Tuesday, October 14, 2008 3:03:25 PM
Report Created: Tuesday, October 14, 2008 3:34:11 PM
Software: Autodesk Inventor Professional 2009 ANSYS Technology
Geometry and Mesh
The Relevance setting listed below controlled the fineness of the mesh used in
this analysis. For reference, a setting of -100 produces a coarse mesh, fast
solutions and results that may include significant uncertainty. A setting of+ I 00
generates a fine mesh, longer solution times and the least uncertainty in results.
Zero is the default Relevance setting.
--••-•M-'-•-• -•• •- --- - - M"'-"'"-•- •• -• ----
TABLE4 Existing compressor shaft.ipt Statistics
! 1.681 in Bounding Box Dimensions: 1.681 in
i 9.034 in
jPartMass il!.552 lbm
!Part Volume jj6.044 in'
jMesh Relevance Setting IIJO~ -··~ -- - -- . -[Nodes_ _____ -_ JII985
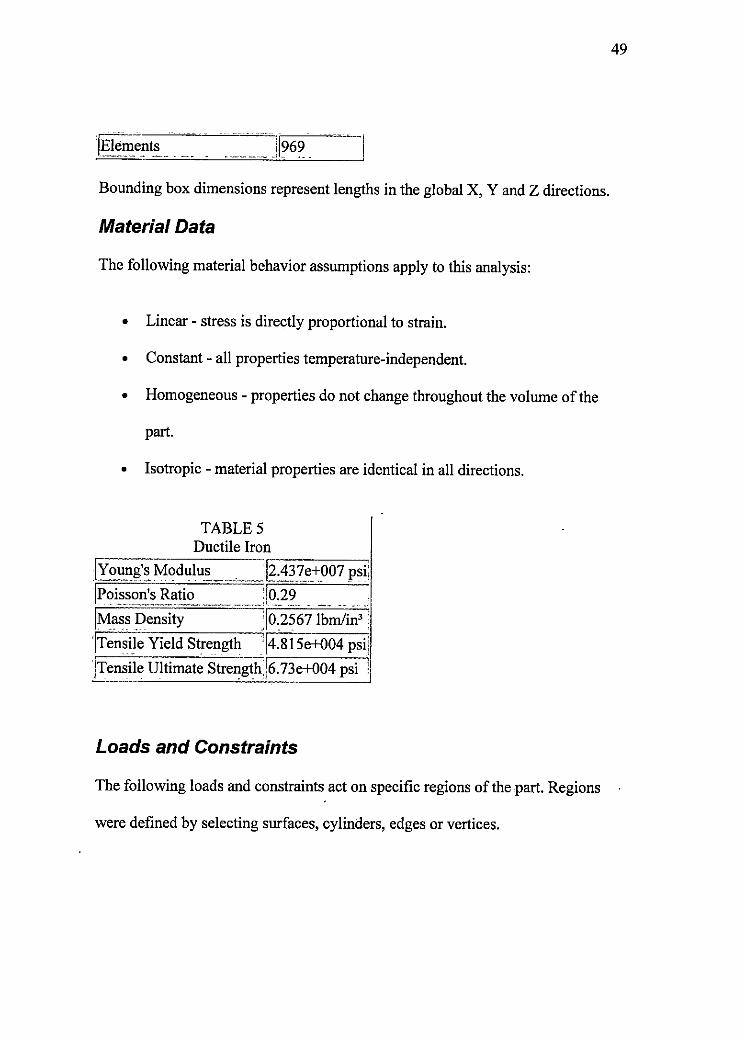
Bounding box dimensions represent lengths in the global X, Y and Z directions.
Material Data
The following material behavior assumptions apply to this analysis:
• Linear - stress is directly proportional to strain.
• Constant - all properties temperature-independent.
• Homogeneous - properties do not change throughout the volume of the
part.
• Isotropic - material properties are identical in all directions.
TABLES Ductile Iron
,[y oung's Modulus '[2_.4_3 7_e_+_0-07_p __ s~i1
1
[Pois_son'; fu!tj~_: ______ Jo.~2~ . ~- ... , ·
jMass Density j0.2567 lbm/in3 ! '[Tensi]e Yield Strength '[4.815e+004 psil
/Tensile UJtimate Strength/6.73e+004 psi l
Loads and Constraints
The following loads and constraints act on specific regions of the part. Regions
were defined by selecting surfaces, cylinders, edges or vertices.
49
50
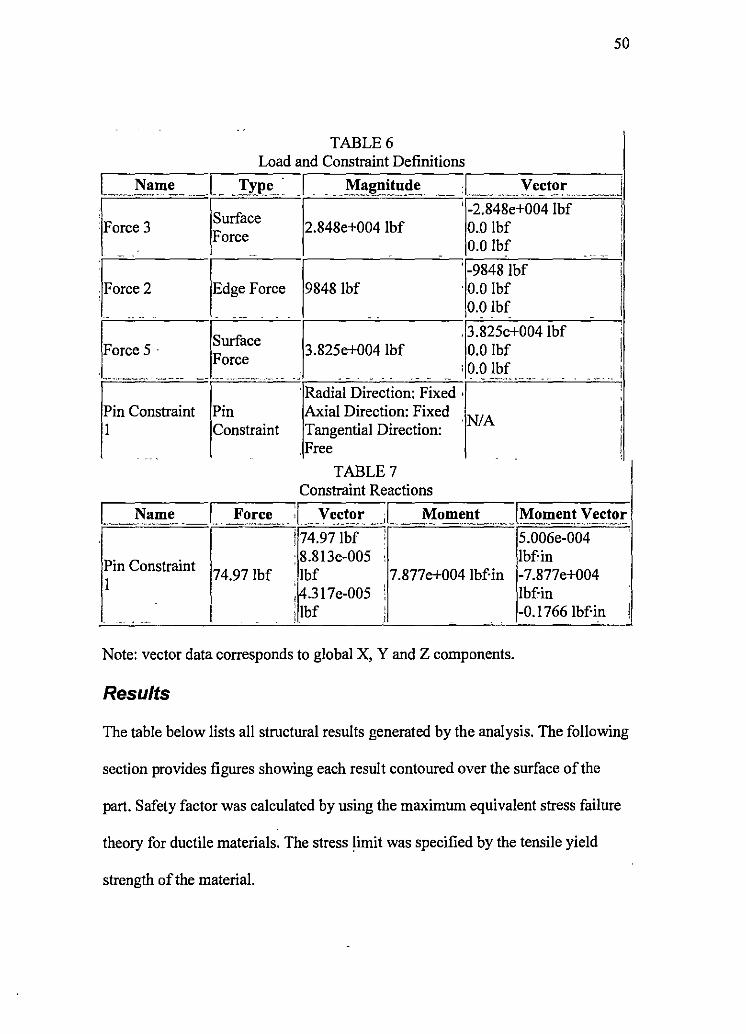
.. TABLE6
Load and Constraint Definitions
L Name ____ .[ _ Type _I ___ Magnitude L Vector i Fs~ . ,., ,w ~,.. . . ' -2.848e+004 !bf I
2.848e+004 !bf 0.0 !bf I orce F ' orce 0.0 !bf i - - - --
:F 19848 lbf
' -9848 lbf
I Edge Force · 0.0 !bf
0.0 !bf - - - ' - - - . - -
E Surface , 3.825e+004 lbf '
3.825e+004 lbf 0.0 !bf I Force I
: 0.0 !bf ' '_.,.,, --- ·~·~--- - --- -·-· -· - '" . . . -- - - ____ ,_ -·- --·- - .. - ·~' I
' Radial Direction: Fixed , ' ' Pin Constraint Pin Axial Direction: Fixed I
NIA I
I Constraint Tangential Direction: ' ' Free I TABLE7
Constraint Reactions
I_ Name __ I __ Force _:/.._Vector __ L_ Moment Moment Vector
Pin Constraint I
74.97 lbf
i 74.97 lbf : 8.813e-005 !bf 7.877e+004 lbf-in
; 4.317e-005 ; !bf '
Note: vector data corresponds to global X, Y and Z components.
Results
5.006e-004 lbf·in -7.877e+004 lbf·in -0.1766 !bf-in
Tbe table below lists all structural results generated by the analysis. Tbe following
section provides figures showing each result contoured over the surface of the
part. Safety factor was calculated by using the maximum equivalent stress failure
theory for ductile materials. The stress limit was specified by the tensile yield
strength of the material.
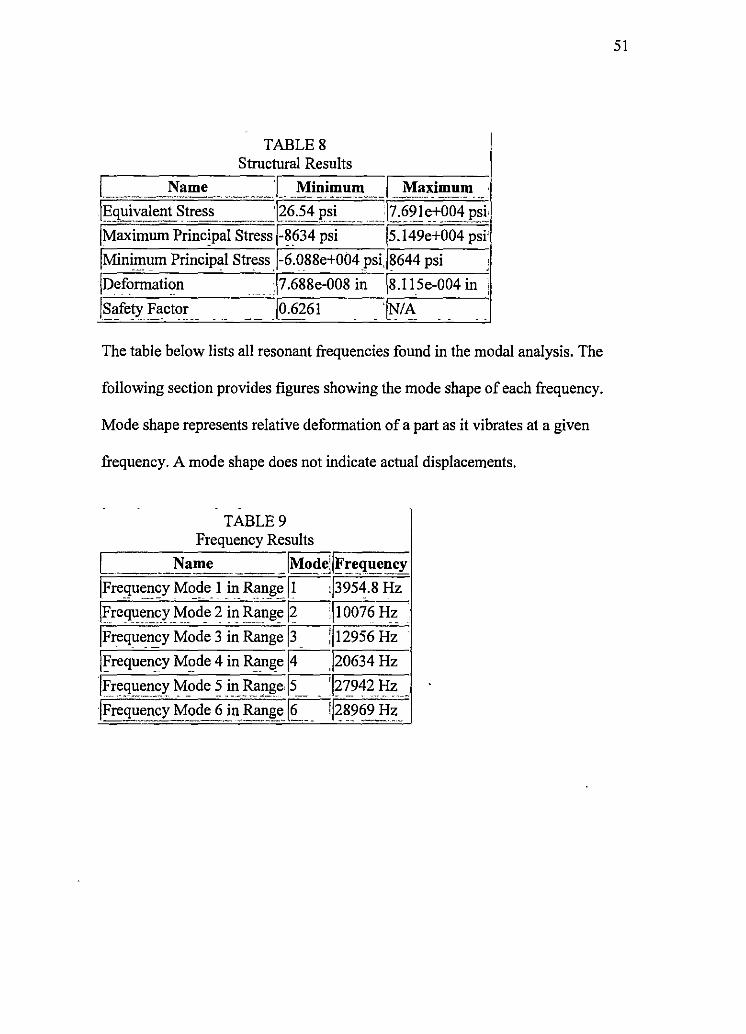
TABLES Structural Results
I Name __ j ___ Mini!1_1.Ul_ll __ J ---~11~~mn __ · --l§guivalent Stress _ t~:54psi _ _J7.691e+004 psi
jMaximum Princ)pal Stress j-~634 psi 5.149e+004 psi·
jMinh_1mm Principal Stress _j-6.088e+004 psi. 8644 psi ; ,
jDeformaticm 17 .688e-008 in js.I 15e-004 in :
Jsi:fe~ Fact?~ __ . -- -- Jo.6~61 - ·1!'11~ .. . .
The table below lists all resonant frequencies found in the modal analysis. The
following section provides figures showing the mode shape of each frequency.
Mode shape represents relative deformation of a part as it vibrates at a given
frequency. A mode shape does not indicate actual displacements .
. .
TABLE9 Frequency Results
L Name jModeijFrequency -- -----~ -- ,. - '
jFre_guency Mode_ 1 _in_ Ran~~ ~/3954.8 Hz
IJ::re9~en_1:x_rvlod~ 2 in !l~ng~ 12 ;jl0076 Hz
IFreguency Mode 3 in Range ~j12956 Hz
jFrequency Mode 4 in Range ~)20634 Hz - - -- -- -
jl'reg~~_n_cx :tvlode 5 in__Ran__l!e [5__ . ]~7942 l-Iz _,
jFrequency M_ode 6_ in Range_ @=71~8969 H~_
51
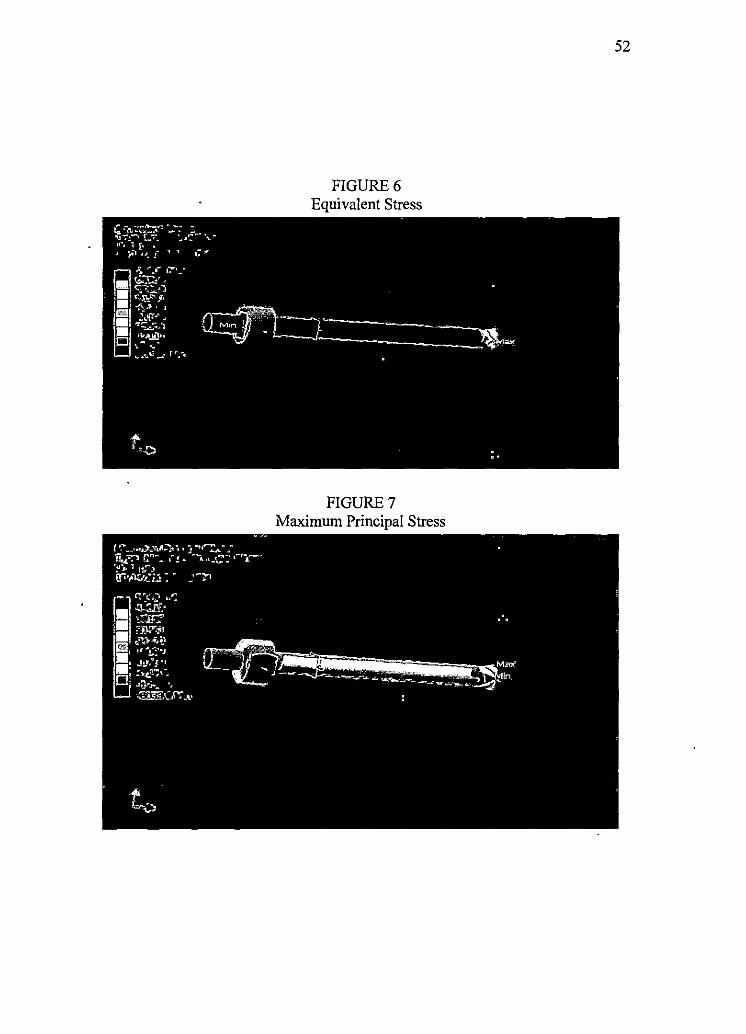
FIGURE6 Equivalent Stress
FIGURE 7 Maximum Principal Stress
52
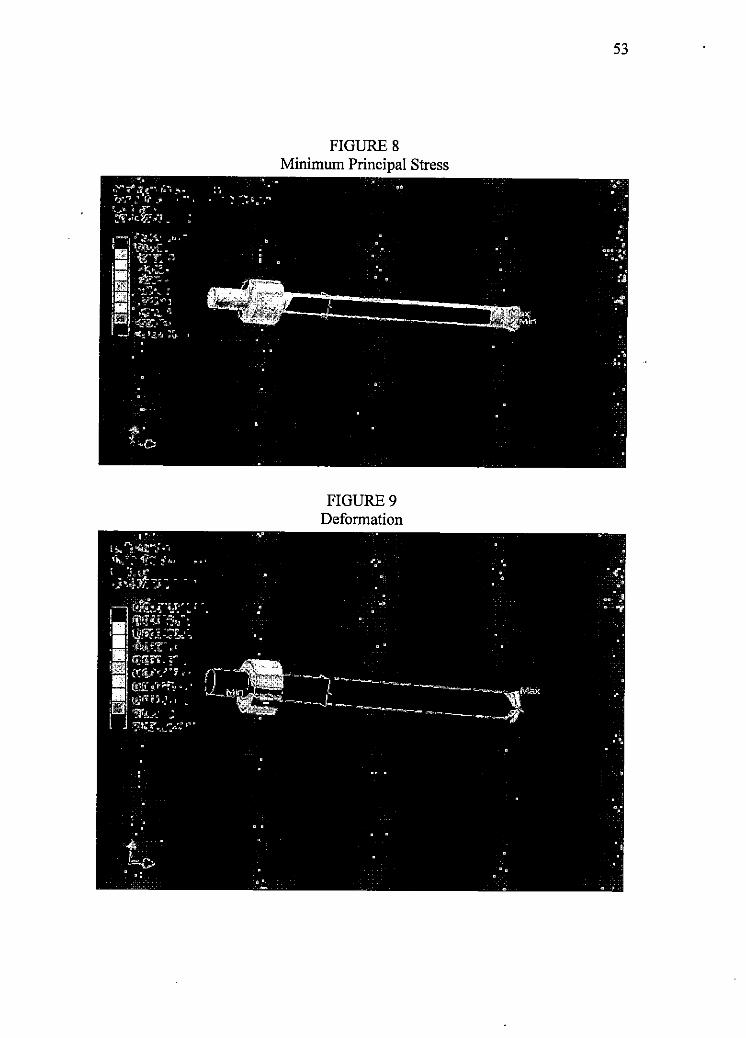
FIGURE 8 Minimum Principal Stress
FIGURE9 Deformation
53
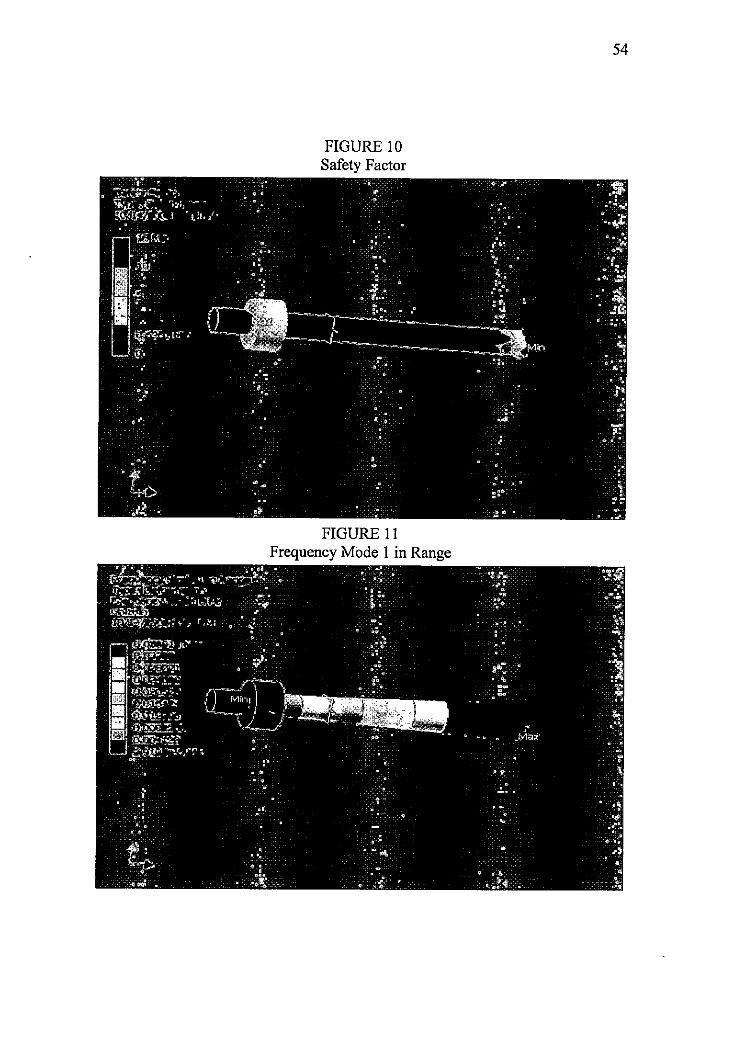
FIGURE 10 Safety Factor
FIGURE 11 Frequency Mode 1 in Range
54
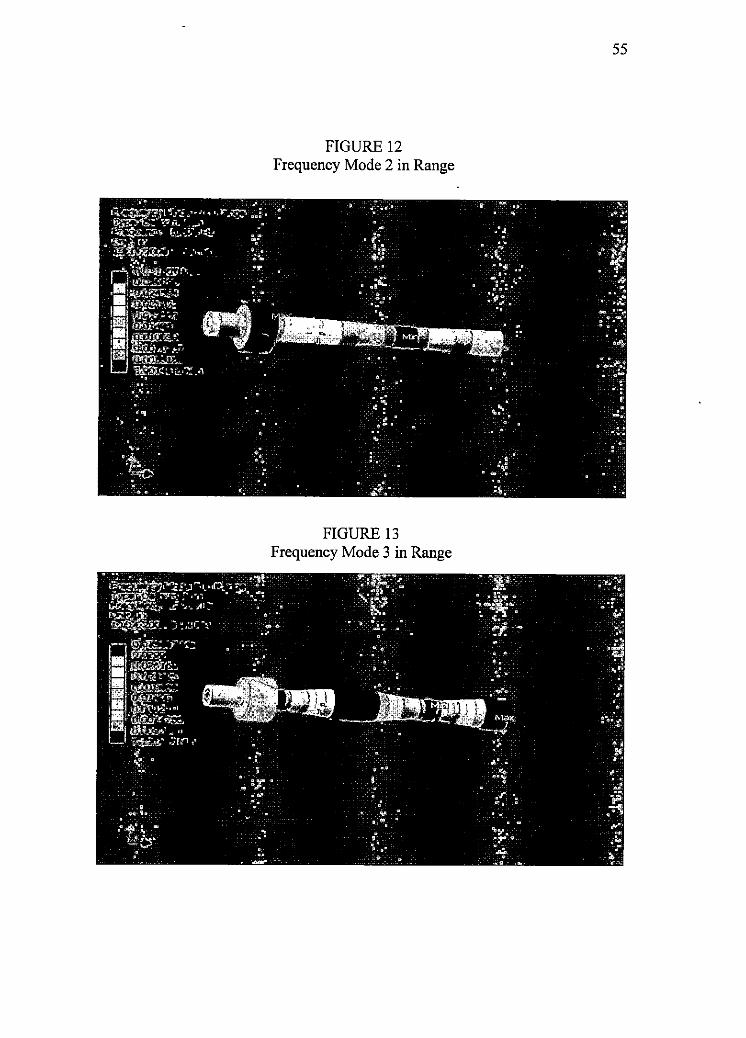
FIGURE 12 Frequency Mode 2 in Range
FIGURE 13 Frequency Mode 3 in Range
55
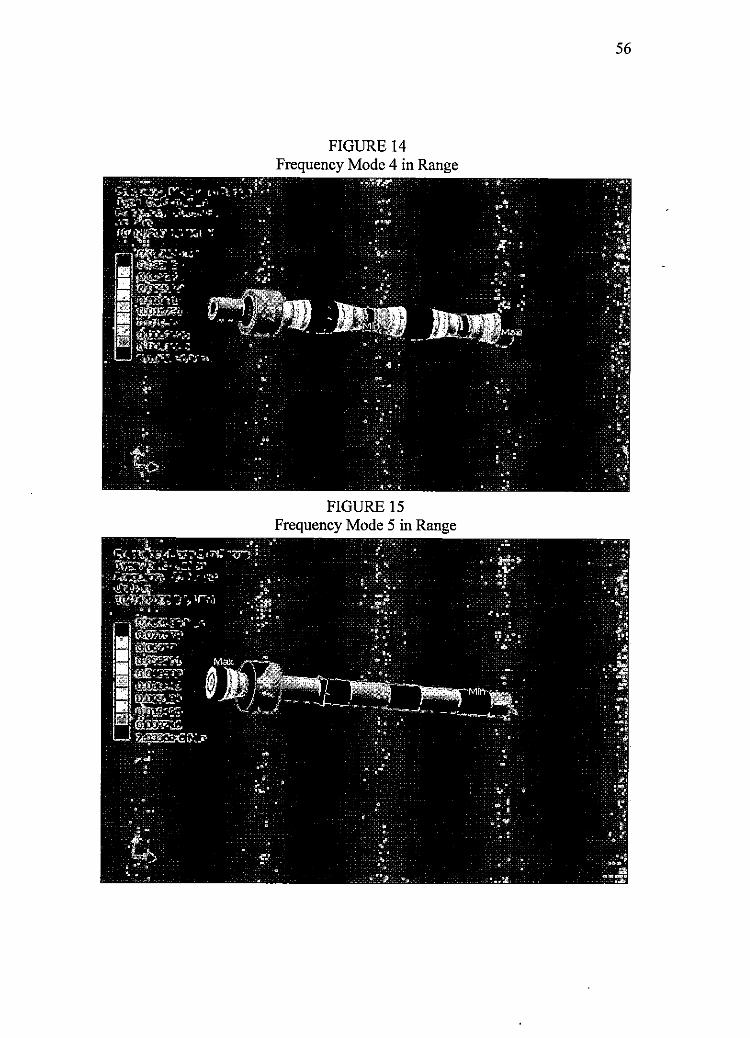
FIGURE 14 Frequency Mode 4 in Range
FIGURE 15 Frequency Mode 5 in Range
56
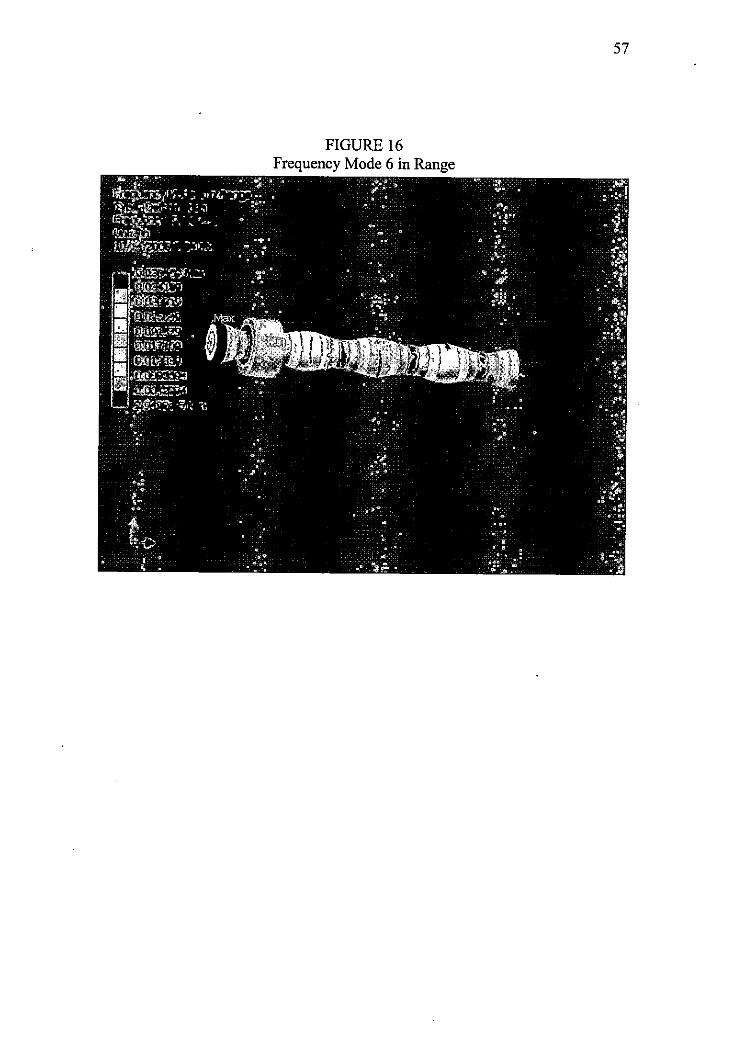
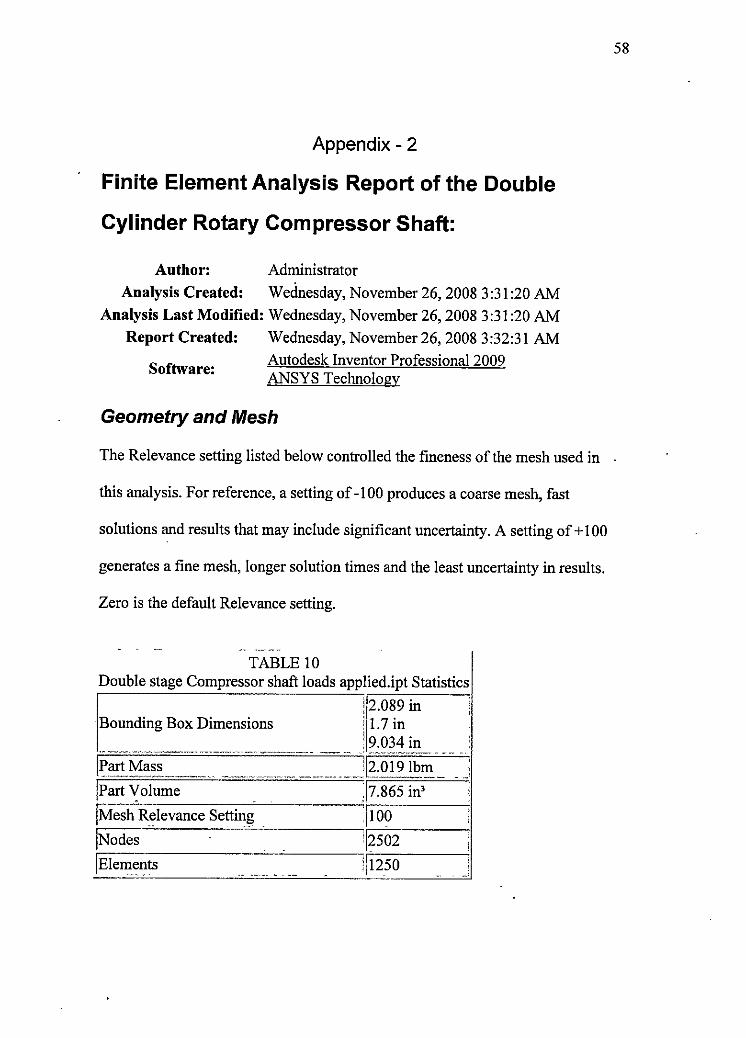
FIGURE 16 Frequency Mode 6 in Range
57
Appendix - 2
Finite Element Analysis Report of the Double
Cylinder Rotary Compressor Shaft:
Author: Administrator
Analysis Created: Wednesday, November 26, 2008 3:31:20 AM
Analysis Last Modified: Wednesday, November 26, 2008 3 :31 :20 AM
Report Created:
Software:
Wednesday, November 26, 2008 3:32:31 AM
Autodesk Inventor Professional 2009 ANSYS Technology
Geometry and Mesh
The Relevance setting listed below controlled the fineness of the mesh used in
this analysis. For reference, a setting of -100 produces a coarse mesh, fast
solutions and results that may include significant uncertainty. A setting of+ 100
generates a fine mesh, longer solution times and the least uncertainty in results.
Zero is the default Relevance setting .
- .. --~-" -TABLE 10
Double stage Compressor shaft loads applied.ipt Statistics
2.089 in ' Bounding Box Dimensions 1.7 in
. 9.034 in i
' •w ~-~- ,w,,"_ - ---•••••·,c,--•·• . . .. }2~019 Ibm
. - -, - . !Part Mass '
' '. c-- -·-----· ----•-•"""••-·· ... ' !Part ': olume j7.865 in'
!Mesh Relevance Setting 100 ' i "" .... ,.
JNodes 112502
I Elements ·- ,,.., ·-- - . -- !1250
58
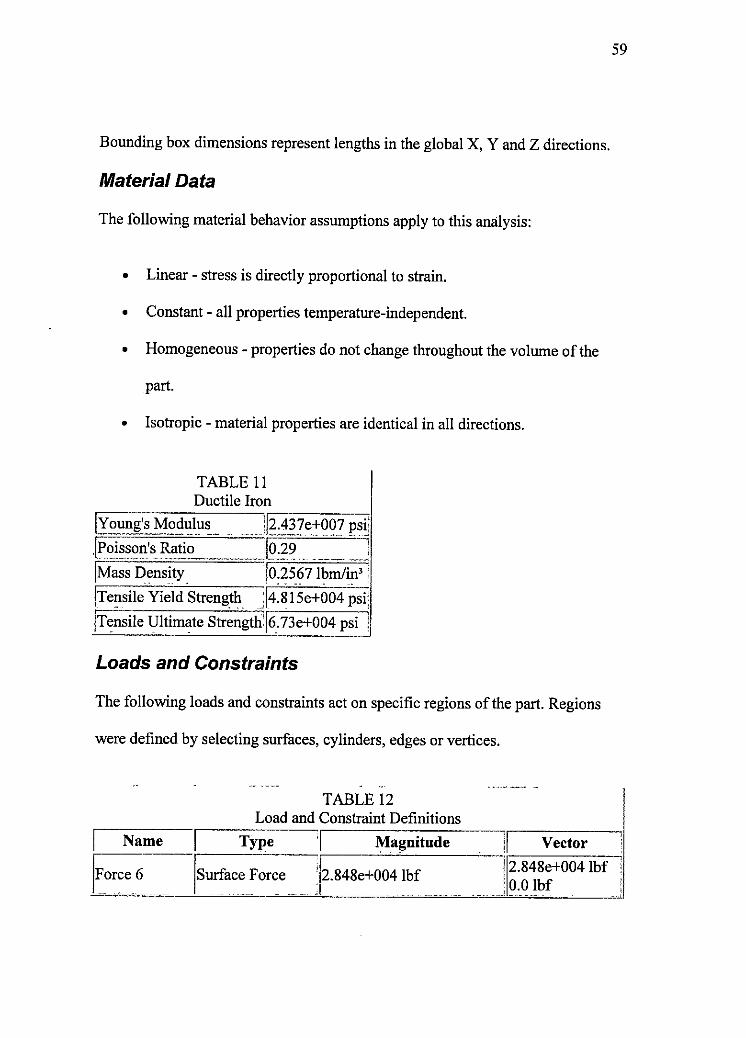
Bounding box dimensions represent lengths in the global X, Y and Z directions.
Material Data
The following material behavior assumptions apply to this analysis:
• Linear - stress is directly proportional to strain.
• Constant - all properties temperature-independent.
• Homogeneous - properties do not change throughout the volume of the
part.
• Isotropic - material properties are identical in all directions.
TABLE 11 Ductile Iron
IYoung'.s J'v.l?d~lu~- .. . •. Jl?,:~,3-?e_+007 psij
[P_oiss?~'~Ratio ___ .•• :@:.?9. ... _____ _j
!Mass Density I0:25_67 lbm/in' •
!Te~sile Yield Strength ; 4.815e+004 psi!
!Tensile Ultimate Strengthl6_.73e+004 psi
Loads and Constraints
The following loads and constraints act on specific regions of the part. Regions
were defined by selecting surfaces, cylinders, edges or vertices.
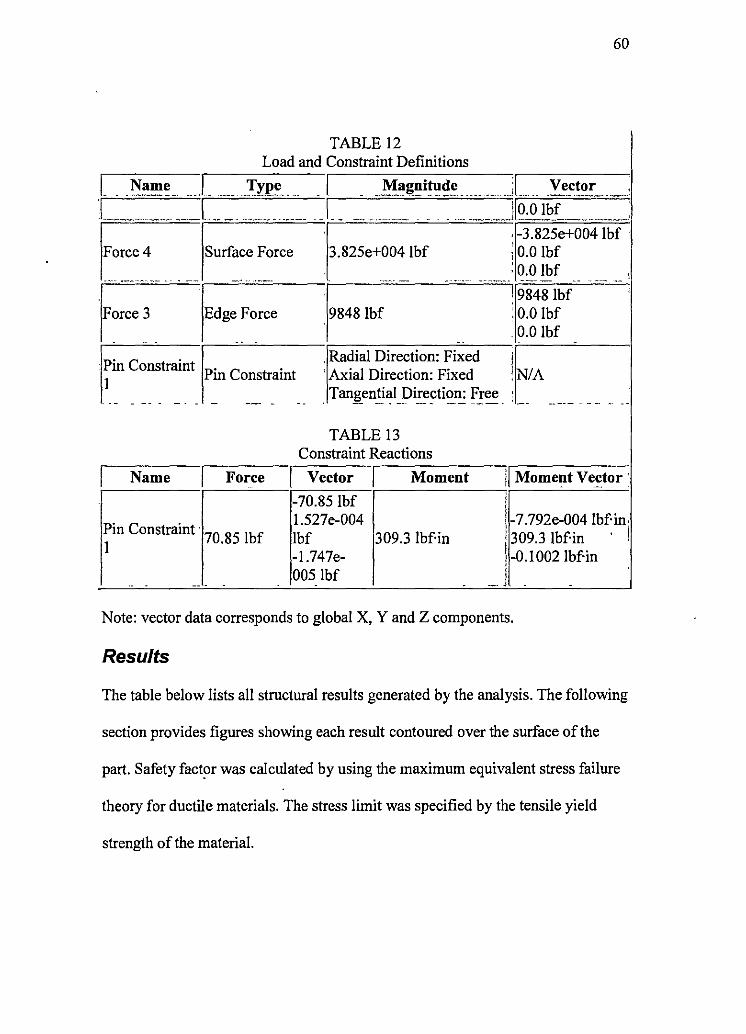
TABLE 12 Load and Constraint Definitions
,--N-a_m_e __ r ___ T_y_p_e ___ l Ma!lnitude II Vector
59
IForce,6~~---''-sur_. _fa_c~e_F_o_rc_e=----·~:i2_.s_4=8-e+_o=o_4_1b_f _____ ~°""'""'~-=:~=1b=8
~=+=o=o4 __
1b=f~"'
60
TABLE12 Load and Constraint Definitions
I Name _J_ ---- Type -I Magnitude_··--· ,, •. J Vector - __ ,. __ --- -- - - --··· ---· ~----" ! _____________ - L __ I 0.0 !bf ,_,I
IF=• . '""""-~"~ - - - - ---- ••>''*"•-~- .. . --- ·- ·-- --··---
3.825e+004 !bf ; -3.825e+004 lbf 1 0.0 !bf : 0.0 !bf
' ·-·" -- -.•... .,. - ,.._ ___ -·· - .. .. -·- """
F 19848 lbf
19848lbf Edge Force '. 0.0 !bf
. 0.0 !bf •.. -
Pin Constraint , Radial Direction: Fixed
IN/A Pin Constraint ' Axial Direction: Fixed I
Tangential Direction: Free. . - - -- - - . - - -- - - . --· ----- . - - -· --
TABLE 13 Constraint Reactions
I Name I Force I Vector I Moment ii Moment Vector:
-70.85 lbf '
Pin Constraint l.527e-004 I -7.792e-004 lbf-in,
70.85 lbf !bf 309.3 lbf·in 309.3 lbf·in · ! 1
-1.747e- j -0.1002 lbf·in 005 !bf
.. -· . . .
Note: vector data corresponds to global X, Y and Z components.
Results
The table below lists all structural results generated by the analysis. The following
section provides figures showing each result contoured over the surface of the
part. Safety fact~r was calculated by using the maximum equivalent stress failure
theory for ductile materials. The stress limit was specified by the tensile yield
strength of the material.
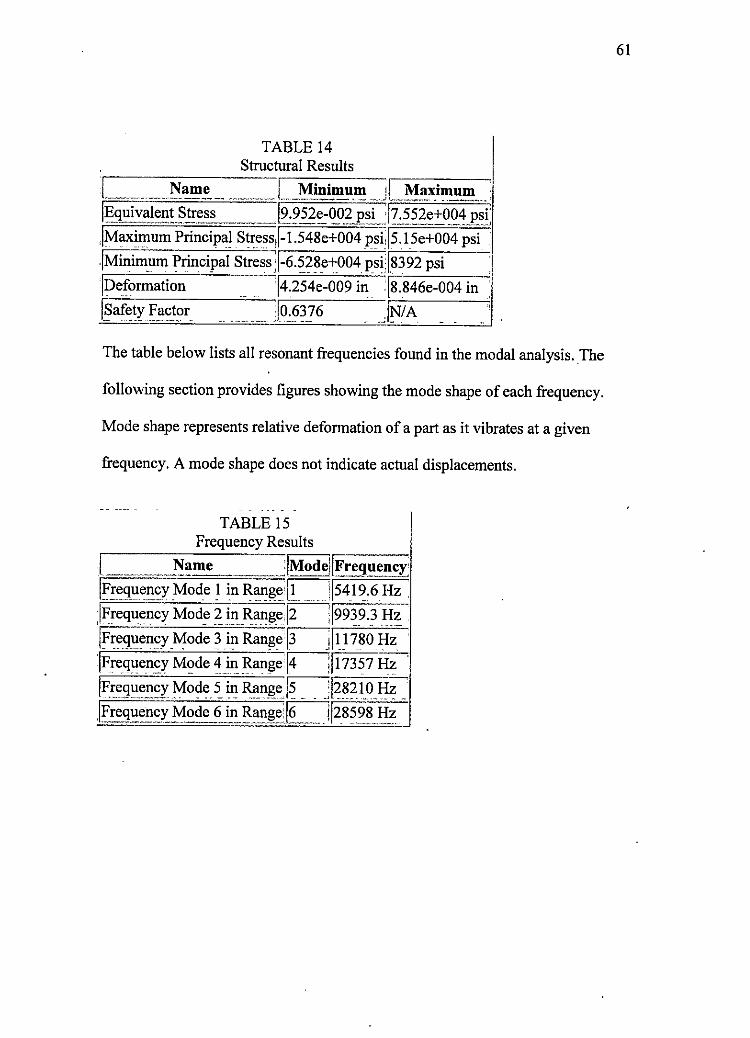
TABLE14 Structural Results
L Nam! ... _____ L Minimu_m_ . [_ M_a._x_illlum __
!Equivalent S!:ess l9-252e-~_Q_2 psiJ7.552e+004 p_si'.
,IMaxinmm Principal Stress}l.548e+004 psi,l5.15e+004 psi
,IMinim_um Principal Stress ;l-6-~28,e-+:004 !)siJ8392 psi
!Deformation !4254e-009 in !S.846e-004 in
!~aft:t~X_ii,ct?r_ __ _______ il0_~6~_?6 _ J!'J! A
The table below lists all resonant frequencies found in the modal analysis. _The
following section provides figures showing the mode shape of each frequency.
Mode shape represents relative deformation of a part as it vibrates at a given
frequency. A mode shape does not indicate actual displacements.
-- --~ TABLE 15
Frequency Results
[ Name !Modei1Fr_eq!le11cr
l~reque11:y _Mode! in R<J?.!l~!! j5419.6Hz
:!Frequency Mod,e ~ inllange [27[99~9.3 H~
IFrequency_Mode ~ in Ran1ie'37jI_I 780.Hz
IFreqllency M?de 4i11llange'4"7l17357 Hz
!Frt:9llt:_ll:X .1.f ode 5_ in ~n!le ,~ _ _ _:j~~~ l_OJ:Iz _
!Frequen:y Mode 6 in Range EJj28598_H~
61
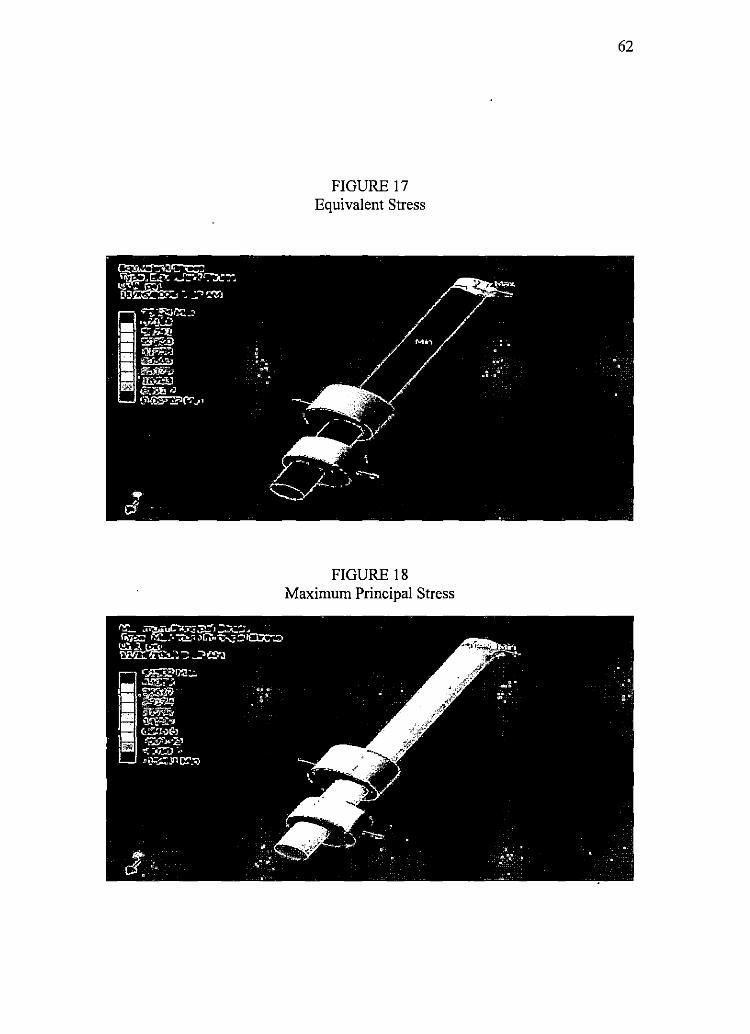
FIGURE 17 Equivalent Stress
FIGURE 18 Maximum Principal Stress
62
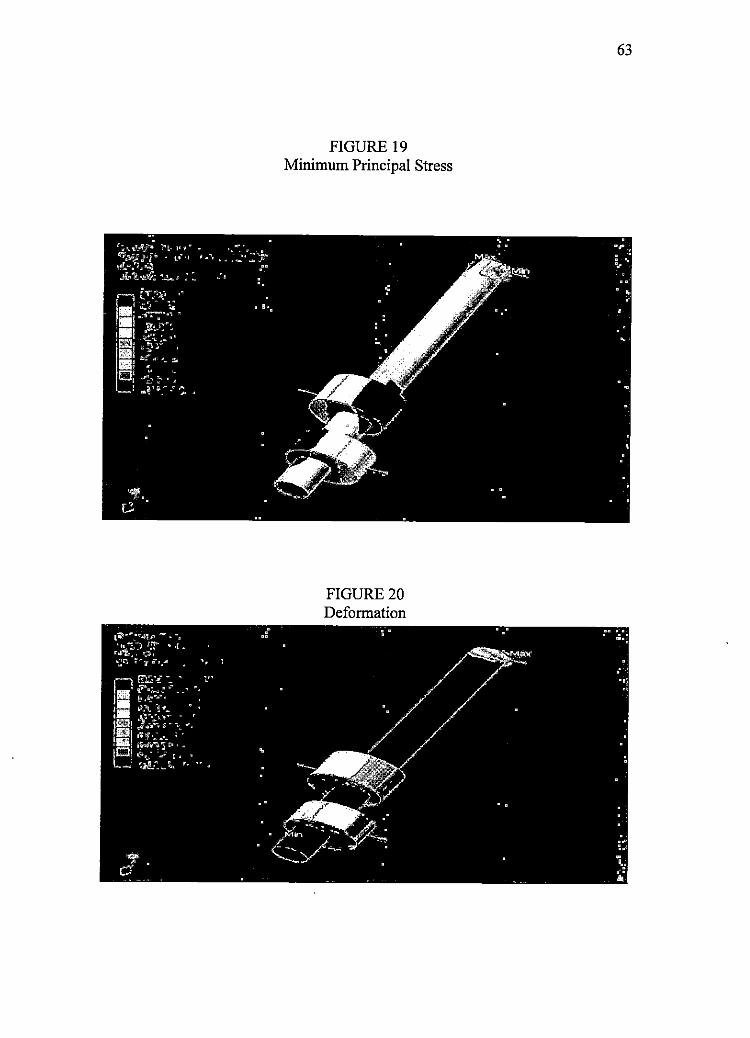
FIGURE 19 Minimum Principal Stress
FIGURE20 Deformation
63
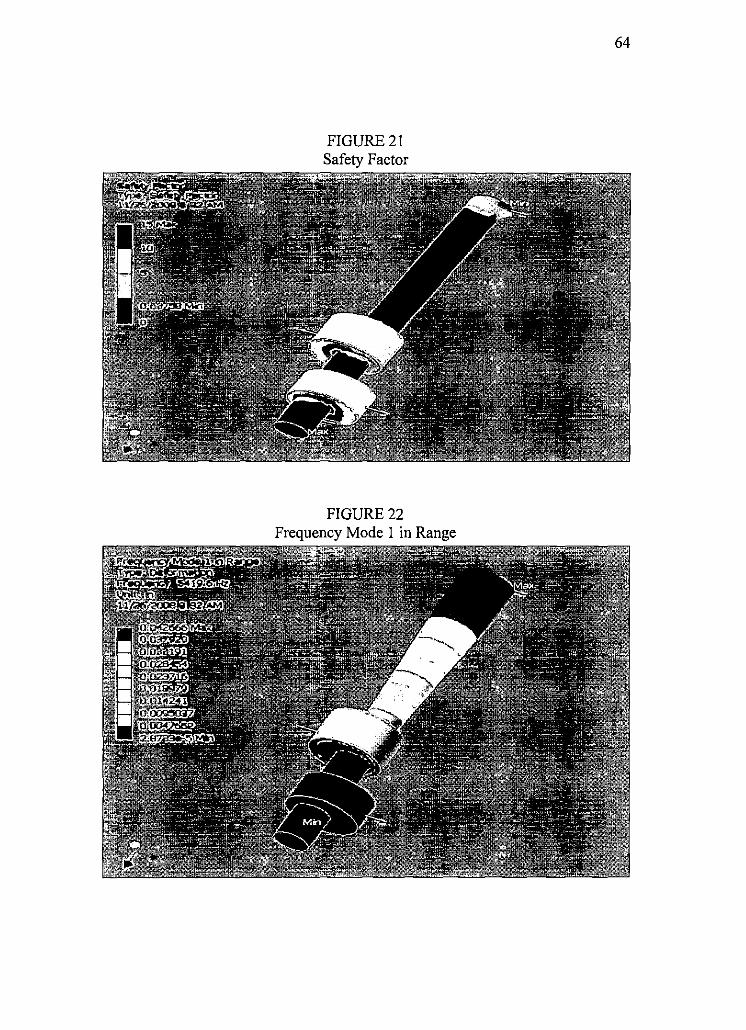
FIGURE21 Safety Factor
FIGURE22 Frequency Mode I in Range
64
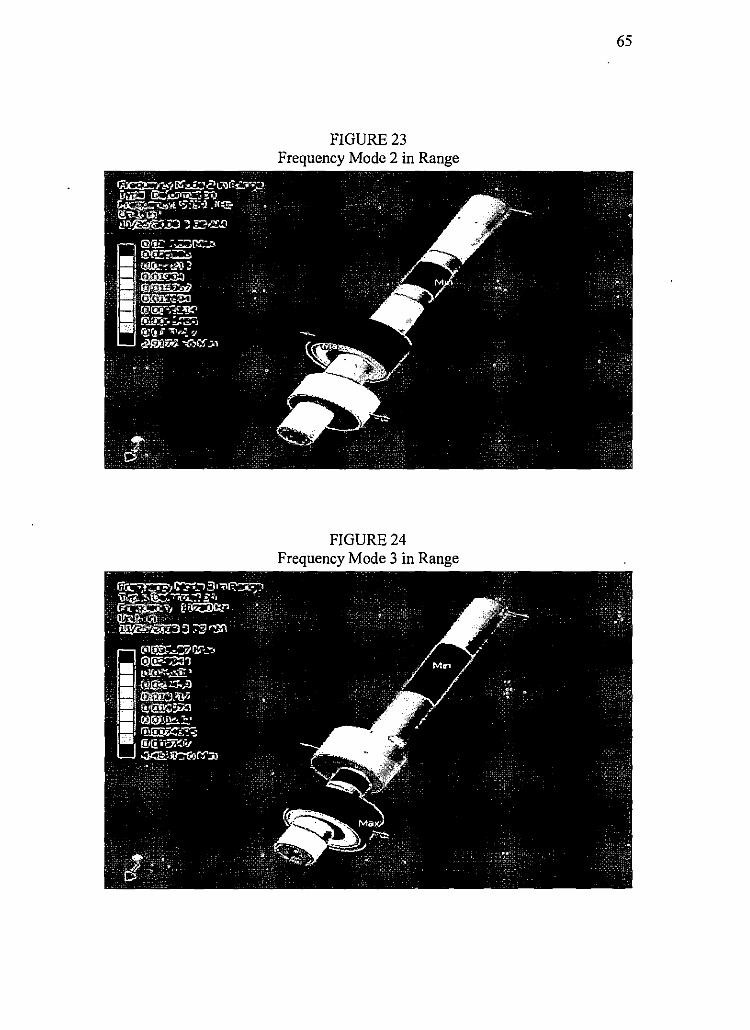
FIGURE23 Frequency Mode 2 in Range
FIGURE24 Frequency Mode 3 in Range
65
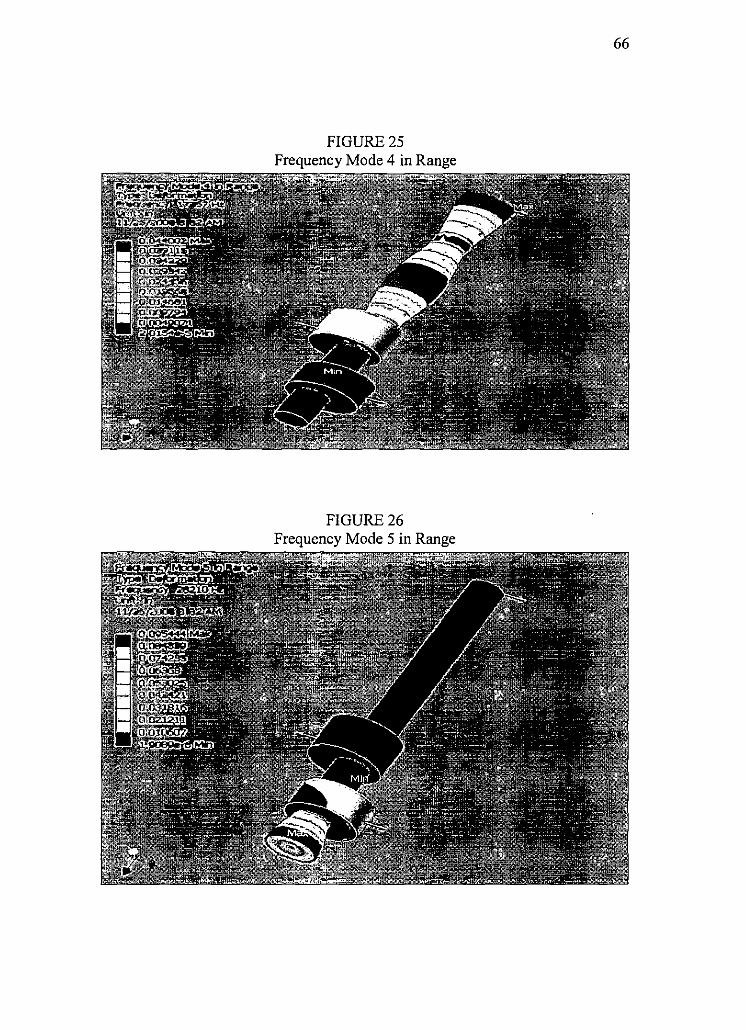
FIGURE25 Frequency Mode 4 in Range
FIGURE26 Frequency Mode 5 in Range
66
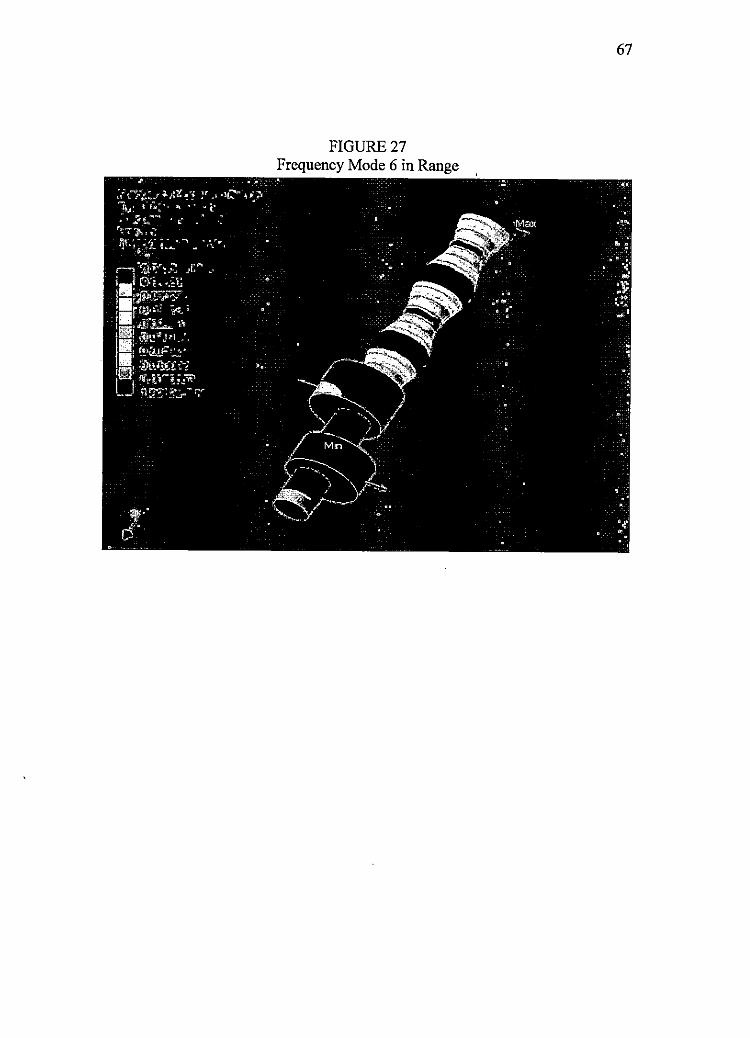
FIGURE27 Frequency Mode 6 in Range
67
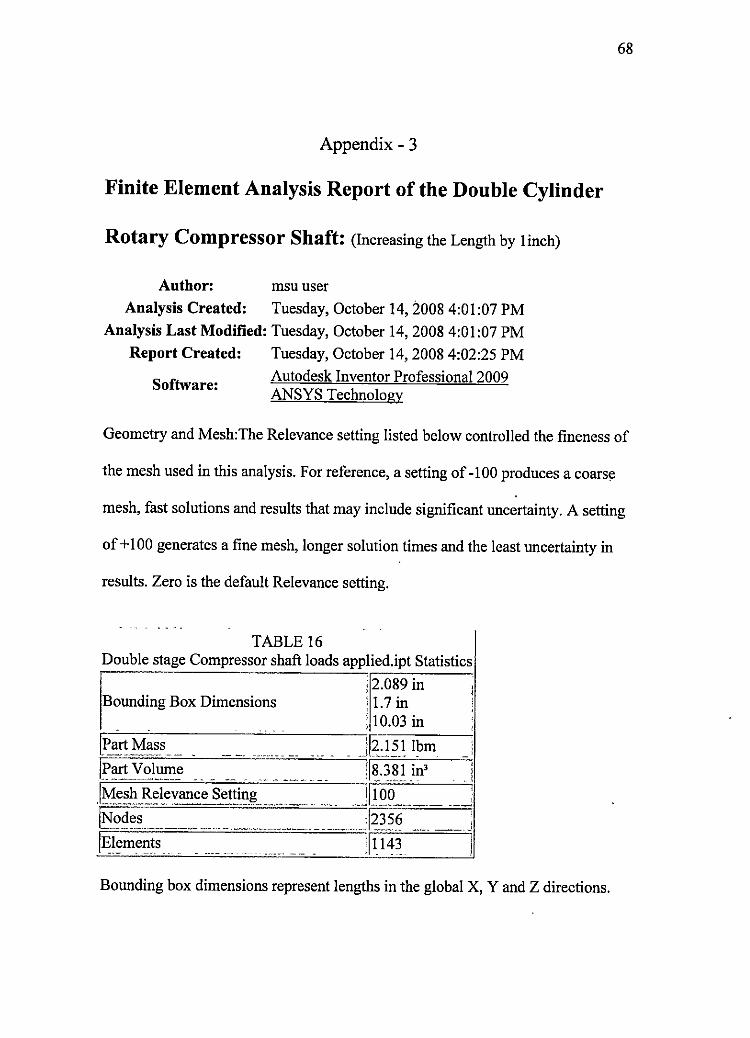
Appendix - 3
Finite Element Analysis Report of the Double Cylinder
Rotary Compressor Shaft: (Increasing the Length by 1inch)
Author: msu user
Analysis Created: Tuesday, October 14, 2008 4:01:07 PM
Analysis Last Modified: Tuesday, October 14, 2008 4:01 :07 PM
Report Created: Tuesday, October 14, 2008 4:02:25 PM
Software: Autodesk Inventor Professional 2009 ANSYS Technology
68
Geometry and Mesh:The Relevance setting listed below controlled the fineness of
the mesh used in this analysis. For reference, a setting of -100 produces a coarse
mesh, fast solutions and results that may include significant uncertainty. A setting
of+ I 00 generates a fine mesh, longer solution times and the least uncertainty in
results. Zero is the default Relevance setting.
- - - -
TABLE16 Double stage Compressor shaft loads applied.ipt Statistics
Bounding Box Dimensions
/Part Mass - - -· ·- - -- -· . ·------- - ·-- - -- - .
!Part Volume
/Nodes
/~lements
12.089 in ! 1.7 in : 10.03 in
l 2.151 lbm . .J ..•.• ·• . .
_J/100
,2356
!II 143
' ' ! ' f
i -' . !
Bounding box dimensions represent lengths in the global X, Y and Z directions.
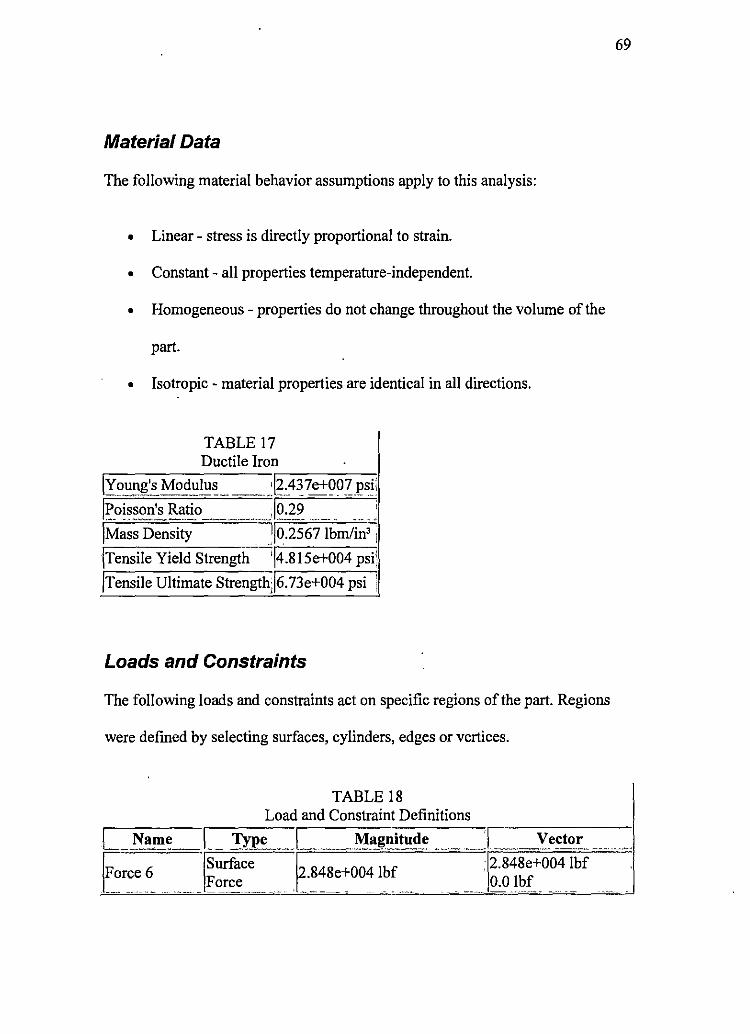
Material Data
The following material behavior assumptions apply to this analysis:
• Linear - stress is directly proportional to strain.
• Constant - all properties temperature-independent.
• Homogeneous - properties do not change throughout the volume of the
part.
• Isotropic - material properties are identical in all directions.
TABLE 17 Ductile Iron
!Young's Modulus ,12.437e+007 psi:
,~_~i~i~~:_s_ Ratio - . ____ ,.Jo.29 ... __ - :~. _-_,
!Mass Density J0.2567 Ihm/in' :
!Tensile Yield Strength '/4.8 l 5e+004 psi!
/Tensile Ultimate StrengthJ6. 73e+004 psi !
Loads and Constraints
The following loads and constraints act on specific regions of the part. Regions
were defined by selecting surfaces, cylinders, edges or vertices.
TABLE 18 Load and Constraint Definitions
Name Magnitude Vector
69
L I_ Type I ---· J_ ·-· ""- - ·---- -·--~~--"
l:or~e6 ____ Surface
l2--~48e+004 !bf _ -2.848e+004 !bf
Force 0.0 !bf ·- - - -- - . . . ----- -
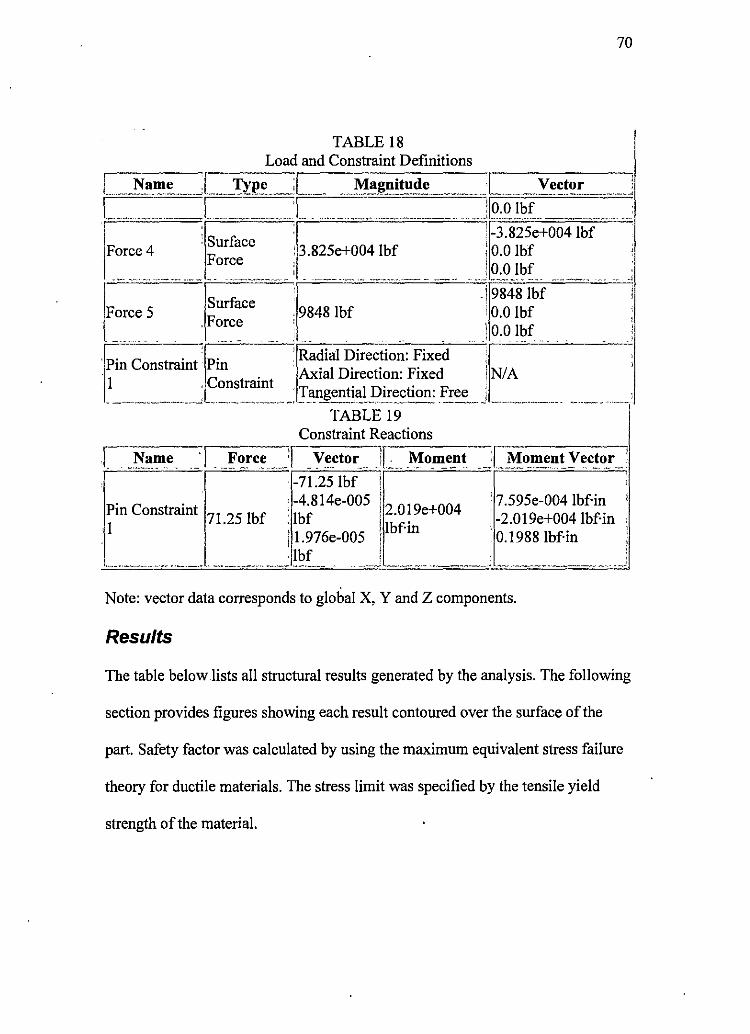
TABLE 18 Load and Constraint Definitions
Constraint Reactions
Force __ J V~_ctor _ _ Ii.: _l\:1o~ent
Pin Constraint 71.25 !bf I
· -71.25 lbf
, -4.814e-005 2.019e+004 : !bf i l.976e-005 !bf
!bf-in
70
! 7.595e-004 lbf·in -2.019e+004 lbf·in , 0.1988 lbf·in :
Note: vector data corresponds to global X, Y and Z components.
Results
The table below lists all structural results generated by the analysis. The following
section provides figures showing each result contoured over the surface of the
part. Safety factor was calculated by using the maximum equivalent stress failure
theory for ductile materials. The stress limit was specified by the tensile yield
strength of the material.
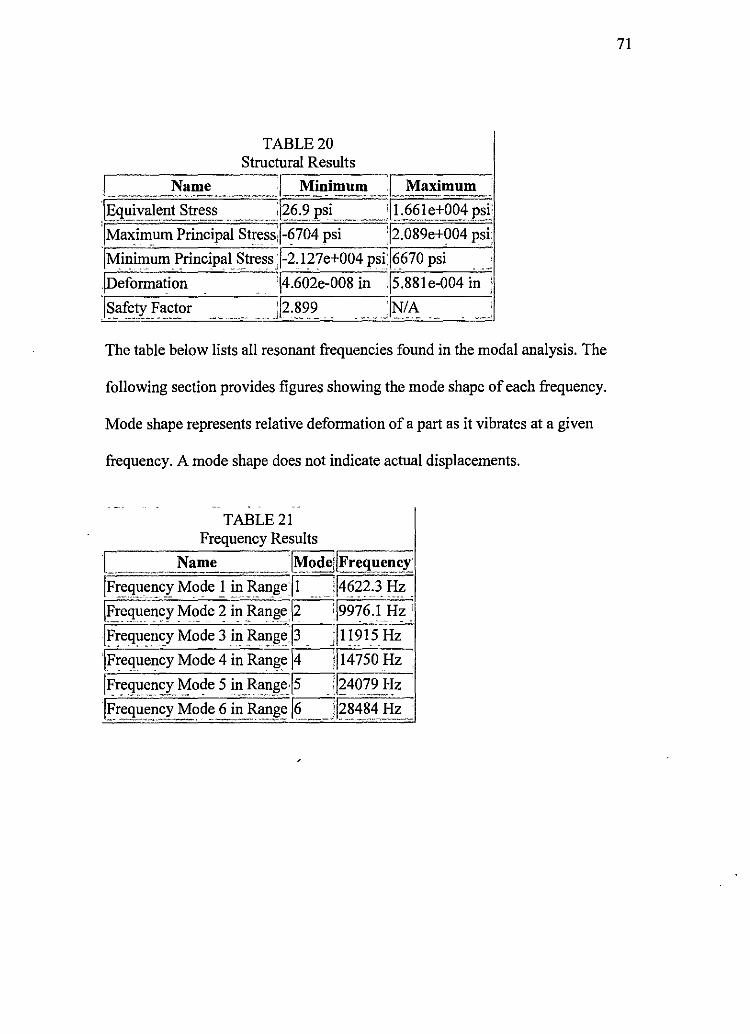
TABLE20 Structural Results
L~--. --_-N-_a-__ m-e---... -J M_~i°.1.~1.11- I Maximum _
l§quivalent St.i:ess .. _ ;[?6,9psi___ .... j1.66le+oo.~P.si;
'fMaximum Principal Stress:l-6704 psi :12.089e+004psi:
!Minimum Principal Stress f-2.127e+004 psi;l6670 psi
.,D~fo~ati~~ .. - - ·j4.602e-008 in j5.881e-004 in
f~!11'ety_~~~tor ... . .. _ Jl2.~,_9_~ _ . -·. JN!,\ ...
The table below lists all resonant frequencies found in the modal analysis. The
following section provides figures showing the mode shape of each frequency.
Mode shape represents relative deformation of a part as it vibrates at a given
frequency. A mode shape does not indicate actual displacements.
TABLE21 Frequency Results
[ . Name _ _ ~!Fr:e9ue~cr
JF~t:9uellCX Mode I ~ _R_ange !1 ····-· il4~22.3_ Hz .
JFre9uenc~ Mode 2 in Ran!le j2"':j9976JH~ .•
Jy~eq11~ncy Mode 3 i11 Rai.iii: !3Jjl 1215 Hz
jFre(juency Mode 4 in Range ~l!14750Hz
J~re(j11e_ncY, f\Jode 5 ill_Range_,is-:-r\240_7.2. Hz
l!':r:qu~~~x Mod: 6 in ll~~_!l: LJl?_~4~~!:I_z I
71
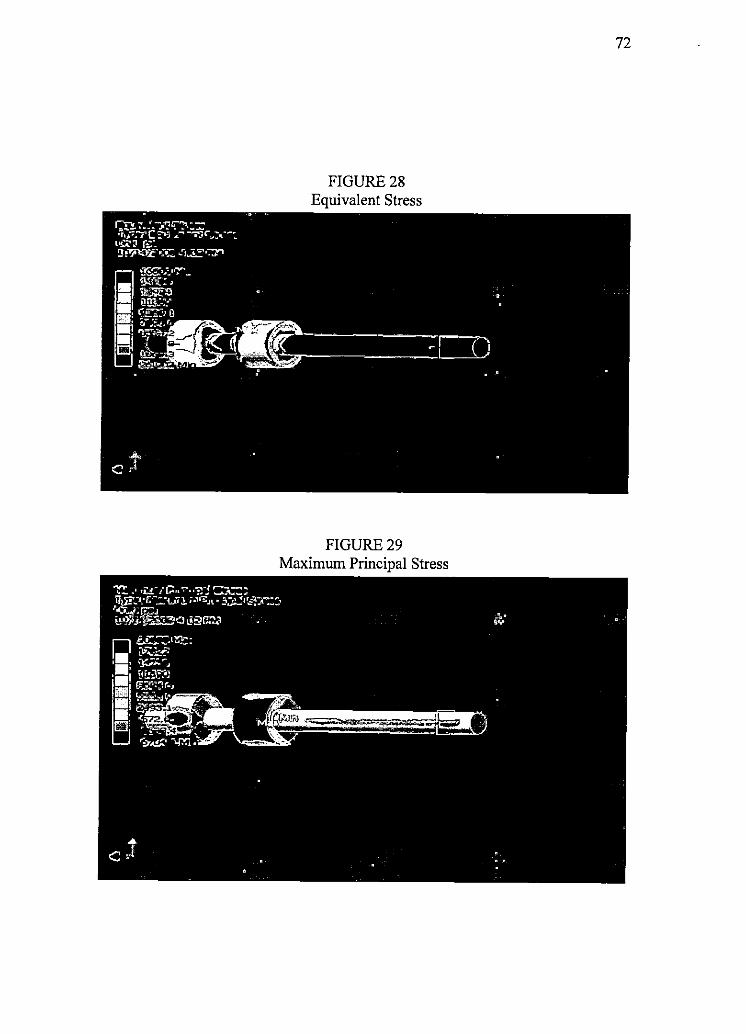
FIGURE28 Equivalent Stress
FIGURE29 Maximum Principal Stress
72
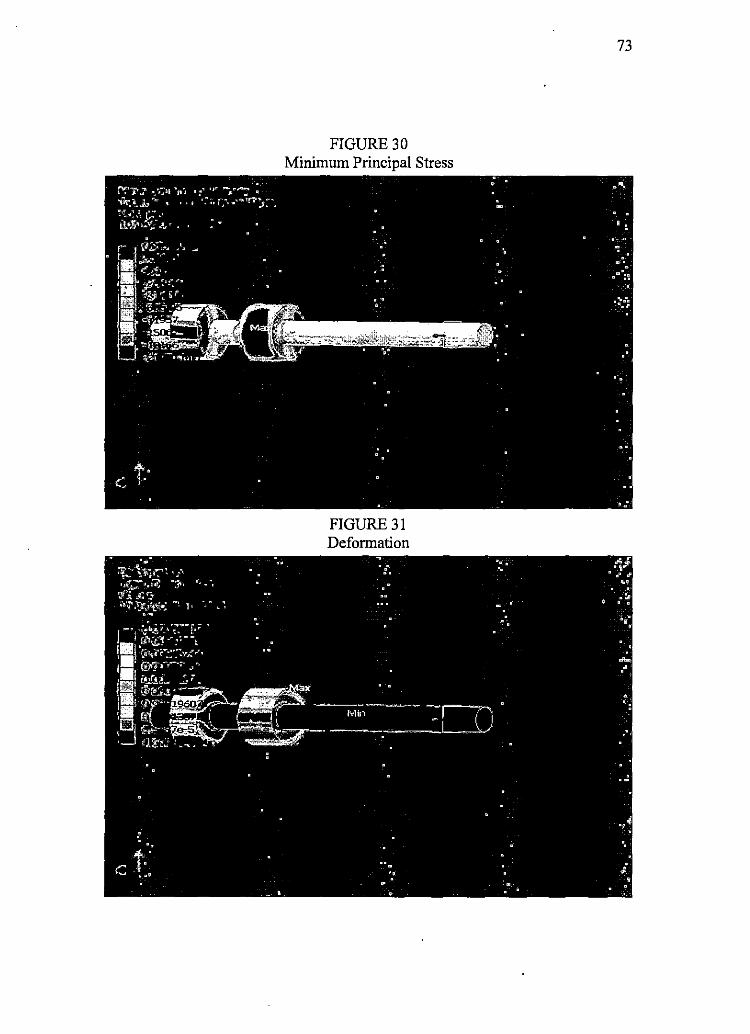
FIGURE30 Minimum Principal Stress
FIGURE31 Deformation
73
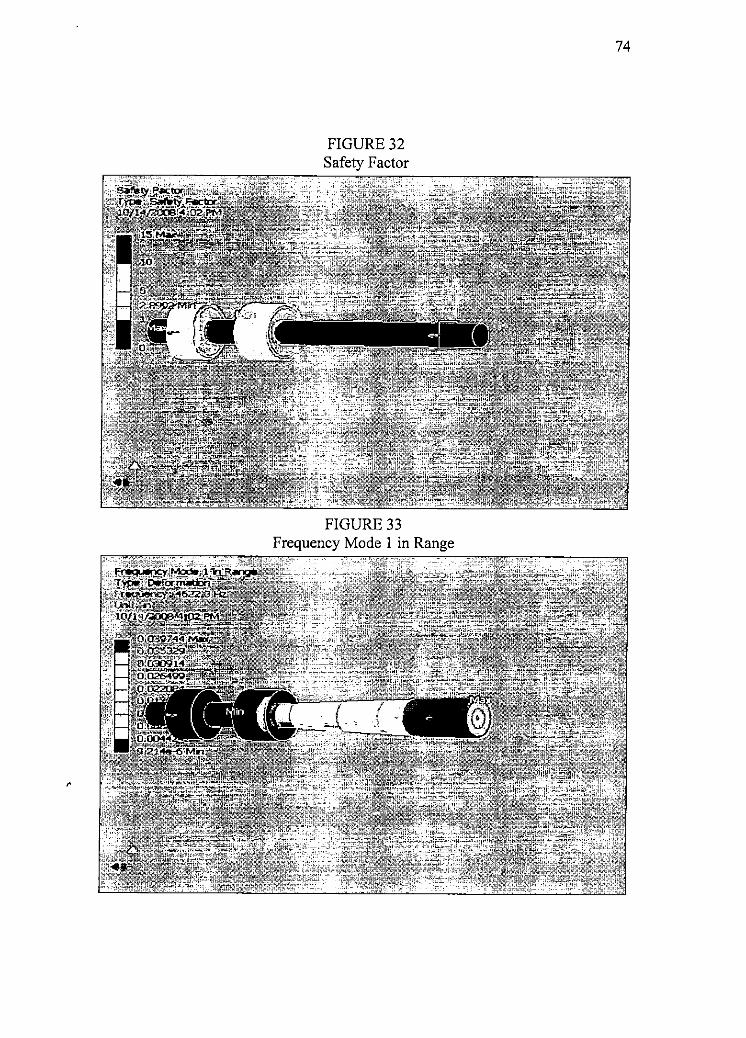
FIGURE32 Safety Factor
FIGURE33 Frequency Mode 1 in Range
74
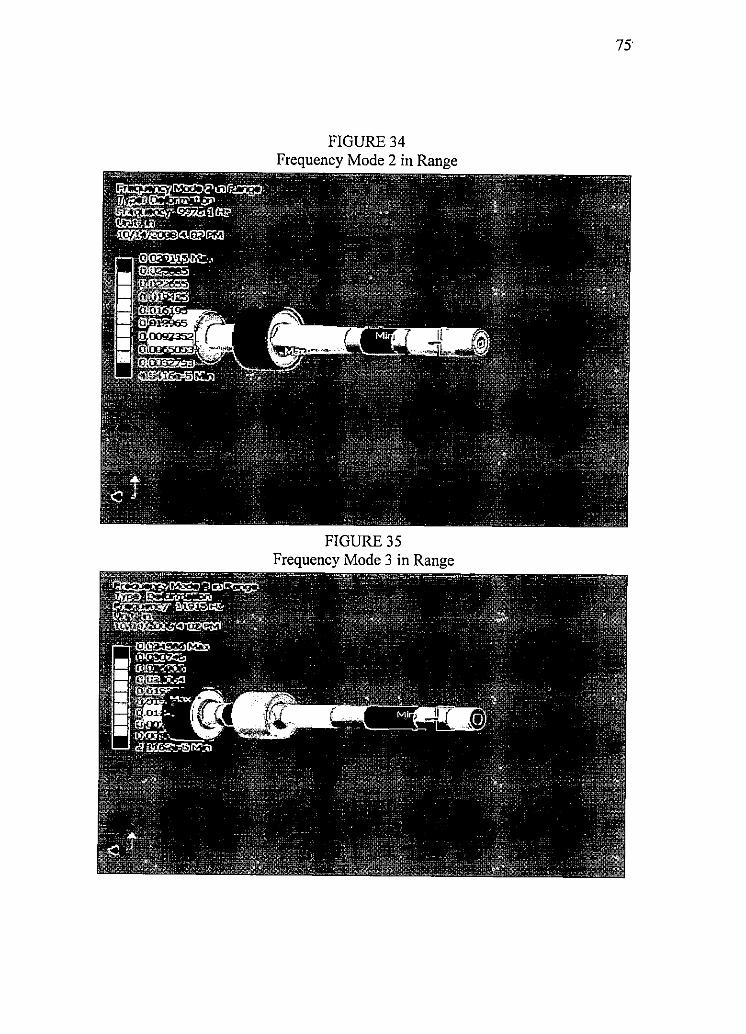
FIGURE34 Frequency Mode 2 in Range
FIGURE35 Frequency Mode 3 in Range
75
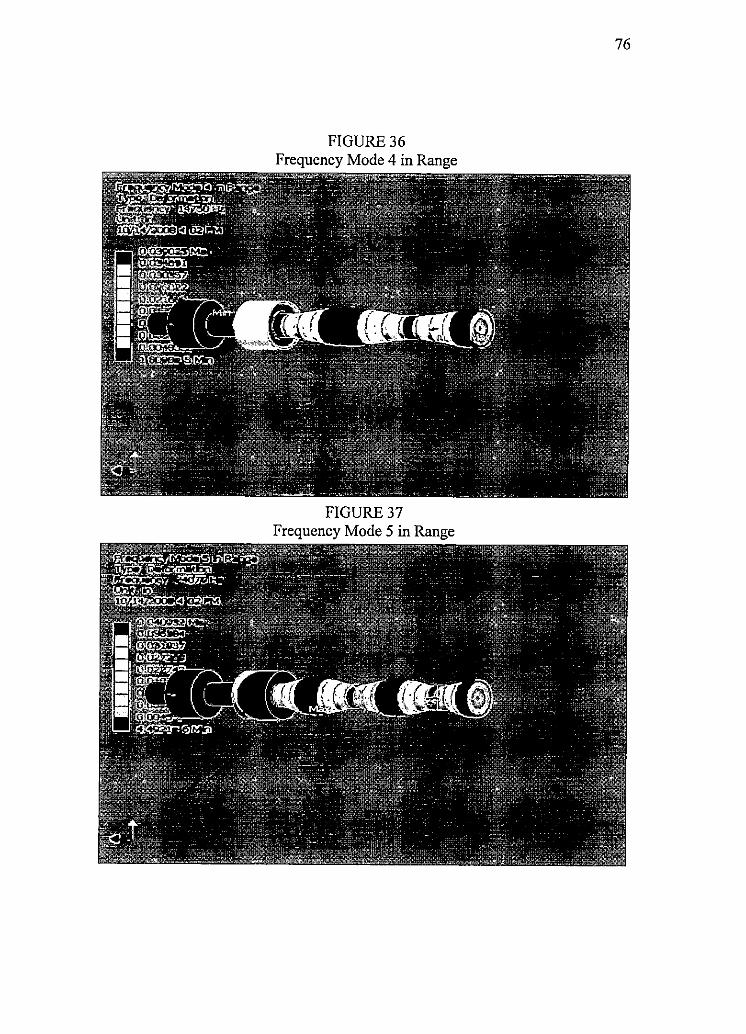
FIGURE36 Frequency Mode 4 in Range
FIGURE37 Frequency Mode 5 in Range
76
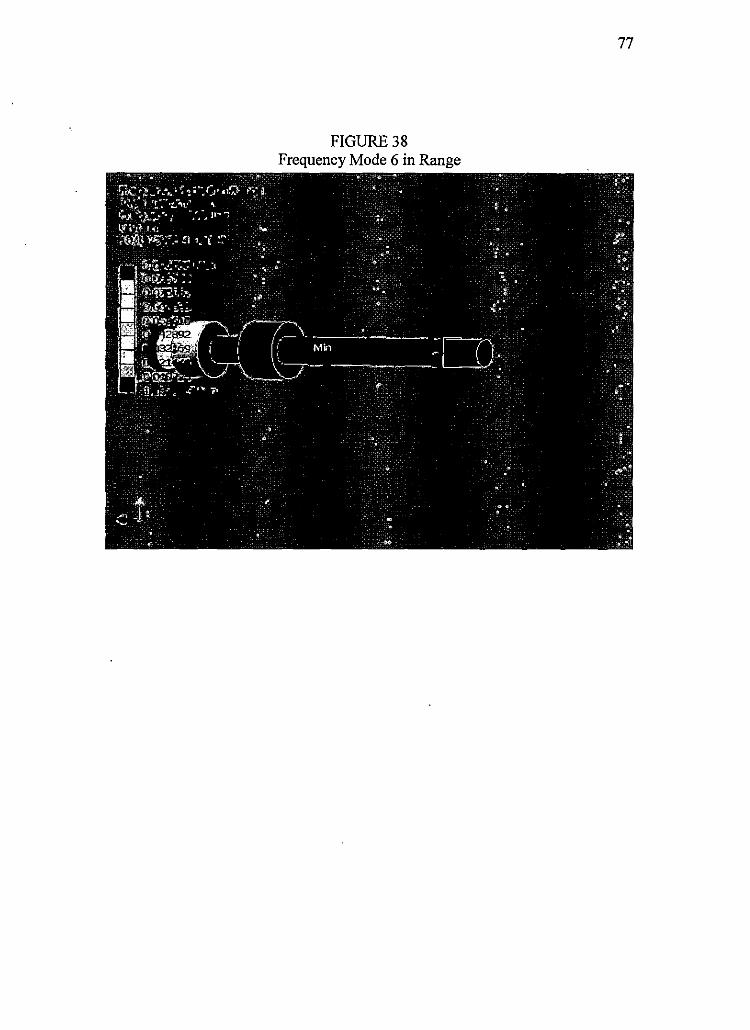
FIGURE38 Frequency Mode 6 in Range
77
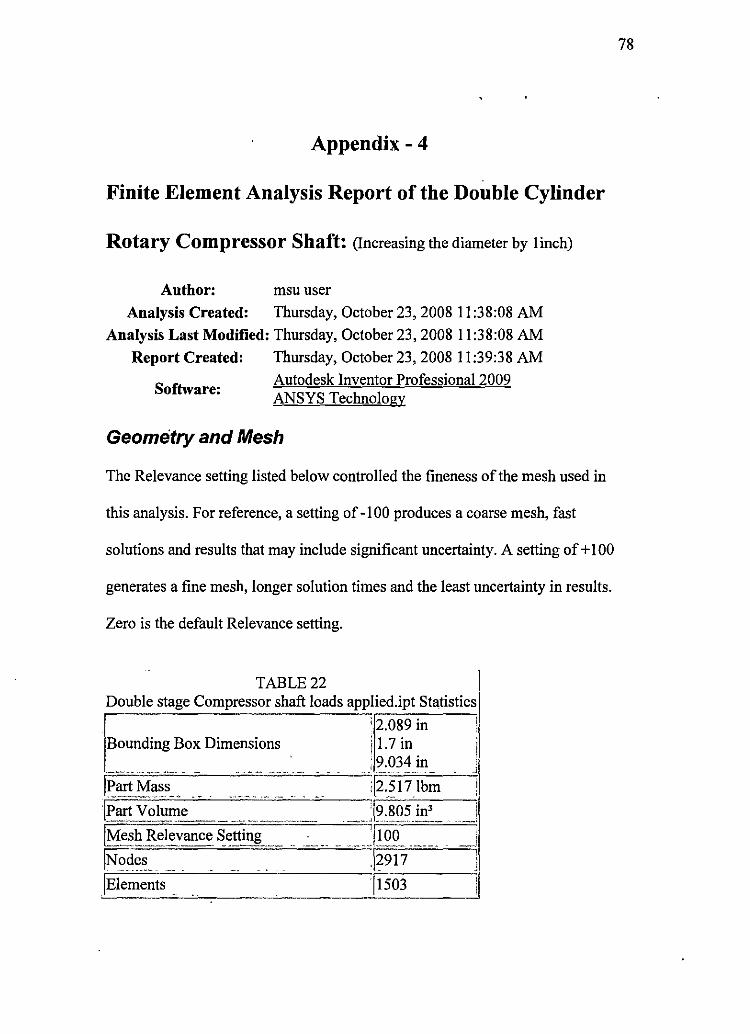
Appendix- 4
Finite Element Analysis Report of the Double Cylinder
Rotary Compressor Shaft: (Increasing the diameter by 1inch)
Author: msu user
Analysis Created: Thursday, October 23, 2008 11 :38:08 AM
Analysis Last Modified: Thursday, October 23, 2008 11 :38:08 AM
Report Created: Thursday, October 23, 2008 11:39:38 AM
Software: Autodesk Inventor Professional 2009 ANSYS Technology
Geometry and Mesh
The Relevance setting listed below controlled the fineness of the mesh used in
this analysis. For reference, a setting of -100 produces a coarse mesh, fast
solutions and results that may include significant uncertainty. A setting of+ 100
generates a fine mesh, longer solution times and the least uncertainty in results.
Zero is the default Relevance setting.
TABLE22 Double stage Compressor shaft loads applied.ipt Statistics
: 2.089 in :
Bounding Box Dimensions i 1.7 in I '-- ·-- - .. - - - ~~ w• - -• .. : 9.034 in
J
j~art _Ma~s __ . . "'' ____ -- ·- .. .. ·,12_i17-lb~ !
jPart Volm11_e 9.805 in3 i ·-- -~- ,_,.
-~.1 ·--··~-""'- _l
[Me~h Relevance ~~tting ___ -- -- - --~ J100_ --- j
jNo~~~ ,j2917 ' : . . .. .. J
!Elements !1so3 ' .. I
78
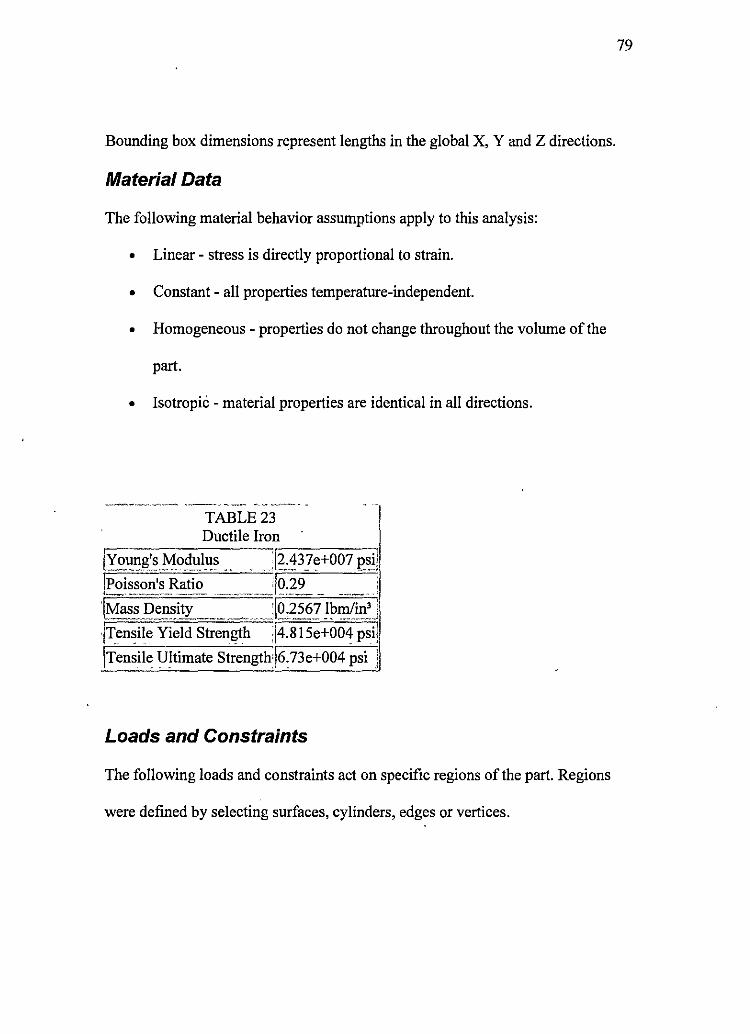
Bounding box dimensions represent lengths in the global X, Y and Z directions.
Material Data
The following material behavior assumptions apply to this analysis:
• Linear - stress is directly proportional to strain.
• Constant - all properties temperature-independent.
• Homogeneous - properties do not change throughout the volume of the
part.
• Isotropic - material properties are identical in all directions.
TABLE23 Ductile Iron
[Young'sModulus .. _ J?:~3Je+00712sij
jPoisson's Ratio _ _ _ J9:~9. [tviass Density____ ... _j0.2567 lbm/in'J
jTensile Yield Strength j4.815e+004 psiJ
\Tensile UJtimate Strength:\6:73e+004 psi !
Loads and Constraints
The following loads and constraints act on specific regions of the part. Regions
were defined by selecting surfaces, cylinders, edges or vertices.
79
80
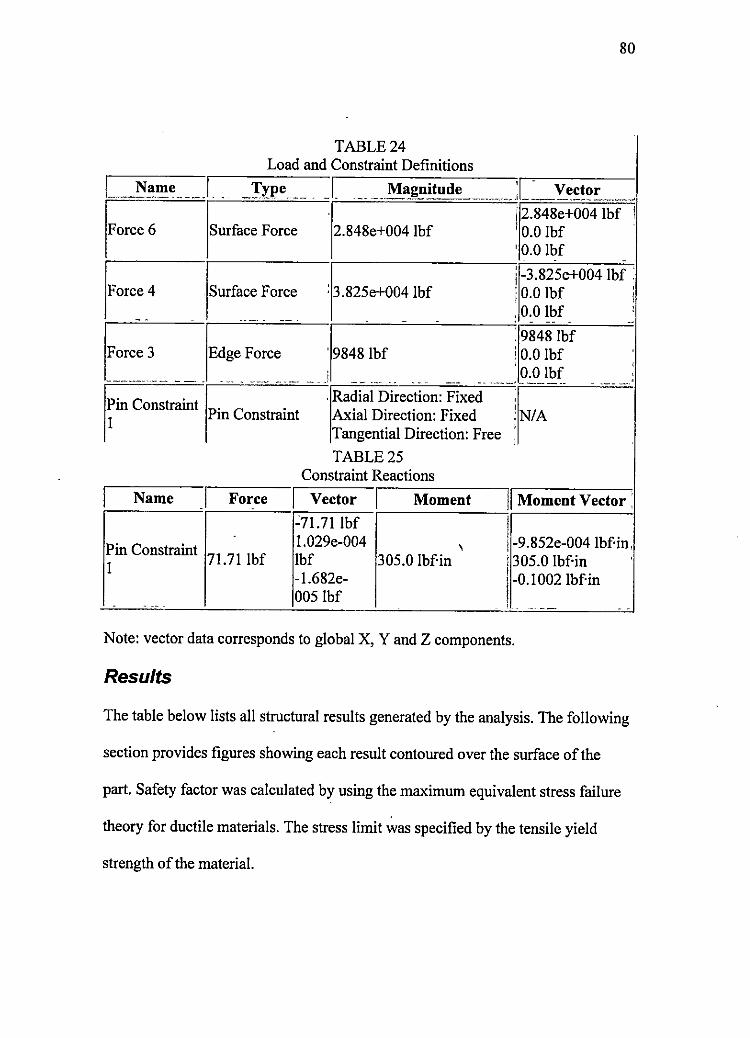
TABLE24 Load and Constraint Definitions
I Type ' -
Vector Name ____ _./ __ F Surface Force
J -- ·-··· M_a_gnitude ., __ . .I
, ..... ~--,,,., [ 2.848e+004 !bf I
/
2.848e+004 !bf '0.0 !bf '0.0 !bf
.
/Fore~ .4 . Surface Fo~c-e : 3.825e+004 lbf i -3.825e+004 lbf • : 0.0 !bf i . 0.0 !bf :
1~0~~~3- _ . Ed~e-F~~c:
. . .. ,
;l984~ l~f.
:9848lbf i 0.0 !bf ' ' 0.0 !bf
. ·- - - """ --· "" ·---~'-- ------ . - . ·-Pin Constraint , Radial Direction: Fixed ' ' Pin Constraint Axial Direction: Fixed :NIA 1
Tangential Direction: Free '
TABLE25 Constraint Reactions
I Name . I Force I Vector I Moment j/ Moment Vector :
~71.71 lbf ' I
Pin Constraint 1.029e-004 \ l-9.852e-004 lbf·in,
1 71.71 lbf !bf 305.0 !bf-in 305.0 lbf·in -l.682e- -0.1002 lbf·in 005 lbf
.. -- ' ""
Note: vector data corresponds to global X, Y and Z components.
Results
The table below lists all structural results generated by the analysis. The following
section provides figures showing each result contoured over the surface of the
part. Safety factor was calculated by using the maximum equivalent stress failure
theory for ductile materials. The stress limit was specified by the tensile yield
strength of the material.
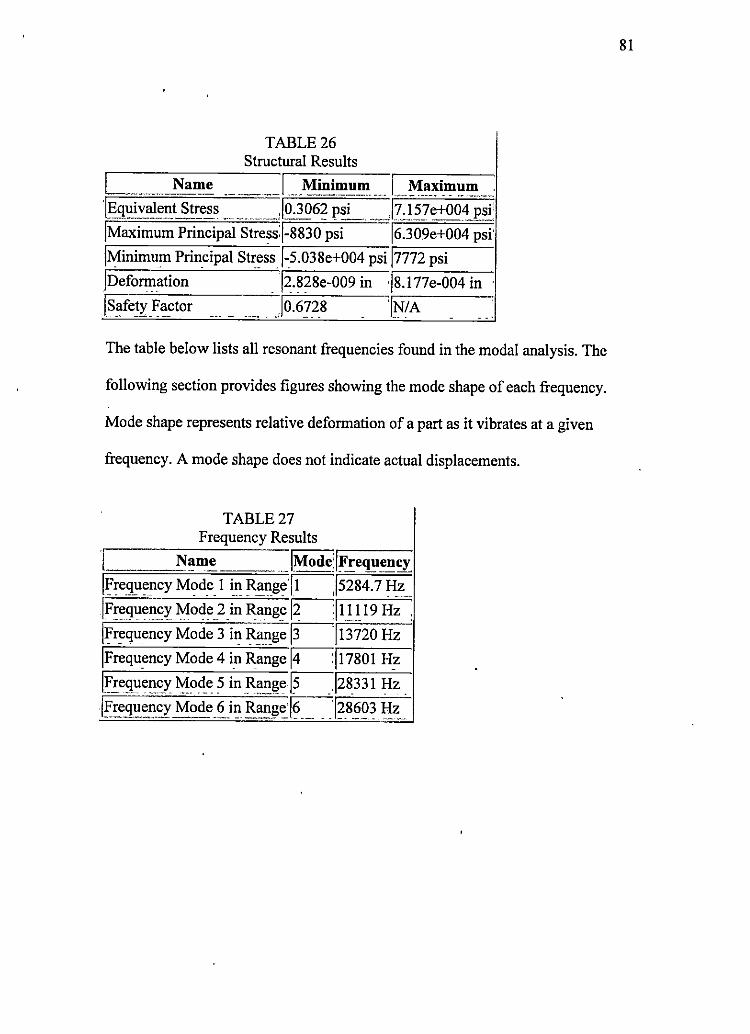
TABLE26 Structural Results
[ _ Name _ . J ...... Minimu~ . ..... I ~'.'-~i_m~~--: 'JEquivalent Stress .I0.3062 psi ,J7.157e+004 psi'
JMaximurn Principal Stress:l-8830 ~~i . ·--l6~309e+004~~i:
I
JMinimum Prin_cipal Stress J~5.038e+004 psi 17772 psi
/Deformation . l2,828e-009 in ·l8, l 77e-004 in
ls~ety_~~_ctor ___ _ _ .. .Jo.672_8 l~!A
The table below lists all resonant frequencies found in the modal analysis. The
following section provides figures showing the mode shape of each frequency.
Mode shape represents relative deformation of a part as it vibrates at a given
frequency. A mode shape does not indicate actual displacements.
TABLE27 Frequency Results
Name .. IMod~;IFrequ~ncy Ji;oregu:ncy Mode_ I ~Il Rallge ~J5284. 7 llz
JFr:guency Mode 2_in Rang_e ~Jlll 19 Hz
ji;or:quency Mode 3 in R~ge ~J13720 Hz
JFrequency Mode 4 i.n Range ~j 17801 H!
Jl_"regue!l<:)' ~o~e 5 in Rll:Ill,\e ~J28331 Hz .
J!':req~_t:_n.cy _Mode_ 6 _il_l R_an~e J~ ___ . /?_86Q3 Hz_.
81
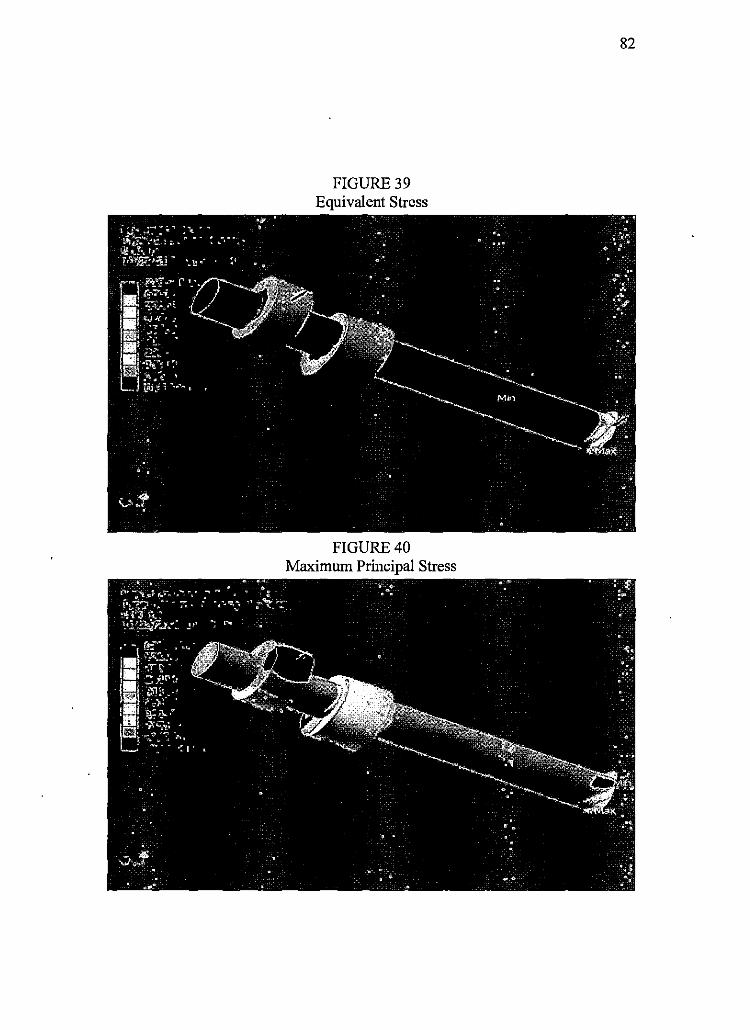
FIGURE39 Equivalent Stress
FIGURE40 Maximum Principal Stress
82
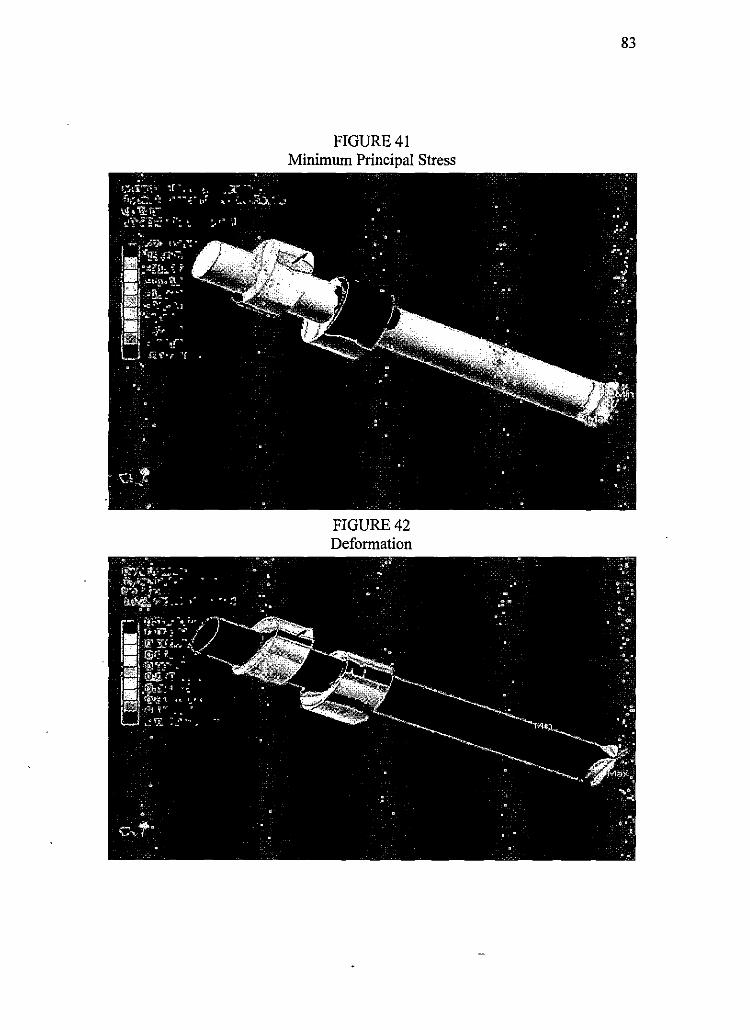
FIGURE41 Minimum Principal Stress
FIGURE42 Deformation
83
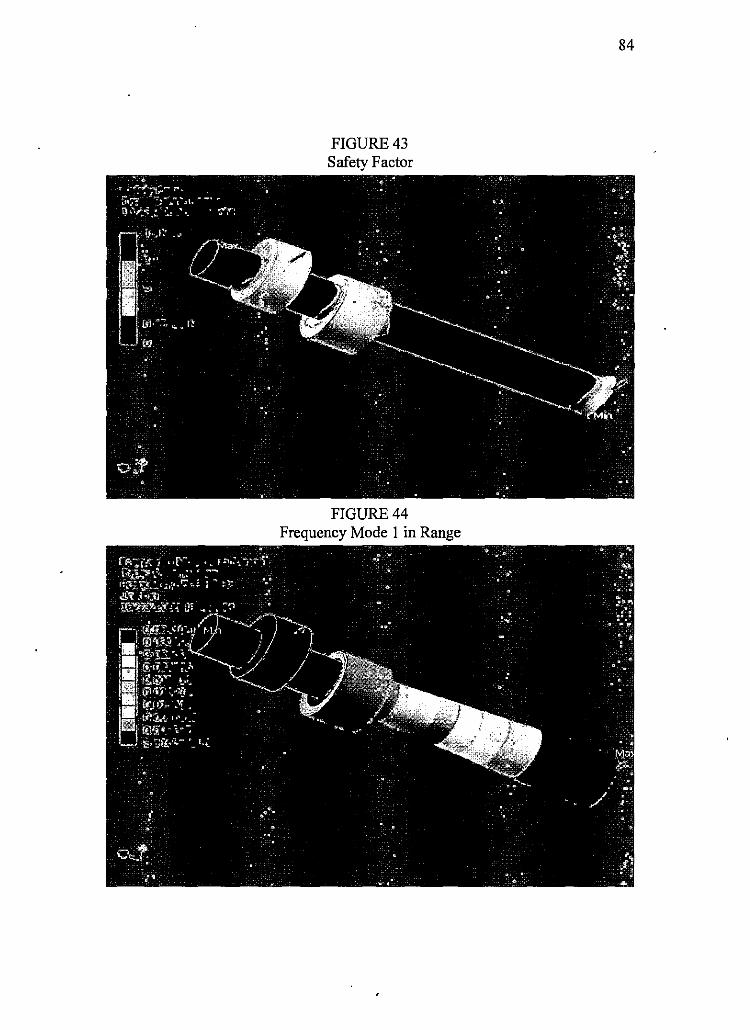
FIGURE43 Safety Factor
FIGURE44 Frequency Mode I in Range
84
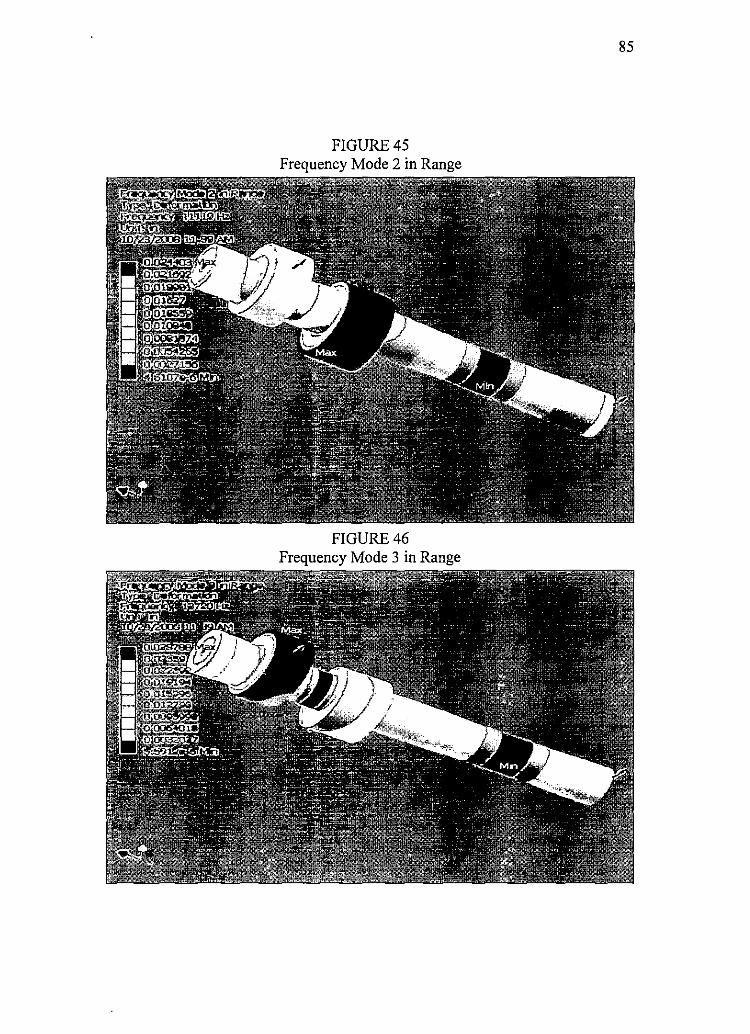
FIGURE45 Frequency Mode 2 in Range
FIGURE46 Frequency Mode 3 in Range
85
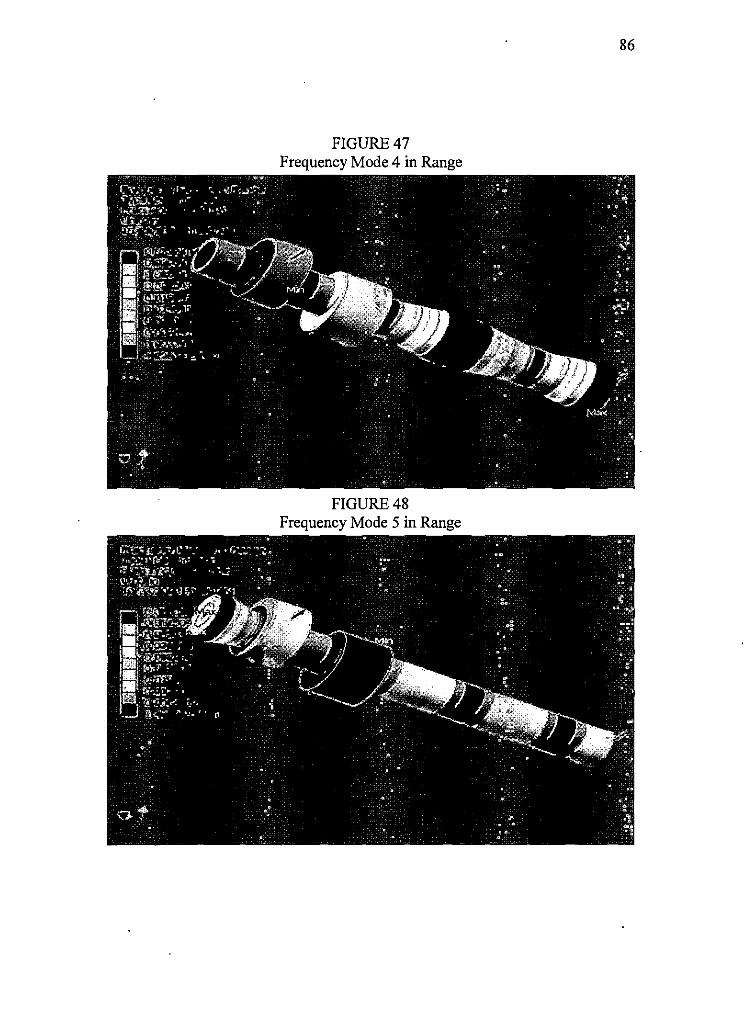
FIGURE47 Frequency Mode 4 in Range
FIGURE48 Frequency Mode 5 in Range
86
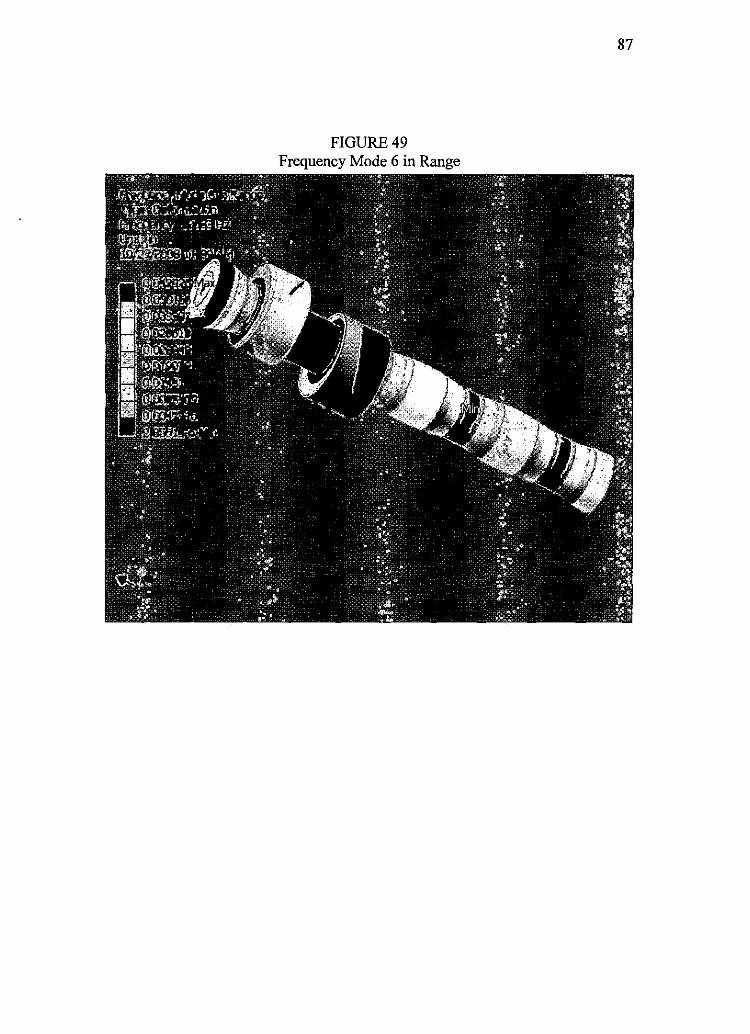
FIGURE49 Frequency Mode 6 in Range
87
88
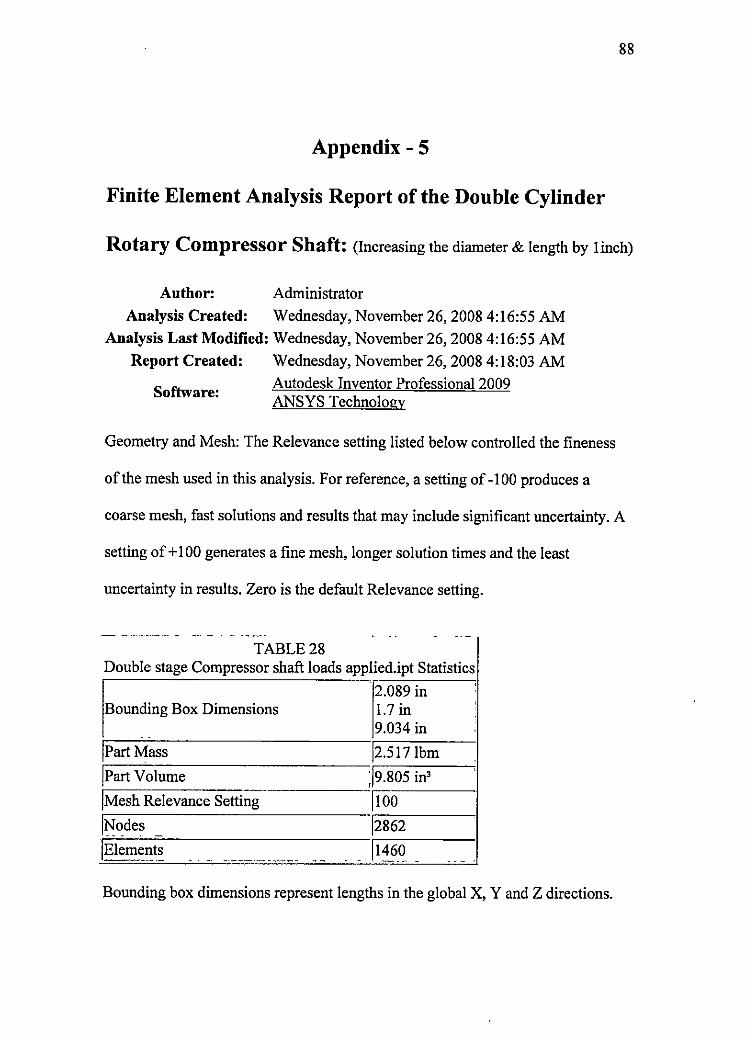
Appendix - 5
Finite Element Analysis Report of the Double Cylinder
Rotary Compressor Shaft: (Increasing the diameter & length by 1inch)
Author: Administrator
Analysis Created: Wednesday, November 26, 2008 4:16:55 AM
Analysis Last Modified: Wednesday, November 26, 2008 4:16:55 AM
Report Created: Wednesday, November 26, 2008 4:18:03 AM
Software: Autodesk Inventor Professional 2009 ANSYS Technology
Geometry and Mesh: The Relevance setting listed below controlled the fineness
of the mesh used in this analysis. For reference, a setting of -100 produces a
coarse mesh, fast solutions and results that may include significant uncertainty. A
setting of+ I 00 generates a fine mesh, longer solution times and the least
uncertainty in results. Zero is the default Relevance setting.
- •-•W•'N'M•>-»- - --- - - - - - -·-- .. -TABLE28
Double stage Compressor shaft loads applied.ipt Statistics
2.089 in '.I
Bounding Box Dimensions 1.7 in '
9.034 in - -
!Part Mass 2.517 lbm
!Part Volume ;19.805 in'
!Mesh Relevance Setting 1100
jNodes 2862
!Elements - . "' -·- - - - - -- - [116_0 - - - -- ,
Bounding box dimensions represent lengths in the global X, Y and Z directions.
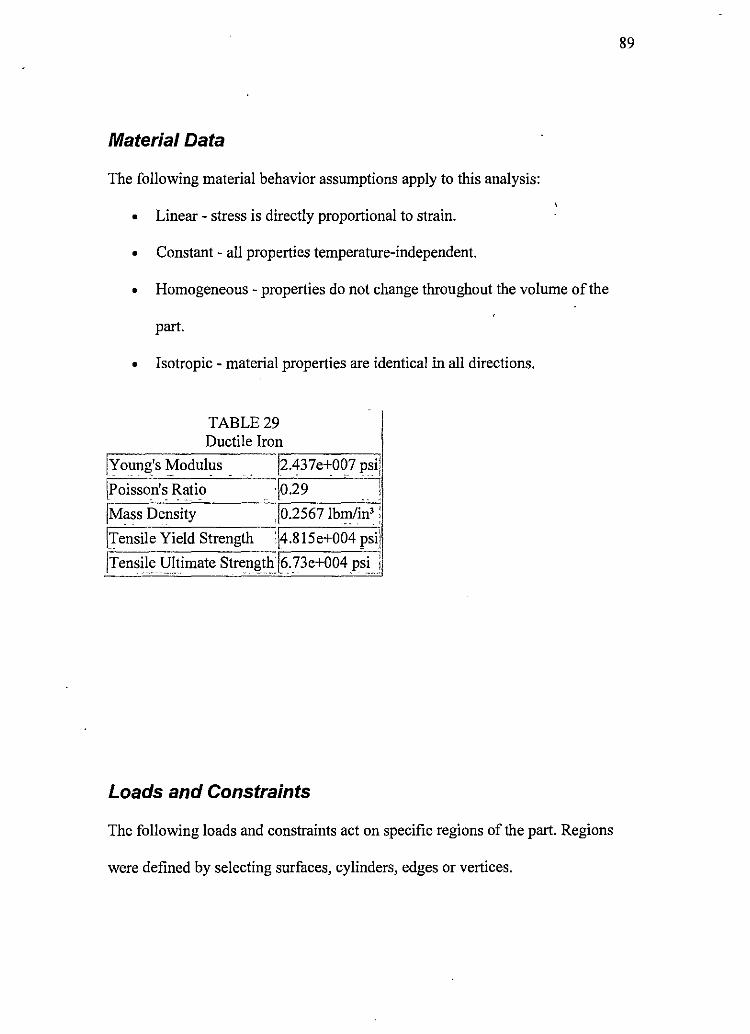
Material Data
The following material behavior assumptions apply to this analysis:
• Linear - stress is directly proportional to strain.
• Constant - all properties temperature-independent.
• Homogeneous - properties do not change throughout the volume of the
part.
• Isotropic - material properties are identical in all directions.
TABLE29 Ductile Iron
jYoung's Modulus _ j2.437e+007 psi!
\Poisson's Ratio · 0.29
jMass Density Jo.2567 lbllVin' :
\Tensile Yield Strength :j4.815e+004 psij
jTensile lJ1_timate Stren~th,J6._73e+004 psij
Loads and Constraints
The following loads and constraints act on specific regions of the part. Regions
were defined by selecting surfaces, cylinders, edges or vertices.
89
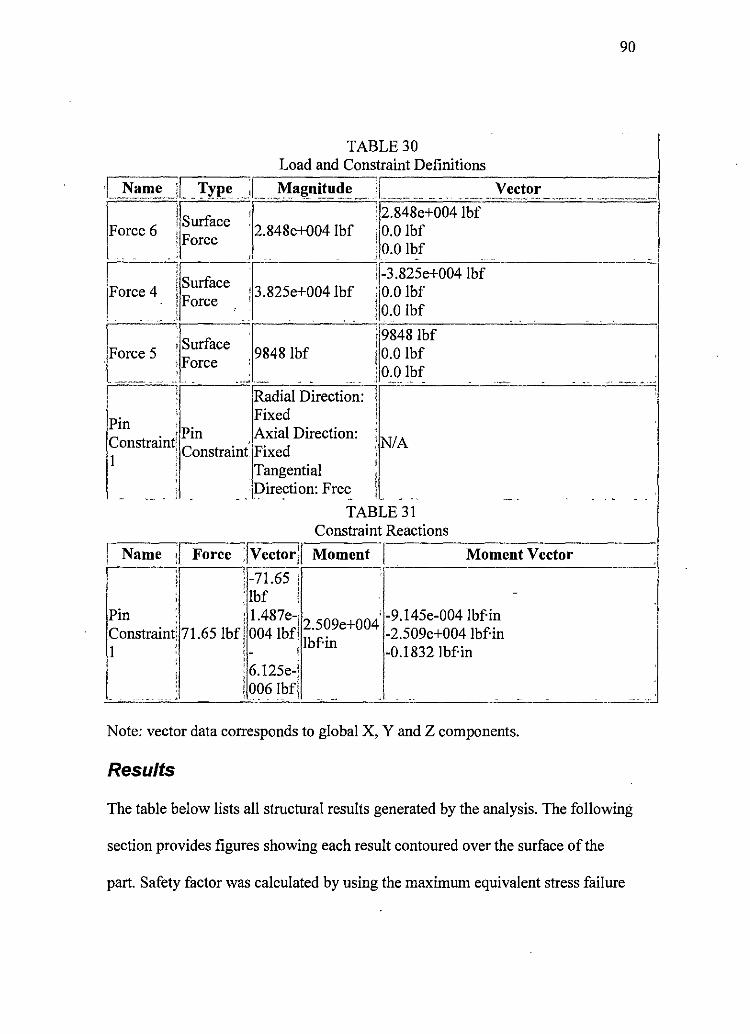
TABLE 30 Load and Constraint Definitions
·I Name _l[ _ !r.1,1e J __ IV1,ag_nitu~~ _ JI_ ___ __ _ _ _ _ _v~~!OE
Fl. , l 2.848e+004 lbf Surface Force · 2.848e+004 !bf 1 0.0 !bf
i 0.0 !bf / j - • -
Fl FSurface : 3.825e+004 lbf orce
'
I -3.825e+004 !bf ; 0.0 !bf i I o.o !bf
r848 lbf i 0.0 !bf i 0.0 !bf \ -···- -- -
1 Radial Direction: I!
' Fixed . Pin 'p· A . 10· . C tr
. ti m xia 1rect10n: ons am1C . F" d
1 i onstramt 1xe
Tangential
;NIA
Direction: Free
TABLE31 Constraint Reactions
90
I Name :i Force !vector/I Moment ,-----M-o-m-en_t_V-ec_t_o_r _____ ,
; !-71.65 1
' l !bf ! '
Pin l.487e-J 2 509 +004 -9.145e-004 !bf-in Constrainti 71.65 !bf 004 lbf, 1bf-in e -2.509e+004 lbf·in I ; - ! -0.1832lbf-in
6 125e-l l • :
!(006 lbf\
Note: vector data corresponds to global X, Y and Z components.
Results
The table below lists all structural results generated by the analysis. The following
section provides figures showing each result contoured over the surface of the
part. Safety factor was calculated by using the maximum equivalent stress failure
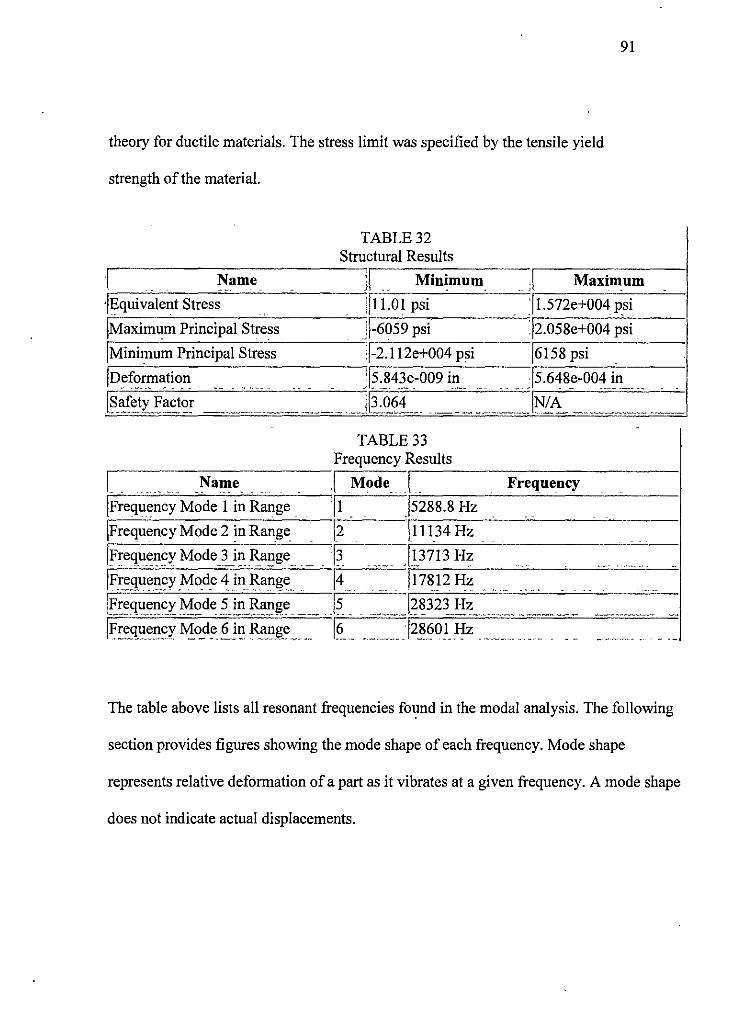
91
theory for ductile materials. The stress limit was specified by the tensile yield
strength of the material.
j Name
\Maximum Principal Stress
[Minimum Principal Stress
[Defo~mation
TABLE32 Structural Results
!J Minimum J •
!/11.01 psi
j\-6059 psi
i[-2.112e+004 psi
JJ5.843_e-009 i~_
TABLE 33
.. j Maximum
:/I.572e+004 p_si
j2.058e+004 psi
[6158 psi
[5.648e-004 in
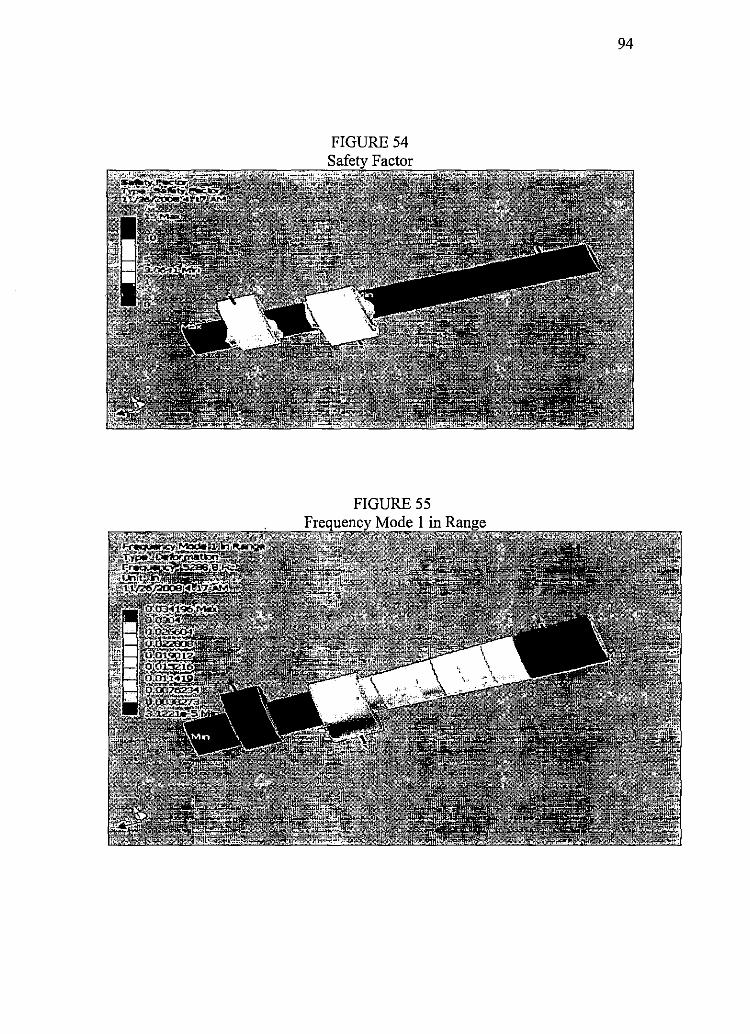
Frequency Results r,-.--... -.. --_N-am-__ -e_-----[ Mode rl -----F-r-eq_u_e-_n_c_y _____ 1
[Frequency Mode 1 in Range [1 [5288.8 Hz lrF-re_q_u_e_n_cy_M_o_d_e_2-in_R_an-_g_e __ --12 "rll_l_13_4_H_z ______ '-'-----I
.r[F-"re_qccu=·e=n=c::y"-__ M_o_d_e=}=1'-"·n-'-"R-"'_a~11"-g_e=···~ccccrl3_'---~"'-'-"-"'F'!"-.3-7_13_H..:;zc__-"""----~-=-=-"'=-~I
jF_rt!gu~~cy Ivfo_d_e 4 in Ran~:. .. \4 _ . . . rl 1~78=_1_2~H~.z~_ -"-"-~'-'='---"'-"'~'---...=c.-1
~[F,=re"-'q=t1e=n=cy=-··=1'.!=~~de-"_ 5=in=R=an=ge=···=~-J5 .. . _ j~~323 l-!z_ ... ____ _ jFrequency Mode 6 in Range __ [6 ______ ../28601 Hz . . ..
The table above lists all resonant frequencies fo1:1nd in the modal analysis. The following
section provides figures showing the mode shape of each frequency. Mode shape
represents relative deformation of a part as it vibrates at a given frequency. A mode shape
does not indicate actual displacements.
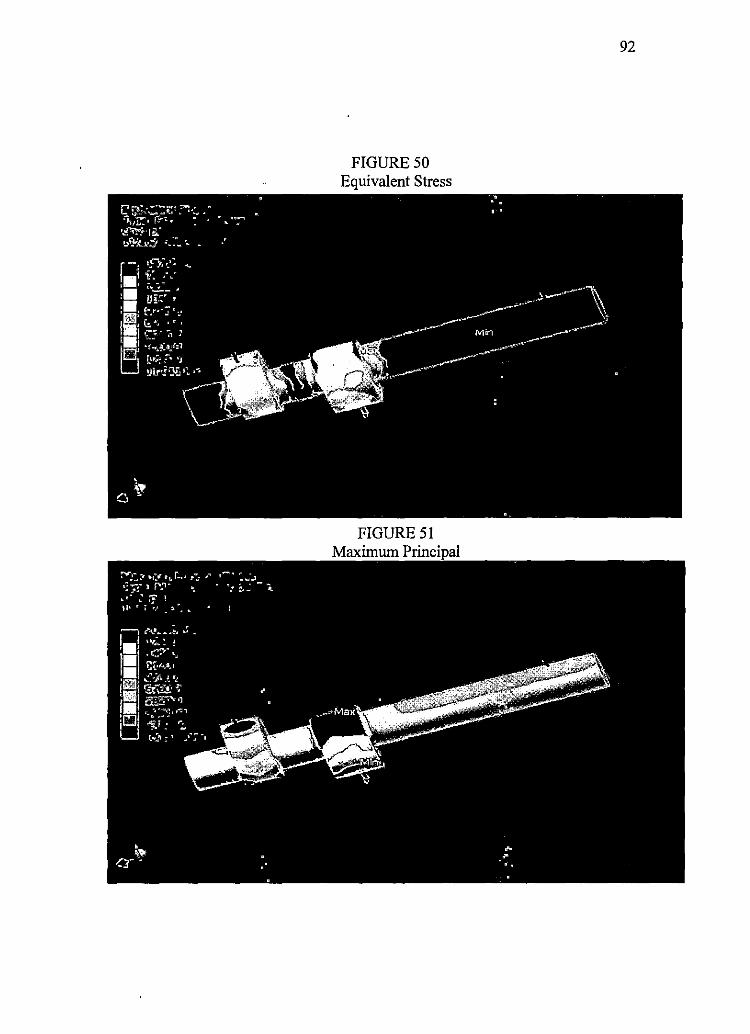
FIGURE SO Equivalent Stress
FIGURES! Maximum Principal
92
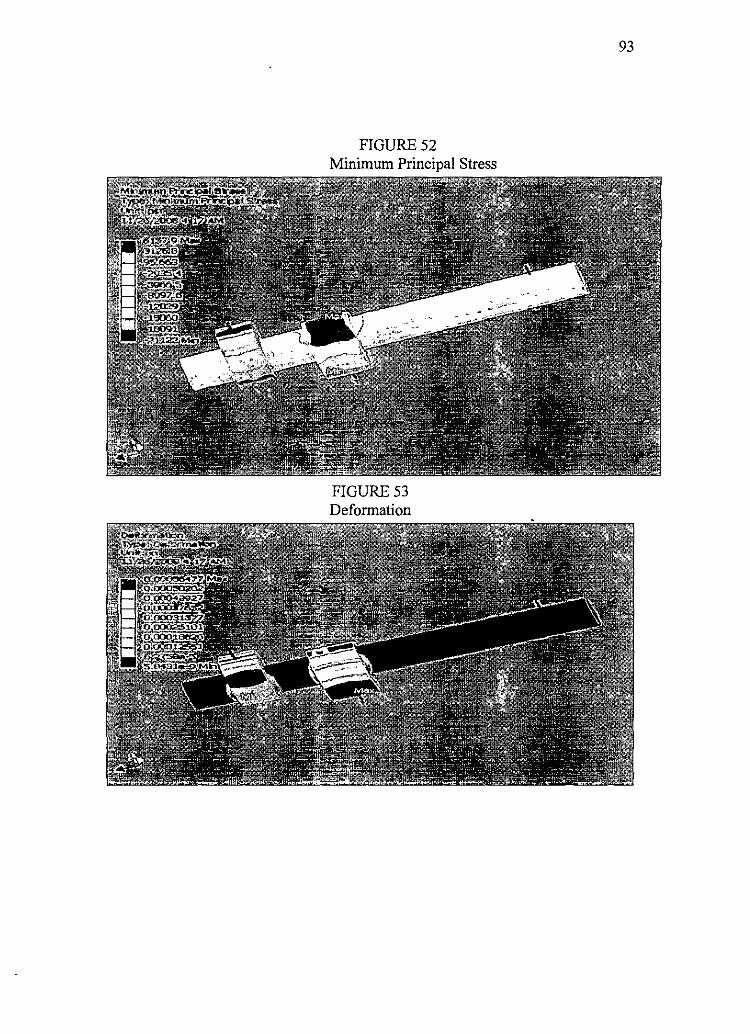
FIGURE52 Minimum Principal Stress
FIGURE53 Deformation
93
94
FIGURE 54
FIGURE55
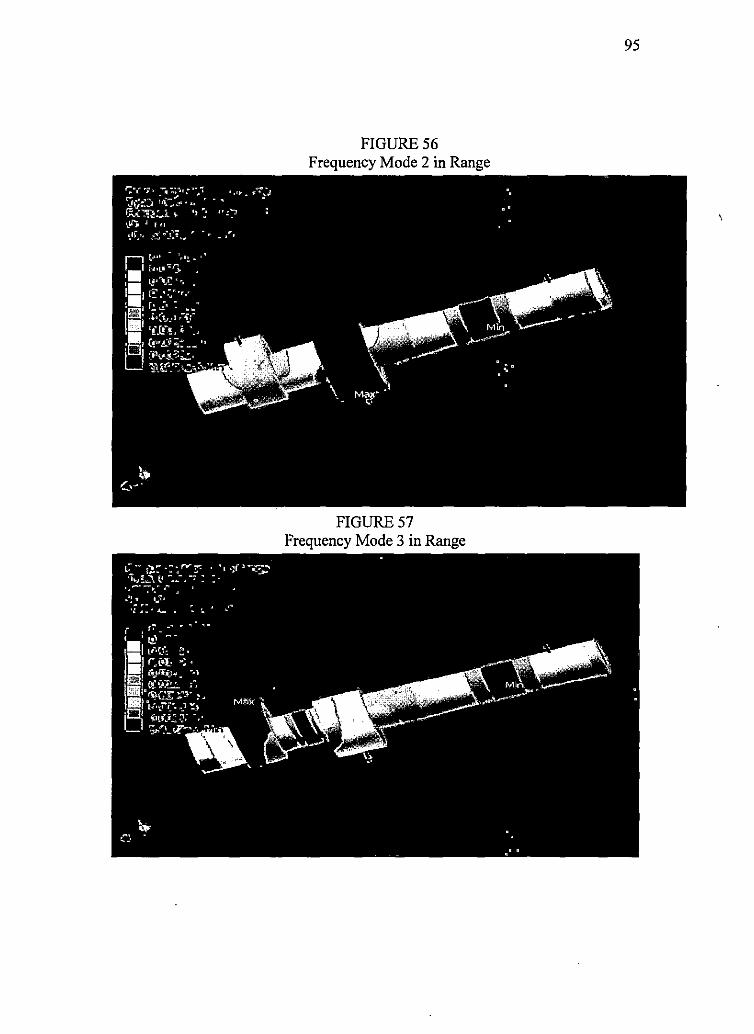
FIGURE56 Frequency Mode 2 in Range
FIGURES? Frequency Mode 3 in Range
95
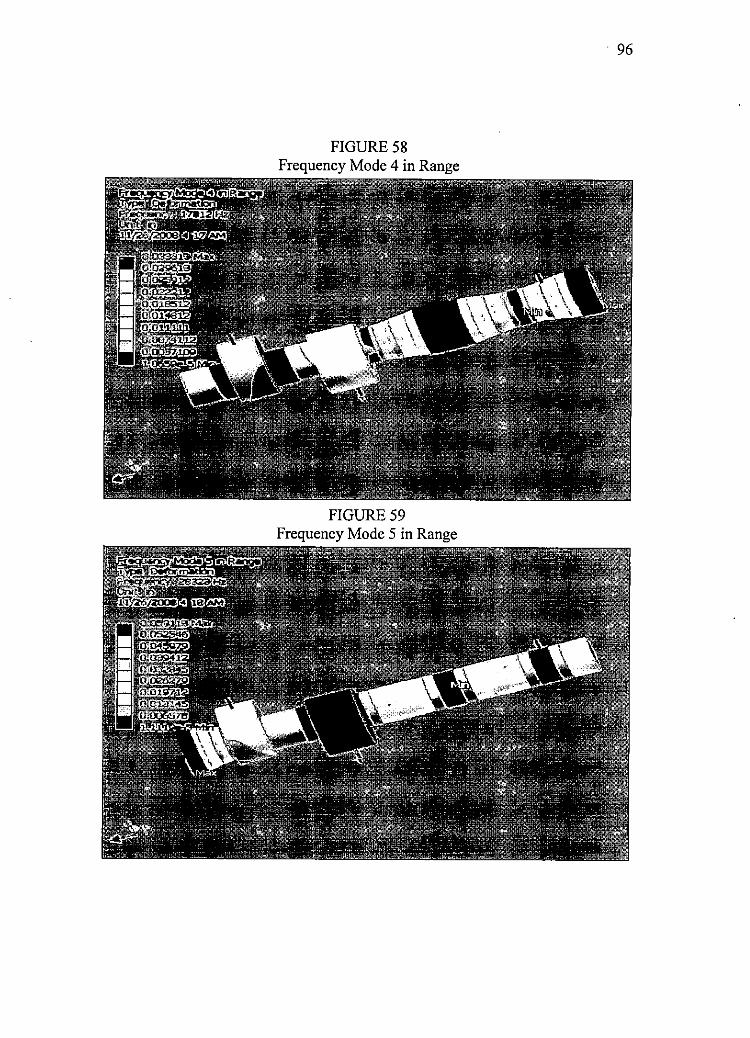
FIGURE58 Frequency Mode 4 in Range
FIGURE59 Frequency Mode 5 in Range
96

FIGURE60 Frequency Mode 6 in Range
97