Embed Size (px)
Citation preview

Design optimization of the A320 engine inlet cowl
Bruno Santos da [email protected]
Instituto Superior Tecnico, Universidade de Lisboa, Portugal
November 2016
Abstract
Aircraft operate in environments in which the components are subject to large temperatureand pressure variations. In structures as the engine nacelles, composed by several components andmaterials, the presence of wear and corrosion becomes noticeable, due to the their operation inenvironments as the one foremost described. Corrective actions must be employed to the componentswhich present this kind of problems. The acoustic panels of the inlet cowl of the Airbus A320/A321,present corrosion problems on the aluminium doublers of the joints. In order to develop a correctiveaction to the joint of the acoustic panels, the analysis of the mechanical behaviour and forces actingon the joint must be made. In this work, a methodology involving Computational Fluid Dynamics(CFD), Finite Element Method (FEM) and Computer Aided Design (CAD) tools is developed in orderto analyse the mechanical behaviour of the acoustic panels joint. The geometry of the inlet cowl andof its components are in Solidworks. The assessment of the aerodynamic loads acting on the inlet cowlis made with CFD tools, with STAR CCM+ software. The structural analysis of the members of thejoint of the acoustic panels is made with the use of FEM tools in ANSYS Workbench software. Thesteps involved in the analysis are explained and the result are presented.
Keywords: Inlet cowl, acoustic panel, aerodynamic loads, mechanical behaviour, joints
1. Introduction
Commercial aircraft engines are invariably exter-nal pod-mounted and they are usually attached tothe wing. The engines are enclosed in a structuralhousing, called nacelle. The main goal of a nacelleis to reduce the drag associated to airflow passingaround the engine, minimize engine noise propaga-tion and to provide a smooth airflow to the engine[1]. The nacelle configuration varies with the enginetype [2].
TAP, the Portuguese airline has a fleet of 80 air-craft. From the 80 aircraft fleet, 19 aircraft are Air-bus A320 and 3 are Airbus A321. At TAP, both theA320 and A321 aircraft share the same engine andthe same inlet cowl. The engine of these aircraft isthe CFM56-5B. Despite the use of the same engine,the engine is installed on each aircraft type withdifferent rates. The inlet cowl of the A320/A321 iscomposed of three acoustic panels, the upper, thelower and side panels. The acoustic panels forma diffuser that provide an uniform airflow to theengine and also have acoustic properties, that par-tially cancel the engine’s noise [3, 4]. The inlet cowlof the A320/A321 is presented in Fig.1.
During the aircraft operation, the inlet cowl is
Figure 1: Airbus A320/A321 inlet cowl.
exposed to large pressures and temperature ranges.Atmospheric temperatures can range from -65◦C to50◦C, and some components of the inlet cowl canreach even higher temperatures due to the anti-icingsystem. In flight operation the inlet is exposed torain, hail and birds. On ground operation, debriscan be suctioned with the airflow into the inlet. Allthese factors contribute to the inlet degradation [5].
When aircraft components start to degrade, cor-rective actions must be employed. The corrective
1

actions depend on many factors, such as the severityof the problem and its location on the component.The corrective actions can be found in the repairmanuals provided by the component manufacturer.
With regard to the acoustic panels, there are sev-eral repairs that are foreseen by the manufacturer.From time to time, aluminium corrosion appearson the doublers of the joint of the acoustic panels.Fig.2, shows a typical A320 acoustic panel and itscomponents. A repair for the aft doubler of thepanel (please see Fig.2) is foreseen by the manufac-turer, however, no repair for the internal doubler ispresent in the repair manual.
TAP is certified with a Design Organization Ap-proval (DOA). The certification is granted by EASA(European Aviation Safety Agency). This certifi-cate grants to TAP the authorization to designchanges for repairs, for some aircraft areas.
Since the repair of the corroded internal doublerof the acoustic panel is not foreseen in the repairmanuals of the aircraft, making use of the certifica-tion to design a repair for this component can bebeneficial for when such problems arise.
Hereupon, the work presented aims to supportthe approval of the repair with the analysis the me-chanical behaviour of the joint where the doublersare applied.
(a)
(b)
Figure 2: Acoustic panel side section and mainJoint. (a) Acoustic panel side section view;(b) Jointmain components.
2. Aerodynamic Loads DeterminationCFD Methodology
In order to determine the aerodynamic loads actingon the engine’s nacelle of the Airbus A320/A321, aCFD methodology was developed.
2.1. CAD Modelling - A320/A321 NacelleBoth aircraft models, A320 and A321, share thesame inlet cowl and engine, the CFM56-5B. In orderto correctly simulate the flow behaviour around theengine’s nacelle, a CAD model was created in Solid-works environment. Information gathered from Air-bus website, Airbus A320 manual and measure-ments performed at TAP facilities, were used to cre-ate the CAD model, presented in Fig.3. A very im-portant input for the CAD model was the mappedgeometry of the lower acoustic panels. With thedata of the mapped acoustic panel it was possibleto determine the inlet curvature and length.
Figure 3: A320/A321 nacelle CAD model.
2.2. Simulated Flight ConditionsIn order to structurally analyse the joint of theacoustic panel, the critical aerodynamic load mustbe determined. The takeoff and cruise phases wereconsidered the most critical flight phases. In thetakeoff phase engines are pushed close to their max-imum power, in turn, the maximum air mass flow issuctioned by the engine. In the cruise phase maxi-mum aircraft speed is attained. The landing phasewasn’t considered critical due to the low speeds ofthe aircraft and low power employed.
Four flight conditions were analysed. Threefor takeoff with different angles of attack, at sealevel. The fourth condition, for cruise at 11000 m(36000ft). The flight conditions are summarized inTable 1.
Table 1: Simulated flight conditions.Flight Altitude Mach Mass FlowConditions [m] Number [kg/s]
Takeoff 0◦ 0 0.438 400Takeoff 9◦ 0 0.438 400Takeoff 16◦ 0 0.438 400Cruise 11000 0.847 110
2.3. CFD ApproachesTwo different methodologies were implemented inorder to obtain the aerodynamic load on the enginenacelle. As the engine fan blades are constantly ro-tating, real boundary conditions are complex anddifficult to reproduce. Some simplifications to the
2

real model had to be done. Both implementedmethodologies intended to reproduce the engine’soperation.
The first approach intended to simulate the en-gine fan operation. In order to simulate the fan aSTAR-CCM+ inbuilt fan simulator was used. Somesimulations were performed in order to understandthe fan simulator’s reaction to different inputs. Aporous media was used at the engine core in order tosimulate flow dissipation and to generate a uniformflow at the engine exit. Due to poor results, unreal-istic flow behaviour and lack of information aboutthe engine’s fan, this methodology was dropped.
To simplify the complexity of the real enginemodel and to avoid the problems associated to thefan modelling, an alternative methodology was in-troduced. This methodology was the adopted oneto perform all CFD calculations. In order to sim-plify the real engine model the following simplifica-tions were made: the fan geometry was replaced bya section with the same diameter of the real fan.Boundary conditions were applied to the fan sec-tion to simulate the fan flow suction; No engine corecomponents were modelled. A ”black box” mecha-nism was used to simulate the engine core; as thefocus of this work is to analyse the effect of theflow at the engine inlet, no exhaust flow simulationwas performed. Instead, a ”Sting” was created atthe end of the nacelle. With the introduction of asting the interaction of both hot and cold jets wasavoided, reducing the simulation complexity. Thesting has a length 5 times the fan diameter to mini-mize the wake effect on the area closer to the engine,as made in [6].
The final engine configuration for the CFD sim-ulations is presented in Fig.4.
Figure 4: Engine configuration for CFD simula-tions.
2.4. The CFD Methodology
The methodology used to simulate the flight condi-tions was based on the second approach previouslypresented. All the CFD simulations were made us-ing an isolated STAR CCM+ engine model.
2.4.1 Computational Domain
A rectangular prism with typical dimension wasused to defined the computational domain. All theprism dimensions were set as function of the fan di-ameter Dfan, starting at a referential with originat the center of the fan. Both the computationaldomain and the boundaries used in the CFD simu-lations are presented in Fig.5.
Figure 5: Computational domain and boundaries.
2.4.2 Generated Mesh
The mesh used in the present work was composedby a trimmed mesh combined with a prismaticlayer. The prismatic layer was only generated onthe surfaces of interest, that is, on the surfaceswhere the wall shear stress was to be calculated. Afew layers of prismatic cells are needed, typically 5to 8 to determine the above properties. Ten layerswere used in the computational simulations. Thenumber of layers was also taken into account in or-der to obtain a y+ <200. Due to computationallimitations, a mesh with a maximum number of 1.61million cell was created. In order to obtain betteraccuracy in the regions of interest a block refine-ment was created. The mesh and its different levelsof refinement can be seen in Fig.6.
Figure 6: Mesh at the geometry mid-plane.
2.4.3 The Problem Physics
In order to correctly represent the engine a tri-dimensional model was used to account for the en-
3
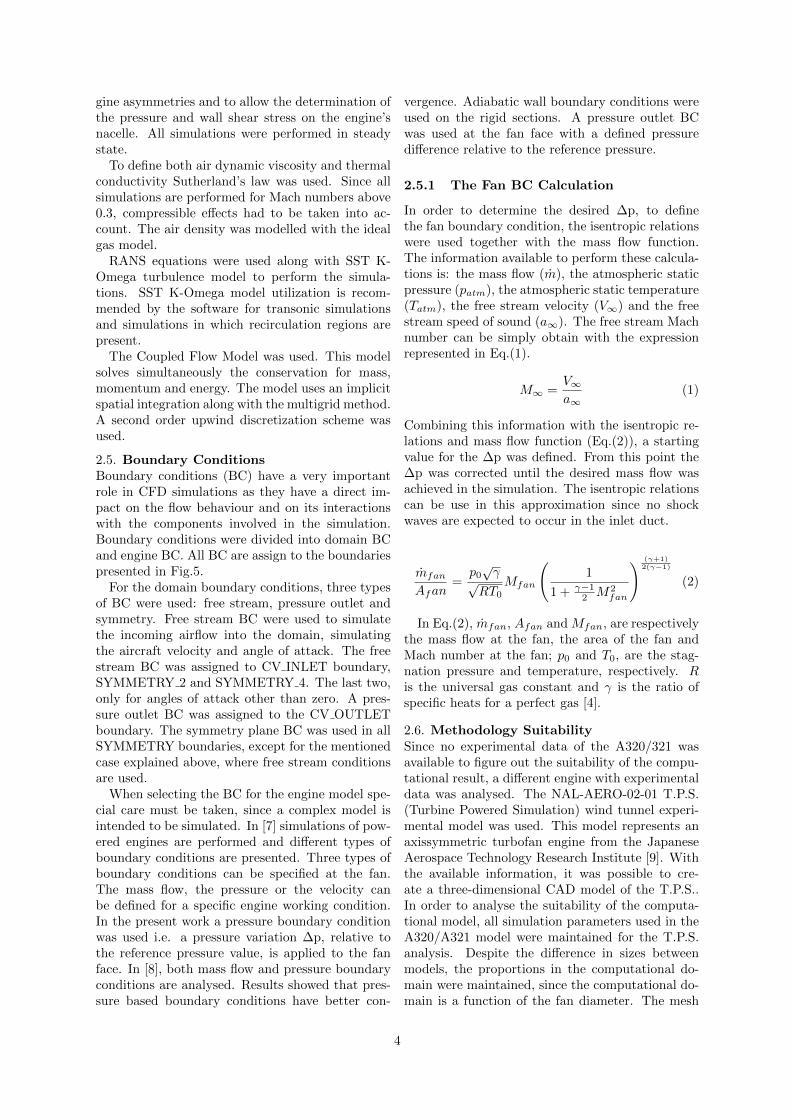
gine asymmetries and to allow the determination ofthe pressure and wall shear stress on the engine’snacelle. All simulations were performed in steadystate.
To define both air dynamic viscosity and thermalconductivity Sutherland’s law was used. Since allsimulations are performed for Mach numbers above0.3, compressible effects had to be taken into ac-count. The air density was modelled with the idealgas model.
RANS equations were used along with SST K-Omega turbulence model to perform the simula-tions. SST K-Omega model utilization is recom-mended by the software for transonic simulationsand simulations in which recirculation regions arepresent.
The Coupled Flow Model was used. This modelsolves simultaneously the conservation for mass,momentum and energy. The model uses an implicitspatial integration along with the multigrid method.A second order upwind discretization scheme wasused.
2.5. Boundary ConditionsBoundary conditions (BC) have a very importantrole in CFD simulations as they have a direct im-pact on the flow behaviour and on its interactionswith the components involved in the simulation.Boundary conditions were divided into domain BCand engine BC. All BC are assign to the boundariespresented in Fig.5.
For the domain boundary conditions, three typesof BC were used: free stream, pressure outlet andsymmetry. Free stream BC were used to simulatethe incoming airflow into the domain, simulatingthe aircraft velocity and angle of attack. The freestream BC was assigned to CV INLET boundary,SYMMETRY 2 and SYMMETRY 4. The last two,only for angles of attack other than zero. A pres-sure outlet BC was assigned to the CV OUTLETboundary. The symmetry plane BC was used in allSYMMETRY boundaries, except for the mentionedcase explained above, where free stream conditionsare used.
When selecting the BC for the engine model spe-cial care must be taken, since a complex model isintended to be simulated. In [7] simulations of pow-ered engines are performed and different types ofboundary conditions are presented. Three types ofboundary conditions can be specified at the fan.The mass flow, the pressure or the velocity canbe defined for a specific engine working condition.In the present work a pressure boundary conditionwas used i.e. a pressure variation ∆p, relative tothe reference pressure value, is applied to the fanface. In [8], both mass flow and pressure boundaryconditions are analysed. Results showed that pres-sure based boundary conditions have better con-
vergence. Adiabatic wall boundary conditions wereused on the rigid sections. A pressure outlet BCwas used at the fan face with a defined pressuredifference relative to the reference pressure.
2.5.1 The Fan BC Calculation
In order to determine the desired ∆p, to definethe fan boundary condition, the isentropic relationswere used together with the mass flow function.The information available to perform these calcula-tions is: the mass flow (m), the atmospheric staticpressure (patm), the atmospheric static temperature(Tatm), the free stream velocity (V∞) and the freestream speed of sound (a∞). The free stream Machnumber can be simply obtain with the expressionrepresented in Eq.(1).
M∞ =V∞a∞
(1)
Combining this information with the isentropic re-lations and mass flow function (Eq.(2)), a startingvalue for the ∆p was defined. From this point the∆p was corrected until the desired mass flow wasachieved in the simulation. The isentropic relationscan be use in this approximation since no shockwaves are expected to occur in the inlet duct.
mfan
Afan=
p0√γ
√RT0
Mfan
(1
1 + γ−12 M2
fan
) (γ+1)2(γ−1)
(2)
In Eq.(2), mfan, Afan and Mfan, are respectivelythe mass flow at the fan, the area of the fan andMach number at the fan; p0 and T0, are the stag-nation pressure and temperature, respectively. Ris the universal gas constant and γ is the ratio ofspecific heats for a perfect gas [4].
2.6. Methodology SuitabilitySince no experimental data of the A320/321 wasavailable to figure out the suitability of the compu-tational result, a different engine with experimentaldata was analysed. The NAL-AERO-02-01 T.P.S.(Turbine Powered Simulation) wind tunnel experi-mental model was used. This model represents anaxissymmetric turbofan engine from the JapaneseAerospace Technology Research Institute [9]. Withthe available information, it was possible to cre-ate a three-dimensional CAD model of the T.P.S..In order to analyse the suitability of the computa-tional model, all simulation parameters used in theA320/A321 model were maintained for the T.P.S.analysis. Despite the difference in sizes betweenmodels, the proportions in the computational do-main were maintained, since the computational do-main is a function of the fan diameter. The mesh
4

cells density was also maintained between simula-tions, please see Fig.7.
A simulation to recreate the experimental datawas performed, simulating the cruise condition. InFig.8, a graphic with the experimental and com-putational pressure coefficient (Cp), is presented.In Fig.8 the good agreement between the experi-mental and computation result can be seen. Errorsbellow 3% can be found in the region of interest(Inlet cowl). Since good results were obtained withthis computational setting, it is expected to obtainresult for the A320/A321 as suitable as the onesobtained with the T.P.S. model.
Figure 7: T.P.S. model and mesh.
Figure 8: T.P.S. Cp distribution for computationaland experimental results.
2.7. CFD Results and DiscussionFour flight conditions were simulated in order todetermine the critical flight conditions to which themaximum flight aerodynamic load is presented.
All simulations ran until the stopping criteria wasattained. The control parameters in the presentwork were the Residuals, the Mass Flow and the y+.The y+ was used to control the mesh quality. Boththe residuals and mass flow were used to controlthe solution convergence. In the present work thesolution was considered to be converged when allthe residual had values bellow 10−4. Although, themass flow variation was analysed in parallel with theresidual to ensure that this important quantity had
also converged. In all flight conditions the residu-als are below 10−4 and the mass flow converged tothe desired values, approximately 400 kg/s for thetakeoff conditions and approximately 110 kg/s forcruise.
From analysis of the velocity field it could be ver-ified that flow is uniform for the lower takeoff angleconditions. For the takeoff 16◦, flow separation isvisible, accompanied with flow recirculation, thatcan affect the engine performance, please see Fig.9.At cruise condition, the flow is uniform in the inletregion, but the exterior of the nacelle is affected byshock waves.
The analysis of the Mach number at the fan, forthe takeoff conditions, shows that the Mach numberis in the typical range for turbofan engines, 0.4-0.7[4]. For the takeoff 16◦ condition, the influence ofthe flow separation is visible on the Mach numberdistribution, please see Fig.10. The result for thecruise condition are slightly below the typical val-ues, maybe due to the mass flow approximations.
The analysis of the pressure distribution showsthat the maximum pressure has about the samemagnitude for the three takeoff conditions. Theminimum pressure increases in magnitude as the an-gle of attack increases, due to a further accelerationaround the lip leading edge. For the cruise condi-tion large pressure variations appear in the shockwave regions. The pressure result are presented inTable 2.
The analysis of the wall shear stress (WSS) showsthat its magnitude is higher in regions of higher ve-locity, the inverse is also verified. Comparing theWWS magnitude to the pressure magnitude it canbe seen that the WSS corresponds to about 1% ofthe pressure magnitude. The WSS results are pre-sented in Table 3.
Figure 9: Velocity field for takeoff 16◦.
5

Figure 10: Fan Mach number distribution for take-off 16◦.
Table 2: Pressure variation for the simulated flightconditions.
Takeoff Takeoff Takeoff CruiseProperty 0◦ 9◦ 16◦
Maximum 14815 14998 14798 13541Pressure [Pa] [Pa] [Pa] [Pa]Minimum -11757 -38840 -49922 -14071Pressure [Pa] [Pa] [Pa] [Pa]
Table 3: Wall Shear Stress variation for the simu-lated flight conditions
Takeoff Takeoff Takeoff CruiseProperty 0◦ 9◦ 16◦
WSS [Pa] 94.41 153.14 166.69 66.53WSS [Pa] 0.15 0.22 0.13 0.16
3. Analysis of the Joints of the AcousticPanel - FEM Methodology
The methodology used to determine the mechan-ical behaviour of the joint of the acoustic panel andthe fasteners of the joint is presented. The differentapproaches to the problem are explained. Resultsfrom the CFD methodology chapter were used, inorder to correctly simulate the aerodynamic loadingon the structure.
3.1. Preparing the FEM Simulations
The joint of the acoustic panel intended to be anal-ysed is the joint presented in Fig.1. In order to un-derstand the effect of the aerodynamic load on theacoustic panel’s joint and fasteners, several FEMsimulations were performed.
3.1.1 Aerodynamic Load
All aerodynamic load obtained with Star CCM+software, were imported to ANSYS Workbench. Inorder to preform the structural analysis both the
pressure and wall shear stress were imported toANSYS. The imported data correspond to the fourfight conditions, takeoff 0, 9, 16 and cruise. Atten-tion was made to verify if the imported coordinatesystem was coincident with the one found in AN-SYS, and also to verify if the same units are usedin both systems.
3.1.2 Geometry and Geometry Importation
In order to generate the structural analysis, a CADmodel was created and imported into the ANSYSenvironment. All the geometries used in the analy-sis were created using Solidworks. Since the objec-tive of the present work is to analyse the joint ofthe acoustic panel, special attention was made tocorrectly simulate the components in that region.In Fig.11 ,the external region of the inlet cowl arepresented. The three sections corresponding to theacoustic panels are visible with three different col-ors. In Fig.12 the internal view of the inlet cowlwith the joint components is presented. In additionto the components represented, there is an attach-ment ring that creates the connection between theinlet cowl joint and the engine.
3.1.3 Material and Mechanical Properties
Several materials are used in the construction of theinlet cowl and acoustic panel. All material proper-ties were introduced in the software. The proper-ties were obtained form CES EduPack 2015 Soft-ware, except those of the honeycomb core, whichwere calculated based on the geometrical parame-ters [10]. The Honeycomb was modelled as an or-thotropic material.
Figure 11: Inlet cowl isometric view.
3.1.4 Contact Between Components
Whenever two or more components surfaces toucheach other, these components are said to be in con-tact. In the simulations of the present work the twotypes of contact used were Bonded and Frictionless.
6

Figure 12: Inlet cowl internal view.
When using bonded contact it is assumed that com-ponents in contact are glued together. No sliding orseparation is allowed between components. Bondedcontact was used in the acoustic panel components.The frictionless contact allows components to slideand to separate from each other. Unlike the bondedcontact type, frictionless contact has nonlinear for-mulation that results in longer solutions time. Thistype of contact is used to simulate contact betweenthe acoustic panel doublers and the attachmentsring. It is also used to simulate the contact betweenthe fasteners shank and the Joint’s holes.
3.1.5 Defining the Mesh
ANSYS Workbench presents several meshing meth-ods to mesh solids components. Depending on thetype of method selected, different building blockswill be used in the construction of the mesh. In thepresent work, the hex-dominant method was used.The hex-dominant method creates a mainly hexa-hedral element mesh. When the hexahedral meshis compared to the tetrahedral it can be verifiedthat the hexahedral mesh requires much less ele-ments than the tetrahedral one to obtain the samesolution accuracy. Quadratic elements were used inthe analysis. As the computational resources arelimited, a global mesh size was defined and localrefinements were used to increase the mesh densityin locals of interest.
3.2. Determination of the Critical Load Con-dition
In order to determine the critical loading condition,the pressure and wall shear stresses, determined inSTAR CCM+, were applied to the structures inANSYS environment. An analysis of the Force Re-action and Moment Reaction is made to determinethe critical loading conditions.
3.2.1 Model Considerations
The complete model of the inlet cowl was used inthe analysis. In order to reduce the simulation com-plexity and the computational effort, no fastenerswere simulated and bonded contact was used in all
components. Since only reaction forces and mo-ments are to be obtained, the use of Bonded contactdoesn’t compromises the results.
All simulations were performed with the same ge-ometry and mesh in order to have a base of com-parison between simulations. The mesh used was ofthe Hex Dominant Type, with 305136 elements.
For each simulation, the respective aerodynamicloads, were imported into the model.
To ensure that the geometry was held in place,a constraint was imposed at the Attachment Ring.The constrain was defined as a Fixed Support.
A simulation with the structural weight was alsoperformed in order to understand its influence.
3.2.2 Results and Discussion
Reaction forces and moments corresponding to theanalysed loading conditions are presented in Table4. As the angle of attack increases, both forces andmoments reaction increase. It is possible to con-clude that the loading corresponding to the Take-off 16 flight condition corresponds to the criticalloading condition. From the analysis of the resultscorresponding to the structural weight condition, itis visible that all components of the reaction forceand moment reaction, have the opposite sign whencompared to the other analysis made. This meansthat the addition of the structural weight reducesthe global loading.
Table 4: Moment and and reaction forces results.Force Moment
Reaction [N] Reaction [N.m]LoadingCondition Total Total
Takeoff 0 947.53 2128Takeoff 9 21154 14476Takeoff 16 34695 20236Cruise 7371.7 6168.4Structural 1380 1490.4Weight
3.3. Approach to Analyse the Acoustic PanelJoint
In order to obtain enough resolution to capture thedesired properties, both for the fastener of the jointand the interface between the internal honeycomband internal doubler, some simplifications had to bedone to the model.
3.3.1 Model Simplifications
In order to simplify the model, the equivalent stressof the complete bonded model was analysed. Theloading conditions used in the simulations were the
7

critical ones, Takeoff 16. From these analysis it waspossible to identify the region with higher stress lev-els. This region corresponds to the interface regionbetween the Lower and Side Acoustic Panels. Asection of the model comprising that region and afastener pattern on each side of the interface wascreated. Please see Fig.13.
As the inlet cowl was sectioned, new boundaryconditions had to be implemented in order to sim-ulate the complete structure behaviour. A springmodel was used to simulate the rigidity of the com-plete model. Please see Fig.14.
Figure 13: Inlet cowl most stressed region.
Figure 14: Spring model.
3.4. Analysis of the fasteners of the JointIn the present section the analysis of the fastenersof the joint is made in order to understand the me-chanical behaviour of the fasteners in the Joint.
3.4.1 Components Contact and Mesh Re-finement
The aerodynamic loads tend to bend the inlet, gen-erating tension on the Hi-Loks. Bonded contact wasused to connect the Hi-Lok head to the doubler andthe collar to the attachment ring. Frictionless con-tact was used between the attachment ring and thedoublers and between the Hi-Lok shank and holes.Due to computational limitation bolts were locally
refined. For the convergence analysis only the fas-teners were refined.
3.4.2 Convergence Analysis
For the convergence analysis the equivalent stress(von Mises) of the fasteners was analysed. In orderto always analyse the convergence of the fastener atthe same point, a fixed referential was created foreach fastener, at the maximum stress node. Thesame referential was used at each refinement.
As it can be seen from Table 5, there still exista fluctuation on the stress values. Although, theerror between consecutive refinements is very small.Refinement 5 was used to obtain the result for thebolts analysis.
Table 5: Bolts convergence analysisN◦ Elements von Mises Error
Refinement [Pa] [Pa] %
1 132150 1.206E7 1.0742 134838 1.219E7 6.0843 143908 1.298E7 0.0384 208108 1.299E7 0.9645 274881 1.287E7 -
3.4.3 Result and Discussion of the Fasten-ers Analysis
Analysis of the Tension and Shear StressThe results obtained from the fasteners analysisallowed to compare the maximum tension stressσmax, and the maximum shear stress τxymax , ofeach Hi-Lok, with the material yield strength limits.From the analysis of the results a minimum safetyfactor of 47 and 246 were obtained for tension andshear respectively.
Pretension Results Hi-Lok fastener with twodifferent diameters were used in the main joint. Thepreload analysis was made to the fasteners, of eachdiameter, which presented highest normal stresses.The normal stress of each of these bolts, was con-verted into tension force in order to make a com-parison between the resultant normal force and thetheoretical preload. The preload Fi, was calculatedwith the Eq.(3) [11].
Fi =T
Kd(3)
T corresponds to the tightening torque applied tothe fastener (obtained from the fastener data sheet)and d correspond to the major diameter of the fas-tener. A torque coefficient, K, of 0.16 was used.The results are presented in Table 6. As the maxi-mum tension force on the fasteners is only about 5%
8

of the theoretical preload, it is possible to concludethat the joint is safe against flange separation.
Table 6: Comparison between the theoreticalpreload and resultant tensile force on the fasteners.
Hi-Lok Theoretical Tension % ofDiameter Preload[N] Force[N] Preload
4.76 [mm] 5148.44 227 4.41(Hi-Lok65 4)
6.35 [mm] 7784.03 375 4.81(Hi-Lok32 1)
3.5. Analysis of the Interface between inter-nal honeycomb core and internal doubler
In the present section the forces acting on thebonded interface between the internal honeycombcore and the internal doubler are determined.
3.5.1 Components Contact and Mesh Re-finement
Bonded contact was used in all the acoustic panelcomponents. The contact between the attachmentring and the doubler was frictionless contact. Fric-tionless contact was also used between the fastenersshank and the holes of the fasteners.
In order to capture the forces acting between thedoubler and the honeycomb, a fixed joint connec-tion was used between the components. Two jointsare analysed, one joint correspond to the LowerPanel section and the other to the Side Panel sec-tion. The two joints and respective referential arepresented in Fig.15. In this analysis the refinementwas focus on the component of the joint.
A convergence analysis was made and the mostrefined results were used for the analysis.
Figure 15: Joint’s interfaces and referential.
3.5.2 Results and Discussion of the JointsAnalysis
In order to determine the Joints properties, calcu-lations to determine the flat tensile strength and
shear stress are made. Formulation presented instandards ASTM C297-94 [12] and C273-00ε1 [13]were used. The forces used in the analysis are pre-sented in Table 7.
Table 7: Joints forces.
ComponentForce [N]Lower Joint
Force [N]Side Joint
X 160.15 -150.6Y 912.97 571.29Z 450.22 365.37Total 1030.5 694.66
The Flatwise Tensile Strength For the flat-wise tensile strength analysis the maximum Y com-ponent of the force was used, corresponding tothe lower joint. Both joints have the same cross-sectional areas, A = 9946mm2. The flatwise tensilestrength was calculated with Eq.(4).
σ =P
A= 92kPa (4)
In Eq.(4), σ represents the flatwise tensilestrength and P the load. Comparing the obtainedresult with the experimental test results of theLOCTITE EA 9658 AERO[14], it can be verifiedthat the obtained tension are equivalent to 4.38%of the minimum experimental strength. A force22.82 times the force obtained in the simulationwould be needed to attain the minimum experimen-tal strength limit.
The Shear Stress The shear stress resultingfrom the aerodynamic load on the joint correspondsto the X and Z components of the joint force. Sincethe Z component of the lower joint is the largestforce component, this force was used to calculatethe shear stress in the joint. The calculation is madeas follows, Eq.(5).
τ =P
Lb= 45kPa (5)
In Eq.(5), τ represents the shear stress, P theload, L the length of specimen, and b the width ofspecimen.
As in the previous analysis, the results were com-pared with experimental data. The simulation re-vealed that results correspond to about 0.4% of thelimit strength.
4. ConclusionsThe overall results of this work allowed to reach thefollowing conclusions:• Two CAD models of the A320/A321 inlet cowl
were created for the analysis performed using CFD
9

and FEM. The correct modelling on the nacelle canbe very challenging.
• A methodology using Computational Fluid Dy-namics to determine the aerodynamic loads actingon the inlet cowl on of an aircraft’s engine was de-veloped.
• The aerodynamics loads, pressure and wallshear stress, were obtained for four flight conditions.
• The suitability of the methodology employed todetermine the aerodynamic loads was verified.
• A methodology to analyse the joints of theacoustic panels using FEM was developed.
• The critical loading condition was determined.
• It was possible to conclude that the joint andthe fasteners are subjected to combined loads.
• Stresses in the fasteners are far from their yieldlimits, both for tension and shear. This indicatesthat the fasteners do not present risks for the jointsafety.
• Loads on the fasteners far from the preloadones.
• Forces acting on the interface between the inter-nal honeycomb core and the internal doubler weredetermined.
• The analysis of the flatwise tensile strength andshear stresses allowed to conclude that L0CTITEEA 9658 AERO can be used to connected both theinternal honeycomb core and internal doubler, witha large safety margin.
• Finally, the development of this project allowedto create a methodology that allows the analysis ofaerodynamic and structural parameters of the inletcowl of an aircraft engine. This methodology couldbe used and adapted to analyse other models in-volving aerodynamic loads and structural analysis.
5. Future Work
In the future it would be interesting to perform asimilar analysis with more computational power. Itwould be interesting to analyse larger sections of theinlet, or even the complete model. An experimentalanalysis of the joint of the acoustic panel could bedone in order to compare experimental and numer-ical results. Finally, the developed model could beused to approach different problem.
Acknowledgements
I would like to express my gratitude to Prof. LuisReis and Vitor Anes for their support and recom-mendations through the development of this work.I would like to thank TAP Engines Engineering de-partment for their availability and for the opportu-nity of having direct contact with the componentsat their facilities.
References
[1] Kundu, A. K. (2010). Aircraft design (Vol. 27).Cambridge University Press.
[2] Shmyrov, V.F., other (2010). Airplane powerplants systms designing. Kharkiv NationalAerospace University.
[3] Airbus. Component maintenance manual of theAirbus A320.
[4] Philip, H., & Carl, P. R. (1992). Mechanics andthermodynamics of propulsion. Addison Wesly.
[5] Watson Jr, H. A. (1970). Structural and En-vironmental Studies of Acoustical DuctLiningMaterials. The Journal of the Acoustical Societyof America, 48(3C), 795-814.
[6] Hall, Z., Ahuja, V., Hartfield, R., Shelton, A., &Ahmed, A. (2009). Optimization of a TurbofanInlet Duct using a Genetic Algorithm and CFD.AIAA Paper, 3775, 22-25.
[7] Zhaoguang, Tan and Yinchun, Chen and Wei,Huang (2012). Research for jet flow influences towing-mounted civil aircraft aerodynamic char-acteristics. International Congress of the Aero-nautical Sciences.
[8] LUCIOLI, J. (2011). CFD analysis of a nacelleat high angle of incidence.
[9] HIROSE, Naoki, et al. Transonic 3-D EulerAnalysis of Flows around Fanjet Engine andTPS (Turbine Powered Simulator)-Comparisonwith Wind Tunnel Experiment, Evaluation ofTPS Testing Method and 3-D Flow. 1989.
[10] Gibson, L. J., & Ashby, M. F. (1999). Cellu-lar solids: structure and properties. Cambridgeuniversity press.
[11] Budynas, R. G., & Nisbett, J. K.(2011).Shigley’s mechanical engineering design. McGraw Hill.
[12] ASTM International (1999). Standard TestMethod for Flatwise Tensile Strength of Sand-wich Constructions. Designation: C 297 94.
[13] ASTM International (2000). Standard TestMethod for Shear Properties of Sandwich CoreMaterials. Designation: C273-00.
[14] LOCTITE, LOCTITE EA 9658AERO Epoxy Film Adhesive. From:https://tds.us.henkel.com/NA/UT/HNAUTTDS.nsf/web/22C510C43FA6A5B58525715C001BD519/Accessed: 2016-09-30.
10