Embed Size (px)
Citation preview
Article
Design Optimization and Analysis of an Outer-RotorDirect-Drive Permanent-Magnet Motor forMedium-Speed Electric Vehicle
Yuan Yuan 1,*, Wenjun Meng 1, Xiaoxia Sun 1 and Liyong Zhang 2
1 School of Mechanical Engineering, Taiyuan University of Science and Technology, Taiyuan 030024, China;[email protected] (W.M.); [email protected] (X.S.)
2 Great Wall Motor Company Limited, Baoding 071000, China; [email protected]* Correspondence: [email protected]
Received: 18 February 2019; Accepted: 20 March 2019; Published: 4 April 2019�����������������
Abstract: At present, it is the conventional inner rotor motor instead of the internal combustionengine that is adopted by most electric cars. However, compared to the traditional centralized drivingpattern, cars adopting a distributed direct driving pattern have higher drive efficiency and morestable handling. Given this background, a kind of direct-drive outer rotor motor with 40 poles and42 slots applied for middle or low speed electric cars was designed. The core of this study includedthe electromagnetic analysis and structural design of the motor. Firstly, the material and dimensionparameters of the stator and rotor were selected and calculated by the traditional method. The air-gaplength and pole-arc coefficient were optimized using an RMxprt module, which was developedusing the equivalent magnetic circuit method. Then, a two-dimensional finite-element model wasestablished using ANSYS Maxwell. The magnetic field and torque characteristics of the model werethen analyzed. Results show that the design of the motor is reasonable. In addition, a method forreducing the torque ripple was proposed and verified by simulation.
Keywords: outer rotor; direct-drive brushless DC motor; structural design; electromagnetic analysis;torque ripple
1. Introduction
In the development of the modern industrial rise today, the automotive industry has become a“bright pearl” of the tech world. However, with the development of the automobile industry, energy isconsumed, and steadily each year more than 60% of the world’s oil resources are consumed by theauto industry [1]. The development of new energy vehicles has become the hotspot of research. In newenergy vehicles, electric vehicles have a become a mainstay in the new energy vehicles because oftheir minimal pollution of the environment, low energy consumption, flexible control, and some otheradvantages. Electric vehicles are listed in China’s 13th five-year plan and have become a key researcharea of the made in China 2025 program; their future development space is enormous [2,3].
There are two driving methods for electric vehicles, which are divided into centralized singlemotor drive and distributed multi-motor drive [4]. In roughly the same driving mode, the centralizeddriving electric vehicle is comparable with the conventional internal combustion engine vehicle.The engine or the electric motor is used as the driving mechanism, and the transmission and thetransmission shaft are used as the transmission mechanism. Thus, the centralized driving systemoccupies a large volume, which result in a small utility space for the vehicle, the energy loss is high,and energy utilization efficiency is low. Compared with the centralized drive, the distributed driveeliminates the intermediate transmission mechanism and places the motor directly in the drive wheel,
World Electric Vehicle Journal 2019, 10, 16; doi:10.3390/wevj10020016 www.mdpi.com/journal/wevj
World Electric Vehicle Journal 2019, 10, 16 2 of 19
saving the space occupied by the engine and reducing the mass of the whole vehicle. At the sametime, the regenerative technology of energy braking can be used. The energy in braking and downhillconditions is recycled and utilized to increase the mileage of electric vehicles [5]. Distributed drivescan be divided into two types: deceleration drive and direct drive [6]. The deceleration drivingmethod drives the motor by integrating the motor and the speed reducer with a certain reductionratio. The technology is relatively simple but widely used, and the wheel drive method adopted by theleader of electric vehicles, Tesla automobiles [7]. The direct drive mode directly drives the car with alow-speed permanent-magnet motor. The permanent-magnet motor is generally an outer rotor type.This type of drive can not only flexibly arrange the drive but can also realize the individual control ofmultiple wheels of the car, as well as vehicle dynamics control technology, such as electronic stabilityprogram (ESP), anti-lock brake system (ABS), and electronic brakeforce distribution (EBD) [8].
In 2007, the team led by S. Ekram [9] optimized the cogging torque and increased torque to designa permanent-magnet brushless outer rotor motor that was designed with air gap length, coggingwidth, and winding turns. In the variable, multi-objective optimization design, the subsequentexperimental comparison shows that the cogging torque fluctuation is obviously suppressed, andthe radial unbalance force is also reduced by 24%, achieving the purpose of optimization. In 2010,Gombert et al. [10] designed a 17-inch hub motor, which could directly replace the hub in the city tram.The experimental results showed that the efficiency of the motor gradually increased as the speedincreased, with the peak efficiency up to 94%, satisfying the standards of passenger vehicles. In 2012,Arnold J. Rix [11] studied the effect of different stator and rotor structures on the performance of thehub motor. By comparing different stator and stator pairs of motors, it was found that the influence ofdifferent pole pairs on winding loss was closely related to the motor speed; the higher the speed, themore obvious the difference. In 2012, K. Emmrich [12] led the team to study the influence of temperatureon the electric wheel drive system. The transient thermal simulation of the motor was carried out.The results showed that the temperature was the main influencing factor on the motor performance.If the temperature exceeded a certain value, magnetic steel demagnetization would threaten drivingsafety. In 2013, Chukwuma Junior [13] designed a new type of hub motor. This motor combinesthe controller inside the motor and divides a controller into eight parts to coordinate the control ofthe motor, improving the control accuracy and making the motor more reliable. In 2014, MsaddekHejra et al. [14] designed and optimized a small permanent-magnet hub motor for vehicles. Afteroptimization, it reduced the quality by 20% and optimized the efficiency by 3.7% and supervised thedesign of permanent-magnet outer rotor motors. Theoretical guidance was given by A. Kock et al. [15]and Tashakori et al. [16], who both studied the fault tolerance of hub motors, and designed the hubmotor drive system to compensate the brake torque when the motor failed. This design method notonly increased the installation space but also suppressed the torque ripple, and the bench test of theredesigned hub motor proved the rationality of its design.
In this study, an outer-rotor brushless DC motor, which can directly drive the electric vehicle, wasdesigned. It deviates from the structure of the traditional electric vehicle drive system. The static andtransient magnetic fields of the motor were analyzed comprehensively to verify the rationality of thedesign. The causes of the torque ripple of the brushless DC motor was analyzed extensively, and themain factor causing the torque ripple was discovered. A segmented stator method was developed toreduce the torque ripple. This method was validated and proved effective by finite-element simulationand harmonic analysis.
2. Design of the Outer-Rotor Direct-Drive Brushless DC Motor
2.1. Design Parameters of the Motor
Taking a certain model of a Geely automobile as the research object, a middle or low speeddirect-drive brushless DC motor with an outer-rotor structure was developed. The design parametersof the Geely automobile are presented in Table 1.
World Electric Vehicle Journal 2019, 10, 16 3 of 19
Table 1. Parameters of a Geely automobile.
A Geely Automobile Technical Parameters Value
Basic parameters
The entire vehicle mass m (kg) 800Windward area A (m2) 2
Coefficient of air resistance CD 0.32Rolling resistance coefficient f 0.015
System transmission efficiency ηT 0.96The wheel radius r (m) 0.27
Performance indexThe maximum speed umax (km/h) 80The maximum gradeability a (◦) 11.30–60 km/h acceleration time ta (s) 9
2.1.1. Determination of Motor Power
The minimum power required by the vehicle according to different working conditions canbe calculated.
When the car achieves the highest speed, the maximum power of the motor is pe, the maximumpower of the vehicle achieving the maximum gradient is pa, and the power of the vehicle achieving thehighest acceleration time is pc.
1. Taking the maximum speed as the basis
pe =umax
3600ηT
(mg f +
CDAu2max
21.15
)(1)
2. Taking the climbing capability as the basis
pa =ui
3600ηT
mg f cosαmax + mg sinαmax +CDAu2
i21.15
(2)
3. Taking the acceleration capability as the basis
pc =1
3600taηT
(δm
u2a
2√
ta+ mg f
ua
1.5ta +
CDAu3a
21.15× 2.5ta
)(3)
where ua is the acceleration final velocity(km/h), and δ is the mass conversion coefficient whosevalue is 1.04.
Furthermore, the motor’s power is deduced as
p ≥ max[pe, pa, pc] (4)
2.1.2. Determination of the Rated Speed and Peak Speed
The design is based on the maximum speed of 80 km/h. Due to the use of an outer–rotor structure,the motor speed is equal to the wheel speed; the maximum speed nmax of the motor is deduced as
nmax ≥umax × 103
120πr(5)
The relationship between the rated speed and the maximum speed of the motor is deduced as
nmax = βnN (6)
where β is the expanded constant power meter coefficient; the larger the β is, the greater the outputtorque of the motor will be, and the better the acceleration and climbing performance of the electric
World Electric Vehicle Journal 2019, 10, 16 4 of 19
vehicle will be. However, if it is too large, the size of the power converter is large accordingly.Comprehensively, its range is 2 to 4.
According to the above formula, all parameters can be substituted to calculate the designparameters of the brushless DC motor, such as torque, power, and speed, as shown in Table 2.
Table 2. Design requirements of the brushless DC motor.
Parameters Value
Rated power pN = 22kw
Peak power pmax = 55kw
Rated speed nN = 260r/min
Maximum speed nmax = 780r/min
Rated torque TN = 2.02 kN ·m
Phase number M = 3
Efficiency η ≥ 85%
Permanent magnet material N35SH
2.2. Main Dimensions of the Motor and Electromagnetic Load
The main dimensions of the motor include the diameter of the armature and the effective length ofthe armature core. In addition, the energy conversion process of the motor is completed in the air gap;thus, the air-gap length can be considered the third main dimension of the motor [17]. The calculationand optimization of the main dimensions is a crucial step in the process of motor design.
The electromagnetic load comprises the electrical load A and magnetic load Bδ of the motor, whichare closely related to the main dimensions of the motor. These loads exert a significant influence on themechanical characteristics, efficiency, torque, and other performance parameters of the motor. Therelation between the main dimensions of the motor and the electromagnetic load is deduced as
D2aLa =
6.1× 10⁷
αpABδ·
Pem
nN(7)
where Da is the armature diameter (cm), La is the length of the stator core (cm), αp is the pole-arccoefficient whose initial value is 0.7, A is the electrical load set to 300 A/cm in this study, and Bδ is themagnetic load set to 0.96 T.
Substituting the given parameters into Equation (7) yields D2aLa = 67844.78cm3.
The outer rotor will distort under stress given that the electric vehicle drive system is replacedby the outer-rotor direct-drive permanent-magnet brushless DC motor. Setting the dimension of theair-gap inappropriately small may induce friction between the outer rotor and the stator. This outcomeshould be avoided. Therefore, the air-gap dimension should be sufficiently large. In this study, itsinitial value is set to 1 mm.
2.3. Design of the Stator and Rotor of the Motor
2.3.1. Dimensions of the Stator and Rotor
Based on an appointed car, the outer diameter of the motor rotor is set to 500 mm. The stabilityof the running electric vehicle is directly affected when the outer-rotor motor distorts under tension.Thus, the thickness of the rotor core of the motor should be increased, and its initial value is set to12 mm in this design. The inner diameter of the outer rotor, including the permanent magnet, canbe calculated by Equation (8). The outer diameter of the stator can be obtained by subtracting the
World Electric Vehicle Journal 2019, 10, 16 5 of 19
air-gap dimension twice, such that the armature diameter is 462 mm, which is then substituted intoD2
aLa = 67844.78cm3 to obtain La = 317.86 mm.
DRi = DRo − 2(hm + hR) (8)
where DRi is inner diameter of the outer rotor, DRo is the outer diameter of the outer rotor, hm is thethickness of the permanent magnet (hm = 6 mm), and hR is the thickness of rotor core.
2.3.2. Determination of the Armature Winding
The pole number should be increased when the brushless DC motor runs at a middle or low speed.The pole number is set to 40 on the basis of the rated speed of the motor. If the integral-slot windingis adopted, then the tooth-slot number of the three-phase brushless DC motor should be at least at120. Fractional-slot winding is more suitable given the outer diameter of the motor. The fractional-slotwinding structure can significantly reduce not only the tooth-slot number but also the cogging torque.The connection diagram of the three-phase winding of the motor is illustrated in Figure 1.
World Electric Vehicle Journal 2019, 10, 16 5 of 18
gap dimension twice, such that the armature diameter is 462 mm, which is then substituted into 2 3
a a =67844.78cmD Lto obtain La = 317.86 mm.
Ri Ro m R-2 +D D h h= ( ) (8)
where RiD is inner diameter of the outer rotor, RoD is the outer diameter of the outer rotor, mh is
the thickness of the permanent magnet ( mh = 6 mm), and Rh is the thickness of rotor core.
2.3.2. Determination of the Armature Winding
The pole number should be increased when the brushless DC motor runs at a middle or low
speed. The pole number is set to 40 on the basis of the rated speed of the motor. If the integral-slot
winding is adopted, then the tooth-slot number of the three-phase brushless DC motor should be at
least at 120. Fractional-slot winding is more suitable given the outer diameter of the motor. The
fractional-slot winding structure can significantly reduce not only the tooth-slot number but also the
cogging torque. The connection diagram of the three-phase winding of the motor is illustrated in
Figure 1.
Figure 1. Connection diagram of three-phase windings.
2.3.3. Parameter Optimization Based on the Equivalent Magnetic Circuit Method
After the dimension and material parameters of the motor are determined, the initial parameters
should be optimized by magnetic circuit calculation. The magnetic circuit calculation software
RMxprt, which is based on the equivalent magnetic circuit method, can directly import the analysis
data into ANSYS Maxwell to generate a 2D or 3D motor model [18]. Therefore, optimizing the key
parameters of the motor using RMxprt software lays the foundation for the subsequent finite-element
simulation of the motor magnetic field and performance analysis.
Optimization of the Air-Gap Length
As mentioned in Section 2.2, the air-gap length can be considered the third main dimension of
the motor, and its value exerts a significant influence on the performance of the brushless DC motor.
On the condition that the dimensions of the other parameters of the motor are invariable, the air-gap
length is optimized by varying its value from 1 mm to 4 mm at a step length of 0.02 mm. The curves
of motor efficiency and torque with respect to the air-gap length are presented in Figures 2 and 3,
respectively.
Figure 1. Connection diagram of three-phase windings.
2.3.3. Parameter Optimization Based on the Equivalent Magnetic Circuit Method
After the dimension and material parameters of the motor are determined, the initial parametersshould be optimized by magnetic circuit calculation. The magnetic circuit calculation software RMxprt,which is based on the equivalent magnetic circuit method, can directly import the analysis data intoANSYS Maxwell to generate a 2D or 3D motor model [18]. Therefore, optimizing the key parametersof the motor using RMxprt software lays the foundation for the subsequent finite-element simulationof the motor magnetic field and performance analysis.
Optimization of the Air-Gap Length
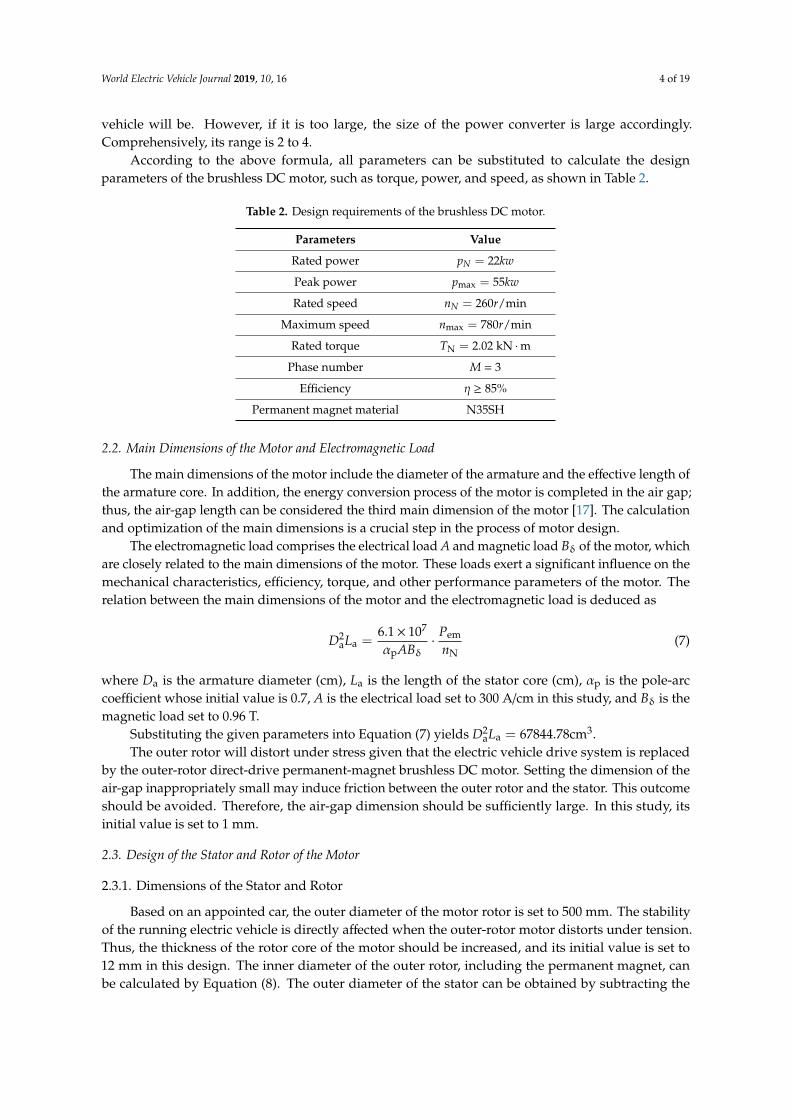
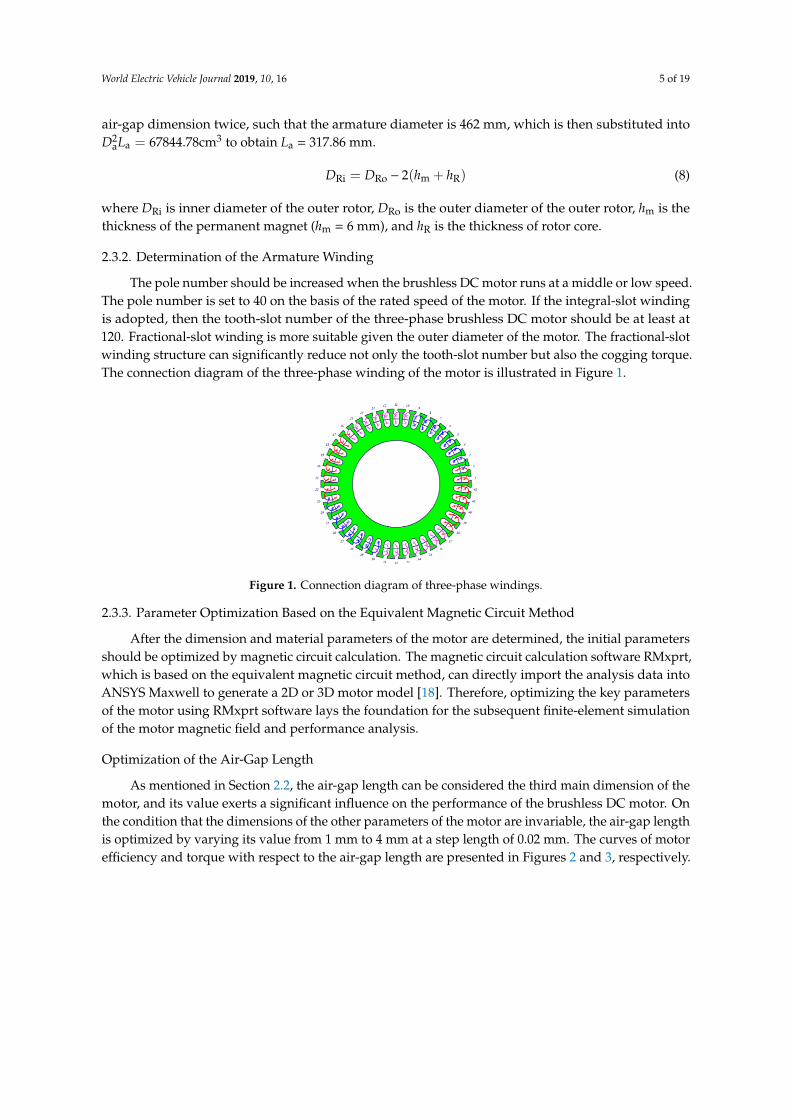
As mentioned in Section 2.2, the air-gap length can be considered the third main dimension of themotor, and its value exerts a significant influence on the performance of the brushless DC motor. Onthe condition that the dimensions of the other parameters of the motor are invariable, the air-gap lengthis optimized by varying its value from 1 mm to 4 mm at a step length of 0.02 mm. The curves of motorefficiency and torque with respect to the air-gap length are presented in Figures 2 and 3, respectively.
World Electric Vehicle Journal 2019, 10, 16 6 of 19World Electric Vehicle Journal 2019, 10, 16 6 of 18
1.0 1.5 2.0 2.5 3.0 3.5 4.0
84
86
88
90
92
94
96
Air-gap length(mm)
Eff
icie
ncy
Figure 2. Relation curve between air-gap length and efficiency.
1.0 1.5 2.0 2.5 3.0 3.5 4.0
1.950
1.975
2.000
2.025
2.050
Rate
d t
orq
ue(k
Nm
)
Air-gap length(mm)
Figure 3. Relation curve between air-gap length and rated torque.
In consideration of the efficiency and torque of the motor as well as the practical application of
the design motor, the air-gap length should be increased to 2 mm, which not only guarantees the
efficiency of the motor but also improves the running reliability of the motor. Consequently, the
excessive deformation of the outer-rotor motor under stress, the friction between the outer rotor and
the stator, and the further damage to the motor can be prevented.
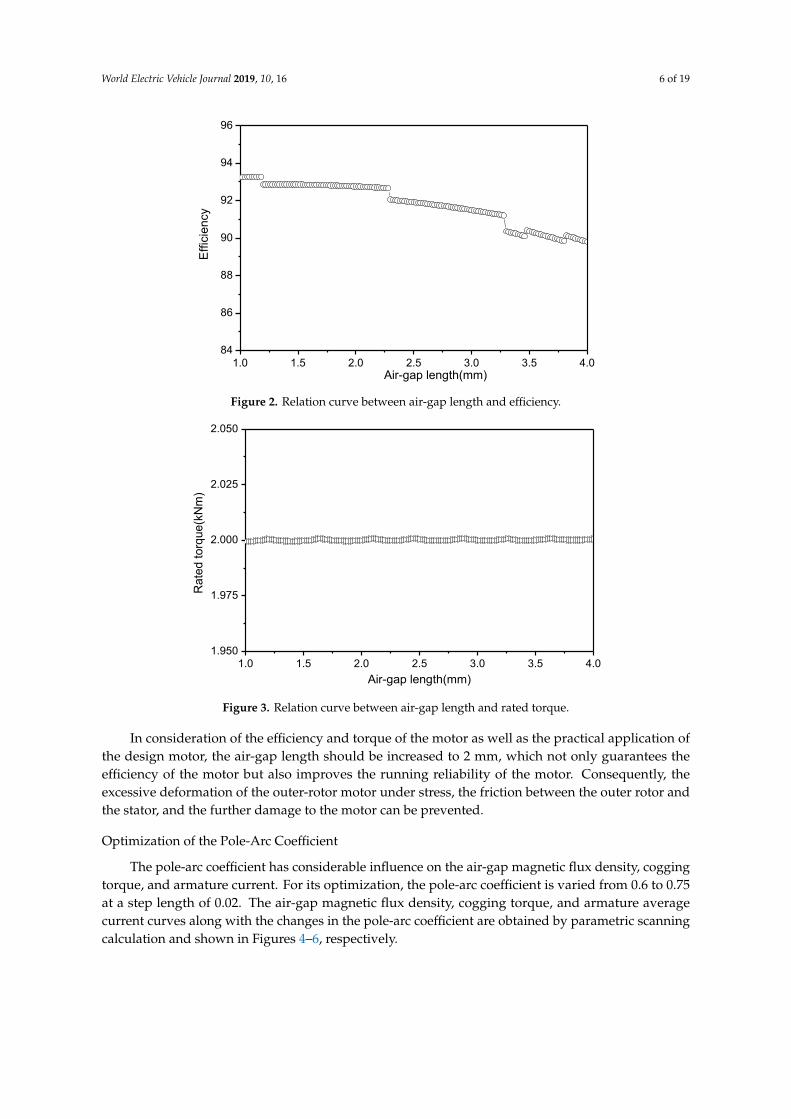
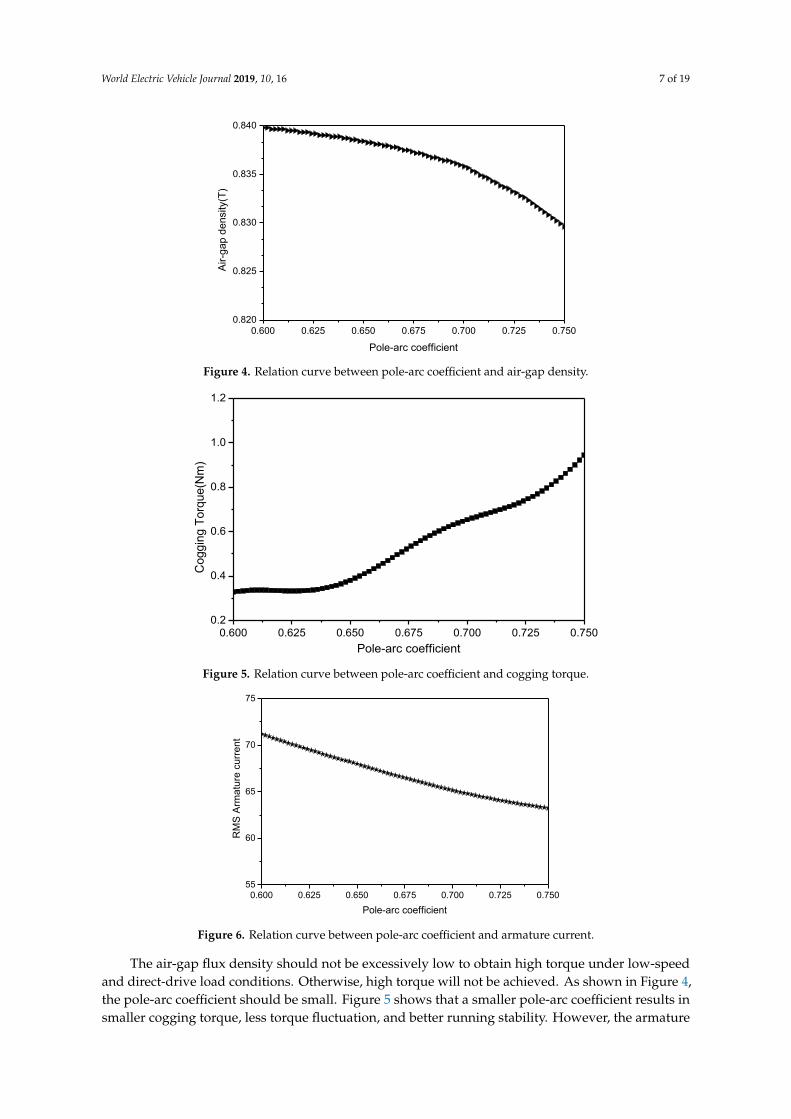
Optimization of the Pole-Arc Coefficient
The pole-arc coefficient has considerable influence on the air-gap magnetic flux density, cogging
torque, and armature current. For its optimization, the pole-arc coefficient is varied from 0.6 to 0.75
at a step length of 0.02. The air-gap magnetic flux density, cogging torque, and armature average
current curves along with the changes in the pole-arc coefficient are obtained by parametric scanning
calculation and shown in Figures 4–6, respectively.
Figure 2. Relation curve between air-gap length and efficiency.
World Electric Vehicle Journal 2019, 10, 16 6 of 18
1.0 1.5 2.0 2.5 3.0 3.5 4.0
84
86
88
90
92
94
96
Air-gap length(mm)
Eff
icie
ncy
Figure 2. Relation curve between air-gap length and efficiency.
1.0 1.5 2.0 2.5 3.0 3.5 4.0
1.950
1.975
2.000
2.025
2.050
Rate
d t
orq
ue(k
Nm
)
Air-gap length(mm)
Figure 3. Relation curve between air-gap length and rated torque.
In consideration of the efficiency and torque of the motor as well as the practical application of
the design motor, the air-gap length should be increased to 2 mm, which not only guarantees the
efficiency of the motor but also improves the running reliability of the motor. Consequently, the
excessive deformation of the outer-rotor motor under stress, the friction between the outer rotor and
the stator, and the further damage to the motor can be prevented.
Optimization of the Pole-Arc Coefficient
The pole-arc coefficient has considerable influence on the air-gap magnetic flux density, cogging
torque, and armature current. For its optimization, the pole-arc coefficient is varied from 0.6 to 0.75
at a step length of 0.02. The air-gap magnetic flux density, cogging torque, and armature average
current curves along with the changes in the pole-arc coefficient are obtained by parametric scanning
calculation and shown in Figures 4–6, respectively.
Figure 3. Relation curve between air-gap length and rated torque.
In consideration of the efficiency and torque of the motor as well as the practical application ofthe design motor, the air-gap length should be increased to 2 mm, which not only guarantees theefficiency of the motor but also improves the running reliability of the motor. Consequently, theexcessive deformation of the outer-rotor motor under stress, the friction between the outer rotor andthe stator, and the further damage to the motor can be prevented.
Optimization of the Pole-Arc Coefficient
The pole-arc coefficient has considerable influence on the air-gap magnetic flux density, coggingtorque, and armature current. For its optimization, the pole-arc coefficient is varied from 0.6 to 0.75at a step length of 0.02. The air-gap magnetic flux density, cogging torque, and armature averagecurrent curves along with the changes in the pole-arc coefficient are obtained by parametric scanningcalculation and shown in Figures 4–6, respectively.
World Electric Vehicle Journal 2019, 10, 16 7 of 19World Electric Vehicle Journal 2019, 10, 16 7 of 18
0.600 0.625 0.650 0.675 0.700 0.725 0.750
0.820
0.825
0.830
0.835
0.840
Air
-gap d
ensity(T
)
Pole-arc coefficient
Figure 4. Relation curve between pole-arc coefficient and air-gap density.
0.600 0.625 0.650 0.675 0.700 0.725 0.750
0.2
0.4
0.6
0.8
1.0
1.2
Coggin
g T
orq
ue(N
m)
Pole-arc coefficient
Figure 5. Relation curve between pole-arc coefficient and cogging torque.
0.600 0.625 0.650 0.675 0.700 0.725 0.750
55
60
65
70
75
RM
S A
rmatu
re c
urr
ent
Pole-arc coefficient
Figure 6. Relation curve between pole-arc coefficient and armature current.
The air-gap flux density should not be excessively low to obtain high torque under low-speed
and direct-drive load conditions. Otherwise, high torque will not be achieved. As shown in Figure 4,
the pole-arc coefficient should be small. Figure 5 shows that a smaller pole-arc coefficient results in
Figure 4. Relation curve between pole-arc coefficient and air-gap density.
World Electric Vehicle Journal 2019, 10, 16 7 of 18
0.600 0.625 0.650 0.675 0.700 0.725 0.750
0.820
0.825
0.830
0.835
0.840
Air
-gap d
ensity(T
)
Pole-arc coefficient
Figure 4. Relation curve between pole-arc coefficient and air-gap density.
0.600 0.625 0.650 0.675 0.700 0.725 0.750
0.2
0.4
0.6
0.8
1.0
1.2
Coggin
g T
orq
ue(N
m)
Pole-arc coefficient
Figure 5. Relation curve between pole-arc coefficient and cogging torque.
0.600 0.625 0.650 0.675 0.700 0.725 0.750
55
60
65
70
75
RM
S A
rmatu
re c
urr
ent
Pole-arc coefficient
Figure 6. Relation curve between pole-arc coefficient and armature current.
The air-gap flux density should not be excessively low to obtain high torque under low-speed
and direct-drive load conditions. Otherwise, high torque will not be achieved. As shown in Figure 4,
the pole-arc coefficient should be small. Figure 5 shows that a smaller pole-arc coefficient results in
Figure 5. Relation curve between pole-arc coefficient and cogging torque.
World Electric Vehicle Journal 2019, 10, 16 7 of 18
0.600 0.625 0.650 0.675 0.700 0.725 0.750
0.820
0.825
0.830
0.835
0.840
Air
-gap d
ensity(T
)
Pole-arc coefficient
Figure 4. Relation curve between pole-arc coefficient and air-gap density.
0.600 0.625 0.650 0.675 0.700 0.725 0.750
0.2
0.4
0.6
0.8
1.0
1.2
Coggin
g T
orq
ue(N
m)
Pole-arc coefficient
Figure 5. Relation curve between pole-arc coefficient and cogging torque.
0.600 0.625 0.650 0.675 0.700 0.725 0.750
55
60
65
70
75
RM
S A
rmatu
re c
urr
ent
Pole-arc coefficient
Figure 6. Relation curve between pole-arc coefficient and armature current.
The air-gap flux density should not be excessively low to obtain high torque under low-speed
and direct-drive load conditions. Otherwise, high torque will not be achieved. As shown in Figure 4,
the pole-arc coefficient should be small. Figure 5 shows that a smaller pole-arc coefficient results in
Figure 6. Relation curve between pole-arc coefficient and armature current.
The air-gap flux density should not be excessively low to obtain high torque under low-speedand direct-drive load conditions. Otherwise, high torque will not be achieved. As shown in Figure 4,the pole-arc coefficient should be small. Figure 5 shows that a smaller pole-arc coefficient results insmaller cogging torque, less torque fluctuation, and better running stability. However, the armature

World Electric Vehicle Journal 2019, 10, 16 8 of 19
winding current is already high when the motor is running under low-speed high-torque conditions.Figure 6 shows that the armature winding current increases, and permanent-magnet demagnetizationis enhanced if the pole-arc coefficient takes a smaller value. As a result, the overheating problem of themotor becomes more severe, and the performance of the permanent magnet is affected, easily leadingto permanent demagnetization and permanent damage to the rotor magnetic pole. On the basis of thepossible outcomes and the three generated curves, the pole-arc coefficient is adjusted to 0.675, whichnot only guarantees an increase in the motor magnetic flux density and a decrease in the coggingtorque to a certain extent but also ensures that the average current of the armature winding does notexcessively increase.
2.3.4. Structural Design of the Motor Stator and Rotor
The structure of the brushless DC motor is designed using the optimized parameters. The motorstructure includes the mechanical structures of the stator, rotor, wheel hub, and fixed axis.
Mechanical Structure of the Stator
The dimensions of the low-speed brushless DC motor are larger than an ordinary motor; thus, ifthe traditional manufacturing method is adopted, then the original manufacturing tools should beupgraded, and the production costs will increase. The coil pitch of the motor is only one, that is, thecoil span is a stator tooth when the fractional-slot concentrated winding is adopted. Therefore, thestructure of the stator core can be designed as a multimodule spliced type, in which every stator toothis used as a module with a separate winding coil. Every module can be manufactured separatelyand then assembled after winding each coil module. This process reduces the difficulty in winding,improves the coil space factor, and increases the output torque of the motor.
The stator core is spliced by 42 stator tooth modules, which are connected together by the coreskeleton, as shown in Figure 7. A core retaining ring is set at each end of the core skeleton andconnected to the core skeleton with a bolt to prevent the single stator tooth module from coming off.The assembly drawing of the entire stator structure is shown in Figure 8.
World Electric Vehicle Journal 2019, 10, 16 8 of 18
smaller cogging torque, less torque fluctuation, and better running stability. However, the armature
winding current is already high when the motor is running under low-speed high-torque conditions.
Figure 6 shows that the armature winding current increases, and permanent-magnet
demagnetization is enhanced if the pole-arc coefficient takes a smaller value. As a result, the
overheating problem of the motor becomes more severe, and the performance of the permanent
magnet is affected, easily leading to permanent demagnetization and permanent damage to the rotor
magnetic pole. On the basis of the possible outcomes and the three generated curves, the pole-arc
coefficient is adjusted to 0.675, which not only guarantees an increase in the motor magnetic flux
density and a decrease in the cogging torque to a certain extent but also ensures that the average
current of the armature winding does not excessively increase.
2.3.4. Structural Design of the Motor Stator and Rotor
The structure of the brushless DC motor is designed using the optimized parameters. The motor
structure includes the mechanical structures of the stator, rotor, wheel hub, and fixed axis.
Mechanical Structure of the Stator
The dimensions of the low-speed brushless DC motor are larger than an ordinary motor; thus,
if the traditional manufacturing method is adopted, then the original manufacturing tools should be
upgraded, and the production costs will increase. The coil pitch of the motor is only one, that is, the
coil span is a stator tooth when the fractional-slot concentrated winding is adopted. Therefore, the
structure of the stator core can be designed as a multimodule spliced type, in which every stator tooth
is used as a module with a separate winding coil. Every module can be manufactured separately and
then assembled after winding each coil module. This process reduces the difficulty in winding,
improves the coil space factor, and increases the output torque of the motor.
The stator core is spliced by 42 stator tooth modules, which are connected together by the core
skeleton, as shown in Figure 7. A core retaining ring is set at each end of the core skeleton and
connected to the core skeleton with a bolt to prevent the single stator tooth module from coming off.
The assembly drawing of the entire stator structure is shown in Figure 8.
Figure 7. Connection diagram of single-tooth and core skeleton.
Figure 8. Multi-module spliced type stator structure.
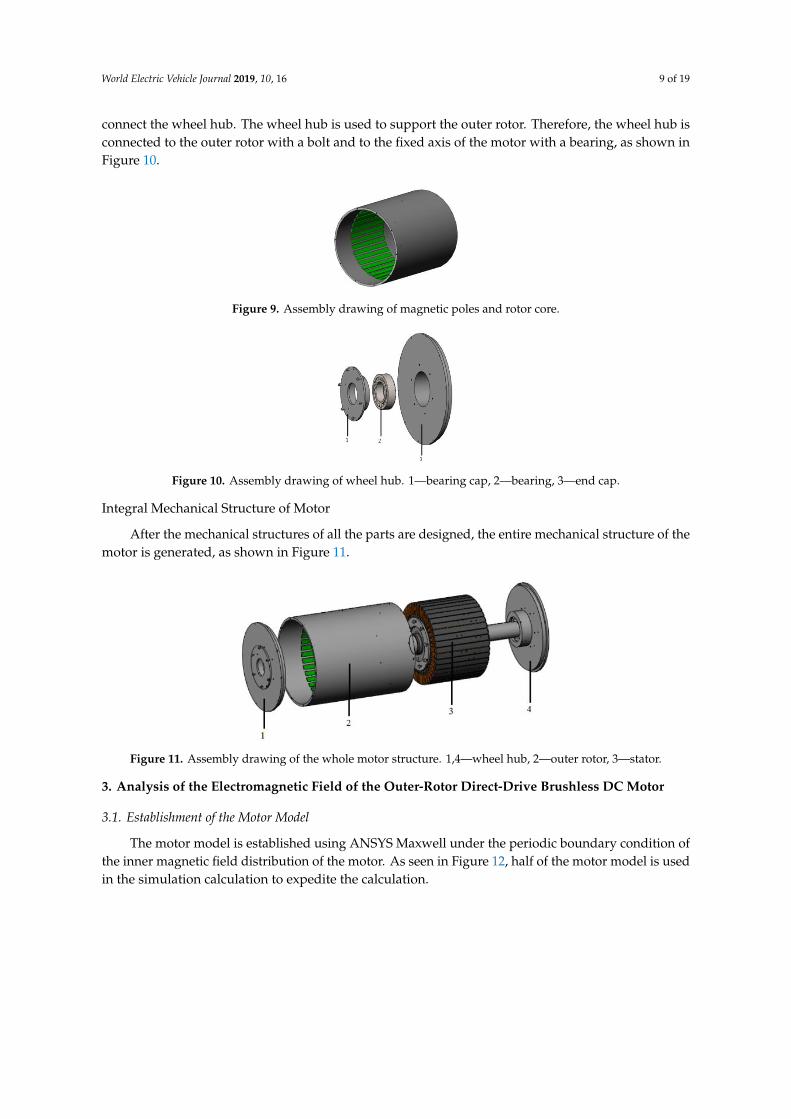
Mechanical Structure of the Rotor
The mechanical structure of the rotor is relatively simple. It is mainly composed of the magnetic
pole, rotor core, and wheel hub. The magnetic pole is attached to the inner surface of the rotor core,
as shown in Figure 9. The threaded holes are machined at each end of the rotor core, which are used
Figure 7. Connection diagram of single-tooth and core skeleton.
World Electric Vehicle Journal 2019, 10, 16 8 of 18
smaller cogging torque, less torque fluctuation, and better running stability. However, the armature
winding current is already high when the motor is running under low-speed high-torque conditions.
Figure 6 shows that the armature winding current increases, and permanent-magnet
demagnetization is enhanced if the pole-arc coefficient takes a smaller value. As a result, the
overheating problem of the motor becomes more severe, and the performance of the permanent
magnet is affected, easily leading to permanent demagnetization and permanent damage to the rotor
magnetic pole. On the basis of the possible outcomes and the three generated curves, the pole-arc
coefficient is adjusted to 0.675, which not only guarantees an increase in the motor magnetic flux
density and a decrease in the cogging torque to a certain extent but also ensures that the average
current of the armature winding does not excessively increase.
2.3.4. Structural Design of the Motor Stator and Rotor
The structure of the brushless DC motor is designed using the optimized parameters. The motor
structure includes the mechanical structures of the stator, rotor, wheel hub, and fixed axis.
Mechanical Structure of the Stator
The dimensions of the low-speed brushless DC motor are larger than an ordinary motor; thus,
if the traditional manufacturing method is adopted, then the original manufacturing tools should be
upgraded, and the production costs will increase. The coil pitch of the motor is only one, that is, the
coil span is a stator tooth when the fractional-slot concentrated winding is adopted. Therefore, the
structure of the stator core can be designed as a multimodule spliced type, in which every stator tooth
is used as a module with a separate winding coil. Every module can be manufactured separately and
then assembled after winding each coil module. This process reduces the difficulty in winding,
improves the coil space factor, and increases the output torque of the motor.
The stator core is spliced by 42 stator tooth modules, which are connected together by the core
skeleton, as shown in Figure 7. A core retaining ring is set at each end of the core skeleton and
connected to the core skeleton with a bolt to prevent the single stator tooth module from coming off.
The assembly drawing of the entire stator structure is shown in Figure 8.
Figure 7. Connection diagram of single-tooth and core skeleton.
Figure 8. Multi-module spliced type stator structure.
Mechanical Structure of the Rotor
The mechanical structure of the rotor is relatively simple. It is mainly composed of the magnetic
pole, rotor core, and wheel hub. The magnetic pole is attached to the inner surface of the rotor core,
as shown in Figure 9. The threaded holes are machined at each end of the rotor core, which are used
Figure 8. Multi-module spliced type stator structure.
Mechanical Structure of the Rotor
The mechanical structure of the rotor is relatively simple. It is mainly composed of the magneticpole, rotor core, and wheel hub. The magnetic pole is attached to the inner surface of the rotor core, asshown in Figure 9. The threaded holes are machined at each end of the rotor core, which are used to
World Electric Vehicle Journal 2019, 10, 16 9 of 19
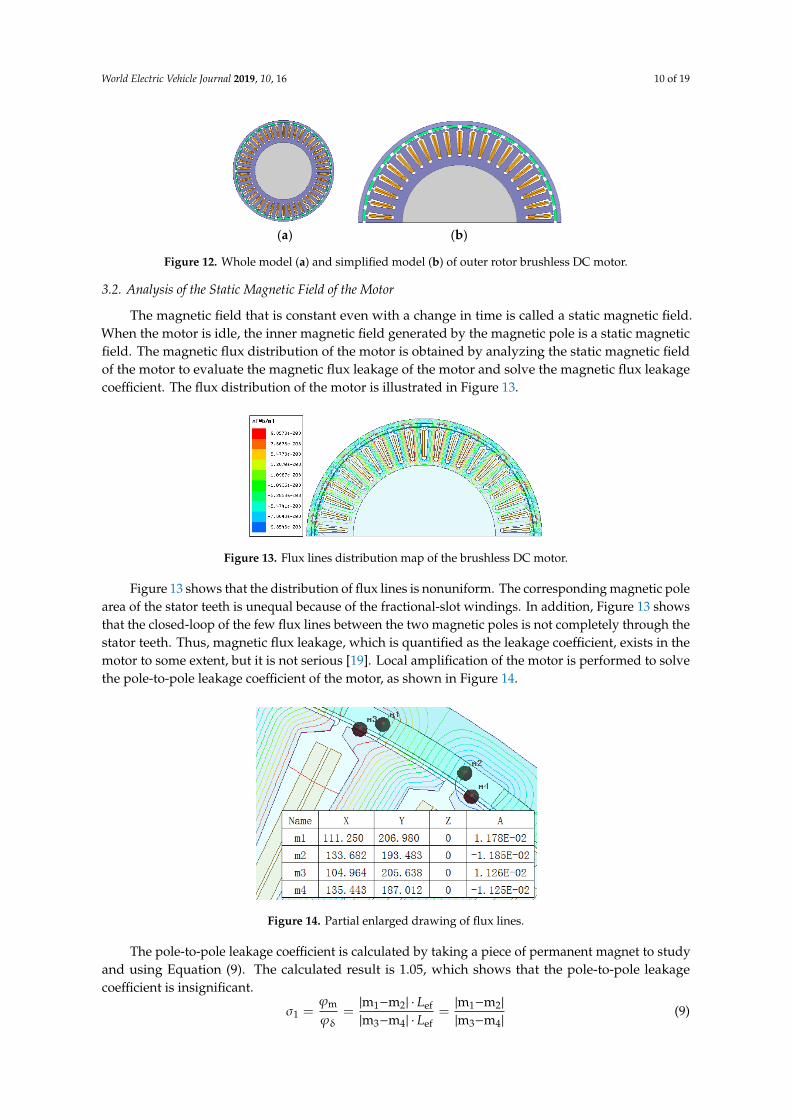
connect the wheel hub. The wheel hub is used to support the outer rotor. Therefore, the wheel hub isconnected to the outer rotor with a bolt and to the fixed axis of the motor with a bearing, as shown inFigure 10.
World Electric Vehicle Journal 2019, 10, 16 9 of 18
to connect the wheel hub. The wheel hub is used to support the outer rotor. Therefore, the wheel hub
is connected to the outer rotor with a bolt and to the fixed axis of the motor with a bearing, as shown
in Figure 10.
Figure 9. Assembly drawing of magnetic poles and rotor core.
Figure 10. Assembly drawing of wheel hub. 1—bearing cap, 2—bearing, 3—end cap.
Integral Mechanical Structure of Motor
After the mechanical structures of all the parts are designed, the entire mechanical structure of
the motor is generated, as shown in Figure 11.
Figure 11. Assembly drawing of the whole motor structure. 1,4—wheel hub, 2—outer rotor, 3—
stator.
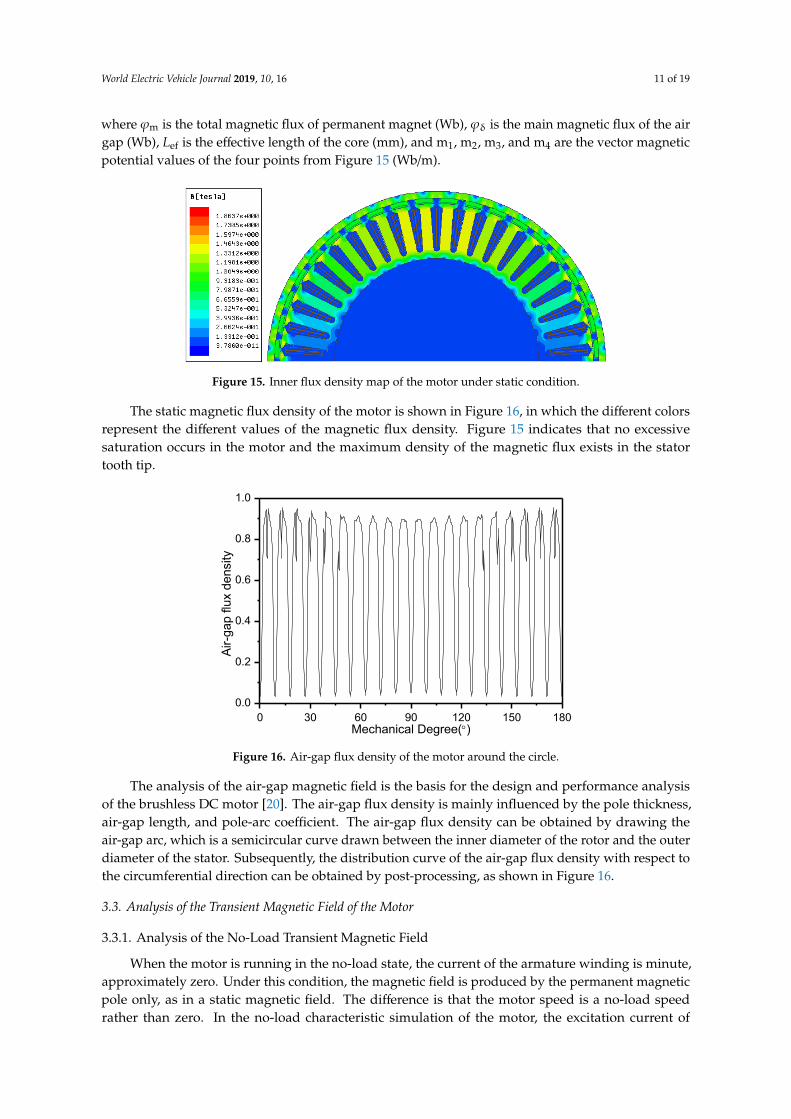
3. Analysis of the Electromagnetic Field of the Outer-Rotor Direct-Drive Brushless DC Motor
3.1. Establishment of the Motor Model
The motor model is established using ANSYS Maxwell under the periodic boundary condition
of the inner magnetic field distribution of the motor. As seen in Figure 12, half of the motor model is
used in the simulation calculation to expedite the calculation.
(a) (b)
Figure 9. Assembly drawing of magnetic poles and rotor core.
World Electric Vehicle Journal 2019, 10, 16 9 of 18
to connect the wheel hub. The wheel hub is used to support the outer rotor. Therefore, the wheel hub
is connected to the outer rotor with a bolt and to the fixed axis of the motor with a bearing, as shown
in Figure 10.
Figure 9. Assembly drawing of magnetic poles and rotor core.
Figure 10. Assembly drawing of wheel hub. 1—bearing cap, 2—bearing, 3—end cap.
Integral Mechanical Structure of Motor
After the mechanical structures of all the parts are designed, the entire mechanical structure of
the motor is generated, as shown in Figure 11.
Figure 11. Assembly drawing of the whole motor structure. 1,4—wheel hub, 2—outer rotor, 3—
stator.
3. Analysis of the Electromagnetic Field of the Outer-Rotor Direct-Drive Brushless DC Motor
3.1. Establishment of the Motor Model
The motor model is established using ANSYS Maxwell under the periodic boundary condition
of the inner magnetic field distribution of the motor. As seen in Figure 12, half of the motor model is
used in the simulation calculation to expedite the calculation.
(a) (b)
Figure 10. Assembly drawing of wheel hub. 1—bearing cap, 2—bearing, 3—end cap.
Integral Mechanical Structure of Motor
After the mechanical structures of all the parts are designed, the entire mechanical structure of themotor is generated, as shown in Figure 11.
World Electric Vehicle Journal 2019, 10, 16 9 of 18
to connect the wheel hub. The wheel hub is used to support the outer rotor. Therefore, the wheel hub
is connected to the outer rotor with a bolt and to the fixed axis of the motor with a bearing, as shown
in Figure 10.
Figure 9. Assembly drawing of magnetic poles and rotor core.
Figure 10. Assembly drawing of wheel hub. 1—bearing cap, 2—bearing, 3—end cap.
Integral Mechanical Structure of Motor
After the mechanical structures of all the parts are designed, the entire mechanical structure of
the motor is generated, as shown in Figure 11.
Figure 11. Assembly drawing of the whole motor structure. 1,4—wheel hub, 2—outer rotor, 3—
stator.
3. Analysis of the Electromagnetic Field of the Outer-Rotor Direct-Drive Brushless DC Motor
3.1. Establishment of the Motor Model
The motor model is established using ANSYS Maxwell under the periodic boundary condition
of the inner magnetic field distribution of the motor. As seen in Figure 12, half of the motor model is
used in the simulation calculation to expedite the calculation.
(a) (b)
Figure 11. Assembly drawing of the whole motor structure. 1,4—wheel hub, 2—outer rotor, 3—stator.
3. Analysis of the Electromagnetic Field of the Outer-Rotor Direct-Drive Brushless DC Motor
3.1. Establishment of the Motor Model
The motor model is established using ANSYS Maxwell under the periodic boundary condition ofthe inner magnetic field distribution of the motor. As seen in Figure 12, half of the motor model is usedin the simulation calculation to expedite the calculation.
World Electric Vehicle Journal 2019, 10, 16 10 of 19
World Electric Vehicle Journal 2019, 10, 16 9 of 18
to connect the wheel hub. The wheel hub is used to support the outer rotor. Therefore, the wheel hub
is connected to the outer rotor with a bolt and to the fixed axis of the motor with a bearing, as shown
in Figure 10.
Figure 9. Assembly drawing of magnetic poles and rotor core.
Figure 10. Assembly drawing of wheel hub. 1—bearing cap, 2—bearing, 3—end cap.
Integral Mechanical Structure of Motor
After the mechanical structures of all the parts are designed, the entire mechanical structure of
the motor is generated, as shown in Figure 11.
Figure 11. Assembly drawing of the whole motor structure. 1,4—wheel hub, 2—outer rotor, 3—
stator.
3. Analysis of the Electromagnetic Field of the Outer-Rotor Direct-Drive Brushless DC Motor
3.1. Establishment of the Motor Model
The motor model is established using ANSYS Maxwell under the periodic boundary condition
of the inner magnetic field distribution of the motor. As seen in Figure 12, half of the motor model is
used in the
(a) (b)
Figure 12. Whole model (a) and simplified model (b) of outer rotor brushless DC motor.
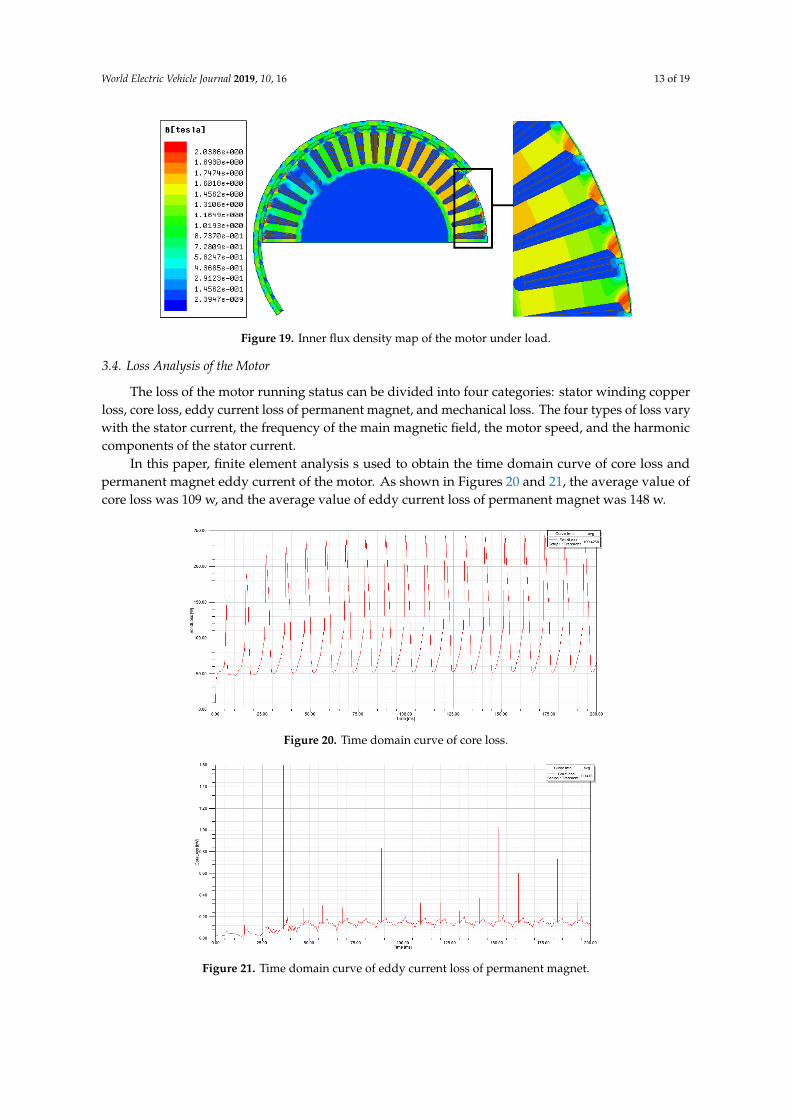
3.2. Analysis of the Static Magnetic Field of the Motor
The magnetic field that is constant even with a change in time is called a static magnetic field.When the motor is idle, the inner magnetic field generated by the magnetic pole is a static magneticfield. The magnetic flux distribution of the motor is obtained by analyzing the static magnetic fieldof the motor to evaluate the magnetic flux leakage of the motor and solve the magnetic flux leakagecoefficient. The flux distribution of the motor is illustrated in Figure 13.
World Electric Vehicle Journal 2019, 10, 16 10 of 18
Figure 12. Whole model (a) and simplified model (b) of outer rotor brushless DC motor.
3.2. Analysis of the Static Magnetic Field of the Motor
The magnetic field that is constant even with a change in time is called a static magnetic field.
When the motor is idle, the inner magnetic field generated by the magnetic pole is a static magnetic
field. The magnetic flux distribution of the motor is obtained by analyzing the static magnetic field
of the motor to evaluate the magnetic flux leakage of the motor and solve the magnetic flux leakage
coefficient. The flux distribution of the motor is illustrated in Figure 13.
Figure 13. Flux lines distribution map of the brushless DC motor.
Figure 13 shows that the distribution of flux lines is nonuniform. The corresponding magnetic
pole area of the stator teeth is unequal because of the fractional-slot windings. In addition, Figure 13
shows that the closed-loop of the few flux lines between the two magnetic poles is not completely
through the stator teeth. Thus, magnetic flux leakage, which is quantified as the leakage coefficient,
exists in the motor to some extent, but it is not serious [19]. Local amplification of the motor is
performed to solve the pole-to-pole leakage coefficient of the motor, as shown in Figure 14.
Figure 14. Partial enlarged drawing of flux lines.
The pole-to-pole leakage coefficient is calculated by taking a piece of permanent magnet to study
and using Equation (9). The calculated result is 1.05, which shows that the pole-to-pole leakage
coefficient is insignificant.
1 2 ef 1 2m1
δ 3 4 ef 3 4
m -m m -m= = =
m -m m -m
L
L
(9)
where m is the total magnetic flux of permanent magnet (Wb), δ is the main magnetic flux of the
air gap (Wb), efL is the effective length of the core (mm), and m1, m2, m3, and m4 are the vector
magnetic potential values of the four points from Figure 15 (Wb/m).
The static magnetic flux density of the motor is shown in Figure 16, in which the different colors
represent the different values of the magnetic flux density. Figure 15 indicates that no excessive
saturation occurs in the motor and the maximum density of the magnetic flux exists in the stator tooth
tip.
Figure 13. Flux lines distribution map of the brushless DC motor.
Figure 13 shows that the distribution of flux lines is nonuniform. The corresponding magnetic polearea of the stator teeth is unequal because of the fractional-slot windings. In addition, Figure 13 showsthat the closed-loop of the few flux lines between the two magnetic poles is not completely through thestator teeth. Thus, magnetic flux leakage, which is quantified as the leakage coefficient, exists in themotor to some extent, but it is not serious [19]. Local amplification of the motor is performed to solvethe pole-to-pole leakage coefficient of the motor, as shown in Figure 14.
World Electric Vehicle Journal 2019, 10, 16 10 of 18
Figure 12. Whole model (a) and simplified model (b) of outer rotor brushless DC motor.
3.2. Analysis of the Static Magnetic Field of the Motor
The magnetic field that is constant even with a change in time is called a static magnetic field.
When the motor is idle, the inner magnetic field generated by the magnetic pole is a static magnetic
field. The magnetic flux distribution of the motor is obtained by analyzing the static magnetic field
of the motor to evaluate the magnetic flux leakage of the motor and solve the magnetic flux leakage
coefficient. The flux distribution of the motor is illustrated in Figure 13.
Figure 13. Flux lines distribution map of the brushless DC motor.
Figure 13 shows that the distribution of flux lines is nonuniform. The corresponding magnetic
pole area of the stator teeth is unequal because of the fractional-slot windings. In addition, Figure 13
shows that the closed-loop of the few flux lines between the two magnetic poles is not completely
through the stator teeth. Thus, magnetic flux leakage, which is quantified as the leakage coefficient,
exists in the motor to some extent, but it is not serious [19]. Local amplification of the motor is
performed to solve the
Figure 14. Partial enlarged drawing of flux lines.
The pole-to-pole leakage coefficient is calculated by taking a piece of permanent magnet to study
and using Equation (9). The calculated result is 1.05, which shows that the pole-to-pole leakage
coefficient is insignificant.
1 2 ef 1 2m1
δ 3 4 ef 3 4
m -m m -m= = =
m -m m -m
L
L
(9)
where m is the total magnetic flux of permanent magnet (Wb), δ is the main magnetic flux of the
air gap (Wb), efL is the effective length of the core (mm), and m1, m2, m3, and m4 are the vector
magnetic potential values of the four points from Figure 15 (Wb/m).
The static magnetic flux density of the motor is shown in Figure 16, in which the different colors
represent the different values of the magnetic flux density. Figure 15 indicates that no excessive
saturation occurs in the motor and the maximum density of the magnetic flux exists in the stator tooth
tip.
Figure 14. Partial enlarged drawing of flux lines.
The pole-to-pole leakage coefficient is calculated by taking a piece of permanent magnet to studyand using Equation (9). The calculated result is 1.05, which shows that the pole-to-pole leakagecoefficient is insignificant.
σ1 =ϕm
ϕδ=|m1−m2| · Lef
|m3−m4| · Lef=|m1−m2|
|m3−m4|(9)
World Electric Vehicle Journal 2019, 10, 16 11 of 19
where ϕm is the total magnetic flux of permanent magnet (Wb), ϕδ is the main magnetic flux of the airgap (Wb), Lef is the effective length of the core (mm), and m1, m2, m3, and m4 are the vector magneticpotential values of the four points from Figure 15 (Wb/m).World Electric Vehicle Journal 2019, 10, 16 11 of 18
Figure 15. Inner flux density map of the motor under static condition.
The analysis of the air-gap magnetic field is the basis for the design and performance analysis of
the brushless DC motor [20]. The air-gap flux density is mainly influenced by the pole thickness, air-
gap length, and pole-arc coefficient. The air-gap flux density can be obtained by drawing the air-gap
arc, which is a semicircular curve drawn between the inner diameter of the rotor and the outer
diameter of the stator. Subsequently, the distribution curve of the air-gap flux density with respect to
the circumferential direction can be obtained by post-processing, as shown in Figure 16.
0 30 60 90 120 150 180
0.0
0.2
0.4
0.6
0.8
1.0
Air
-ga
p flu
x d
en
sity
Mechanical Degree()
Figure 16. Air-gap flux density of the motor around the circle.
3.3. Analysis of the Transient Magnetic Field of the Motor
3.3.1. Analysis of the No-Load Transient Magnetic Field
When the motor is running in the no-load state, the current of the armature winding is minute,
approximately zero. Under this condition, the magnetic field is produced by the permanent magnetic
pole only, as in a static magnetic field. The difference is that the motor speed is a no-load speed rather
than zero. In the no-load characteristic simulation of the motor, the excitation current of the winding
should be set to zero, and the motor speed should be set to the no-load speed. The flux–linkage
waveform and the back–EMF waveform of the three-phase windings can be obtained by post-
processing, as shown in Figures 17 and 18, respectively.
Figure 15. Inner flux density map of the motor under static condition.
The static magnetic flux density of the motor is shown in Figure 16, in which the different colorsrepresent the different values of the magnetic flux density. Figure 15 indicates that no excessivesaturation occurs in the motor and the maximum density of the magnetic flux exists in the statortooth tip.
World Electric Vehicle Journal 2019, 10, 16 11 of 18
Figure 15. Inner flux density map of the motor under static condition.
The analysis of the air-gap magnetic field is the basis for the design and performance analysis of
the brushless DC motor [20]. The air-gap flux density is mainly influenced by the pole thickness, air-
gap length, and pole-arc coefficient. The air-gap flux density can be obtained by drawing the air-gap
arc, which is a semicircular curve drawn between the inner diameter of the rotor and the outer
diameter of the stator. Subsequently, the distribution curve of the air-gap flux density with respect to
the circumferential direction can be obtained by post-processing, as shown in Figure 16.
0 30 60 90 120 150 180
0.0
0.2
0.4
0.6
0.8
1.0
Air
-ga
p flu
x d
en
sity
Mechanical Degree()
Figure 16. Air-gap flux density of the motor around the circle.
3.3. Analysis of the Transient Magnetic Field of the Motor
3.3.1. Analysis of the No-Load Transient Magnetic Field
When the motor is running in the no-load state, the current of the armature winding is minute,
approximately zero. Under this condition, the magnetic field is produced by the permanent magnetic
pole only, as in a static magnetic field. The difference is that the motor speed is a no-load speed rather
than zero. In the no-load characteristic simulation of the motor, the excitation current of the winding
should be set to zero, and the motor speed should be set to the no-load speed. The flux–linkage
waveform and the back–EMF waveform of the three-phase windings can be obtained by post-
processing, as shown in Figures 17 and 18, respectively.
Figure 16. Air-gap flux density of the motor around the circle.
The analysis of the air-gap magnetic field is the basis for the design and performance analysisof the brushless DC motor [20]. The air-gap flux density is mainly influenced by the pole thickness,air-gap length, and pole-arc coefficient. The air-gap flux density can be obtained by drawing theair-gap arc, which is a semicircular curve drawn between the inner diameter of the rotor and the outerdiameter of the stator. Subsequently, the distribution curve of the air-gap flux density with respect tothe circumferential direction can be obtained by post-processing, as shown in Figure 16.
3.3. Analysis of the Transient Magnetic Field of the Motor
3.3.1. Analysis of the No-Load Transient Magnetic Field
When the motor is running in the no-load state, the current of the armature winding is minute,approximately zero. Under this condition, the magnetic field is produced by the permanent magneticpole only, as in a static magnetic field. The difference is that the motor speed is a no-load speedrather than zero. In the no-load characteristic simulation of the motor, the excitation current of

World Electric Vehicle Journal 2019, 10, 16 12 of 19
the winding should be set to zero, and the motor speed should be set to the no-load speed. Theflux–linkage waveform and the back–EMF waveform of the three-phase windings can be obtained bypost-processing, as shown in Figures 17 and 18, respectively.
Figure 17. Waveform of three-phase flux linkage under no-load.
Figure 18. Waveform of three-phase back electromotive force under no-load.
3.3.2. Analysis of the Load Transient Magnetic Field
When the motor is running in the load state, the internal cloud of the magnetic flux density at thetooth tip is presented in the partially enlarged diagram of the motor under load operation (Figure 19).Figure 19 shows that the magnetic field distribution is similar to that of the no-load state. The internalmagnetic flux density value is still located at the stator tooth tip, and the highest magnetic flux densityis approximately 2 T. No saturation is evident, indicating that the motor design is reasonable.
World Electric Vehicle Journal 2019, 10, 16 13 of 19
World Electric Vehicle Journal 2019, 10, 16 12 of 18
0 20 40 60 80
-0.8
-0.6
-0.4
-0.2
0.0
0.2
0.4
0.6
0.8
Flu
x L
inkag
e(W
b)
Time(ms)
A相 B相 C相
Figure 17. Waveform of three-phase flux linkage under no-load.
0 20 40 60 80
-150
-100
-50
0
50
100
150
Ind
uced
Voltag
e(V
)
Time(ms)
A相 B相 C相
Figure 18. Waveform of three-phase back electromotive force under no-load.
3.3.2. Analysis of the Load Transient Magnetic Field
When the motor is running in the load state, the internal cloud of the magnetic flux density at
the tooth tip is presented in the partially enlarged diagram of the motor under load operation (Figure
19). Figure 19 shows that the magnetic field distribution is similar to that of the no-load state. The
internal magnetic flux density value is still located at the stator tooth tip, and the highest magnetic
flux density is approximately 2 T. No saturation is evident, indicating that the motor design is
reasonable.
Figure 19. Inner flux density map of the motor under load.
3.4. Loss Analysis of the Motor
The loss of the motor running status can be divided into four categories: stator winding copperloss, core loss, eddy current loss of permanent magnet, and mechanical loss. The four types of loss varywith the stator current, the frequency of the main magnetic field, the motor speed, and the harmoniccomponents of the stator current.
In this paper, finite element analysis s used to obtain the time domain curve of core loss andpermanent magnet eddy current of the motor. As shown in Figures 20 and 21, the average value ofcore loss was 109 w, and the average value of eddy current loss of permanent magnet was 148 w.
World Electric Vehicle Journal 2019, 10, 16 13 of 18
Figure 19. Inner flux density map of the motor under load.
3.4. Loss Analysis of the Motor
The loss of the motor running status can be divided into four categories: stator winding copper
loss, core loss, eddy current loss of permanent magnet, and mechanical loss. The four types of loss
vary with the stator current, the frequency of the main magnetic field, the motor speed, and the
harmonic components of the stator current.
In this paper, finite element analysis s used to obtain the time domain curve of core loss and
permanent magnet eddy current of the motor. As shown in Figures 20 and 21, the average value of
core loss was
Figure 20. Time domain curve of core loss.
Figure 21. Time domain curve of eddy current loss of permanent magnet.
The calculation of copper loss is relatively simple. The calculation formula without considering
current harmonic and skin effect is shown as follows [21]:
scu RmIP 21 (10)
where cuP is the copper loss, m is the phase number, 1I is the effective value of the phase
current, and sR is the average resistance of phase winding. The calculated copper loss is 3.32 kW.
4. Analysis of the Torque Ripple Characteristics of the Outer Rotor Direct-Drive Brushless DC
Motor
4.1. Analysis of the Cogging Torque
A previous study [22] suggested that the fluctuation cycle of the cogging torque of a permanent-
magnet motor is equal to the least common multiple of the pole number and the tooth-slot number.
The pole number of the designed brushless DC motor is 40, and its slot number is 42; therefore, the
Figure 20. Time domain curve of core loss.
World Electric Vehicle Journal 2019, 10, 16 13 of 18
Figure 19. Inner flux density map of the motor under load.
3.4. Loss Analysis of the Motor
The loss of the motor running status can be divided into four categories: stator winding copper
loss, core loss, eddy current loss of permanent magnet, and mechanical loss. The four types of loss
vary with the stator current, the frequency of the main magnetic field, the motor speed, and the
harmonic components of the stator current.
In this paper, finite element analysis s used to obtain the time domain curve of core loss and
permanent magnet eddy current of the motor. As shown in Figures 20 and 21, the average value of
core loss was
Figure 20. Time domain curve of core loss.
Figure 21. Time domain curve of eddy current loss of permanent magnet.
The calculation of copper loss is relatively simple. The calculation formula without considering
current harmonic and skin effect is shown as follows [21]:
scu RmIP 21 (10)
where cuP is the copper loss, m is the phase number, 1I is the effective value of the phase
current, and sR is the average resistance of phase winding. The calculated copper loss is 3.32 kW.
4. Analysis of the Torque Ripple Characteristics of the Outer Rotor Direct-Drive Brushless DC
Motor
4.1. Analysis of the Cogging Torque
A previous study [22] suggested that the fluctuation cycle of the cogging torque of a permanent-
magnet motor is equal to the least common multiple of the pole number and the tooth-slot number.
The pole number of the designed brushless DC motor is 40, and its slot number is 42; therefore, the
Figure 21. Time domain curve of eddy current loss of permanent magnet.
World Electric Vehicle Journal 2019, 10, 16 14 of 19
The calculation of copper loss is relatively simple. The calculation formula without consideringcurrent harmonic and skin effect is shown as follows [21]:
Pcu = mI21Rs (10)
where Pcu is the copper loss, m is the phase number, I1 is the effective value of the phase current, andRs is the average resistance of phase winding. The calculated copper loss is 3.32 kW.
4. Analysis of the Torque Ripple Characteristics of the Outer Rotor Direct-Drive BrushlessDC Motor
4.1. Analysis of the Cogging Torque
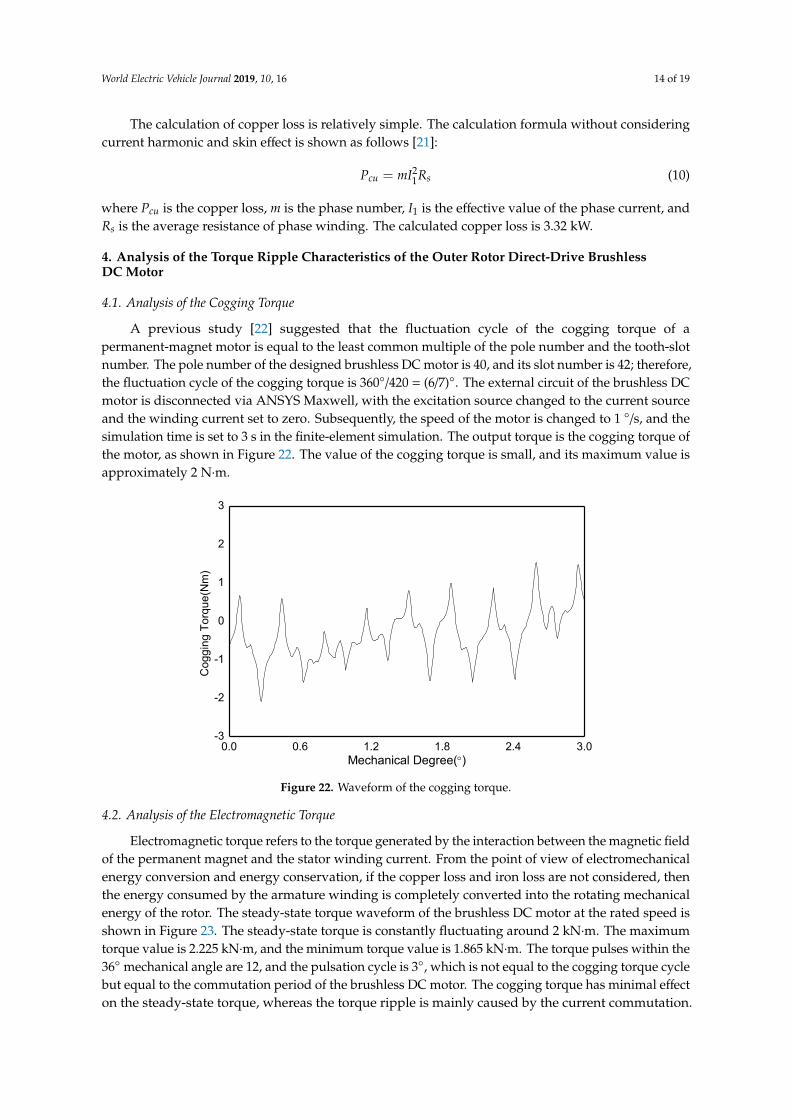
A previous study [22] suggested that the fluctuation cycle of the cogging torque of apermanent-magnet motor is equal to the least common multiple of the pole number and the tooth-slotnumber. The pole number of the designed brushless DC motor is 40, and its slot number is 42; therefore,the fluctuation cycle of the cogging torque is 360◦/420 = (6/7)◦. The external circuit of the brushless DCmotor is disconnected via ANSYS Maxwell, with the excitation source changed to the current sourceand the winding current set to zero. Subsequently, the speed of the motor is changed to 1 ◦/s, and thesimulation time is set to 3 s in the finite-element simulation. The output torque is the cogging torque ofthe motor, as shown in Figure 22. The value of the cogging torque is small, and its maximum value isapproximately 2 N·m.
World Electric Vehicle Journal 2019, 10, 16 14 of 18
fluctuation cycle of the cogging torque is 360/420 = (6/7). The external circuit of the brushless DC
motor is disconnected via ANSYS Maxwell, with the excitation source changed to the current source
and the winding current set to zero. Subsequently, the speed of the motor is changed to 1 °/s, and the
simulation time is set to 3 s in the finite-element simulation. The output torque is the cogging torque
of the motor, as shown in Figure 22. The value of the cogging torque is small, and its maximum value
is approximately 2 Nm.
0.0 0.6 1.2 1.8 2.4 3.0-3
-2
-1
0
1
2
3
Co
gg
ing
To
rqu
e(N
m)
Mechanical Degree()
Figure 22. Waveform of the cogging torque.
4.2. Analysis of the Electromagnetic Torque
Electromagnetic torque refers to the torque generated by the interaction between the magnetic
field of the permanent magnet and the stator winding current. From the point of view of
electromechanical energy conversion and energy conservation, if the copper loss and iron loss are not
considered, then the energy consumed by the armature winding is completely converted into the
rotating mechanical energy of the rotor. The steady-state torque waveform of the brushless DC motor
at the rated speed is shown in Figure 23. The steady-state torque is constantly fluctuating around 2
kNm. The maximum torque value is 2.225 kNm, and the minimum torque value is 1.865 kNm. The
torque pulses within the 36° mechanical angle are 12, and the pulsation cycle is 3°, which is not equal
to the cogging torque cycle but equal to the commutation period of the brushless DC motor. The
cogging torque has minimal effect on the steady-state torque, whereas the torque ripple is mainly
caused by the current commutation. After the harmonics of the steady-state torque are analyzed, the
harmonic torque amplitude in every order is determined (Figure 24).
0 9 18 27 36
0.0
0.5
1.0
1.5
2.0
2.5
3.0
Torq
ue(k
Nm
)
Mechanical Degree()
Max:2.224774
Min:1.865275
Figure 22. Waveform of the cogging torque.
4.2. Analysis of the Electromagnetic Torque
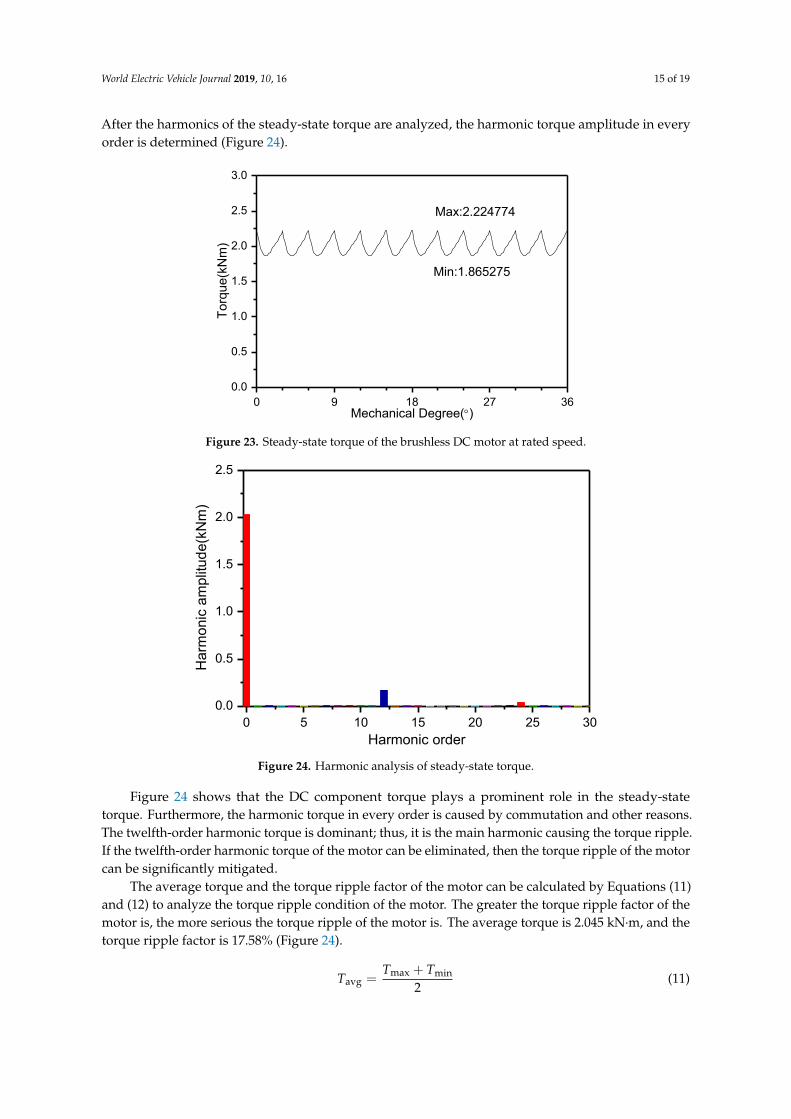
Electromagnetic torque refers to the torque generated by the interaction between the magnetic fieldof the permanent magnet and the stator winding current. From the point of view of electromechanicalenergy conversion and energy conservation, if the copper loss and iron loss are not considered, thenthe energy consumed by the armature winding is completely converted into the rotating mechanicalenergy of the rotor. The steady-state torque waveform of the brushless DC motor at the rated speed isshown in Figure 23. The steady-state torque is constantly fluctuating around 2 kN·m. The maximumtorque value is 2.225 kN·m, and the minimum torque value is 1.865 kN·m. The torque pulses within the36◦ mechanical angle are 12, and the pulsation cycle is 3◦, which is not equal to the cogging torque cyclebut equal to the commutation period of the brushless DC motor. The cogging torque has minimal effecton the steady-state torque, whereas the torque ripple is mainly caused by the current commutation.
World Electric Vehicle Journal 2019, 10, 16 15 of 19
After the harmonics of the steady-state torque are analyzed, the harmonic torque amplitude in everyorder is determined (Figure 24).
World Electric Vehicle Journal 2019, 10, 16 14 of 18
fluctuation cycle of the cogging torque is 360/420 = (6/7). The external circuit of the brushless DC
motor is disconnected via ANSYS Maxwell, with the excitation source changed to the current source
and the winding current set to zero. Subsequently, the speed of the motor is changed to 1 °/s, and the
simulation time is set to 3 s in the finite-element simulation. The output torque is the cogging torque
of the motor, as shown in Figure 22. The value of the cogging torque is small, and its maximum value
is approximately 2 Nm.
0.0 0.6 1.2 1.8 2.4 3.0-3
-2
-1
0
1
2
3
Co
gg
ing
To
rqu
e(N
m)
Mechanical Degree()
Figure 22. Waveform of the cogging torque.
4.2. Analysis of the Electromagnetic Torque
Electromagnetic torque refers to the torque generated by the interaction between the magnetic
field of the permanent magnet and the stator winding current. From the point of view of
electromechanical energy conversion and energy conservation, if the copper loss and iron loss are not
considered, then the energy consumed by the armature winding is completely converted into the
rotating mechanical energy of the rotor. The steady-state torque waveform of the brushless DC motor
at the rated speed is shown in Figure 23. The steady-state torque is constantly fluctuating around 2
kNm. The maximum torque value is 2.225 kNm, and the minimum torque value is 1.865 kNm. The
torque pulses within the 36° mechanical angle are 12, and the pulsation cycle is 3°, which is not equal
to the cogging torque cycle but equal to the commutation period of the brushless DC motor. The
cogging torque has minimal effect on the steady-state torque, whereas the torque ripple is mainly
caused by the current commutation. After the harmonics of the steady-state torque are analyzed, the
harmonic torque amplitude in every order is determined (Figure 24).
0 9 18 27 36
0.0
0.5
1.0
1.5
2.0
2.5
3.0
Torq
ue(k
Nm
)
Mechanical Degree()
Max:2.224774
Min:1.865275
Figure 23. Steady-state torque of the brushless DC motor at rated speed.
World Electric Vehicle Journal 2019, 10, 16 15 of 18
Figure 23. Steady-state torque of the brushless DC motor at rated speed.
0 5 10 15 20 25 30
0.0
0.5
1.0
1.5
2.0
2.5
Harmonic order
Ha
rmo
nic
am
plit
ud
e(k
Nm
)
Figure 24. Harmonic analysis of steady-state torque.
Figure 24 shows that the DC component torque plays a prominent role in the steady-state torque.
Furthermore, the harmonic torque in every order is caused by commutation and other reasons. The
twelfth-order harmonic torque is dominant; thus, it is the main harmonic causing the torque ripple.
If the twelfth-order harmonic torque of the motor can be eliminated, then the torque ripple of the
motor can be significantly mitigated.
The average torque and the torque ripple factor of the motor can be calculated by Equations (11)
and (12) to analyze the torque ripple condition of the motor. The greater the torque ripple factor of
the motor is, the more serious the torque ripple of the motor is. The average torque is 2.045 kNm,
and the torque ripple factor is 17.58% (Figure 24).
max minavg
2
T TT
+= (11)
max min
avg
TPF= 100%T T
T
−
(12)
where maxT is maximum torque (kNm), minT is minimum torque (kNm), avgT is average torque
(kNm), and TPF is torque ripple factor.
4.3. Reduction of the Torque Ripple of the Motor
The permanent-magnet brushless DC motor has many advantages, but there are also inevitable
torque ripples, especially at lower speed. Usually, different methods are adopted to reduce the torque
ripple, mainly from two aspects of the motor design and control. In terms of motor design, Chute of
the stator or rotor skewed pole are commonly used, but the skewed pole makes the shape of the
permanent magnet more special, so the process is complicated and not easy to manufacture. Chute
stator also has certain problems; it not only increases the difficulty of the stator winding embedding,
but also the low filling ratio. In order to solve the above problem, putting forward stator with two
twisted modules based on the principle of chute, then the torque ripple of the motor can be reduced
to allow the motor to run smoothly, and through to the stator unit separately controlled, the motor
would have good fault tolerant performance; when a module is broken, another module is not
affected, and can still continue to work. The 3D model of the outer rotor with the two twisted stators
and the corresponding rotor is shown in Figures 25 and 26.
Figure 24. Harmonic analysis of steady-state torque.
Figure 24 shows that the DC component torque plays a prominent role in the steady-statetorque. Furthermore, the harmonic torque in every order is caused by commutation and other reasons.The twelfth-order harmonic torque is dominant; thus, it is the main harmonic causing the torque ripple.If the twelfth-order harmonic torque of the motor can be eliminated, then the torque ripple of the motorcan be significantly mitigated.
The average torque and the torque ripple factor of the motor can be calculated by Equations (11)and (12) to analyze the torque ripple condition of the motor. The greater the torque ripple factor of themotor is, the more serious the torque ripple of the motor is. The average torque is 2.045 kN·m, and thetorque ripple factor is 17.58% (Figure 24).
Tavg =Tmax + Tmin
2(11)

World Electric Vehicle Journal 2019, 10, 16 16 of 19
TPF =Tmax − Tmin
Tavg× 100% (12)
where Tmax is maximum torque (kN·m), Tmin is minimum torque (kN·m), Tavg is average torque(kN·m), and TPF is torque ripple factor.
4.3. Reduction of the Torque Ripple of the Motor
The permanent-magnet brushless DC motor has many advantages, but there are also inevitabletorque ripples, especially at lower speed. Usually, different methods are adopted to reduce the torqueripple, mainly from two aspects of the motor design and control. In terms of motor design, Chuteof the stator or rotor skewed pole are commonly used, but the skewed pole makes the shape of thepermanent magnet more special, so the process is complicated and not easy to manufacture. Chutestator also has certain problems; it not only increases the difficulty of the stator winding embedding,but also the low filling ratio. In order to solve the above problem, putting forward stator with twotwisted modules based on the principle of chute, then the torque ripple of the motor can be reducedto allow the motor to run smoothly, and through to the stator unit separately controlled, the motorwould have good fault tolerant performance; when a module is broken, another module is not affected,and can still continue to work. The 3D model of the outer rotor with the two twisted stators and thecorresponding rotor is shown in Figures 25 and 26.World Electric Vehicle Journal 2019, 10, 16 16 of 18
Figure 25. Diagram of the stator with two twisted modules.
Figure 26. Diagram of the outer rotor.
The finite-element simulation of the two-dimensional magnetic field is based on the uniform
distribution of the section magnetic field; the section magnetic field distribution between the two
segments is different from that of the two twisted stators. The superposition method is employed to
predict the total torque of the motor.
First, the half-length of the motor is used to conduct the finite-element simulation analysis of the
magnetic field. Second, the stator of the motor is divided into two segments with the same length and
the segment stators are placed axially skewed at 1.5°, equivalent to two units of motor. Then the total
torque is equivalent to the superposition torque generated by the two units of motor, as shown in
Figures 27 and 28.
0 9 18 27 36
0.0
0.6
1.2
1.8
2.4
3.0
To
rqu
e(k
Nm
)
Mechanical Degree()
Total
Rotor1
Rotor2 Max:2.139
Min:1.967
Figure 27. Torque waveforms of two units of motor and their total torque.
Figure 25. Diagram of the stator with two twisted modules.
World Electric Vehicle Journal 2019, 10, 16 16 of 18
Figure 25. Diagram of the stator with two twisted modules.
Figure 26. Diagram of the outer rotor.
The finite-element simulation of the two-dimensional magnetic field is based on the uniform
distribution of the section magnetic field; the section magnetic field distribution between the two
segments is different from that of the two twisted stators. The superposition method is employed to
predict the total torque of the motor.
First, the half-length of the motor is used to conduct the finite-element simulation analysis of the
magnetic field. Second, the stator of the motor is divided into two segments with the same length and
the segment stators are placed axially skewed at 1.5°, equivalent to two units of motor. Then the total
torque is equivalent to the superposition torque generated by the two units of motor, as shown in
Figures 27 and 28.
0 9 18 27 36
0.0
0.6
1.2
1.8
2.4
3.0
To
rqu
e(k
Nm
)
Mechanical Degree()
Total
Rotor1
Rotor2 Max:2.139
Min:1.967
Figure 27. Torque waveforms of two units of motor and their total torque.
Figure 26. Diagram of the outer rotor.
The finite-element simulation of the two-dimensional magnetic field is based on the uniformdistribution of the section magnetic field; the section magnetic field distribution between the twosegments is different from that of the two twisted stators. The superposition method is employed topredict the total torque of the motor.
World Electric Vehicle Journal 2019, 10, 16 17 of 19
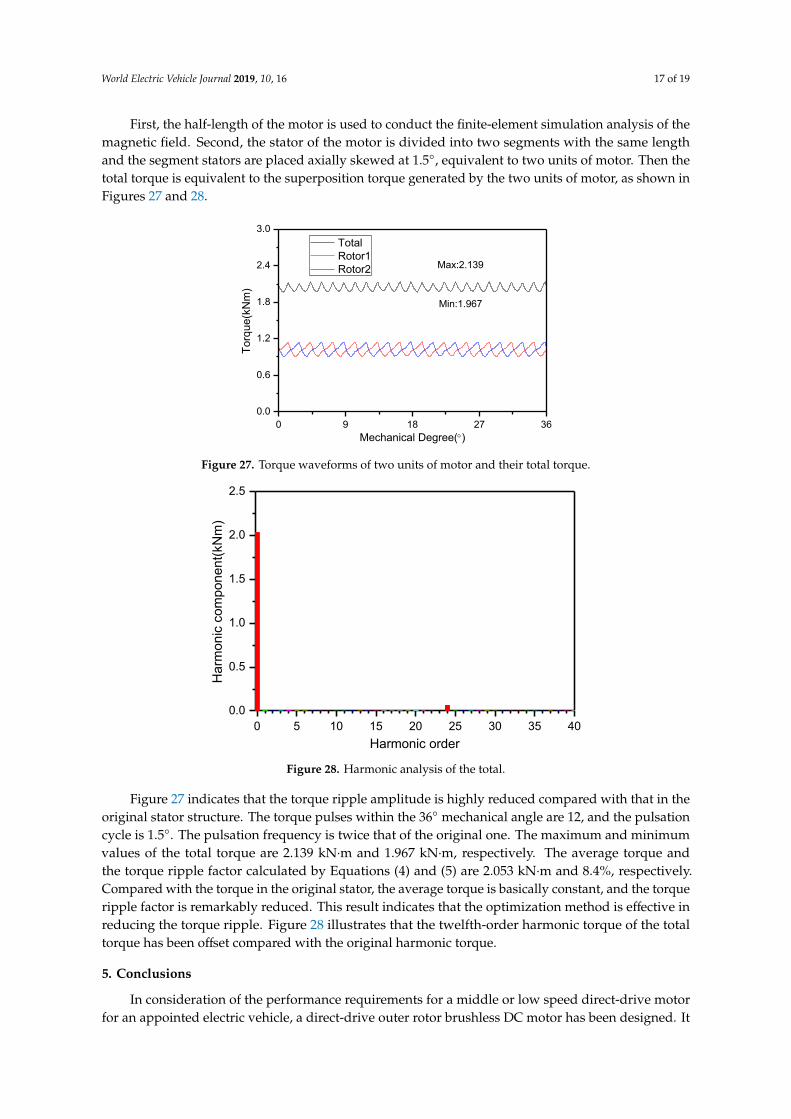
First, the half-length of the motor is used to conduct the finite-element simulation analysis of themagnetic field. Second, the stator of the motor is divided into two segments with the same lengthand the segment stators are placed axially skewed at 1.5◦, equivalent to two units of motor. Then thetotal torque is equivalent to the superposition torque generated by the two units of motor, as shown inFigures 27 and 28.
World Electric Vehicle Journal 2019, 10, 16 16 of 18
Figure 25. Diagram of the stator with two twisted modules.
Figure 26. Diagram of the outer rotor.
The finite-element simulation of the two-dimensional magnetic field is based on the uniform
distribution of the section magnetic field; the section magnetic field distribution between the two
segments is different from that of the two twisted stators. The superposition method is employed to
predict the total torque of the motor.
First, the half-length of the motor is used to conduct the finite-element simulation analysis of the
magnetic field. Second, the stator of the motor is divided into two segments with the same length and
the segment stators are placed axially skewed at 1.5°, equivalent to two units of motor. Then the total
torque is equivalent to the superposition torque generated by the two units of motor, as shown in
Figures 27 and 28.
0 9 18 27 36
0.0
0.6
1.2
1.8
2.4
3.0
To
rqu
e(k
Nm
)
Mechanical Degree()
Total
Rotor1
Rotor2 Max:2.139
Min:1.967
Figure 27. Torque waveforms of two units of motor and their total torque. Figure 27. Torque waveforms of two units of motor and their total torque.World Electric Vehicle Journal 2019, 10, 16 17 of 18
0 5 10 15 20 25 30 35 40
0.0
0.5
1.0
1.5
2.0
2.5
Harmonic order
Ha
rmo
nic
co
mp
on
en
t(kN
m)
Figure 28. Harmonic analysis of the total.
Figure 27 indicates that the torque ripple amplitude is highly reduced compared with that in the
original stator structure. The torque pulses within the 36° mechanical angle are 12, and the pulsation
cycle is 1.5°. The pulsation frequency is twice that of the original one. The maximum and minimum
values of the total torque are 2.139 kNm and 1.967 kNm, respectively. The average torque and the
torque ripple factor calculated by Equations (4) and (5) are 2.053 kNm and 8.4%, respectively.
Compared with the torque in the original stator, the average torque is basically constant, and the
torque ripple factor is remarkably reduced. This result indicates that the optimization method is
effective in reducing the torque ripple. Figure 28 illustrates that the twelfth-order harmonic torque of
the total torque has been offset compared with the original harmonic torque.
5. Conclusion
In consideration of the performance requirements for a middle or low speed direct-drive motor
for an appointed electric vehicle, a direct-drive outer rotor brushless DC motor has been designed. It
replaces the traditional centralized driving pattern of the electric vehicle. The main dimensions of the
motor have been preliminarily calculated, and on this basis the air-gap length and the pole-arc
coefficient, which are important parameters of the motor, have been optimized using the equivalent
magnetic circuit method. The optimization of these parameters not only ensures the efficiency of the
motor but also improves its operation reliability; the electromagnetic design scheme is finally
determined, and the mechanical structure of the motor has been designed using the optimized
parameters. The two-dimensional finite-element model of the motor has been established using
ANSYS Maxwell, and the static magnetic field and transient magnetic field of the motor have been
analyzed. The results show that the design of the motor is reasonable. The causes of the torque ripple
have been investigated on the basis of steady-state torque, and current commutation is the main cause
of the torque ripple. In order to decrease torque ripple, the stator structure of the motor has been
optimized, and the results indicate that the torque ripple factor of the motor has decreased
significantly from 17.58% to 8.4%.
Author Contributions: Data curation, W.M.; Investigation, X.S.; Methodology, L.Z.; Writing—original draft,
Y.Y.
Funding: The work was financially supported by the Shanxi Science and Technology Development Plan 2014
(Industrial) Project 20140321008-04; Shanxi Province Scientific and Technological Achievements transformation
guidance Project 201604D131028; and the Shanxi Province Graduate Excellent Innovation Project Fund under
Grant No. 20133116.
Conflicts of Interest: The authors declare no conflict of interest.
Figure 28. Harmonic analysis of the total.
Figure 27 indicates that the torque ripple amplitude is highly reduced compared with that in theoriginal stator structure. The torque pulses within the 36◦ mechanical angle are 12, and the pulsationcycle is 1.5◦. The pulsation frequency is twice that of the original one. The maximum and minimumvalues of the total torque are 2.139 kN·m and 1.967 kN·m, respectively. The average torque andthe torque ripple factor calculated by Equations (4) and (5) are 2.053 kN·m and 8.4%, respectively.Compared with the torque in the original stator, the average torque is basically constant, and the torqueripple factor is remarkably reduced. This result indicates that the optimization method is effective inreducing the torque ripple. Figure 28 illustrates that the twelfth-order harmonic torque of the totaltorque has been offset compared with the original harmonic torque.
5. Conclusions
In consideration of the performance requirements for a middle or low speed direct-drive motorfor an appointed electric vehicle, a direct-drive outer rotor brushless DC motor has been designed. It

World Electric Vehicle Journal 2019, 10, 16 18 of 19
replaces the traditional centralized driving pattern of the electric vehicle. The main dimensions ofthe motor have been preliminarily calculated, and on this basis the air-gap length and the pole-arccoefficient, which are important parameters of the motor, have been optimized using the equivalentmagnetic circuit method. The optimization of these parameters not only ensures the efficiency ofthe motor but also improves its operation reliability; the electromagnetic design scheme is finallydetermined, and the mechanical structure of the motor has been designed using the optimizedparameters. The two-dimensional finite-element model of the motor has been established using ANSYSMaxwell, and the static magnetic field and transient magnetic field of the motor have been analyzed.The results show that the design of the motor is reasonable. The causes of the torque ripple have beeninvestigated on the basis of steady-state torque, and current commutation is the main cause of thetorque ripple. In order to decrease torque ripple, the stator structure of the motor has been optimized,and the results indicate that the torque ripple factor of the motor has decreased significantly from17.58% to 8.4%.
Author Contributions: Data curation, W.M.; Investigation, X.S.; Methodology, L.Z.; Writing—original draft, Y.Y.
Funding: The work was financially supported by the Shanxi Science and Technology Development Plan 2014(Industrial) Project 20140321008-04; Shanxi Province Scientific and Technological Achievements transformationguidance Project 201604D131028; and the Shanxi Province Graduate Excellent Innovation Project Fund underGrant No. 20133116.
Conflicts of Interest: The authors declare no conflict of interest.
References
1. Jinghong, L. Drive System Design and Simulation Analysis for Hybrid Electric Vehicles. J. Shanghai Dianji Univ.2007, 1, 33–35.
2. Ruiqing, D. New energy vehicles development strategy research. J. New Ind. 2011, 1, 18–24.3. Lianqiao, T. The Full Text of China’s 13th Five-Year Plan. Available online: http://www.woc88.com/doc-
12659458.html (accessed on 1 March 2018).4. Ningning, T. Finite Element Modeling and Multi-Field Coupling Analysis of BLDC Wheel Motor; Jilin University:
Jilin, China, 2014.5. Shumei, C.; Junyun, S. The Research of the Direct-driven Wheel Motor Applied in Electric Vehicle.
Micromotors Servo Tech. 2006, 39, 68–70.6. Xinmei, L. Design and Research of the High-Power Density Permanent Magnet In-Wheel Motor Based on the
Reluctance Torque; Harbin Institute of Technology: Harbin, China, 2008.7. Tesla Model S. Automotive Observer 2018, 1, 25.8. Zhenpo, W.; Fengchun, S.; Peng, L. The Electric Car Principle and Application Technology; Mechanical Industry
Press: Beijing, China, 2015.9. Ekram, S.; Mahajan, D.; Fazil, M.; Patwardhan, V.; Ravi, N. Design Optimization of Brushless Permanent
Magnet Hub Motor Drive Using FEA. In Proceedings of the International Conference on Electrical Machinesand Systems, Seoul, Korea, 8–11 October 2007; Volume 8, pp. 8–11.
10. Gombert, B.; Fischer, R.; Heinrich, W. Wheel-Hub Motors Criteria of Construction and Vehicle Integrtation.ATZelektronik Worldw. 2010, 5, 4–10. [CrossRef]
11. Rix, A.J.; Kamper, M.J. Radial-Flux Permanent-Magnet Hub Drives: A Comparison Based on Stator andRotor Topologies. IEEE Trans. Ind. Electron. 2012, 59, 2475–2483. [CrossRef]
12. Xiong, S. Motor drive technology research of the electric car. Silicon Val. 2014, 21, 41.13. Li, G.; Ojeda, J.; Hoang, E.; Gabsi, M.; Lecrivain, M. Thermal-electromag-netic analysis for driving cycles of
embedded flux-switching permanent-magnet motors. IEEE Trans. Veh. Technol. 2012, 61, 140–151. [CrossRef]14. Hejra, M.; Mansouri, A. Optimal Design of a Permanent Magnet Synchronous Motor: Application of In-Wheel
Motor. In Proceedings of the 15th Intemational Renewable Energy Congress IREC, Hammamet, Tunisia,25–27 March 2014.
15. Kock, A.; Groninger, M.; Mertens, A. Fault Tolerant Wheel Hub Drive with Integrated Converter for ElectricVehicle Applications. In Proceedings of the 2012 IEEE Vehicle Power and Propulsion Conference, Seoul, Korea,9–12 October 2012.
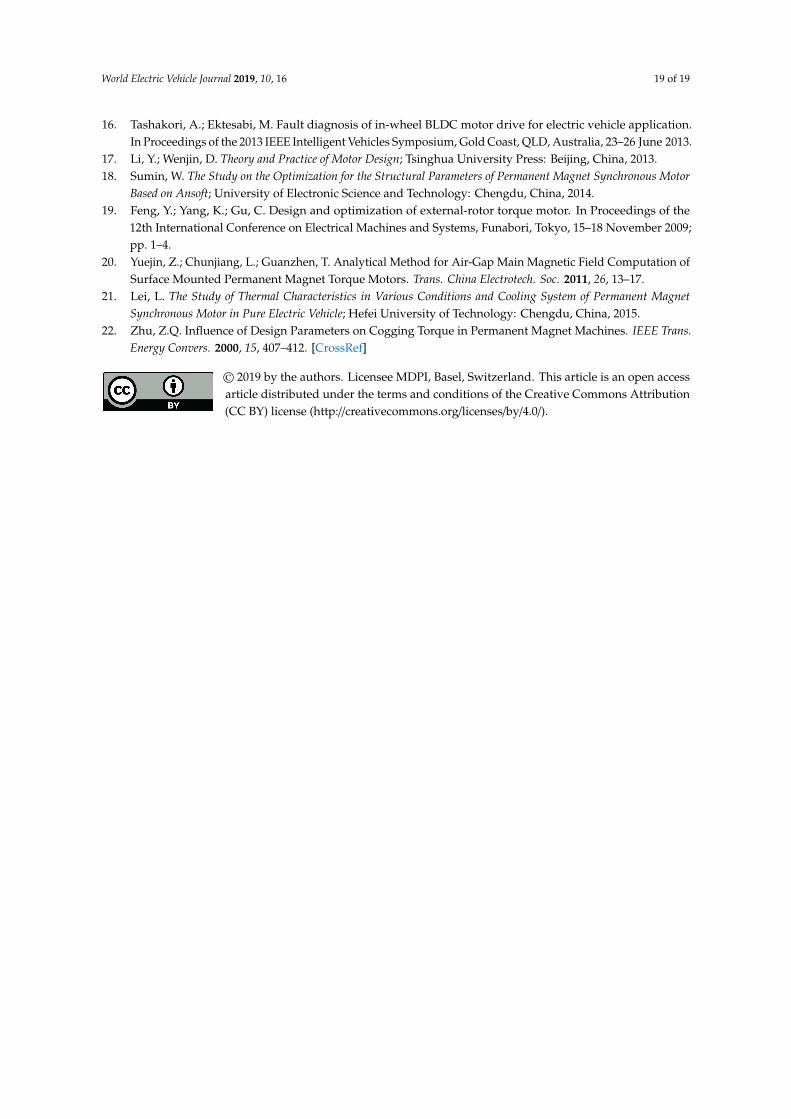
World Electric Vehicle Journal 2019, 10, 16 19 of 19
16. Tashakori, A.; Ektesabi, M. Fault diagnosis of in-wheel BLDC motor drive for electric vehicle application.In Proceedings of the 2013 IEEE Intelligent Vehicles Symposium, Gold Coast, QLD, Australia, 23–26 June 2013.
17. Li, Y.; Wenjin, D. Theory and Practice of Motor Design; Tsinghua University Press: Beijing, China, 2013.18. Sumin, W. The Study on the Optimization for the Structural Parameters of Permanent Magnet Synchronous Motor
Based on Ansoft; University of Electronic Science and Technology: Chengdu, China, 2014.19. Feng, Y.; Yang, K.; Gu, C. Design and optimization of external-rotor torque motor. In Proceedings of the
12th International Conference on Electrical Machines and Systems, Funabori, Tokyo, 15–18 November 2009;pp. 1–4.
20. Yuejin, Z.; Chunjiang, L.; Guanzhen, T. Analytical Method for Air-Gap Main Magnetic Field Computation ofSurface Mounted Permanent Magnet Torque Motors. Trans. China Electrotech. Soc. 2011, 26, 13–17.
21. Lei, L. The Study of Thermal Characteristics in Various Conditions and Cooling System of Permanent MagnetSynchronous Motor in Pure Electric Vehicle; Hefei University of Technology: Chengdu, China, 2015.
22. Zhu, Z.Q. Influence of Design Parameters on Cogging Torque in Permanent Magnet Machines. IEEE Trans.Energy Convers. 2000, 15, 407–412. [CrossRef]
© 2019 by the authors. Licensee MDPI, Basel, Switzerland. This article is an open accessarticle distributed under the terms and conditions of the Creative Commons Attribution(CC BY) license (http://creativecommons.org/licenses/by/4.0/).