Embed Size (px)
Citation preview


i
Design & Operation of Land Application Systems from a
Water, Nitrogen & Salt Balance Approach
by
Clifford B. Fedler
Runbin Duan
John Borrelli
Cary Green
Texas Tech University
Lubbock, TX 79409-1023
Submitted To:
Texas On-Site Wastewater Treatment Research Council
Austin, TX 78711-3087
Final Report for Project No. 582‐5‐73601
1 December 2008

ii
TABLE OF CONTENTS
TABLE OF CONTENTS ................................................................................................... II ABSTRACT.................................................................ERROR! BOOKMARK NOT DEFINED. LIST OF TABLES .........................................................................................................VIII LIST OF FIGURES........................................................................................................... X CHAPTER I .....................................................................................................................1 INTRODUCTION AND RESEARCH OBJECTIVES ...............................................................1
1.1 Introduction.............................................................................................1 1.2 Background of the study ........................................................................1 1.3 Research objectives.................................................................................3 1.4 The professional significance of this study ...........................................4 1.5 The delimitations of the study................................................................5 Reference ..................................................................................................................6
CHAPTER II....................................................................................................................7 LITERATURE REVIEW ...................................................................................................7
2.1 General land application systems ..........................................................7 2.2 Current design procedures for SR systems ..........................................7 2.3 On-site sewage facility (OSSF) systems...............................................10 2.4 Environmental impact of wastewater quality ....................................10 2.5 Leach water quality ..............................................................................12
2.5.1 BOD and Nutrients...........................................................................................................12 2.5.2 Pharmaceuticals and personal care products ...................................................................13
2.6 Escherichia coli in soils after wastewater irrigation..........................16 2.6.1 Introduction ......................................................................................................................16 2.6.2 Total coliform, fecal coliform, and E. coli ......................................................................16 2.6.3 Distribution of E. coli at different depth of soil ..............................................................17 2.6.4 Factors impacting persistence of E. coli in soils .............................................................17 2.6.5 The fate of E.coli O157:H7 and model of E. coli transport in soils ...............................18 2.6.6 Concluding remarks .........................................................................................................19
2.7 Relationships in soil-water-plant-air system ......................................20 2.7.1 Water-plant relationship...................................................................................................20 2.7.2 Soil air-soil water relationship .........................................................................................20 2.7.3 Soil-plant ..........................................................................................................................21 2.7.4 Soil-water relationship .....................................................................................................22
Reference ................................................................................................................28 CHAPTER III ................................................................................................................32 METHODOLOGY...........................................................................................................32
3.1 An alternative design approach...........................................................32 3.1.1 Water balance...................................................................................................................32 3.1.2 Nitrogen balance ..............................................................................................................35 3.1.3 Salt balance.......................................................................................................................39

iii
3.2 Experimental design .............................................................................41 3.2.1 Field sites..........................................................................................................................41 3.2.2 Experimental layout and design at Littlefield site...........................................................45 3.2.3 Experimental layout and design at TTU site ...................................................................56
Reference ................................................................................................................58 CHAPTER IV ................................................................................................................59 DATA ANALYSIS AND RESULTS AT LITTLEFIELD SITE...............................................59
4.1 Water Balance .......................................................................................59 4.1.1 UCC measurements..........................................................................................................59 4.1.2 Spatial and temporal distribution of leach water.............................................................62 4.1.3 Calculation of water mass balance...................................................................................65
4.2 Nitrogen Balance...................................................................................68 4.2.1 Spatial and temporal distribution of leached nitrogen.....................................................68 4.2.2 Calculation of nitrogen mass balance ..............................................................................75 4.2.3 Nitrate-nitrogen and ammonia-nitrogen ..........................................................................76
4.3 Salt Balance ...........................................................................................83 4.3.1 Salt concentration unit conversion...................................................................................83 4.3.2 Spatial and temporal distribution of leached salt mass ...................................................85 4.3.3 Salt mass balance .............................................................................................................91
DATA ANALYSIS AND RESULTS AT TTU SITE ............................................................92 4.4 Water Balance .......................................................................................92
4.4.1 Temporal distribution of average leach water volume....................................................92 4.4.2 Calculation of water mass balance...................................................................................92 4.4.3 Irrigation and leach water quantity for sampling periods ...............................................94 4.4.4 Cumulative leach water and cumulative input water ......................................................94
4.5 Nitrogen Balance.................................................................................102 4.5.1 Temporal distribution of leached total nitrogen ............................................................102 4.5.2 Calculation of nitrogen mass balance ............................................................................102 4.5.3 Cumulative nitrogen mass input and output ..................................................................103 4.5.4 Cumulative total nitrogen concentration in leached water............................................104
4.6 Salt Balance .........................................................................................114 4.6.1 Temporal distribution of average leached salt...............................................................114 4.6.2 Calculation of salt mass balance....................................................................................114 4.6.3 Accumulated salt mass-in and salt mass out .................................................................114 4.6.4 Ratio of accumulated stored salt in the soil ...................................................................115
CHAPTER V................................................................................................................127 DISCUSSION................................................................................................................127
5.1 Water balance......................................................................................127 5.1.1 Precipitation Patterns .....................................................................................................127 5.1.2 Expected leaching and measured leaching ....................................................................130 5.1.3 Leachate passing through the root zone.........................................................................133
5.2 Nitrogen balance .................................................................................138 5.2.1 Grass yield and nitrogen uptake.....................................................................................138 5.2.2 Total nitrogen leached....................................................................................................138

iv
5.2.3 Nitrogen removal............................................................................................................141 5.3 Salt Balance .........................................................................................147
5.3.1 Salt concentration and mass...........................................................................................147 5.3.2 Salt mass balance in the root zone .................................................................................148 5.3.3 Leaching requirement and leaching fraction .................................................................152
References.............................................................................................................155 CHAPTER VI ..............................................................................................................157 CONCLUSIONS AND RECOMMENDATIONS.................................................................157
6.1 Water balance......................................................................................157 6.2 Nitrogen balance .................................................................................158 6.3 Salt balance..........................................................................................159
APPENDIX A...............................................................................................................160 DETERMINATION OF IRRIGATION RATE AT SITE .....................................................160 APPENDIX B ...............................................................................................................169 THE PLOTS OF SPATIAL DISTRIBUTION OF LEACHED WATER................................169 APPENDIX C...............................................................................................................181 THE PLOTS OF TEMPORAL DISTRIBUTION OF LEACHED WATER ...........................181 APPENDIX D...............................................................................................................198 THE PLOTS OF SPATIAL DISTRIBUTION OF LEACHED TOTAL NITROGEN MASS ....198 APPENDIX E ...............................................................................................................210 THE PLOTS OF SPATIAL DISTRIBUTION OF LEACHED SALT MASS..........................210

v
EXECUTIVE SUMMARY
Land application of wastewater has been considered as one of the pathways to
reduce the pressure on fresh water resources that are used for irrigation throughout the
world. Two concerns with land application of wastewater are the potential of nitrogen
contamination of groundwater and salt accumulation in soils. Design procedures for
surface application systems should be developed to optimize the protection of the various
water resources from potential pollution and protect soils from degradation. A new model
was developed for designing surface application systems under common climate and soil
conditions for safe utilization and ultimately disposal of wastewater while preserving
fresh water resources. The procedure centers on the balances of applied water, nitrogen,
and salt. Another objective of this research was to model the quality and quantity of
leachate water passing through root zone in a surface application system based on the
proposed design approach. Data were collected from a local surface application site
where Bermuda grass is grown and a solid set irrigation system was used to distribute the
wastewater that was taken from an aerobic pond treatment system. This system most
closely simulates the typical aerobic treatment on-site sewage facility (OSSF) used in
Texas. Deep percolate water was collected in lysimeter-type samplers and analyzed
approximately monthly for over two years. Soil samples were also collected for analysis
in the mass balance analyses.
The volume weighted concentration of total nitrogen in the water collected from
the sampling devices was less than 5 mg/L during each individual sampling period and
the long term volume weighted concentration of total nitrogen collected was less than 3.5
mg/L. This is highly significant since the drinking water standards require less than 10
mg/L of only one component of the total nitrogen, nitrate-nitrogen. The total nitrogen
removal ranged from 80% to 100% during individual sampling periods. The overall
cumulative total nitrogen removal ratio was over 96%. Therefore, this study showed that
the land application of treated wastewater effluent had no adverse effects on groundwater
with respect to nitrogen contamination.

vi
Salt concentration varies with the designed leaching rate and ranged from 1261 to
2794 µS/cm on this research site. The salt balance was designed according to long-term
accepted practices and thus no detrimental effects were found on the Bermuda grass
throughout the testing period. An interesting result found from this research was that
even though there were several periods of high precipitation, the soils data exhibited and
increase in the overall salt concentration with no negative effect on plant growth. Another
interesting finding resulting from this research was that there was considerable spatial
and temporal variability of the quantity of water leached through the soil profile, which
then affected the quantity of nitrogen and salt moving past the plant root zone. When the
leaching data was analyzed over the entire period of testing, the cumulative leaching
resulted in an average of 10%, which was the designed rate for the plant, soil, and
climatic conditions of the test site.
One of the more important design considerations that affects the spatial variability
found from a surface application system for wastewater is the uniformity of the
distribution of the applied wastewater. To determine the distribution uniformity of the
applied wastewater, the Christensen’s Uniformity Coefficient (UCC) is calculated based
on the water collected from the application site. In addition, when testing a designed
irrigation system for its distribution uniformity, testing under very specific climatic
conditions (such as very low wind conditions) will not necessarily provide the
appropriate results found under field conditions. In order to provide appropriate data for a
complete analysis of the system, field test of the irrigation system should be conducted
multiple times throughout the year, usually tied to the various seasons of the year, in
order to produce an annual UCC value and that value should be used for design purposes.
Individual UCC tests completed for this study resulted in individual UCC values ranging
from 31% to 75%. Yet, when the data were analyzed as an annual operation, the resulting
UCC was 84%. To minimize the spatial variability found under filed conditions for the
distribution of wastewater, the recommended UCC value should be designed to be at least
80%. In addition to designing the system for uniform distribution, runoff from the
application site should be avoided. To minimize and even avoid runoff, the irrigation
application time and frequency, and the rate of application need to be designed for the
existing soil and climatic conditions that exist throughout the year.

vii
The most compelling result obtained from this research is that all surface applied
systems can be designed to have minimal effect on the environment as long as the
principle of mass balance is followed within the design. Even though some spatial
variability will exist at any site receiving wastewater, caution should be taken when
analyzing individual samples and drawing extensive conclusions from that data.
Testing of soil samples collected from the Midland and Houston areas showed
similar results to that found at the Littlefield test site. The most pronounced difference
came from the Houston area soil, which was principally a clay soil. In this case, the
application of the water had to be adjusted for the soil infiltration properties. In particular,
the application rate had to be decreased while the frequency of application was increased.

viii
LIST OF TABLES Table 3. 1 Predetermined irrigation schedule for Littlefield site ...................................... 52
Table 3. 2 The methods used to measure the quality of leachate water and wastewater................................................................................................. 52
Table 4. 1 UCC values and climate data during tests ....................................................... 61
Table 4. 2 Collected leach water volume (mL) in each sampler at sampling date............................................................................................................ 63
Table 4. 3 The calculation of water balance for the Littlefield site .................................. 66
Table 4. 4 The list of total nitrogen in the leached water and in wastewater at the Littlefield site .................................................................................. 70
Table 4. 5 Total nitrogen mass balance at the Littlefield site ........................................... 75
Table 4. 6 The list of nitrate-nitrogen in the leached water and in wastewater at the Littlefield site ............................................................... 77
Table 4. 7 The list of ammonia-nitrogen in the leached water and in wastewater at the Littlefield site ............................................................... 80
Table 4. 8 The salinity expressed with electrical conductivity and total dissolved solid for a set of water samples................................................. 84
Table 4. 9 The summarization of salinity and salt mass in the leached water and applied wastewater at the Littlefield site.................................. 86
Table 4. 10 Mass balance of salt for each sampling period at the Littlefield site based on one sampler ......................................................................... 91
Table 4. 11 Water balance calculation for Houston soil ................................................... 96
Table 4. 12 Water balance calculation for Midland soil ................................................... 98
Table 4. 13 Calculation of mass of total nitrogen for Houston soil ................................ 105
Table 4. 14 Calculation of mass of total nitrogen for Midland soil ................................ 107
Table 4. 15 Mass balance of Houston soil based on one sampler................................... 109
Table 4. 16 Mass balance of Midland soil based on one sampler................................... 109
Table 4. 17 TN removal by grass mowing on Aug 21, 2007 at the TTU site................. 110
Table 4. 18 The cumulative mass balance for Houston soil based on a sampler.................................................................................................... 110
Table 4. 19 The cumulative mass balance for Midland soil based on a sampler.................................................................................................... 111
Table 4. 20 The cumulative TN concentration for Houston soil .................................... 112
Table 4. 21 The cumulative TN concentration for Midland soil .................................... 113
Table 4. 22 Cumulative removal ratio of TN of Houston soil ........................................ 113

ix
Table 4. 23 Cumulative removal ratio of TN of Midland soil ........................................ 114
Table 4. 24 The summarization of salinity for Houston soil .......................................... 116
Table 4. 25 The summarization of salinity for Midland soil .......................................... 118
Table 4. 26 Salt mass balance for Houston soil based on a sampler .............................. 123
Table 4. 27 Salt mass balance for Midland soil based on a sampler .............................. 123
Table 4. 28 Salt mass storage ratio for Houston soil ...................................................... 126
Table 4. 29 Salt mass storage ratio for Midland soil ...................................................... 126
Table 5. 1 The difference of the recorded and the 30-year average precipitation (PPT), and the difference of measured leaching and expected leaching .............................................................. 132
Table 5. 2 Removed TKN by grass mowing during the period of April 2007 to Oct 2007..................................................................................... 138
Table 5. 3 Nitrogen removal data by the land application system. TN means total nitrogen; NO3
- in the table is nitrate-nitrogen; NH4
+ is ammonia-nitrogen...................................................................... 142
Table 5. 4 The salt mass in the leached water and in the applied wastewater............................................................................................... 151
Table 5. 5 Leaching requirements, leaching fraction, and SBI/SER .............................. 153
Table A. 1 The performance data of two types of nozzle used at the research site............................................................................................. 161
Table A. 2 Summary of irrigation radius, flow rate, and number of nozzles at the research site................................................................................... 166

x
LIST OF FIGURES Figure 3. 1 Water balance and components in the wastewater land
application system..................................................................................... 34
Figure 3. 2 Nitrogen cycle and balance at the wastewater land application site ............................................................................................................. 36
Figure 3. 3 Salt balance at the wastewater land application site....................................... 39
Figure 3. 4 Flow chart of wastewater at the wastewater treatment plant, Littlefield, Texas. A: sampling point for the secondary effluent; B: sampling position for the leached water ................................ 41
Figure 3. 5 Aerobic ponds at Littlefield wastewater treatment plant................................ 42
Figure 3. 6 Storage pond at Littlefield wastewater treatment plant .................................. 43
Figure 3. 7 A part of sprayfield at Littlefield wastewater treatment plant........................ 44
Figure 3. 8 The layout of samplers (lysimeters) at Littlefield wastewater treatment plant (not scaled)....................................................................... 46
Figure 3. 9 Side view of the sampling device (lysimeter) installed under soil surface (not scaled) ............................................................................ 47
Figure 3. 10 The installation of supporting layers within a sampler (lysimeter) ................................................................................................. 48
Figure 3. 11 Right after installation of a sampler into ground.......................................... 49
Figure 3. 12 Right after installation of samplers at the Littlefield site ............................. 50
Figure 3. 13 Soil sampling in process............................................................................... 53
Figure 3. 14 UCC test grid and measurement in process.................................................. 55
Figure 3. 15 Installation positions of Houston and Midland samplers at TTU site .................................................................................................... 57
Figure 4. 1 The average leaching amount of each sampling period from Oct 2005 to Sept 2007 at the Littlefield site. The error bars represent ± one standard error................................................................... 64
Figure 4. 2 The temporal distribution of volume weighted average total nitrogen concentration in leach water at the Littlefield site...................... 73
Figure 4. 3 Average total nitrogen mass leached in each sampling period at the Littlefield site. The symbol presents means of repeated measurements, and the error bars present standard errors. ....................... 74
Figure 4. 4 The relationship between electrical conductivity, μS/cm, and total dissolved solid, mg/L........................................................................ 84
Figure 4. 5 The temporal distribution of volume weighted average salinity in the leach water at the Littlefield site..................................................... 89

xi
Figure 4. 6 Average leached mass of salt ± standard error in the leached water in each sampling period at the Littlefield site ................................. 90
Figure 4. 7 The mean of leach water with one standard deviation for each sampling period for Houston soil.............................................................. 92
Figure 4. 8 The mean of leach water with one standard deviation for each sampling period for Midland soil.............................................................. 93
Figure 4. 9 Applied water and leached water amount for Houston soil ......................... 100
Figure 4. 10 Applied water plus precipitation and leached water amount for Midland soil....................................................................................... 100
Figure 4. 11 The linear relationship between cumulative applied water and cumulative leached water for Houston soil............................................. 101
Figure 4. 12 The linear relationship between cumulative applied water plus precipitation and cumulative leached water for Midland soil ............................................................................................ 101
Figure 4. 13 Temporal distribution of weighted average total nitrogen concentration of Houston soil ................................................................. 102
Figure 4. 14 Temporal distribution of weighted average total nitrogen concentration of Midland soil ................................................................. 103
Figure 4. 15 The plots of cumulative applied TN and leached TN for Houston soil in a sampler........................................................................ 111
Figure 4. 16 The plots of cumulative applied TN and leached TN for Midland soil in a sampler........................................................................ 112
Figure 4. 17 Temporal distribution of weighted average salinity in leached water of Houston soil .............................................................................. 120
Figure 4. 18 Temporal distribution of weighted average salinity in leached water of Midland soil .............................................................................. 121
Figure 4. 19 Average leached mass of salt ± standard deviation at each sampling time for Houston soil............................................................... 122
Figure 4. 20 Average leached mass of salt ± standard deviation at each sampling time for Midland soil............................................................... 122
Figure 4. 21 Salt mass input and output in a sampler of Houston soil ........................... 124
Figure 4. 22 Salt mass input and output in a sampler of Midland soil ........................... 124
Figure 4. 23 The regression relationship between average accumulated salt mass input and output for a sampler of Houston soil.............................. 125
Figure 4. 24 The regression relationship between average accumulated salt mass input and output for a sampler of Midland soil.............................. 125

xii
Figure 5. 1 The 30-year average precipitation at Lubbock and recorded precipitation at Littlefield during the period of Oct 2005 to Sept 2007 ................................................................................................ 128
Figure 5. 2 The recorded precipitation at Littlefield above or below the 30-year average precipitation at Lubbock during Oct 2005 to Sept 2007 ................................................................................................ 129
Figure 5. 3 The daily average leaching of each sampling period, the No. of sampling period can be referred to Table 5.1. ........................................ 135
Figure 5. 4 The ratio of leaching amount to total water input including applied wastewater and precipitation, the No. of sampling period can be referred to Table 5.1. ........................................................ 136
Figure 5. 5 The ratio of cumulative leaching amount to cumulative total water input, the No. of sampling period can be referred to Table 5.1. ................................................................................................ 137
Figure 5. 6 Daily average leached total nitrogen mass during the project. The number of sampling period can be referred to Table 5. 1............................................................................................................... 140
Figure 5. 7 The concentration of total nitrogen, nitrate-nitrogen, and ammonia-nitrogen in the applied wastewater. The number of the sampling period can be referred to Table 5.1 ............................... 145
Figure 5. 8 The concentration of total nitrogen, nitrate-nitrogen, and ammonia-nitrogen in effluent of the land application system to the groundwater passing through the grass root zone. The number of the sampling period can be referred to Table 5. 1. ............................................................................................... 146
Figure 5. 9 Salinity (electrical conductivity) in applied water and volume weighted average salinity in leached water ............................................ 148
Figure 5. 10 Cumulative salt mass in, mass out, and mass balance in the root zone.................................................................................................. 154
Figure A. 1 Plot of relationship between nozzle pressure and irrigation radius for Gray I-25 plus nozzle series ................................................... 162
Figure A. 2 Plot of relationship between nozzle pressure and irrigation radius for Dk. Brown I-25 plus nozzle series ......................................... 163
Figure A. 3 Plot of relationship between square root of nozzle pressure and flow rate for Gray I-25 plus nozzle series ........................................ 164
Figure A. 4 Plot of relationship between square root of nozzle pressure and flow rate for Dk. Brown................................................................... 165
Figure A. 5 The layout of sprinklers at the Littlefield site.............................................. 167
Figure A. 6 The irrigated area......................................................................................... 168
Figure B. 1 Collected leach water volume in each sampler on 10/07/2005 ................... 170

xiii
Figure B. 2 Collected leach water volume in each sampler on 11/28/2005 ................... 170
Figure B. 3 Collected leach water volume in each sampler on 12/29/2005 ................... 171
Figure B. 4 Collected leach water volume in each sampler on 2/10/2006 ..................... 171
Figure B. 5 Collected leach water volume in each sampler on 4/6/2006 ....................... 172
Figure B. 6 Collected leach water volume in each sampler on 5/25/2006 ..................... 172
Figure B. 7 Collected leach water volume in each sampler on 6/16/2006 ..................... 173
Figure B. 8 Collected leach water volume in each sampler on 7/21/2006 ..................... 173
Figure B. 9 Collected leach water volume in each sampler on 9/1/2006 ....................... 174
Figure B. 10 Collected leach water volume in each sampler on 9/22/2006 ................... 174
Figure B. 11 Collected leach water volume in each sampler on 10/12/2006 ................. 175
Figure B. 12 Collected leach water volume in each sampler on 11/22/2006 ................. 175
Figure B. 13 Collected leach water volume in each sampler on 1/9/2007 ..................... 176
Figure B. 14 Collected leach water volume in each sampler on 2/23/2007 ................... 176
Figure B. 15 Collected leach water volume in each sampler on 3/30/2007 ................... 177
Figure B. 16 Collected leach water volume in each sampler on 4/25/2007 ................... 177
Figure B. 17 Collected leach water volume in each sampler on 5/29/2007 ................... 178
Figure B. 18 Collected leach water volume in each sampler on 6/28/2007 ................... 178
Figure B. 19 Collected leach water volume in each sampler on 7/31/2007 ................... 179
Figure B. 20 Collected leach water volume in each sampler on 8/31/2007 ................... 179
Figure B. 21 Collected leach water volume in each sampler on 9/28/2007 ................... 180
Figure C. 1 Collected leach water volume in sampler 1 at different sampling date, mL................................................................................... 182
Figure C. 2 Collected leach water volume in sampler 2 at different sampling date, mL................................................................................... 183
Figure C. 3 Collected leach water volume in sampler 3 at different sampling date, mL................................................................................... 184
Figure C. 4 Collected leach water volume in sampler 4 at different sampling date, mL................................................................................... 185
Figure C. 5 Collected leach water volume in sampler 5 at different sampling date, mL................................................................................... 186
Figure C. 6 Collected leach water volume in sampler 6 at different sampling date, mL................................................................................... 187
Figure C. 7 Collected leach water volume in sampler 7 at different sampling date, mL................................................................................... 188

xiv
Figure C. 8 Collected leach water volume in sampler 8 at different sampling date, mL................................................................................... 189
Figure C. 9 Collected leach water volume in sampler 9 at different sampling date, mL................................................................................... 190
Figure C. 10 Collected leach water volume in sampler 10 at different sampling date, mL................................................................................... 191
Figure C. 11 Collected leach water volume in sampler 11 at different sampling date, mL................................................................................... 192
Figure C. 12 Collected leach water volume in sampler 12 at different sampling date, mL................................................................................... 193
Figure C. 13 Collected leach water volume in sampler 13 at different sampling date, mL................................................................................... 194
Figure C. 14 Collected leach water volume in sampler 14 at different sampling date, mL................................................................................... 195
Figure C. 15 Collected leach water volume in sampler 15 at different sampling date, mL................................................................................... 196
Figure C. 16 Collected leach water volume in sampler 16 at different sampling date, mL................................................................................... 197
Figure D. 1 Mass of total nitrogen in the leach water of each sampler, 10/07/2005 .............................................................................................. 199
Figure D. 2 Mass of total nitrogen in the leach water of each sampler, 11/28/2005 .............................................................................................. 199
Figure D. 3 Mass of total nitrogen in the leach water of each sampler, 12/29/2005 .............................................................................................. 200
Figure D. 4 Mass of total nitrogen in the leach water of each sampler, 2/10/2006 ................................................................................................ 200
Figure D. 5 Mass of total nitrogen in the leach water of each sampler, 4/6/2006 .................................................................................................. 201
Figure D. 6 Mass of total nitrogen in the leach water of each sampler, 5/25/2006 ................................................................................................ 201
Figure D. 7 Mass of total nitrogen in the leach water of each sampler, 6/16/2006 ................................................................................................ 202
Figure D. 8 Mass of total nitrogen in the leach water of each sampler, 7/21/2006 ................................................................................................ 202
Figure D. 9 Mass of total nitrogen in the leach water of each sampler, 9/1/2006 .................................................................................................. 203
Figure D. 10 Mass of total nitrogen in the leach water of each sampler, 9/22/2006 ................................................................................................ 203

xv
Figure D. 11 Mass of total nitrogen in the leach water of each sampler, 10/12/2006 .............................................................................................. 204
Figure D. 12 Mass of total nitrogen in the leach water of each sampler, 11/22/2006 .............................................................................................. 204
Figure D. 13 Mass of total nitrogen in the leach water of each sampler, 1/9/2007 .................................................................................................. 205
Figure D. 14 Mass of total nitrogen in the leach water of each sampler, 2/23/2007 ................................................................................................ 205
Figure D. 15 Mass of total nitrogen in the leach water of each sampler, 3/30/2007 ................................................................................................ 206
Figure D. 16 Mass of total nitrogen in the leach water of each sampler, 4/25/2007 ................................................................................................ 206
Figure D. 17 Mass of total nitrogen in the leach water of each sampler, 5/29/2007 ................................................................................................ 207
Figure D. 18 Mass of total nitrogen in the leach water of each sampler, 6/28/2007 ................................................................................................ 207
Figure D. 19 Mass of total nitrogen in the leach water of each sampler, 7/31/2007 ................................................................................................ 208
Figure D. 20 Mass of total nitrogen in the leach water of each sampler, 8/31/2007 ................................................................................................ 208
Figure D. 21 Mass of total nitrogen in the leach water of each sampler, 9/28/2007 ............................................................................................ 20909
Figure E. 1 Mass of salt in leach water of each sampler, 10/07/2005 ............................ 211
Figure E. 2 Mass of salt in leach water of each sampler, 11/28/2005 ............................ 211
Figure E. 3 Mass of salt in leach water of each sampler, 12/29/2005 ............................ 212
Figure E. 4 Mass of salt in leach water of each sampler, 2/10/2006 .............................. 212
Figure E. 5 Mass of salt in leach water of each sampler, 4/6/2006 ................................ 213
Figure E. 6 Mass of salt in leach water of each sampler, 5/25/2006 .............................. 213
Figure E. 7 Mass of salt in leach water of each sampler, 6/16/2006 .............................. 214
Figure E. 8 Mass of salt in leach water of each sampler, 7/21/2006 .............................. 214
Figure E. 9 Mass of salt in leach water of each sampler, 9/1/2006 ................................ 215
Figure E. 10 Mass of salt in leach water of each sampler, 9/22/2006 ............................ 215
Figure E. 11 Mass of salt in leach water of each sampler, 10/12/2006 .......................... 216
Figure E. 12 Mass of salt in leach water of each sampler, 11/22/2006 .......................... 216
Figure E. 13 Mass of salt in leach water of each sampler, 1/9/2007 .............................. 217
Figure E. 14 Mass of salt in leach water of each sampler, 2/23/2007 ............................ 217

xvi
Figure E. 15 Mass of salt in leach water of each sampler, 3/30/2007 ............................ 218
Figure E. 16 Mass of salt in leach water of each sampler, 4/25/2007 ............................ 218
Figure E. 17 Mass of salt in leach water of each sampler, 5/29/2007 ............................ 219
Figure E. 18 Mass of salt in leach water of each sampler, 6/28/2007 ............................ 219
Figure E. 19 Mass of salt in leach water of each sampler, 7/31/2007 ............................ 220
Figure E. 20 Mass of salt in leach water of each sampler, 8/31/2007 ............................ 220
Figure E. 21 Mass of salt in leach water of each sampler, 9/28/2007 ............................ 221

1
CHAPTER I
INTRODUCTION AND RESEARCH OBJECTIVES
1.1 Introduction
The quality and quantity of leachate water in the land application of
wastewater are important parameters to fully understand in order to design the most
environmentally friendly and functional system. The wastewater land application
system utilized in this study was designed primarily with the innovative design
approach, which includes a mass balance method, integrated with scheduled irrigation
events, field sampling, lab analysis, and statistics analysis.
1.2 Background of the study
It has been widely accepted by designers of wastewater treatment systems that
treated wastewater has the potential to provide a safe and feasible option to supply
crops and turf with water and nutrients (Toze 2004). Therefore, land treatment of
municipal wastewater is regarded as an alternative option for treating wastewater.
Primarily, land application of wastewater has been one solution used to reduce the
pressure on available fresh water resources. On one hand, many areas where humans
dwell on this earth is drying up due to global warming while on the other hand, the
global economy and population are increasing; therefore, the demand for water is
sharply increasing. This pronounced problem places high pressure on existing natural
water resources in many regions of the world (Toze 2004). Perth, Australia is one
typical example, where the major drinking water aquifer is being depleted because of
public needs and agriculture irrigation (Toze 2004). Saudi Arabia is another example
of a country with a water crisis due to increasing demands on groundwater by
agricultural irrigation (Bushnak 2002). Accordingly, many countries have to manage
water resources more efficiently than they did before in order to resolve the water
crisis problems confronting them. Fortunately, wastewater reuse as agricultural

2
irrigation water becomes a vital alternative resource to conserve water and improve
the efficiency of water use (Lazarova and Bahri 2005).
Wastewater reuse for irrigation can result in many environmental, economic,
and social benefits. The environmental benefits of wastewater reuse can be easily
identified. For example, wastewater application on land plays a significant role in
reducing or completely removing the potential pollution components of wastewater to
receiving water bodies such as lakes, rivers, and coastal marine environments (Toze
2004) because wastewater is disposed on the land rather than discharged to receiving
water bodies. More importantly, the wastewater applied to the land can effectively
substitute some parts of natural water used for irrigation, which is needed to be
extracted from natural water sources (Gregory 2000; U.S.EPA 1992), as a result, land
application of wastewater is helpful to reduce the pressure of agricultural irrigation on
natural water resources. Additionally, wastewater can supply the soil with organic and
inorganic nutrients in terms of nitrogen, phosphate, etc., which are used as a fertilizer
source when wastewater is recycled as crop irrigation water (Toze 2004). Besides
environmental benefits, surface application of wastewater can provide economic
benefits by lowering costs for such things as advanced wastewater treatment and
discharge, increasing land and property values, and obtaining additional revenue from
sale of recycled water and agricultural products (Lazarova and Bahri 2005). Land
application of wastewater can increase local food production, which is particularly
important for people and communities in arid or semi-arid and undeveloped regions
around the world.
Although land application of wastewater has significant benefits, there are a
few risks resulting from an improperly designed land application system. Those risks
may include nitrogen contamination of groundwater, salt accumulation in the soil, the
contaminations to groundwater of E. coli and pharmaceuticals and personal care
products (PPCPs), and the degradation of soil properties.
Currently, land treatment of wastewater is mainly executed by full-scale land
(or surface) application systems or on-site sewage facilities (OSSFs). Surface

3
application of wastewater for irrigation is possibly the oldest approach to treat and
dispose of wastewater. It was introduced in the United States in 1872 (Fedler et al.
2006). Although once considered an unacceptable treatment method for wastewater,
surface application of wastewater has been recognized as a complete wastewater
treatment alternative and the most common disposal method in the United States
(USEPA 1999). Surface application of wastewater utilizes the land, not just as a
treatment unit, but also a disposal area. This process has the advantage of satisfying
treatment effects, low costs and easy operations; therefore, many states in the U.S.
mandate that land application of wastewater be considered while new treatment
facilities are planned since the mid-1970s. On-site sewage facility (OSSF) is a
technical term in the state of Texas, USA, which is actually the form of on-site
wastewater treatment and disposal system for usually single family homes, especially
those in rural or non-sewered areas. Also, OSSF is referred to as on-site Wastewater
Treatment Systems (OWTS) by the U.S. Environmental Protection Agency (Wheeler
2005). OSSF is utilized by about 25 percent of all homes in the United States (Fedler
and Borrelli 2001). OSSF is typically classified as standard, non-standard, or
proprietary by the Texas Commission on Environmental Quality (Wheeler 2005).
Standard OSSF systems generally include a septic tank and some type of drainfield,
mainly absorptive, evapotranspirative, or pumped drainfield. Non-standard OSSF
systems mostly contain either a septic tank in combination with low-pressure dosing,
absorptive mounds, and soil substitution, or a septic tank followed by secondary
treatment, filtration, and surface application. Proprietary OSSF systems consist of
septic tanks with leaching chambers, gravelless pipe, or some aerobic systems with a
final disposal method (Wheeler 2005).
1.3 Research objectives
Although land application of wastewater has been one method used to save
fresh water resources in the world, it is still questioned as an environmentally safe
disposal method for municipal wastewater. One concern is the contamination of
groundwater by applied wastewater onto land. In order to reduce or even remove the

4
risk factors identified for wastewater reuse for agricultural irrigation, an alternative
design approach, combined mass balance approach, is proposed with consideration of
three important components of surface wastewater land application system, which are
water, nitrogen, and salt. All these three components are important individually to
impact the quantity and quality of leachate water passing through the plant root zone
to enter groundwater, and at same time, there are combined effects and interactions
among those components in the system. The accumulation of salts in soil and the loss
of nitrogen from the root zone down to the groundwater are closely related to the
quantity of leachate water. Generally speaking, more leached water is expected to
flush more salts down to the groundwater with a result of reducing the salt
accumulation in soil, but over leached water may flush more nitrogen to contaminate
the groundwater. In addition, the nitrogen contamination of groundwater in some way
depends on the quality of leachate water.
The combined mass balance approach for the design has been proposed for a
few years, however, there is no field research conducted on the approach, and no field
data to illustrate this method. The overall objective of this research is to investigate
the quantity and quality of leachate water that moves below the plant root zone of a
land application system designed from a mass balance approach. The potential
environmental impact in a wastewater land application system was to be evaluated in
terms of salt accumulation in soil and nitrogen contamination to groundwater. The
evaluation was based on measurement of the mass and concentration of nitrogen and
salt in leachate water. Specific data would be collected and the following data analysis
was to be processed for combined mass balance approach in order to provide the
proof of the feasibility of such a design method in some particular cases.
1.4 The professional significance of this study
First of all, this study was to investigate the feasibility of wastewater land
application as the potential water resources to irrigate turf. Although wastewater land
application has been widely accepted in the world as a methodology to reduce water
demand upon limited fresh water supplies, it is still a questioned approach.
5
Secondly, this study was to investigate the effects of wastewater land
treatment system with a new design approach, a mass balance method. In reality, there
are a few design methods for wastewater land treatment systems, however, some of
them are accepted, and the others are still in trial phase or in discussion. The mass
balance method, which was proposed by Texas Tech University, is supposed to be an
innovative way to design wastewater land application systems and to guide irrigation
events and practice. This study was undertaken to evaluate the effects of the proposed
design method under field conditions.
Thirdly, this study attempted to explore the models of quality and quantity of
leached water in the wastewater land treatment system designed with mass balance
method by field investigation, lab analysis, and statistical analysis. As stated above,
the mass balance method is a new design method. Once the method is proved to be
feasible and reasonable; the models of quality and quantity of leach water will be set
up for the predictions of quality and quantity of leach water in full-scale practice.
1.5 The delimitations of the study
In this research, the wastewater effluent is from a pond treatment system
located at the Littlefield, Texas municipal wastewater treatment plant. The wastewater
from Littlefield is collected and treated by an aerated pond system, and then goes to a
storage pond prior to irrigation. The quality of wastewater effluent used in irrigation
depends on the treatment process and climatic conditions at Littlefield.
The irrigation system involved in this research is a solid set sprinkler system
using popup rotary sprinklers. The characteristics and operation of this type of surface
application system determined the inherent water application efficiency, and
furthermore, ultimately impacted the quality and quantity of leached water in the soil-
water-plant system. The uniformity of the system is the primary concern, and it is
distinctly impacted by the design and the arrangement of sprinkler system, and local
climate conditions such as wind speed, wind direction, and temperature at the time of
irrigation event, which cannot be controlled by the researchers.

6
Reference
Bushnak, A. A. (2002). "Future strategy for water resources management in Saudi Arabia." A future vision for the Saudi Economy Symposium, Riyadh, p. 37.
Fedler, C. B., and Borrelli, J. (2001). "Re-evaluating Surface Application Rates for Texas OSSF Systems." Texas On-Site Wastewater Treatment Research Council.
Fedler, C. B., Duan, R., Green, C. J., and Borrelli, J. (2006). "Surface Application of Wastewater -A Mass Balance Approch." The 14th Annual Texas On-site Wastewater Treatment Research Council Conference, Waco, Texas.
Gregory, A. (2000). "Strategic direction of water recycling in Sydney, In Water Recycling Australia." Proceedings of the First Symposium Water Recycling Australia Adeliade, Australia, p. 35-41.
Lazarova, V., and Bahri, A. a. (2005). Water reuse for irrigation : agriculture, landscapes, and turf grass, CRC Press, Boca Raton.
Toze, S. (2004). "Reuse of effluent water-benefits and risks, “New directions for a diverse planet”." Proceedings of the 4th International Crop Science Congress, Brisbane, Australia.
U.S.EPA. (1992). "Guidelines for water reuse, Offices of Water and Wastewater and compliance (Ed.), U.S.EPA, Washington."
USEPA. (1999). "Decentralized Systems Technology Fact Sheet – Septage Treatment/Disposal, EPA-932-F-99-068, U.S. Environmental Protection Agency, Office of Water, Washington, D.C.".
Wheeler, J. L. (2005). "Fate of Nitrogen in On-site Surface Application Systems," Master Degree Thesis, Texas Tech University, Lubbock, Texas, USA

7
CHAPTER II
LITERATURE REVIEW
2.1 General land application systems
Land application is used to apply wastewater to land to achieve treatment of
wastewater by natural physical, chemical and biological processes in the soil-plant-water
matrix. Types of land application systems include slow rate (SR), overland flow (OF),
and rapid infiltration (RI) (Reed et al. 1995). Another method often used in OSSFs is
subsurface drip irrigation (DI).
Slow rate is the main type of wastewater application; the technology of which is
similar to that of agriculture irrigation, and which can be used in the widest range of
acceptable soil types and permeabilities (Reed et al. 1995). Rapid infiltration is used to
treat wastewater by allowing wastewater to percolate through permeable soils at loading
rates of 6-125 m/year. Although both SR and RI utilize the soil matrix for treatment
during infiltration of the wastewater down to groundwater, vegetation plays an important
role in SR while it is usually not a part of the RI systems (Reed et al. 1995). One of the
main differences between them is loading rate, which is generally 0.5-6 m/year for the SR
system (Reed et al. 1995), much less than that of RI. Overland flow is to apply
wastewater to a well-designed slope with vegetation, and then to collect treated
wastewater at the bottom of the slope. Soil surface and vegetation are used for treatment
in an OF system similar to a trickling filter.
2.2 Current design procedures for SR systems
Reed et al. (1995) stated that there were two types of SR systems. The type 1
system is so designed that the maximum possible amount of wastewater is applied to the
minimum possible land area with the consideration of the limiting design factor (LDF),
which includes hydraulic capacity of the soil profile and constituents of the wastewater.
The type 2 system is designed to take full advantage of wastewater as an irrigation source
such that wastewater is applied to the maximum possible amount of land. For Type 1
systems, Reed et al. (1995) proposed that most SR systems had two LDFs, hydraulic or
nitrogen loading rates. Loading rate is determined by choosing the smaller of both

8
loading rates, wastewater hydraulic loading rate (Lw) and hydraulic loading rate
controlled by nitrogen as the LDF (Lwn), calculated by regarding hydraulic capacity and
nitrogen content in wastewater as LDFs, respectively. Hydraulic loading rate for the Type
1 SR systems is (Reed et al. 1995):
wrw PPETL +−= (2.1)
where Lw = wastewater hydraulic loading rate, cm/week or m/yr (inches/week or ft/yr);
ET = evapotranspiration rate, cm/week or m/yr (inches/week or ft/yr);
Pr = precipitation rate, cm/week or m/yr (inches/week or ft/yr);
Pw = percolation rate, cm/week or m/yr (inches/week or ft/yr).
The design percolation rate Pw is calculated by the flowing equation (Reed et al.
1995):
)10.0 04.0)(/ 24()( todhKdailyPw = (2.2)
where Pw = design daily percolation rate, cm/d;
K = permeability of limiting soil layer, cm/h (in/h);
0.04 to 0.10 = adjustment factor to account for wet/dry ratio and ensure a
conservative value for infiltration of wastewater.
Hydraulic loading rate controlled by nitrogen as the LDF, Lwn, is (Reed et al.
1995):

9
pn
rpwn CCf
UETPCL
−−+−
=))(1(
)(10)(
(2.3)
where Lwn = hydraulic loading rate controlled by nitrogen as the LDF, cm/year;
Cp = percolate nitrogen concentration, mg/L, usually set at 10 mg/L;
ET = evapotranspiration rate, cm/yr;
Pr = precipitation rate, cm/yr;
U = crop uptake, kg/ha.yr;
f = fraction of applied nitrogen lost to denitrification, volatilization, and soil
storage, from 0 to 1, exclusive;
Cn = nitrogen concentration in applied wastewater, mg/L.
For the Type 2 systems, Reed et al. (1995) recommended the following equations
for design:
)/100)(1)(( ELRPETL rw +−= (2.4)
where LR = leaching requirement, it may range from 0.05 to 0.30;
E = efficiency of the irrigation system, it represents the fraction of the applied
water accounted for in crop consumptive use or ET. For surface irrigation systems, it
ranges from 0.65 to 0.75; for sprinkler systems, usually 0.7 to 0.8; for drip irrigation
systems, from 0.9 to 0.95.
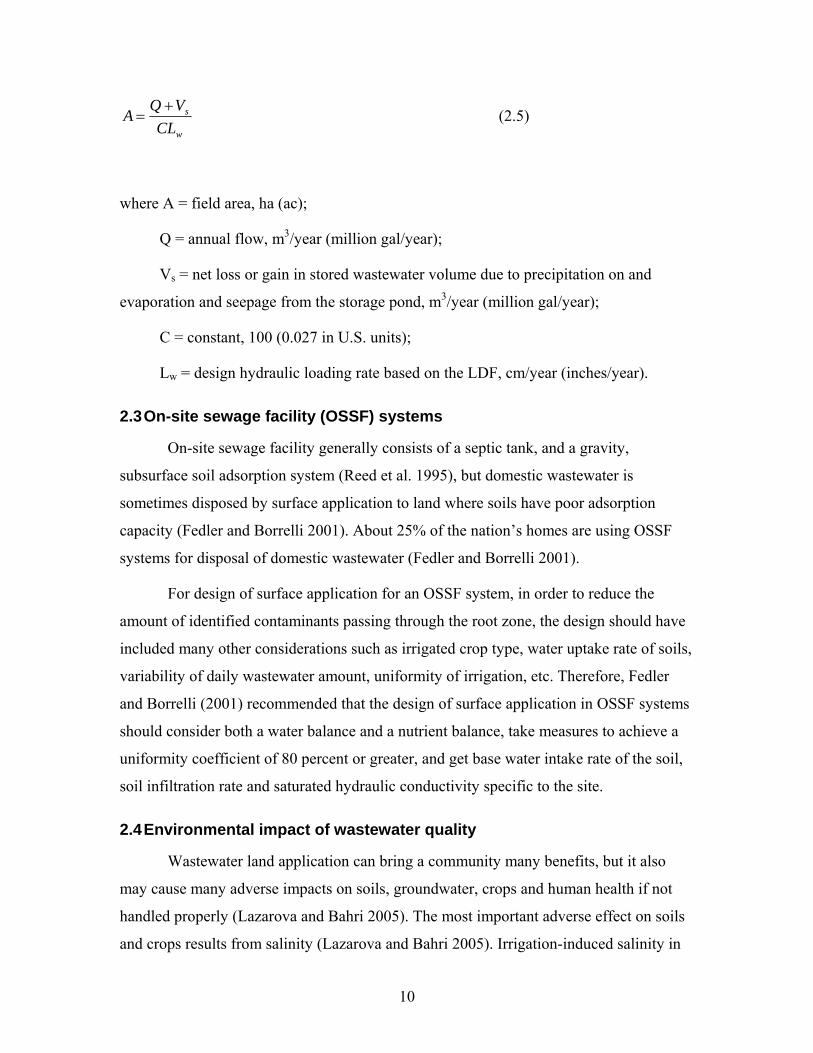
The land area is determined by the following equation (Reed et al. 1995):
10
w
s
CLVQA +
= (2.5)
where A = field area, ha (ac);
Q = annual flow, m3/year (million gal/year);
Vs = net loss or gain in stored wastewater volume due to precipitation on and
evaporation and seepage from the storage pond, m3/year (million gal/year);
C = constant, 100 (0.027 in U.S. units);
Lw = design hydraulic loading rate based on the LDF, cm/year (inches/year).
2.3 On-site sewage facility (OSSF) systems
On-site sewage facility generally consists of a septic tank, and a gravity,
subsurface soil adsorption system (Reed et al. 1995), but domestic wastewater is
sometimes disposed by surface application to land where soils have poor adsorption
capacity (Fedler and Borrelli 2001). About 25% of the nation’s homes are using OSSF
systems for disposal of domestic wastewater (Fedler and Borrelli 2001).
For design of surface application for an OSSF system, in order to reduce the
amount of identified contaminants passing through the root zone, the design should have
included many other considerations such as irrigated crop type, water uptake rate of soils,
variability of daily wastewater amount, uniformity of irrigation, etc. Therefore, Fedler
and Borrelli (2001) recommended that the design of surface application in OSSF systems
should consider both a water balance and a nutrient balance, take measures to achieve a
uniformity coefficient of 80 percent or greater, and get base water intake rate of the soil,
soil infiltration rate and saturated hydraulic conductivity specific to the site.
2.4 Environmental impact of wastewater quality
Wastewater land application can bring a community many benefits, but it also
may cause many adverse impacts on soils, groundwater, crops and human health if not
handled properly (Lazarova and Bahri 2005). The most important adverse effect on soils
and crops results from salinity (Lazarova and Bahri 2005). Irrigation-induced salinity in

11
soils restricts some crops from growing. One practice to avoid an over-accumulation of
salts within the root zone due to wastewater irrigation is to apply more water onto the
land in order to flush those salts down below the root zone. As a result, the groundwater
beneath the root zone will result in higher salt concentrations. Generally, the higher TDS
(total dissolved solids) in wastewater and the higher accumulation of salts within the root
zone result in higher volumes of wastewater required to be applied to flush salt from the
root zone (Lazarova and Bahri 2005). In addition, under normal irrigation of field crops,
water is also leached and causes the potential for higher TDS concentrations to occur in
groundwater because mostly the salt content in applied water is concentrated due to the
function of evapotranspiration after the water passes through the root zone.
Nitrogen must be considered in any land application system. In summary,
environmental issues concerning nitrogen at wastewater land application sites include
contamination to groundwater, contamination to surface water bodies, and greenhouse
gas such as N2O, which is one of the end products of denitrification. Nitrate leaching to
groundwater is an environmental concern for wastewater land application, because in
many locations groundwater is an important and main water source for human beings.
Nitrate in drinking water poses a potential health risk identified as “blue baby disease”
(Broadbent and Reisenauer 1985). Additionally, it has been related to cancer (Broadbent
and Reisenauer 1985). Environmental protection agency or regulatory agencies of many
countries set a maximum allowable concentration of nitrate in groundwater. Therefore, in
wastewater land treatment or application, the leached nitrate-nitrogen concentration
should be controlled to be below the drinking water standard of 10 mg/L of nitrate-
nitrogen. If runoff is not well controlled in a wastewater land application system, there is
the possibility that nitrogen can contaminate the surrounding surface water bodies.
Another new concern in recent years is greenhouse gas. As stated, nitrous oxide (N2O),
which is a product of denitrification in the land application system, contributes to global
warming and the destruction of the ozone layer (Cicerone 1989), therefore, some
researchers have started to work on the emissions of nitrous oxide from wastewater land
application sites.
Wastewater application can cause adverse impact on soil properties. It can reduce
the soil infiltration rate which leads to either lower application rates or more runoff on the

12
soil surface and potential contamination of water bodies around the irrigation sites. There
are three mechanisms contributing to lower permeability (Ks) of soils by wastewater
irrigation and they are physical, chemical, and biological processes. Soil filtration of
suspended solids in wastewater and their accumulation in the upper layer (0-20 mm) of
soil profile are the main reasons to explain physical clogging (De Vries 1972; Rice 1974).
Relatively higher concentrations of sodium or organic matter in wastewater often induce
chemical clogging by causing swelling and dispersing of clay particles (Menneer et al.
2001; Tarchitzky et al. 1999). Bacterial growth or accumulation of their by-products
under aerobic or anaerobic conditions in soils cause soil pore size to decrease, and finally
form biological clogging (Rice 1974; Vandevivere and Baveye 1992).
2.5 Leach water quality
2.5.1 BOD and Nutrients Biochemical Oxygen Demand (BOD) represents biological degradable organics.
BOD in leaching water is relatively much lower than raw sewage, but the addition of
organic matter can affect soil structure and stability. It was concluded (Potts et al. 2004)
that aeration in soils plays an important role to significantly remove BOD5 from applied
wastewater causing lower BOD in leach water of wastewater land application systems.
Nitrogen exists in the soil-plant-water matrix mainly in the forms of nitrate,
ammonia, and organic nitrogen. Both nitrate (NO3-) and ammonia (NH4
+) can be taken up
by plants, and eventually become organic nitrogen. There are a few transformations of
nitrogen in soils: ammonia volatilization, mineralization-immobilization, nitrification,
and denitrification. Ammonia volatilization is the release of ammonia to air when the pH
is higher resulting in more NH3 gas formation. Mineralization is the process of organic
nitrogen changed into inorganic nitrogen by bacteria. Immobilization is the process of
inorganic nitrogen changed into organic nitrogen, mostly by which inorganic nitrogen is
absorbed by plants and utilized by bacteria, and then become the part of plant tissue or
microorganisms. Nitrification occurs when bacteria change ammonia into nitrate with
oxygen as electron acceptor and hydrogen as electron donor. Denitrification is the
process of nitrogen changed into nitrogen gas (N2) or N2O by microorganisms. In most
negatively charged soils, nitrate-nitrogen is susceptible to leaching through the root zone

13
down to groundwater (Feigin et al. 1991); the reason is that nitrate is not readily adsorbed
by soil particles and is soluble in water. The leaching of nitrogen is related to soil type,
crop type, and irrigation management (Feigin et al. 1991). It was found that “the addition
of a layer of carbon material at least 0.3 m thick below a standard leachfields” (Bedessem
et al. 2005) substantially improved total N removal, and reduced the leaching of nitrogen
in an OSSF system. Also, Potts et al. (2004) found that aeration in soils significantly
helped to remove nitrogen from wastewater in leachfield.
In addition to nitrogen, another main nutrient, phosphorus, in soil-water-plant
matrix is essential for plants and soil microorganisms. Feigin et al. (1991) pointed out
that the amount of phosphorus added to the soil by wastewater land application was
usually excessive. Due to adsorption and precipitation of phosphorus in soil, soluble
phosphorus concentration decreases rapidly within a short time after phosphorus addition
by wastewater irrigation; also in the long term, plants use soluble phosphorus in soil
water and thus, reduce the level of soluble phosphorus in soil. As a result, soluble
phosphorus movement downward is limited and even phosphorus leaching has been
considered negligible (Feigin et al. 1991). However, when wastewater land treatment is
used as the primary approach to remove phosphorus in wastewater with high
concentration, phosphorus leaching becomes a concern. Excessive application of
phosphorus may cause deficiencies of other nutrients such as copper and zinc in the soil
(Lazarova and Bahri 2005).
2.5.2 Pharmaceuticals and personal care products
Recently, pharmaceuticals and personal care products (PPCPs) have become a
concern for wastewater land application systems. Wastewater contains a variety of
hormones; therefore, their application may cause fertility problems in animals feeding on
crops irrigated by wastewater (Lazarova and Bahri 2005). Other concerns with PPCPs in
wastewater used for irrigation are endocrine disruptors, “at least 45 chemicals have been
identified as potential endocrine-disrupting contaminant (EDC), including industrial
contaminants like dioxins and PCBs, insecticides like carbaryl and DDT, and herbicides
like 2, 4-D and atrazine” (Lazarova and Bahri 2005).

14
The investigation completed by the U.S. Geological Survey found that organic
wastewater contaminants (OWCS), which include pharmaceuticals, hormones, and other
organic contaminants, were found in 80% of the streams sampled during the study
(Kolpin et al. 2002). An investigation completed in Germany illustrated that
pharmaceutical residuals were found in surface water, sewage, and groundwater, and the
amount of pharmaceuticals have the same order of magnitude as pesticides applied in
agriculture (Stan and Heberer 1997). It was addressed (Godfrey et al. 2007) that in
Western Montana, twelve compounds (acetaminophen, caffeine, codeine, carbamazepine,
cotinine, erythromycin-18, nicotine, paraxanthine, ranitidine, sulfamethoxazole,
trimethoprim, and warfarin) were detected in a high school septic tank effluent. The fate
of PPCPs in arable land application system in Braunschweig, Germany was investigated
(Ternes et al. 2007), which was irrigated with treated municipal wastewater mixed with
digested sludge in summer and without digested sludge in winter for more than 45 years.
The selected PPCPs included 52 pharmaceuticals and two personal care products, most of
which were not detected in groundwater (Ternes et al. 2007). The PPCPs primaryly
detected were the ICM diatrizoate and iopamidol, the antiepileptic carbamazepine and the
antibiotic sulfamethoxazole with concentrations up to several mg/L, and some of PPCPs
like the acidic pharmaceuticals, musk fragrances, estrogens and betablockers were
possibly adsorbed to soil particles or transformed in the land application system (Ternes
et al. 2007). When discussing the fate of PPCPs in wastewater land application system,
the soil properties should be considered; those properties mainly contain soil grain size
distribution, pH, and the content of organic carbon (Oppel et al. 2004). During the
research on the leaching of PPCPs, Oppel et al. (2004) found that the leaching potential
of diazepam, ibuprofen, ivermectin and carbamazepine could be rated as low if the soil
layers are sufficient above the groundwater table; however, clofibric acid and iopromide
were very mobile with high leaching potential under the experimental conditions. There
is a discrepancy that the occurrence of carbamazepine is frequently detected in
groundwater, the reason may be that carbamazepine leaches down to the groundwater by
river sediments and subsoil from receiving waters in reality rather than similar soils used
in the research (Oppel et al. 2004).

15
In Germany, clofibric acid concentrations up to 165 ng/L (Stan et al. 1994) and
270 ng/L (Heberer et al. 1998) have been confirmed in drinking water, the source of
which is groundwater recharged by contaminated wastewater treatment plant effluents
(Daughton and Ternes 1999), clofibric acid is an antilipaemic agent and the biologically
active metabolite of clofibrate, which is a fibric acid derivative used in the treatment of
type III hyperlipoproteinaemia and severe hypertriglyceridem. The results of another
study in Germany showed that “many pharmaceuticals could not be biodegraded during
conventional biological treatment, nor could they be adsorbed by sewage sludge” (Adams
et al. 2002; Kummerer et al. 1997). Although the research on the fate of PPCPs in soils
after wastewater irrigation is scarce, many mechanisms are not clear; the pathways after
they are applied to land via wastewater stimulate researchers’ interests. It was stated
(Kinney et al. 2006) that four kinds of PPCPs were detected at three sites in the Front
Range of Colorado, USA, from May through September 2003, where they intended to
assess the presence and distribution of pharmaceuticals in soil irrigated with reclaimed
water derived from urban wastewater. Those PPCPs were erythromycin, carbamazepine,
fluoxetine, and diphenhydramine, whose typical concentrations were as low as 0.02-15
mg/kg dry soil. However, the investigation also illustrated that those chemicals’
concentrations in soil varied through seasons and persisted for a few months after
wastewater irrigation events. Recently, research has focused on the adsorption and
desorption of PPCPs in soils after wastewater land application (Drillia et al. 2005;
Figueroa et al. 2004; Hashsham and Freedman 2003; Kay et al. 2005; Williams et al.
2006). It is accepted that sorption partly determines the movement of PPCPs in soils. The
higher adsorption and the less desorption, the less PPCPs will leach down to contaminate
groundwater. This explains why clofibric acid can be found in some groundwater in
Germany since it is weakly adsorbed by soil particles. Some of estrogenic hormones go
through chemical processes to be removed and some of them are removed by
biochemical process. For example, 17β-Estradiol is oxidized to estrone in soils with an
abiological transformation (Colucci et al. 2001), however, the removal of estrone
(Colucci et al. 2001) and 17α-ethynylestradiol (Colucci and Topp 2001) are microbially
mediated; “17α-ethynylestradiol is rapidly dissipated in agricultural soils under a range of
conditions typical of a temperate growing season” (Colucci and Topp 2001). The

16
bioavailability and mobility of PPCPs depend on their sorption potential to soil particles.
Gao and Pedersen (2004) found that sulfonamides have week sorption potential to both
clay minerals and natural organic matter and the sorption was strongly pH dependent
(Gao and Pedersen 2004).
2.6 Escherichia coli in soils after wastewater irrigation
2.6.1 Introduction It has been accepted that wastewater is an important source of irrigation water and
fertilizer in agriculture (Malkawi and Mohammad 2003), especially in arid or semi-arid
areas in the world. However, it is reasonable to speculate that secondary wastewater
effluent probably contains residual pathogen even if wastewater is fully treated in
developed countries; due to the economic reasons, in developing countries, untreated
domestic wastewater is often used as agriculture irrigating water (Santamaria and
Toranzos 2003). On the other hand, wastewater land application is also considered as a
potential way to remove pathogens. As a result, a pathogen might be brought to the
environment again by wastewater irrigation and threaten human health. Agricultural soils
are places for producing food for customers and places where farm workers work thus, it
is not difficult to understand that irrigating wastewater is identified as one of sources of
pathogens in agricultural fields (Gerba and Smith 2005).
Although wastewater has been applied to land systems for many years, and
recently more and more wastewater is irrigated to relieve the water resources pressure in
the world, data on pathogen in soils after wastewater irrigation is scarce and the relative
research and study are limited (Van Cuyk et al. 2004). One reason of concern about the
effect of wastewater irrigation on public health lies in the fact that the fate of pathogens
in the soils is not well understood (Santamaria and Toranzos 2003) after wastewater
irrigation.
2.6.2 Total coliform, fecal coliform, and E. coli Total coliform (TC), fecal coliform (FC) and E. coli are main indexes to judge
contamination of enteric pathogens in water. TC are aerobic or facultatively anaerobic,
gram-negative, non-spore forming, rod-shaped bacteria that ferment lactose with gas
production in 24 to 48 hours (Entry and Farmer 2001); FC is a subset of TC, which

17
originates from intestinal tracts of homothermic animals. Their presence in water implies
the potential presence of pathogenic contamination from warm-blooded animals (Entry
and Farmer 2001).
E. coli is the subset of FC, and often used as indicator of fecal contamination of
water due to the relatively simple, fast, and reliable detection technique. E. coli are gram-
negative, facultative anaerobic, straight, rod-shape bacteria, and considered as fecal
origin. Most members of E. coli are harmless, but some of them are enteric pathogens.
Currently, the most well-known pathogenic E. coli is O157:H7 (Foppen and Schijven
2006). E. coli are hydrophilic and strongly negatively charged (Foppen and Schijven,
2006). Those particular characteristics of E. coli determine the initial adhesion of E. coli
to the surface of soil media (Foppen and Schijven 2006), and their fate in soils.
2.6.3 Distribution of E. coli at different depth of soil It was observed (Schaub and Sorber 1977) that the largest concentration of enteric
pathogen often occurred at the soil surface, and the concentration of pathogenic bacteria
dropped sharply below the soil surface and declined at a slower rate as sampling depth
increased. Another similar observation was made (Malkawi and Mohammad 2003) that
bacterial counts were higher in surface soil than in the first few centimeters of soil from
soil surface after wastewater irrigation events.
Malkawi and Mohammad (2003) found that although wastewater irrigation didn’t
significantly stimulate or inhibit the total aerobic bacteria at the soil surface, the numbers
of total coliforms and fecal coliforms were so high, 2.1×10³ CFU/g to 4.2×10³ CFU/g and
1.2×10² CFU/g to 4.2×10² CFU/g respectively, that they strongly suggested that it was
necessary to treat wastewater to the degree at which no or few pathogens would be
detected in soils after wastewater irrigation. The concentrations of fecal coliform in
leaching water may be estimated by the concentrations in soil solids (Van Cuyk et al.
2004).
2.6.4 Factors impacting persistence of E. coli in soils A few mechanisms can explain the removal of E. coli in soils after wastewater
irrigation and the distribution difference at different depth in wastewater irrigated soils.
Soils have the ability to remove part of the pathogens in irrigated wastewater going

18
through it down to the groundwater with filtration, sedimentation and adsorption (Gilbert
et al. 1976; Page et al. 1986).
There are many factors impacting transport, survival, and persistence of E. coli in
soils. Those factors include soil water holding capacity, pH, soil organic matter content,
nutrient availability (Gilbert et al. 1976), the nature of pathogen, temperature, antagonism
in soil (Gerba and Goyal 1984), soil moisture, concentration of salts in soil-water
environment (Bartone and Arlosoroff 1987; Gilbert et al. 1976; Tate 1978), climate
conditions including rainfall (Gilbert et al. 1976; Saini et al. 2003), tillage (McMurry et
al. 1998), sunlight, toxic substance, dissolved oxygen (Foppen and Schijven 2006), CEC
and texture of soils (Page et al. 1986) and so on.
In 2001, Entry and Farmer found that the slower flow and finer-grain-sized sand
aquifer might filter more TC and FC from wastewater than the faster flow and coarser
basalt aquifer. It was concluded (Powelson and Mills 2001) that constant unsaturated
flow was better to remove pathogens than saturated and variable unsaturated flow during
simulated infiltration to investigate the relation of soil volumetric water content to
bacteria (E. coli) removal by soil systems. It is interesting and pointed out (Sharples et al.
2004) that E. coli had the ability to grow in soils; therefore, the contamination with fecal
pathogen could be either recent or past.
It can be safe to conclude that the fate and removal of E. coli in soils are
determined by multi-factors. Therefore, early in 1976, Gilbert et al. recommended that
such studies should be executed individually, and, similarly, the optimum amounts and
application rate of wastewater, which would not have severe health risks to human,
should be determined individually. Later in 2003, Santamaria and Toranzos also
suggested that the similar studies were supposed to be carried out in different types of
soil.
2.6.5 The fate of E. coli O157:H7 and model of E. coli transport in soils
E. coli O157:H7 is listed here on purpose because it is a pathogen from
wastewater irrigation that causes many human diseases such as diarrhea, hemorrhagic
colitis, and complications including hemolytic uremic syndrome (Wikipedia 2008). This

19
fact stimulated interests of researchers in recent years. E. coli O157:H7 is a robust
pathogen (Maule 2000) and can survive in soil samples for 154-196 days (Islam et al.
2005). After a few experiments on its survival in soil systems, it was found (Ibekwe et al.
2004) that E. coli O157:H7 had higher concentration in the rhizosphere soils than in the
non-rhizosphere soils and leaf surfaces, and persisted longer in clay soil than other types
of soils. It was concluded (Gagliardi and Karns 2000) after the research that there was a
correlation of ammonia and nitrate levels with E. coli O157:H7 and total coliform levels
in leaching water. They also speculated that soluble nitrogen might promote E. coli
O157:H7’s transport. Turbidity in leaching water did not correlate with the movement of
this type of E. coli and its movement was probably not as they anticipated as compared to
the particles’ movement in soils. In addition, it was discovered (Gagliardi and Karns
2002) that clay, plant roots, and freezing increased persistence and activity of E. coli
O157:H7 and other coliforms.
Wang et al. (2003) tried to use a kinetic second-order model along with one-
dimension convection-dispersion equation to describe E. coli transport through 20 cm
sand columns. They thought that the most likely mechanism was physical entrapment of
bacteria within sands and sand size was the main factor in E. coli transport under
saturated flow conditions in sand columns. Their research proved that the finer the sand
size, the greater the entrapment capacity of E. coli in designed sand columns (Wang et al.
2003).
2.6.6 Concluding remarks It is obvious that there is much more work to be done investigating the fate of E.
coli in soils irrigated with wastewater. There is currently insufficient data and no
effective models to understand and describe transport and survival of E. coli in soils.
The distribution at different locations in soils is so complex that it is tough to
carry out the relative research. Maybe future research should be focused on the individual
or particular research as Gilbert et al. proposed in 1976.

20
2.7 Relationships in soil-water-plant-air system
In reality, the relationships between the components of a soil-water-plant-air
system are complex. The following is the description of those relationships based on the
consideration of them in land application systems.
2.7.1 Water-plant relationship
Water is the media of chemical and biochemical processes that support plant
metabolism. Water is a component of plant tissue. Water moves the plant-requiring
substances and nutrients in soils to the roots of plants, and then moves them up to the
leaves, finally, some of water transpires from plants. Such a pathway of water in plants in
conjunction with water evaporation from surrounding soil surface, and water
consumptive use by plants as a part of their bodies, form an important design parameter,
evapotranspiration (ET). The evapotranspiration from a crop is defined by Brouwer et al.
(1985) as the total amount of soil water used for transpiration by the plants and
evaporation from the surrounding soil surface. In reality, the crop ET is the amount of
water utilized by the crop and its environment (Brouwer et al. 1985).
This part of water loss is one important component in water balance during
wastewater land treatment design. ET is influenced by climate conditions (temperature,
wind speed, relative humidity, and solar radiation), soil moisture and texture, and crop
type and growth.
ET varies for different crops and grass, even for the same plant, ET still varies
because of the growth stage and plants spacing (Brouwer et al. 1985). Generally, ET
determination for field type crops and grass crops is different and the related methods for
Texas were determined by Borrelli (1998).
2.7.2 Soil air-soil water relationship More oxygen can enter into wastewater when it is surface-applied onto land
because the contact area between air and water is increased. Oxygen in wastewater in
soil-water system is an important factor controlling substance redox reactions and
microorganism biochemical processes. More oxygen in wastewater causes less
denitrification because denitrification is principally an anaerobic process.

21
There are two types of pore spaces in soil: capillary spaces and non-capillary
spaces (Ferguson 1950). The former is important to soil water holding capacity; the latter
is important to soil aeration (Ferguson 1950). Soil pore spaces are filled with water
and/or air. When water goes in soil, air goes out of soil; when water goes out of soil, air
goes in (Ferguson 1950). Soil water has three classes: gravitational water, capillary water,
and hygroscopic water (Ferguson 1950). Soil water and soil air should be available for
plants growth in the soil-water-plant-air system; therefore, land should not be over-
irrigated causing plants to have no soil oxygen available on their root surface which
causes plant wilt (Ferguson 1950). It is necessary to keep a balance between soil water
and soil air.
2.7.3 Soil-plant Soil is the media that supports plant growth. Soil provides plants a place to
develop a root system and absorb water and nutrients.
One important consideration of soil and plant relationship in wastewater land
treatment design is soil salinity. Once enough salts accumulate in the root zone, soil
salinity will become a severe problem for some plants growth. Those excess salts in the
root zone hamper the plants ability to absorb water from the surrounding soil due to the
increased osmotic pressure required by the plant to take up the water. Plants need more
energy to pump water from soil to the plant tissue. As a result, excess salts in soil can
“decrease plant available water and cause plant stress” (Pearson 2003). The adverse
effects of salts on plants are inhibition of germination, reduced rates of plant growth,
reduced yields, and even total crop failure (Rhoades and Loveday 1990).
Therefore, to avoid excess salt accumulation in soil, more water is required to be
applied onto land to flush salts down through the root zone. The following equation can
be used to determine the leaching requirements for typical sprinkler irrigation systems
(Ayers and Westcot 1976):
we
w
ECECECLR−
=5
(2.6)

22
where, LR is the minimum leaching requirement needed to control salt accumulation in
the soil; ECw is the electrical conductivity of the effluent (micromhos/cm) (note, 1 dS/m
is equal to 1 mmho/cm); ECe is the electrical conductivity of the saturation extract of soil
for a given crop appropriate to the tolerable degree of yield reduction--usually 10% or
less (micromhos/cm).
The potential yield reduction of a crop as a function of ECe is found in Ayers and
Westcot (1976). In the design of wastewater land treatment, crops should be carefully
selected according to the soil salinity. The plants should be tolerant of the salinity level in
soil. Field type crops and grass crops have different tolerance of salt levels in soils. In
addition, the size and distribution of the root zone of field type crops are different from
grass crops.
2.7.4 Soil-water relationship For someone to develop the successful irrigation practice and irrigation
scheduling required for land treatment of wastewater effluent, they need to understand
the principles involved with the relationship between soil and water. The quality of
irrigated water may have important impacts on the change of soil properties such as
salinity and infiltration.
2.7.4.1 Entry of wastewater into soil Two important concepts related to the movement of water in soil: infiltration and
soil hydraulic conductivity. Those two soil physical properties are related to the irrigation
scheduling such as the maximum application rate and the lengths of irrigation events.
The Food and Agriculture Organization (FAO) defines the infiltration rate of a
soil as the velocity at which water can seep into it. It is commonly expressed as a depth
per time and it is influenced by soil texture, soil structure, and soil moisture content.
Another concept is soil hydraulic conductivity, which is an important soil property to
reflect the potential movement of water in soils. When all pores are filled with water, the
soil hydraulic conductivity is called saturated hydraulic conductivity, otherwise,
unsaturated conductivity.
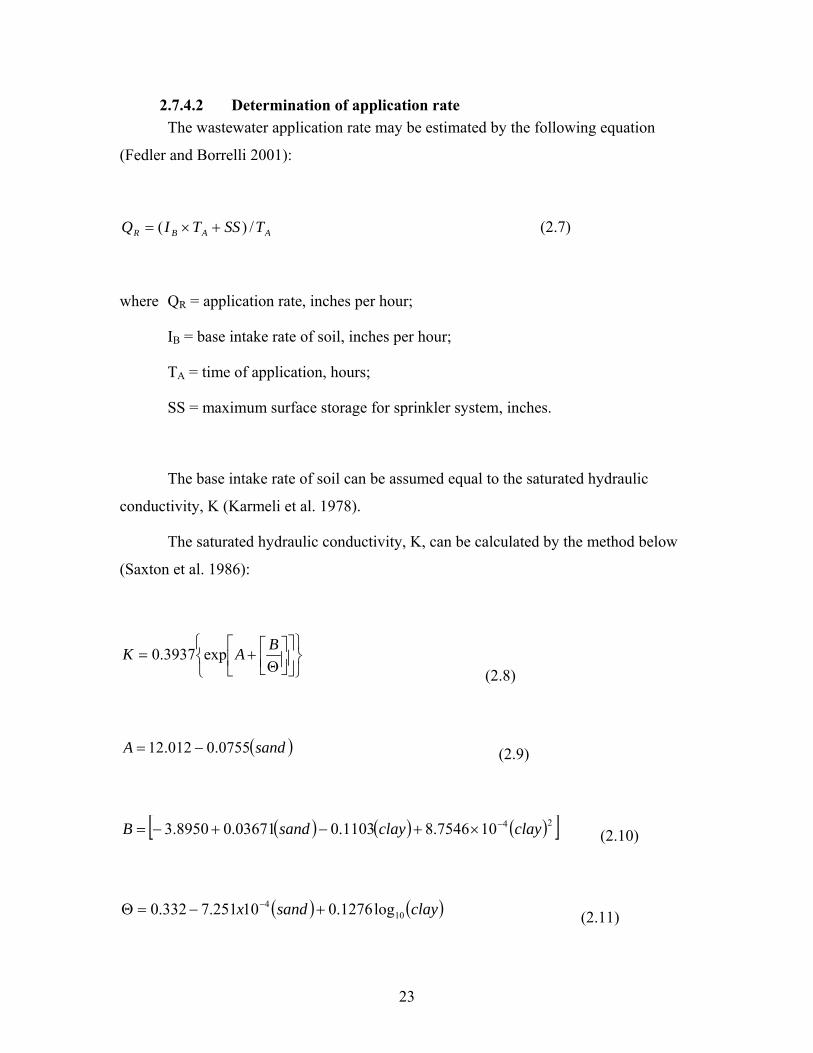
23
2.7.4.2 Determination of application rate The wastewater application rate may be estimated by the following equation
(Fedler and Borrelli 2001):
AABR TSSTIQ /)( +×= (2.7)
where QR = application rate, inches per hour;
IB = base intake rate of soil, inches per hour;
TA = time of application, hours;
SS = maximum surface storage for sprinkler system, inches.
The base intake rate of soil can be assumed equal to the saturated hydraulic
conductivity, K (Karmeli et al. 1978).
The saturated hydraulic conductivity, K, can be calculated by the method below
(Saxton et al. 1986):
⎭⎬⎫
⎩⎨⎧
⎥⎦
⎤⎢⎣
⎡⎥⎦⎤
⎢⎣⎡Θ
+=BAK exp3937.0
(2.8)
( )sandA 0755.0012.12 −= (2.9)
( ) ( ) ( )[ ]24107546.81103.003671.08950.3 clayclaysandB −×+−+−= (2.10)
( ) ( )claysandx 104 log1276.010251.7332.0 +−=Θ −
(2.11)

24
where K = saturated hydraulic conductivity, inches/hr;
Θ = soil moisture content, ft3/ft3;
sand = sand content in the soil, percent;
clay = clay content in the soil, percent.
2.7.4.3 Soil moisture content to understand the water moisture in water balance
There are three soil moisture conditions, which are saturated, field capacity, and
permanent capacity (Figure 2.1). Saturated condition means all soil pores are filled with
water; field capacity is the soil moisture condition, which refer to “after the drainage has
stopped (approximately 2 days), the large soil pores are filled with both air and water
while the smaller pores are still full of water. At this stage, the soil is said to be at field
capacity. At field capacity, the water and air contents of the soil are considered to be ideal
for crop growth” (Brouwer et al. 1985); And Permanent wilting point is the point when
the soil water content at the stage where it is not available for plants uptake and plant
dies. The amount of water available to plants is calculated by the difference in moisture
content between field capacity and permanent wilting point. It is controlled by soil nature
(soil porosity, texture, structure, and organic matter content) and the root- zone depth.

25
Figure 2. 1 Water conditions in the soil profile of a surface application system.

26
2.7.4.4 Soil salinity, sodicity, and their influence on the physical properties of soil
Wastewater irrigation may increase soil salinity and sodicity. Sodicity is the
amount of sodium present in soil. High salinity and sodicity in wastewater can increase
the soil salinity and sodicity, and cause problems for plants and soil physical properties.
Soil water salinity has positive effect on soil aggregation and stabilization, but high level
of salts has severe effects on plants (Pearson 2003). “The three main problems due to
sodium-induced dispersion are reduced infiltration, reduced hydraulic conductivity, and
surface crusting” (Pearson 2003). Because Ca and Mg have no similar effects on soil
properties as Na, they generally keep soil flocculated, so increased amounts of Ca and
Mg can reduce the effects due to Na on soils (Pearson 2003).
To reduce the negative effects of soil salinity and sodicity on soil physical
properties induced by wastewater irrigation, some more wastewater is applied in order to
leach more water down through the root zone resulting in flushing out of salts including
sodium bound in the soil. The leaching requirement is determined by Equation 2.6.
TDS is a term defining total dissolved solids in water or wastewater; sometimes,
TDS can be used to express salinity of wastewater. Salinity in irrigating water is an
important parameter influencing the soil infiltration rate. Sodium is a unique cation due to
its effect on soil properties (Lazarova and Bahri 2005). When sodium is present in an
exchangeable form, sodium may cause adverse physical-chemical changes, particularly to
soil structure resulting dispersion of particles and low soil infiltration rate (Lazarova and
Bahri 2005). If sodium in applied water is at high levels, soil hydraulic ability or
infiltration ability tends to decrease as Exchangeable Sodium Percentage (ESP) increases,
as a result, clay swells, disperses, and plugs the conducting pores in soils, all of which
causes low soil infiltration rate (Al-Haddabi et al. 2004).
The reliable index of the sodium hazard of irrigation water is the sodium
adsorption ratio SAR, defined by Equation 2.12:
2/)( MgCaNaSAR+
= (2.12)

27
where, the ion concentrations are expressed in mEq/L.
The threshold value of SAR of less than 3 indicates no restriction on the use of
wastewater for irrigation, while SAR with a value larger than 9 has a severe damage on
infiltration rate (Lazarova and Bahri 2005). At a given SAR, the infiltration rate increases
as salinity increases or decreases when salinity decreases. SAR and salinity should be
used in combination to evaluate the potential soil infiltration problem (Lazarova and
Bahri 2005).

28
Reference
Adams, C., Wang, Y., Loftin, K., and Meyer, M. (2002). "Removal of antibiotics from surface and distilled water in conventional water treatment processes." Journal of Environmental Engineering-Asce, 128(3), 253-260.
Al-Haddabi, M., Ahmed, M., Kacimov, A., Rahman, S., and Al-Rawahy, S. (2004). "Impact of treated wastewater from oil extraction process on soil physical properties." Communications in Soil Science and Plant Analysis, 35(5-6), 751-758.
Ayers, R. S., and Westcot, D. W. (1976). "Water Quality for Agriculture." FAO Irrigation and Drainage Paper No. 29, FAO, United Nations, Rome.
Bartone, C. R., and Arlosoroff, S. (1987). "Irrigation reuse in pond effluent in developing countries." Water Science and Technology, 19, 289-297.
Bedessem, M. E., Edgar, T. V., and Roll, R. (2005). "Nitrogen removal in laboratory model leachfields with organic-rich layers." J. Environ. Qual., 34, 936-942.
Broadbent, F. E., and Reisenauer, H. M. (1985). Fate of wastewater constituents in soils and groundwater: nitrogen and phosphorous, Chapter 12 in irrigation with reclaimed municipal wastewater – A guidance manual, Pettygrove, G.S. and T. Asano, eds. Lewis Publishers, Inc. 1985.
Brouwer, C., Goffeau, A., and Heibloem, M. (1985). Irrigation Water Management: Training Manual No. 1 - Introduction to Irrigation, Provisional edition, Food and Agriculture Organization of the United Nations, seen at: http://www.fao.org/docrep/R4082E/r4082e00.htm#Contents.
Cicerone, R. J. (1989). "Analysis of Sources and Sinks of Atmospheric Nitrous-Oxide (N2o)." Journal of Geophysical Research-Atmospheres, 94(D15), 18265-18271.
Colucci, M. S., Bork, H., and Topp, E. (2001). "Persistence of estrogenic hormones in agricultural soils: I. 17 beta-estradiol and estrone." Journal of Environmental Quality, 30(6), 2070-2076.
Colucci, M. S., and Topp, E. (2001). "Persistence of estrogenic hormones in agricultural soils: II. 17 alpha-ethynylestradiol." Journal of Environmental Quality, 30(6), 2077-2080.
Daughton, C. G., and Ternes, T. A. (1999). "Special report: Pharmaceuticals and Personal Care Products in the Environment: Agents of Subtle Change? ." Environmental Health Perspectives, Vol. 107(Supplement 6), 907-944.
De Vries, J. (1972). "Soil filtration of wastewater effluent and the mechanism of pore clogging." J. Water Pollut. Control Fed., 44(3), 565–573.
Drillia, P., Stamatelatou, K., and Lyberatos, G. (2005). "Fate and mobility of pharmaceuticals in solid matrices." Chemosphere, 60(8), 1034-1044.
Entry, J. A., and Farmer, N. (2001). "Movement of coliform bacteria and nutrients in ground water flowing through basalt and sand aquifers." J Environ Qual, 30(5), 1533-9.
Fedler, C. B., and Borrelli, J. (2001). "Re-evaluating Surface Application Rates for Texas OSSF Systems." Texas On-Site Wastewater Treatment Research Council.

29
Feigin, A., Ravina, I., and Shalhevet, J. (1991). Irrigation with treated sewage effluent: management for environmental protection, ISBN: 038750804X, Berlin; New York: Springer-Verlag, c1991.
Ferguson, M. H. (1950). "Soil water and soil air: Their relationship to turf production." USGA Journal, July 1950.
Figueroa, R. A., Leonard, A., and Mackay, A. A. (2004). "Modeling tetracycline antibiotic sorption to clays." Environmental Science & Technology, 38(2), 476-483.
Foppen, J. W. A., and Schijven, J. F. (2006). "Evaluation of data from the literature on the transport and survival of Escherichia coli and thermotolerant coliforms in aquifers under saturated conditions." Water Research, 40(3), 401-426.
Gagliardi, J. V., and Karns, J. S. (2000). "Leaching of Escherichia coli O157:H7 in diverse soils under various agricultural management practices." Appl Environ Microbiol, 66(3), 877-83.
Gagliardi, J. V., and Karns, J. S. (2002). "Persistence of Escherichia coli O157:H7 in soil and on plant roots." Environ Microbiol, 4(2), 89-96.
Gao, J., and Pedersen, J. A. "Sorption of sulfonamide antimicrobials to clay and natural organic matter." On-Site Wastewater Treatment X, Conference Proceedings, 21-24 March 2004, Sacramento, California, USA, ASAE Publication Number 701P0104, ed. K.R. Mankin, 733-739
Gerba, C. P., and Goyal, S. M. (1984). Pathogen removal from wastewater during groundwater recharge. Artificial Recharge of Groundwater (Asano, T., Editor), Butterworth Publishers, p.317, Boston, Massachusetts.
Gerba, C. P., and Smith, J. E., Jr. (2005). "Sources of pathogenic microorganisms and their fate during land application of wastes." J Environ Qual, 34(1), 42-8.
Gilbert, R. G., Gerba, C. P., Rice, R. C., Bouwer, H., Wallis, C., and Melnick, J. L. (1976). "Virus and bacteria removal from wastewater by land treatment." Appl Environ Microbiol, 32(3), 333-8.
Godfrey, E., Woessner, W. W., and Benotti, M. J. (2007). "Pharmaceuticals in on-site sewage effluent and ground water, Western Montana." Ground Water, 45(3), 263-71.
Hashsham, S. A., and Freedman, D. L. (2003). "Adsorption of vitamin B-12 to alumina, kaolinite, sand and sandy soil." Water Research, 37(13), 3189-3193.
Heberer, T., Schmidt-Baumler, K., and Stan, H.-J. (1998). "Occurrence and distribution of organic contaminants in the aquatic system in Berlin. Part I: Drug residues and other polar contaminants in Berlin surface and ground water." Acta Hydrochim Hydrobiol 26(5), 272-278.
Ibekwe, A. M., Watt, P. M., Shouse, P. J., and Grieve, C. M. (2004). "Fate of Escherichia coli O157:H7 in irrigation water on soils and plants as validated by culture method and real-time PCR." Can J Microbiol, 50(12), 1007-14.
Islam, M., Doyle, M. P., Phatak, S. C., Millner, P., and Jiang, X. P. (2005). "Survival of Escherichia coli O157 : H7 in soil and on carrots and onions grown in fields treated with contaminated manure composts or irrigation water." Food Microbiology, 22(1), 63-70.
Karmeli, D., Salazar, L. L., and Walker, W. R. (1978). Assessing the Spatial Variability of Irrigation Water Applications, EPA-600/2-78-041. U.S. Environmental
30
Protection Agency, Robert S. Kerr Environmental Research Laboratory. Ada, Oklahoma.
Kay, P., Blackwell, P. A., and Boxall, A. B. (2005). "A lysimeter experiment to investigate the leaching of veterinary antibiotics through a clay soil and comparison with field data." Environ Pollut, 134(2), 333-41.
Kinney, C. A., Furlong, E. T., Werner, S. L., and Cahill, J. D. (2006). "Presence and distribution of wastewater-derived pharmaceuticals in soil irrigated with reclaimed water." Environmental Toxicology and Chemistry, 25(2), 317-326.
Kolpin, D. W., Furlong, E. T., Meyer, M. T., Thurman, E. M., Zaugg, S. D., Barber, L. B., and Buxton, H. T. (2002). "Pharmaceuticals, hormones, and other organic wastewater contaminants in US streams, 1999-2000: A national reconnaissance." Environmental Science & Technology, 36(6), 1202-1211.
Kummerer, K., StegerHartmann, T., and Meyer, M. (1997). "Biodegradability of the anti-tumour agent ifosfamide and its occurrence in hospital effluents and communal sewage." Water Research, 31(11), 2705-2710.
Lazarova, V., and Bahri, A. a. (2005). Water reuse for irrigation : agriculture, landscapes, and turf grass, CRC Press, Boca Raton.
Malkawi, H. I., and Mohammad, M. J. (2003). "Survival and accumulation of microorganisms in soils irrigated with secondary treated wastewater." J Basic Microbiol, 43(1), 47-55.
Maule, A. (2000). "Survival of verocytotoxigenic Escherichia coli O157 in soil, water and on surfaces." Symp Ser Soc Appl Microbiol(29), 71S-78S.
McMurry, S. W., Coyne, M. S., and Perfect, E. (1998). "Fecal coliform transport through intact soil blocks amended with poultry manure." Journal of Environmental Quality, 27(1), 86-92.
Menneer, J. C., McLay, C. D. A., and Lee, R. (2001). "Effects of sodium contaminated wastewater on soil permeability of two New Zealand soils." Aust. J. Soil Res., 39(4), 877–891.
Oppel, J., Broll, G., Loffler, D., Meller, M., Rombke, J., and Ternes, T. (2004). "Leaching behaviour of pharmaceuticals in soil-testing-systems: a part of an environmental risk assessment for groundwater protection." Sci Total Environ, 328(1-3), 265-73.
Page, A. L., Lue-hin, G. C., and Chang, C. A. (1986). Utilization, treatment, and disposal of waste on land, SSSA, Inc., Utilization, Treatment, and Disposal of Waste on Land (Brown, K.W. et al., Editors), pp. 1., Madison, Wisconsin, USA.
Pearson, K. E. (2003). "The basic of salinity and sodicity effects on soil physical properties, Information highlight for the general public, Adapted by Krista E. Pearson from a paper by Nikos J. Warrence, Krista E. Pearson, and James W. Bauder, 2003."
Potts, D. A., Görres, J. H., Nicosia, E. L., and Amador, J. A. (2004). "Effects of aeration on water quality from septic system leachfields." J. Environ. Qual., 33, 1828–1838.
Powelson, D. K., and Mills, A. L. (2001). "Transport of Escherichia coli in sand columns with constant and changing water contents." J Environ Qual, 30(1), 238-45.
Reed, S. C., Crites, R. W., and Middlebrooks, E. J. (1995). Natural systems for waste management and treatment, McGraw-Hill, New York.

31
Rhoades, J. D., and Loveday, J. (1990). "Salinity in Irrigated Agriculture. In B.A. Stewart et al. (eds.) Irrigation of Agricultural Crops." American Society of Agronomy Madison, WI.
Rice, R. C. (1974). "Soil clogging during infiltration of secondary effluent." J. Water Pollut. Control Fed., 46(4), 709–716.
Saini, R., Halverson, L. J., and Lorimor, J. C. (2003). "Rainfall timing and frequency influence on leaching of Escherichia coli RS2G through soil following manure application." J Environ Qual, 32(5), 1865-72.
Santamaria, J., and Toranzos, G. A. (2003). "Enteric pathogens and soil: a short review." Int Microbiol, 6(1), 5-9.
Saxton, K. E., Rawls, W. J., Romerger, J. S., and Papendick, R. I. (1986). "Estimating Generalized Soil-water Characteristics from Texture." American Society of Soil Science Journal, 50, 1031-1036.
Schaub, S. A., and Sorber, C. A. (1977). "Virus and Bacteria Removal from Wastewater by Rapid Infiltration Through Soil." Appl Environ Microbiol, 33(3), 609-619.
Sharples, K. E., Stratton, G. W., Madani, S. A., Gordon, R. J., and Patterson, G. (2004). "The survival of E. coli in agricultural soil treated with dairy manure." 2004 ASAE Annual Meeting, Paper number 042209.
Stan, H.-J., Heberer, T., and Linkerhagner, M. (1994). "Occurrence of clofibric acid in the aquatic system-is the use in human medical care the source of the contamination of surface, ground and drinking water? ." Vom Wasser, 83, 57-68
Stan, H. J., and Heberer, T. (1997). "Pharmaceuticals in the aquatic environment." Analusis, 25(7), M20-M23.
Tarchitzky, J., Golobati, Y., Keren, R., and Chen, Y. (1999). "Wastewater effects on montmorillonite suspensions and hydraulic properties of sandy soils." Soil Science Society of America Journal, 63, p554-560.
Tate, R. L. (1978). "Cultural and environmental factors affecting the longevity of Escherichia coli in histosols." Appl. Environ. Microbiol., 35, 25-929.
Ternes, T. A., Bonerz, M., Herrmann, N., Teiser, B., and Andersen, H. R. (2007). "Irrigation of treated wastewater in Braunschweig, Germany: an option to remove pharmaceuticals and musk fragrances." Chemosphere, 66(5), 894-904.
Van Cuyk, S., Siegrist, R. L., Lowe, K., and Harvey, R. W. (2004). "Evaluating microbial purification during soil treatment of wastewater with multicomponent tracer and surrogate tests." J Environ Qual, 33(1), 316-29.
Vandevivere, P., and Baveye, P. (1992). "Saturated hydraulic conductivity reductions caused by aerobic bacteria in sand columns." Soil Sci. Soc. Am. J., 56(1), 1–13.
Wang, L., Mankin, K. R., and Marchin, G. L. (2003). "Kinetic model for E. coli transport through sand column." 2003 ASAE Annual Meeting, Paper number 032151.
Wikipedia. (2008). "Escherichia coli O157:H7." Seen at: http://en.wikipedia.org/wiki/Escherichia_coli_O157:H7.
Williams, C. F., Williams, C. E., and Adamsen, E. J. (2006). "Sorption-desorption of carbamazepine from irrigated soils." Journal of Environmental Quality, 35(5), 1779-1783.

32
CHAPTER III
METHODOLOGY
3.1 An alternative design approach
At least three components, water, nitrogen, and salt, should be carefully
considered when designing a wastewater land application system. Water is the vehicle for
the movement of nitrogen and salt in the soil. Nitrogen is one of the main concerns in the
system because of the potential pollution that could be caused to both groundwater and
surface water if the land application system is not appropriately designed. Salt is a key
factor with respect to potential changes of soil properties. Moreover, all three components
have the combined effects and interactions in land application systems. Those combined
effects and interactions are complex and need more understanding.
Generally, a land application system design needs to consider many design factors
and interactions, which include soil infiltration rate, soil water holding capacity, plant
nitrogen uptake, plant water uptake (evapotranspiration, ET), nitrogen consumption by
microbes within the soil (such as nitrification, denitrification, etc.), salt tolerance of the
plants, the leaching of salt and nitrogen, and the accumulation of salt in soil. The data of
those design factors for one location will be quantified in this research for the
understanding of the system and design procedure. As a result, the design procedures and
the surface application process may be complicated, however, the mass balance approach
proposed by Fedler (2000), allows the design of surface application systems to be easily
executed resulting in an environmentally sound system design. The mass balance
approach includes a water balance, a nitrogen balance, and a salt balance (Fedler 2000).
The design procedure is similar for both on-site systems and large-scale land application
systems for municipal wastewater.
3.1.1 Water balance
The water balance for a land treatment system is the capstone for the whole
design of the surface application treatment system. In the wastewater land application
system, there are a few components to be considered while doing a water balance (Figure
3. 1). If the root zone is regarded as a system while the input is wastewater applied and

33
effective precipitation. Some water fallen onto soil surface is utilized by plants while
some is evaporated from soil. The incorporation of plant transpiration and soil surface
evaporation is called evapotranspiration (ET). In addition, some water deep percolates
through the root zone and down to groundwater while some water stays in the root zone
of the plants. Because ET and applied water (including precipitation) vary throughout the
season due to the stage of the plant growth and the variation of climate conditions, the
water stored in the root zone also varies.
Therefore, the basic equation used to produce a water balance and develop the
irrigation schedule is proposed as below (Fedler and Borrelli 2001):
iiiiii LETIPSMSM −−++= −1 (3.1)
where, SMi is the soil moisture in month i, (inches/month);
SMi-1 is the soil moisture in the previous month, (inches/month);
Pi is the precipitation in month i, (inches/month);
Ii is the irrigation in month i, (inches/month);
ETi is the evapotranspiration in month i, (inches/month);
and Li is the leaching that occurs in month i, (inches/month).

34
Figure 3. 1 Water balance and components in the wastewater land application system

35
Note that all the variables in Equation 3.1 have units of depth per time (e.g. inches
per month or centimeters per month) and the value of soil moisture cannot be less than
zero nor more than the available water holding capacity of the soil in the plant root zone.
The change of soil water storage in the root zone with time of month can be calculated by
the difference of the soil moisture in month i and the soil moisture in month i-1. Any
water applied in excess of the water holding capacity and less than saturation condition is
called deep percolation, or leaching water, and this water passes through the plant root
zone eventually reaching the ground water. There are two assumptions inherent to
Equation 3.1; that irrigation events are designed and controlled well enough to have no
runoff on the soil surface and the groundwater level is low enough to make sure there is
no groundwater entering into the crops root zone. By determining the variables in
Equation 3.1, the irrigation schedule can be determined. Equation 3.1 will be used to
make the irrigation schedule and then be evaluated to understand if it can be used to
estimate the quantity of leachate water in the field.
In the field, wastewater application is influenced by irrigation distribution
uniformity; a subtask in the water balance section is to determine the irrigation
distribution uniformity of the specific research site.
3.1.2 Nitrogen balance
Nitrogen in the municipal wastewater has a few of forms such as organic nitrogen,
ammonia-nitrogen, nitrate-nitrogen, and nitrite-nitrogen. The residual nitrogen of treated
municipal wastewater mainly includes incompletely degraded or undegraded organic
nitrogen, ammonia-nitrogen, and nitrate-nitrogen. The transformations and cycle of
nitrogen are complicated in the land application system (Figure 3. 2).
It is required to state the nitrogen cycle in the land application system in order to
completely understand the model of nitrogen balance used in this research. The boundary
of the nitrogen balance model is the plant root zone plus the plants growing on the
surface of the soil involved with the plant root zone.

36
Figure 3. 2 Nitrogen cycle and balance at the wastewater land application site

37
Nitrogen may be input into the land application system in the forms of organic
nitrogen, nitrate-nitrogen, and ammonia-nitrogen by the pathway of wastewater
application, rainwater, plants residues and animal manures, possibly fertilizers, and even
nitrogen fixation by the bacteria growing on the surface of leguminous plant root system
if leguminous plants are grown. Some nitrogen is released from the system in the forms
of gaseous NH3, nitrogen gas, N2O, and NO to the atmosphere as a result of
denitrification (Barton et al. 1999), and some of nitrogen is leached down to the
groundwater. In the root zone, organic nitrogen can be converted to ammonia and
ammonium ion, which is defined as mineralization (Broadbent and Reisenauer 1985), but
nitrate and ammonium ion can be absorbed by some microorganisms, the process is
immobilization (Mulvaney et al. 1993). Ammonium ion can be converted to nitrite in
nitrification I and finally nitrate in nitrification II (Quastel and Scholefield 1951); Nitrite
can be converted to nitrate in nitrification II (Quastel and Scholefield 1951) and to
nitrogen gas or N2O in denitrification II (Barton et al. 1999); Nitrate can be converted to
nitrite in denitrification I, and then nitrogen gas or N2O in denitrification II (Barton et al.
1999), due to its high mobility, nitrate can be leached down within leachate to
groundwater.
The complete model of nitrogen balance for a wastewater land application system
may be explained with Equation 3.2.
sadpllfriiggppnn NNNNNNNCVCVCVCV Δ−−−−+++++= (3.2)
where, N = mass of total nitrogen (mg);
n = total nitrogen in the leaching water;
V = volume (L);
C = concentration of total nitrogen (mg/L);
p = precipitation;
g = groundwater;

38
i = irrigation;
r = total nitrogen from plant residuals fallen onto or into soils;
f = total nitrogen from fertilizer if applicable;
l = total nitrogen due to nitrogen gas fixation with legume growing;
pl = total nitrogen loss by harvesting crops;
d = total nitrogen loss by denitrification;
a = total nitrogen loss by ammonia volatilization;
ΔNs = loss of total nitrogen from soil water to soil in the root zone due to nitrogen
immobilized by soil microbes (+) or adsorption, or add total nitrogen from soil to soil
water due to nitrogen mineralization or desorption (-).
Equation 3.2 can be used to readily and completely understand the mass balance
of nitrogen, however, it is not practical for use in the research, and therefore, this
equation needs to be simplified. Assuming the nitrogen input in the land application
system (Figure 3. 2) is just from wastewater, and the plant is grass, then it could be found
that the output of nitrogen from the system is nitrogen loss by denitrification and nitrogen
leaching if the grass is mowed but not carried away from the system. If there is no
fertilizer applied and no groundwater entering the plant root zone and if the concentration
of total nitrogen in precipitation and the storage change of total nitrogen in the root zone
are not considered in the design procedure, then nitrogen mass balance Equation 3.2 may
be expressed by the following equation for practical design consideration. Therefore,
Equation 3.3 may be used for making nitrogen mass balances.
pldiinn NNCVCV −−= (3.3)
In the nitrogen balance section, the related data of nitrogen in wastewater and in
leached water was collected and analyzed. The denitrification amount of each month can
be derived from Equation 3.3.
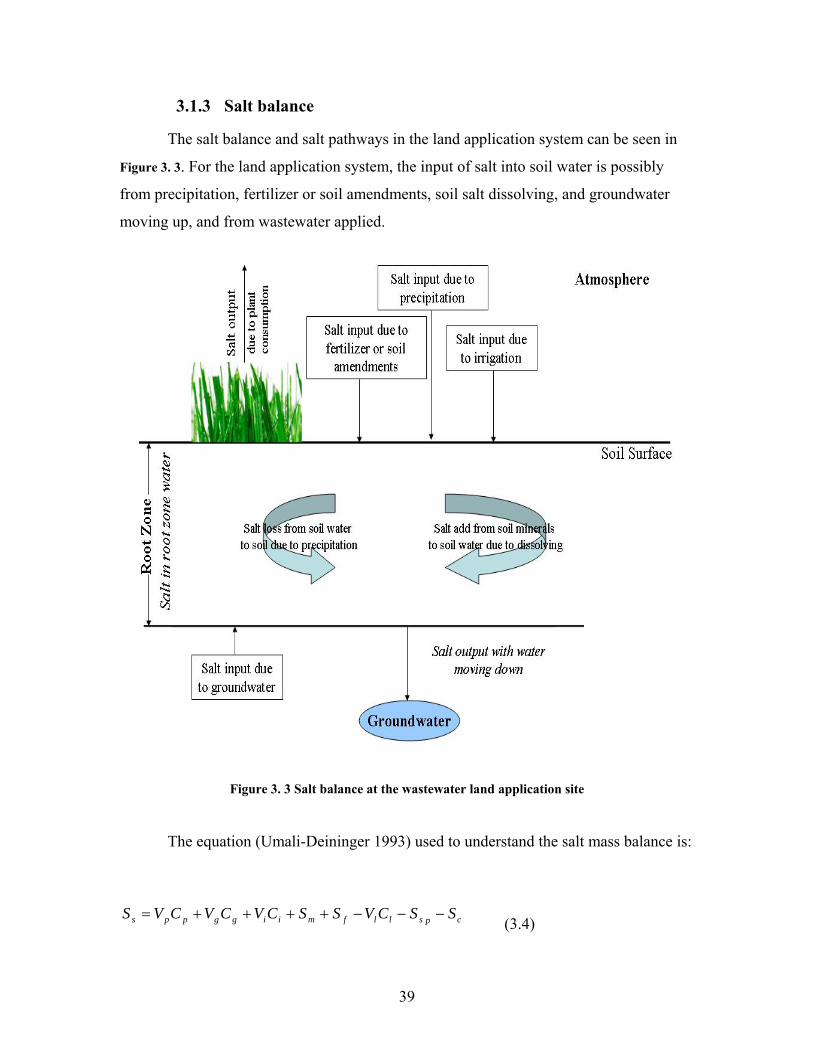
39
3.1.3 Salt balance
The salt balance and salt pathways in the land application system can be seen in
Figure 3. 3. For the land application system, the input of salt into soil water is possibly
from precipitation, fertilizer or soil amendments, soil salt dissolving, and groundwater
moving up, and from wastewater applied.
Figure 3. 3 Salt balance at the wastewater land application site
The equation (Umali-Deininger 1993) used to understand the salt mass balance is:
cpsllfmiiggpps SSCVSSCVCVCVS −−−++++= (3.4)

40
where, S = mass of salt (mg);
s = salt in the root zone water;
V = volume (L);
C = concentration of salt (mg/L);
p = precipitation;
g = groundwater;
i = irrigation;
m = salt dissolved from soil minerals;
f = salt from fertilizer or soil amendments;
l = salt loss by leaching water;
sp = salt loss by salt precipitation;
and c = salt loss by harvesting crops.
The salt mass balance can be simplified as shown below for the utilization in this
research:
lliirootzone CVCVS −= (3.5)
Note in Equation 3.5, Srootzone is the salt in the root zone water and soil. In the salt
balance section, the related data of salt in wastewater and in leachate water was collected
and analyzed. The salt accumulation amount in each month was derived from Equation
3.5.
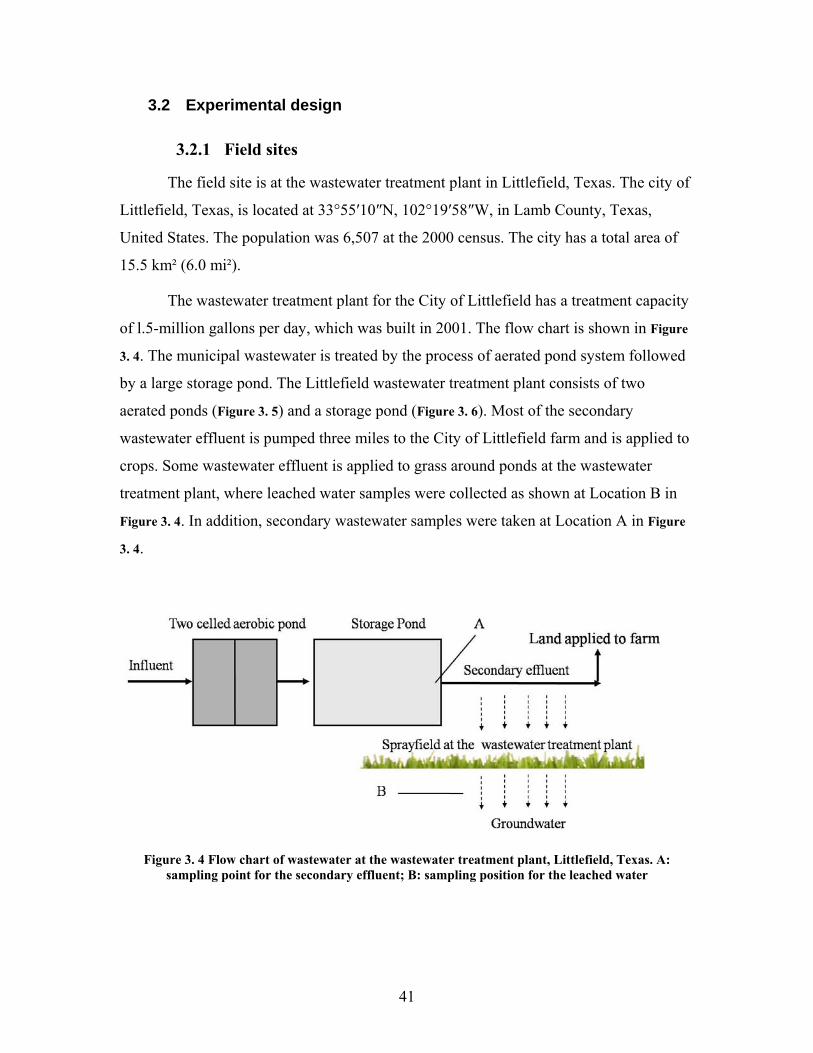
41
3.2 Experimental design
3.2.1 Field sites
The field site is at the wastewater treatment plant in Littlefield, Texas. The city of
Littlefield, Texas, is located at 33°55′10″N, 102°19′58″W, in Lamb County, Texas,
United States. The population was 6,507 at the 2000 census. The city has a total area of
15.5 km² (6.0 mi²).
The wastewater treatment plant for the City of Littlefield has a treatment capacity
of l.5-million gallons per day, which was built in 2001. The flow chart is shown in Figure
3. 4. The municipal wastewater is treated by the process of aerated pond system followed
by a large storage pond. The Littlefield wastewater treatment plant consists of two
aerated ponds (Figure 3. 5) and a storage pond (Figure 3. 6). Most of the secondary
wastewater effluent is pumped three miles to the City of Littlefield farm and is applied to
crops. Some wastewater effluent is applied to grass around ponds at the wastewater
treatment plant, where leached water samples were collected as shown at Location B in
Figure 3. 4. In addition, secondary wastewater samples were taken at Location A in Figure
3. 4.
Figure 3. 4 Flow chart of wastewater at the wastewater treatment plant, Littlefield, Texas. A: sampling point for the secondary effluent; B: sampling position for the leached water
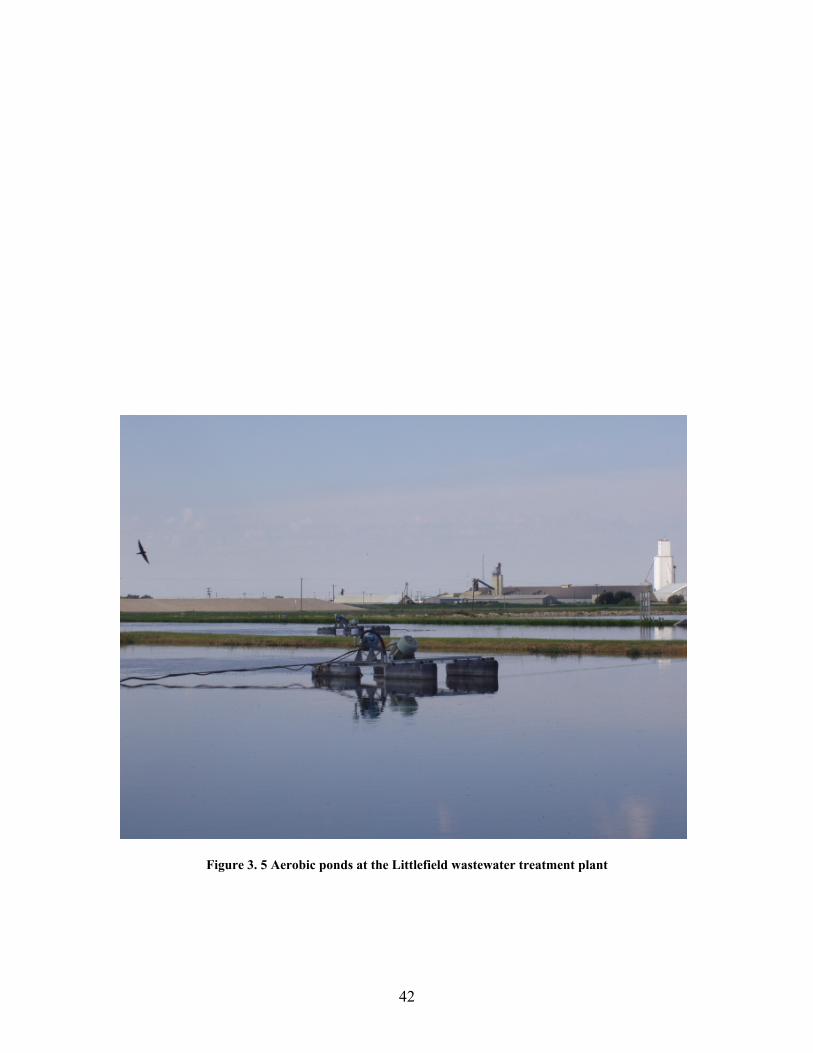
42
Figure 3. 5 Aerobic ponds at the Littlefield wastewater treatment plant

43
Figure 3. 6 Storage pond at the Littlefield wastewater treatment plant

44
Figure 3. 7 A part of sprayfield at the Littlefield wastewater treatment plant

45
3.2.2 Experimental layout and design at the Littlefield site
A lysimeter system was installed in situ to collect samples of the leachate from
the irrigated grass adjacent to the ponds (Figure 3. 8). Sixteen samplers (lysimeters) were
initially installed in a straight line with the top of the sampler flush with the soil surface.
Each sampler has a diameter of eight inches and a depth of eighteen inches. The distance
between two adjacent samplers was 10 ft. The distance between two adjacent sprinklers is
about 59 ft. Those sixteen samplers were installed at Littlefield site on April 15th, 2005.
There are two parts in each sampler (Figure 3. 9). The top part was initially filled
with 12 inches of nearly an undisturbed soil plug with grass taken from the same location.
The bottom part of each sampling device consists of support layers made up of
approximate two inches high of sand, fine gravel, and coarse gravel. A 1/2 inch diameter
PVC pipe is placed along the inside of each sampler in order to extract the leachate water
collected within the sampler (Figure 3. 9). The installation process is as shown in Figure
3.10, Figure 3.11, and Figure 3.12. At Littlefield site, Bermuda grass was established in the
plots as out of the plots. And the soil core in the plots consists mainly of sandy clay loam
and clay same as the sprayfield.
The effluent from the storage pond was applied to the irrigation site by a solid-set
sprinkler system. When the experiments were initially started, effluent was applied for 20
minutes per day as prescribed by the original designers’ water balance. After operating
with this application rate for 9 months, then a predetermined irrigation schedule (Table 3.
1) was prescribed according to a calculated water balance for the specific site and
associated weather conditions.

46
Figure 3. 8 The layout of samplers (lysimeters) at Littlefield wastewater treatment plant (not scaled)

47
Figure 3. 9 Side view of the sampling device (lysimeter) installed under soil surface (not scaled)
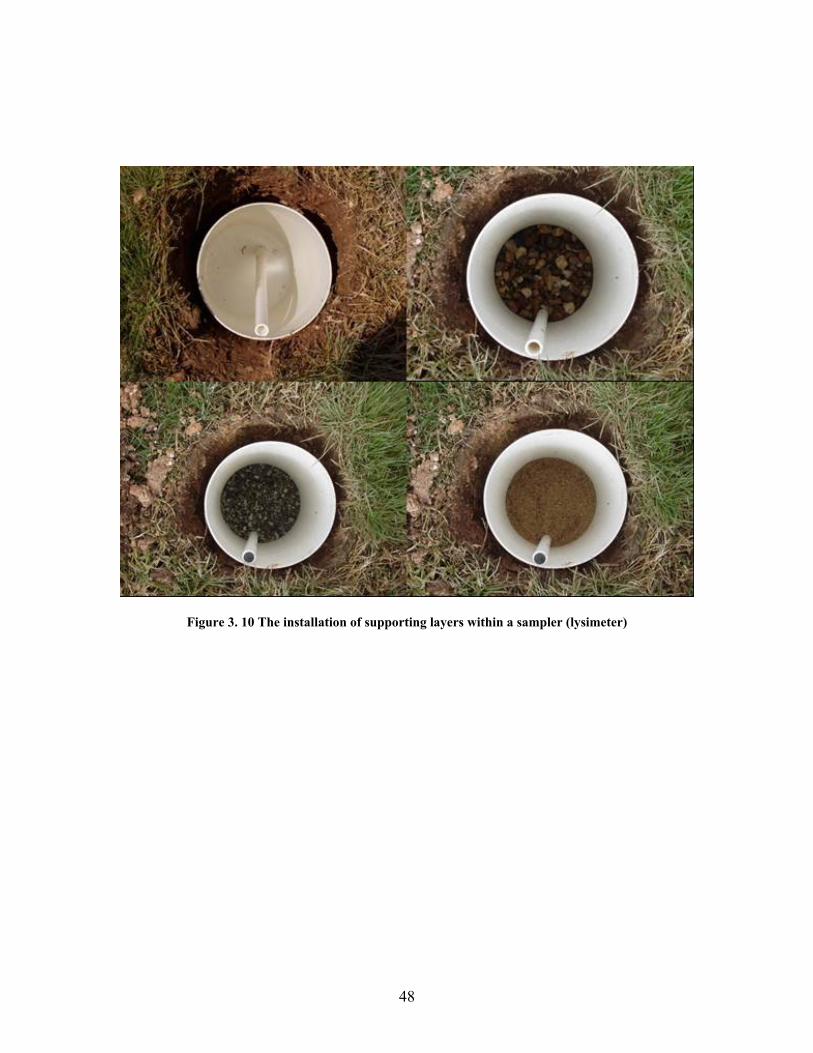
48
Figure 3. 10 The installation of supporting layers within a sampler (lysimeter)

49
Figure 3. 11 Right after installation of a sampler into ground

50
Figure 3. 12 Right after installation of samplers at the Littlefield site

51
Water samples were extracted approximately once per month and then analyzed
for both quantity and quality. Water samples were collected by hand pump (2006G2
pressure-vacuum hand pump, the product of Soilmoisture Equipment Corp., CA, USA).
Water quality parameters tested includes COD, total nitrogen (TN), nitrate-nitrogen,
ammonia-nitrogen, and electricity conductivity (EC), which were analyzed or measured
according to standard procedures. The analytical measurement methods used are listed in
Table 3. 2.
Soil samples were collected for analysis before and when the sampling devices
were installed at the Littlefield site; twenty randomized soil samples at the Littlefield site
were collected down to 4 feet deep annually after the installation of samplers, and
analyzed. The randomized soil sampling is shown in Figure 3.13. Also, three samplers
(lysimeters) at the Littlefield site are extracted annually for same constituents’ analysis.

52
Table 3. 1 Predetermined irrigation schedule for the Littlefield site 1 ET0 data in Lubbock (inches) Jan Feb Mar Apr May Jun Jul Aug Sep Oct Nov Dec 2.49 2.92 4.78 6 7.05 7.65 7.94 7.33 5.63 4.55 3.15 2.5 Kcb for Burmuda 0.8 0.8 0.8 0.8 0.8 0.8 0.8 0.8 0.8 0.8 0.8 0.8 ET (inches) 1.99 2.34 3.82 4.80 5.64 6.12 6.35 5.86 4.50 3.64 2.52 2.00 2 PPT data (inches) Jan Feb Mar Apr May Jun Jul Aug Sep Oct Nov Dec 0.61 0.73 0.93 1.31 2.32 2.98 1.63 2.02 2.25 1.78 0.96 0.68 PPT is the average of 30 years in Lubbock due to no PPT data in Littlefield available. 3 Expected leaching (inches) Jan Feb Mar Apr May Jun Jul Aug Sep Oct Nov Dec 0.5 0.5 0.5 0.5 0.5 0 0 0 0.5 1 1 1 4 Irrigation water (inches) Jan Feb Mar Apr May Jun Jul Aug Sep Oct Nov Dec 1.88 2.11 3.40 3.99 3.83 3.14 4.72 3.85 2.75 2.86 2.56 2.32 5 Irrigation Rate = 0.66 inches per hour at Pressure of 58 PSI Calculation of irrigation time in a month (hours) Jan Feb Mar Apr May Jun Jul Aug Sep Oct Nov Dec 2.85 3.19 5.15 6.04 5.80 4.76 7.15 5.83 4.17 4.33 3.87 3.51 Days in this month 31 28 31 30 31 30 31 31 30 31 30 31 Irrigation time everyday in this month (minutes) 5.51 6.84 9.97 12.09 11.22 9.51 13.84 11.28 8.35 8.38 7.75 6.80 Roundoff of irrigation time everyday in this month (minutes) 6 7 10 12 11 10 14 11 8 8 8 7
Note: ET0 and Kcb are from the project report written by Borrelli et al. in 1998 (Borrelli et al. 1998).
Table 3. 2 The methods used to measure the quality of leachate water and wastewater
TN mg/L NO3-N mg/L NH3-N mg/L COD mg/L EC μS/cm
Method Hach: M10071 Hach: M8039 Hach:
M10023 Hach: M8000 ORION model 162
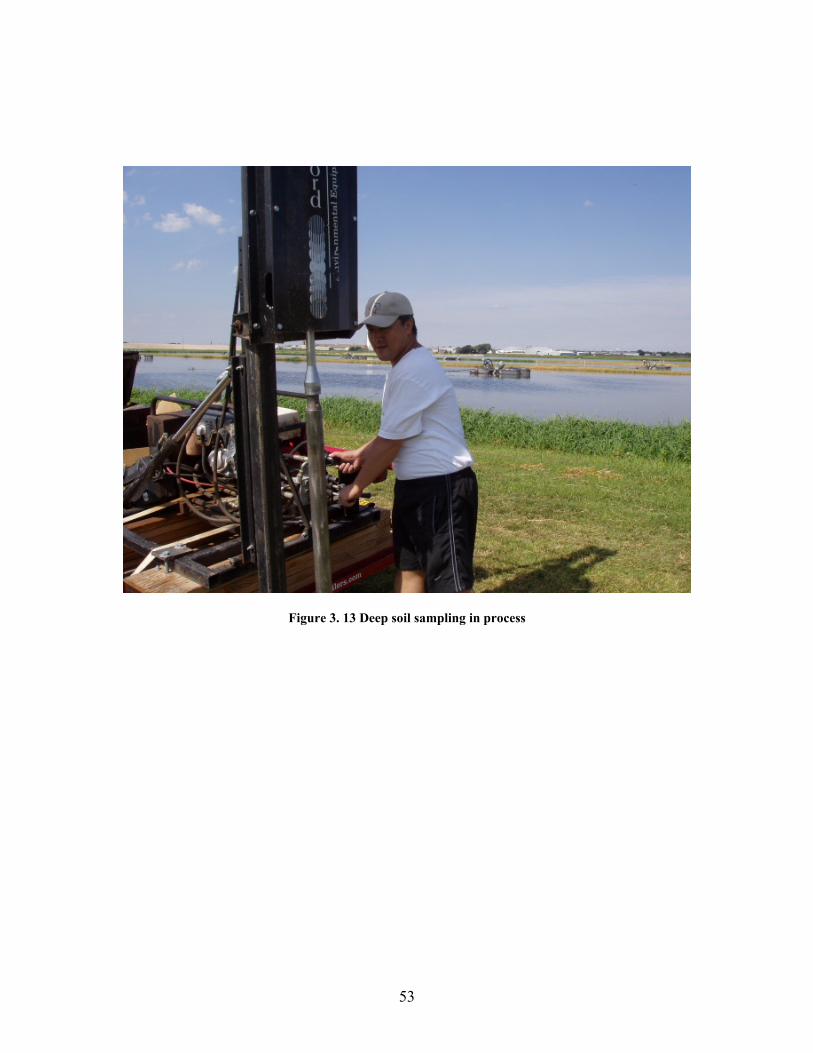
53
Figure 3. 13 Deep soil sampling in process

54
Additionally, to probe the causes of potential variability of leach water quality
and quantity, the irrigation uniformity coefficient (or UCC) was measured at different
times of the year. Each UCC test consisted of 100 sampling points evenly arranged at the
center of 100 squares measuring 6 feet by 6 feet. Generally, thirty minutes were used to
operate one row of sprinklers with the other row closed, and another 30 minutes to
operate the second row of sprinklers with the initial row not operating in order to operate
the system at or close to the designed pressures. The two rows of sprinklers covered the
whole test area. At each sampling point, one cup was positioned on a stake and used to
collect the irrigation water. The volume in the cup was measured with a graduated
cylinder and the UCC was calculated from those data. Additionally, wind speeds and air
temperatures were measured with a Model 45158, Mini Hygro Thermo-Anemometer,
made by EXTECH Instruments, while UCC test was in progress. Figure 3. 14 shows the
UCC measurement in process.
UCC means Christiansen’s Uniformity Coefficient (Karmeli et al. 1978), it is
calculated in the measurements by Equation 3.6, and a UCC of 70 or higher is regarded
as good irrigation (Karmeli et al. 1978).
1001 1 ×
⎟⎟⎟⎟
⎠
⎞
⎜⎜⎜⎜
⎝
⎛
×
−−=∑=
Xn
XXUCC
n
ii
(3.6)
where UCC = Christiansen’s Uniformity Coefficient, %;
iX = the i-th single observation depth or volume measured, inches or mL;
X = the mean of all the individual observations, inches or mL;
n = the total number of observations.

55
Figure 3. 14 UCC test grid and measurement in process

56
3.2.3 Experimental layout and design at the TTU site
TTU site is at the northwest corner of 4th Street and Avenue Quaker, Lubbock,
Texas. This research is on the campus of Texas Tech University. A green house was built
at this research site with an area of 150 ft × 34 ft. A natural wastewater treatment and
reuse system keeps operating every day. This system functions to produce algae, aquatic
plants such as duckweed, cattail, and water lilies, invertebrates, fishes while treating
artificial wastewater. Also, artificial marine water system is available to simulate living
environment of marine plants and fishes. There is a weather station installed outside of
greenhouse.
Six sampling devices containing soils from Harris County, Texas, where St.
Augustine Grass is grown, are installed in the greenhouse of the Lubbock site. Because
soil plugs are from the place near Houston, the samplers are defined as Houston samplers.
Another six samplers containing soils from Midland, Texas are set up outside of the
greenhouse. Similarly, those six samplers are called Midland samplers. The installation
positions are as shown in Figure 3.15.
Initially, all 12 samplers were irrigated a few months by hand with tap water for
flushing salts in soils down through the root zone, then irrigated by hand with water from
a wastewater recycling system according to the designed irrigation schedule by combined
mass balance approach. After the end of August of 2006, those samplers are irrigated
with the same water with the addition of fertilizer to obtain a similar nitrogen
concentration to a typical municipal wastewater. A rain gage was also installed at the
Lubbock site. Leach water samples are extracted by hand pump, their volumes are
measured, and water quality is analyzed in the lab with the same method as samples from
the Littlefield site.

57
Figure 3. 15 Installation positions of Houston and Midland samplers at TTU site

58
Reference
Barton, L., McLay, C. D. A., Schipper, L. A., and Smith, C. T. (1999). "Denitrification Rates in a Wastewater-Irrigated Forest Soil in New Zealand." J Environ Qual, 28, 2008-2014.
Borrelli, J., Fedler, C. B., and Gregory, J. M. (1998). Mean crop consumptive use and free water evaporation for Texas, Project Report No. 95-483-137, Texas Water Development Board, Austin, TX.
Broadbent, F. E., and Reisenauer, H. M. (1985). Fate of wastewater constituents in soils and groundwater: nitrogen and phosphorous, Chapter 12 in irrigation with reclaimed municipal wastewater - A guidance manual, Pettygrove, G.S. and T. Asano, eds. Lewis Publishers, Inc. 1985.
Fedler, C. B. (2000). "Impact of Long-Term Application of Wastewater." the International Summer Meeting of the ASAE, Chicago, IL. July 9-12. Paper No. 002055. ASAE, 2950 Niles Road, St. Joseph, MI 49085-9659. USA.
Fedler, C. B., and Borrelli, J. (2001). "Re-evaluating Surface Application Rates for Texas OSSF Systems."
Karmeli, D., Salazar, L. L., and Walker, W. R. (1978). "Assessing the Spatial Variability of Irrigation Water Applications." U.S. Environmental Protection Agency. Robert S.Kerr Environmental Research Laboratory. Ada, Ok.
Mulvaney, R. L., Azam, F., and Simmons, F. W. "Immobilization of Different Nitrogen Fertilizers." Illinois Fertilizer Conference Proceedings, January 25-27, 1993, http://frec.cropsci.uiuc.edu/1993/report3/.
Quastel, J. H., and Scholefield, P. G. (1951). "BIOCHEMISTRY OF NITRIFICATION IN SOIL." Bacteriol Rev. , 15(1), 1–53.
Umali-Deininger, D. (1993). Irrigation-induced salinity : a growing problem for development and the environment, World Bank, Washington, D.C.

59
CHAPTER IV
DATA ANALYSIS AND RESULTS AT LITTLEFIELD SITE The data analysis and results contains three sections, water balance, nitrogen balance, and
salt balance. All these three sections covers the original results of mass balances, and the further
discussion of the results will be conducted in the next chapter.
4.1 Water Balance
In the section of water balance, the test results of the irrigation distribution uniformity are
summarized first. And this section also includes the spatial and temporal distribution of the
leached water, and calculation of water mass balance.
4.1.1 UCC measurements
UCC measurements were executed six times to represent four seasons in a year. The
UCC testing dates are Mar 3, 2006, Mar 24, 2006, Jun 20, 2006, Oct 10, 2006, Oct12, 2006, and
Feb 23, 2007. Measurements on Mar 3, 2006 and Mar 24, 2006 represented Spring UCC;
Measurements on Jun 20, 2006 represented Summer UCC; Measurements on Oct 10, 2006 and
Oct 12, 2006 represented Fall UCC; Measurements on Feb 23, 2007 represented Winter UCC.
The UCC values and climate data during tests are listed in Table 4. 1. For the tests of Mar 3, 2006
and Mar 24, 2006, the operating pressures were 35 psi. One test block was employed; in the
other tests, the pressures were 58 psi, and two blocks with the same area, north block and south
block, were used at the site where the samplers were installed. The applied water, nitrogen, and
salt during UCC tests will be counted into the respective mass balance. The irrigation rates
(Appendix A) were determined to calculate the applied water amount during UCC tests for the
three mass balances and to calculate the length of the irrigating time for each irrigation event.
The individual UCC test results ranged from 31% to 56% in spring, 49% to 66% in
summer, 52% to 75% in fall, and 37% to 51% in winter. The annual UCC is 83% and 84% if the
first three tests are not considered because the operational pressure was 35 psi, much lower than
the designed operation pressure of 65 psi. The annual UCC is determined by Equation 3.6, n is
still equal to 100, and it is the number of sub-square. In order to determine the annual UCC, each
block of the test data were summed to obtain a total application within a given test block. And

60
first make the sum (Xi) of collected water volume in the same sub-square for the different test in
the test year, then calculate the mean of all 100 sums, finally substitute them to Equation 3.6 to
get the annual UCC. The annual UCC represents the cumulative effect or average effect of
applied wastewater onto the land surface in the test year. Wind speed significantly impacts UCC
test in the field. The recorded wind speed range is from 5.7 MPH in fall corresponding to highest
seasonal UCC to 23.7 MPH in winter with lowest seasonal UCC. In some cases, UCC test had to
be conducted with the conditions of wind speed exceeding 8 MPH, which is the upper limit in a
standard UCC test. However, the resulting UCC under the field conditions was more
representative of the real uniformity distribution so that the spatial distribution of leached water,
nitrogen, and salts can be explained by the field data. Additionally, wind direction is another
factor that significantly influences the water distribution pattern at the research site. The low
UCC data partly demonstrates the fact that the leaching may have a high variability in the field,
especially at this site, which is located in an area where the wind frequently blows.
UCC represents the distribution uniformity of an irrigation system. A low UCC leads to
reduced yield because of the potential for soil moisture stress or water logging, and the resulting
deep percolation (Ascough and Kiker 2002). Unexpected deep percolation water may transport
more nitrogen down to groundwater. On the other hand, salt accumulation in the soil is another
concern, which increases the difficulty of plants to extract soil moisture. In addition, runoff often
occurs when the UCC is low. This may have the potential environmental impacts by
contaminating nearby surface water. Therefore, it was recommended that the system be designed
to achieve a uniformity coefficient of 80% or greater under ideal conditions (Fedler and Borrelli
2001). The UCC of a sprinkler system is the function of the pressure at the sprinkler, the
variation in pressure in the operating set, the sprinkler spacing, the nozzle diameter influencing
discharge and wetted diameter, the water distribution pattern, and the wind speed and direction
(Ascough and Kiker 2002).

61
Table 4. 1 UCC values and climate data during tests
Testing Time
Average wind speed
Average air temperature UCC
Mar 3, 2006 Test 1 30 min 9.2 MPH 57 F 31%
Test 1 40 min 11.8 MPH 59 F 56% Mar 24, 2006
Test 2 43 min 7.5 MPH 59 F 56%
Test 1-South Block 60 min* 9.4 MPH 73 F 59%
Test 1-North Block 60 min* 9.4 MPH 73 F 49%
Test 2-South Block 90 min* 10.6 MPH 88.5 F 66% Jun 20, 2006
Test 2-North Block 90 min* 10.6 MPH 88.5 F 57%
Test 1-South Block 80 min* 8.8 MPH 69.8 F 66% Oct 10, 2006
Test 1-North Block 80 min* 8.8 MPH 69.8 F 75%
Test 1-South Block 50 min* 5.7 MPH 62.8 F 61%
Test 1-North Block 50 min* 5.7 MPH 62.8 F 52%
Test 2-South Block 60 min* 5.8 MPH 57.6 F 68% Oct 12, 2006
Test 2-North Block 60 min* 5.8 MPH 57.6 F 66%
Test 1-South Block 40 min* 23.7 MPH 77.2 F 37%
Test 1-North Block 40 min* 23.7 MPH 77.2 F 40%
Test 2-South Block 40 min* 19.5 MPH 77.5 F 41% Feb 23, 2007
Test 2-North Block 40 min* 19.5 MPH 77.5 F 51%
Annual UCC is 83%; Annual UCC is 84% if the first three tests are not considered

62
4.1.2 Spatial and temporal distribution of leach water
The leach water is collected at the end of the sampling period, the volume (mL) of leach
water; average leach water volume (mL) and standard deviation (mL) for all available samplers
are shown in Table 4. 12. Samplers 6, 7, and 14 were removed for internal soil lab analysis, right
after water sample collection on June 16, 2006. Another three samplers, 3, 9, and 12 were
removed from the Littlefield site for soil analysis on June 28, 2007 after water sample collection
on the same day. Therefore, there were 13 samplers during the period from June 16, 2006 to June
28, 2007, and 10 samplers available after June 28, 2007.
The spatial distributions of leach water volume are listed in Figure B.1 to Figure B.21 in
Appendix B. The temporal distribution of leach water in each sampler is shown in Figure C.1 to
Figure C.16 in Appendix C. The average leach volume during each sampling period with standard
error is illustrated in Figure 4. 1.
The leached water was available in each sampling period with the average volume of 23
mL to 1722 mL per sampler (Table 4.2); the coefficient of variation (C. V.) is from 28 % to
217%. It can be concluded that the variability of the collected leached water was relatively large
in each sampling period. Such high variability might be caused by lower operation pressure of 58
psi or even 35 psi than the design pressure of 65 psi. The sprinkler system was laid out in the
form of sprinkler head overlap in order to increase the distribution uniformity coefficient,
however, the sprinkler pattern of such arrangement doesn’t ensure that the accepted water are
absolutely even over the wetted diameter. Once the designed pressure is not guaranteed during
the irrigation event, the individual UCC decreases, then large variability of distributed water and
subsequent leached water occurs. In addition, frequent wind, varying wind speed, and unstable
wind direction are another reason to cause high variability for this specific site.
The pattern of deep percolation passing through the root zone was quite different from
one sampling period to another (Figure 4. 1). The range of leaching amounts is from 0.03 inches
to 2.10 inches. The leaching amount in each sampling period reflects the time effect. Because the
days of each sampling period are not the same, from 20 to 55 days, therefore, the higher amounts
in some sampling periods might be caused by relative more water input due to longer periods.

63
Table 4. 2 Collected leach water volume (mL) in each sampler at sampling date Sampler Number Sampling
Date 1 2 3 4 5 6 7 8 9 10 11 12 13 14 15 16 Mean SD 10/7/2005 223 220 350 305 332 410 701 887 810 379 54 698 326 689 605 300 456 242
11/28/2005 120 224 262 1063 650 1099 1490 1117 800 222 0 1326 693 927 440 545 686 455 12/29/2005 0 0 0 0 0 20 84 86 0 0 0 172 0 0 0 0 23 49 2/10/2006 1322 1758 1838 1750 1300 1602 1658 938 1584 0 0 1950 850 2590 1714 1902 1422 688 4/6/2006 905 825 1415 1510 1155 1430 1120 1631 2179 2047 1622 1110 1230 2148 1350 1539 1451 409
5/25/2006 410 235 495 360 222 485 170 347 0 0 0 1780 0 725 1123 0 397 481 6/16/2006 404 390 590 760 450 850 780 540 0 214 132 1422 220 860 860 0 530 382 7/21/2006 530 345 740 900 340 655 118 600 0 1104 580 549 272 518 3059/1/2006 340 290 620 670 40 1350 270 1680 0 1234 300 530 670 615 515
9/22/2006 660 480 645 960 900 1400 1090 1590 1490 1540 740 890 990 1029 37010/12/2006 1610 0 550 1540 0 2206 0 170 0 680 370 2790 440 797 93511/22/2006 150 50 310 350 46 870 0 320 59 330 25 350 1170 310 349
1/9/2007 995 1435 1395 1455 0 1545 0 640 0 335 1435 1480 1335 927 6382/23/2007 1161 1032 620 1146 760 1470 630 1470 820 67 1050 1100 1470 984 4043/30/2007 1440 1550 1582 1780 1250 2050 2090 2550 2130 520 1685 2225 1532 1722 5154/25/2007 670 980 805 1290 770 1450 185 590 855 50 490 1470 700 793 4335/29/2007 1435 1500 1640 1670 730 1790 1820 2470 2110 440 1645 1760 1555 1582 5226/28/2007 1360 870 1490 1520 1500 1480 1390 2345 1750 235 1550 1500 1480 1421 4777/31/2007 450 870 675 235 1000 0 0 0 660 700 459 3788/31/2007 1575 0 340 0 1950 0 0 0 840 570 528 7199/28/2007 925 300 720 340 1420 1600 265 340 1420 470 780 527 Notes: SD means standard deviation.

64
Sampling date
9/1/05 12/1/05 3/1/06 6/1/06 9/1/06 12/1/06 3/1/07 6/1/07 9/1/07
The
aver
age
leac
hing
am
ount
, inc
hes
0.0
0.2
0.4
0.6
0.8
1.0
1.2
1.4
1.6
1.8
2.0
2.2
2.4
Figure 4. 1 The average leaching amount of each sampling period from Oct 2005 to Sept 2007 at the
Littlefield site. The error bars represent ± one standard error.

65
4.1.3 Calculation of water mass balance
Soil saturation, field capacity, and wilting point of the soil at Littlefield site are
determined from the results of soil analysis executed by the lab of the Department of Plant and
Soil Science, Texas Tech University. The soil saturation, field capacity, and permanent wilting
point are 0.491, 0.301, and 0.194 cubic inch water per cubic inch soil, respectively. The soil
moistures in a sampler corresponding to soil saturation, field capacity, and wilting point can be
calculated as below (the designed depth of the root zone is 12 inches).
The soil moisture at saturation in the sampler is:
inches 892.5inches 12soil
water491.0 3
3
=×inch
inch
The soil moisture at field capacity in the sampler is:
inches 612.3inches 12soil
water301.0 3
3
=×inch
inch
The soil moisture at wilting point in the sampler is:
inches 328.2inches 12soil
water194.0 3
3
=×inch
inch
One inch of water in the sampler is equivalent to 820 mL in this research. The
precipitation data used in this dissertation is from the site of the National Climatic Data Center.
The water balance calculation is illustrated in Table 4. 3.

66
Table 4. 3 The calculation of water balance for the Littlefield site 1 2 3 4 5 6 7
Period Soil moisture PPT Irrigation ET Average
leaching Runoff, other unknown losses
10/7/2005 4.752 10/07/2005-11/28/2005 1.12 9.360 5.170 0.837 3.333
11/28/2005 5.892 11/28/2005-12/29/2005 0.13 5.580 2.039 0.028 3.643
12/29/2005 5.892 12/29/2005-2/10/2006 0.05 7.740 2.955 1.734 3.101
2/10/2006 5.892 2/10/2006-4/6/2006 2.27 10.840 6.286 1.770 5.055
4/6/2006 5.892 4/6/2006-5/25/2006 1.63 8.820 8.388 0.484 1.577
5/25/2006 5.892 5/25/2006-6/16/2006 1.55 2.414 4.356 0.646 0.000
6/16/2006 4.854 6/16/2006-7/21/2006 5.18 5.492 7.159 0.632 2.881
7/21/2006 5.892 7/21/2006-9/1/2006 5.42 5.370 7.913 0.750 2.127
9/1/2006 5.892 9/1/2006-9/22/2006 4.21 2.020 3.303 1.255 1.672
9/22/2006 5.892 9/22/2006-10/12/2006 0.53 2.692 2.610 1.194 0.000
10/12/2006 5.310 10/12/2006-11/22/2006 1.43 2.954 4.079 0.378 0.000
11/22/2006 5.237 11/22/2006-1/9/2007 10.53 2.912 3.250 1.130 9.062
1/9/2007 5.892 1/9/2007-2/23/2007 10.04 3.505 3.333 1.200 9.012

67
1 2 3 4 5 6 7 Period Soil
moisture PPT Irrigation ET Average leaching Runoff, other unknown losses
2/23/2007 5.892 2/23/2007-3/30/2007 4.59 3.641 4.090 2.100 2.041
3/30/2007 5.892 3/30/2007-4/25/2007 1.2 3.434 4.123 0.967 0.000
4/25/2007 5.435 4/25/2007-5/29/2007 4.56 4.243 6.076 1.929 0.798
5/29/2007 5.892 5/29/2007-6/28/2007 4.81 3.176 6.076 1.733 0.177
6/28/2007 5.892 6/28/2007-7/31/2007 0.72 4.929 6.760 0.560 0.000
7/31/2007 4.221 7/31/2007-8/31/2007 0.59 3.847 5.864 0.644 0.000
8/31/2007 2.328 8/31/2007-9/28/2007 2.61 2.570 4.204 0.951 0.000
9/28/2007 2.353 Notes:
1. All values in Column 2-7 are in inches; 2. Start point of soil moisture is set as the average of the soil saturation and the field capacity; 3. If the soil moisture of the end of a sampling period is larger than the soil saturation, which is calculated by summing up the soil
moisture at the starting point of a sampling period, PPT (precipitation), and irrigation, then subtracting ET and average leaching, the soil moisture at the end of a sampling period is set as saturation. Finally, Column 7 is equal to the result of Column 2 + Column 3 + Column 4 - Column 5 - Column 6 –Saturation; otherwise, Column 7 is equal to zero;
4. If the soil moisture at the end of a sampling period falls into the range between saturation and wilting point, then this value is kept. If it is smaller than wilting point, then it is set as wilting point.
Continued

68
4.2 Nitrogen Balance
The spatial and temporal distribution of leached nitrogen is illustrated in this section.
Nitrogen mass balance is carried out in the term of total nitrogen. And the volume weighted
average concentrations of total nitrogen, nitrate-nitrogen, and ammonia-nitrogen are summarized
in this section.
4.2.1 Spatial and temporal distribution of leached nitrogen
The total nitrogen concentration in leached water of each sampler, the volume of leach
water, total and average leached mass of total nitrogen, volume weighted average total nitrogen
concentration in each sampling period, and total nitrogen concentration and mass in the applied
wastewater are listed in Table 4. 4. The spatial distribution of total nitrogen mass leached is shown
in Figure D.1 to Figure D.21 in Appendix D.
The temporal distribution of weighted average total nitrogen concentration in the leach
water is shown in Figure 4. 2. The weighted average total nitrogen concentration can be
determined by the following Equation 4.1.
∑
∑
=
== n
ii
i
weighted
V
V
1
n
1iiC
C (4.1)
where, weightedC is the volume weighted average total nitrogen concentration in the
leached water, mg/L;
Ci is the concentration of total nitrogen in the i-th sampler, mg/L;
Vi is the volume of the leach water in the i-th sampler, L.
Also, the temporal distribution of average total nitrogen mass with one standard error per
hectare is shown in Figure 4. 3. The average total nitrogen concentration in the secondary

69
wastewater was from 5 mg/L to 19 mg/L. The total nitrogen concentration was higher in summer
and fall than in winter and spring due to the effect of temperature on the treatment in the pond
system. The volume weighted average concentration of total nitrogen in the leached water ranged
from 0 mg/L to 5.12 mg/L. There occurred two peaks of total nitrogen in the leached water
during the project, 4.97 mg/L in the period from Feb 10, 2006 to Apr 6, 2006, and 5.12 mg/L in
the period from Nov 22, 2006 to Jan 9, 2007. Similarly, the peaks of the average leached mass
occurred in winter and spring (Figure 4. 3). In winter and spring, the combined effect of nitrogen
loss becomes weak with the decrease of plant nitrogen uptake rate and denitrification rate due to
the low temperature, additionally, the total nitrogen concentration in winter and spring is
relatively higher than in summer and fall, as a result, and the total nitrogen concentration goes up
in winter and spring.

70
Table 4. 4 The list of total nitrogen in the leached water and in wastewater at the Littlefield site
1 2 3 4 5 6 7 8 9 10 11 12 13 14 15 16 Total Average W/W10/7/2005 Concentration, mg/L 0 0 2 1 0 0 1 1 0 0 0 0 0 0 0 0 0.356 7.5
Volume, mL 223 220 350 305 332 410 701 887 810 379 54 698 326 689 605 300 7289Mass, mg 0 0 0.7 0.305 0 0 0.701 0.887 0 0 0 0 0 0 0 0 2.593 0.162
11/28/2005 Concentration, mg/L 0 0 0 0 0 0 0 0 0 0 n/a 0 0 0 0 0 0.000 12Volume, mL 120 224 262 1063 650 1099 1490 1117 800 222 0 1326 693 927 440 545 10978 7675.2Mass, mg 0 0 0 0 0 0 0 0 0 0 0 0 0 0 0 0 0.000 92.102
12/29/2005 Concentration, mg/L n/a n/a n/a n/a n/a 2 1 2 n/a n/a n/a 3 n/a n/a n/a n/a 2.243 16Volume, mL 0 0 0 0 0 20 84 86 0 0 0 172 0 0 0 0 362 4575.6Mass, mg 0.04 0.084 0.172 0.516 0.812 0.051 73.210
2/10/2006 Concentration, mg/L 1 1 2 1 0 1 3 4 10 n/a n/a 4 5 10 6 2 3.811 16.5Volume, mL 1322 1758 1838 1750 1300 1602 1658 938 1584 0 0 1950 850 2590 1714 1902 22756 6346.8Mass, mg 1.322 1.758 3.676 1.75 0 1.602 4.974 3.752 15.84 7.8 4.25 25.9 10.284 3.804 86.71 5.420 104.722
4/6/2006 Concentration, mg/L 18 0 0 0 0 0 0 10 14 *130 0 9 0 14 9 0 4.967 19Volume, mL 905 825 1415 1510 1155 1430 1120 1631 2179 2047 1622 1110 1230 2148 1350 1539 23216 8888.8Mass, mg 16.29 0 0 0 0 0 0 16.31 30.51 0 9.99 0 30.072 12.15 0 115.3 7.207 168.887
5/25/2006 Concentration, mg/L 2 1 0 0 0 0 1 0 n/a n/a n/a 0 n/a 1 0 n/a 0.307 18Volume, mL 410 235 495 360 222 485 170 347 0 0 0 1780 0 725 1123 0 6352 7232.4Mass, mg 0.82 0.235 0 0 0 0 0.17 0 0 0.725 0 1.95 0.122 130.183
6/16/2006 Concentration, mg/L 0 1 3 1 1 2 2 2 n/a 4 4 2 5 2 2 n/a 1.945 15Volume, mL 404 390 590 760 450 850 780 540 0 214 132 1422 220 860 860 0 8472 1979.48Mass, mg 0 0.39 1.77 0.76 0.45 1.7 1.56 1.08 0.856 0.528 2.844 1.1 1.72 1.72 16.48 1.030 29.692
Sampler NumberSampling Date

71
Continued
1 2 3 4 5 8 9 10 11 12 13 15 16 Total Average W/W7/21/2006 Concentration, mg/L 2 1 2 2 2 3 3 2 n/a 2 2 2 2 2.064 8.5
Volume, mL 530 345 740 900 340 655 118 600 0 1104 580 549 272 6733 4503.4Mass, mg 1.06 0.345 1.48 1.8 0.68 1.965 0.354 1.2 2.208 1.16 1.098 0.544 13.894 1.069 38.279
9/1/2006 Concentration, mg/L 1 1 1 1 2 2 3 4 n/a 1 2 1 2 1.993 7Volume, mL 340 290 620 670 40 1350 270 1680 0 1234 300 530 670 7994 4403.4Mass, mg 0.34 0.29 0.62 0.67 0.08 2.7 0.81 6.72 1.234 0.6 0.53 1.34 15.934 1.226 30.824
9/22/2006 Concentration, mg/L 0 0 0 0 0 1 1 2 1 0 1 1 1 0.731 6Volume, mL 660 480 645 960 900 1400 1090 1590 1490 1540 740 890 990 13375 1656.4Mass, mg 0 0 0 0 0 1.4 1.09 3.18 1.49 0 0.74 0.89 0.99 9.78 0.752 9.938
10/12/2006 Concentration, mg/L 3 n/a 3 4 n/a 2 n/a 2 n/a 2 2 3 2 2.775 5Volume, mL 1610 0 550 1540 0 2206 0 170 0 680 370 2790 440 10356 2207.4Mass, mg 4.83 1.65 6.16 4.412 0.34 1.36 0.74 8.37 0.88 28.742 2.211 11.037
11/22/2006 Concentration, mg/L 0 2 0 0 1 0 N/A 0 10 0 50 0 0 0.493 12Volume, mL 150 50 310 350 46 870 0 320 59 330 25 350 1170 4030 2422.3Mass, mg 0 0.1 0 0 0.046 0 0 0.59 0 1.25 0 0 1.986 0.153 29.067
1/9/2007 Concentration, mg/L 2 16 3 3 N/A 4 N/A 3 N/A 2 3 3 8 5.120 16Volume, mL 995 1435 1395 1455 0 1545 0 640 0 335 1435 1480 1335 12050 2387.8Mass, mg 1.99 22.96 4.185 4.365 6.18 1.92 0.67 4.305 4.44 10.68 61.695 4.746 38.205
2/23/2007 Concentration, mg/L 0 2 2 2 0 0 2 2 2 2 0 0 8 1.823 10Volume, mL 1161 1032 620 1146 760 1470 630 1470 820 67 1050 1100 1470 12796 2874.1Mass, mg 0 2.064 1.24 2.292 0 0 1.26 2.94 1.64 0.134 0 0 11.76 23.33 1.795 28.741
3/30/2007 Concentration, mg/L 2 2 4 2 2 3 5 4 2 1 4 3 4 3.104 17Volume, mL 1440 1550 1582 1780 1250 2050 2090 2550 2130 520 1685 2225 1532 22384 2985.6Mass, mg 2.88 3.1 6.328 3.56 2.5 6.15 10.45 10.2 4.26 0.52 6.74 6.675 6.128 69.491 5.345 50.756
4/25/2007 Concentration, mg/L 0 0 0 0 0 0 2 2 0 17 1 0 0 0.280 17Volume, mL 670 980 805 1290 770 1450 185 590 855 50 490 1470 700 10305 2815.9Mass, mg 0 0 0 0 0 0 0.37 1.18 0 0.85 0.49 0 0 2.89 0.222 47.870
5/29/2007 Concentration, mg/L 1 1 1 1 1 1 3 3 1 2 1 2 2 1.600 12.5Volume, mL 1435 1500 1640 1670 730 1790 1820 2470 2110 440 1645 1760 1555 20565 3479.3Mass, mg 1.435 1.5 1.64 1.67 0.73 1.79 5.46 7.41 2.11 0.88 1.645 3.52 3.11 32.9 2.531 43.491
6/28/2007 Concentration, mg/L 2 1 2 2 1 1 3 2 2 2 2 2 2 1.867 8Volume, mL 1360 870 1490 1520 1500 1480 1390 2345 1750 235 1550 1500 1480 18470 2604.3Mass, mg 2.72 0.87 2.98 3.04 1.5 1.48 4.17 4.69 3.5 0.47 3.1 3 2.96 34.48 2.652 20.835
Sampler NumberSampling Date

72
Continued
1 2 4 5 8 10 11 13 15 16 Total Average W/W7/31/2007 Concentration, mg/L 2 1 1 1 2 n/a n/a n/a 2 2 1.612 6
Volume, mL 450 870 675 235 1000 0 0 0 660 700 4590 4041.78Mass, mg 0.9 0.87 0.675 0.235 2 1.32 1.4 7.4 0.74 24.251
8/31/2007 Concentration, mg/L 1 n/a 0 n/a 2 n/a n/a n/a 10 8 3.495 5Volume, mL 1575 0 340 0 1950 0 0 0 840 570 5275 3154.54Mass, mg 1.575 0 3.9 8.4 4.56 18.44 1.8435 15.773
9/28/2007 Concentration, mg/L 4 1 1 3 3 4 2 3 4 4 3.271 7.5Volume, mL 925 300 720 340 1420 1600 265 340 1420 470 7800 2107.4Mass, mg 3.7 0.3 0.72 1.02 4.26 6.4 0.53 1.02 5.68 1.88 25.51 2.551 15.806
Sampling DateSampler Number
Notes: 1. Gray denotes that leach water is not available for calculation of total nitrogen mass; 2. Black denotes that the total nitrogen concentration is an outlier, and abnormal, and the value is not shown; 3. W/W denotes applied wastewater.

73
Sampling Date
10/1/05 1/1/06 4/1/06 7/1/06 10/1/06 1/1/07 4/1/07 7/1/07 10/1/07
Tota
l nitr
ogen
con
cent
ratio
n, m
g/L
0
1
2
3
4
5
6
Figure 4. 2 The temporal distribution of volume weighted average total nitrogen concentration in leach
water at the Littlefield site

74
Sampling Date from Oct 2005 to Sept 2007
10/1/05 1/1/06 4/1/06 7/1/06 10/1/06 1/1/07 4/1/07 7/1/07 10/1/07
Aver
age
tota
l nitr
ogen
mas
s le
ache
d, k
g pe
r hec
tare
0.0
0.5
1.0
1.5
2.0
2.5
3.0
3.5
Figure 4. 3 Average total nitrogen mass leached in each sampling period at the Littlefield site. The
symbol presents means of repeated measurements, and the error bars present standard errors.

75
4.2.2 Calculation of nitrogen mass balance
Nitrogen mass balance based on one sampler during each sampling period is calculated
based on the Equation 3.3 in Chapter III; the calculation results are listed in Table 4. 5.
At this site, although grass is mowed monthly, total nitrogen is not removed by grass
mowing, because the mowed grass remains on the surface of the ground, this part of the total
nitrogen in the soil-water-plant system doesn’t exit from the system as defined in Chapter III
when three conceptual mass balances were discussed. Therefore, the nitrogen loss by plant
uptake is not considered in nitrogen mass balance in the land application system if the mowed
grass is not taken away. However, in reality, the nitrogen loss by plant uptake influences the total
nitrogen concentration in the leached water. The fate of nitrogen from mowed grass, which still
remains in the land application system, is complicated, and not included in this research.
Table 4. 5 Total nitrogen mass balance at the Littlefield site
Sampling period Applied TN,
mg per sampler
Leached TN, mg per sampler
Nitrogen stored or lost*, mg per sampler
10/07/2005-11/28/2005 92.102 0.000 92.102 11/28/2005-12/29/2005 73.210 0.051 73.159 12/29/2005-2/10/2006 104.722 5.420 99.303 2/10/2006-4/6/2006 168.887 7.207 161.680 4/6/2006-5/25/2006 130.183 0.122 130.061 5/25/2006-6/16/2006 29.692 1.030 28.662 6/16/2006-7/21/2006 38.279 1.069 37.210 7/21/2006-9/1/2006 30.824 1.226 29.598 9/1/2006-9/22/2006 9.938 0.752 9.186
9/22/2006-10/12/2006 11.037 2.211 8.826 10/12/2006-11/22/2006 29.067 0.153 28.915 11/22/2006-1/9/2007 38.205 4.746 33.460 1/9/2007-2/23/2007 28.741 1.795 26.946 2/23/2007-3/30/2007 50.756 5.345 45.410 3/30/2007-4/25/2007 47.870 0.222 47.648 4/25/2007-5/29/2007 43.491 2.531 40.960 5/29/2007-6/28/2007 20.835 2.652 18.182 6/28/2007-7/31/2007 24.251 0.740 23.511 7/31/2007-8/31/2007 15.773 1.844 13.929 8/31/2007-9/28/2007 15.806 2.551 13.255
*defines the N stored or lost here

76
4.2.3 Nitrate-nitrogen and ammonia-nitrogen
Although average total nitrogen concentration in the leached water was low, less than 5
mg/L, it is useful to summarize the results of nitrate-nitrogen and ammonia-nitrogen in the
leached water. The concentration in leached water in each sampler, the volume of leached water,
total and average leached mass, volume weighted average concentration in each sampling period,
and concentration and mass per sampler in the applied wastewater are listed for nitrate-nitrogen
and ammonia-nitrogen in Table 4. 6 and Table 4. 7, respectively.
The range of volume weighted average nitrate-nitrogen in the leached water is 0 mg/L to
3.292 mg/L, and the average nitrate-nitrogen in the wastewater is 2.4 mg/L to 8.2 mg/L. The
range of volume weighted average ammonia-nitrogen in the leached water is 0 mg/L to 0.327
mg/L, and the average nitrate-nitrogen in the wastewater is 0.01 mg/L to 6.4 mg/L. It can be
concluded that both types of nitrogen have low concentration in the leached water, especially for
ammonia-nitrogen, which is minor.

77
Table 4. 6 The list of nitrate-nitrogen in the leached water and in wastewater at the Littlefield site
1 2 3 4 5 6 7 8 9 10 11 12 13 14 15 16 Total Average W/W10/7/2005 Concentration, n/a n/a n/a n/a n/a n/a n/a n/a n/a n/a n/a n/a n/a n/a n/a n/a n/a 7.35
Volume, mL 223 220 350 305 332 410 701 887 810 379 54 698 326 689 605 300 7289Mass, mg n/a n/a n/a n/a n/a n/a n/a n/a n/a n/a n/a n/a n/a n/a n/a n/a n/a n/a
11/28/2005 Concentration, n/a n/a n/a n/a n/a n/a n/a n/a n/a n/a n/a n/a n/a n/a n/a n/a n/a 5.75Volume, mL 120 224 262 1063 650 1099 1490 1117 800 222 0 1326 693 927 440 545 10978 7675.2Mass, mg n/a n/a n/a n/a n/a n/a n/a n/a n/a n/a n/a n/a n/a n/a n/a n/a n/a 0.000 44.132
12/29/2005 Concentration, n/a n/a n/a n/a n/a n/a n/a n/a n/a n/a n/a n/a n/a n/a n/a n/a n/a 3.35Volume, mL 0 0 0 0 0 20 84 86 0 0 0 172 0 0 0 0 362 4575.6Mass, mg n/a n/a n/a n/a n/a 0.000 15.328
2/10/2006 Concentration, 0 0 0 0 0 0 0 0 9.6 n/a n/a 0 4.1 9.1 5.1 0 2.241 3.4Volume, mL 1322 1758 1838 1750 1300 1602 1658 938 1584 0 0 1950 850 2590 1714 1902 22756 6346.8Mass, mg 0 0 0 0 0 0 0 0 15.2064 0 3.485 23.569 8.7414 0 51.0018 3.188 21.579
4/6/2006 Concentration, 2.5 0 0 0 0 0 0 8.4 10.3 *131 0 6.5 0 10 6.9 0 3.292 2.4Volume, mL 905 825 1415 1510 1155 1430 1120 1631 2179 2047 1622 1110 1230 2148 1350 1539 23216 8888.8Mass, mg 2.2625 0 0 0 0 0 0 13.7004 22.4437 0 0 7.215 0 21.48 9.315 0 76.4166 4.776 21.333
5/25/2006 Concentration, 0 0 0 0 0 0 0 0 n/a n/a n/a 0 n/a 0 0 n/a 0.000 2.7Volume, mL 410 235 495 360 222 485 170 347 0 0 0 1780 0 725 1123 0 6352 7232.4Mass, mg 0 0 0 0 0 0 0 0 0 0 0 0 0.000 19.527
6/16/2006 Concentration, 0 0.2 0.9 0 0 0.4 0.8 0.1 n/a 0.7 1 0.2 2.1 0.3 0 n/a 0.344 5Volume, mL 404 390 590 760 450 850 780 540 0 214 132 1422 220 860 860 0 8472 1979.48Mass, mg 0 0.078 0.531 0 0 0.34 0.624 0.054 0.1498 0.132 0.2844 0.462 0.258 0 2.9132 0.182 9.897
Sampler NumberSampling Date

78
Continued
1 2 3 4 5 8 9 10 11 12 13 15 16 Total Average W/W7/21/2006 Concentration, m 0.3 0.7 0 0.4 0 0.4 1.5 0.4 n/a 0 0 0 0.6 0.238 5
Volume, mL 530 345 740 900 340 655 118 600 0 1104 580 549 272 6733 4503.44Mass, mg 0.159 0.2415 0 0.36 0 0.262 0.177 0.24 0 0 0 0.1632 1.6027 0.123 22.517
9/1/2006 Concentration, m 0.5 0.6 0.5 0.8 0.4 1 1.8 2.1 n/a 0.5 1.4 0.6 1 1.075 5.2Volume, mL 340 290 620 670 40 1350 270 1680 0 1234 300 530 670 7994 4403.4Mass, mg 0.17 0.174 0.31 0.536 0.016 1.35 0.486 3.528 0.617 0.42 0.318 0.67 8.595 0.661 22.898
9/22/2006 Concentration, m 0 0 0 0 0 0.8 0.8 1.4 0.7 0 0.6 0.8 0.8 0.539 3.9Volume, mL 660 480 645 960 900 1400 1090 1590 1490 1540 740 890 990 13375 1656.4Mass, mg 0 0 0 0 0 1.12 0.872 2.226 1.043 0 0.444 0.712 0.792 7.209 0.555 6.460
10/12/2006 Concentration, m 2.3 n/a 2.2 2.6 n/a 1.7 n/a 0.4 n/a 0.6 1.5 2.5 1.4 2.056 4.15Volume, mL 1610 0 550 1540 0 2206 0 170 0 680 370 2790 440 10356 2207.44Mass, mg 3.703 1.21 4.004 3.7502 0.068 0.408 0.555 6.975 0.616 21.2892 1.638 9.161
11/22/2006 Concentration, m 0 0.5 0 0 0.2 0 n/a 0 0.9 0 1.4 0 0 0.030 4.7Volume, mL 150 50 310 350 46 870 0 320 59 330 25 350 1170 4030 2422.28Mass, mg 0 0.025 0 0 0.0092 0 0 0.0531 0 0.035 0 0 0.1223 0.009 11.385
1/9/2007 Concentration, m 0.4 3.9 1 0.6 n/a 1 n/a 0.3 n/a 0 0.7 0.9 3.8 1.445 4.1Volume, mL 995 1435 1395 1455 0 1545 0 640 0 335 1435 1480 1335 12050 2387.84Mass, mg 0.398 5.5965 1.395 0.873 1.545 0.192 0 1.0045 1.332 5.073 17.409 1.339 9.790
2/23/2007 Concentration, m 0 1.3 1.5 1.3 0 0 1.1 1.3 1.1 1.6 0 0 7.9 1.484 5.75Volume, mL 1161 1032 620 1146 760 1470 630 1470 820 67 1050 1100 1470 12796 2874.1Mass, mg 0 1.3416 0.93 1.4898 0 0 0.693 1.911 0.902 0.1072 0 0 11.613 18.9876 1.461 16.526
3/30/2007 Concentration, m 1.2 0.4 3 1.2 0.3 0.6 1.8 2.5 0.8 0.4 1 1.8 1.2 1.359 4.25Volume, mL 1440 1550 1582 1780 1250 2050 2090 2550 2130 520 1685 2225 1532 22384 2985.62Mass, mg 1.728 0.62 4.746 2.136 0.375 1.23 3.762 6.375 1.704 0.208 1.685 4.005 1.8384 30.4124 2.339 12.689
4/25/2007 Concentration, m 0 0 0 0 0 0 1.8 1.5 0 1.8 0.6 0 0 0.155 4.7Volume, mL 670 980 805 1290 770 1450 185 590 855 50 490 1470 700 10305 2815.88Mass, mg 0 0 0 0 0 0 0.333 0.885 0 0.09 0.294 0 0 1.602 0.123 13.235
5/29/2007 Concentration, m 1 0.8 0.9 0.9 0.4 0.6 1.8 1.7 0.7 1.6 0.9 1.7 1.3 1.125 8.2Volume, mL 1435 1500 1640 1670 730 1790 1820 2470 2110 440 1645 1760 1555 20565 3479.26Mass, mg 1.435 1.2 1.476 1.503 0.292 1.074 3.276 4.199 1.477 0.704 1.4805 2.992 2.0215 23.13 1.779 28.530
6/28/2007 Concentration, m 1.3 0.4 1.7 0.9 0.2 0.6 2.9 1.1 0.6 0.5 1.2 1.3 0.8 1.082 5.1Volume, mL 1360 870 1490 1520 1500 1480 1390 2345 1750 235 1550 1500 1480 18470 2604.32Mass, mg 1.768 0.348 2.533 1.368 0.3 0.888 4.031 2.5795 1.05 0.1175 1.86 1.95 1.184 19.977 1.537 13.282
Sampler NumberSampling Date

79
Continued
1 2 4 5 8 10 11 13 15 16 Total Average W/W7/31/2007 Concentration, 1.3 0.3 0.7 0.6 1.7 n/a n/a n/a 1.5 1.5 1.133 4.7
Volume, mL 450 870 675 235 1000 0 0 0 660 700 4590 4041.78Mass, mg 0.585 0.261 0.4725 0.141 1.7 0.99 1.05 5.1995 0.51995 18.996
8/31/2007 Concentration, 0.4 n/a 0 n/a 1.2 n/a n/a n/a 5.5 3.1 1.774 3.15Volume, mL 1575 0 340 0 1950 0 0 0 840 570 5275 3154.54Mass, mg 0.63 0 2.34 4.62 1.767 9.357 0.9357 9.937
9/28/2007 Concentration, 1.6 0.9 0.9 0.9 1.3 1.6 1.5 1.4 2.3 1.3 1.521 5.75Volume, mL 925 300 720 340 1420 1600 265 340 1420 470 7800 2107.4Mass, mg 1.48 0.27 0.648 0.306 1.846 2.56 0.3975 0.476 3.266 0.611 11.8605 1.18605 12.118
Sampling DateSampler Number
Notes: 1. Gray denotes that leach water is not available for calculation of total nitrogen mass; 2. Black denotes that the total nitrogen concentration is an outlier, and abnormal, and the value is not shown; 3. W/W denotes applied wastewater; 4. Nitrate-nitrogen analysis was not conducted for the samples before 2006.
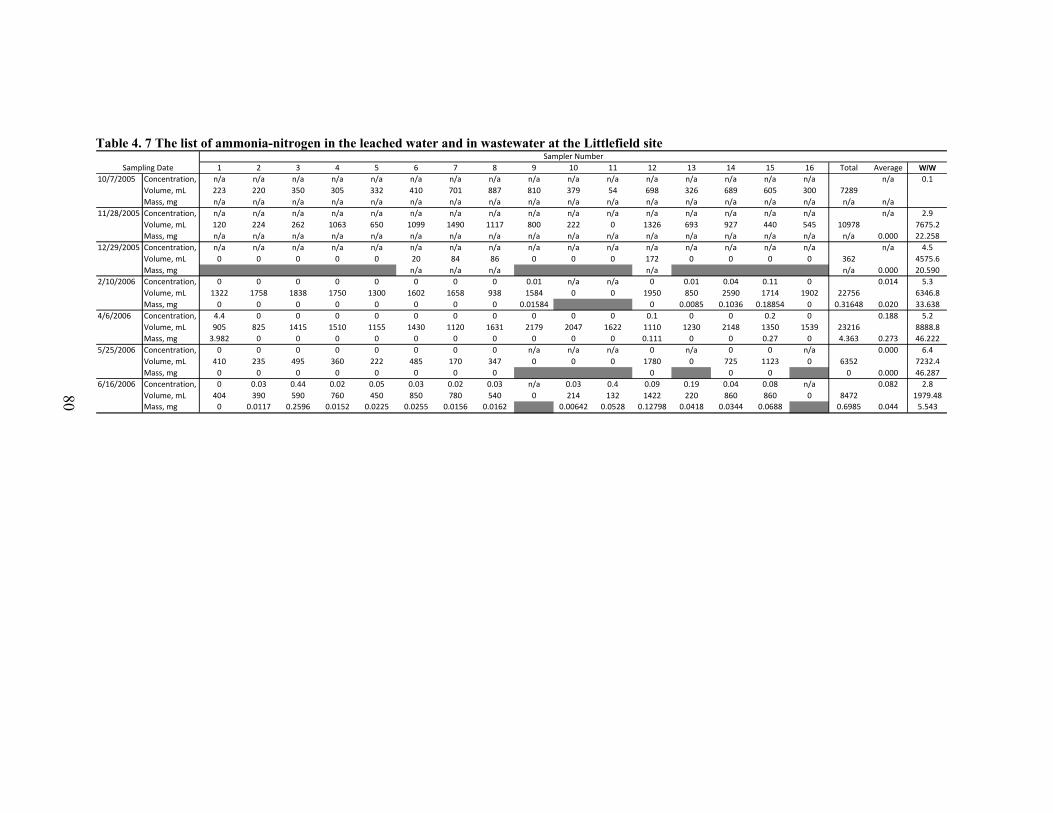
80
Table 4. 7 The list of ammonia-nitrogen in the leached water and in wastewater at the Littlefield site
1 2 3 4 5 6 7 8 9 10 11 12 13 14 15 16 Total Average W/W10/7/2005 Concentration, n/a n/a n/a n/a n/a n/a n/a n/a n/a n/a n/a n/a n/a n/a n/a n/a n/a 0.1
Volume, mL 223 220 350 305 332 410 701 887 810 379 54 698 326 689 605 300 7289Mass, mg n/a n/a n/a n/a n/a n/a n/a n/a n/a n/a n/a n/a n/a n/a n/a n/a n/a n/a
11/28/2005 Concentration, n/a n/a n/a n/a n/a n/a n/a n/a n/a n/a n/a n/a n/a n/a n/a n/a n/a 2.9Volume, mL 120 224 262 1063 650 1099 1490 1117 800 222 0 1326 693 927 440 545 10978 7675.2Mass, mg n/a n/a n/a n/a n/a n/a n/a n/a n/a n/a n/a n/a n/a n/a n/a n/a n/a 0.000 22.258
12/29/2005 Concentration, n/a n/a n/a n/a n/a n/a n/a n/a n/a n/a n/a n/a n/a n/a n/a n/a n/a 4.5Volume, mL 0 0 0 0 0 20 84 86 0 0 0 172 0 0 0 0 362 4575.6Mass, mg n/a n/a n/a n/a n/a 0.000 20.590
2/10/2006 Concentration, 0 0 0 0 0 0 0 0 0.01 n/a n/a 0 0.01 0.04 0.11 0 0.014 5.3Volume, mL 1322 1758 1838 1750 1300 1602 1658 938 1584 0 0 1950 850 2590 1714 1902 22756 6346.8Mass, mg 0 0 0 0 0 0 0 0 0.01584 0 0.0085 0.1036 0.18854 0 0.31648 0.020 33.638
4/6/2006 Concentration, 4.4 0 0 0 0 0 0 0 0 0 0 0.1 0 0 0.2 0 0.188 5.2Volume, mL 905 825 1415 1510 1155 1430 1120 1631 2179 2047 1622 1110 1230 2148 1350 1539 23216 8888.8Mass, mg 3.982 0 0 0 0 0 0 0 0 0 0 0.111 0 0 0.27 0 4.363 0.273 46.222
5/25/2006 Concentration, 0 0 0 0 0 0 0 0 n/a n/a n/a 0 n/a 0 0 n/a 0.000 6.4Volume, mL 410 235 495 360 222 485 170 347 0 0 0 1780 0 725 1123 0 6352 7232.4Mass, mg 0 0 0 0 0 0 0 0 0 0 0 0 0.000 46.287
6/16/2006 Concentration, 0 0.03 0.44 0.02 0.05 0.03 0.02 0.03 n/a 0.03 0.4 0.09 0.19 0.04 0.08 n/a 0.082 2.8Volume, mL 404 390 590 760 450 850 780 540 0 214 132 1422 220 860 860 0 8472 1979.48Mass, mg 0 0.0117 0.2596 0.0152 0.0225 0.0255 0.0156 0.0162 0.00642 0.0528 0.12798 0.0418 0.0344 0.0688 0.6985 0.044 5.543
Sampler NumberSampling Date

81
Continued
1 2 3 4 5 8 9 10 11 12 13 15 16 Total Average W/W7/21/2006 Concentration, m 0.14 0.02 0.17 0.03 0.03 0.06 0.02 0.05 n/a 0.08 0.07 0.12 0.06 0.078 0.12
Volume, mL 530 345 740 900 340 655 118 600 0 1104 580 549 272 6733 4503.44Mass, mg 0.0742 0.0069 0.1258 0.027 0.0102 0.0393 0.00236 0.03 0.08832 0.0406 0.06588 0.01632 0.52688 0.041 0.540
9/1/2006 Concentration, m 0.03 0.01 0.01 0.03 0.03 0.03 0.08 0.17 n/a 0.05 0.04 0.05 0.06 0.066 0.14Volume, mL 340 290 620 670 40 1350 270 1680 0 1234 300 530 670 7994 4403.4Mass, mg 0.0102 0.0029 0.0062 0.0201 0.0012 0.0405 0.0216 0.2856 0.0617 0.012 0.0265 0.0402 0.5287 0.041 0.616
9/22/2006 Concentration, m 0 0 0 0 0 0 0.01 0.01 0 0 0 0.02 0.02 0.005 0.02Volume, mL 660 480 645 960 900 1400 1090 1590 1490 1540 740 890 990 13375 1656.4Mass, mg 0 0 0 0 0 0 0.0109 0.0159 0 0 0 0.0178 0.0198 0.0644 0.005 0.033
10/12/2006 Concentration, m 0.04 n/a 0.07 0.06 n/a 0.02 n/a 0 n/a 0 0.04 0.05 0.02 0.039 0.16Volume, mL 1610 0 550 1540 0 2206 0 170 0 680 370 2790 440 10356 2207.44Mass, mg 0.0644 0.0385 0.0924 0.04412 0 0 0.0148 0.1395 0.0088 0.40252 0.031 0.353
11/22/2006 Concentration, m 0 0.02 0 0 0.1 0 n/a 0 0.54 0 2.6 0 0 0.025 1.8Volume, mL 150 50 310 350 46 870 0 320 59 330 25 350 1170 4030 2422.28Mass, mg 0 0.001 0 0 0.0046 0 0 0.03186 0 0.065 0 0 0.10246 0.008 4.360
1/9/2007 Concentration, m 0.01 2.5 0.02 0 n/a 0.02 n/a 0.02 n/a 0.01 0.02 0.03 0.15 0.327 2.6Volume, mL 995 1435 1395 1455 0 1545 0 640 0 335 1435 1480 1335 12050 2387.84Mass, mg 0.00995 3.5875 0.0279 0 0.0309 0.0128 0.00335 0.0287 0.0444 0.20025 3.94575 0.304 6.208
2/23/2007 Concentration, m 0 0 0 0 0 0 0.01 0 0 0.04 0 0 0.04 0.005 3.5Volume, mL 1161 1032 620 1146 760 1470 630 1470 820 67 1050 1100 1470 12796 2874.1Mass, mg 0 0 0 0 0 0 0.0063 0 0 0.00268 0 0 0.0588 0.06778 0.005 10.059
3/30/2007 Concentration, m 0.02 0.01 0.02 0.02 0.02 0.01 0.03 0.02 0.01 0.02 0.02 0.06 0.06 0.025 4.1Volume, mL 1440 1550 1582 1780 1250 2050 2090 2550 2130 520 1685 2225 1532 22384 2985.62Mass, mg 0.0288 0.0155 0.03164 0.0356 0.025 0.0205 0.0627 0.051 0.0213 0.0104 0.0337 0.1335 0.09192 0.56156 0.043 12.241
4/25/2007 Concentration, m 0 0 0 0 0 0 0.02 0.05 0 0.9 0.03 0 0 0.009 4.7Volume, mL 670 980 805 1290 770 1450 185 590 855 50 490 1470 700 10305 2815.88Mass, mg 0 0 0 0 0 0 0.0037 0.0295 0 0.045 0.0147 0 0 0.0929 0.007 13.235
5/29/2007 Concentration, m 0 0 0 0 0 0 0 0.01 0 0.1 0 0.01 0.02 0.006 0.01Volume, mL 1435 1500 1640 1670 730 1790 1820 2470 2110 440 1645 1760 1555 20565 3479.26Mass, mg 0 0 0 0 0 0 0 0.0247 0 0.044 0 0.0176 0.0311 0.1174 0.009 0.035
6/28/2007 Concentration, m 0.05 0.01 0.1 0.01 0 0.01 0.01 0.01 0.01 0.15 0.02 0.04 0.04 0.027 1.05Volume, mL 1360 870 1490 1520 1500 1480 1390 2345 1750 235 1550 1500 1480 18470 2604.32Mass, mg 0.068 0.0087 0.149 0.0152 0 0.0148 0.0139 0.02345 0.0175 0.03525 0.031 0.06 0.0592 0.496 0.038 2.735
Sampler NumberSampling Date
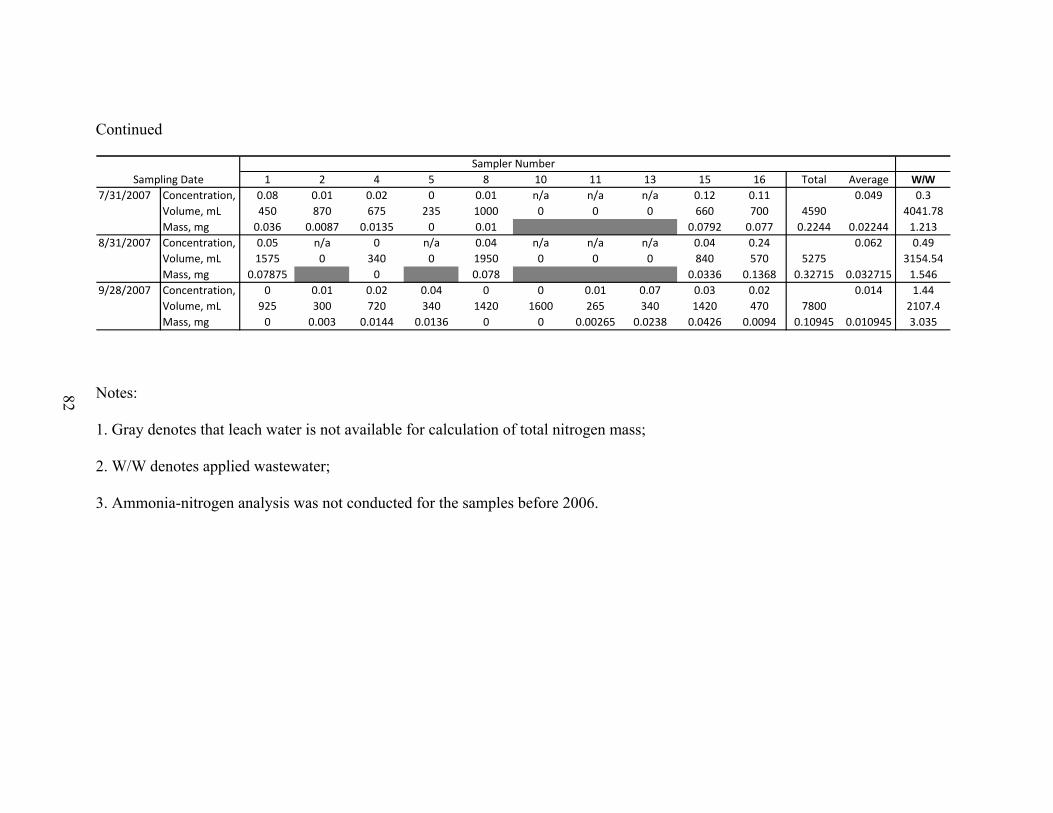
82
Continued
1 2 4 5 8 10 11 13 15 16 Total Average W/W7/31/2007 Concentration, 0.08 0.01 0.02 0 0.01 n/a n/a n/a 0.12 0.11 0.049 0.3
Volume, mL 450 870 675 235 1000 0 0 0 660 700 4590 4041.78Mass, mg 0.036 0.0087 0.0135 0 0.01 0.0792 0.077 0.2244 0.02244 1.213
8/31/2007 Concentration, 0.05 n/a 0 n/a 0.04 n/a n/a n/a 0.04 0.24 0.062 0.49Volume, mL 1575 0 340 0 1950 0 0 0 840 570 5275 3154.54Mass, mg 0.07875 0 0.078 0.0336 0.1368 0.32715 0.032715 1.546
9/28/2007 Concentration, 0 0.01 0.02 0.04 0 0 0.01 0.07 0.03 0.02 0.014 1.44Volume, mL 925 300 720 340 1420 1600 265 340 1420 470 7800 2107.4Mass, mg 0 0.003 0.0144 0.0136 0 0 0.00265 0.0238 0.0426 0.0094 0.10945 0.010945 3.035
Sampling DateSampler Number
Notes: 1. Gray denotes that leach water is not available for calculation of total nitrogen mass; 2. W/W denotes applied wastewater; 3. Ammonia-nitrogen analysis was not conducted for the samples before 2006.

83
4.3 Salt Balance
This section illustrates how two types of salt concentration unit are converted. Spatial and
temporal distribution of the leached salt mass is described. Salt mass balance is calculated.
4.3.1 Salt concentration unit conversion
In this research, salt concentration, which is also called salinity, is measured and recorded
in μS/cm; however, in the mass balance of salt, it is necessary to convert electrical conductivity
(EC) in μS/cm into total dissolved solid (TDS) in mg/L in order to calculate the mass of salt. The
salinity of water samples taken on June 28th, 2007 was measured in μS/cm (EC) and mg/L
(TDS) with the ORION model 162 instrument. The data of the measurement is shown in Table 4.
8 and the plots of their relationship are shown in Figure 4. 4. The relationship can be found by
making the regression model. The corresponding equation is
y = 0.68x + 5.68
x is μS/cm;
y is mg/L.
This relationship is used during the following salt mass balance to convert the units
between μS/cm and mg/L of salt concentration.

84
Table 4. 8 The salinity expressed with electrical conductivity and total dissolved solid for a set of water samples
Water sample no. Electrical conductivity (EC), μS/cm Total dissolved solid (TDS), mg/L 1 1664 1135 2 2510 1696 3 1517 1033 4 1596 1085 5 2220 1511 6 1668 1136 7 2040 1388 8 1438 978 9 1606 1093 10 1465 996 11 2050 1397 12 1593 1085 13 2030 1382 14 964 656 15 960 654 16 1631 1109
y = 0. 6769x + 5. 6829R2 = 0. 9999
400600800
10001200140016001800
500 1000 1500 2000 2500 3000El ect r i cal conduct i vi t y ( EC) , μ S/ cm
Tota
l di
ssol
ved
soli
d (T
DS),
mg/
L
Figure 4. 4 The relationship between electrical conductivity, μS/cm, and total dissolved solid, mg/L

85
4.3.2 Spatial and temporal distribution of leached salt mass
The salinity and salt mass in the leach water of each sampler during each sampling period
and the total and average salinity and salt mass are summarized in Table 4. 9. The spatial
distribution of leached salt mass can be seen in Figure E.1 to Figure E.21 in Appendix E.
The volume weighted average salinity in leach water at each sampling date is plotted in
Figure 4. 5, and the average leached mass of salt with ±standard error at each sampling date is
shown in Figure 4. 6. The calculation of volume weighted average salinity in leach water at each
sampling date is based on the following equation:
∑
∑
=
== n
ii
i
weighted
V
V
1
n
1iiC
C (4.2)
where, weightedC is the weighted average salinity in the leach water, μS/cm;
Ci is the salinity in the i-th sampler, μS/cm;
Vi is the volume of the leach water in the i-th sampler, L.

86
Table 4. 9 The summarization of salinity and salt mass in the leached water and applied wastewater at the Littlefield site Sampling Date 1 2 3 4 5 6 7 8 9 10 11 12 13 14 15 16 Total Average W/W10/7/2005 Salinity (μS/cm) 2670 3050 2380 1639 1590 2650 2330 1967 1694 1504 1658 1518 2420 2020 1723 1328 1962 937.5
Volume, mL 223 220 350 305 332 410 701 887 810 379 54 698 326 689 605 300 7289 456Salinity (mg/L) 1813 2070 1617 1115 1082 1799 1583 1337 1152 1024 1128 1033 1644 1373 1172 905 1334 640Mass, mg 404 455 566 340 359 738 1110 1186 933 388 61 721 536 946 709 271 9724 608
11/28/2005 Salinity (μS/cm) 2480 2810 2510 1604 1620 2500 2240 1915 1955 2200 n/a 1423 2680 1890 1981 1574 1990 1056Volume, mL 120 224 262 1063 650 1099 1490 1117 800 222 0 1326 693 927 440 545 10978 686 7675Salinity (mg/L) 1684 1908 1705 1091 1102 1698 1522 1302 1329 1495 969 1820 1285 1347 1071 1353 720Mass, mg 202 427 447 1160 716 1866 2268 1454 1063 332 1285 1261 1191 593 584 14849 928 5530
12/29/2005 Salinity (μS/cm) n/a n/a n/a n/a n/a 2790 2390 2250 n/a n/a n/a 1514 n/a n/a n/a n/a 1963 1146.5Volume, mL 0 0 0 0 0 20 84 86 0 0 0 172 0 0 0 0 362 23 4575.6Salinity (mg/L) 1894 1623 1529 1031 1334 782Mass, mg 38 136 131 177 483 30 3577
2/10/2006 Salinity (μS/cm) 1538 2450 1843 1335 1562 1973 1880 1623 1658 n/a n/a 1207 2390 1579 1597 1386 1686 876Volume, mL 1322 1758 1838 1750 1300 1602 1658 938 1584 0 0 1950 850 2590 1714 1902 22756 1422 6347Salinity (mg/L) 1047 1664 1253 909 1063 1341 1278 1104 1128 823 1623 1075 1087 944 1147 599Mass, mg 1384 2925 2303 1591 1382 2149 2119 1036 1787 1604 1380 2783 1863 1795 26101 1631 3799
4/6/2006 Salinity (μS/cm) 946 2060 2080 1319 1555 1869 1789 1573 1632 2610 2070 1294 2100 1495 1496 1427 1733 840Volume, mL 905 825 1415 1510 1155 1430 1120 1631 2179 2047 1622 1110 1230 2148 1350 1539 23216 1451 8889Salinity (mg/L) 646 1400 1414 899 1058 1271 1217 1070 1110 1772 1407 882 1427 1018 1018 972 1179 574Mass, mg 585 1155 2000 1357 1222 1817 1363 1746 2420 3628 2282 979 1755 2186 1375 1495 27364 1710 5105
5/25/2006 Salinity (μS/cm) 1344 1591 1451 1408 1492 1748 1536 1386 n/a n/a n/a 1145 n/a 1544 1492 n/a 1402 1016Volume, mL 410 235 495 360 222 485 170 347 0 0 0 1780 0 725 1123 0 6352 397 7232Salinity (mg/L) 915 1083 988 959 1016 1189 1045 944 781 1051 1016 955 693Mass, mg 375 254 489 345 225 577 178 328 1390 762 1141 6063 379 5015
6/16/2006 Salinity (μS/cm) 918 1175 1097 1093 1450 1651 1422 1171 n/a 1639 1868 1104 1286 1029 1446 n/a 1261 851.5Volume, mL 404 390 590 760 450 850 780 540 0 214 132 1422 220 860 860 0 8472 530 1979Salinity (mg/L) 627 801 748 746 987 1123 968 798 1115 1270 753 876 702 984 859 582Mass, mg 253 312 441 567 444 955 755 431 239 168 1071 193 604 847 7279 455 1152
Sampler Number

87
Continued Sampling Date 1 2 3 4 5 8 9 10 11 12 13 15 16 Total Average W/W7/21/2006 Salinity (μS/cm) 1585 1332 1406 1507 2140 1733 1569 1038 n/a 1288 2080 1783 1544 1544 839
Volume, mL 530 345 740 900 340 655 118 600 0 1104 580 549 272 6733 518 4503Salinity (mg/L) 1079 907 957 1026 1454 1179 1068 708 878 1414 1213 1051 1051 574Mass, mg 572 313 708 923 494 772 126 425 969 820 666 286 7074 544 2583
9/1/2006 Salinity (μS/cm) 1531 1275 1117 1390 1644 1914 1360 1263 n/a 1436 1747 1653 2020 1523 891Volume, mL 340 290 620 670 40 1350 270 1680 0 1234 300 530 670 7994 615 4403.4Salinity (mg/L) 1042 869 762 947 1119 1301 926 861 978 1188 1125 1373 1037 609Mass, mg 354 252 472 634 45 1757 250 1446 1206 356 596 920 8289 638 2681
9/22/2006 Salinity (μS/cm) 1644 1733 1270 1276 2120 1706 2080 1649 3010 1399 2020 1525 1972 1839 884.5Volume, mL 660 480 645 960 900 1400 1090 1590 1490 1540 740 890 990 13375 1029 1656.4Salinity (mg/L) 1119 1179 865 869 1441 1160 1414 1122 2043 953 1373 1038 1341 1250 604Mass, mg 738 566 558 835 1297 1625 1541 1784 3044 1467 1016 924 1327 16721 1286 1001
10/12/2006 Salinity (μS/cm) 1616 n/a 1352 1429 n/a 1570 n/a 1897 n/a 1463 2300 1652 2370 1625 884.5Volume, mL 1610 0 550 1540 0 2206 0 170 0 680 370 2790 440 10356 797 2207.44Salinity (mg/L) 1100 921 973 1068 1290 996 1563 1124 1610 1106 604Mass, mg 1770 506 1498 2357 219 677 578 3136 708 11451 881 1334
11/22/2006 Salinity (μS/cm) 1203 1526 1240 1291 1888 1328 n/a 1150 2170 1305 2280 1588 2200 1600 930.5Volume, mL 150 50 310 350 46 870 0 320 59 330 25 350 1170 4030 310 2422.28Salinity (mg/L) 820 1039 845 880 1284 905 784 1475 889 1549 1081 1495 1089 636Mass, mg 123 52 262 308 59 787 251 87 293 39 378 1749 4388 338 1539
1/9/2007 Salinity (μS/cm) 1511 984 800 1137 n/a 1320 n/a 1589 n/a 1340 2090 1351 2200 1421 1000Volume, mL 995 1435 1395 1455 0 1545 0 640 0 335 1435 1480 1335 12050 927 2387.84Salinity (mg/L) 1028 672 547 775 899 1081 913 1420 920 1495 968 683Mass, mg 1023 964 763 1128 1389 692 306 2038 1362 1996 11662 897 1630
2/23/2007 Salinity (μS/cm) 1800 1894 893 1086 3160 1168 2800 1355 2090 1251 2150 1603 1637 1715 857Volume, mL 1161 1032 620 1146 760 1470 630 1470 820 67 1050 1100 1470 12796 984 2874.1Salinity (mg/L) 1224 1288 610 741 2145 796 1901 923 1420 852 1461 1091 1114 1166 586Mass, mg 1421 1329 378 849 1630 1171 1198 1357 1165 57 1534 1200 1637 14925 1148 1684
3/30/2007 Salinity (μS/cm) 1787 2250 1485 1263 2170 1294 2250 1410 1633 1406 1999 1795 1709 1720 1036Volume, mL 1440 1550 1582 1780 1250 2050 2090 2550 2130 520 1685 2225 1532 22384 1722 2985.62Salinity (mg/L) 1215 1529 1011 861 1475 882 1529 960 1111 957 1359 1221 1163 1170 707Mass, mg 1750 2369 1599 1532 1843 1807 3195 2448 2367 498 2290 2716 1781 26195 2015 2111
4/25/2007 Salinity (μS/cm) 1915 2180 1213 1293 2020 1171 1933 1347 1492 1257 1937 1245 1707 1532 1053Volume, mL 670 980 805 1290 770 1450 185 590 855 50 490 1470 700 10305 793 2815.88Salinity (mg/L) 1302 1481 827 881 1373 798 1314 917 1016 857 1317 848 1161 1042 718Mass, mg 872 1452 666 1136 1057 1158 243 541 868 43 645 1247 813 10742 826 2023
5/29/2007 Salinity (μS/cm) 1943 2560 1646 1524 2290 1463 2090 1443 1663 1407 2080 1525 1852 1782 945.5Volume, mL 1435 1500 1640 1670 730 1790 1820 2470 2110 440 1645 1760 1555 20565 1582 3479.26Salinity (mg/L) 1321 1739 1120 1037 1556 996 1420 982 1131 958 1414 1038 1259 1212 646Mass, mg 1895 2608 1837 1732 1136 1783 2585 2427 2387 422 2325 1827 1958 24922 1917 2247
6/28/2007 Salinity (μS/cm) 1664 2510 1517 1596 2220 1668 2040 1438 1606 1465 2050 1593 2030 1779 962Volume, mL 1360 870 1490 1520 1500 1480 1390 2345 1750 235 1550 1500 1480 18470 1421 2604.32Salinity (mg/L) 1132 1705 1033 1086 1508 1135 1387 979 1093 997 1393 1084 1380 1210 657Mass, mg 1540 1483 1538 1651 2263 1679 1927 2296 1912 234 2160 1626 2042 22352 1719 1711
Sampler Number

88
Continued
Sampling Date 1 2 4 5 8 10 11 13 15 16 Total Average W/W7/31/2007 Salinity (μS/cm) 1618 2280 1610 2960 2050 n/a n/a n/a 1694 2220 2008 1009.5
Volume, mL 450 870 675 235 1000 0 0 0 660 700 4590 459 4041.78Salinity (mg/L) 1101 1549 1095 2009 1393 1152 1508 1365 689Mass, mg 495 1348 739 472 1393 761 1056 6264 626 2785
8/31/2007 Salinity (μS/cm) 1604 n/a 5470 n/a 3080 n/a n/a n/a 2840 3440 2794 1121Volume, mL 1575 0 340 0 1950 0 0 0 840 570 5275 528 3154.54Salinity (mg/L) 1091 3708 2091 1928 2334 1897 764Mass, mg 1719 1261 4077 1620 1331 10006 1001 2412
9/28/2007 Salinity (μS/cm) 1882 2520 2440 3480 2190 3250 3800 3590 1921 3230 2592 1075Volume, mL 925 300 720 340 1420 1600 265 340 1420 470 7800 780 2107.4Salinity (mg/L) 1280 1711 1657 2361 1488 2206 2578 2436 1306 2192 1760 733Mass, mg 1184 513 1193 803 2113 3529 683 828 1855 1030 13731 1373 1545
Sampler Number
Note:
1. Gray denotes that there is no leach water available; 2. W/W means the applied secondary wastewater.
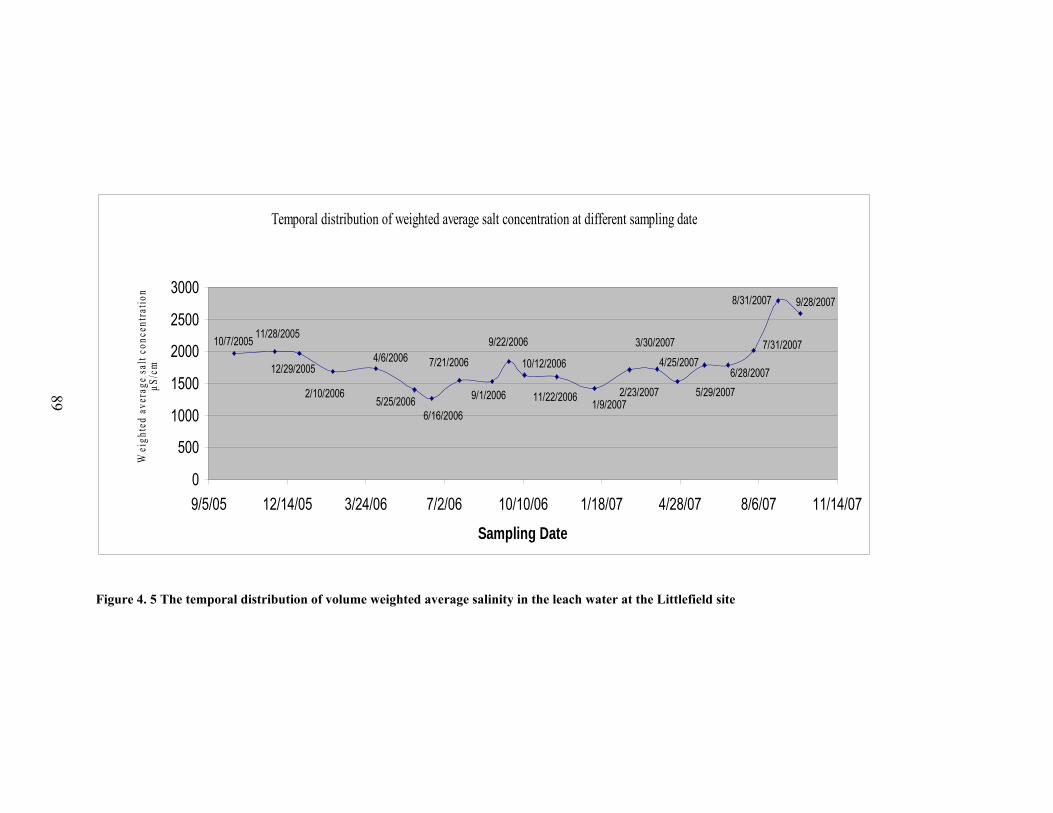
89
Temporal distribution of weighted average salt concentration at different sampling date
1/9/2007
9/28/20078/31/2007
4/25/20077/31/20073/30/2007
5/25/2006
6/28/20075/29/20072/23/200711/22/2006
10/12/2006
9/22/2006
9/1/2006
7/21/200612/29/2005
6/16/2006
4/6/2006
2/10/2006
11/28/200510/7/2005
0
500
1000
1500
2000
2500
3000
9/5/05 12/14/05 3/24/06 7/2/06 10/10/06 1/18/07 4/28/07 8/6/07 11/14/07
Sampling Date
Wei
ghte
d av
erag
e sa
lt co
ncen
tratio
n μS
/cm
Figure 4. 5 The temporal distribution of volume weighted average salinity in the leach water at the Littlefield site

90
Sampling date
10/1/05 1/1/06 4/1/06 7/1/06 10/1/06 1/1/07 4/1/07 7/1/07 10/1/07
Ave
rage
leac
hed
salt
mas
s, m
g
0
500
1000
1500
2000
2500
3000
Figure 4. 6 Average leached mass of salt ± standard error in the leached water in each sampling
period at the Littlefield site

91
4.3.3 Salt mass balance
Salt mass balance is based on one sampler. Equation 3.5 is employed to determine
the salt mass balance. The applied salt is the average mass in the applied wastewater
falling onto the soil surface of the samplers, the leached salt is the average mass in the
leached water of the samplers, and the stored salt is the average salt mass stored in the
root zone in the samplers. The result of calculation of salt mass balance is listed in Table
4. 10 for each sampling period.
Table 4. 10 Mass balance of salt for each sampling period at the Littlefield site based on one sampler Sampling period Leached salt, mg Applied salt, mg Stored salt in soil, mg
10/07/2005-11/28/2005 928.075 5529.899 4601.824 11/28/2005-12/29/2005 30.186 3576.970 3546.784 12/29/2005-2/10/2006 1631.341 3799.495 2168.153 2/10/2006-4/6/2006 1710.275 5104.650 3394.375 4/6/2006-5/25/2006 378.957 5015.042 4636.086 5/25/2006-6/16/2006 454.967 1152.183 697.215 6/16/2006-7/21/2006 544.160 2583.182 2039.022 7/21/2006-9/1/2006 637.617 2680.793 2043.177 9/1/2006-9/22/2006 1286.239 1001.130 -285.109
9/22/2006-10/12/2006 880.834 1334.179 453.345 10/12/2006-11/22/2006 337.540 1539.452 1201.912 11/22/2006-1/9/2007 897.042 1629.899 732.857 1/9/2007-2/23/2007 1148.089 1683.608 535.520 2/23/2007-3/30/2007 2015.032 2110.688 95.655 3/30/2007-4/25/2007 826.275 2023.093 1196.818 4/25/2007-5/29/2007 1917.050 2246.530 329.480 5/29/2007-6/28/2007 1719.356 1710.675 -8.681 6/28/2007-7/31/2007 626.446 2784.841 2158.395 7/31/2007-8/31/2007 1000.647 2411.607 1410.961 8/31/2007-9/28/2007 1373.136 1545.463 172.327

92
DATA ANALYSIS AND RESULTS AT TTU SITE
4.4 Water Balance
4.4.1 Temporal distribution of average leach water volume
Temporal distribution of average leach water volume with standard deviation for
Houston samplers and Midland samplers are shown in Figure 4.7 and Figure 4.8,
respectively.
4.4.2 Calculation of water mass balance
The soil moisture at saturation in the sampler for Houston samplers is:
inches 36.6inches 12soil
water53.0 3
3
=×m
m
Houston Samples
Sampling date
10/1/05 1/1/06 4/1/06 7/1/06 10/1/06 1/1/07 4/1/07 7/1/07 10/1/07
The
mea
n of
leac
h w
ater
vol
ume
with
sta
ndar
d de
viat
ion
for e
ach
sam
plin
g pe
riod,
mL
-500
0
500
1000
1500
2000
2500
Figure 4. 7 The mean of leach water with one standard deviation for each sampling
period for Houston soil
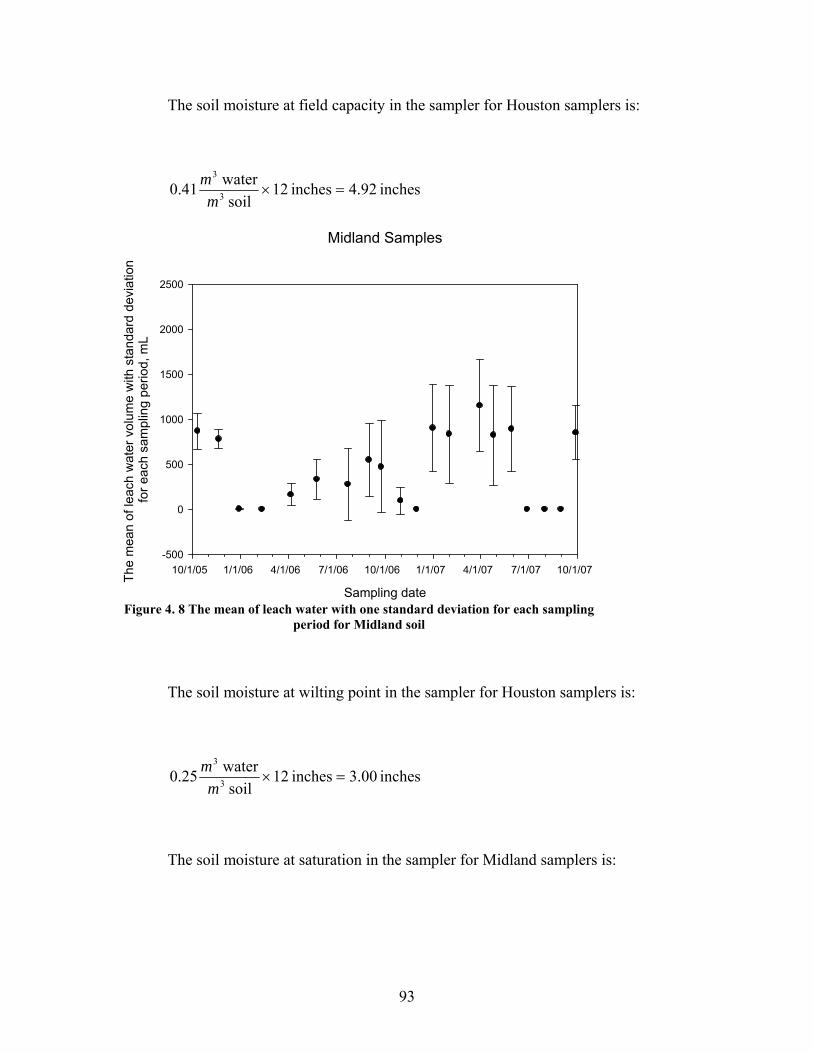
93
The soil moisture at field capacity in the sampler for Houston samplers is:
inches 92.4inches 12soil
water41.0 3
3
=×m
m
The soil moisture at wilting point in the sampler for Houston samplers is:
inches 00.3inches 12soil
water25.0 3
3
=×m
m
The soil moisture at saturation in the sampler for Midland samplers is:
Midland Samples
Sampling date
10/1/05 1/1/06 4/1/06 7/1/06 10/1/06 1/1/07 4/1/07 7/1/07 10/1/07
The
mea
n of
leac
h w
ater
vol
ume
with
sta
ndar
d de
viat
ion
for e
ach
sam
plin
g pe
riod,
mL
-500
0
500
1000
1500
2000
2500
Figure 4. 8 The mean of leach water with one standard deviation for each sampling
period for Midland soil

94
inches 8.4inches 12soil
water4.0 3
3
=×m
m
The soil moisture at field capacity in the sampler for Midland samplers is:
inches 4.2inches 12soil
water2.0 3
3
=×m
m
The soil moisture at wilting point in the sampler for Midland samplers is:
inches 2.1inches 12soil
water1.0 3
3
=×m
m
One inch of water in the sampler is equivalent to 820 mL of water. The
precipitation is zero inches for Houston samplers since those six samplers are installed
inside of Greenhouse at TTU site. And the precipitation data at TTU site for Midland
samplers can be obtained at the web site of the National Climatic Data Center:
http://www.ncdc.noaa.gov.
The water balance calculations for Houston samplers and Midland samplers are
illustrated in Table 4.11 and Table 4.12, respectively.
4.4.3 Irrigation and leach water quantity for sampling periods
The relationships between irrigation amount plus precipitation and leach water
amount for each sampling period for Houston samplers and Midland samplers are shown
in Figure 4.9 and Figure 4.10, respectively.
4.4.4 Cumulative leach water and cumulative input water
The regression model of cumulative leach water volume and cumulative water
application amount including precipitation can be obtained by Microsoft Office Excel

95
2003. The plots and the regression model for Houston samplers and Midland samplers are
shown in the Figure 4.11 and Figure 4.12, respectively.

96
Table 4. 11 Water balance calculation for Houston soil
Period Soil
Moisture, inches
PPT, inches
Irrigation, inches
ET, inches
Average Leaching, inches
Runoff or/and other unknown loss, inches
10/11/2005 5.640 10/11/2005-11/20/2005 0 6.707 4.491 1.837 0.000
11/20/2005 6.019 11/20/2005-12/29/2005 0 2.439 3.007 0.977 0.000
12/29/2005 4.474 12/29/2005-2/10/2006 0 2.927 3.312 1.152 0.000
2/10/2006 3.000 2/10/2006-4/6/2006 0 3.415 6.238 0.370 0.000
4/6/2006 3.000 4/6/2006-5/25/2006 0 7.012 7.954 0.026 0.000
5/25/2006 3.000 5/25/2006-7/23/2006 0 17.683 11.492 1.287 1.545
7/23/2006 6.360 7/23/2006-9/1/2006 0 10.976 7.804 1.368 1.804
9/1/2006 6.360 9/1/2006-9/242006 0 3.049 4.147 0.707 0.000
9/24/2006 4.555 9/24/2006-10/31/2006 0 7.188 5.096 2.067 0.000
10/31/2006 4.580 10/31/2006-11/30/2006 0 2.561 2.808 1.176 0.000
11/30/2006 3.157 11/30/2006-12/31/2006 0 2.696 2.214 1.455 0.000
12/31/2006 3.000 12/31/2006-1/31/2007 0 2.224 2.295 0.838 0.000
1/31/2007 3.000 1/31/2007-3/30/2007 0 4.390 6.080 0.000 0.000
3/30/2007 3.000

97
Continued
Period Soil
Moisture, inches
PPT, inches
Irrigation, inches
ET, inches
Average Leaching, inches
Runoff or/and other unknown loss, inches
3/30/2007-4/25/2007 0 6.312 3.916 0.343 0.000 4/25/2007 5.053
4/25/2007-5/29/2007 0 6.341 5.760 0.000 0.000 5/29/2007 5.634
5/29/2007-6/28/2007 0 6.209 5.780 0.000 0.000 6/28/2007 6.063
6/28/2007-7/31/2007 0 7.462 6.634 0.000 0.531 7/31/2007 6.360
7/31/2007-8/31/2007 0 7.407 6.192 0.049 1.166 8/31/2007 6.360
8/31/2007-9/28/2007 0 6.902 4.838 1.039 1.025 9/28/2007 6.360

98
Table 4. 12 Water balance calculation for Midland soil
Period Soil Moisture, inches
PPT, inches
Irrigation, inches
ET, inches
Average Leaching, inches
Runoff or/and other unknown loss, inches
10/11/2005 3.600 10/11/2005-11/20/2005 0.2 5.122 4.146 0.950 0.000
11/20/2005 3.826 11/20/2005-12/29/2005 0 1.341 2.711 0.007 0.000
12/29/2005 2.449 12/29/2005-2/10/2006 0.03 2.927 2.955 0.000 0.000
2/10/2006 2.451 2/10/2006-4/6/2006 2.27 3.415 6.286 0.199 0.000
4/6/2006 1.651 4/6/2006-5/25/2006 1.12 8.841 8.388 0.405 0.000
5/25/2006 2.819 5/25/2006-7/23/2006 2.75 13.415 11.924 0.339 1.920
7/23/2006 4.800 7/23/2006-9/1/2006 2.25 10.122 7.503 0.671 4.198
9/1/2006 4.800 9/1/2006-9/242006 4.57 1.220 3.603 0.577 1.609
9/24/2006 4.800 9/24/2006-10/31/2006 1.3 3.588 4.541 0.118 0.229
10/31/2006 4.800 10/31/2006-11/30/2006 3.36 1.829 2.520 0.000 2.669
11/30/2006 4.800 11/30/2006-12/31/2006 2.31 1.445 2.000 1.100 0.655
12/31/2006 4.800 12/31/2006-1/31/2007 5.6 1.866 1.992 1.018 4.456
1/31/2007 4.800 1/31/2007-3/30/2007 10.94 5.277 6.037 1.407 8.773
3/30/2007 4.800 3/30/2007-4/25/2007 1.15 5.104 4.123 1.005 1.125

99
Continued
Period Soil Moisture, inches
PPT, inches
Irrigation, inches
ET, inches
Average Leaching, inches
Runoff or/and other unknown loss, inches
4/25/2007 4.800 4/25/2007-5/29/2007 5.22 3.415 6.076 1.089 1.469
5/29/2007 4.800 5/29/2007-6/28/2007 3.76 3.152 6.076 0.000 0.837
6/28/2007 4.800 6/28/2007-7/31/2007 0.94 5.717 6.760 0.000 0.000
7/31/2007 4.697 7/31/2007-8/31/2007 1.99 5.065 5.864 0.000 1.088
8/31/2007 4.800 8/31/2007-9/28/2007 2.2 3.976 4.204 1.039 0.933
9/28/2007 4.800

100
0.00
0.50
1.00
1.50
2.00
2.50
0.00 5.00 10.00 15.00 20.00 25.00
Irrigation water amount in each sampling period, inches
Leac
h w
ater
am
ount
in e
ach
sam
plin
g pe
riod
, inc
hes
Figure 4. 9 Applied water and leached water amount for Houston soil
0.00
0.20
0.40
0.60
0.80
1.00
1.20
1.40
1.60
0.00 5.00 10.00 15.00 20.00 25.00
Irrigation water amount in each sampling period, inches
Leac
h w
ater
am
ount
in e
ach
sam
plin
g pe
riod
, inc
hes
Figure 4. 10 Applied water plus precipitation and leached water amount for Midland soil

101
y = 0.1261x + 2.0225R2 = 0.9095
0.00
2.00
4.00
6.00
8.00
10.00
12.00
14.00
16.00
18.00
0.00 20.00 40.00 60.00 80.00 100.00 120.00
Cumulative applied water, inches
Cum
ulat
ive
leac
hed
wat
er, i
nche
s
Figure 4. 11 The linear relationship between cumulative applied water and cumulative leached water
for Houston soil
y = 0.0718x - 0.3286R2 = 0.9485
0.00
2.00
4.00
6.00
8.00
10.00
12.00
0.00 20.00 40.00 60.00 80.00 100.00 120.00 140.00 160.00
Cumulative applied water and precipitation, inches
Cum
ulat
ive
leac
h w
ater
, inc
hes
Figure 4. 12 The linear relationship between cumulative applied water plus precipitation and
cumulative leached water for Midland soil

102
4.5 Nitrogen Balance
4.5.1 Temporal distribution of leached total nitrogen
The temporal distributions of weighted average total nitrogen concentration in the
leach water for Houston samplers and Midland samplers are shown in Figure 4.13 and
Figure 4.14, respectively.
Figure 4. 13 Temporal distribution of weighted average total nitrogen concentration of Houston samples
4.5.2 Calculation of nitrogen mass balance
The results of the total and average mass of total nitrogen in a sampler for
Houston samplers and Midland samplers are calculated and shown in Table 4.13 and Table
4.14, respectively. The nitrogen mass balances based on one sampler during each
sampling period for Houston and Midland samplers are shown in Table 4.15 and Table 4.16,
respectively.
The removal of total nitrogen by mowing is listed in Table 4.17.

103
Figure 4. 14 Temporal distribution of weighted average total nitrogen concentration of Midland
samples
4.5.3 Cumulative nitrogen mass input and output
The cumulative applied and leached total nitrogen mass in a sampler with
regression model for Houston and Midland samplers are summarized in Table 4.18 and
Table 4.19, respectively, and the plots are shown in Figure 4.15 and Figure 4.16, respectively.
The regression models obtained by Microsoft Excel 2003 for Houston and
Midland samplers are:
y = 0.029x + 2.977 (Houston samples)
y = 0.0514x + 6.6091 (Midland samples)
x is the cumulative applied total nitrogen mass in a sampler;
y is the cumulative leached total nitrogen mass in a sampler.

104
4.5.4 Cumulative total nitrogen concentration in leached water
Cumulative total nitrogen concentrations in the leached water for Houston and
Midland samples are calculated and shown in Table 4.20 and Table 4.21, respectively; the
total nitrogen removal ratios in both types of soils are determined based on the
cumulative applied mass and cumulative leached mass of total nitrogen and the results are
listed in Table 4.22 and Table 4.23, respectively.
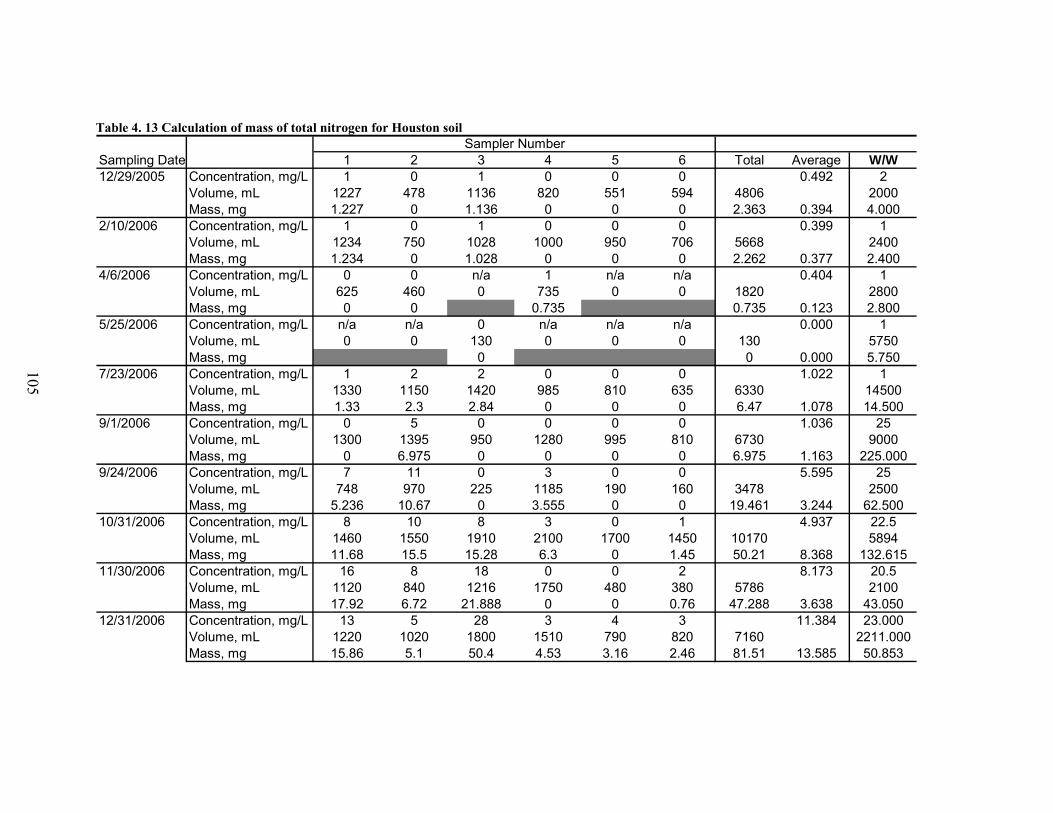
105
Table 4. 13 Calculation of mass of total nitrogen for Houston soil
Sampling Date 1 2 3 4 5 6 Total Average W/W12/29/2005 Concentration, mg/L 1 0 1 0 0 0 0.492 2
Volume, mL 1227 478 1136 820 551 594 4806 2000Mass, mg 1.227 0 1.136 0 0 0 2.363 0.394 4.000
2/10/2006 Concentration, mg/L 1 0 1 0 0 0 0.399 1Volume, mL 1234 750 1028 1000 950 706 5668 2400Mass, mg 1.234 0 1.028 0 0 0 2.262 0.377 2.400
4/6/2006 Concentration, mg/L 0 0 n/a 1 n/a n/a 0.404 1Volume, mL 625 460 0 735 0 0 1820 2800Mass, mg 0 0 0.735 0.735 0.123 2.800
5/25/2006 Concentration, mg/L n/a n/a 0 n/a n/a n/a 0.000 1Volume, mL 0 0 130 0 0 0 130 5750Mass, mg 0 0 0.000 5.750
7/23/2006 Concentration, mg/L 1 2 2 0 0 0 1.022 1Volume, mL 1330 1150 1420 985 810 635 6330 14500Mass, mg 1.33 2.3 2.84 0 0 0 6.47 1.078 14.500
9/1/2006 Concentration, mg/L 0 5 0 0 0 0 1.036 25Volume, mL 1300 1395 950 1280 995 810 6730 9000Mass, mg 0 6.975 0 0 0 0 6.975 1.163 225.000
9/24/2006 Concentration, mg/L 7 11 0 3 0 0 5.595 25Volume, mL 748 970 225 1185 190 160 3478 2500Mass, mg 5.236 10.67 0 3.555 0 0 19.461 3.244 62.500
10/31/2006 Concentration, mg/L 8 10 8 3 0 1 4.937 22.5Volume, mL 1460 1550 1910 2100 1700 1450 10170 5894Mass, mg 11.68 15.5 15.28 6.3 0 1.45 50.21 8.368 132.615
11/30/2006 Concentration, mg/L 16 8 18 0 0 2 8.173 20.5Volume, mL 1120 840 1216 1750 480 380 5786 2100Mass, mg 17.92 6.72 21.888 0 0 0.76 47.288 3.638 43.050
12/31/2006 Concentration, mg/L 13 5 28 3 4 3 11.384 23.000Volume, mL 1220 1020 1800 1510 790 820 7160 2211.000Mass, mg 15.86 5.1 50.4 4.53 3.16 2.46 81.51 13.585 50.853
Sampler Number
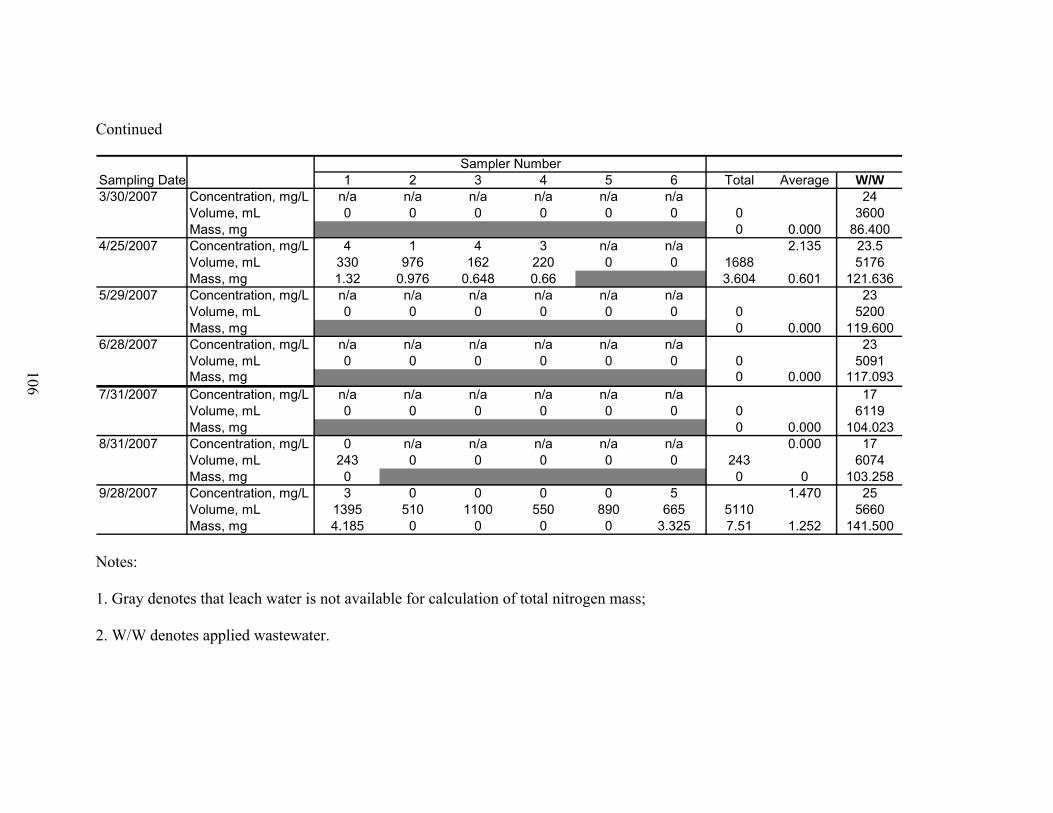
106
Continued
Sampling Date 1 2 3 4 5 6 Total Average W/W3/30/2007 Concentration, mg/L n/a n/a n/a n/a n/a n/a 24
Volume, mL 0 0 0 0 0 0 0 3600Mass, mg 0 0.000 86.400
4/25/2007 Concentration, mg/L 4 1 4 3 n/a n/a 2.135 23.5Volume, mL 330 976 162 220 0 0 1688 5176Mass, mg 1.32 0.976 0.648 0.66 3.604 0.601 121.636
5/29/2007 Concentration, mg/L n/a n/a n/a n/a n/a n/a 23Volume, mL 0 0 0 0 0 0 0 5200Mass, mg 0 0.000 119.600
6/28/2007 Concentration, mg/L n/a n/a n/a n/a n/a n/a 23Volume, mL 0 0 0 0 0 0 0 5091Mass, mg 0 0.000 117.093
7/31/2007 Concentration, mg/L n/a n/a n/a n/a n/a n/a 17Volume, mL 0 0 0 0 0 0 0 6119Mass, mg 0 0.000 104.023
8/31/2007 Concentration, mg/L 0 n/a n/a n/a n/a n/a 0.000 17Volume, mL 243 0 0 0 0 0 243 6074Mass, mg 0 0 0 103.258
9/28/2007 Concentration, mg/L 3 0 0 0 0 5 1.470 25Volume, mL 1395 510 1100 550 890 665 5110 5660Mass, mg 4.185 0 0 0 0 3.325 7.51 1.252 141.500
Sampler Number
Notes: 1. Gray denotes that leach water is not available for calculation of total nitrogen mass; 2. W/W denotes applied wastewater.

107
Table 4. 14 Calculation of mass of total nitrogen for Midland soil
Sampling Date 1 2 3 4 5 6 Total Average W/W12/29/2005 Concentration, mg/L 4 n/a n/a n/a 5 n/a 4.758 2
Volume, mL 8 0 0 0 25 0 33 1100Mass, mg 0.032 0.125 0.157 0.026 2.200
2/10/2006 Concentration, mg/L n/a n/a n/a n/a n/a n/a 1Volume, mL 0 0 0 0 0 0 0 2400Mass, mg 0 0.000 2.400
4/6/2006 Concentration, mg/L 0 n/a 13 12 0 0 4.270 1Volume, mL 350 0 225 105 200 100 980 2800Mass, mg 0 2.925 1.26 0 0 4.185 0.698 2.800
5/25/2006 Concentration, mg/L 1 6 14 n/a 1 5 6.094 1Volume, mL 455 265 495 0 180 598 1993 7250Mass, mg 0.455 1.59 6.93 0.18 2.99 12.145 2.024 7.250
7/23/2006 Concentration, mg/L n/a 3 32 27 n/a 28 27.126 1Volume, mL 0 140 518 28 0 980 1666 11000Mass, mg 0.42 16.576 0.756 27.44 45.192 7.532 11.000
9/1/2006 Concentration, mg/L 5 2 36 32 6 32 25.982 25Volume, mL 282 434 985 360 122 1118 3301 8300Mass, mg 1.41 0.868 35.46 11.52 0.732 35.776 85.766 14.294 207.500
9/24/2006 Concentration, mg/L 2 1 9 n/a 3 6 6.269 25Volume, mL 215 335 1160 0 61 1065 2836 1000Mass, mg 0.43 0.335 10.44 0.183 6.39 17.778 2.963 25.000
10/31/2006 Concentration, mg/L n/a n/a 1 n/a n/a 2 1.483 22.5Volume, mL 0 0 300 0 0 280 580 2942Mass, mg 0.3 0.56 0.86 0.143 66.195
11/30/2006 Concentration, mg/L n/a n/a n/a n/a n/a n/a 20.5Volume, mL 0 0 0 0 0 0 0 1500Mass, mg 0 0.000 30.750
12/31/2006 Concentration, mg/L 6 3 6 n/a 5 4 4.805 23.000Volume, mL 880 860 1074 0 1310 1290 5414 1185.000Mass, mg 5.28 2.58 6.444 6.55 5.16 26.014 4.336 27.255
Sampler Number

108
Continued
Sampling Date 1 2 3 4 5 6 Total Average W/W3/30/2007 Concentration, mg/L 5 2 13 7 4 4 5.655 24
Volume, mL 1156 1210 1354 180 1714 1311 6925 4327Mass, mg 5.78 2.42 17.602 1.26 6.856 5.244 39.162 6.527 103.848
4/25/2007 Concentration, mg/L 4 2 2 n/a 2 3 2.532 23.5Volume, mL 1024 780 868 0 1688 583 4943 4185Mass, mg 4.096 1.56 1.736 3.376 1.749 12.517 2.086 98.348
5/29/2007 Concentration, mg/L 3 2 2 n/a 4 3 2.702 23Volume, mL 1210 1120 1240 0 765 1020 5355 2800Mass, mg 3.63 2.24 2.48 3.06 3.06 14.47 2.412 64.400
6/28/2007 Concentration, mg/L n/a n/a n/a n/a n/a n/a 23Volume, mL 0 0 0 0 0 0 0 2585Mass, mg 59.455
7/31/2007 Concentration, mg/L n/a n/a n/a n/a n/a n/a 17Volume, mL 0 0 0 0 0 0 0 4688Mass, mg 79.696
8/31/2007 Concentration, mg/L n/a n/a n/a n/a n/a n/a 17Volume, mL 0 0 0 0 0 0 0 4153Mass, mg 70.601
9/28/2007 Concentration, mg/L 8 3 3 56 5 3 16.969 25Volume, mL 850 1000 700 1230 970 360 5110 3260Mass, mg 6.8 3 2.1 68.88 4.85 1.08 86.71 14.452 81.500
Sampler Number
Notes: 1. Gray denotes that leach water is not available for calculation of total nitrogen mass; 2. W/W denotes applied wastewater.
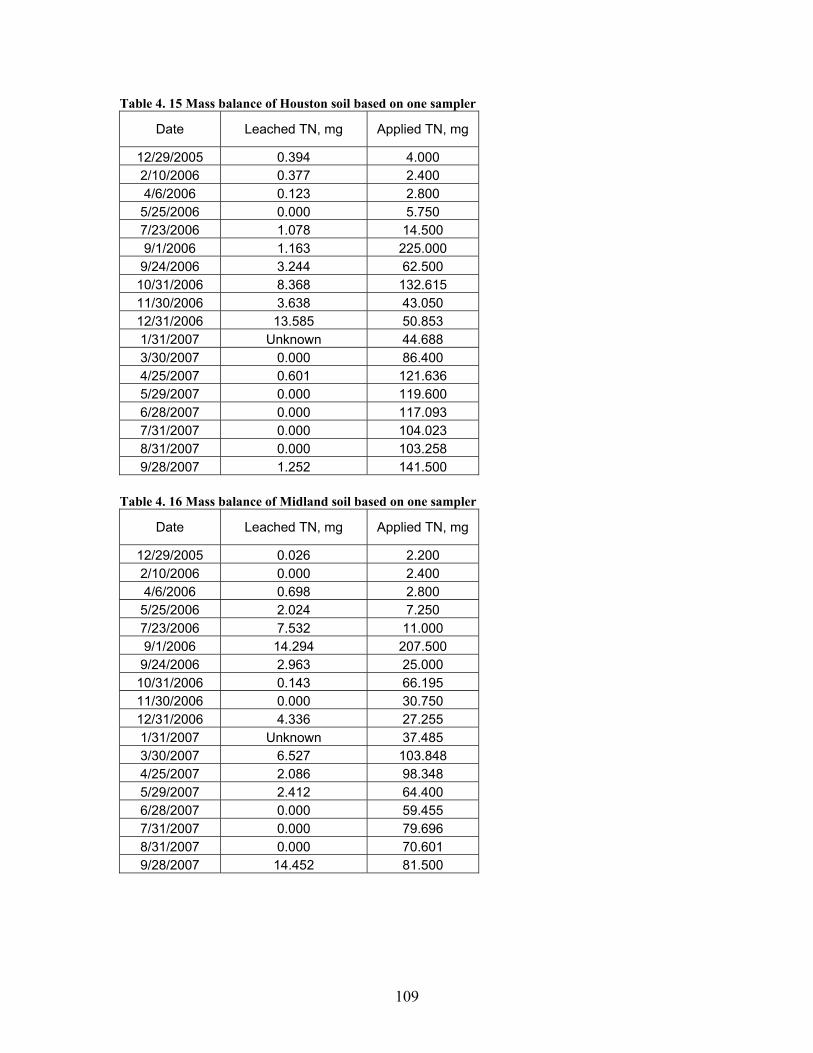
109
Table 4. 15 Mass balance of Houston soil based on one sampler
Date Leached TN, mg Applied TN, mg
12/29/2005 0.394 4.000 2/10/2006 0.377 2.400 4/6/2006 0.123 2.800 5/25/2006 0.000 5.750 7/23/2006 1.078 14.500 9/1/2006 1.163 225.000 9/24/2006 3.244 62.500 10/31/2006 8.368 132.615 11/30/2006 3.638 43.050 12/31/2006 13.585 50.853 1/31/2007 Unknown 44.688 3/30/2007 0.000 86.400 4/25/2007 0.601 121.636 5/29/2007 0.000 119.600 6/28/2007 0.000 117.093 7/31/2007 0.000 104.023 8/31/2007 0.000 103.258 9/28/2007 1.252 141.500
Table 4. 16 Mass balance of Midland soil based on one sampler
Date Leached TN, mg Applied TN, mg
12/29/2005 0.026 2.200 2/10/2006 0.000 2.400 4/6/2006 0.698 2.800 5/25/2006 2.024 7.250 7/23/2006 7.532 11.000 9/1/2006 14.294 207.500 9/24/2006 2.963 25.000 10/31/2006 0.143 66.195 11/30/2006 0.000 30.750 12/31/2006 4.336 27.255 1/31/2007 Unknown 37.485 3/30/2007 6.527 103.848 4/25/2007 2.086 98.348 5/29/2007 2.412 64.400 6/28/2007 0.000 59.455 7/31/2007 0.000 79.696 8/31/2007 0.000 70.601 9/28/2007 14.452 81.500

110
Table 4. 17 TN removal by grass mowing on Aug 21, 2007 at TTU site
Site Average
harvest per sampler, kg
Moisture, %
Average dry harvest per sampler, kg
TKN, %
Removed TN per
sampler, mg
Removed TN per acre, kg
Houston 0.1212 63.33 0.044 1.34 595.496 74.707
Midland 0.0108 37 0.007 1.19 81.2175 10.189
Table 4. 18 The cumulative mass balance for Houston soil based on a sampler
Sampling period Cumulative TN output, mg Cumulative TN input, mg 11/28/2005-12/29/2005 0.394 4.000 12/29/2005-2/10/2006 0.771 6.400 2/10/2006-4/6/2006 0.893 9.200 4/6/2006-5/25/2006 0.893 14.950 5/25/2006-7/23/2006 1.972 29.450 7/23/2006-9/1/2006 3.134 254.450 9/1/2006-9/24/2006 6.378 316.950
9/24/2006-10/31/2006 14.746 449.565 10/31/2006-11/30/2006 18.384 492.615 11/30/2006-12/31/2006 31.969 543.468 12/31/2006-1/31/2007 31.969 588.156 1/31/2007-3/30/2007 31.969 674.556 3/30/2007-4/25/2007 32.569 796.192 4/25/2007-5/29/2007 32.569 915.792 5/29/2007-6/28/2007 32.569 1032.885 6/28/2007-7/31/2007 32.569 1136.908 7/31/2007-8/31/2007 32.569 1240.166 8/31/2007-9/28/2007 33.821 1381.666

111
Table 4. 19 The cumulative mass balance for Midland soil based on a sampler
Sampling period Cumulative TN output, mg Cumulative TN input, mg 11/28/2005-12/29/2005 0.026 2.200 12/29/2005-2/10/2006 0.026 4.600 2/10/2006-4/6/2006 0.724 7.400 4/6/2006-5/25/2006 2.748 14.650 5/25/2006-7/23/2006 10.280 25.650 7/23/2006-9/1/2006 24.574 233.150 9/1/2006-9/24/2006 27.537 258.150
9/24/2006-10/31/2006 27.681 324.345 10/31/2006-11/30/2006 27.681 355.095 11/30/2006-12/31/2006 32.016 382.350 12/31/2006-1/31/2007 32.016 419.835 1/31/2007-3/30/2007 38.543 523.683 3/30/2007-4/25/2007 40.629 622.031 4/25/2007-5/29/2007 43.041 686.431 5/29/2007-6/28/2007 43.041 745.886 6/28/2007-7/31/2007 43.041 825.582 7/31/2007-8/31/2007 43.041 896.183 8/31/2007-9/28/2007 57.493 977.683
y = 0.029x + 2.977R2 = 0.8075
0.0005.000
10.00015.00020.00025.00030.00035.00040.00045.00050.000
0.000 200.000 400.000 600.000 800.000 1000.000 1200.000 1400.000 1600.000
Cumulative applied TN, mg
Cum
ulat
ive
leac
hed
TN, m
g
Figure 4. 15 The plots of cumulative applied TN and leached TN for Houston soil in a sampler

112
y = 0.0514x + 6.6091R2 = 0.9082
0.000
10.000
20.000
30.000
40.000
50.000
60.000
70.000
0.000 100.000 200.000 300.000 400.000 500.000 600.000 700.000 800.000 900.000 1000.000
Cumulative applied TN, mg
Cum
ulat
ive
leac
hed
TN, m
g
Figure 4. 16 The plots of cumulative applied TN and leached TN for Midland soil in a sampler
Table 4. 20 The cumulative TN concentration for Houston soil
Sampling date
Cumulative leached TN, mg
Cumulative leached water, mL
Cumulative TN concentration, mg/L
12/29/2005 0.394 801 0.492 2/10/2006 0.771 1746 0.442 4/6/2006 0.893 2049 0.436 5/25/2006 0.893 2071 0.431 7/23/2006 1.972 3126 0.631 9/1/2006 3.134 4247 0.738 9/24/2006 6.378 4827 1.321 10/31/2006 14.746 6522 2.261 11/30/2006 18.384 7486 2.456 12/31/2006 31.969 8680 3.683 1/31/2007 31.969 9367 3.413 3/30/2007 31.969 9367 3.413 4/25/2007 32.569 9649 3.376 5/29/2007 32.569 9649 3.376 6/28/2007 32.569 9649 3.376 7/31/2007 32.569 9649 3.376 8/31/2007 32.569 9689 3.361 9/28/2007 33.821 10541 3.209

113
Table 4. 21 The cumulative TN concentration for Midland soil
Sampling date
Cumulative leached TN, mg
Cumulative leached water, mL
Cumulative TN concentration, mg/L
12/29/2005 0.026 6 4.758 2/10/2006 0.026 6 4.758 4/6/2006 0.724 169 4.286 5/25/2006 2.748 501 5.485 7/23/2006 10.280 779 13.202 9/1/2006 24.574 1329 18.493 9/24/2006 27.537 1802 15.286 10/31/2006 27.681 1898 14.583 11/30/2006 27.681 1898 14.583 12/31/2006 32.016 2801 11.432 1/31/2007 32.016 3636 8.807 3/30/2007 38.543 4790 8.047 4/25/2007 40.629 5614 7.238 5/29/2007 43.041 6506 6.616 6/28/2007 43.041 6506 6.616 7/31/2007 43.041 6506 6.616 8/31/2007 43.041 6506 6.616 9/28/2007 57.493 7358 7.814
Table 4. 22 Cumulative removal ratio of TN of Houston soil
Sampling period Cumulative leached TN, mg
Cumulative applied TN, mg Removal ratio, %
11/28/2005-12/29/2005 0.394 4.000 90.15 12/29/2005-2/10/2006 0.771 6.400 87.96 2/10/2006-4/6/2006 0.893 9.200 90.29 4/6/2006-5/25/2006 0.893 14.950 94.02 5/25/2006-7/23/2006 1.972 29.450 93.31 7/23/2006-9/1/2006 3.134 254.450 98.77 9/1/2006-9/24/2006 6.378 316.950 97.99
9/24/2006-10/31/2006 14.746 449.565 96.72 10/31/2006-11/30/2006 18.384 492.615 96.27 11/30/2006-12/31/2006 31.969 543.468 94.12 12/31/2006-1/31/2007 31.969 588.156 94.56 1/31/2007-3/30/2007 31.969 674.556 95.26 3/30/2007-4/25/2007 32.569 796.192 95.91 4/25/2007-5/29/2007 32.569 915.792 96.44 5/29/2007-6/28/2007 32.569 1032.885 96.85 6/28/2007-7/31/2007 32.569 1136.908 97.14 7/31/2007-8/31/2007 32.569 1240.166 97.37 8/31/2007-9/28/2007 33.821 1381.666 97.55
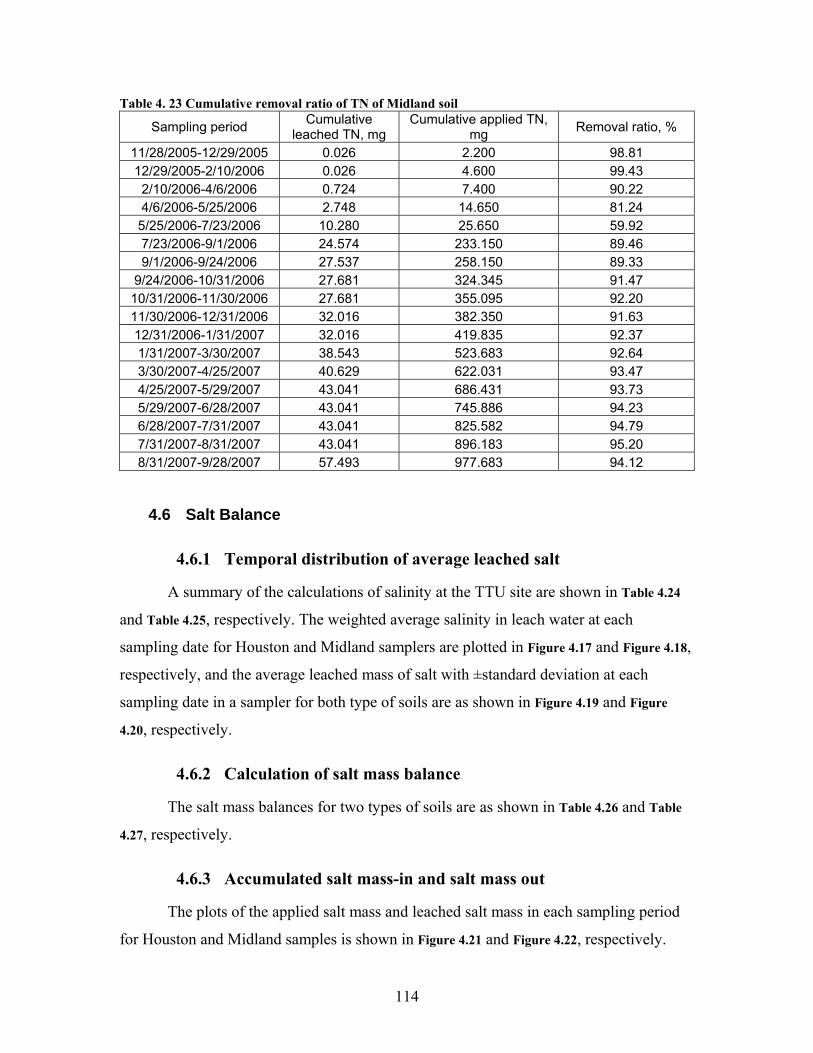
114
Table 4. 23 Cumulative removal ratio of TN of Midland soil
Sampling period Cumulative leached TN, mg
Cumulative applied TN, mg Removal ratio, %
11/28/2005-12/29/2005 0.026 2.200 98.81 12/29/2005-2/10/2006 0.026 4.600 99.43 2/10/2006-4/6/2006 0.724 7.400 90.22 4/6/2006-5/25/2006 2.748 14.650 81.24 5/25/2006-7/23/2006 10.280 25.650 59.92 7/23/2006-9/1/2006 24.574 233.150 89.46 9/1/2006-9/24/2006 27.537 258.150 89.33
9/24/2006-10/31/2006 27.681 324.345 91.47 10/31/2006-11/30/2006 27.681 355.095 92.20 11/30/2006-12/31/2006 32.016 382.350 91.63 12/31/2006-1/31/2007 32.016 419.835 92.37 1/31/2007-3/30/2007 38.543 523.683 92.64 3/30/2007-4/25/2007 40.629 622.031 93.47 4/25/2007-5/29/2007 43.041 686.431 93.73 5/29/2007-6/28/2007 43.041 745.886 94.23 6/28/2007-7/31/2007 43.041 825.582 94.79 7/31/2007-8/31/2007 43.041 896.183 95.20 8/31/2007-9/28/2007 57.493 977.683 94.12
4.6 Salt Balance
4.6.1 Temporal distribution of average leached salt
A summary of the calculations of salinity at the TTU site are shown in Table 4.24
and Table 4.25, respectively. The weighted average salinity in leach water at each
sampling date for Houston and Midland samplers are plotted in Figure 4.17 and Figure 4.18,
respectively, and the average leached mass of salt with ±standard deviation at each
sampling date in a sampler for both type of soils are as shown in Figure 4.19 and Figure
4.20, respectively.
4.6.2 Calculation of salt mass balance
The salt mass balances for two types of soils are as shown in Table 4.26 and Table
4.27, respectively.
4.6.3 Accumulated salt mass-in and salt mass out
The plots of the applied salt mass and leached salt mass in each sampling period
for Houston and Midland samples is shown in Figure 4.21 and Figure 4.22, respectively.

115
The plots of the average cumulative salt mass input and salt mass output and their
relationship is shown in Figure 4.23 and Figure 4.24, respectively, along with their
regression model results.
4.6.4 Ratio of accumulated stored salt in the soil
The ratio of average accumulated salt in a sampler’s soil for both types of samples
are calculated in Table 4.28 and Table 4.29, respectively.

116
Table 4. 24 The summarization of salinity for Houston soil
Sampling Date 1 2 3 4 5 6 Total Average W/W12/29/2005 Salinity (μS/cm) 2790 3710 3680 2680 3170 2760 3113 1492
Volume, mL 1227 478 1136 820 551 594 4806 801 2000Salinity (mg/L) 1894 2517 2497 1820 2151 1874 2113 1016Mass, mg 2324 1203 2836 1492 1185 1113 10154 1692 2031
2/10/2006 Salinity (μS/cm) 2060 3080 2920 2390 2480 2710 2561 1346Volume, mL 1234 750 1028 1000 950 706 5668 945 2400Salinity (mg/L) 1400 2091 1982 1623 1684 1840 1739 917Mass, mg 1728 1568 2038 1623 1600 1299 9856 1643 2200
4/6/2006 Salinity (μS/cm) 2130 2600 n/a 2500 n/a n/a 2398 1346Volume, mL 625 460 0 735 0 0 1820 303 2800Salinity (mg/L) 1447 1766 n/a 1698 n/a n/a 1629 917Mass, mg 905 812 1248 2965 494 2567
5/25/2006 Salinity (μS/cm) n/a n/a 3630 n/a n/a n/a 3630 1148Volume, mL 0 0 130 0 0 0 130 22 5750Salinity (mg/L) n/a n/a 2463 n/a n/a n/a 2463 783Mass, mg 320 320 53 4501
7/23/2006 Salinity (μS/cm) 2850 3490 2600 2840 3480 2900 2994 903Volume, mL 1330 1150 1420 985 810 635 6330 1055 14500Salinity (mg/L) 1935 2368 1766 1928 2361 1969 2033 617Mass, mg 2573 2723 2507 1899 1913 1250 12866 2144 8945
9/1/2006 Salinity (μS/cm) 2780 3450 4440 2500 3110 2340 3096 885Volume, mL 1300 1395 950 1280 995 810 6730 1122 9000Salinity (mg/L) 1887 2341 3011 1698 2111 1590 2101 605Mass, mg 2454 3266 2861 2173 2100 1288 14141 2357 5443
9/24/2006 Salinity (μS/cm) 3370 3420 4850 2660 3270 2680 3201 1278Volume, mL 748 970 225 1185 190 160 3478 580 2500Salinity (mg/L) 2287 2321 3289 1806 2219 1820 2172 871Mass, mg 1711 2251 740 2140 422 291 7555 1259 2177
10/31/2006 Salinity (μS/cm) 3090 2650 3800 2780 3210 2330 3004 1758Volume, mL 1460 1550 1910 2100 1700 1450 10170 1695 5894Salinity (mg/L) 2097 1799 2578 1887 2179 1583 2039 1196Mass, mg 3062 2789 4924 3964 3704 2295 20737 3456 7047
11/30/2006 Salinity (μS/cm) 4050 3220 4010 3800 4080 3320 3800 1847Volume, mL 1120 840 1216 1750 480 380 5786 964 2100Salinity (mg/L) 2747 2185 2720 2578 2767 2253 2578 1256Mass, mg 3077 1836 3308 4511 1328 856 14916 2486 2637
12/31/2006 Salinity (μS/cm) 3480 3130 3660 3230 3840 2540 3355 1643Volume, mL 1220 1020 1800 1510 790 820 7160 1193 2211Salinity (mg/L) 2361 2124 2483 2192 2605 1725 2277 1118Mass, mg 2881 2167 4470 3310 2058 1415 16300 2717 2472
Sampler Number

117
Continued
Sampling Date 1 2 3 4 5 6 Total Average W/W3/30/2007 Salinity (μS/cm) n/a n/a n/a n/a n/a n/a 1598
Volume, mL 0 0 0 0 0 0 0 0 3600Salinity (mg/L) n/a n/a n/a n/a n/a n/a 1087Mass, mg 0 0 3915
4/25/2007 Salinity (μS/cm) 4540 4190 4520 3000 n/a n/a 4135 1641Volume, mL 330 976 162 220 0 0 1688 281 5176Salinity (mg/L) 3079 2842 3065 2036 n/a n/a 2805 1116Mass, mg 1016 2774 497 448 4734 789 5779
5/29/2007 Salinity (μS/cm) n/a n/a n/a n/a n/a n/a 1676Volume, mL 0 0 0 0 0 0 0 0 5200Salinity (mg/L) n/a n/a n/a n/a n/a n/a 1140Mass, mg 0 0 5929
6/28/2007 Salinity (μS/cm) n/a n/a n/a n/a n/a n/a 1645Volume, mL 0 0 0 0 0 0 0 0 5091Salinity (mg/L) n/a n/a n/a n/a n/a n/a 1119Mass, mg 0 0 5698
7/31/2007 Salinity (μS/cm) n/a n/a n/a n/a n/a n/a 1696Volume, mL 0 0 0 0 0 0 0 0 6119Salinity (mg/L) n/a n/a n/a n/a n/a n/a 1154Mass, mg 0 0 7060
8/31/2007 Salinity (μS/cm) 11580 n/a n/a n/a n/a n/a 11580 1696Volume, mL 243 0 0 0 0 0 243 41 6074Salinity (mg/L) 7844 n/a n/a n/a n/a n/a 7844 1154Mass, mg 1906 1906 318 7008
9/28/2007 Salinity (μS/cm) 7300 9510 10870 8130 13190 12510 10082 1734Volume, mL 1395 510 1100 550 890 665 5110 852 5660Salinity (mg/L) 4947 6443 7364 5509 8934 8474 6830 1179Mass, mg 6901 3286 8100 3030 7951 5635 34903 5817 6676
Sampler Number
Notes: 1. Gray denotes that leach water is not available for calculation of total nitrogen mass; 2. W/W denotes applied wastewater.

118
Table 4. 25 The summarization of salinity for Midland soil
Sampling Date 1 2 3 4 5 6 Total Average W/W12/29/2005 Salinity (μS/cm) 2500 n/a n/a n/a 11590 n/a 9386 1492
Volume, mL 8 0 0 0 25 0 33 6 1100Salinity (mg/L) 1698 n/a n/a n/a 7851 n/a 6359 1016Mass, mg 14 196 210 35 1117
2/10/2006 Salinity (μS/cm) n/a n/a n/a n/a n/a n/a 1346Volume, mL 0 0 0 0 0 0 0 0 2400Salinity (mg/L) n/a n/a n/a n/a n/a n/a 917Mass, mg 0 0 2200
4/6/2006 Salinity (μS/cm) 4840 n/a 7530 6340 5820 6960 6035 1346Volume, mL 350 0 225 105 200 100 980 163 2800Salinity (mg/L) 3282 n/a 5103 4297 3945 4717 4091 917Mass, mg 1149 1148 451 789 472 4009 668 2567
5/25/2006 Salinity (μS/cm) 8150 8320 6600 n/a 7100 6010 7051 1148Volume, mL 455 265 495 0 180 598 1993 332 7250Salinity (mg/L) 5522 5637 4473 n/a 4812 4074 4778 783Mass, mg 2513 1494 2214 866 2436 9523 1587 5675
7/23/2006 Salinity (μS/cm) n/a 6270 4450 7070 n/a 4450 4647 903Volume, mL 0 140 518 28 0 980 1666 278 11000Salinity (mg/L) n/a 4250 3018 4791 n/a 3018 3151 617Mass, mg 595 1563 134 2958 5250 875 6786
9/1/2006 Salinity (μS/cm) 12770 7030 3820 6550 13370 4180 5779 885Volume, mL 282 434 985 360 122 1118 3301 550 8300Salinity (mg/L) 8650 4764 2591 4439 9056 2835 3918 605Mass, mg 2439 2068 2553 1598 1105 3170 12932 2155 5019
9/24/2006 Salinity (μS/cm) 12200 6320 4380 n/a 15720 3790 5224 1278Volume, mL 215 335 1160 0 61 1065 2836 473 1000Salinity (mg/L) 8264 4284 2971 n/a 10647 2571 3542 871Mass, mg 1777 1435 3446 649 2738 10045 1674 871
10/31/2006 Salinity (μS/cm) n/a n/a 2330 n/a n/a 4520 3387 1758Volume, mL 0 0 300 0 0 280 580 97 2942Salinity (mg/L) n/a n/a 1583 n/a n/a 3065 2299 1196Mass, mg 475 858 1333 222 3518
11/30/2006 Salinity (μS/cm) n/a n/a n/a n/a n/a n/a 1847Volume, mL 0 0 0 0 0 0 0 0 1500Salinity (mg/L) n/a n/a n/a n/a n/a n/a 1256Mass, mg 0 0 1884
12/31/2006 Salinity (μS/cm) 11230 8960 4340 n/a 14680 4060 8629 1643Volume, mL 880 860 1074 0 1310 1290 5414 902 1185Salinity (mg/L) 7607 6071 2943 n/a 9943 2754 5847 1118Mass, mg 6694 5221 3161 13025 3553 31654 5276 1325
Sampler Number
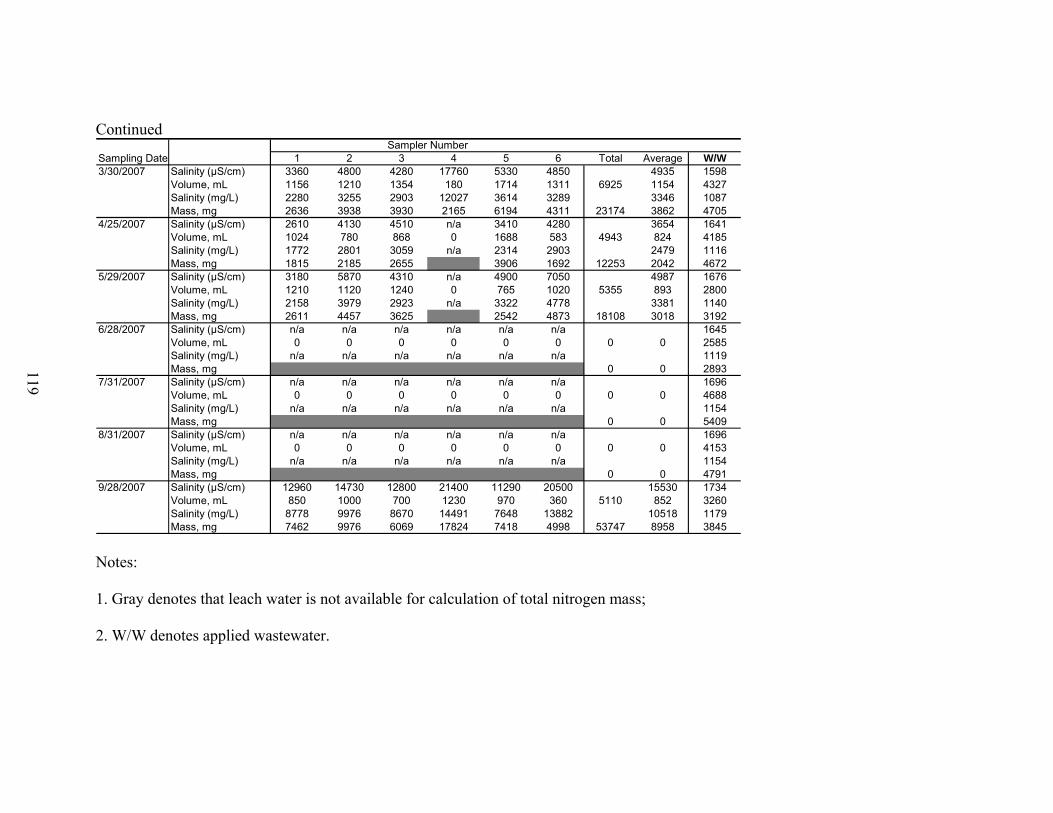
119
Continued
Sampling Date 1 2 3 4 5 6 Total Average W/W3/30/2007 Salinity (μS/cm) 3360 4800 4280 17760 5330 4850 4935 1598
Volume, mL 1156 1210 1354 180 1714 1311 6925 1154 4327Salinity (mg/L) 2280 3255 2903 12027 3614 3289 3346 1087Mass, mg 2636 3938 3930 2165 6194 4311 23174 3862 4705
4/25/2007 Salinity (μS/cm) 2610 4130 4510 n/a 3410 4280 3654 1641Volume, mL 1024 780 868 0 1688 583 4943 824 4185Salinity (mg/L) 1772 2801 3059 n/a 2314 2903 2479 1116Mass, mg 1815 2185 2655 3906 1692 12253 2042 4672
5/29/2007 Salinity (μS/cm) 3180 5870 4310 n/a 4900 7050 4987 1676Volume, mL 1210 1120 1240 0 765 1020 5355 893 2800Salinity (mg/L) 2158 3979 2923 n/a 3322 4778 3381 1140Mass, mg 2611 4457 3625 2542 4873 18108 3018 3192
6/28/2007 Salinity (μS/cm) n/a n/a n/a n/a n/a n/a 1645Volume, mL 0 0 0 0 0 0 0 0 2585Salinity (mg/L) n/a n/a n/a n/a n/a n/a 1119Mass, mg 0 0 2893
7/31/2007 Salinity (μS/cm) n/a n/a n/a n/a n/a n/a 1696Volume, mL 0 0 0 0 0 0 0 0 4688Salinity (mg/L) n/a n/a n/a n/a n/a n/a 1154Mass, mg 0 0 5409
8/31/2007 Salinity (μS/cm) n/a n/a n/a n/a n/a n/a 1696Volume, mL 0 0 0 0 0 0 0 0 4153Salinity (mg/L) n/a n/a n/a n/a n/a n/a 1154Mass, mg 0 0 4791
9/28/2007 Salinity (μS/cm) 12960 14730 12800 21400 11290 20500 15530 1734Volume, mL 850 1000 700 1230 970 360 5110 852 3260Salinity (mg/L) 8778 9976 8670 14491 7648 13882 10518 1179Mass, mg 7462 9976 6069 17824 7418 4998 53747 8958 3845
Sampler Number
Notes: 1. Gray denotes that leach water is not available for calculation of total nitrogen mass; 2. W/W denotes applied wastewater.
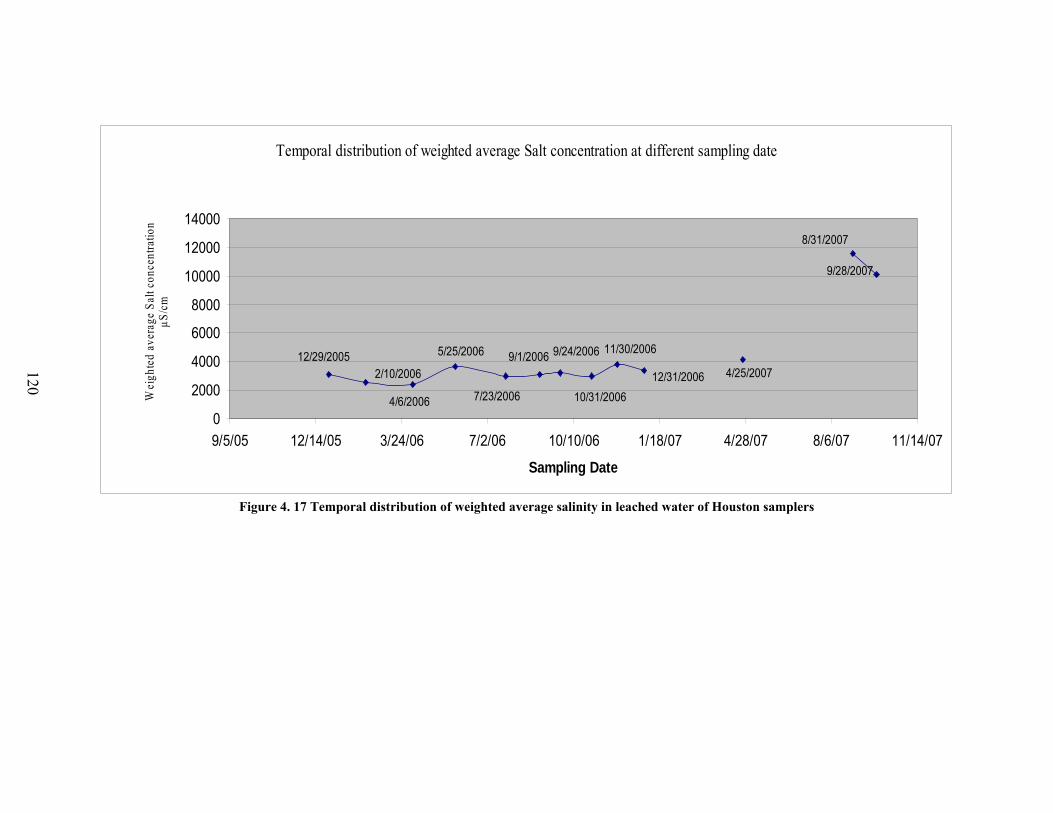
120
Temporal distribution of weighted average Salt concentration at different sampling date
4/25/20079/1/2006
9/28/2007
8/31/2007
12/31/2006
11/30/2006
10/31/20064/6/2006
9/24/2006
7/23/2006
5/25/2006
2/10/200612/29/2005
0
2000
4000
6000
8000
10000
12000
14000
9/5/05 12/14/05 3/24/06 7/2/06 10/10/06 1/18/07 4/28/07 8/6/07 11/14/07
Sampling Date
Wei
ghte
d av
erag
e Sa
lt co
ncen
tratio
nμS
/cm
Figure 4. 17 Temporal distribution of weighted average salinity in leached water of Houston samplers

121
Temporal distribution of weighted average Salt concentration at different sampling date
4/25/2007
9/1/2006
9/28/2007
5/29/20073/30/2007
12/31/2006
10/31/20064/6/2006
9/24/2006
7/23/2006
5/25/2006
12/29/2005
02000400060008000
1000012000140001600018000
9/5/05 12/14/05 3/24/06 7/2/06 10/10/06 1/18/07 4/28/07 8/6/07 11/14/07
Sampling Date
Wei
ghte
d av
erag
e Sa
lt co
ncen
tratio
n μS
/cm
Figure 4. 18 Temporal distribution of weighted average salinity in leached water of Midland samplers

122
Sampling date
10/1/05 1/1/06 4/1/06 7/1/06 10/1/06 1/1/07 4/1/07 7/1/07 10/1/07 Ave
rage
sal
t mas
s le
ache
d do
wn
thro
ugh
root
zon
e, m
g
0
2000
4000
6000
8000
Figure 4. 19 Average leached mass of salt ± standard deviation at each sampling
time for the Houston soil
Sampling date
10/1/05 1/1/06 4/1/06 7/1/06 10/1/06 1/1/07 4/1/07 7/1/07 10/1/07 Ave
rage
sal
t mas
s le
ache
d do
wn
thro
ugh
root
zon
e, m
g
0
2000
4000
6000
8000
10000
12000
14000
Figure 4. 20 Average leached mass of salt ± standard deviation at each sampling
time for the Midland soil

123
Table 4. 26 Salt mass balance for Houston soil based on a sampler Sampling period Salt output, mg Salt input, mg
11/28/2005-12/29/2005 1692.391 2031.235 12/29/2005-2/10/2006 1642.683 2200.297 2/10/2006-4/6/2006 494.140 2567.013 4/6/2006-5/25/2006 53.361 4500.894 5/25/2006-7/23/2006 2144.289 8945.392 7/23/2006-9/1/2006 2356.864 5442.655 9/1/2006-9/24/2006 1259.125 2176.903
9/24/2006-10/31/2006 3456.227 7047.297 10/31/2006-11/30/2006 2485.976 2637.426 11/30/2006-12/31/2006 2716.627 2471.521 12/31/2006-1/31/2007 0.000 1983.361 1/31/2007-3/30/2007 0.000 3914.529 3/30/2007-4/25/2007 789.046 5778.879 4/25/2007-5/29/2007 0.000 5928.870 5/29/2007-6/28/2007 0.000 5697.763 6/28/2007-7/31/2007 0.000 7059.523 7/31/2007-8/31/2007 317.689 7007.606 8/31/2007-9/28/2007 5817.194 6675.560
Table 4. 27 Salt mass balance for Midland soil based on a sampler
Sampling period Salt output, mg Salt input, mg 11/28/2005-12/29/2005 34.976 1117.179 12/29/2005-2/10/2006 0.000 2200.297 2/10/2006-4/6/2006 668.120 2567.013 4/6/2006-5/25/2006 1587.191 5675.040 5/25/2006-7/23/2006 874.989 6786.160 7/23/2006-9/1/2006 2155.357 5019.337 9/1/2006-9/24/2006 1674.208 870.761
9/24/2006-10/31/2006 222.189 3517.670 10/31/2006-11/30/2006 0.000 1883.876 11/30/2006-12/31/2006 5275.625 1324.628 12/31/2006-1/31/2007 0.000 1663.675 1/31/2007-3/30/2007 3862.413 4705.046 3/30/2007-4/25/2007 2042.155 4672.451 4/25/2007-5/29/2007 3017.965 3192.468 5/29/2007-6/28/2007 0.000 2893.089 6/28/2007-7/31/2007 0.000 5408.570 7/31/2007-8/31/2007 0.000 4791.338 8/31/2007-9/28/2007 8957.892 3844.934

124
0.000
1000.000
2000.000
3000.000
4000.000
5000.000
6000.000
7000.000
0.000 2000.000 4000.000 6000.000 8000.000 10000.000
Salt input, mg
Salt
out
put,
mg
Figure 4. 21 Salt mass input and output in a sampler of Houston soil.
0.000
1000.000
2000.0003000.000
4000.000
5000.000
6000.000
7000.0008000.000
9000.000
10000.000
0.000 2000.000 4000.000 6000.000 8000.000
Salt input, mg
Salt
out
put,
mg
Figure 4. 22 Salt mass input and output in a sampler of Midland soil.

125
y = 0.2722x + 2779.1R2 = 0.884
0.000
5000.000
10000.000
15000.000
20000.000
25000.000
30000.000
0.000 10000.000
20000.000
30000.000
40000.000
50000.000
60000.000
70000.000
80000.000
90000.000
Cumulative Salt input, mg
Cum
ulat
ive
Salt
outp
ut, m
g
Figure 4. 23 The regression relationship between average accumulated salt mass input and output for
a sampler of Houston soil.
y = 0.4832x - 3310.2R2 = 0.9365
-5000.000
0.000
5000.000
10000.000
15000.000
20000.000
25000.000
30000.000
35000.000
0.000 10000.000 20000.000 30000.000 40000.000 50000.000 60000.000 70000.000
Cumulative Salt input, mg
Cum
ulat
ive
Salt
outp
ut, m
g
Figure 4. 24 The regression relationship between average accumulated salt mass input and output for
a sampler of Midland soil.

126
Table 4. 28 Salt mass storage ratio for Houston soil
Sampling period Accumulated Salt
output, mg Accumulated Salt
input, mg Storage ratio,
% 11/28/2005-12/29/2005 1692.391 2031.235 16.68 12/29/2005-2/10/2006 3335.074 4231.532 21.19 2/10/2006-4/6/2006 3829.215 6798.545 43.68 4/6/2006-5/25/2006 3882.576 11299.439 65.64 5/25/2006-7/23/2006 6026.865 20244.831 70.23 7/23/2006-9/1/2006 8383.729 25687.485 67.36 9/1/2006-9/24/2006 9642.855 27864.388 65.39
9/24/2006-10/31/2006 13099.081 34911.685 62.48 10/31/2006-11/30/2006 15585.057 37549.111 58.49 11/30/2006-12/31/2006 18301.684 40020.633 54.27 12/31/2006-1/31/2007 18301.684 42003.994 56.43 1/31/2007-3/30/2007 18301.684 45918.523 60.14 3/30/2007-4/25/2007 19090.729 51697.401 63.07 4/25/2007-5/29/2007 19090.729 57626.271 66.87 5/29/2007-6/28/2007 19090.729 63324.034 69.85 6/28/2007-7/31/2007 19090.729 70383.557 72.88 7/31/2007-8/31/2007 19408.419 77391.163 74.92 8/31/2007-9/28/2007 25225.613 84066.722 69.99
Table 4. 29 Salt mass storage ratio for Midland soil
Sampling period Accumulated Salt
output, mg Accumulated Salt
input, mg Storage ratio,
% 11/28/2005-12/29/2005 34.976 1117.179 96.87 12/29/2005-2/10/2006 34.976 3317.476 98.95 2/10/2006-4/6/2006 703.097 5884.489 88.05 4/6/2006-5/25/2006 2290.287 11559.529 80.19 5/25/2006-7/23/2006 3165.276 18345.688 82.75 7/23/2006-9/1/2006 5320.633 23365.025 77.23 9/1/2006-9/24/2006 6994.842 24235.786 71.14
9/24/2006-10/31/2006 7217.031 27753.457 74.00 10/31/2006-11/30/2006 7217.031 29637.333 75.65 11/30/2006-12/31/2006 12492.655 30961.961 59.65 12/31/2006-1/31/2007 12492.655 32625.635 61.71 1/31/2007-3/30/2007 16355.068 37330.681 56.19 3/30/2007-4/25/2007 18397.223 42003.133 56.20 4/25/2007-5/29/2007 21415.188 45195.601 52.62 5/29/2007-6/28/2007 21415.188 48088.690 55.47 6/28/2007-7/31/2007 21415.188 53497.261 59.97 7/31/2007-8/31/2007 21415.188 58288.599 63.26 8/31/2007-9/28/2007 30373.080 62133.532 51.12

127
CHAPTER V
DISCUSSION This chapter discusses some new findings during the research. Those findings are
illustrated in the sections of water balance, nitrogen balance, and salt balance.
5.1 Water balance
In water balance, precipitation patterns, the difference between designed leaching
and measured leaching, the leaching pattern, and the implication to the design are
discussed. The precipitation is an important parameter to the water leaching.
5.1.1 Precipitation Patterns
The precipitation (PPT) data at Littlefield during the period of Oct 2005 to Sept
2007 shows that there were 14 months with PPT above the 30-year average and ten with
PPT below the average (Figure 5. 1 and Figure 5. 2). From Oct 2005 to June 2006, all
months except May 2006, the PPT was lower than normal, but from July 2006 to Sept
2007, all months except July and August 2007 were above normal. The lowest normal
PPT is in January with 0.61 inches and the highest normal PPT is in June with 2.98
inches. However, the lowest PPT during the project happened in Jan 2006 with 0.02
inches, and the highest PPT appeared in Dec 2006 with 7.11 inches. As shown in Figure 5.
2, the highest shift away from the recorded average PPT was in Dec 2006 with 6.43
inches and the highest one below average was in June 2006 with -2.432 inches. The PPT
in the months of May and October of 2006 were the two months closest to the average.
There were disparities between the two sets of PPT with 3.24% below normal in May
2006 and with 1041.54% above normal in Jan 2007.

128
Months from Oct 2005 to Sep 2007
Sep Nov Jan Mar May Jul Sep Nov Jan Mar May Jul Sep
Thirt
y-ye
ar a
vera
ge P
PT
& re
cord
ed P
PT,
inch
es
0.0
0.5
1.0
1.5
2.0
2.5
3.0
3.5
4.0
4.5
5.0
5.5
6.0
6.5
7.0
7.5
30-year average PPT Recorded PPT
Figure 5. 1 The 30-year average precipitation at Lubbock and recorded
precipitation at Littlefield during the period of Oct 2005 to Sept 2007

129
Months from Oct 2005 to Sep 2007
Sep Nov Jan Mar May Jul Sep Nov Jan Mar May Jul Sep
The
PP
T ab
ove
or b
elow
the
30-y
ears
ave
rage
, inc
hes
-2.5-2.0-1.5-1.0-0.50.00.51.01.52.02.53.03.54.04.55.05.56.06.5
Figure 5. 2 The recorded precipitation at Littlefield above or below the 30-year
average precipitation at Lubbock during Oct 2005 to Sept 2007

130
5.1.2 Expected leaching and measured leaching
To mathematically know the model of water leaching, the conceptual model of
water balance (Equation 4.1) used in this research can be converted to Equation 5.1 and
5.2. Also, it can be found that the amount of leachate is the function of precipitation,
applied wastewater, evapotranspiration, and the change of soil moisture. As calculated in
Chapter IV, the soil moistures in the sampler at saturation, field capacity, and wilting
point are 5.892 inches, 3.612 inches, and 2.328 inches, respectively. The soil water higher
than field capacity and lower than saturation is supposed to be leached down through the
root zone. The soil moisture is assumed not to be less than wilting point. Therefore, the
range of the change of soil moisture for this type of sampler (ΔSM) is from 0 inches to
1.284 inches.
)( 1−−−−+= iiiiii SMSMETIPL (5.1)
SMETIPL iiii Δ−−+= (5.2)
where, Li is the leaching that occurs in sampling period i, (inches/sampling
period);
Pi is the precipitation in sampling period i, (inches/sampling period);
Ii is the irrigation in sampling period i, (inches/sampling period);
ETi is the evapotranspiration in sampling period i, (inches/sampling period);
SMi is the soil moisture in sampling period i, (inches/ sampling period);
SMi-1 is the soil moisture in the previous sampling period, (inches/ sampling
period);
and ΔSM is the change of soil moisture, (inches/ sampling period).

131
The average water storage capacities (saturation) of three support layers, sand,
pea gravel, and coarse gravel in such type of sampler, are estimated as 705 mL, 557 mL,
and 459 mL, respectively. The total average storage capacity of the whole support section
of the sampler is calculated as 1721 mL. The ranges of water storage capacities of sand
layer, pea gravel layer, and coarse gravel layer, are 410 to 869 mL, 410 to 623 mL, and
393 to 590 mL. And the range of the total storage capacity of the three support layers is
1213 mL to 2082 mL, the lowest limit of which is the sum of the respective lowest limit
of those three layers and the highest limit of which is the sum of the respective highest
limit of three layers.
The differences of the recorded precipitation and the 30-year average precipitation
(PPT), and the difference of measured leaching and designed leaching are summarized in
Table 5. 1. In this table, if the difference is larger than zero, then “+” is put in the
following column; in versus, “-” is set. Table 5. 1 illustrates that 14 sets of data in twenty
sampling periods for two differences in precipitation and leaching amount have the same
change direction or trend, though there are different degrees of discrepancy. It illustrates
that the difference between measured leaching and designed leaching is not just caused
by the difference between the recorded precipitation and the 30-year average
precipitation used in the determination of the irrigation scheduling. As shown in Equation
5.2, the leaching amount of deep percolation water is determined by individual and
combined function of precipitation, applied wastewater, evapotranspiration, and the
change of soil moisture.

132
Table 5. 1 The difference of the recorded and the 30-year average precipitation (PPT), and the difference of measured leaching and expected leaching
1 2 3 4 5
No. Recorded PPTminus 30-year Ave. PPT
Column 1 is positive
or negative
Measured leaching minus
expected leaching
Column 3 is positive
or negative Sampling period
1 -1.122 - -0.838 - 10/07/2005-11/28/20052 -0.580 - -0.975 - 11/28/2005-12/29/20053 -0.887 - 0.959 + 12/29/2005-2/10/2006 4 0.609 + 0.848 + 2/10/2006-4/6/2006 5 -1.289 - -0.319 - 4/6/2006-5/25/2006 6 -0.488 - 0.550 + 5/25/2006-6/16/2006 7 2.685 + 0.632 + 6/16/2006-7/21/2006 8 2.874 + 0.750 + 7/21/2006-9/1/2006 9 2.560 + 0.888 + 9/1/2006-9/22/2006
10 -0.759 - 0.673 + 9/22/2006-10/12/2006 11 -0.365 - -0.968 - 10/12/2006-11/22/200612 9.417 + -0.281 - 11/22/2006-1/9/2007 13 9.007 + 0.434 + 1/9/2007-2/23/2007 14 3.560 + 1.527 + 2/23/2007-3/30/2007 15 0.078 + 0.534 + 3/30/2007-4/25/2007 16 2.171 + 1.378 + 4/25/2007-5/29/2007 17 1.879 + 1.701 + 5/29/2007-6/28/2007 18 -1.109 - 0.560 + 6/28/2007-7/31/2007 19 -1.430 - 0.644 + 7/31/2007-8/31/2007 20 0.510 + 0.485 + 8/31/2007-9/28/2007
133
It can be seen in Table 5. 1 that even if the precipitation is much higher than
normal one in No. 12 sampling period, 11/22/2006-1/9/2007, the measured leaching, 1.13
inches, is still less than expected one, 1.41 inches. One cause is that the wind blew the
snow on and around the samplers and this part of snow did not really enter the sampler
soil.
However, the measured leaching in five sampling periods is a little larger than
expected when the precipitation is less than normal. There are five of such cases. In the
case of sampling period, 12/29/2005-2/10/2006, the reason may be that ET was less than
the normal due to low temperature than normal; as a result, it caused higher leaching.
During the period of 9/22/2006-10/12/2006, more leaching occurred was caused by the
intensive irrigation during UCC test. In the other three sampling periods, higher leaching
amount might be the result of less ET than the normal due to insufficient growth of grass.
5.1.3 Leachate passing through the root zone
The pattern of deep percolation passing through the root zone was quite different
from one sampling period to another. This is illustrated in Appendix B, Appendix C, and
Figure 4. 1. The range of leaching amount is from 0.028 inches to 2.100 inches in
sampling period. The leaching amount in each sampling period as shown in Figure 4.1
reflects the time effect. Because the days of each sampling period are not same, from 20
to 55 days, therefore, the higher leaching amounts in some sampling periods might
contribute to relatively more days. Accordingly, the daily average leaching amount is
plotted as in Figure 5. 3. The daily average leaching amount is from 0.001 to 0.060 inches.
One reason causing different leaching is identified as the UCC test. For example, three
UCC tests conducted in March, three UCC tests between the first to the 12th of October
in 2006, two UCC tests on Feb 23, 2007, right before the 14th sampling period, all of
those UCC tests caused the high leaching because the wastewater was applied intensively
in the relative short time and the ET was kept relative constant. Precipitation in the 9th,
16th, and 17th sampling periods was one of the causes of high leaching. The lower total
inputs of water can explain the low leaching in the 2nd, 5th, and 11th sampling periods.
The ratio of leaching to water inputs is expected to be variable because the input
of precipitation and irrigation are variable and cannot be controlled, and ET is also

134
variable depending on the weather. The ratio of leaching to the total input in the whole
test period is 14.62%, the average ratio of leaching to the total input in each sampling
period over the period of study is 15.8%, the ratio of leaching to the total input in each
sampling period over the period of study is shown in Figure 5. 4, with the range of 0.49 to
37.05%. The pattern is similar to the daily average leaching shown in Figure 5. 3. The
leaching ratio reflected the combined effect of all kinds of field conditions including
climatic conditions, irrigation events and schedule, and irrigation management in each
sampling period. The ratio of cumulative leaching amount to the total water input was
plotted in Figure 5. 5. There is a trend in this figure that the ratio is close to be identical
since the third sampling period and finally stable on the range of 12-14%. Such relative
stable trend reflects the cumulative effect for the individual sampling period and averages
the effects of all kinds of field impacting factors for the ratio of leaching to the total
input.

135
No. of sampling period
0 1 2 3 4 5 6 7 8 9 10 11 12 13 14 15 16 17 18 19 20 21
The
daily
ave
rage
leac
hing
of e
ach
sam
plin
g pe
riod,
inch
es
0.00
0.01
0.02
0.03
0.04
0.05
0.06
0.07
Figure 5. 3 The daily average leaching of each sampling period, the No. of sampling period can be
referred to Table 5.1.

136
No. of sampling period
0 1 2 3 4 5 6 7 8 9 10 11 12 13 14 15 16 17 18 19 20 21
The
ratio
of l
each
ing
amou
nt to
tota
l wat
er in
put
0%
10%
20%
30%
40%
50%
60%
70%
80%
90%
100%
Figure 5. 4 The ratio of leaching amount to total water input including applied wastewater and
precipitation, the No. of sampling period can be referred to Table 5.1.

137
No. of sampling period
0 1 2 3 4 5 6 7 8 9 10 11 12 13 14 15 16 17 18 19 20 21The
ratio
of c
umul
ativ
e le
achi
ng to
cum
ulat
ive
tota
l wat
er in
put
0%
10%
20%
30%
40%
50%
60%
70%
80%
90%
100%
Figure 5. 5 The ratio of cumulative leaching amount to cumulative total water input. the No. of
sampling period in Table 5.1.
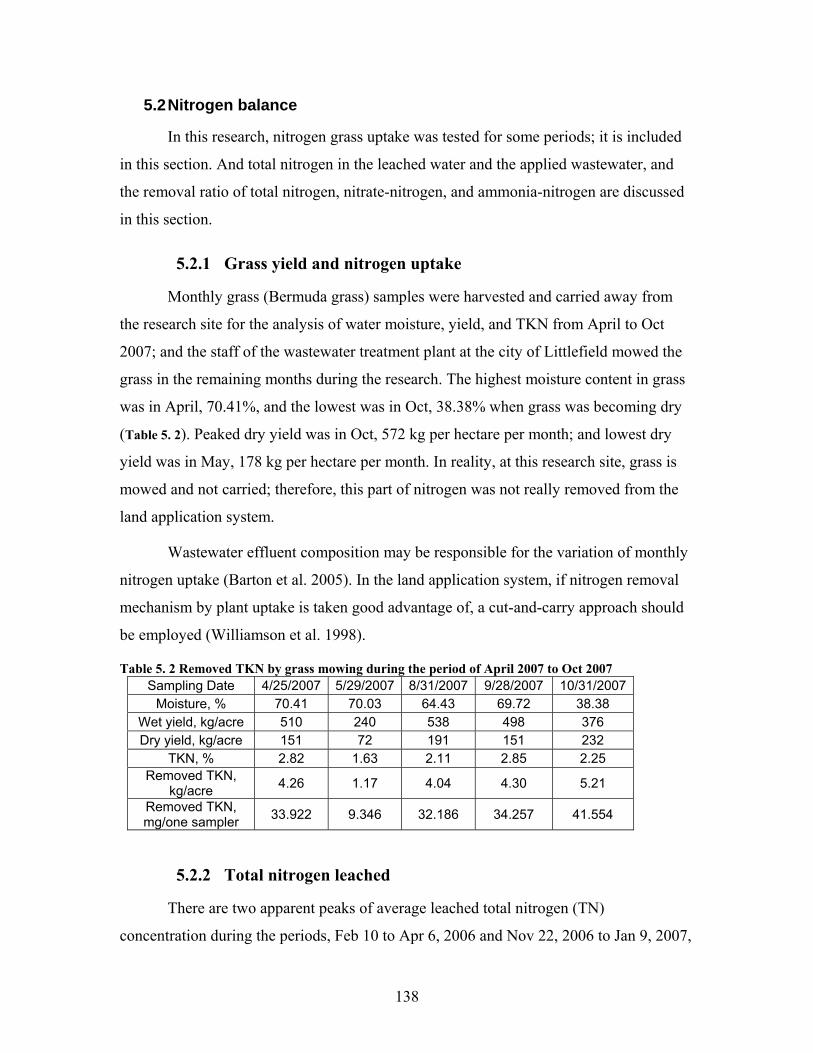
138
5.2 Nitrogen balance
In this research, nitrogen grass uptake was tested for some periods; it is included
in this section. And total nitrogen in the leached water and the applied wastewater, and
the removal ratio of total nitrogen, nitrate-nitrogen, and ammonia-nitrogen are discussed
in this section.
5.2.1 Grass yield and nitrogen uptake
Monthly grass (Bermuda grass) samples were harvested and carried away from
the research site for the analysis of water moisture, yield, and TKN from April to Oct
2007; and the staff of the wastewater treatment plant at the city of Littlefield mowed the
grass in the remaining months during the research. The highest moisture content in grass
was in April, 70.41%, and the lowest was in Oct, 38.38% when grass was becoming dry
(Table 5. 2). Peaked dry yield was in Oct, 572 kg per hectare per month; and lowest dry
yield was in May, 178 kg per hectare per month. In reality, at this research site, grass is
mowed and not carried; therefore, this part of nitrogen was not really removed from the
land application system.
Wastewater effluent composition may be responsible for the variation of monthly
nitrogen uptake (Barton et al. 2005). In the land application system, if nitrogen removal
mechanism by plant uptake is taken good advantage of, a cut-and-carry approach should
be employed (Williamson et al. 1998).
Table 5. 2 Removed TKN by grass mowing during the period of April 2007 to Oct 2007 Sampling Date 4/25/2007 5/29/2007 8/31/2007 9/28/2007 10/31/2007
Moisture, % 70.41 70.03 64.43 69.72 38.38 Wet yield, kg/acre 510 240 538 498 376 Dry yield, kg/acre 151 72 191 151 232
TKN, % 2.82 1.63 2.11 2.85 2.25 Removed TKN,
kg/acre 4.26 1.17 4.04 4.30 5.21
Removed TKN, mg/one sampler 33.922 9.346 32.186 34.257 41.554
5.2.2 Total nitrogen leached
There are two apparent peaks of average leached total nitrogen (TN)
concentration during the periods, Feb 10 to Apr 6, 2006 and Nov 22, 2006 to Jan 9, 2007,

139
with the volume weighted average concentrations of 4.97 mg/L and 5.12 mg/L,
respectively (Figure 4. 2). Totally, two summers in 2006 and 2007 have lower volume
weighted average concentrations of leached TN concentrations. Due to the difference in
length of each sampling period, concentration, and the leached water quantity, the daily
average leached total nitrogen mass needs to be plotted to compare the leached nitrogen
mass in different sampling period. In this research, the volume weighted average total
nitrogen concentration was less than 5.12 mg/L, and the EPA’s maximum contaminant
level (MCL) for nitrate-nitrogen in public water supplies is 10 mg/L (Klocke et al. 1999),
so there was no potential nitrogen contamination to the groundwater in this research.

140
The number of sampling period from Oct 2005 to Sept 2007
0 1 2 3 4 5 6 7 8 9 10 11 12 13 14 15 16 17 18 19 20 21
Dai
ly a
vera
ge le
ache
d TN
mas
s, k
g/ha
0.00
0.01
0.02
0.03
0.04
0.05
Figure 5. 6 Daily average leached total nitrogen mass during the project. The
number of sampling period can be referred to Table 5. 1.

141
It can be seen in Figure 5. 6 that the peaks of daily average leached TN mass
occurred in the third, fourth, tenth, twelfth and fourteenth sampling periods. The higher
daily leached total mass happened mainly in the winter and spring (Figure 5. 6). However,
the tenth had a relative high leaching TN mass; the reason is because three UCC tests
were conducted just in three days, therefore, more total water (the total of scheduled
wastewater, wastewater used for UCC tests, and precipitation) flushed nitrogen down in
the short sampling period. And the peaks in winter and spring were because the plants
nitrogen uptake rate went down and denitrification rate may also slow down in the low
temperature, which results in more total nitrogen leaching in winter. In this research, the
total nitrogen concentration in wastewater effluent is high in winter and spring, but low in
summer and fall. This specific applied wastewater composition is also responsible for this
phenomenon. Therefore, in this research site, leached total nitrogen mass depends on the
leachate volume, season, irrigated wastewater amount and composition, the capacity of
plant nitrogen uptake, and denitrification.
The loss or removal of total nitrogen is mainly due to plant uptake with the
management of cut and carry-away model and denitrification. In the wastewater land
treatment system similar to this study, the ammonia volatilization is neglected because
the applied ammonia concentration is relatively minor. Crop nitrogen uptake is not
considered as an output if the grass was mowed but stays in the system during nitrogen
mass balance. In such a system, denitrification is the main removal mechanism, and
system should be designed so that denitrification is maximized. Denitrification is the
function of substrate (carbon, nitrogen available to microorganisms), oxygen, temperature
in the soil profile, water moisture content in the soil, and other soil characteristics (Luo et
al. 1999).
5.2.3 Nitrogen removal
The total nitrogen, nitrate-nitrogen, and ammonia-nitrogen were tested in this
study for the applied wastewater and the leached water in different sampling periods.
Table 5. 3 provides their concentrations in the influent of the designed land application
system (the effluent of the pond system) and in the effluent of the land application
system, and the mass removal efficiency.

142
Table 5. 3 Nitrogen removal data by the land application system. TN means total nitrogen; NO3
- in the table is nitrate-nitrogen; NH4
+ is ammonia-nitrogen.
TN NO3‐ NH4
+ TN NO3‐ NH4
+ TN NO3‐NH4
+
1 10/07/2005‐11/28/2005 12.00 5.75 2.90 0.00 0.00 0.00 100 100 1002 11/28/2005‐12/29/2005 16.00 3.35 4.50 2.24 0.00 0.00 100 100 1003 12/29/2005‐2/10/2006 16.50 3.40 5.30 3.81 2.24 0.01 95 85 1004 2/10/2006‐4/6/2006 19.00 2.40 5.20 4.97 3.29 0.19 96 78 995 4/6/2006‐5/25/2006 18.00 2.70 6.40 0.31 0.00 0.00 100 100 1006 5/25/2006‐6/16/2006 15.00 5.00 2.80 1.95 0.34 0.08 97 98 997 6/16/2006‐7/21/2006 8.50 5.00 0.12 2.06 0.24 0.08 97 99 928 7/21/2006‐9/1/2006 7.00 5.20 0.14 1.99 1.08 0.07 96 97 939 9/1/2006‐9/22/2006 6.00 3.90 0.02 0.73 0.54 0.01 92 91 8510 9/22/2006‐10/12/2006 5.00 4.15 0.16 2.78 2.06 0.04 80 82 9111 10/12/2006‐11/22/2006 12.00 4.70 1.80 0.49 0.03 0.03 99 100 10012 11/22/2006‐1/9/2007 16.00 4.10 2.60 5.12 1.45 0.33 88 86 9513 1/9/2007‐2/23/2007 10.00 5.75 3.50 1.82 1.48 0.01 94 91 10014 2/23/2007‐3/30/2007 17.00 4.25 4.10 3.10 1.36 0.03 89 82 10015 3/30/2007‐4/25/2007 17.00 4.70 4.70 0.28 0.16 0.01 100 99 10016 4/25/2007‐5/29/2007 12.50 8.20 0.01 1.60 1.13 0.01 94 94 7417 5/29/2007‐6/28/2007 8.00 5.10 1.05 1.87 1.08 0.03 87 88 9918 6/28/2007‐7/31/2007 6.00 4.70 0.30 1.61 1.13 0.05 97 97 9819 7/31/2007‐8/31/2007 5.00 3.15 0.49 3.50 1.77 0.06 88 91 9820 8/31/2007‐9/28/2007 7.50 5.75 1.44 3.27 1.52 0.01 84 90 100
19.00 8.20 6.40 5.12 3.29 0.33 100 100 1005.00 2.40 0.01 0.00 0.00 0.00 80 78 74
MaxMin
InfluentConcentration, mg/L
EffluentConcentration, mg/L
Removal%No. Sampling period
143
The range of total nitrogen, nitrate-nitrogen, and ammonia-nitrogen in the applied
wastewater were 5 mg/L to 19 mg/L, 2.4 mg/L to 8.2 mg/L, and 0.01 mg/L to 6.40 mg/L,
respectively. The concentrations of total nitrogen, nitrate-nitrogen, and ammonia-nitrogen
in the leached water were 0 mg/L to 5.12 mg/L, 0 mg/L to 3.29 mg/L, and 0 mg/L to 0.33
mg/L, respectively. Their mass removal efficiencies were 80% to 100%, 78% to 100%,
and 74% to 100% in different sampling period, respectively. And the average mass
removals of total nitrogen, nitrate-nitrogen, and ammonia-nitrogen by the land
application system were 94%, 92%, and 96%, respectively. The cumulative mass
removals in the two-year period were 96%, 93%, and 100% for total nitrogen, nitrate-
nitrogen, and ammonia-nitrogen.
Total nitrogen concentration fluctuated with the change of the time in the two-
year period in the applied wastewater (Figure 5. 7), which is also the effluent of the pond
system. Total nitrogen concentration was high from the winter to spring and even early
summer, but low in the summer and fall. The ammonia-nitrogen also exhibited a similar
tendency of variation. The tendency of change of ammonia-nitrogen is in agreement with
the previous research results of the lagoon effluent (Surampalli et al. 2007). The nitrate-
nitrogen concentration in the applied wastewater was relatively stable in this research.
Removal of nitrogen is a function of pH, temperature, and detention time in a pond
system with the nitrogen removal up to 95% (USEPA 2006). And the primary long-term
and permanent removal of nitrogen is caused by ammonia volatilization in the pond
system (USEPA 2006). Ammonia volatilization mainly depends on pH and temperature
and increases with the increase of pH and temperature. This illustrates the varying
tendency of total nitrogen and ammonia-nitrogen in this study. The pond system is often
employed as a type of pre-application treatment. The removal of nitrogen in the pond
system directly influences the design of the following slow rate land application system
due to the importance of nitrogen as one of the Limiting Design Parameters (USEPA
2006).
The long-term and permanent removal of nitrogen in the land application system
is primarily controlled by the plant nitrogen up-take and the denitrification in the plant
root zone, which are positively influence by the temperature in the system. In addition,
the nitrogen concentration is higher in winter and spring than other seasons of the year in

144
the incoming secondary wastewater effluent from the pond system; therefore, generally,
the total nitrogen concentration may be higher in winter and spring in the leached water.
Ammonia-nitrogen in this study was almost completely removed after the wastewater
land treatment system. The main removal mechanisms for ammonia-nitrogen in the land
application system are plant up-take, ammonia volatilization, and nitrification; and are
plant up-take, denitrification, and immobilization for nitrate-nitrogen. The nitrate-
nitrogen in the leached water was much lower than 10 mg/L, which is the requirement by
USEPA. Tzanakakis et al. (2007) found that high nitrate concentration in the soil solution
in the slow rate wastewater land application system, therefore, they proposed that the
appropriate pre-treatment of wastewater should be conducted to reduce the potential risks
of nitrate contamination to the groundwater. There was a pond system working to pre-
treat the wastewater for the following land application system. Therefore, the nitrate-
nitrogen in the leached water was below the level of risks for potential contamination.

145
0.00
5.00
10.00
15.00
20.00
1 2 3 4 5 6 7 8 9 10 11 12 13 14 15 16 17 18 19 20
The concen
tration, mg/L
No. of the sampling period
Total nitrogen Nitrate‐nitrogen Ammonia‐nitrogen
Figure 5. 7 The concentration of total nitrogen, nitrate-nitrogen, and ammonia-nitrogen in the applied wastewater. The number of the sampling period
can be referred to Table 5.1

146
0.00
1.00
2.00
3.00
4.00
5.00
6.00
1 2 3 4 5 6 7 8 9 10 11 12 13 14 15 16 17 18 19 20
The concen
tration, mg/L
No. of the sampling period
Total nitrogen Nitrate‐nitrogen Ammonia‐nitrogen
Figure 5. 8 The concentration of total nitrogen, nitrate-nitrogen, and ammonia-nitrogen in effluent of the land application system to the groundwater
passing through the grass root zone. The number of the sampling period can be referred to Table 5. 1

147
5.3 Salt Balance
This section includes the discussion of salt concentration and mass in the applied
wastewater and the leached wastewater, salt mass balance in the root zone of the land
application system, and the leaching requirement and the leaching factor. Some concepts
concerning salt balance and salt accumulation are reviewed and examined in this
research.
5.3.1 Salt concentration and mass
Salt concentration was represented by salinity (electrical conductivity, µS/cm).
Salt concentration of the applied wastewater showed lower levels and less variation than
that of the leached water (Figure 5. 9). The salinity in the applied wastewater used for
discussion was the average of the salinity of samples collected in two adjacent sampling
periods. The salinity in the leached water is the volume weighted average of the salinity
in all samplers. The salinity in the applied wastewater was 963±95 µS/cm (Mean ± SD)
from Oct 7, 2005 (day 0) to Sept 28, 2007 (day 721) with the coefficient of variation
(CV) of 9.88% and the standard error of 2.16%. The ranges of salinity in the leached
water and in the applied wastewater were 1261 to 2794 µS/cm and 839 to 1147µS/cm,
respectively.
The leached salt mass and the applied salt mass were summarized in Table 5. 4 in
unit of g/m2 and in Table 4.10 in unit of g/sampler. The range of CV for the salt mass in
the leached water was from 31% to 199%. It showed a large variability of salt mass
collected in the different samplers. One of the reasons for the large variability was the
low individual field irrigation distribution uniformities caused by highly variable wind
directions and the frequent winds with speed higher than 10 MPH at the Littlefield site.
The low irrigation distribution uniformity caused by the specific climatic conditions
resulted in some samplers receiving more applied wastewater and thus salt while other
samplers received less water during a given irrigation event.

148
Day of study
0 50 100 150 200 250 300 350 400 450 500 550 600 650 700 750 800
Elec
trica
l con
duct
ivity
, μS/
cm
600
800
1000
1200
1400
1600
1800
2000
2200
2400
2600
2800
3000
Salinity in applied water Salinity in leached water
Figure 5. 9 Salinity (electrical conductivity) in applied water and volume weighted average salinity in
leached water
5.3.2 Salt mass balance in the root zone
The salt in the root zone was concentrated primarily by the mechanism of
evapotranspiration (Corwin et al. 2007). Salt accumulation can be investigated by the
method of a salt mass balance. The concept of salt mass balance in a hydrological
representative volume, which is SaltIn – SaltOut = Salt balance, was proposed by Scofield
for 68 years (Scofield 1940; Thayalakumaran et al. 2007; Wilcox 1963) and was
originally utilized at the scale of the root zone (Scofield 1940). There are two terms
employed to indicate if salt accumulation happens during wastewater land application.
They are the salt balance index (SBI) and salt export ratio (SER) (Gilfedder et al. 1999;
Peck and Hurle 1973; Thayalakumaran et al. 2007; Wilcox 1963; Williamson et al.
1997). The SBI and SER is defined as the result of salt output divided by salt input, and
indicates that salt accumulation occurs when the SBI or SER is less than one and no salt
accumulation when the resulting SBI or SER is larger than one.

149
SBI or SER represents the change of the amount of salt in the root zone in a
wastewater land application system (Rhoades et al. 1997; Thayalakumaran et al. 2007).
However, one of its limitations is that SBI or SER cannot indicate whether such change
of salt amount brings short term detriment to the land application system or not.
Therefore, to evaluate the operation and management of the land application systems, the
leaching fraction (LF) and the leaching requirement (LR) should be considered. The
leaching fraction (LF) is calculated with Equation 5. 3 for the crop root zone (Corwin et
al. 2007; Thayalakumaran et al. 2007). And the LR is determined by Equation 5. 4 (Ayers
and Westcot 1976).
dw
iw
iw
dw
ECEC
VVLF == (5. 3)
Where, Vdw is the volume of drainage water (mm or inches);
Viw is the volume of infiltrating irrigation water (mm or inches);
ECiw is the electrical conductivity (EC) of the irrigation water (dS/m);
and ECdw is the electrical conductivity (EC) of the drainage water (dS/m).
we
w
ECECEC
LR−
=5
(5. 4)
where, LR is the minimum leaching requirement needed to control salt
accumulation in the soil;
ECw is the electrical conductivity of the irrigation water (micromhos/cm);
and ECe is the electrical conductivity of the saturation extract of soil for a given
crop appropriate to the tolerable degree of yield reduction--usually 10% or less
(micromhos/cm). The relationship between ECe and yield reduction of a crop can be
obtained in Ayers and Westcot (1976).
During the period from Oct 10, 2005 to Sept 28, 2007, the masses of total applied
salt, total leached salt, and total mass stored salt, were 1608 g/m2, 636 g/m2, and 973
g/m2, respectively. In twenty sampling periods, the salt was accumulated except the
150
periods of Sept 1, 2006 to Sept 22, 2006 and May 29, 2007 to June 28, 2007 with the SBI
or SER of 1.28 and 1.01, respectively.
Although salt was found to accumulate in this study of approximately two years,
the salt accumulation was not proof of failure of the design of this system. The time for a
land application system to reach salt equilibrium (Salt mass in = salt mass out) varies
from a year to a few years (Sheng and Xiuling 1997; Thayalakumaran et al. 2007), or
even “longer (15-30 years) in discharge areas where soils are poorly leached and the
water table is close to the root-zone” (Thayalakumaran et al. 2007). Therefore, to
investigate the time to reach salt equilibrium in the system designed by mass balance
approach, more research should be conducted. Applying more water onto the land is
considered to be one practice to shorten the time of salt mass balance to reach the
equilibrium; also soil texture plays an important role for salt mass out of the root zone.
The better the soils are leached, the shorter time to realize the favorable salt mass
balance. In addition, climatic conditions have significant influences on the salt balance in
the root zone (Jolly et al. 1998; Sheng and Xiuling 1997; Thayalakumaran et al. 2007;
Tyagi 2003; Williams 2005).
The salt mass balance can be utilized as the indicator of salinization in the root
zone (Scofield 1940; Thayalakumaran et al. 2007) and to assess the appropriateness of
leaching and irrigation practices (Rhoades et al. 1997; Thayalakumaran et al. 2007).
However, the salt mass balance can not be used to evaluate the absolute salinity levels
and the spatial distribution of salinity in the root zone (Thayalakumaran et al. 2007).

151
Table 5. 4 The salt mass in the leached water and in the applied wastewater
The leached salt The applied salt Sampling Date
Mass, g/m2 SD, g/m2 CV, % Mass,g/m2
10/07/2005-11/28/2005 29 19 67 173
11/28/2005-12/29/2005 1 2 199 112
12/29/2005-2/10/2006 51 25 50 119
2/10/2006-4/6/2006 53 22 42 160
4/6/2006-5/25/2006 12 13 110 157
5/25/2006-6/16/2006 14 10 71 36
6/16/2006-7/21/2006 17 9 56 81
7/21/2006-9/1/2006 20 17 85 84
9/1/2006-9/22/2006 40 21 52 31
9/22/2006-10/12/2006 28 32 115 42
10/12/2006-11/22/2006 11 15 140 48
11/22/2006-1/9/2007 28 22 78 51
1/9/2007-2/23/2007 36 15 41 53
2/23/2007-3/30/2007 63 21 33 66
3/30/2007-4/25/2007 26 13 48 63
4/25/2007-5/29/2007 60 19 32 70
5/29/2007-6/28/2007 54 17 31 53
6/28/2007-7/31/2007 20 17 85 87
7/31/2007-8/31/2007 31 41 131 75
8/31/2007-9/28/2007 43 28 66 48

152
5.3.3 Leaching requirement and leaching fraction
The leaching requirement (LR) in all twenty sampling periods ranged from 0.02
to 0.03 (Table 5. 5). The LR was calculated using Equation 5. 4, and the ECe of 8.5 dS/m
(8500 µS/cm) was taken from Ayers and Westcot (1976). In the Table 5. 5, LF-1 is
obtained with the definition of leaching fraction, and it is the result of the measured
leached water divided by irrigated water during the sampling period, but LF-2 is the
result of the collected water divided by total water input including applied wastewater
and precipitation. Therefore, it is impossible for LF-2 to be higher than LF-1. LF-1
ranged from 0.00 to 0.62, and LF-2 ranged from 0.00 to 0.30 during the research period.
The SBI/SER had the range of 0.01 to 1.28. There were two sampling periods in which
the SBI/SER was larger than 1.00. Therefore, in those two sampling periods, 9/1/2006-
9/22/2006 and 5/29/2007-6/28/2007, there were no salt accumulation. In addition, in the
sampling period of 2/23/2007-3/30/2007, the SBI/SER was 0.95 close to 1 and the salt
accumulation was relatively small. In the sampling period of 9/1/2006-9/22/2006,
5/29/2007-6/28/2007, and 2/23/2007-3/30/2007, LF-1 and LF-2 were 0.62 and 0.20, 0.55
and 0.22, and 0.58 and 0.26, respectively. Those data showed that the relative high ratio
of the leached water to irrigated wastewater caused no salt accumulation in the sampling
period, but the relative leaching fraction was caused by relative high precipitation.
The leaching fraction was higher than the leaching requirement in all sampling
periods but the sampling period of 11/28/2005-12/29/2005. This showed that the target
soil salinity in the root zone was achieved, which was always less than 8500 µS/cm. The
data of salinity in the leached water was less than 8500 µS/cm (Figure 5. 9). The LR was
determined with consideration of the salinity in applied wastewater and the salinity in the
root zone that plant can tolerance with 10% of yield reduction. However, salt was
accumulated during the period of the whole study (Figure 5. 10). It illustrated that even if
the LR was satisfied under the field conditions with the LF was higher than LR, the salt

153
accumulation still happened. Therefore, it is possible for the land to have the risk of
salinization even if the LR is satisfied.
Table 5. 5 Leaching requirements, leaching fraction, and SBI/SER
Sampling Date LF-1 LF-2 LR SBI/SER
10/07/2005-11/28/2005 0.09 0.08 0.03 0.17
11/28/2005-12/29/2005 0.00 0.00 0.03 0.01
12/29/2005-2/10/2006 0.22 0.22 0.02 0.43
2/10/2006-4/6/2006 0.16 0.14 0.02 0.34
4/6/2006-5/25/2006 0.05 0.05 0.02 0.08
5/25/2006-6/16/2006 0.27 0.16 0.02 0.39
6/16/2006-7/21/2006 0.12 0.06 0.02 0.21
7/21/2006-9/1/2006 0.14 0.07 0.02 0.24
9/1/2006-9/22/2006 0.62 0.20 0.02 1.28
9/22/2006-10/12/2006 0.36 0.30 0.02 0.66
10/12/2006-11/22/2006 0.13 0.09 0.02 0.22
11/22/2006-1/9/2007 0.39 0.21 0.02 0.55
1/9/2007-2/23/2007 0.34 0.25 0.02 0.68
2/23/2007-3/30/2007 0.58 0.26 0.02 0.95
3/30/2007-4/25/2007 0.28 0.21 0.03 0.41
4/25/2007-5/29/2007 0.45 0.22 0.02 0.85
5/29/2007-6/28/2007 0.55 0.22 0.02 1.01
6/28/2007-7/31/2007 0.11 0.10 0.02 0.22
7/31/2007-8/31/2007 0.17 0.14 0.03 0.41
8/31/2007-9/28/2007 0.37 0.18 0.03 0.89

154
Day of study
0 100 200 300 400 500 600 700 800
Salt
mas
s, g
/m2
0
200
400
600
800
1000
1200
1400
1600
1800
Cumulative salt out Cumulative salt in Cumulative salt balance
Figure 5. 10 Cumulative salt mass in, mass out, and mass stored in the root zone

155
References: Ayers, R. S., and Westcot, D. W. (1976). "Water Quality for Agriculture." FAO Irrigation
and Drainage Paper No. 29, FAO, United Nations, Rome. Barton, L., Schipper, L. A., Barkle, G. F., McLeod, M., Speir, T. W., Taylor, M. D.,
McGill, A. C., van Schaik, A. P., Fitzgerald, N. B., and Pandey, S. P. (2005). "Land application of domestic effluent onto four soil types: plant uptake and nutrient leaching." J Environ Qual, 34(2), 635-43.
Corwin, D. L., Rhoades, J. D., and Simunek, J. (2007). "Leaching requirement for soil salinity control: Steady-state versus transient models." Agriculture Water Management(90), 165-180.
Gilfedder, M., Connell, L. D., and Mein, R. G. (1999). "Implications of Irrigation Bay Management for Salt Export - A Study of Irrigation Bay Processes in the Barr Creek Catchment." Cooperative Research Center for Catchment Hydrology, Melbourne.
Jolly, I. D., Narayan, K. A., Armstrong, D., and Walker, G. R. (1998). "Impact of flooding on modelling salt transport processes to streams." Environ. Model., 13, 87-104.
Klocke, N. L., Watts, D. G., Schneekloth, J. P., Davison, D. R., Todd, R. W., and Parkhurst, A. M. (1999). "Nitrate leaching in irrigated corn and soybean in a semi-arid climate." Transactions of the ASAE, 42(6), 1621-1630.
Luo, J., Tillman, R. W., and Ball, P. R. (1999). "Factors regulating denitrification in a soil under pasture." Soil Biology and Biochemistry, 31(913-927).
Peck, A. J., and Hurle, D. H. (1973). "Chloride balance of some farmed and forested catchments in south western Australia." Water Resour. Res. , 9, 648-657.
Rhoades, J. D., Lesch, S. M., LeMert, R. D., and Alves, W. J. (1997). "Assessing irrigation, drainage, salinity mangement using spatially referenced salinity measurements." Agriculture Water Management, 35(35), 147-165.
Scofield, C. S. (1940). "Salt balance in irrigated areas." J. Agric. Res., 61, 17-39. Sheng, F., and Xiuling, C. (1997). "Using shallow saline groundwater for irrigation and
regulating for soil salt regime." Irrig. Drainage Syst., 11, 1-14. Surampalli, R. Y., Banerji, S. K., Tyagi, R. D., and Yang, P. Y. (2007). "Integrated
advanced natural wastewater treatment system for small communities." Water science and technology, 55(11), 239-243.
Thayalakumaran, T., Bethune, M. G., and McMahon, T. A. (2007). "Achieving a salt balance - Should it be a management objective? ." Agriculture Water Management, 92, 1-12.
Tyagi, N. K. (2003). "Managing saline and alkaline water for higher productivity." Kijne, J.W., Barker, R., Molden, D. (Eds.), Water Productivity in Agriculture: Limits and Opportunities for Improvement. CAB International, pp. 69-87.
USEPA. (2006). Process Design Manual: Land Treatment of Municipal Wastewater Effluents, Land Remediation and Pollution Control Division, National Risk Management Research Laboratory, Office of Research and Development, U.S. Environmental Protection Agency, Cincinnati, Ohio, EPA/625/R-06/016, Sept 2006.

156
Wilcox, L. V. (1963). "Salt Balance and Leaching Requirement in Irrigated Lands." Technical Bulletin No. 1290.
Williams, C. (2005). "Is irrigated agriculture sustainable? The Battle to Counteract Salinity." Southwest Hydrology, 4(4), 22-23.
Williamson, D. R., Gates, G. W. B., Robinson, G., Linke, G. K., Seker, M. P., and Evans, W. R. (1997). "Salt Trends:Historic Trend in Salt Concentration and Salt Load of Stream Flow in the Murray-Darling Drainage Division." Murray Darling Basin Ministerial Committee, Canberra.
Williamson, J. C., Taylor, M. D., Torrens, R. S., and Vojvodic-Vukovic, M. (1998). "Reducing nitrogen leaching from dairy farm effluent-irrigated pasture using dicyandiamide: a lysimeter study." Agriculture, Ecosystems and Environment, 69, 81-88.

157
CHAPTER VI
CONCLUSIONS AND RECOMMENDATIONS
The major objectives in this field study were completed in a two-year period. In
the case study of a wastewater land application system designed by an innovative design
approach from water balance, nitrogen balance, and salt balance, the quantity and quality,
including nitrogen and salinity, of the leached water was investigated. The components in
the water balance, which was proposed by Texas Tech University, were quantified under
real field conditions with a land application system. The conceptual models for nitrogen
balance and salt balance were set up, and the simplified models were utilized by
quantifying the respective components to investigate the environmental impacts of
wastewater land application in terms of nitrogen and salt. It can be concluded from this
field study that wastewater can be effectively surface applied to land as long as it is done
in an environmentally sound method, such as with a mass balance approach. The findings
are summarized in the following.
6.1 Water balance
Water balance is considered as the primary step to design an environmentally
sound wastewater land application system. The leaching amount passing through the
plant root zone in the land application is the function of precipitation, irrigation,
evapotranspiration, and the change of the soil moisture in a period. During this study, the
monthly irrigation schedule was determined by the mass balance model with the
assumption that the change of soil moisture is zero. The 30-year average monthly
precipitation was employed in the determination of monthly irrigation schedule, and
evapotranspiration was adopted from the manual of mean crop consumptive use and free
water evaporation for Texas in the scheduling and mass balance. The designed leaching
amount was based on the consideration of nitrogen leaching and salt accumulation. The
precipitation was the measured value in the data analysis for water balance.
The irrigation uniformity distribution coefficient was measured at the different
season of a year. The individual irrigation uniformity distribution coefficient ranged from

158
31% to 56% in spring, 49% to 66% in summer, 52% to 75% in fall, and 37% to 51% in
winter. However, the annual irrigation uniformity distribution coefficient was 83%. The
range of leaching amounts was from 0.03 inches to 2.10 inches for different sampling
period with the length of 20 days to 55 days. The daily average leaching amount was
from 0.001 to 0.060 inches. The range of coefficient of variation was from 28% to 217%.
It can be concluded that the variability of the collected leached water was relatively large.
This type of variability might be due to the poor individual irrigation distribution
uniformity under field conditions. Generally, the high leaching happened in the winter
and spring and the low leaching in summer and fall. The excess water leaching was a
result of excess precipitation over the 30-year average precipitation, the applied
wastewater for the tests of the irrigation distribution uniformity coefficient, and less
evapotranspiration than the calculated amount from the published design manual (Borrelli
et al. 1988). The ratio of leaching to the total input in each sampling period over the
period of study ranged from 0.49% to 37.05%. The ratio of cumulative leaching amount
to the total water input was linear following the third sampling period and finally
stabilized in the range of 12-14%.
6.2 Nitrogen balance
This study investigated nitrogen leaching based on total nitrogen, nitrate-nitrogen,
and ammonia-nitrogen under field conditions in a municipal wastewater land treatment
system at the city of Littlefield, Texas. The range of total nitrogen, nitrate-nitrogen, and
ammonia-nitrogen in the applied wastewater were 5 mg/L to 19 mg/L, 2.4 mg/L to 8.2
mg/L, and 0.01 mg/L to 6.40 mg/L, respectively. The concentrations of total nitrogen,
nitrate-nitrogen, and ammonia-nitrogen in the leached water were 0 mg/L to 5.12 mg/L, 0
mg/L to 3.29 mg/L, and 0 mg/L to 0.33 mg/L, respectively. Their mass removal
efficiencies by the land application system were 80% to 100%, 78% to 100%, and 74% to
100% in different sampling period, respectively. And the average mass removals of total
nitrogen, nitrate-nitrogen, and ammonia-nitrogen by the land application system were
94%, 92%, and 96%, respectively. The cumulative mass removals in the two-year period
were 96%, 93%, and 100% for total nitrogen, nitrate-nitrogen, and ammonia-nitrogen.
The average concentration of nitrate-nitrogen in the leached water is far less than the
159
maximum allowed concentration of nitrate-nitrogen in drinking water, 10 mg/L set by
USEPA. Therefore, this study did not show that the wastewater land application with
wastewater secondary effluent had the problem of nitrogen contamination to
groundwater. Although there is variability, the nitrogen leaching can be well controlled in
such an application system when designed using the mass balance approach.
6.3 Salt balance
The salinity in the applied wastewater was 963±95 µS/cm (Mean ± SD) during
the research with the coefficient of variation (C.V.) of 9.88% and the standard error of
2.16%. The range of salinity in the leached water was 1261 to 2794 µS/cm. The range of
C.V. of salt mass in the leached water was from 31% to 199%. Similar to total nitrogen,
the variability of salt in leached water depends on irrigation system, climatic conditions,
and irrigation operations. There are two sampling periods in which salt-out was larger
than salt-in in both individual sampling periods, but salt-out was less than salt-in in all
other sampling periods. The former case was caused by excess precipitation which was
sufficient to flush out the applied salt mass in that sampling period. During this research,
although the leaching requirement was satisfied under the field conditions with the
leaching fraction higher than the leaching requirement, the salt accumulation still
happened. Therefore, it is possible for the land to have the risk of salinization in a short
term if the leaching requirement is satisfied. However, such salt accumulation doesn’t
prove that the design approach is not feasible in the short and long term; on the contrary,
the mass balance method can be theoretically utilized to control the salt mass balance in
the plant root zone.

160
APPENDIX A
DETERMINATION OF IRRIGATION RATE AT SITE

161
To determine the monthly irrigation schedule, the irrigation rate at Littlefield site
is required to be determined. There are two operating pressure values which were
measured and recorded in irrigation events, 35 psi and 58 psi, at Littlefield site during the
project period. However, the design operation pressure was 65 psi according to the design
instruction.
At the Littlefield site, two types of nozzles are employed, which are Gray and Dk.
Brown I-25 plus nozzle series produced by Hunter Industries with inner diameter of 1/4
inches and 17/64 inches, respectively. The performance data is list in Table A. 1, those
data were obtained from the product information brochure provided by Hunter Company.
Table A. 1 The performance data of two types of nozzle used at the research site
Nozzle Inner Diameter
inches
Pressure
psi
Radius
ft
Flow
GPM
Gray, I‐25 plus nozzle 1/4
50
60
70
80
56'
57'
57'
58'
13.4
14.3
15.2
16.4
Dk Brown, I‐25 plus nozzle 17/64
60
70
80
90
62'
63'
64'
65'
17.8
19.2
20.5
21.8
Relationship between nozzle pressure and irrigation radius
For Gray I-25 plus nozzle series, the relationship between nozzle pressure and
irrigation radius is plotted as in Figure A. 1 with the data in Table A. 1 provided by the
manufacturer, and the linear regression model between nozzle pressure (x, psi) and
irrigation radius (y, ft) is:
y = 0.06x+53.1 (A.1)

162
When nozzle pressure is 35 psi, then irrigation radius y for Gray I-25 plus nozzle
series is:
y = 0.06*35+53.1 = 55.2 ft
When nozzle pressure is 58 psi, then irrigation radius y for Gray I-25 plus nozzle
series is:
y = 0.06*58+53.1 = 56.6 ft
y = 0.06x + 53.1R² = 0.9
55.5
56
56.5
57
57.5
58
58.5
40 50 60 70 80 90
Irrig
atio
n R
adiu
s, ft
Nozzle Pressure, psi
Figure A. 1 Plot of relationship between nozzle pressure and irrigation radius for Gray I-25 plus nozzle series
Similarly, for Dk. Brown I-25 plus nozzle series, the relationship between nozzle
pressure and irrigation radius is plotted as in Figure A. 2.

163
y = 0.1x + 56R² = 1
61.562
62.563
63.5
6464.5
65
65.5
40 50 60 70 80 90 100
Irrig
atio
n R
adiu
s, ft
Nozzle Pressure, psi
Figure A. 2 Plot of relationship between nozzle pressure and irrigation radius for Dk. Brown I-25 plus nozzle series
The linear regression model between nozzle pressure (x, psi) and irrigation radius
(y, ft) for Dk. Brown I-25 plus nozzle series is:
y = 0.1x+56 (A.2)
When nozzle pressure is 35 psi, then irrigation radius y for Dk. Brown I-25 plus
nozzle series is:
y = 0.1*35+56 = 59.5 ft
When nozzle pressure is 58 psi, then irrigation radius y for Dk. Brown I-25 plus
nozzle series is:
y = 0.1*58+56 = 61.8 ft
Relationship between flow rate and nozzle pressure
For Gray I-25 plus nozzle series, the linear relationship between flow rate and
square root of nozzle pressure is plotted as in Figure A. 3 with the performance data in
Table A. 1. The linear regression model between square root of nozzle pressure (x) and
flow rate (y, GPM) is:
y = 1.5809x+2.1273 (A.3)

164
When nozzle pressure is 35 psi, x = 5.916 (psi)1/2, then flow rate y for Gray I-25
plus nozzle is:
y = 1.5809*5.916+2.1273 = 11.5 GPM
When nozzle pressure is 58 psi, x = 7.616 (psi)1/2, then flow rate y for Gray I-25
plus nozzle is:
y = 1.5809*7.616+2.1273 = 14.2 GPM
y = 1.58x + 2.13R² = 0.99
1212.5
1313.5
1414.5
1515.5
1616.5
17
6 6.5 7 7.5 8 8.5 9 9.5
Flow
Rat
e, G
PM
Square Root of Pressure, Square Root of psi
Figure A. 3 Plot of relationship between square root of nozzle pressure and flow rate for Gray I-25 plus nozzle series
Similarly, for Dk. Brown I-25 plus nozzle, the relationship between flow rate and
square root of nozzle pressure is plotted as in Figure A. 4.

165
y = 2.29x + 0.03R² = 0.999
12
14
16
18
20
22
24
6 6.5 7 7.5 8 8.5 9 9.5 10
Flow
Rat
e, G
PM
Square Root of Pressure, Square Root of PSI
Figure A. 4 Plot of relationship between square root of nozzle pressure and flow rate for Dk. Brown I-25 plus nozzle series
The linear relationship between square root of nozzle pressure (x) and flow rate
(y, GPM) for Dk. Brown I-25 plus nozzle is:
y = 2.2921x+0.0306 (A.4)
When nozzle pressure is 35 psi, x = 5.916 (psi)1/2, then flow rate y for Dk. Brown
I-25 plus nozzle is:
y = 2.2921*5.916+0.0306 = 13.6 GPM
When nozzle pressure is 58 psi, x = 7.616 (psi)1/2, then flow rate y for Dk. Brown
I-25 plus nozzle is:
y = 2.2921*7.616+0.0306 = 17.5 GPM
The calculated values of irrigation radius and flow rate under the pipe pressure of
35 psi and 58 psi, and the numbers of nozzles installed at Littlefield research site are
summarized in Table A.2.

166
Table A. 2 Summary of irrigation radius, flow rate, and number of nozzles at the research site
Nozzle pressure
psi
Irrigation radius
ft
Flow rate
GPM Number of Nozzles
Gray 35 55.2 11.5 52
Dk. Brown 35 59.5 13.6 79
Gray 58 56.6 14.2 52
Dk. Brown 58 61.8 17.5 79
Irrigated area for different nozzle pressure
With the aid of AutoCAD software, the layout of nozzles and ponds were drawn
with the same scale, each circle represents an irrigated area by a nozzle with the irrigated
radius of 55.2 ft for Gray nozzles and 59.5 ft for Dk. Brown at pressure of 35 psi. Dk.
Brown popup sprinklers are positioned around the storage pond and aerated ponds while
the Gray popup sprinklers are installed on the banks between storage pond and aerated
pond, and shared bank between two aerated ponds (Figure A. 5). The net irrigated area is
shown in Figure A. 6. The size of ponds, the key points for those three ponds, and
irrigation installation points are extracted from the design of Littlefield Wastewater
Treatment Plant designed by Oller Engineering on June 2000.
The irrigated area with nozzle pressure of 35 psi is 298720 ft2. With the similar
method by changing the irrigated radius into 56.58 ft for Gray nozzles and 61.8 ft for Dk.
Brown when the nozzle pressure is 58 psi, the irrigated area with nozzle pressure of 58
psi is retrieved as 308193 ft2.
Determination of wastewater application depth per unit time
When nozzle pressure is 35 psi, total flow rate is:
52 nozzles*11.5 GPM/nozzle (Gray) +79 nozzles*13.6 GPM/nozzle (Dk. Brown)
= 1672.4 GPM

167
Total irrigated area is 298720 ft2.
Average wastewater application depth per unit time is:
1672.4 GPM/(298720 ft2) = 0.00898 inches/min = 0.54 inches/hour
When nozzle pressure is 58 psi, total flow rate is:
52 nozzles*14.2 GPM/nozzle (Gray) +79 nozzles*17.5 GPM/nozzle (Dk. Brown)
= 2120.9 GPM
Total irrigated area is 308193 ft2.
Average wastewater application depth per unit time is:
2120.9 GPM/(308193 ft2) = 0.011 inches/min = 0.66 inches/hour
Figure A. 5 The layout of sprinklers at the Littlefield site.

168
Figure A. 6 The irrigated area served at the Littlefield site.

169
APPENDIX B
THE PLOTS OF SPATIAL DISTRIBUTION OF LEACHED WATER

170
Collected Leach Water Volume in Each Sampler on 10/07/2005
0100200300400500600700800900
1000
1 2 3 4 5 6 7 8 9 10 11 12 13 14 15 16
Sampler No.
Colle
cted
Lea
ch W
ater
Vo
lum
e, m
L
Figure B. 1 Collected leach water volume in each sampler on 10/07/2005
Collected Leach Water Volume in Each Sampler on 11/28/2005
0200400600800
1000120014001600
1 2 3 4 5 6 7 8 9 10 11 12 13 14 15 16
Sampler No.
Col
lect
ed L
each
Wat
er
Vol
ume,
mL
Figure B. 2 Collected leach water volume in each sampler on 11/28/2005

171
Collected Leach Water Volume in Each Sampler on 12/29/2005
020406080
100120140160180200
1 2 3 4 5 6 7 8 9 10 11 12 13 14 15 16
Sampler No.
Col
lect
ed L
each
Wat
er
Volu
me,
mL
Figure B. 3 Collected leach water volume in each sampler on 12/29/2005
Collected Leach Water Volume in Each Sampler on 2/10/2006
0
500
1000
1500
2000
2500
3000
1 2 3 4 5 6 7 8 9 10 11 12 13 14 15 16
Sampler No.
Colle
cted
Lea
ch W
ater
Vo
lum
e, m
L
Figure B. 4 Collected leach water volume in each sampler on 2/10/2006

172
Collected Leach Water Volume in Each Sampler on 4/6/2006
0
500
1000
1500
2000
2500
1 2 3 4 5 6 7 8 9 10 11 12 13 14 15 16
Sampler No.
Colle
cted
Lea
ch W
ater
Vo
lum
e, m
L
Figure B. 5 Collected leach water volume in each sampler on 4/6/2006
Collected Leach Water Volume in Each Sampler on 5/25/2006
0200400600800
100012001400160018002000
1 2 3 4 5 6 7 8 9 10 11 12 13 14 15 16
Sampler No.
Col
lect
ed L
each
Wat
er
Volu
me,
mL
Figure B. 6 Collected leach water volume in each sampler on 5/25/2006
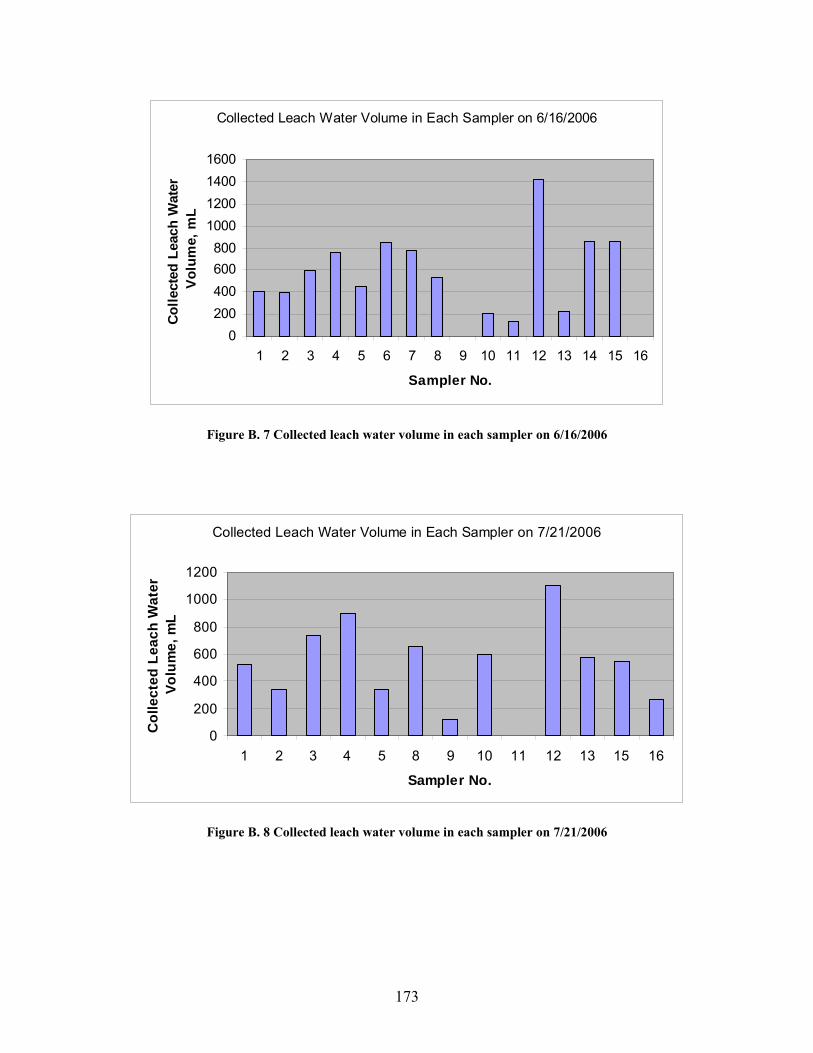
173
Collected Leach Water Volume in Each Sampler on 6/16/2006
0200400600800
1000120014001600
1 2 3 4 5 6 7 8 9 10 11 12 13 14 15 16
Sampler No.
Colle
cted
Lea
ch W
ater
Vo
lum
e, m
L
Figure B. 7 Collected leach water volume in each sampler on 6/16/2006
Collected Leach Water Volume in Each Sampler on 7/21/2006
0
200
400
600
800
1000
1200
1 2 3 4 5 8 9 10 11 12 13 15 16
Sampler No.
Col
lect
ed L
each
Wat
er
Volu
me,
mL
Figure B. 8 Collected leach water volume in each sampler on 7/21/2006

174
Collected Leach Water Volume in Each Sampler on 9/1/2006
0200400600800
10001200140016001800
1 2 3 4 5 8 9 10 11 12 13 15 16
Sampler No.
Col
lect
ed L
each
Wat
er
Volu
me,
mL
Figure B. 9 Collected leach water volume in each sampler on 9/1/2006
Collected Leach Water Volume in Each Sampler on 9/22/2006
0200400600800
10001200140016001800
1 2 3 4 5 8 9 10 11 12 13 15 16
Sampler No.
Col
lect
ed L
each
Wat
er
Volu
me,
mL
Figure B. 10 Collected leach water volume in each sampler on 9/22/2006

175
Collected Leach Water Volume in Each Sampler on 10/12/2006
0
500
1000
1500
2000
2500
3000
1 2 3 4 5 8 9 10 11 12 13 15 16
Sampler No.
Col
lect
ed L
each
Wat
er
Volu
me,
mL
Figure B. 11 Collected leach water volume in each sampler on 10/12/2006
Collected Leach Water Volume in Each Sampler on 11/22/2006
0
200
400
600800
1000
1200
1400
1 2 3 4 5 8 9 10 11 12 13 15 16
Sampler No.
Col
lect
ed L
each
Wat
er
Volu
me,
mL
Figure B. 12 Collected leach water volume in each sampler on 11/22/2006

176
Collected Leach Water Volume in Each Sampler on 1/9/2007
0200400600800
10001200140016001800
1 2 3 4 5 8 9 10 11 12 13 15 16
Sampler No.
Col
lect
ed L
each
Wat
er
Volu
me,
mL
Figure B. 13 Collected leach water volume in each sampler on 1/9/2007
Collected Leach Water Volume in Each Sampler on 2/23/2007
0200400600800
1000120014001600
1 2 3 4 5 8 9 10 11 12 13 15 16
Sampler No.
Col
lect
ed L
each
Wat
er
Volu
me,
mL
Figure B. 14 Collected leach water volume in each sampler on 2/23/2007

177
Collected Leach Water Volume in Each Sampler on 3/30/2007
0
500
1000
1500
2000
2500
3000
1 2 3 4 5 8 9 10 11 12 13 15 16
Sampler No.
Col
lect
ed L
each
Wat
er
Volu
me,
mL
Figure B. 15 Collected leach water volume in each sampler on 3/30/2007
Collected Leach Water Volume in Each Sampler on 4/25/2007
0200400600800
1000120014001600
1 2 3 4 5 8 9 10 11 12 13 15 16
Sampler No.
Col
lect
ed L
each
Wat
er
Volu
me,
mL
Figure B. 16 Collected leach water volume in each sampler on 4/25/2007
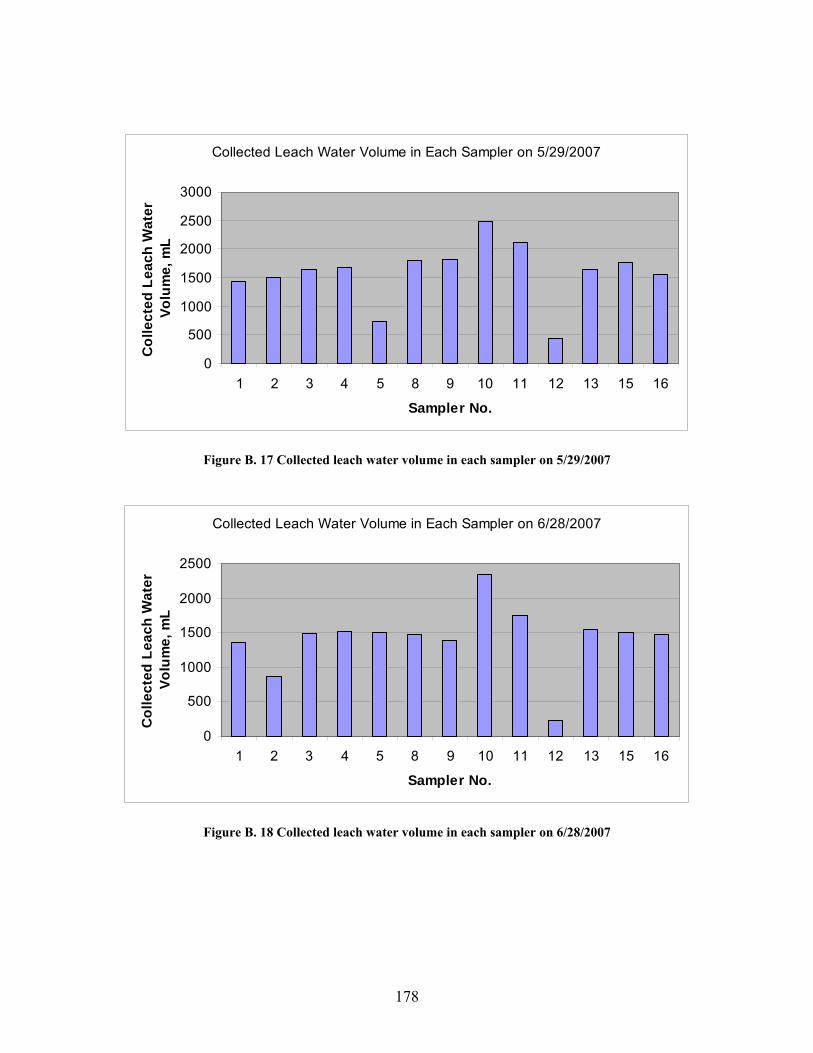
178
Collected Leach Water Volume in Each Sampler on 5/29/2007
0
500
1000
1500
2000
2500
3000
1 2 3 4 5 8 9 10 11 12 13 15 16
Sampler No.
Col
lect
ed L
each
Wat
er
Volu
me,
mL
Figure B. 17 Collected leach water volume in each sampler on 5/29/2007
Collected Leach Water Volume in Each Sampler on 6/28/2007
0
500
1000
1500
2000
2500
1 2 3 4 5 8 9 10 11 12 13 15 16
Sampler No.
Col
lect
ed L
each
Wat
er
Volu
me,
mL
Figure B. 18 Collected leach water volume in each sampler on 6/28/2007

179
Collected Leach Water Volume in Each Sampler on 7/31/2007
0
200
400
600
800
1000
1200
1 2 4 5 8 10 11 13 15 16
Sampler No.
Col
lect
ed L
each
Wat
er
Volu
me,
mL
Figure B. 19 Collected leach water volume in each sampler on 7/31/2007
Collected Leach Water Volume in Each Sampler on 8/31/2007
0
500
1000
1500
2000
2500
1 2 4 5 8 10 11 13 15 16
Sampler No.
Col
lect
ed L
each
Wat
er
Volu
me,
mL
Figure B. 20 Collected leach water volume in each sampler on 8/31/2007

180
Collected Leach Water Volume in Each Sampler on 9/28/2007
0200400600800
10001200140016001800
1 2 4 5 8 10 11 13 15 16
Sampler No.
Col
lect
ed L
each
Wat
er
Volu
me,
mL
Figure B. 21 Collected leach water volume in each sampler on 9/28/2007

181
APPENDIX C
THE PLOTS OF TEMPORAL DISTRIBUTION OF LEACHED WATER

182
Collected Leach Water Volume in Sampler 1 at different sampling date, mL
2/10/2006
4/6/2006
9/1/2006
4/25/2007
7/31/2007
11/22/2006
9/22/2006
7/21/20069/28/2007
8/31/2007
6/28/2007
5/29/20073/30/2007
2/23/2007
1/9/2007
10/12/2006
6/16/2006
5/25/2006
12/29/2005
11/28/2005
10/7/2005
0
200
400
600
800
1000
1200
1400
1600
1800
10/7
/200
5
11/7
/200
5
12/7
/200
5
1/7/
2006
2/7/
2006
3/7/
2006
4/7/
2006
5/7/
2006
6/7/
2006
7/7/
2006
8/7/
2006
9/7/
2006
10/7
/200
6
11/7
/200
6
12/7
/200
6
1/7/
2007
2/7/
2007
3/7/
2007
4/7/
2007
5/7/
2007
6/7/
2007
7/7/
2007
8/7/
2007
9/7/
2007
Sampling Date
Col
lect
ed L
each
Wat
er V
olum
e, m
L
Figure C. 1 Collected leach water volume in sampler 1 at different sampling dates, mL

183
Collected Leach Water Volume in Sampler 2 at different sampling date, mL
9/22/2006
7/31/20074/25/2007
11/22/20069/1/2006
7/21/2006
4/6/2006
2/10/2006
10/7/200511/28/2005
12/29/2005
5/25/2006 6/16/200610/12/2006
1/9/2007
2/23/2007
3/30/20075/29/2007
6/28/2007
8/31/2007
9/28/2007
0200
400600
8001000
12001400
16001800
2000
10/7
/200
5
11/7
/200
5
12/7
/200
5
1/7/
2006
2/7/
2006
3/7/
2006
4/7/
2006
5/7/
2006
6/7/
2006
7/7/
2006
8/7/
2006
9/7/
2006
10/7
/200
6
11/7
/200
6
12/7
/200
6
1/7/
2007
2/7/
2007
3/7/
2007
4/7/
2007
5/7/
2007
6/7/
2007
7/7/
2007
8/7/
2007
9/7/
2007
Sampling Date
Col
lect
ed L
each
Wat
er V
olum
e, m
L
Figure C. 2 Collected leach water volume in sampler 2 at different sampling dates, mL

184
Collected Leach Water Volume in Sampler 3 at different sampling date, mL
9/22/2006
6/28/2007
5/29/20073/30/2007
2/23/2007
1/9/2007
10/12/2006
6/16/20065/25/2006
12/29/2005
11/28/200510/7/2005
2/10/2006
4/6/2006
7/21/2006
9/1/2006
11/22/2006
4/25/2007
0200400600800
1000
12001400160018002000
10/7
/200
5
11/7
/200
5
12/7
/200
5
1/7/
2006
2/7/
2006
3/7/
2006
4/7/
2006
5/7/
2006
6/7/
2006
7/7/
2006
8/7/
2006
9/7/
2006
10/7
/200
6
11/7
/200
6
12/7
/200
6
1/7/
2007
2/7/
2007
3/7/
2007
4/7/
2007
5/7/
2007
6/7/
2007
Sampling Date
Col
lect
ed L
each
Wat
er V
olum
e, m
L
Figure C. 3 Collected leach water volume in sampler 3 at different sampling dates, mL

185
Collected Leach Water Volume in Sampler 4 at different sampling date, mL
7/31/2007
4/25/2007
11/22/20069/1/2006
7/21/2006
4/6/20062/10/2006
10/7/2005
11/28/2005
12/29/2005
5/25/2006
6/16/2006
10/12/20061/9/2007
2/23/2007
3/30/2007
5/29/2007
6/28/2007
8/31/2007
9/28/20079/22/2006
0200
400600800
1000
120014001600
18002000
10/7
/200
5
11/7
/200
5
12/7
/200
5
1/7/
2006
2/7/
2006
3/7/
2006
4/7/
2006
5/7/
2006
6/7/
2006
7/7/
2006
8/7/
2006
9/7/
2006
10/7
/200
6
11/7
/200
6
12/7
/200
6
1/7/
2007
2/7/
2007
3/7/
2007
4/7/
2007
5/7/
2007
6/7/
2007
7/7/
2007
8/7/
2007
9/7/
2007
Sampling Date
Col
lect
ed L
each
Wat
er V
olum
e, m
L
Figure C. 4 Collected leach water volume in sampler 4 at different sampling dates, mL

186
Collected Leach Water Volume in Sampler 5 at different sampling date, mL
9/22/2006
9/28/2007
8/31/2007
6/28/2007
5/29/2007
3/30/2007
2/23/2007
1/9/200710/12/2006
6/16/2006
5/25/2006
12/29/2005
11/28/2005
10/7/2005
2/10/2006
4/6/2006
7/21/2006
9/1/2006
11/22/2006
4/25/2007
7/31/2007
0
200
400
600
800
1000
1200
1400
160010
/7/2
005
11/7
/200
5
12/7
/200
5
1/7/
2006
2/7/
2006
3/7/
2006
4/7/
2006
5/7/
2006
6/7/
2006
7/7/
2006
8/7/
2006
9/7/
2006
10/7
/200
6
11/7
/200
6
12/7
/200
6
1/7/
2007
2/7/
2007
3/7/
2007
4/7/
2007
5/7/
2007
6/7/
2007
7/7/
2007
8/7/
2007
9/7/
2007
Sampling Date
Col
lect
ed L
each
Wat
er V
olum
e, m
L
Figure C. 5 Collected leach water volume in sampler 5 at different sampling dates, mL

187
Collected Leach Water Volume in Sampler 6 at different sampling date, mL
4/6/20062/10/2006
10/7/2005
11/28/2005
12/29/2005
5/25/2006
6/16/2006
0
200
400
600
800
1000
1200
1400
1600
180010
/7/2
005
10/1
4/20
05
10/2
1/20
05
10/2
8/20
05
11/4
/200
5
11/1
1/20
05
11/1
8/20
05
11/2
5/20
05
12/2
/200
5
12/9
/200
5
12/1
6/20
05
12/2
3/20
05
12/3
0/20
05
1/6/
2006
1/13
/200
6
1/20
/200
6
1/27
/200
6
2/3/
2006
2/10
/200
6
2/17
/200
6
2/24
/200
6
3/3/
2006
3/10
/200
6
3/17
/200
6
3/24
/200
6
3/31
/200
6
4/7/
2006
4/14
/200
6
4/21
/200
6
4/28
/200
6
5/5/
2006
5/12
/200
6
5/19
/200
6
5/26
/200
6
6/2/
2006
6/9/
2006
6/16
/200
6
Sampling Date
Col
lect
ed L
each
Wat
er V
olum
e, m
L
Figure C. 6 Collected leach water volume in sampler 6 at different sampling dates, mL

188
Collected Leach Water Volume in Sampler 7 at different sampling date, mL
6/16/2006
5/25/200612/29/2005
11/28/2005
10/7/2005
2/10/2006
4/6/2006
0
200
400
600
800
1000
1200
1400
1600
180010
/7/2
005
10/1
4/20
05
10/2
1/20
05
10/2
8/20
05
11/4
/200
5
11/1
1/20
05
11/1
8/20
05
11/2
5/20
05
12/2
/200
5
12/9
/200
5
12/1
6/20
05
12/2
3/20
05
12/3
0/20
05
1/6/
2006
1/13
/200
6
1/20
/200
6
1/27
/200
6
2/3/
2006
2/10
/200
6
2/17
/200
6
2/24
/200
6
3/3/
2006
3/10
/200
6
3/17
/200
6
3/24
/200
6
3/31
/200
6
4/7/
2006
4/14
/200
6
4/21
/200
6
4/28
/200
6
5/5/
2006
5/12
/200
6
5/19
/200
6
5/26
/200
6
6/2/
2006
6/9/
2006
6/16
/200
6
Sampling Date
Col
lect
ed L
each
Wat
er V
olum
e, m
L
Figure C. 7 Collected leach water volume in sampler 7 at different sampling dates, mL

189
Collected Leach Water Volume in Sampler 8 at different sampling date, mL
7/31/20074/25/2007
11/22/2006
9/1/2006
7/21/2006
4/6/2006
2/10/2006
10/7/2005
11/28/2005
12/29/20055/25/2006
6/16/2006
10/12/2006
1/9/2007
2/23/2007
3/30/2007
5/29/2007
6/28/2007
8/31/2007
9/28/20079/22/2006
0
500
1000
1500
2000
250010
/7/2
005
11/7
/200
5
12/7
/200
5
1/7/
2006
2/7/
2006
3/7/
2006
4/7/
2006
5/7/
2006
6/7/
2006
7/7/
2006
8/7/
2006
9/7/
2006
10/7
/200
6
11/7
/200
6
12/7
/200
6
1/7/
2007
2/7/
2007
3/7/
2007
4/7/
2007
5/7/
2007
6/7/
2007
7/7/
2007
8/7/
2007
9/7/
2007
Sampling Date
Col
lect
ed L
each
Wat
er V
olum
e, m
L
Figure C. 8 Collected leach water volume in sampler 8 at different sampling dates, mL

190
Collected Leach Water Volume in Sampler 9 at different sampling date, mL
9/22/20066/28/2007
5/29/2007
3/30/2007
2/23/20071/9/200710/12/20066/16/20065/25/200612/29/2005
11/28/2005
10/7/2005
2/10/2006
4/6/2006
7/21/2006
9/1/2006
11/22/2006 4/25/20070
500
1000
1500
2000
250010
/7/2
005
11/7
/200
5
12/7
/200
5
1/7/
2006
2/7/
2006
3/7/
2006
4/7/
2006
5/7/
2006
6/7/
2006
7/7/
2006
8/7/
2006
9/7/
2006
10/7
/200
6
11/7
/200
6
12/7
/200
6
1/7/
2007
2/7/
2007
3/7/
2007
4/7/
2007
5/7/
2007
6/7/
2007
Sampling Date
Col
lect
ed L
each
Wat
er V
olum
e, m
L
Figure C. 9 Collected leach water volume in sampler 9 at different sampling dates, mL

191
Collected Leach Water Volume in Sampler 10 at different sampling date, mL
7/31/2007
4/25/200711/22/2006
9/1/2006
7/21/2006
4/6/2006
2/10/2006
10/7/2005
11/28/2005
12/29/2005 5/25/2006 6/16/200610/12/2006
1/9/2007
2/23/2007
3/30/2007 5/29/2007
6/28/2007
8/31/2007
9/28/20079/22/2006
0
500
1000
1500
2000
2500
300010
/7/2
005
11/7
/200
5
12/7
/200
5
1/7/
2006
2/7/
2006
3/7/
2006
4/7/
2006
5/7/
2006
6/7/
2006
7/7/
2006
8/7/
2006
9/7/
2006
10/7
/200
6
11/7
/200
6
12/7
/200
6
1/7/
2007
2/7/
2007
3/7/
2007
4/7/
2007
5/7/
2007
6/7/
2007
7/7/
2007
8/7/
2007
9/7/
2007
Sampling Date
Col
lect
ed L
each
Wat
er V
olum
e, m
L
Figure C. 10 Collected leach water volume in sampler 10 at different sampling dates, mL

192
Collected Leach Water Volume in Sampler 11 at different sampling date, mL
9/22/2006
9/28/2007
8/31/2007
6/28/2007
5/29/20073/30/2007
2/23/2007
1/9/2007
10/12/2006
6/16/20065/25/200612/29/2005
11/28/200510/7/2005
2/10/2006
4/6/2006
7/21/20069/1/2006 11/22/2006
4/25/2007
7/31/20070
500
1000
1500
2000
250010
/7/2
005
11/7
/200
5
12/7
/200
5
1/7/
2006
2/7/
2006
3/7/
2006
4/7/
2006
5/7/
2006
6/7/
2006
7/7/
2006
8/7/
2006
9/7/
2006
10/7
/200
6
11/7
/200
6
12/7
/200
6
1/7/
2007
2/7/
2007
3/7/
2007
4/7/
2007
5/7/
2007
6/7/
2007
7/7/
2007
8/7/
2007
9/7/
2007
Sampling Date
Col
lect
ed L
each
Wat
er V
olum
e, m
L
Figure C. 11 Collected leach water volume in sampler 11 at different sampling dates, mL

193
Collected Leach Water Volume in Sampler 12 at different sampling date, mL
4/25/200711/22/2006
9/1/2006
7/21/20064/6/2006
2/10/2006
10/7/2005
11/28/2005
12/29/2005
5/25/20066/16/2006
10/12/20061/9/2007
2/23/2007
3/30/2007 5/29/2007
6/28/2007
9/22/2006
0
500
1000
1500
2000
250010
/7/2
005
11/7
/200
5
12/7
/200
5
1/7/
2006
2/7/
2006
3/7/
2006
4/7/
2006
5/7/
2006
6/7/
2006
7/7/
2006
8/7/
2006
9/7/
2006
10/7
/200
6
11/7
/200
6
12/7
/200
6
1/7/
2007
2/7/
2007
3/7/
2007
4/7/
2007
5/7/
2007
6/7/
2007
Sampling Date
Col
lect
ed L
each
Wat
er V
olum
e, m
L
Figure C. 12 Collected leach water volume in sampler 12 at different sampling dates, mL

194
Collected Leach Water Volume in Sampler 13 at different sampling date, mL
9/22/2006
9/28/2007
8/31/2007
6/28/2007
5/29/20073/30/2007
2/23/2007
1/9/2007
10/12/2006
6/16/20065/25/200612/29/2005
11/28/2005
10/7/2005
2/10/2006
4/6/2006
7/21/2006
9/1/2006 11/22/2006
4/25/2007
7/31/20070
200
400
600
800
1000
1200
1400
1600
180010
/7/2
005
11/7
/200
5
12/7
/200
5
1/7/
2006
2/7/
2006
3/7/
2006
4/7/
2006
5/7/
2006
6/7/
2006
7/7/
2006
8/7/
2006
9/7/
2006
10/7
/200
6
11/7
/200
6
12/7
/200
6
1/7/
2007
2/7/
2007
3/7/
2007
4/7/
2007
5/7/
2007
6/7/
2007
7/7/
2007
8/7/
2007
9/7/
2007
Sampling Date
Col
lect
ed L
each
Wat
er V
olum
e, m
L
Figure C. 13 Collected leach water volume in sampler 13 at different sampling dates, mL

195
Collected Leach Water Volume in Sampler 14 at different sampling date, mL
4/6/2006
2/10/2006
10/7/2005
11/28/2005
12/29/2005
5/25/2006
6/16/2006
0
500
1000
1500
2000
2500
300010
/7/2
005
10/1
4/20
05
10/2
1/20
05
10/2
8/20
05
11/4
/200
5
11/1
1/20
05
11/1
8/20
05
11/2
5/20
05
12/2
/200
5
12/9
/200
5
12/1
6/20
05
12/2
3/20
05
12/3
0/20
05
1/6/
2006
1/13
/200
6
1/20
/200
6
1/27
/200
6
2/3/
2006
2/10
/200
6
2/17
/200
6
2/24
/200
6
3/3/
2006
3/10
/200
6
3/17
/200
6
3/24
/200
6
3/31
/200
6
4/7/
2006
4/14
/200
6
4/21
/200
6
4/28
/200
6
5/5/
2006
5/12
/200
6
5/19
/200
6
5/26
/200
6
6/2/
2006
6/9/
2006
6/16
/200
6
Sampling Date
Col
lect
ed L
each
Wat
er V
olum
e, m
L
Figure C. 14 Collected leach water volume in sampler 14 at different sampling dates, mL

196
Collected Leach Water Volume in Sampler 15 at different sampling date, mL
9/22/2006
9/28/2007
8/31/2007
6/28/2007
5/29/20073/30/2007
2/23/2007
1/9/2007
10/12/2006
6/16/2006
5/25/2006
12/29/2005
11/28/2005
10/7/2005
2/10/20064/6/2006
7/21/2006 9/1/2006 11/22/2006
4/25/2007
7/31/2007
0
500
1000
1500
2000
2500
300010
/7/2
005
11/7
/200
5
12/7
/200
5
1/7/
2006
2/7/
2006
3/7/
2006
4/7/
2006
5/7/
2006
6/7/
2006
7/7/
2006
8/7/
2006
9/7/
2006
10/7
/200
6
11/7
/200
6
12/7
/200
6
1/7/
2007
2/7/
2007
3/7/
2007
4/7/
2007
5/7/
2007
6/7/
2007
7/7/
2007
8/7/
2007
9/7/
2007
Sampling Date
Col
lect
ed L
each
Wat
er V
olum
e, m
L
Figure C. 15 Collected leach water volume in sampler 15 at different sampling dates, mL

197
Collected Leach Water Volume in Sampler 16 at different sampling date, mL
7/31/20074/25/2007
11/22/2006
9/1/2006
7/21/2006
4/6/2006
2/10/2006
10/7/2005
11/28/2005
12/29/20055/25/2006
6/16/200610/12/2006
1/9/20072/23/2007
3/30/2007 5/29/2007
6/28/2007
8/31/20079/28/2007
9/22/2006
0200400600800
100012001400160018002000
10/7
/200
5
11/7
/200
5
12/7
/200
5
1/7/
2006
2/7/
2006
3/7/
2006
4/7/
2006
5/7/
2006
6/7/
2006
7/7/
2006
8/7/
2006
9/7/
2006
10/7
/200
6
11/7
/200
6
12/7
/200
6
1/7/
2007
2/7/
2007
3/7/
2007
4/7/
2007
5/7/
2007
6/7/
2007
7/7/
2007
8/7/
2007
9/7/
2007
Sampling Date
Col
lect
ed L
each
Wat
er V
olum
e, m
L
Figure C. 16 Collected leach water volume in sampler 16 at different sampling dates, mL

198
APPENDIX D
THE PLOTS OF SPATIAL DISTRIBUTION OF LEACHED TOTAL NITROGEN MASS

199
Mass of total nitrogen in leach water of each sampler, 10/07/2005
0
0.1
0.2
0.3
0.4
0.5
0.6
0.7
0.8
0.9
1
1 2 3 4 5 6 7 8 9 10 11 12 13 14 15 16
Sampler Number
Mas
s of
tota
l nitr
ogen
, mg
Figure D. 1. Mass of total nitrogen in the leach water of each sampler, 10/07/2005.
Mass of total nitrogen in leach water of each sampler, 11/28/2005
0
0.1
0.2
0.3
0.4
0.5
0.6
0.7
0.8
0.9
1
1 2 3 4 5 6 7 8 9 10 11 12 13 14 15 16
Sampler Number
Mas
s of
tota
l nitr
ogen
, mg
Figure D. 2. Mass of total nitrogen in the leach water of each sampler, 11/28/2005.

200
Mass of total nitrogen in leach water of each sampler, 12/29/2005
0
0.1
0.2
0.3
0.4
0.5
0.6
1 2 3 4 5 6 7 8 9 10 11 12 13 14 15 16
Sampler Number
Mas
s of
tota
l nitr
ogen
, mg
Figure D. 3. Mass of total nitrogen in the leach water of each sampler, 12/29/2005.
Mass of total nitrogen in leach water of each sampler, 2/10/2006
0
5
10
15
20
25
30
1 2 3 4 5 6 7 8 9 10 11 12 13 14 15 16
Sampler Number
Mas
s of
tota
l nitr
ogen
, mg
Figure D. 4. Mass of total nitrogen in the leach water of each sampler, 2/10/2006.

201
Mass of total nitrogen in leach water of each sampler, 4/6/2006
0
5
10
15
20
25
30
35
1 2 3 4 5 6 7 8 9 10 11 12 13 14 15 16
Sampler Number
Mas
s of
tota
l nitr
ogen
, mg
Figure D. 5. Mass of total nitrogen in the leach water of each sampler, 4/6/2006.
Mass of total nitrogen in leach water of each sampler, 5/25/2006
0
0.1
0.2
0.3
0.4
0.5
0.6
0.7
0.8
0.9
1 2 3 4 5 6 7 8 9 10 11 12 13 14 15 16
Sampler Number
Mas
s of
tota
l nitr
ogen
, mg
Figure D. 6. Mass of total nitrogen in the leach water of each sampler, 5/25/2006.

202
Mass of total nitrogen in leach water of each sampler, 6/16/2006
0
0.5
1
1.5
2
2.5
3
1 2 3 4 5 6 7 8 9 10 11 12 13 14 15 16
Sampler Number
Mas
s of
tota
l nitr
ogen
, mg
Figure D. 7. Mass of total nitrogen in the leach water of each sampler, 6/16/2006.
Mass of total nitrogen in leach water of each sampler, 7/21/2006
0
0.5
1
1.5
2
2.5
1 2 3 4 5 8 9 10 11 12 13 15 16
Sampler Number
Mas
s of
tota
l nitr
ogen
, mg
Figure D. 8. Mass of total nitrogen in the leach water of each sampler, 7/21/2006.

203
Mass of total nitrogen in leach water of each sampler, 9/1/2006
0
1
2
3
4
5
6
7
8
1 2 3 4 5 8 9 10 11 12 13 15 16
Sampler Number
Mas
s of
tota
l nitr
ogen
, mg
Figure D. 9. Mass of total nitrogen in the leach water of each sampler, 9/1/2006.
Mass of total nitrogen in leach water of each sampler, 9/22/2006
0
0.5
1
1.5
2
2.5
3
3.5
1 2 3 4 5 8 9 10 11 12 13 15 16
Sampler Number
Mas
s of
tota
l nitr
ogen
, mg
Figure D. 10. Mass of total nitrogen in the leach water of each sampler, 9/22/2006.

204
Mass of total nitrogen in leach water of each sampler, 10/12/2006
0
1
2
3
4
5
6
7
8
9
1 2 3 4 5 8 9 10 11 12 13 15 16
Sampler Number
Mas
s of
tota
l nitr
ogen
, mg
Figure D. 11. Mass of total nitrogen in the leach water of each sampler, 10/12/2006.
Mass of total nitrogen in leach water of each sampler, 11/22/2006
0
0.2
0.4
0.6
0.8
1
1.2
1.4
1 2 3 4 5 8 9 10 11 12 13 15 16
Sampler Number
Mas
s of
tota
l nitr
ogen
, mg
Figure D. 12. Mass of total nitrogen in the leach water of each sampler, 11/22/2006.

205
Mass of total nitrogen in leach water of each sampler, 1/9/2007
0
5
10
15
20
25
1 2 3 4 5 8 9 10 11 12 13 15 16
Sampler Number
Mas
s of
tota
l nitr
ogen
, mg
Figure D. 13. Mass of total nitrogen in the leach water of each sampler, 1/9/2007.
Mass of total nitrogen in leach water of each sampler, 2/23/2007
0
2
4
6
8
10
12
14
1 2 3 4 5 8 9 10 11 12 13 15 16
Sampler Number
Mas
s of
tota
l nitr
ogen
, mg
Figure D. 14. Mass of total nitrogen in the leach water of each sampler, 2/23/2007.

206
Mass of total nitrogen in leach water of each sampler, 3/30/2007
0
2
4
6
8
10
12
1 2 3 4 5 8 9 10 11 12 13 15 16
Sampler Number
Mas
s of
tota
l nitr
ogen
, mg
Figure D. 15. Mass of total nitrogen in the leach water of each sampler, 3/30/2007.
Mass of total nitrogen in leach water of each sampler, 4/25/2007
0
0.2
0.4
0.6
0.8
1
1.2
1.4
1 2 3 4 5 8 9 10 11 12 13 15 16
Sampler Number
Mas
s of
tota
l nitr
ogen
, mg
Figure D. 16. Mass of total nitrogen in the leach water of each sampler, 4/25/2007.

207
Mass of total nitrogen in leach water of each sampler, 5/29/2007
0
1
2
3
4
5
6
7
8
1 2 3 4 5 8 9 10 11 12 13 15 16
Sampler Number
Mas
s of
tota
l nitr
ogen
, mg
Figure D. 17. Mass of total nitrogen in the leach water of each sampler, 5/29/2007.
Mass of total nitrogen in leach water of each sampler, 6/28/2007
0
0.5
1
1.5
2
2.5
3
3.5
4
4.5
5
1 2 3 4 5 8 9 10 11 12 13 15 16
Sampler Number
Mas
s of
tota
l nitr
ogen
, mg
Figure D. 18. Mass of total nitrogen in the leach water of each sampler, 6/28/2007.

208
Mass of total nitrogen in leach water of each sampler, 7/31/2007
0
0.5
1
1.5
2
2.5
1 2 4 5 8 10 11 13 15 16
Sampler Number
Mas
s of
tota
l nitr
ogen
, mg
Figure D. 19. Mass of total nitrogen in the leach water of each sampler, 7/31/2007.
Mass of total nitrogen in leach water of each sampler, 8/31/2007
0
1
2
3
4
5
6
7
8
9
1 2 4 5 8 10 11 13 15 16
Sampler Number
Mas
s of
tota
l nitr
ogen
, mg
Figure D. 20. Mass of total nitrogen in the leach water of each sampler, 8/31/2007.

209
Mass of total nitrogen in leach water of each sampler, 9/28/2007
0
1
2
3
4
5
6
7
1 2 4 5 8 10 11 13 15 16
Sampler Number
Mas
s of
tota
l nitr
ogen
, mg
Figure D. 21. Mass of total nitrogen in the leach water of each sampler, 9/28/2007.

210
APPENDIX E
THE PLOTS OF SPATIAL DISTRIBUTION OF LEACHED SALT MASS

211
Mass of salt in leach water of each sampler, 10/07/2005
0
200
400
600
800
1000
1200
1400
1 2 3 4 5 6 7 8 9 10 11 12 13 14 15 16
Sampler Number
Mas
s of
sal
t, m
g
Figure E. 1. Mass of salt in the leach water of each sampler, 10/07/2005.
Mass of salt in leach water of each sampler, 11/28/2005
0
500
1000
1500
2000
2500
1 2 3 4 5 6 7 8 9 10 11 12 13 14 15 16
Sampler Number
Mas
s of
sal
t, m
g
Figure E. 2. Mass of salt in the leach water of each sampler, 11/28/2005.

212
Mass of salt in leach water of each sampler, 12/29/2005
0
20
40
60
80
100
120
140
160
180
200
1 2 3 4 5 6 7 8 9 10 11 12 13 14 15 16
Sampler Number
Mas
s of
sal
t, m
g
Figure E. 3. Mass of salt in the leach water of each sampler, 12/29/2005.
Mass of salt in leach water of each sampler, 2/10/2006
0
500
1000
1500
2000
2500
3000
3500
1 2 3 4 5 6 7 8 9 10 11 12 13 14 15 16
Sampler Number
Mas
s of
sal
t, m
g
Figure E. 4. Mass of salt in the leach water of each sampler, 2/10/2006.

213
Mass of salt in leach water of each sampler, 4/6/2006
0
500
1000
1500
2000
2500
3000
3500
4000
1 2 3 4 5 6 7 8 9 10 11 12 13 14 15 16
Sampler Number
Mas
s of
sal
t, m
g
Figure E. 5. Mass of salt in the leach water of each sampler, 4/6/2006.
Mass of salt in leach water of each sampler, 5/25/2006
0
200
400
600
800
1000
1200
1400
1600
1 2 3 4 5 6 7 8 9 10 11 12 13 14 15 16
Sampler Number
Mas
s of
sal
t, m
g
Figure E. 6. Mass of salt in the leach water of each sampler, 5/25/2006.

214
Mass of salt in leach water of each sampler, 6/16/2006
0
200
400
600
800
1000
1200
1 2 3 4 5 6 7 8 9 10 11 12 13 14 15 16
Sampler Number
Mas
s of
sal
t, m
g
Figure E. 7. Mass of salt in the leach water of each sampler, 6/16/2006.
Mass of salt in leach water of each sampler, 7/21/2006
0
200
400
600
800
1000
1200
1 2 3 4 5 8 9 10 11 12 13 15 16
Sampler Number
Mas
s of
sal
t, m
g
Figure E. 8. Mass of salt in the leach water of each sampler, 7/21/2006.

215
Mass of salt in leach water of each sampler, 9/1/2006
0
200
400
600
800
1000
1200
1400
1600
1800
2000
1 2 3 4 5 8 9 10 11 12 13 15 16
Sampler Number
Mas
s of
sal
t, m
g
Figure E. 9. Mass of salt in the leach water of each sampler, 9/1/2006.
Mass of salt in leach water of each sampler, 9/22/2006
0
500
1000
1500
2000
2500
3000
3500
1 2 3 4 5 8 9 10 11 12 13 15 16
Sampler Number
Mas
s of
sal
t, m
g
Figure E. 10. Mass of salt in the leach water of each sampler, 9/22/2006.

216
Mass of salt in leach water of each sampler, 10/12/2006
0
500
1000
1500
2000
2500
3000
3500
1 2 3 4 5 8 9 10 11 12 13 15 16
Sampler Number
Mas
s of
sal
t, m
g
Figure E. 11. Mass of salt in the leach water of each sampler, 10/12/2006.
Mass of salt in leach water of each sampler, 11/22/2006
0200400600800
1000
12001400160018002000
1 2 3 4 5 8 9 10 11 12 13 15 16
Sampler Number
Mas
s of
sal
t, m
g
Figure E. 12. Mass of salt in the leach water of each sampler, 11/22/2006

217
Mass of salt in leach water of each sampler, 1/9/2007
0
500
1000
1500
2000
2500
1 2 3 4 5 8 9 10 11 12 13 15 16
Sampler Number
Mas
s of
sal
t, m
g
Figure E. 13. Mass of salt in the leach water of each sampler, 1/9/2007.
Mass of salt in leach water of each sampler, 2/23/2007
0
200
400
600
800
1000
1200
1400
1600
1800
1 2 3 4 5 8 9 10 11 12 13 15 16
Sampler Number
Mas
s of
sal
t, m
g
Figure E. 14. Mass of salt in the leach water of each sampler, 2/23/2007.

218
Mass of salt in leach water of each sampler, 3/30/2007
0
500
1000
1500
2000
2500
3000
3500
1 2 3 4 5 8 9 10 11 12 13 15 16
Sampler Number
Mas
s of
sal
t, m
g
Figure E. 15. Mass of salt in the leach water of each sampler, 3/30/2007.
Mass of salt in leach water of each sampler, 4/25/2007
0
200
400
600
800
1000
1200
1400
1600
1 2 3 4 5 8 9 10 11 12 13 15 16
Sampler Number
Mas
s of
sal
t, m
g
Figure E. 16. Mass of salt in the leach water of each sampler, 4/25/2007.

219
Mass of salt in leach water of each sampler, 5/29/2007
0
500
1000
1500
2000
2500
3000
1 2 3 4 5 8 9 10 11 12 13 15 16
Sampler Number
Mas
s of
sal
t, m
g
Figure E. 17. Mass of salt in the leach water of each sampler, 5/29/2007.
Mass of salt in leach water of each sampler, 6/28/2007
0
500
1000
1500
2000
2500
1 2 3 4 5 8 9 10 11 12 13 15 16
Sampler Number
Mas
s of
sal
t, m
g
Figure E. 18. Mass of salt in the leach water of each sampler, 6/28/2007.

220
Mass of salt in leach water of each sampler, 7/31/2007
0
200
400
600
800
1000
1200
1400
1600
1 2 4 5 8 10 11 13 15 16
Sampler Number
Mas
s of
sal
t, m
g
Figure E. 19. Mass of salt in the leach water of each sampler, 7/31/2007.
Mass of salt in leach water of each sampler, 8/31/2007
0
500
1000
1500
2000
2500
3000
3500
4000
4500
1 2 4 5 8 10 11 13 15 16
Sampler Number
Mas
s of
sal
t, m
g
Figure E. 20. Mass of salt in the leach water of each sampler, 8/31/2007.

221
Mass of salt in leach water of each sampler, 9/28/2007
0
500
1000
1500
2000
2500
3000
3500
4000
1 2 4 5 8 10 11 13 15 16
Sampler Number
Mas
s of
sal
t, m
g
Figure E. 21. Mass of salt in the leach water of each sampler, 9/28/2007.