Embed Size (px)
Citation preview
Design of the Psychrometric Calorimeter Chamber of a Room Air
Conditioner Test Facility
ACRCTR-44
For additional information:
Air Conditioning and Refrigeration Center University of Illinois Mechanical & Industrial Engineering Dept. 1206 West Green Street Urbana, IL 61801
(217) 333-3115
J. E. Fleming and W. E. Dunn
July 1993
Prepared as part of ACRC Project 23 Room Air Conditioner Systems Analysis
W. E. Dunn. Principal Investigator
The Air Conditioning and Refrigeration Center was founded in 1988 with a grant from the estate of Richard W. Kritzer, the founder of Peerless of America Inc. A State of Illinois Technology Challenge Grant helped build the laboratory facilities. The ACRC receives continuing support from the Richard W. Kritzer Endowment and the National Science Foundation. Thefollowing organizations have also become sponsors of the Center.
Acustar Division of Chrysler Allied-Signal, Inc. Amana Refrigeration, Inc. Carrier Corporation Caterpillar, Inc. E. I. du Pont de Nemours & Co. Electric Power Research Institute Ford Motor Company General Electric Company Harrison Division of GM ICI Americas, Inc. Johnson Controls, Inc. Modine Manufacturing Co. Peerless of America, Inc. Environmental Protection Agency U. S. Anny CERL Whirlpool Corporation
For additional iriformation:
Air Conditioning & Refrigeration Center Mechanical & Industrial Engineering Dept. University of Illinois 1206 West Green Street Urbana IL 61801
2173333115
DESIGN OF THE PSYCHROMETRIC CALORIMETER CHAMBER OF A ROOM AIR CONDITIONER TEST FACILITY
Jonathan Edward Fleming, M.S.
Department of Mechanical and Industrial Engineering
University of Illinois at Urbana-Champaign, 1993
W. E. Dunn, Advisor
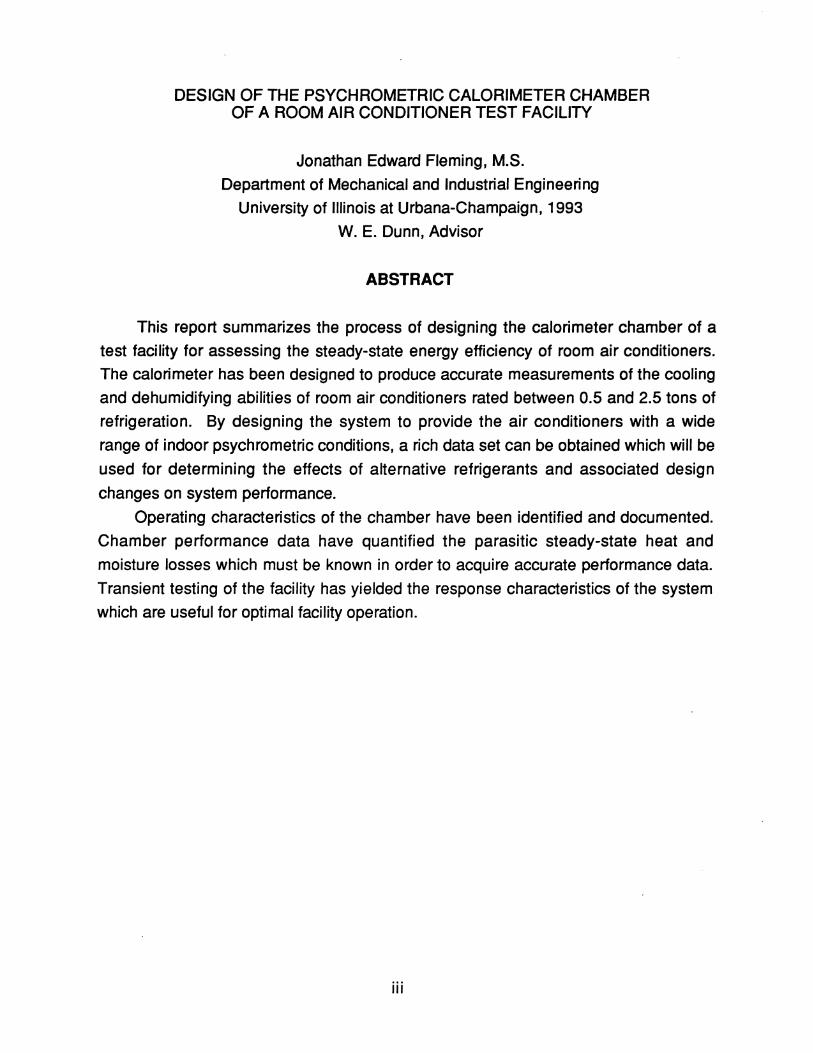
ABSTRACT
This report summarizes the process of designing the calorimeter chamber of a
test facility for assessing the steady-state energy efficiency of room air conditioners.
The calorimeter has been designed to produce accurate measurements of the cooling
and dehumidifying abilities of room air conditioners rated between 0.5 and 2.5 tons of
refrigeration. By designing the system to provide the air conditioners with a wide
range of indoor psychrometric conditions, a rich data set can be obtained which will be
used for determining the effects of alternative refrigerants and associated design
changes on system performance.
Operating characteristics of the chamber have been identified and documented.
Chamber performance data have quantified the parasitic steady-state heat and
moisture losses which must be known in order to acquire accurate performance data.
Transient testing of the facility has yielded the response characteristics of the system
which are useful for optimal facility operation.
iii

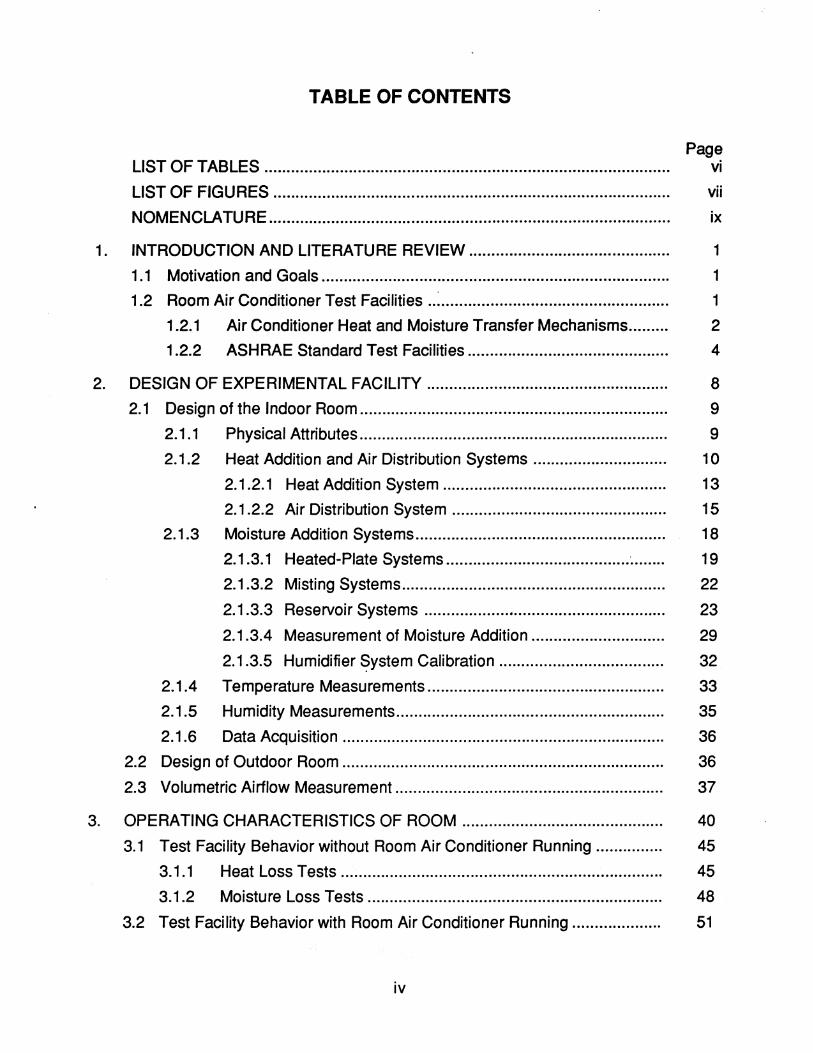
TABLE OF CONTENTS
Page LIST OF TABLES ...... ....... ..... .... .......... ........ ............. ........................ .............. vi
LIST OF FIGURES ......................................................................................... vii
NOMENCLATURE ................................ .......................................................... ix
1. INTRODUCTION AND LITERATURE REViEW............................................. 1
1.1 Motivation and Goals .... ............ ............. ...... ......... ...... ..................... ....... 1
1.2 Room Air Conditioner Test Facilities .. ~................................................... 1
1.2.1 Air Conditioner Heat and Moisture Transfer Mechanisms......... 2
1.2.2 ASH RAE Standard Test Facilities ............................................. 4
2. DESIGN OF EXPERIMENTAL FACILITY ...................................................... 8
2.1 Design of the Indoor Room ................................ ..................................... 9
2.1.1 Physical Attributes ................... ..... ..... ...... ............. ...... ...... ... ...... 9
2.1.2 Heat Addition and Air Distribution Systems .............................. 10
2.1 .2.1 Heat Addition System........ ....... ........ ............ .... ........... 13
2.1.2.2 Air Distribution System ................................................ 15
2.1.3 Moisture Addition Systems ................................ ........................ 18
2.1.3.1 Heated-Plate Systems ................................ .................. 19
2.1.3.2 Misting Systems........................................................... 22
2.1.3.3 Reservoir Systems ...................•.................................. 23
2.1.3.4 Measurement of Moisture Addition .............................. 29
2.1.3.5 Humidifier ~ystem Calibration ..................................... 32
2.1.4 Temperature Measurements ..................................................... 33
2.1.5 Humidity Measurements............................................................ 35
2.1.6 Data Acquisition ............................ .... ........................................ 36
2.2 Design of Outdoor Room ........................................................................ 36
2.3 Volumetric Airflow Measurement ............................................................ 37
3. OPERATING CHARACTERISTICS OF ROOM ............................................. 40
3.1 Test Facility Behavior without Room Air Conditioner Running ............... 45
3.1.1 Heat Loss Tests ........................................................................ 45
3.1.2 Moisture Loss Tests .................................................................. 48
3.2 Test Facility Behavior with Room Air Conditioner Running .................... 51
iv
3.2.1 Sensible Heat Addition Only ...................................................... 51
3.2.2 Sensible and Latent Heat Addition .. ...... ...... .................. ... ......... 54
3.2.3 Volumetric Airflow Measurement .............................................. 56
4. SUMMARY AND CONCLUSiONS.................................................................. 59
REFERENCES ........................................................................................................ 61
v
Table 3.1
Table 3.2
LIST OF TABLES
Page
Summary of Simple Model for Indoor-Room Calorimeter ............... 42
Indoor Room Operating Parameters ................................. ............. 57
vi

LIST OF FIGURES
Page
Figure 1.1 Room Air Conditioner Schematic ................................................... 3
Figure 1.2 Calibrated Room Calorimeter ...... ....... ................... .......... ............... 5
Figure 1.3 Balanced Ambient Room Calorimeter ............................ ...... .......... 7
Figure 2.1 Gasketing of Room Air Conditioner Window.................................. 11
Figure 2.2 Clamping of Room Air Conditioner Window................................... 1.2
Figure 2.3 Furnace Control System ........... ....................................... ............... 14
Figure 2.4 Indoor Air Distribution System ........................................................ 16
Figure 2.5 Hot Plate Humidifier ................................ ........................................ 20
Figure 2.6 Steam Pot Humidifier...................................................................... 25
Figure 2.7 Drum Humidifier .............................................................................. 28
Figure 2.8 Humidifier Control System ......... ............. ....... ... .............................. 30
Figure 2.9 Moisture Addition Measurement System ........................................ 31
Figure 2.10 Measured Humidifier Weight Change with 6 kW Heat Input .......... 34
Figure 2.11 Measured Humidifier Evaporation Rate .......................................... 34
Figure 2.12 Volumetric Airflow Measurement System ................................ ....... 38
Figure 3.1 Schematic of Heat and Moisture Transfers to and from Indoor Room.............................................................................................. 41
Figure 3.2 Heat Loss with Plugged Wall.......................................................... 47
Figure 3.3 Heat Loss with Air Conditioner in Wall ........................................... 47
Figure 3.4 Response of Indoor Room to Initial Humidification......................... 50
Figure 3.5 Response of Moist Indoor Room to Sudden Air Conditioner Operation .... ............... ... ..... ....... ...... ........ ...... ........ ............ .............. 50
Figure 3.6 Transient Response of Indoor Room.............................................. 53
Figure 3.7 Indoor Room Air Temperatures at Quasi-steady-state................... 53
vii
Figure 3.8 Humidity Response of Indoor Room to Change in Evaporation Rate ................................................................................................ 55
Figure 3.9 Evaporator Volumetric Airflow for Whirlpool 1 Ton Test Unit ......... 58
Figure 3.10 Condenser Volumetric Airflow for Whirlpool 1 Ton Test Unit ......... 58
viii
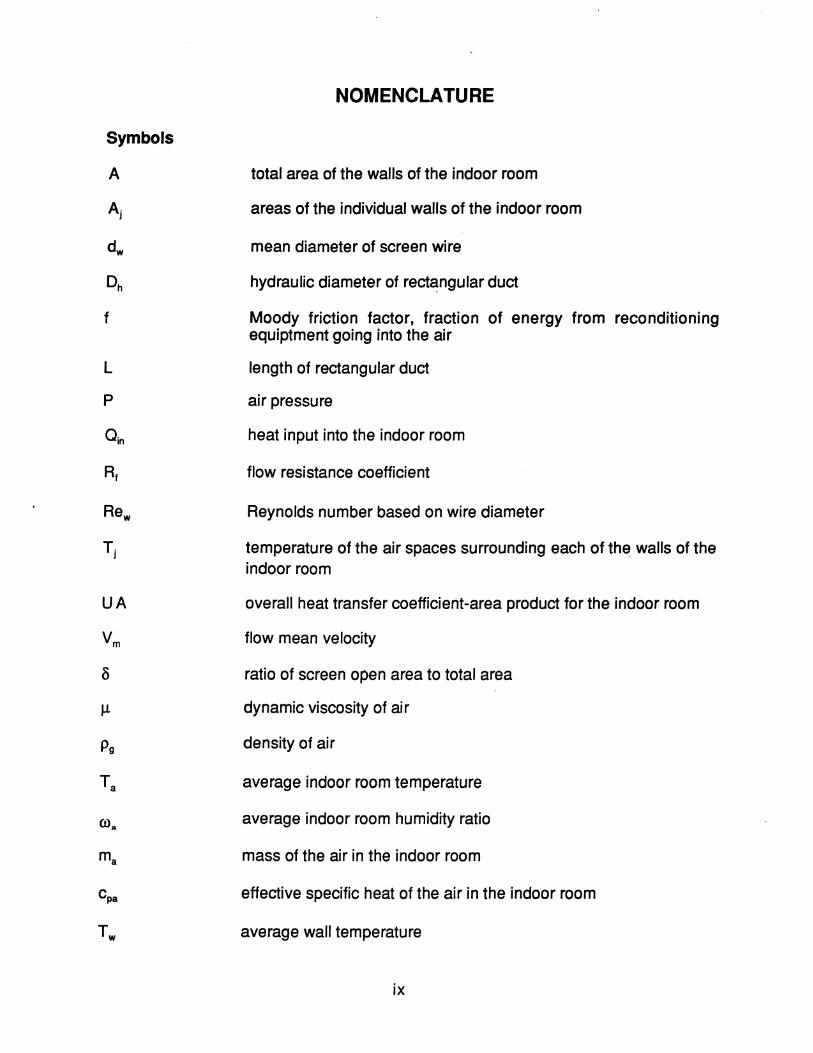
Symbols
A
f
L
p
UA
NOMENCLATURE
total area of the walls of the indoor room
areas of the individual walls of the indoor room
mean diameter of screen wire
hydraulic diameter of rect~ngular duct
Moody friction factor, fraction of energy from reconditioning equiptment going into the air
length of rectangular duct
air pressure
heat input into the indoor room
flow resistance coefficient
Reynolds number based on wire diameter
temperature of the air spaces surrounding each of the walls of the indoor room
overall heat transfer coefficient-area product for the indoor room
flow mean velocity
ratio of screen open area to total area
dynamic viscosity of ai r
density of air
average indoor room temperature
average indoor room humidity ratio
mass of the air in the indoor room
effective specific heat of the air in the indoor room
average wall temperature
ix
cpw
A1
Tamb
Acronyms
ASH RAE
mass of the walls
effective specific heat if the walls
rate of thermal energy addition by reconditioning equiptment
rate of moisture addition by reconditioning equiptment
rate at which the air and walls of the room exchange heat
overall heat transfer coefficient between the walls and air
contact area between the walls and air
area-weighted average temperature of the ambient
rate of heat exchange to the ambient
overall heat transfer coefficient between the walls and the ambient
contact area between the walls and the ambient
effective mass transfer coefficient between the indoor and outdoor rooms
effective mass transfer area between the indoor and outdoor rooms
average humidity ratio for the outdoor room
rate of heat removal by the test unit
rate of moisture removal by the test unit
constants used in the solution of the indoor room model
parameters used in the solution of the indoor room model
eigenvalues used in the solution of the indoor room model
American Society of Heating, Refrigerating, and Air-Condtioning Engineers
x
EER Energy Efficiency Ratio = ratio of the heat removal rate of an air conditioner in Btu/hr to its power requirement in W
xi

1. INTRODUCTION AND LITERATURE REVIEW
1.1 Motivation and Goals
Due to tightening of government mandated energy-efficiency standards on
household appliances (NAECA 1987) as well as the commonly held belief that
chlorofluorocarbons (CFCs) deplete the stratospheric ozone layer, there has been
much interest in determining the energy performance implications of room air
conditioner design changes and refrigerant substitution. The United Nations' Montreal
Protocol defined a structure for the eventual elimination of ozone-depleting substances
(United Nations 1987). The phaseout deadline for CFCs has been set for 1996 (Miro
1993) and, consequently, recent pressure to meet this deadline has been felt in CFC
related fields. The working fluid in room air conditioner systems is R22, a
hydrochlorofluorocarbon (HCFC), which does not have as great an ozone-depletion
potential as a CFC. Consequently, the phaseout schedule for the production and use
of this compound is not as immediate as it is for CFCs. However, there is concern in
the air-conditioning and refrigeration community about the possibility of increased
pressure from either the EPA or the United Nations for quicker phaseout of HCFCs
(ASHRAE 1993; Miro 1993). The search for alternative refrigerants for R22 coupled
with governmental demand for higher-efficiency appliances has created a great need
for performance evaluation.
The purpose of this paper is to (a) describe the process of designing the
calorimeter chamber of a room air conditioner test facility, (b) describe the behavioral
characteristics of the facility and (c) provide some validation of its utility. This design
work has been conducted in order to produce accurate performance data for validating
the Oak Ridge National Laboratory Heat Pump Model as modified for room air
conditioners. Validation of this model or a derivative of the model for R22 and its
alternatives will yield a product which can accurately simulate room air conditioner
performance without the need for expensive and time-consuming testing. Throughout
the development of model validation and/or modification, performance data will be
used to determine the effects of design changes and alternative refrigerants on system
performance.
1.2 Room Air Conditioner Test Facilities
The purpose of the test facility is to collect performance data on room air
conditioners. As prescribed by the American Society of Heating Refrigerating and Air-
1
Conditioning Engineers (ASHRAE), these measurements are to include air-side data
on (a) cooling capacity, (b) moisture removal capability and (c) air mass flow rates
through each heat exchanger of the air conditioner (ASHRAE 1984). As well as these
measurements, our facility will be equipped to make complementary refrigerant-side
cooling measurements. However, the concern of this work is primarily with the air-side
measurements specified by ASH RAE.
1.2.1 Air Conditioner Heat and Moisture Transfer Mechanisms
An important concern in the design of a room air conditioner test facility are the
heat and mass transfer mechanisms of the air conditioner. For this reason, a
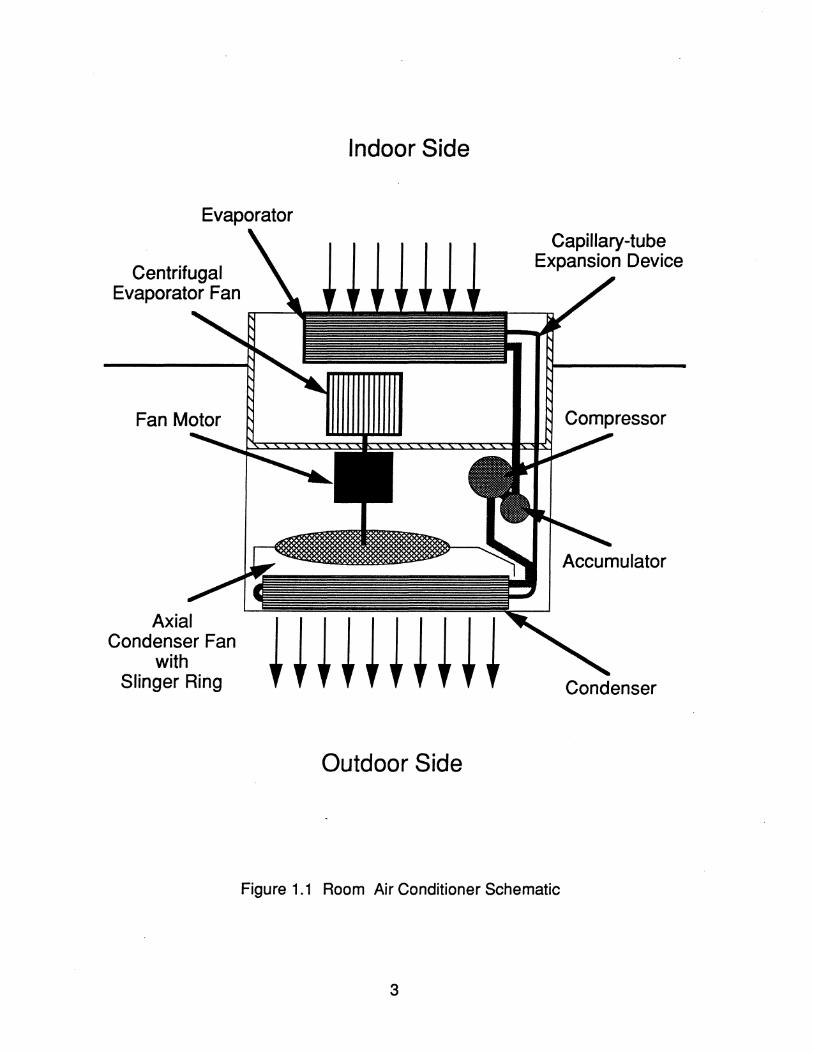
discussion of the workings of a room air conditioner is warranted. Figure 1.1 shows a
schematic of the top view of a typical room air conditioner. A compressor does work
on low pressure R22 and raises the pressure and temperature of the gas to a level
where the temperature is greater than outdoor temperature. This gas is then forced
through a fin-and-tube condenser where it transfers heat to the outdoor air with help
from an axial fan and thus becomes liquid or a two-phase mixture. This product is
forced through a capillary-tube expansion device which lowers the temperature of the
now two-phase refrigerant to a level which is below indoor temperature. The two
phase mixture is then forced through a fin-and-tube evaporator where it gains heat
from the indoor air with help from a centrifugal fan and thus increases in quality or fully
evaporates. The evaporator exit condition may be vapor, in which case it goes directly
into the compressor to repeat the thermodynamic cycle. Otherwise, the liquid portion
of the two-phase exit condition is separated from the bulk flow in an accumulator. As
soon as the necessary heat for evaporation is transferred to the liquid by the gas or
through the accumulator shell by the outdoor air, the refrigerant will rejoin the flow.
The air conditioner has the capability to remove heat from the indoor room through
heat transfer to the evaporator and can reject heat to the outdoor air through heat
transfer from the condenser.
A more subtle attribute of the air conditioner is the ability to transfer moisture from
the indoor air to the outdoor air. When the air conditioner is operating at an indoor
room condition with a dew pOint temperature higher than the evaporator coil
temperature, the coil condenses moisture out of the air which then drips into a
collecting pan. From here, it flows downhill through a channel in the floor of the air
conditioner until it reaches another collecting pan situated beneath the condenser fan
in the outdoor space. This fan has a cupped ring, commonly known as a "slinger ring",
2
Evaporator
Centrifugal Evaporator Fan
Axial Condenser Fan
with Slinger Ring
Indoor Side
Outdoor Side
Capillary-tube Expansion Device
Condenser
Figure 1.1 Room Air Conditioner Schematic
3
attached to the outer edge of the fan blades which lifts water out of the collecting pan
and throws it on the fin-and-tube condenser. This water enhances heat transfer to the
air by evaporating off the condenser which alrows moisture transfer to occur between
the indoor room and the outdoor room.
1.2.2 ASH RAE Standard Test Facilities
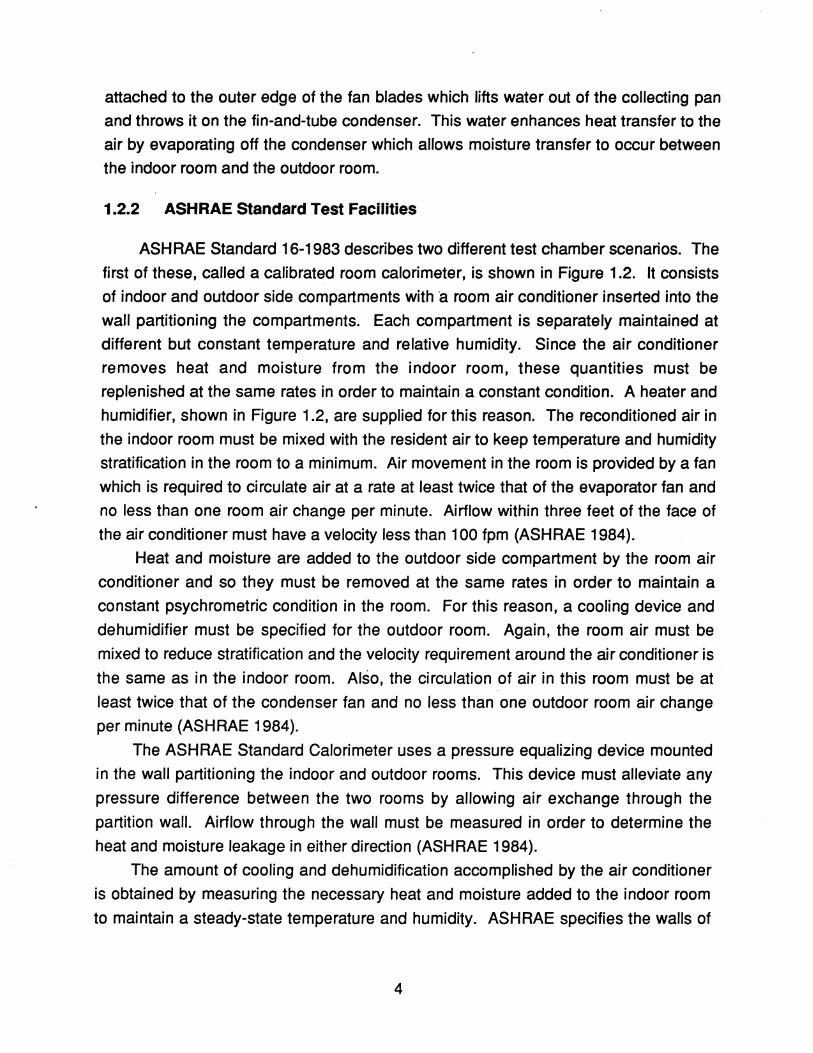
ASH RAE Standard 16-1983 describes two different test chamber scenarios. The
first of these, called a calibrated room calorimeter, is shown in Figure 1.2. It consists
of indoor and outdoor side compartments with'a room air conditioner inserted into the
wall partitioning the compartments. Each compartment is separately maintained at
different but constant temperature and relative humidity. Since the air conditioner
removes heat and moisture from the indoor room, these quantities must be
replenished at the same rates in order to maintain a constant condition. A heater and
humidifier, shown in Figure 1.2, are supplied for this reason. The reconditioned air in
the indoor room must be mixed with the resident air to keep temperature and humidity
stratification in the room to a minimum. Air movement in the room is provided by a fan
which is required to circulate air at a rate at least twice that of the evaporator fan and
no less than one room air change per minute. Airflow within three feet of the face of
the air conditioner must have a velocity less than 100 fpm (ASH RAE 1984).
Heat and moisture are added to the outdoor side compartment by the room air
conditioner and so they must be removed at the same rates in order to maintain a
constant psychrometric condition in the room. For this reason, a cooling device and
dehumidifier must be specified for the outdoor room. Again, the room air must be
mixed to reduce stratification and the velocity requirement around the air conditioner is
the same as in the indoor room. Also, the circulation of air in this room must be at
least twice that of the condenser fan and no less than one outdoor room air change
per minute (ASHRAE 1984).
The ASHRAE Standard Calorimeter uses a pressure equalizing device mounted
in the wall partitioning the indoor and outdoor rooms. This device must alleviate any
pressure difference between the two rooms by allowing air exchange through the
partition wall. Airflow through the wall must be measured in order to determine the
heat and moisture leakage in either direction (ASHRAE 1984).
The amount of cooling and dehumidification accomplished by the air conditioner
is obtained by measuring the necessary heat and moisture added to the indoor room
to maintain a steady-state temperature and humidity. ASHRAE specifies the walls of
4
CJ1
Pressure Equalizing Device
Cooler ~~
Dehumidifier .... ~
Fan ~C>O
Mixers ~X X X
:~~~~~~
Outdoor Side Compartment
li
Indoor Side Compartment
Figure 1.2 Calibrated Room Calorimeter
~1!i Heater
I'- Humidifier
c)c)" Fan
Y" Mixers
the chamber to be made of a non-porous material with all joints sealed to prevent air
and moisture leakage. Since the chamber will be moisture-sealed, the
dehumidification of the air conditioner can be quantified by measuring the amount of
moisture added to the room. Heat loss from the chamber must be calibrated in order
to determine the sensible cooling accomplished by the air conditioner. By measuring
the heat added to the indoor room and adjusting this by the heat lost or gained through
the walls, the sensible cooling will be determined (ASHRAE 1984).
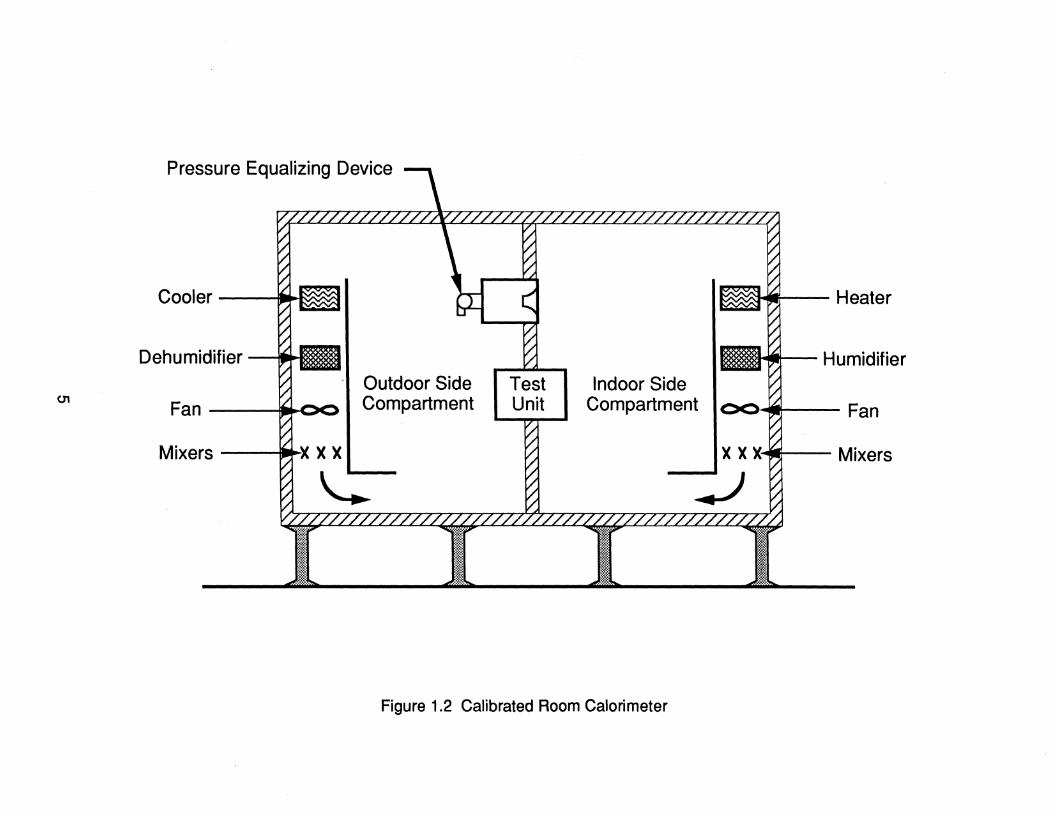
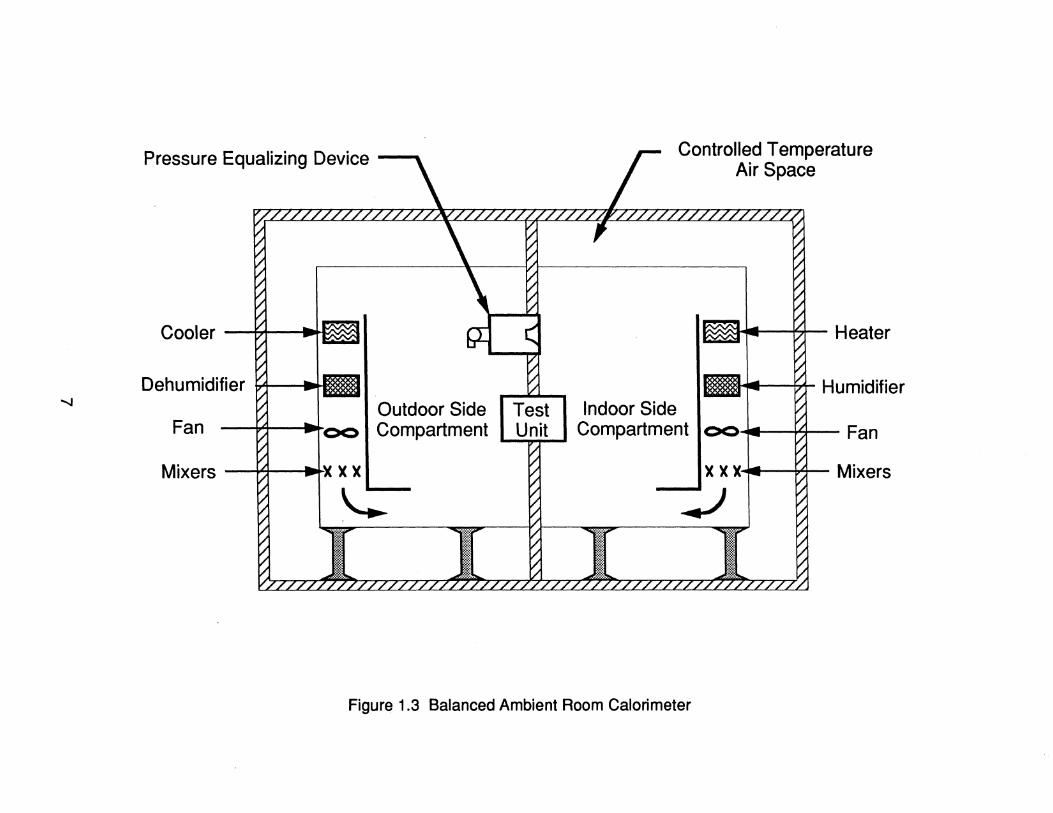
The second chamber design described by ASHRAE and shown in Figure 1.3 is
called the balanced ambient calorimeter. The only difference between this chamber
and the previous one is the existence of a controlled-temperature air space around it.
This air space is maintained at the same temperature as the indoor side compartment.
In this manner, the only heat loss from the indoor room will be through the partition
wall. This approach allows for a more reliable sensible cooling measurement since
one need only calibrate the heat transfer between the two compartments(ASHRAE
1984}.
6
.....,
Pressure Equalizing Device ..
Cooler
Dehumidifier Outdoor Side
Fan Compartment
~ ~XXXL Mixers
'-.:
Test Unit
Indoor Side
Controlled Temperature Air Space
Heater
Humidifier
Compartment loon ~an x x x Mixers
-;.J
Figure 1.3 Balanced Ambient Room Calorimeter
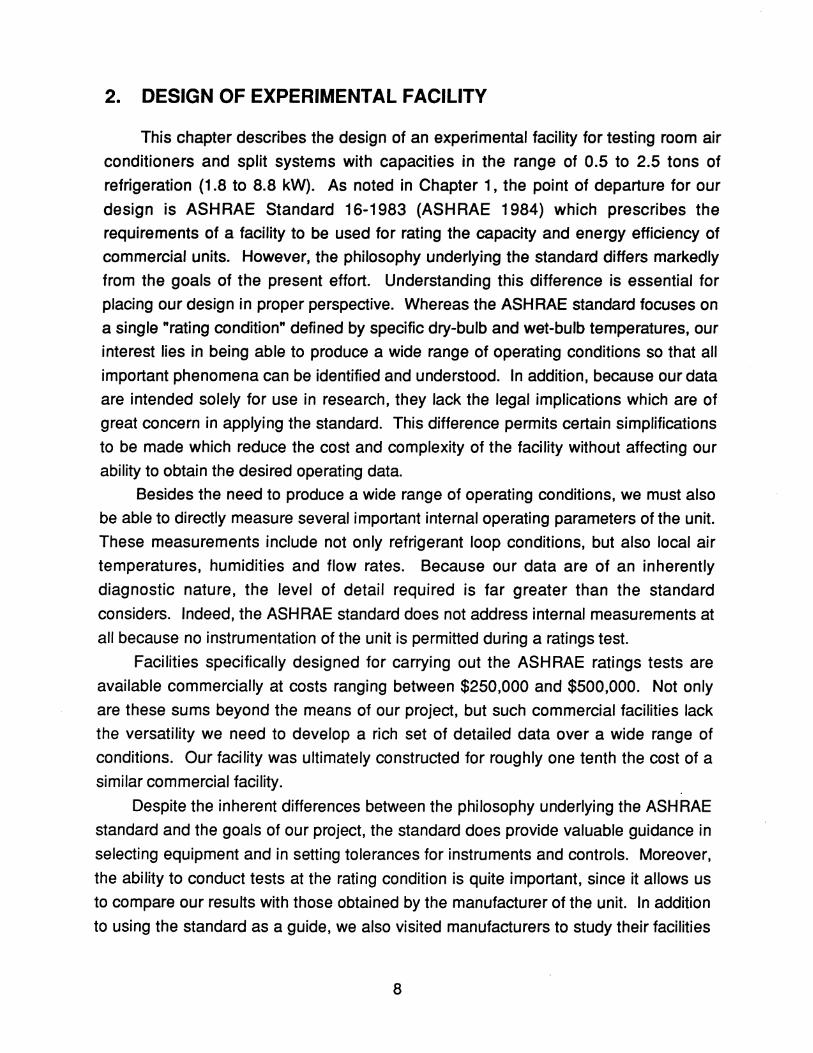
2. DESIGN OF EXPERIMENTAL FACILITY
This chapter describes the design of an experimental facility for testing room air
conditioners and split systems with capacities in the range of 0.5 to 2.5 tons of
refrigeration (1.8 to 8.8 kW). As noted in Chapter 1, the point of departure for our
design is ASHRAE Standard 16-1983 (ASHRAE 1984) which prescribes the
requirements of a facility to be used for rating the capacity and energy efficiency of
commercial units. However, the philosophy underlying the standard differs markedly
from the goals of the present effort. Understanding this difference is essential for
placing our design in proper perspective. Whereas the ASHRAE standard focuses on
a single "rating condition" defined by specific dry-bulb and wet-bulb temperatures, our
interest lies in being able to produce a wide range of operating conditions so that all
important phenomena can be identified and understood. In addition, because our data
are intended solely for use in research, they lack the legal implications which are of
great concern in applying the standard. This difference permits certain simplifications
to be made which reduce the cost and complexity of the facility without affecting our
ability to obtain the desired operating data.
Besides the need to produce a wide range of operating conditions, we must also
be able to directly measure several important internal operating parameters of the unit.
These measurements include not only refrigerant loop conditions, but also local air
temperatures, humidities and flow rates. Because our data are of an inherently
diagnostic nature, the level of detail required is far greater than the standard
considers. Indeed, the ASHRAE standard does not address internal measurements at
all because no instrumentation of the unit is permitted during a ratings test.
Facilities specifically designed for carrying out the ASHRAE ratings tests are
available commercially at costs ranging between $250,000 and $500,000. Not only
are these sums beyond the means of our project, but such commercial facilities lack
the versatility we need to develop a rich set of detailed data over a wide range of
conditions. Our facility was ultimately constructed for roughly one tenth the cost of a
similar commercial facility.
Despite the inherent differences between the philosophy underlying the ASHRAE
standard and the goals of our project, the standard does provide valuable guidance in
selecting equipment and in setting tolerances for instruments and controls. Moreover,
the ability to conduct tests at the rating condition is quite important, since it allows us
to compare our results with those obtained by the manufacturer of the unit. In addition
to using the standard as a guide, we also visited manufacturers to study their facilities
8
and to take advantage of their many years of experience in conducting ratings tests.
These visits proved very valuable in focusing our efforts and in providing insights into
how one might best design and control a facility of the type desired. In some cases,
these ideas were directly transferable to our design, and, in others, the idea was
modified to accommodate our somewhat different purpose.
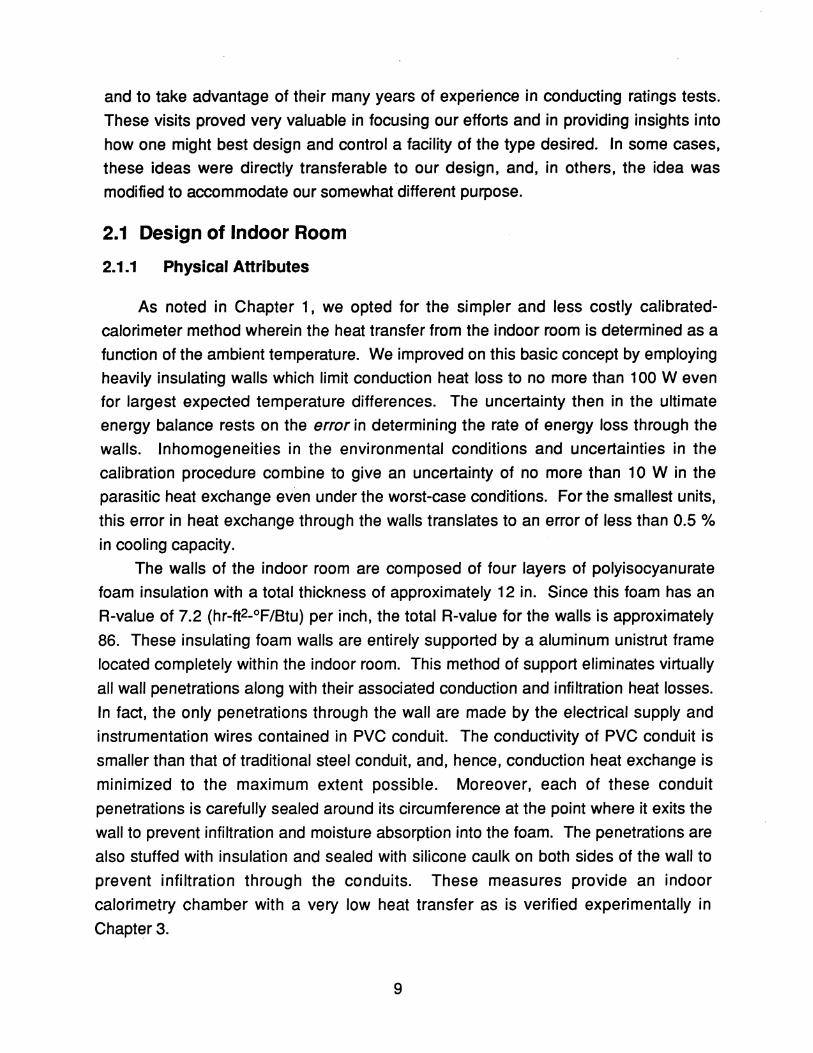
2.1 Design of Indoor Room
2.1.1 Physical Attributes
As noted in Chapter 1, we opted for the simpler and less costly calibrated
calorimeter method wherein the heat transfer from the indoor room is determined as a
function of the ambient temperature. We improved on this basic concept by employing
heavily insulating walls which limit conduction heat loss to no more than 100 W even
for largest expected temperature differences. The uncertainty then in the ultimate
energy balance rests on the error in determining the rate of energy loss through the
walls. Inhomogeneities in the environmental conditions and uncertainties in the
calibration procedure combine to give an uncertainty of no more than 10 W in the
parasitic heat exchange even under the worst-case conditions. For the smallest units,
this error in heat exchange through the walls translates to an error of less than 0.5 %
in cooling capacity.
The walls of the indoor room are composed of four layers of polyisocyanurate
foam insulation with a total thickness of approximately 12 in. Since this foam has an
R-value of 7.2 (hr-ft2_oF/Btu) per inch, the total R-value for the walls is approximately
86. These insulating foam walls are entirely supported by a aluminum unistrut frame
located completely within the indoor room. This method of support eliminates virtually
all wall penetrations along with their associated conduction and infiltration heat losses.
In fact, the only penetrations through the wall are made by the electrical supply and
instrumentation wires contained in PVC conduit. The conductivity of PVC conduit is
smaller than that of traditional steel conduit, and, hence, conduction heat exchange is
minimized to the maximum extent possible. Moreover, each of these conduit
penetrations is carefully sealed around its circumference at the point where it exits the
wall to prevent infiltration and moisture absorption into the foam. The penetrations are
also stuffed with insulation and sealed with silicone caulk on both sides of the wall to
prevent infiltration through the conduits. These measures provide an indoor
calorimetry chamber with a very low heat transfer as is verified experimentally in
Chapter 3.
9
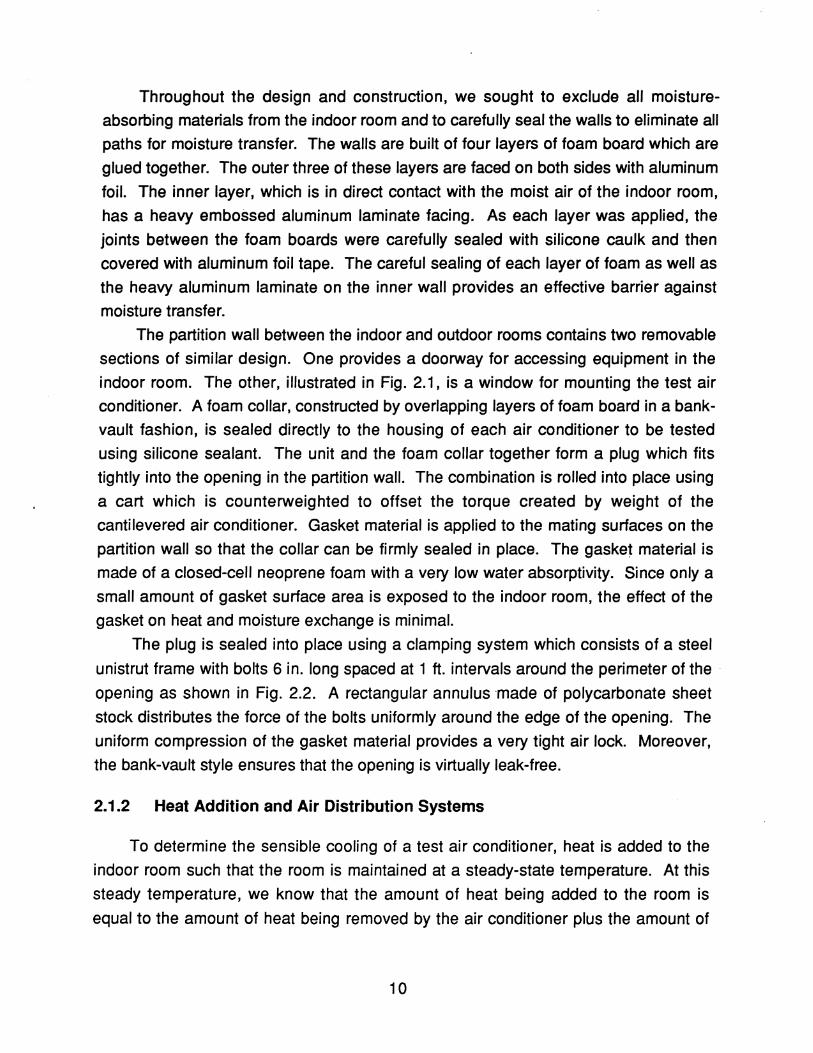
Throughout the design and construction, we sought to exclude all moisture
absorbing materials from the indoor room and to carefully seal the walls to eliminate all
paths for moisture transfer. The walls are built of four layers of foam board which are
glued together. The outer three of these layers are faced on both sides with aluminum
foil. The inner layer, which is in direct contact with the moist air of the indoor room,
has a heavy embossed aluminum laminate facing. As each layer was applied, the
joints between the foam boards were carefully sealed with silicone caulk and then
covered with aluminum foil tape. The careful sealing of each layer of foam as well as
the heavy aluminum laminate on the inner wall provides an effective barrier against
moisture transfer.
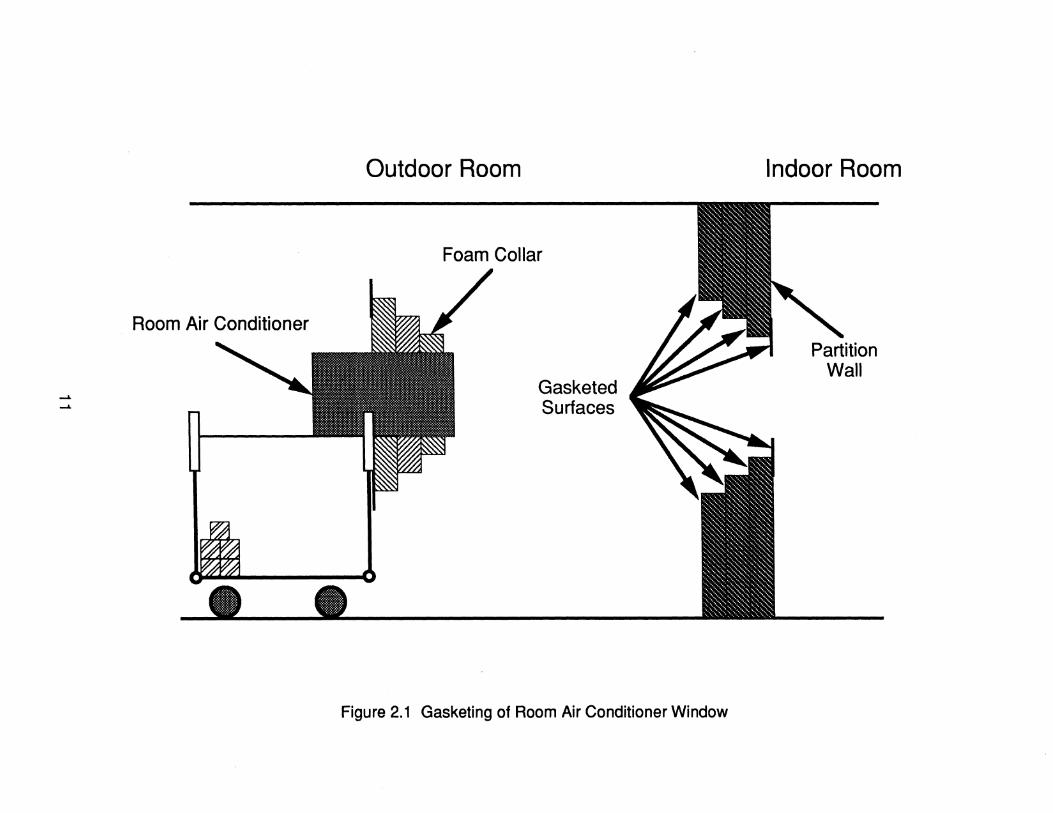
The partition wall between the indoor and outdoor rooms contains two removable
sections of similar design. One provides a doorway for accessing equipment in the
indoor room. The other, illustrated in Fig. 2.1, is a window for mounting the test air
conditioner. A foam collar, constructed by overlapping layers of foam board in a bank
vault fashion, is sealed directly to the housing of each air conditioner to be tested
using silicone sealant. The unit and the foam collar together form a plug which fits
tightly into the opening in the partition wall. The combination is rolled into place using
a cart which is counterweighted to offset the torque created by weight of the
cantilevered air conditioner. Gasket material is applied to the mating surfaces on the
partition wall so that the collar can be firmly sealed in place. The gasket material is
made of a closed-cell neoprene foam with a very low water absorptivity. Since only a
small amount of gasket surface area is exposed to the indoor room, the effect of the
gasket on heat and moisture exchange is minimal.
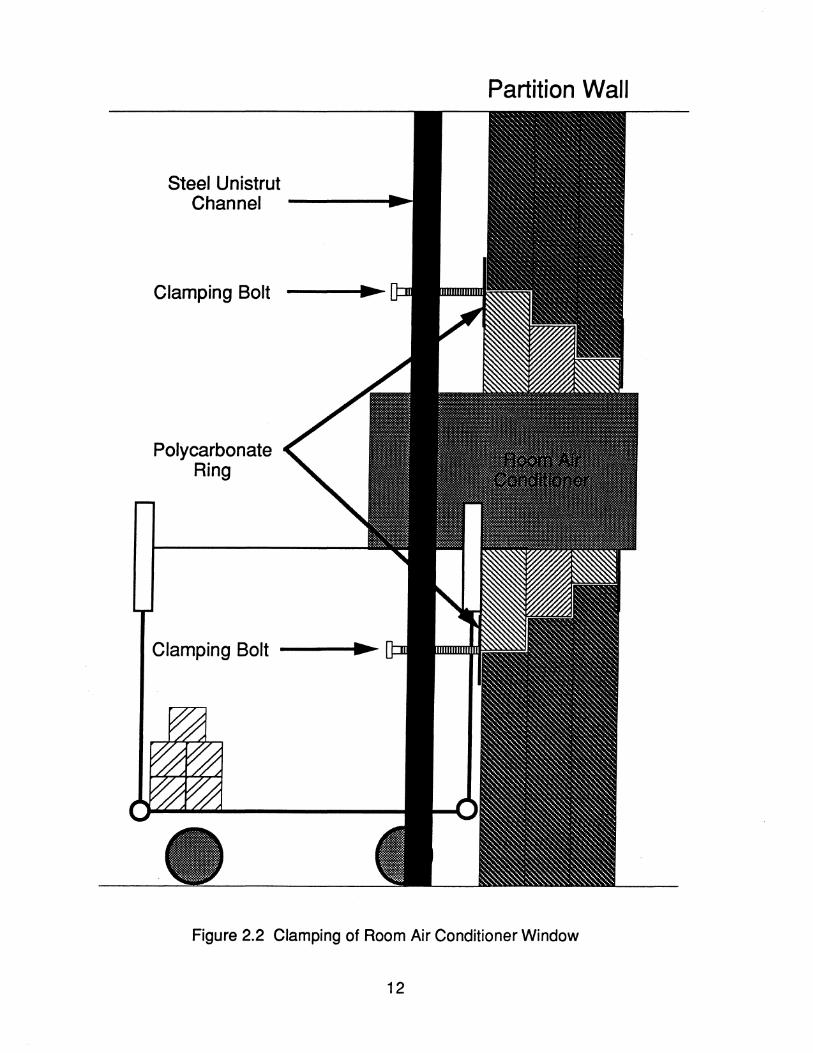
The plug is sealed into place using a clamping system which consists of a steel
unistrut frame with bolts 6 in. long spaced at 1 ft. intervals around the perimeter of the
opening as shown in Fig. 2.2. A rectangular annulus made of polycarbonate sheet
stock distributes the force of the bolts uniformly around the edge of the opening. The
uniform compression of the gasket material provides a very tight air lock. Moreover,
the bank-vault style ensures that the opening is virtually leak-free.
2.1.2 Heat Addition and Air Distribution Systems
To determine the sensible cooling of a test air conditioner, heat is added to the
indoor room such that the room is maintained at a steady-state temperature. At this
steady temperature, we know that the amount of heat being added to the room is
equal to the amount of heat being removed by the air conditioner plus the amount of
10
......
......
Room Air Conditioner
Outdoor Room
Foam Collar
Gasketed Surfaces
Figure 2.1 Gasketing of Room Air Conditioner Window
Indoor Room
Steel Unistrut Channel ----~
Clamping Bolt
Polycarbonate Ring
Clamping Bolt ---~
Partition Wall
Figure 2.2 Clamping of Room Air Conditioner Window
12
heat which is lost through the chamber walls. We can calibrate the total heat loss from
the room and measure the amount of power consumed by the electric heaters to
determine the total sensible cooling achieved by the air conditioner.
2.1 .2.1 Heat Addition System
The facility must be designed to test air conditioners rated from 0.5 to 2.5 tons
(1.76 to 8.8 kW) of cooling, which dictates supplying a continuously variable heat load
over this range to balance a 100% sensible cooling load. The maximum heat loss
through the walls will be on the order of 100 W, which must also be supplied by the
heating element. We sized our maximum heat input requirement to be 10 kW based
on the capacity of the test units, the maximum heat loss from the room, and the
consideration that the units might have larger capacities at non-rating conditions.
Continuously varying the heat load can be achieved easily by using a time-proportional
control system, which will be discussed later.
The first method that we investigated for adding heat to the room was to use 1 ft
by 4 ft silicone mat heaters mounted on aluminum plates a few inches away from the
walls of the chamber. These would be uniformly distributed along the walls and would
therefore add heat to the room in a uniform manner. Fans would be added to the
system to assist the heat transfer to the air and to meet the ASH RAE standard for air
circulation in the room. This idea, however, was not incorporated because we realized
the potential benefit of using an electric furnace for heat addition. The furnace
provides a packaged unit containing a blower and a resistance coil mounted in a steel
duct. This unit is significantly cheaper than a system of plate heaters and was much
more convenient to implement into our facility.
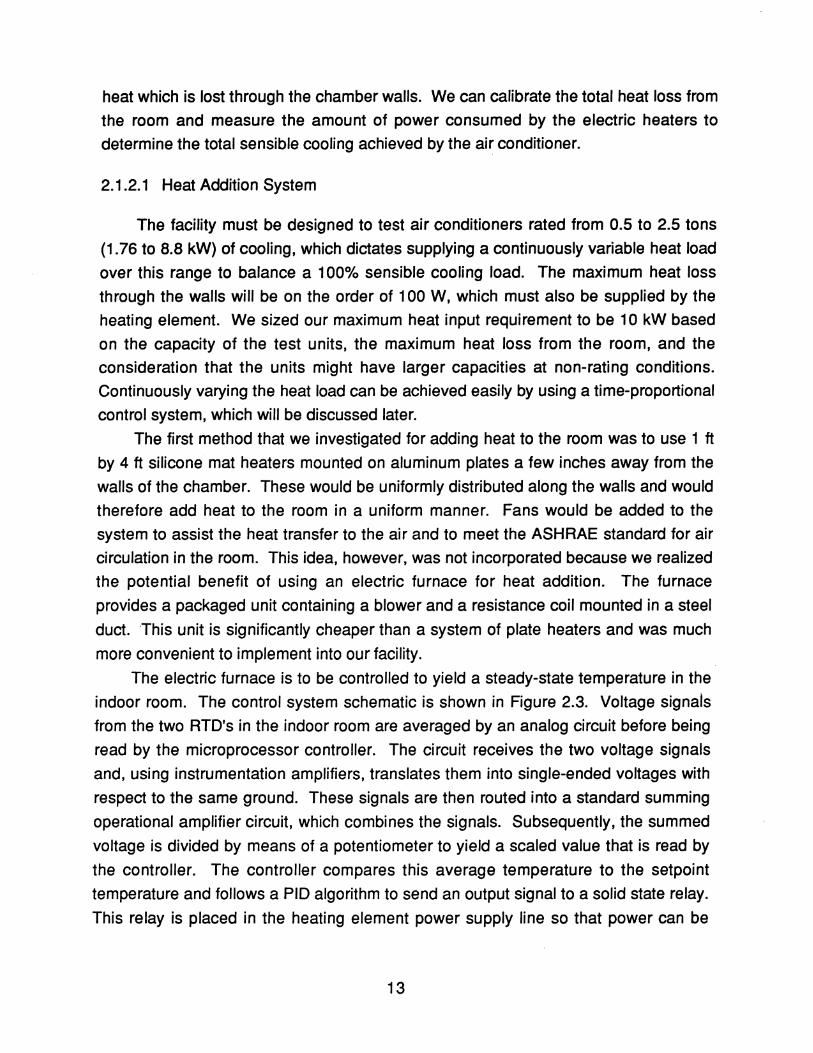
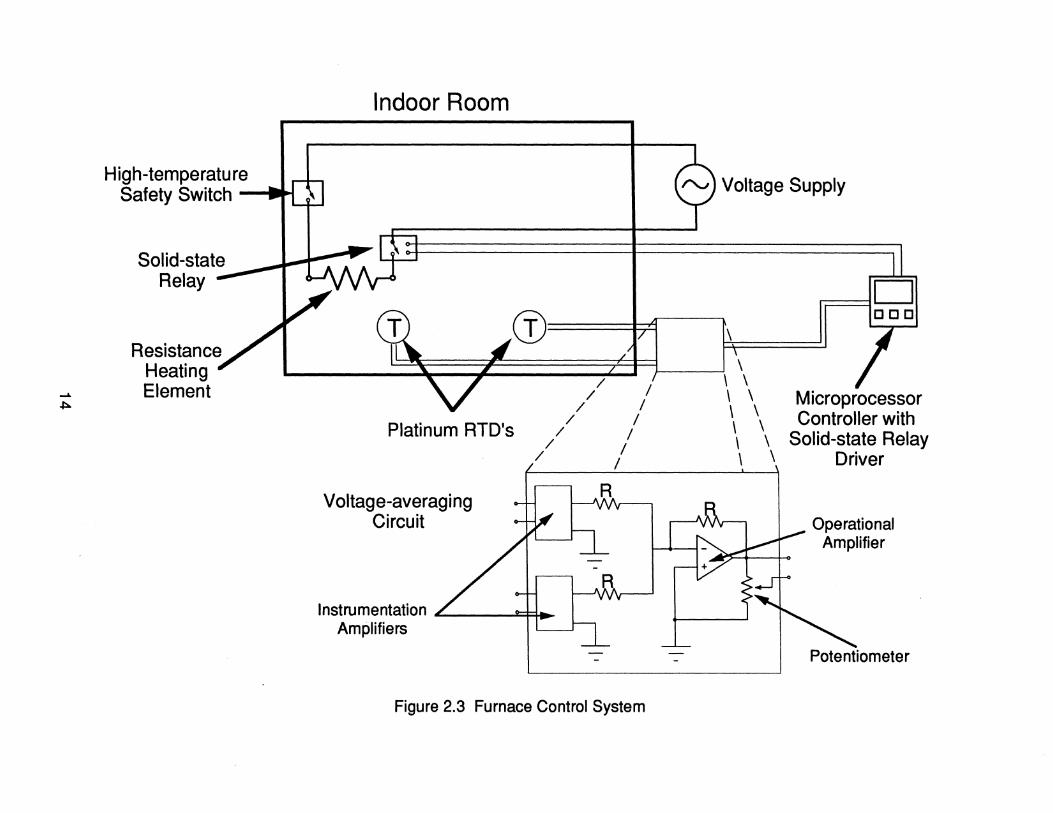
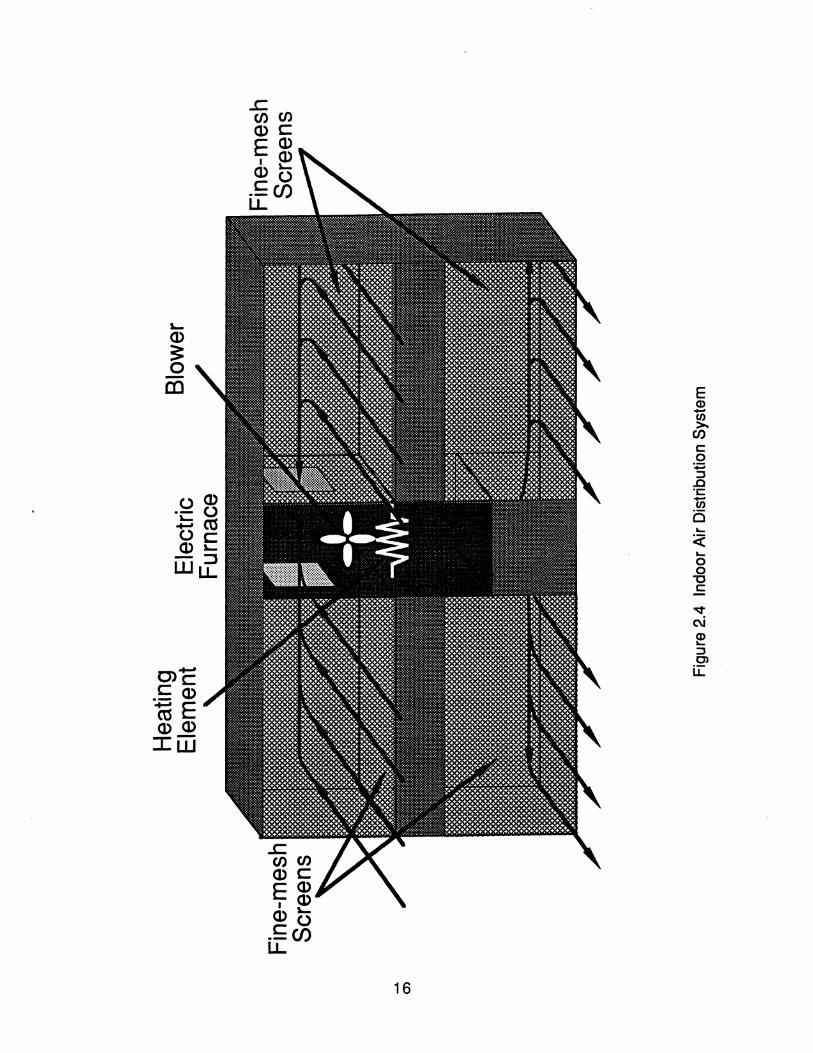
The electric furnace is to be controlled to yield a steady-state temperature in the
indoor room. The control system schematic is shown in Figure 2.3. Voltage signals
from the two RTO's in the indoor room are averaged by an analog circuit before being
read by the microprocessor controller. The circuit receives the two voltage signals
and, using instrumentation amplifiers, translates them into single-ended voltages with
respect to the same ground. These signals are then routed into a standard summing
operational amplifier circuit, which combines the signals. Subsequently, the summed
voltage is divided by means of a potentiometer to yield a scaled value that is read by
the controller. The controller compares this average temperature to the setpoint
temperature and follows a PIO algorithm to send an output signal to a solid state relay.
This relay is placed in the heating element power supply line so that power can be
13
......
.(::0.
High-temperature Safety Switch .. I
Solid-state Relay
Indoor Room
rv 1 Voltage Supply
CD j/l [\ II DOD
Resistance Heating Element
I I' 1t7 i. I I ~ < I ' I r ? _ _ __ --.l. \
Platinum RTD's
Voltag e-averag i ng Circuit
// / \ \ / / \ \
/ / \ \ // / \ \
/ / \ \ / \ \
R
Instrumentation , tH-. Amplifiers
Figure 2.3 Furnace Control System
Microprocessor Controller with
Solid-state Relay Driver
Operational Amplifier
Potentiometer
time-proportionally applied to the element. The controller will drive the relay closed for
a certain percentage of its duty cycle, and then open for the remaining percentage to
modulate the amount of heating done by the resistive element. The percentage of the duty cycle for which the relay is closed is determined by the controller PID algorithm
based on the setpoint and room temperatures. Using this control system, one can maintain a constant average temperature in the indoor room. Figure 2.3 also shows a
high-temperature safety switch in the heating element power line which terminates power to the element if the furnace high-temperature limit is exceeded.
Measurement of the power consumed by the electric furnace (and the humidifier,
which is discussed in later sections) will be accomplished by a device which is designed for power measurement of non-standard waveforms, including "chopped"
waveforms. This system will be detailed in a forthcoming document by Feller (1993). The accuracy of the power measurement device is expected to be 0.5% of the
maximum input power.
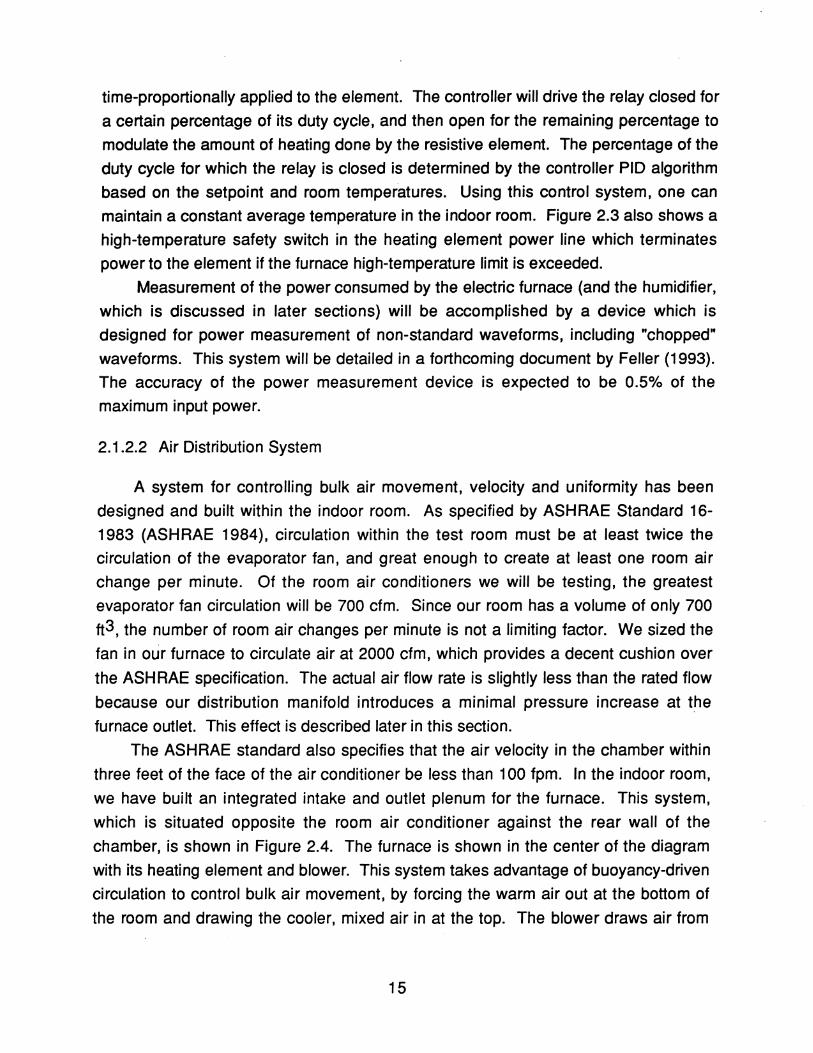
2.1.2.2 Air Distribution System
A system for controlling bulk air movement, velocity and uniformity has been
designed and built within the indoor room. As specified by ASHRAE Standard 16-1983 (ASHRAE 1984), circulation within the test room must be at least twice the circulation of the evaporator fan, and great enough to create at least one room air change per minute. Of the room air conditioners we will be testing, the greatest evaporator fan circulation will be 700 cfm. Since our room has a volume of only 700
ft3, the number of room air changes per minute is not a limiting factor. We sized the
fan in our furnace to circulate air at 2000 cfm, which provides a decent cushion over
the ASHRAE specification. The actual air flow rate is slightly less than the rated flow
because our distribution manifold introduces a minimal pressure increase at the
furnace outlet. This effect is described later in this section.
The ASHRAE standard also specifies that the air velocity in the chamber within
three feet of the face of the air conditioner be less than 100 fpm. In the indoor room,
we have built an integrated intake and outlet plenum for the furnace. This system,
which is situated opposite the room air conditioner against the rear wall of the
chamber, is shown in Figure 2.4. The furnace is shown in the center of the diagram
with its heating element and blower. This system takes advantage of buoyancy-driven
circulation to control bulk air movement, by forcing the warm air out at the bottom of
the room and drawing the cooler, mixed air in at the top. The blower draws air from
15
uO) .- U ~rn Uc 0)'--::) Wu.
O)+-" CC ._ 0)
-asE 0)0) Iw
£. (/)(/) o)c EO) .0) 0)'-c U .- C/) u.
£. (/)(/) o)c EO) .0) 0)'-c U .- C/) u.
16
E Q) -~ C o
:;:; ::J .c "C
"~ o ... « ... o .g C
both sides of the room through vertical fine-mesh screens, into a plenum, and then
down through the furnace. Air exits the furnace from below and is routed to the sides
into separate plenum chambers. From there the air emerges through another set of
vertical screens back into the room. By using the exit plenum chambers as diffusers,
the exit air velocity is reduced to a value well below the specified 100 fpm limit within
three feet of the air conditioner face.
By using screens on the face of each exit plenum, a great resistance to flow is
presented to the furnace exit air in the direction perpendicular to the screen. This
causes the air to move longitudinally in the plenum duct. As long as the frictional
pressure drop induced by the walls of the plenum is much smaller than the pressure
drop introduced by the screen, the flow will have a tendency to move along the plenum
and fill the chamber before being forced to exit through the screens. Since the
chamber will fill before the air exits, the face velocity at the screens will be very
uniform. A similar argument can be used to explain the use of plenum screens at the
inlet to the furnace, and their contribution to velocity uniformity within the room. The
screening material was chosen based on its airflow resistance characteristics. The flow resistance coefficient Rt is defined as
(2.1 )
where aP is the pressure drop across the medium and V m is the mean velocity
through the medium. For screening material, a correlation exists relating the
resistance coefficient to the flow and geometric parameters. This relationship is
defined as
(2.2)
where the Reynolds number based on screen wire diameter Rew is defined as
(2.3)
B is defined as the ratio of screen open area to total area and dw is the screen wire
diameter (Gavin, 1983). We calculated resistance coefficients for several different
17
commercially available screens in order to compare them with .the resistance
coefficient of air moving along the plenum as if it were a simple duct. The resistance
coefficient for a duct is defined by
fL Rf =-
Dh (2.4)
where f is the Moody friction factor, L is the length and Dh is the hydraulic diameter of
the duct. We selected a screen such that its resistance was three orders of magnitude
larger than the frictional resistance along the duct. This assures adequate filling of the
plenum before the air is forced into the room. We also checked the pressure drop
imposed by the screens to be sure that we would still meet our required flowrate. The
total back pressure imposed on the system by all four screens was calculated to be
less than a tenth of an inch of water. Although this pressure does slightly reduce the
airflow capacity of the furnace, the ASHRAE standard requirements for airflow are still
easily met.
2.1.3 Moisture Addition Systems
One method for determining the moisture removal capability of a test air
conditioner involves maintaining a constant humidity in the indoor room by adding
water vapor at the same rate as it is removed by the air conditioner. By holding
humidity constant and by either (a) calibrating moisture. leakage from the room or (b)
assuming it to be negligible, one can determine the moisture removal rate of a unit by
measuring the rate of moisture addition to the indoor room.
Using a system simulation model, we estimated the maximum test unit moisture removal rate to be 27 Ibm/hr. This calculation was made assuming the largest
capacity unit and a saturated (100% RH) indoor room condition. Thus, the humidifier
must be able to supply water vapor at a continuously variable rate between 0 and 27 Ibmlhr to meet the removal requirements of any test unit at any given psychrometric
state. Aside from this condition, the only other design constraints imposed on the
system are qualitative in nature. For instance, the humidification system should be
packaged so as not to significantly disturb the air circulation in the room, or otherwise
affect indoor room performance. The moisture should be distributed low within the
room and pass in front of the exit of the reconditioning equipment. In this manner,
water vapor is released into the warmest air in the chamber, which has the greatest
18
ability to hold moisture. Also, if it is released low in the room, the vapor will travel
further and mix more thoroughly with the hot air stream exiting the plenum before
reaching the ceiling of the chamber. This reduces the chance of water vapor
condensing on the chamber surfaces.
The humidifier must be well integrated with a system for determining the rate at
which it adds moisture to the indoor room. For this reason, a" the considered
humidification options involve concurrent consideration of measuring systems. Ideally,
we desire the accuracy of this system to be perfect since the smallest required moisture addition rate is 0 Ibm/hr, and any small deviation from the actual rate will
create a theoretically infinite percentage error. However, a small error, such as 0.1 Ibm/hr for a measurement of 27 Ibm/hr, yields a tolerable error of 0.37%. It is difficult
to assign a percent error limitation to the system, since its capacity changes
depending upon indoor psychrometric conditions and the dehumidifying ability of the
test unit. Instead of designing the system for a tolerable percent error, as is done in a
single capacity system, we searched for the most accurate measuring device which,
when coupled with a reasonable humidifier design, yields a low-cost solution.
2.1.3.1 Heated-Plate Systems
One of the first ideas we investigated was to drip water onto a heated plate at a
desired flowrate. The temperature of the plate is set at a certain value above the
boiling temperature. As water is dripped on the plate, it evaporates quickly. As the
moisture demand increases, more water flows onto the plate and consequently heat
transfer from the plate to the water increases as the temperature controller attempts to
maintain a constant plate temperature. Assuming there is enough heater surface area
to effect the heat transfer required for evaporation, the main advantage of this system
is its quick response time. As long as water does not accumulate on the plates,
response time is low since energy is not consumed in heating the resident water, but
only in evaporating immediately incident water.
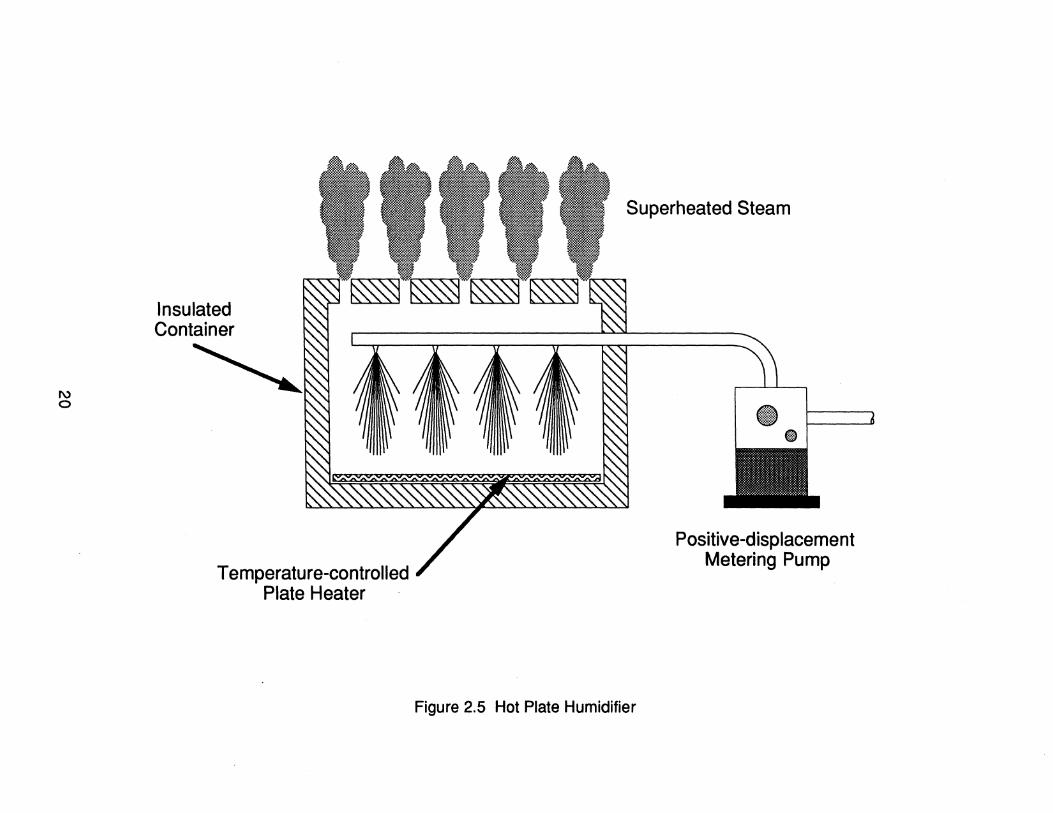
Figure 2.5 shows another variation of this idea which involves encasing the
heated plates in an insulated chamber. This approach allows the air in the chamber to
remain at a temperature higher than the boiling point of the water. When the water
evaporates off the plate, heat transfer from the air to the water vapor serves to
superheat the vapor. This method reduces the chance of moisture condensing after it
mixes with the air in the indoor room.
19
I\) o
T emperatu re-controlled Plate Heater
Superheated Steam
Figure 2.5 Hot Plate Humidifier
-@
Positive-displacement Metering Pump
We investigated two methods for metering water onto the plate. The first of
these, shown in Figure 2.5, uses a positive-displacement pump. Positive
displacement pumps force a fixed volume of fluid through the pump for each rotation of
the shaft, thus making them accurate flowrate metering devices. The pump that we
considered for this purpose was a diaphragm pump with a manually controlled stroke
length and a remotely controlled stroke rate (using a 4-20 mA signal). Using this
system, we can calibrate the flowrate at each manually set stroke length for a range of
stroke rates, and expect an accuracy of ±2% of full scale. By setting the stroke length
to a value which would allow a varying stroke rate to cover the full range of flowrates
needed for testing a particular air conditioner, full control is achieved remotely. A
process controller reads the indoor room humidity, compares it to the setpoint, and
sends a 4-20 mA signal to the pump to modulate the water flowrate. The problem with
this system is that positive displacement pumps cannot provide flow at rates approaching 0 Ibm/hr. In general, we found that these pumps will not provide
consistent flow in the range of 0-5% of full scale output. This poses a problem for us
in testing air conditioners at conditions which result in low moisture removal capacity.
The second option for metering water onto the heated plate involves the use of
pressurized water or a pressurized air/water mixture. One of these types utilizes an air
pressure driven, variable capacity liquid injection system. This system injects bursts of
water based on the pressure setting. The duration of these bursts can be varied to
yield the desired flowrate. Again, we would need to control two variables in order to
set the flowrate. First, we must control the air supply pressure and, second, we need
to control the timing of the water bursts. To maintain constant humidity, we also need
to control a third variable, the plate temperature. Since it is necessary to control three
separate variables, we decided not to pursue this approach.
A similar idea utilizes a spray nozzle instead of the injection system. We
investigated water-pressure driven and air-pressure driven atomizing spray nozzles to
determine their suitability for humidity control. The advantage of these nozzles is that
they produce very small droplet sizes which are easily evaporated either on a hot plate
or in warm air.
As part of the heated plate idea, we proposed using the spray nozzles as the
distribution mechanism in place of the fluid injection system. For this system we chose
a hydraulic atomizing nozzle, because its flowrate can be controlled solely by the
water pressure. Although the air atomizing nozzles produce small droplet sizes, their
smaller size does not hasten evaporation from the heated plate enough to warrant
involving another control variable; namely, air pressure. Spraying water onto the
21
heated plates for evaporation is fairly easy to calibrate since the flowrate can be varied
by regulating the water pressure. However, at lower pressures (and consequently,
lower flowrates) the nozzles no longer produce the small (0.040 in. diameter) droplets
which evaporate quickly. This system can be modified to pulse water intermittently
through the nozzle at higher pressure. This approach solves the droplet size problem
but also introduces another control variable; namely, pulse duration. An even greater
problem lies in trying to measure the amount of water that is being used by the system
when the flowrate is discontinuous. One approach we considered was to time the
bursts and then use a calibration of water flowrate vs. pressure to calculate the actual
flowrate. The need to use such a calibration makes this approach a difficult and
potentially inaccurate measuring system.
2.1.3.2 Misting Systems
As alluded to previously, we also entertained a completely different humidification
idea based on spray nozzles. Instead of adding heat directly to the water, we
considered spraying a fine mist into the air in the indoor room and allowing heat
transfer from the air to evaporate it. In effect, we are using a form of evaporative
cooling. Our heating system in the indoor room is sized to balance the total capacity
of the largest test unit. Whether the cooling is purely sensible, purely latent or a
mixture of the two, the cooling capability never exceeds the capacity of the unit. Since
the heater is controlled to maintain a particular temperature in the room, it must add
enough heat to balance both the sensible cooling load of the air conditioner and the
evaporative cooling load of the humidification system. The heater must also be sized
large enough so that it can provide enough heat for the sensible and latent loading of
the air conditioner. This approach eliminates the need to buy, use and control
ancillary heaters.
The air atomizing nozzles yield much finer droplet sizes than their hydraulic
atomizing counterparts, and the particle size can be reduced by increasing the air
pressure. Using these nozzles, we could keep the water pressure constant and vary
the air pressure to control the flowrate and droplet size. The water flowrate decreases
as the air pressure increases. Assuming that, at our maximum flow rate , the droplet
size is sufficiently small for evaporative cooling, an air-pressure regulator can be used
in concert with a controller to meter the necessary water to the nozzle. If the process
runs at a continuously variable rate, it can be calibrated fairly simply by accurately
measuring flowrate vs. air pressure at the operating water pressure. The drawback to
22
using this system for controlling the flowrate is that as pressure is increased, the
length of the nozzle spray pattern increases. In fact, it becomes so large for the size
system we need that we cannot fit the nozzle with its associated spray pattern inside
our chamber. The droplet plume will reach and wet the wall of the chamber. We
certainly cannot have water building up as liquid in the chamber, since our moisture
balance assumes that all water entering the humidification system adds to the
moisture content of the air.
2.1.3.3 Reservoir Systems
Commercial Hymldlflers
One of the more obvious solutions to this humidification problem is to buy a
commercially available humidifier. We investigated some steam generating
humidifiers and were able to find a system whose manufacturer claimed that their
device can cover our full range of flowrates. As an option with this humidifier, we
could purchase an SeR control system which claimed to be able to control relative
humidity to within 2%. The cost of the system including controls was roughly $5000.
But, after having invested $5000 into this system, we still would not have achieved any
ability to measure the moisture flow rate. The second control option offered was a
time-proportioning system which can control humidity within 5% at two-thirds of the
cost. However, the accuracy of this system is much too low for our purpose. Since
the humidifier is inseparable from its control system, and we can easily build the actual
humidification device ourselves (a ten gallon tank with two to three immersion
heaters), we decided not to pursue this idea any further.
A second commerCially available solution that we investigated was the purchase
of an electric boiler. With this approach, we would place the boiler outside the indoor
room and funnel the steam into the room through a pipe in the wall. Throttling the
steam would be accomplished by either (a) venting part of the steam to the ambient,
(b) controlling the power input to the heating element or (c) a combination of these
two. We can measure the steam using a vortex-shedding flowmeter which is very
accurate at higher steam flowrates. However, because it is very difficult to sense the
vortices at low flowrates, this method becomes ineffective over our full range of flow
and was not used in our facility.
23
Steam Pots
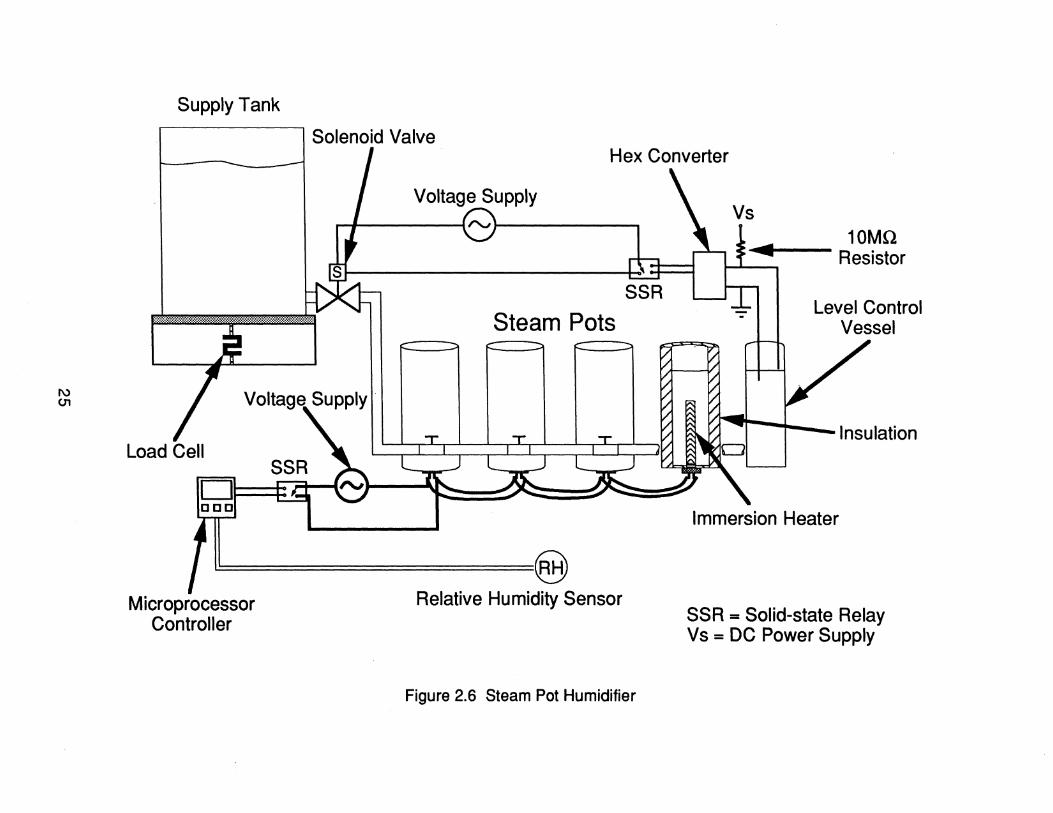
One idea we experimented with was inspired by the test facilities of one of our
research sponsors. Their setup consists of a bank of steam pots as shown in Figure
2.6. Each of these steam pots consists of a piece of two-inch copper tubing with one
end bushed down to accommodate a screw-plug immersion heater. The steam pots
are then insulated and linked together in parallel by a horizontal piping network, which
is connected to a supply tank. Water level is controlled using an identical but
unheated vessel in parallel with the steam pots. Since the level-control vessel has no
heater, the water surface is not agitated and this fact allows for accurate level control.
The level-control system is also shown in Figure 2.6. Two wires lead into the level
control vessel, one of which is submerged in the water all the time and another which
marks the reference height. A DC voltage supply is connected through a 10Mil pull
up resistor across the wires and a hex converter chip. When the water level drops
below the shorter wire, current no longer flows through the water to complete that side
of the circuit. At that point, the line current is drawn to ground through the high
impedance offered by the hex converter and the 10 Mil resistor. This results in a
negligible current flowing through the circuit, which yields a small voltage drop across
the resistor and hence a CMOS logical high input to the hex converter. The hex
converter translates the CMOS logical high to a TTL logical high of 5 V, which
energizes a solid-state relay. The relay closes the power supply circuit for the
solenoid valve and thus energizes the solenoid and opens the valve to allow the steam
pots to fill. When the level reaches the reference height~ a comparatively large current
flows through the water to ground, because the resistance of the water is many orders
of magnitude smaller than the input impedance of the hex converter. This relatively
large current causes a correspondingly large voltage drop across the 10Mil resistor
and brings the hex converter input voltage down to a CMOS logical low.
Consequently, a zero voltage signal is sent to the relay, which opens the solenoid
circuit and thus closes the flow control valve. This system results in very frequent
switching of the solenoid and, consequently, very tight control on level.
The evaporation rate is controlled by time-proportioning full power to the
immersion heaters. A microprocessor controller, responding to a difference between a
relative humidity setpoint and the sensed value, drives a solid-state relay that is
connected in parallel with the immersion heaters. By switching the solid-state relay on
for a certain percentage of its duty cycle and off for the remaining portion, the heat
output is controlled to be that same percentage of the heat load at full power. This
24
I\) 01
Supply Tank
I Solenoid Valve Hex Converter
Load Cell
D ••. [][][]
Voltage Supply
SSR
Steam Pots
II ~ Microprocessor
Controller Relative Humidity Sensor
Figure 2.6 Steam Pot Humidifier
10MQ ~ Resistor
Level Control Vessel
:jI ·1 -Insulation
Immersion Heater
SSR = Solid-state Relay Vs = DC Power Supply
allows for the continuously variable evaporation rate needed for testing the full range
of systems over the full range of psychrometric conditions.
The amount of water evaporated can be obtained by measuring the change in
weight of the supply tank with a load cell as shown in Figure 2.6. At a steady-state
condition in the room, the evaporation rate will be constant and by taking weight data
over time, we will be able to get an accurate representation of the evaporation rate
produced by the steam pots.
We experimented with designs for the steam pots to determine their viability in
our situation. We built a steam pot out of copper tube, screwed in an immersion
heater and applied power to the heater. We found that the water in the tube boiled
uncontrollably unless the heat input from the immersion heater was less than 500 W.
Our first reaction to this discovery was to conclude that the uncontrollable boil was due
to the high watt density of the heater. We hypothesized that too much heat was being
transferred to a surface area of water that was too small. This was causing large gas
bubbles to form on the heater. We obtained and tested another heater which had a
watt density that was one-half that of the first. The results of this test were the same
as for the first heater and the steam pot still spit liquid water from its top. We tried
lengthening the steam pot and adding more water to it ,but this change in water
volume had only a small effect on the boiling characteristics. The watt density did not
seem to be the problem, or at least not a problem we could solve within the constraints
of standard copper tubing and available immersion heaters. More likely, the problem
was that we were adding too much heat to too little water. Our application calls for 27 Ibm/hr of steam production for the worst case test
scenario. This means that a total of 7.7 kW (26.2 kBtu/hr) of heat must be added to
saturated liquid water to meet this evaporation rate. If we are limited to SOOW input to
anyone steam pot, this dictates a need for 16 of these steam pots. This would mean
a big, bulky apparatus within our test chamber, not to mention the expense involved in
buying the 16 heaters and the parts necessary for building the bodies of the steam
pots. For these reasons, we decided to try another idea.
Barrel Humidifiers
Our next and final idea was aimed at solving the problem of uncontrollable boiling
and finding a simplistic, foolproof and inexpensive method of adding moisture to the
indoor room. The obvious way to eliminate the uncontrollable boil is to increase the
amount of water in the boiler. We decided to build a system utilizing a 24 gal steel
26
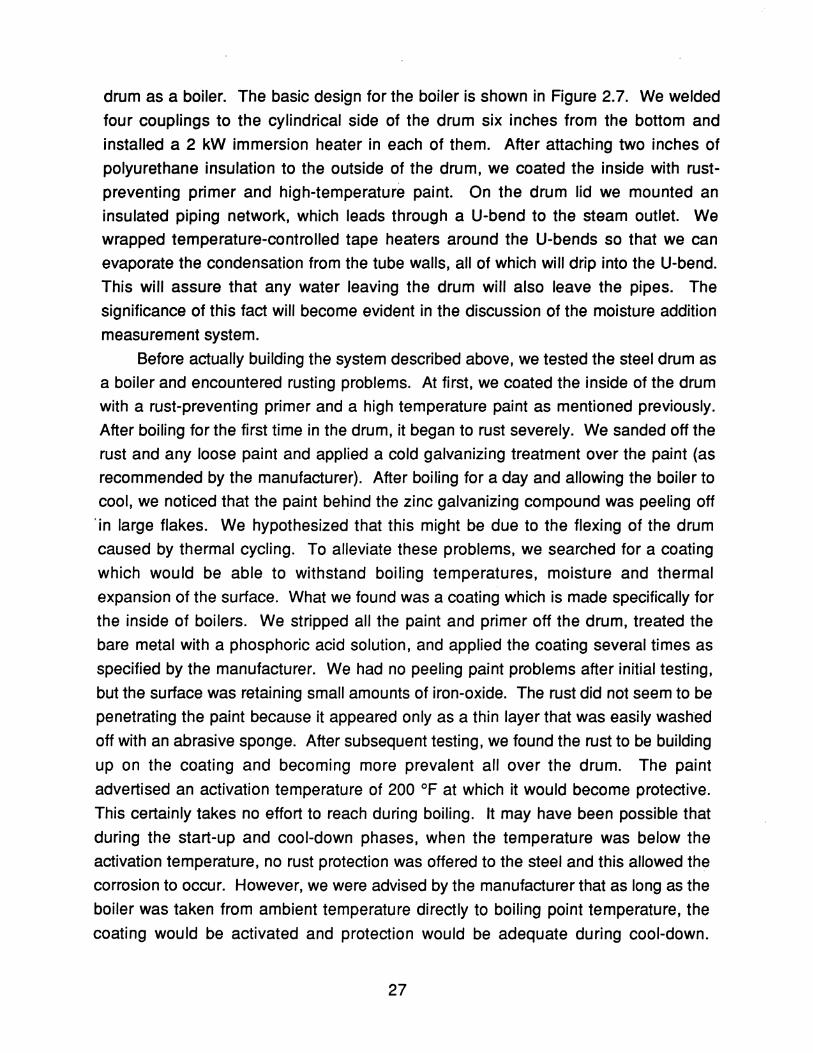
drum as a boiler. The basic design for the boiler is shown in Figure 2.7. We welded
four couplings to the cylindrical side of the drum six inches from the bottom and
installed a 2 kW immersion heater in each of them. After attaching two inches of
polyurethane insulation to the outside of the drum, we coated the inside with rust
preventing primer and high-temperature paint. On the drum lid we mounted an
insulated piping network, which leads through a U-bend to the steam outlet. We
wrapped temperature-controlled tape heaters around the U-bends so that we can
evaporate the condensation from the tube walls, all of which will drip into the U-bend.
This will assure that any water leaving the drum will also leave the pipes. The
significance of this fact will become evident in the discussion of the moisture addition
measurement system.
Before actually building the system described above, we tested the steel drum as
a boiler and encountered rusting problems. At first, we coated the inside of the drum with a rust-preventing primer and a high temperature paint as mentioned previously.
After boiling for the first time in the drum, it began to rust severely. We sanded off the
rust and any loose paint and applied a cold galvanizing treatment over the paint (as
recommended by the manufacturer). After boiling for a day and allowing the boiler to
cool, we noticed that the paint behind the zinc galvanizing compound was peeling off
'in large flakes. We hypothesized that this might be due to the flexing of the drum
caused by thermal cycling. To alleviate these problems, we searched for a coating
which would be able to withstand boiling temperatures, moisture and thermal
expansion of the surface. What we found was a coating which is made specifically for
the inside of boilers. We stripped all the paint and primer off the drum, treated the
bare metal with a phosphoric acid solution, and applied the coating several times as
specified by the manufacturer. We had no peeling paint problems after initial testing,
but the surface was retaining small amounts of iron-oxide. The rust did not seem to be
penetrating the paint because it appeared only as a thin layer that was easily washed
off with an abrasive sponge. After subsequent testing, we found the rust to be building
up on the coating and becoming more prevalent all over the drum. The paint
advertised an activation temperature of 200 OF at which it would become protective.
This certainly takes no effort to reach during boiling. It may have been possible that
during the start-up and cool-down phases, when the temperature was below the
activation temperature, no rust protection was offered to the steel and this allowed the
corrosion to occur. However, we were advised by the manufacturer that as long as the
boiler was taken from ambient temperature directly to boiling point temperature, the
coating would be activated and protection would be adequate during cool-down.
27
(IJ (IJ Cl)
c:E S2 (1)0 -cCl)~ - ..., ~Ci3 :::l (IJ c:
Cl) -co. Cl)0-_a.. ~E :::lea (lJCl) E_
(I)
28
Cl) a. ~
.... (IJ (])
'- ;0::::
Cl) =0 - °e ea Cl) :::l :c :::L c: E 0 :::l o~
.... C
Cl) ,.... E C\i E (]) ....
:::l C)
u::
Apparently, this was not the case and we decided not to put any more effort into rust
prevention coatings. To avoid the problem, we decided to buy a stainless steel drum
as shown in the final design in Figure 2.7.
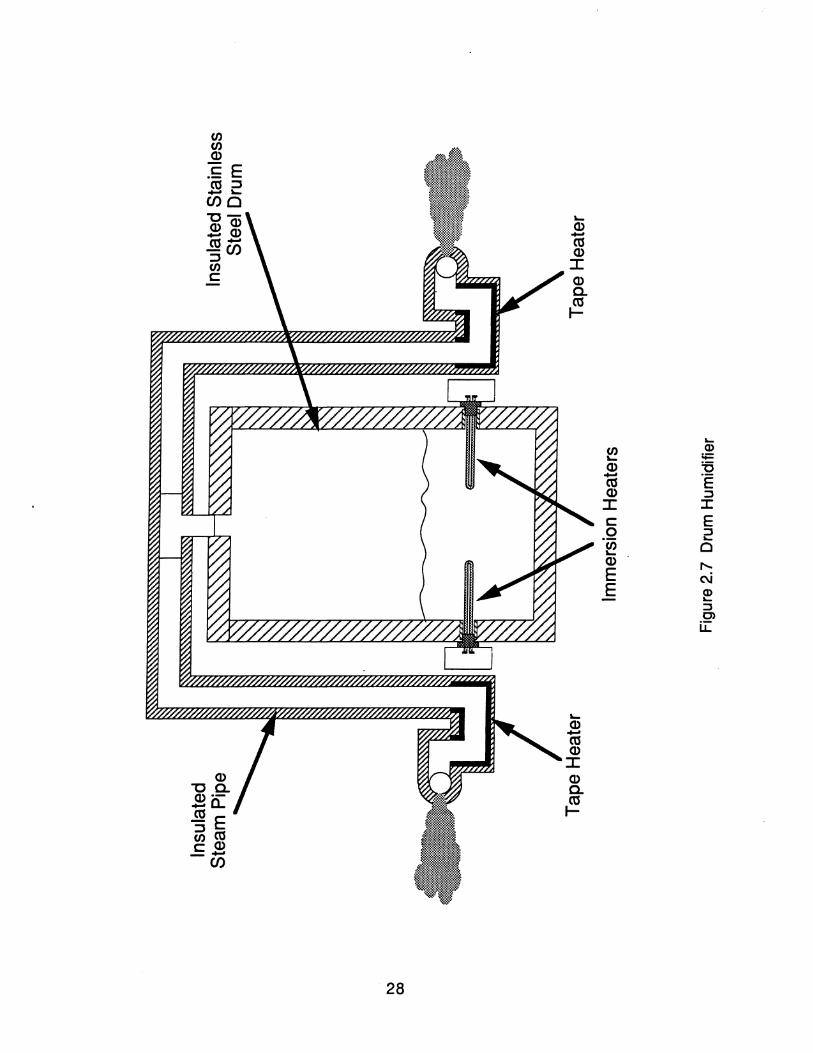
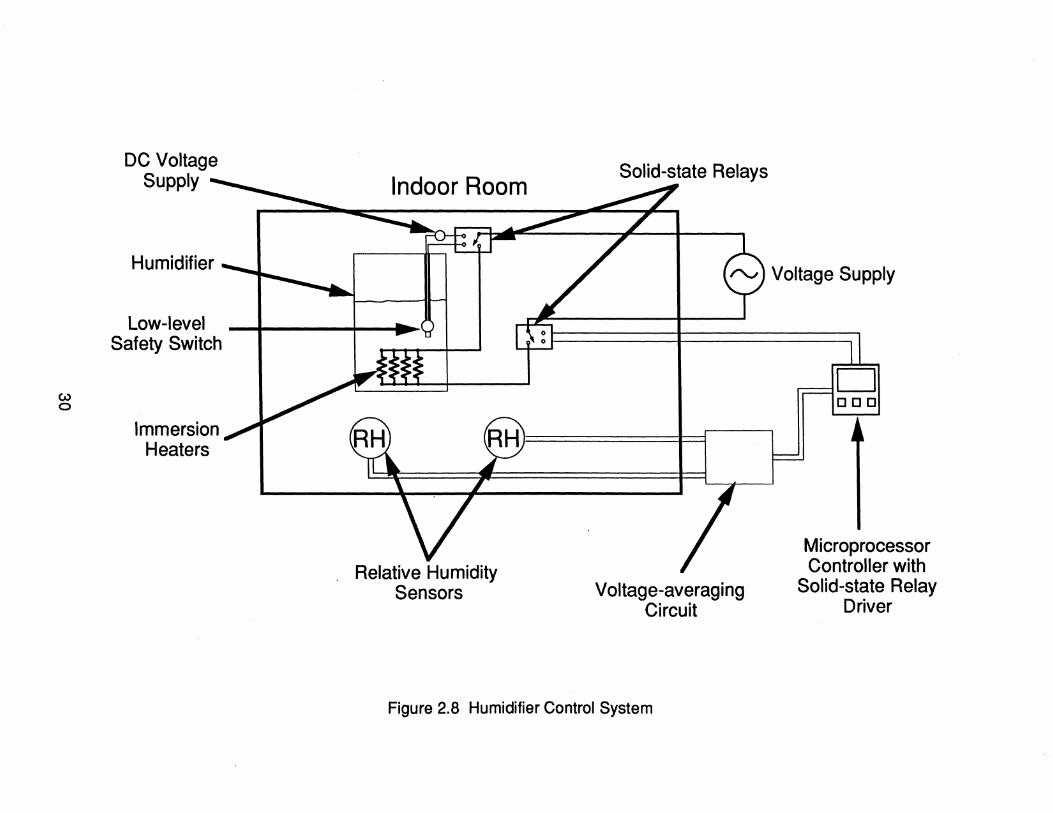
The humidification system is controlled to provide a steady-state relative humidity
in the indoor room. This control system is similar to the furnace control system, as can
be seen in Figure 2.8. Voltage signals from the relative humidity sensors in the indoor
room are averaged by a circuit similar to that used by the heater control system. This
averaged signal is compared to a setpoint, which causes the controller to drive a solid
state relay to modulate power to the immersion heaters in the humidifier. The humidity
controller operates in the same way as the furnace controller. There is a low water
level safety switch built into the humidifier, which opens when the water level drops
below the reference height. When this occurs, a float switch opens the energized
circuit and the solid-state relay, which is in line with the switch, becomes de-energized.
Since the relay will not be energized, it will cut power to the immersion heaters and
keep them from overheating.
It should be noted that at the time of writing of this paper, we are not presently
using the controllers to automatically maintain constant temperature and relative
humidity in the room. An important feature of these controllers is the ability to
manually set a power input to the electric furnace or immersion heaters. We have
been using this feature to learn about the response of the indoor room to constant heat
and moisture inputs. This approach will help us quantify the time constants associated
with the heating and humidifying systems in the indoor room, and will allow us to
develop "smarter" control algorithms.
2.1.3.4 Measurement of Moisture Addition
The method we are using to measure the steam flowrate is to weigh the boiler on
a load cell and record the weight change over time. This method of measuring
flowrate will be a fundamental measurement and is not subject to the inaccuracies
involved in calibrating the measured value to an intermediate variable. The accuracy
of this measurement, like many measurements, will depend on the maximum weight of
the system. The lighter the system, the more accurate the measurement will be,
assuming a fixed resolution of the reading device. The weight of a boiler will be a
substantial fixed weight which must be measured using this weighing device. If the
weight of the boiler was removed, a very accurate measurement of the water flow rate
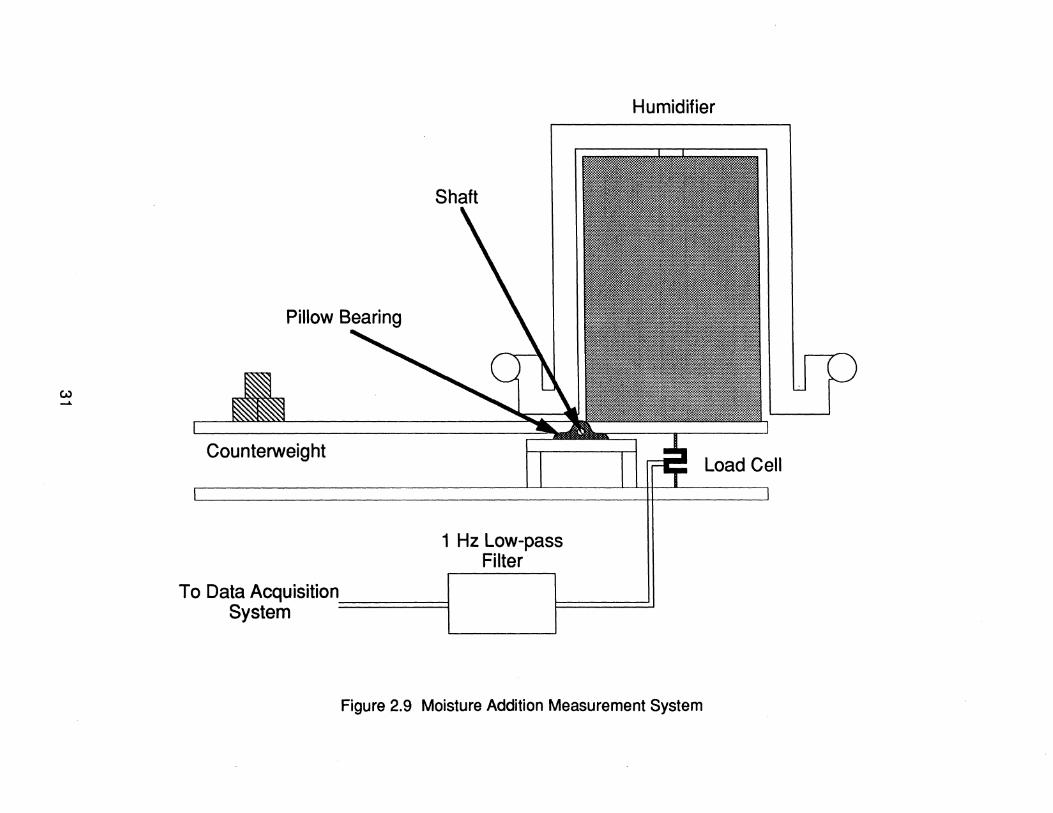
could be produced. As shown in Figure 2.9, by using a counterweight system to
29
w o
DC Voltage Supply
Humidifier
Low-level Safety Switch
Immersion Heaters
Indoor Room
A.J I Voltage Supply
Relative Humidity Sensors Voltage-averaging
Circuit
Figure 2.8 Humidifier Control System
DOD
Microprocessor Controller with
Solid-state Relay Driver
w ......
Counterweight
1 Hz Low-pass Filter
To Data Acquisition System ========~
Humidifier
Load Cell
Figure 2.9 Moisture Addition Measurement System
balance the weight of the humidifier, we will be able to measure only the weight
change of the water. This will increase the accuracy of our measurement by
decreasing the required capacity of the load cell.
The counterweight system consists of a six-foot unistrut platform with a steel
shaft mounted two feet from one end of the platform. This shaft is supported by a pair
of pillow blocks with well-lubricated ball bearing inserts to allow for free movement of
the platform. These pillow blocks are mounted to a firmly-planted unistrut base. A 50-Ibm capacity S-beam load cell is mounted in the span between the base and the
platform directly underneath the humidifier. Counterweights are added to the
balancing side of the platform so that the load cell only measures a maximum load of 50 Ibm.
We decided to buy a 50-Ibm load cell because 50 Ibm of water is more than
sufficient to achieve a single steady-state psychrometric condition in the indoor room.
This point is noted in light of the fact that the maximum evaporation rate which we predict necessary for steady-state operation is 27 Ibm/hr. In order to obtain other
conditions during the same data run, it may become necessary, in some cases, to
remotely fill the boiler from outside the chamber. This provision may be added to the system at a later date. By choosing the 50-Ibm load cell, we obtain an instrument with
a 0.1 % full scale accuracy or a total accuracy of 0.05 Ibm. The electrical response of
the system is 3.1 mV per excitation volt at full scale. When we excite the load cell with a 15 V signal, this corresponds to a 46.5 mV signal at 50 Ibm. By using our Fluke
2280 datalogger, we can read this signal to 0.6 J,1V, which corresponds to reading accuracy of 0.000645 Ibm. Clearly, the limiting factor in total accuracy is the load cell
accuracy. As shown in Figure 2.9, we condition the output signal with a 1 Hz low-pass
filter, which is necessary to remove noise generated by oscillations in the system due
to vigorous boiling.
2.1.3.5 Humidifier System Calibration
The position and orientation of the humidifier above the load cell is crucial to
measurement accuracy. The moment arm measured from the shaft to the center of
mass of the water in the humidifier must remain constant throughout the measuring
range of the load cell. If this condition is not met, the weight measured by the load
cell, as water evaporates from the humidifier, will be dependent upon the moment arm
to the center of mass of the water, as well as the weight of the water in the drum. In
order for the calibration curve to be linear, the humidifier must be level in the direction
32
along the see-saw platform and must not change position during the lifetime of a
particular calibration curve. For these reasons, the platform has been designed to be
able to level and lock the drum in place. After correct placement of the drum on the
platform, the load cell is calibrated by use of a balance which is accurate to ±O.1 g (±2.2e-5 Ibm).
While running the humidifier, the platform vibrated due to the motion of the boiling
water. This fluctuation causes the measured evaporation curve to appear oscillatory.
To alleviate this problem, we viewed the load cell output signal on an oscilloscope to
determine the frequency of the oscillation. The signal noise clearly appeared to be a 2
Hz waveform. 'We filtered this signal with a 1 Hz low-pass filter to be sure of fully
removing the noise from the signal. This action greatly improved the linearity of our
evaporation data over the full range of the load cell measurement capability. Evidence
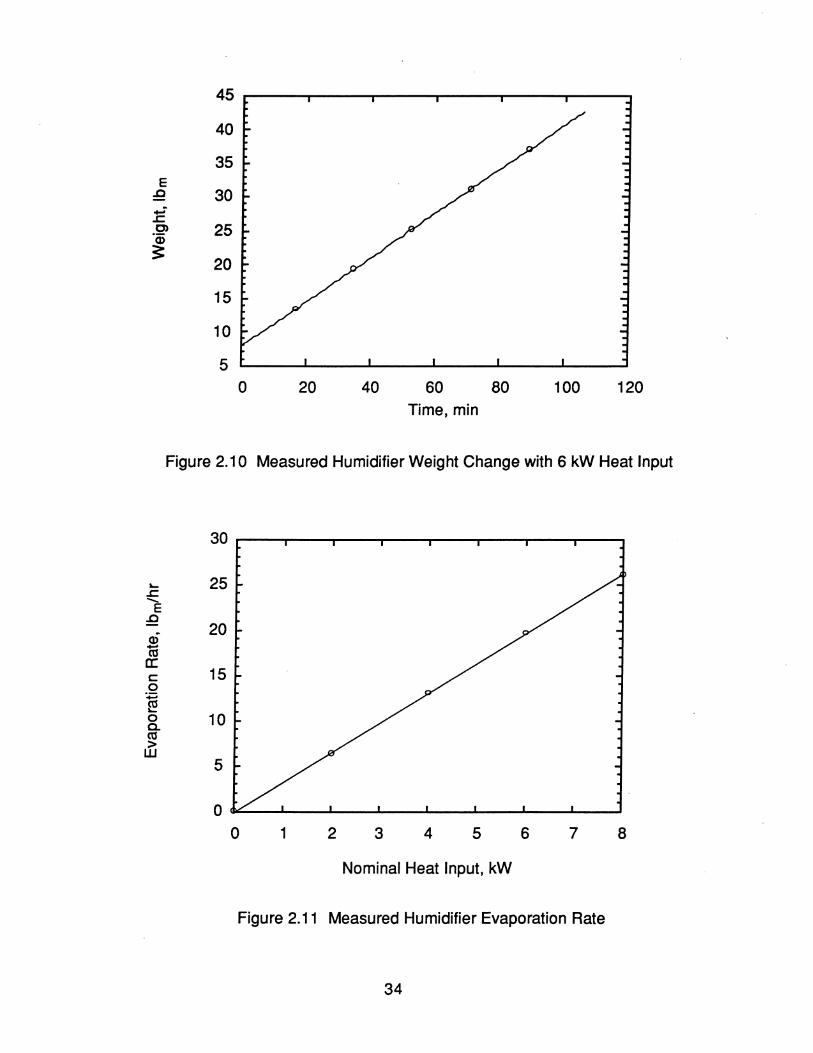
of the linearity of our evaporation rate can be seen in Figure 2.10, which shows the
weight change measured by the load cell with a 6 kW humidifier heat input. We
plotted curves such as this for heat inputs of 2, 4, 6 and 8 kW and subsequently curve
fit each set of data with a linear least squares fit. The results of these curve fits
showed that the RMS error between the data points and their respective curve fits is
less than 1 % for each set of data. This error, however, is the error in the direct weight
measurement. The error in the slope of these curves which corresponds to the error in
our evaporation rate is much smaller.
We plotted the slopes of the four weight change curves in Figure 2.11. This
graph shows the linearity of our ability to measure evaporation rate over the full range
of humidifier heat inputs. It can be seen in Figures 2.10 and 2.11 that our ability to
accurately measure the moisture input into the indoor room is excellent, and that this
contributes positively to our measurement of room air conditioner moisture removal.
2.1.4 Temperature Measurements
Inside the room, we have two combined temperature and relative humidity probes
for measuring the air-space properties. Temperature is measured by a platinum RTD
with an accuracy of ±0.3°C. The probes are housed in aspirated radiation shields for
obtaining true air measurements. These shields, which surround the probe bodies,
are made of a white thermoplastic material to reflect incident radiation that could affect
the temperaturEl measurement. Aspirating fans are attached to the shields with a
piece of PVC piping, causing air to be drawn across the sensing elements. This
results in high heat and moisture transfer to the sensors, and thus more accurate
33
45
40
35 E
:Q 30 ...: .s::::. C) 25
~ 20
15
10
5 0 20 40 60 80 100 120
Time, min
Figure 2.10 Measured Humidifier Weight Change with 6 kW Heat Input
~
.s::::. E .J:l
cD m a: c: o ~ ~
o Co ctS > W
30
25
20
15
10
5
0
0 1 2 3 4 5 6 7 8
Nominal Heat Input, kW
Figure 2.11 Measured Humidifier Evaporation Rate
34
measurement of air properties. These sensors will be used to control the temperature
and relative humidity in the indoor room.
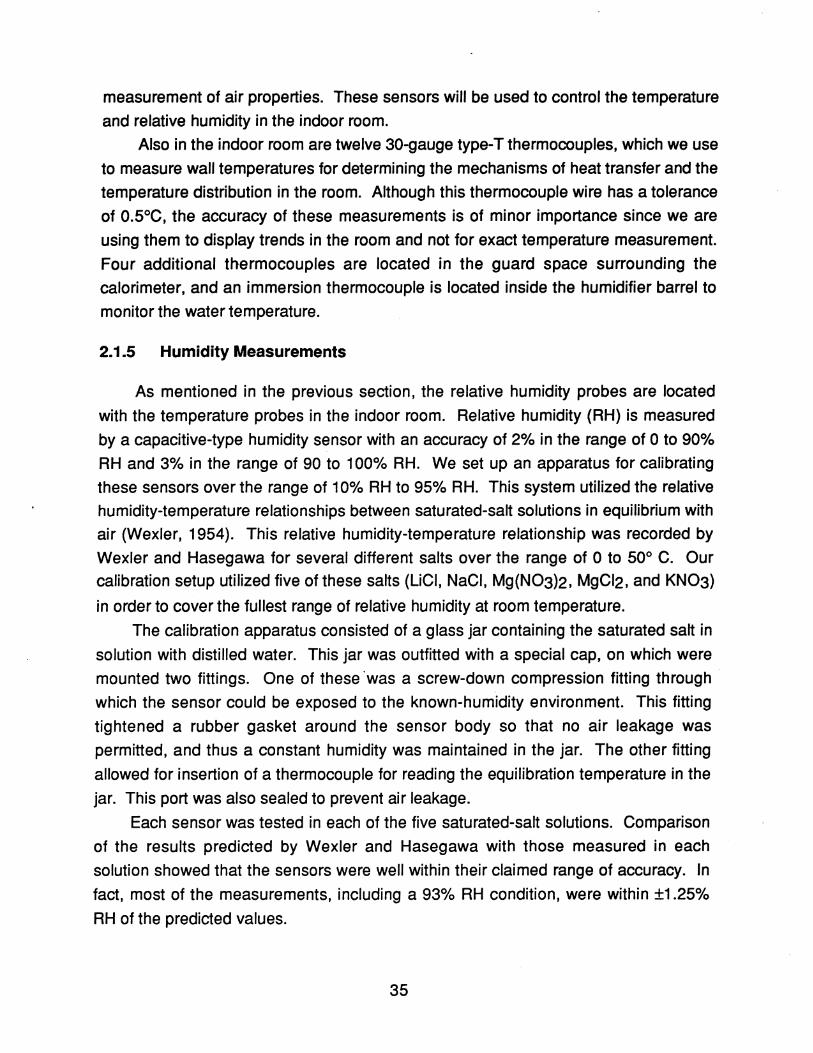
Also in the indoor room are twelve 30-gauge type-T thermocouples, which we use
to measure wall temperatures for determining the mechanisms of heat transfer and the
temperature distribution in the room. Although this thermocouple wire has a tolerance
of 0.5°C, the accuracy of these measurements is of minor importance since we are
using them to display trends in the room and not for exact temperature measurement.
Four additional thermocouples are located in the guard space surrounding the
calorimeter, and an immersion thermocouple is located inside the humidifier barrel to
monitor the water temperature.
2.1.5 Humidity Measurements
As mentioned in the previous section, the relative humidity probes are located
with the temperature probes in the indoor room. Relative humidity (RH) is measured
by a capacitive-type humidity sensor with an accuracy of 2% in the range of 0 to 90%
RH and 3% in the range of 90 to 100% RH. We set up an apparatus for calibrating
these sensors over the range of 10% RH to 95% RH. This system utilized the relative
humidity-temperature relationships between saturated-salt solutions in equilibrium with
air (Wexler, 1954). This relative humidity-temperature relationship was recorded by
Wexler and Hasegawa for several different salts over the range of 0 to 50° C. Our calibration setup utilized five of these salts (LiCI, NaCI, Mg(N03)2, MgCI2, and KN03)
in order to cover the fullest range of relative humidity at room temperature.
The calibration apparatus consisted of a glass jar containing the saturated salt in
solution with distilled water. This jar was outfitted with a special cap, on which were
mounted two fittings. One of these 'was a screw-down compression fitting through
which the sensor could be exposed to the known-humidity environment. This fitting
tightened a rubber gasket around the sensor body so that no air leakage was
permitted, and thus a constant humidity was maintained in the jar. The other fitting
allowed for insertion of a thermocouple for reading the equilibration temperature in the
jar. This port was also sealed to prevent air leakage.
Each sensor was tested in each of the five saturated-salt solutions. Comparison
of the results predicted by Wexler and Hasegawa with those measured in each
solution showed that the sensors were well within their claimed range of accuracy. In
fact, most of the measurements, including a 93% RH condition, were within ±1.25%
RH of the predicted values.
35
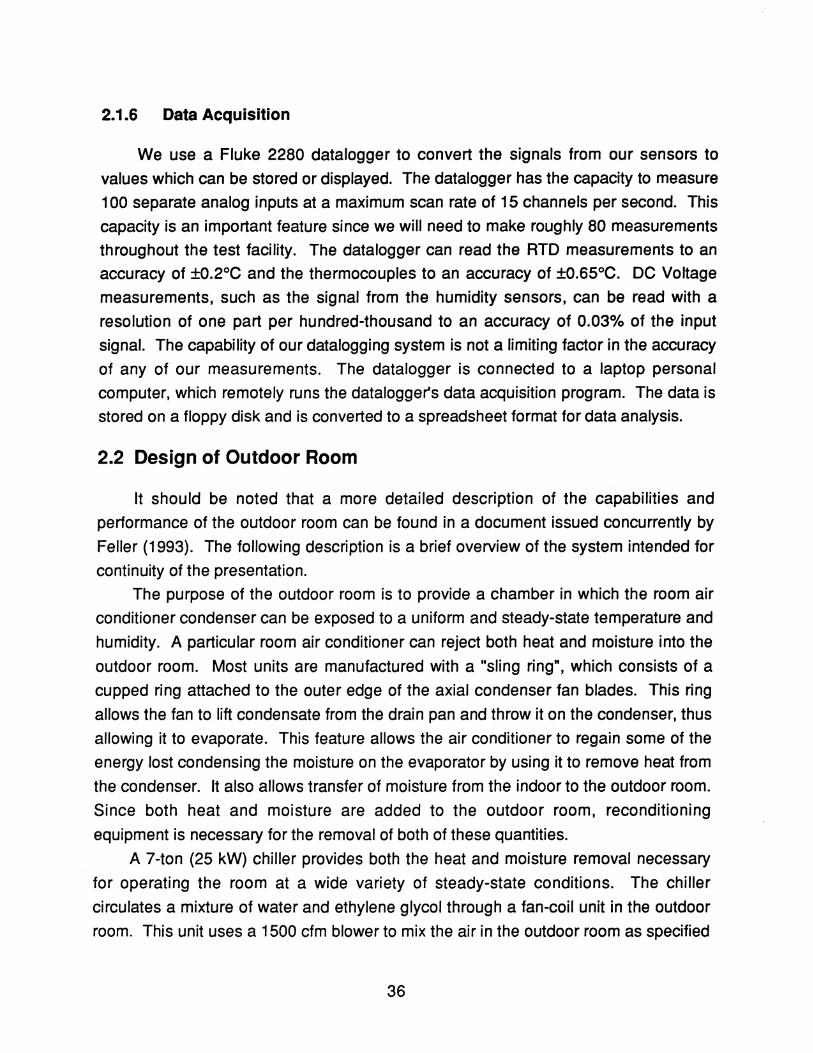
2.1.6 Data Acquisition
We use a Fluke 2280 datalogger to convert the signals from our sensors to
values which can be stored or displayed. The datalogger has the capacity to measure
100 separate analog inputs at a maximum scan rate of 15 channels per second. This
capacity is an important feature since we will need to make roughly 80 measurements
throughout the test facility. The datalogger can read the RTD measurements to an
accuracy of ±0.2°C and the thermocouples to an accuracy of ±0.65°C. DC VoHage
measurements, such as the signal from the humidity sensors, can be read with a
resolution of one part per hundred-thousand to an accuracy of 0.03% of the input
signal. The capability of our datalogging system is not a limiting factor in the accuracy
of any of our measurements. The datalogger is connected to a laptop personal
computer, which remotely runs the datalogger's data acquisition program. The data is
stored on a floppy disk and is converted to a spreadsheet format for data analysis.
2.2 Design of Outdoor Room
It should be noted that a more detailed description of the capabilities and
performance of the outdoor room can be found in a document issued concurrently by
Feller (1993). The following description is a brief overview of the system intended for
continuity of the presentation.
The purpose of the outdoor room is to provide a chamber in which the room air
conditioner condenser can be exposed to a uniform and steady-state temperature and
humidity. A particular room air conditioner can reject both heat and moisture into the
outdoor room. Most units are manufactured with a "sling ring", which consists of a
cupped ring attached to the outer edge of the axial condenser fan blades. This ring
allows the fan to lift condensate from tha drain pan and throw it on the condenser, thus
allowing it to evaporate. This feature allows the air conditioner to regain some of the
energy lost condensing the moisture on the evaporator by using it to remove heat from
the condenser. It also allows transfer of moisture from the indoor to the outdoor room.
Since both heat and moisture are added to the outdoor room, reconditioning
equipment is necessary for the removal of both of these quantities.
A 7-ton (25 kW) chiller provides both the heat and moisture removal necessary
for operating the room at a wide variety of steady-state conditions. The chiller
circulates a mixture of water and ethylene glycol through a fan-coil unit in the outdoor
room. This unit uses a 1500 cfm blower to mix the air in the outdoor room as specified
36
by the ASH RAE standard. The chiller provides ±O.18 OF (±O.1 °C) temperature stability and a range of supply temperatures between 5 of and 95 of (-15 °C and 35
°C.) We can control the mass flow of water through the coil by use of a control valve
mounted in parallel with the coil. By controlling the flow, heat transfer from the air to
the coil is modulated to obtain a steady state temperature condition. Control of the chiller supply temperature, and thus the coil temperature, is used to maintain a
constant dew point in the outdoor room.
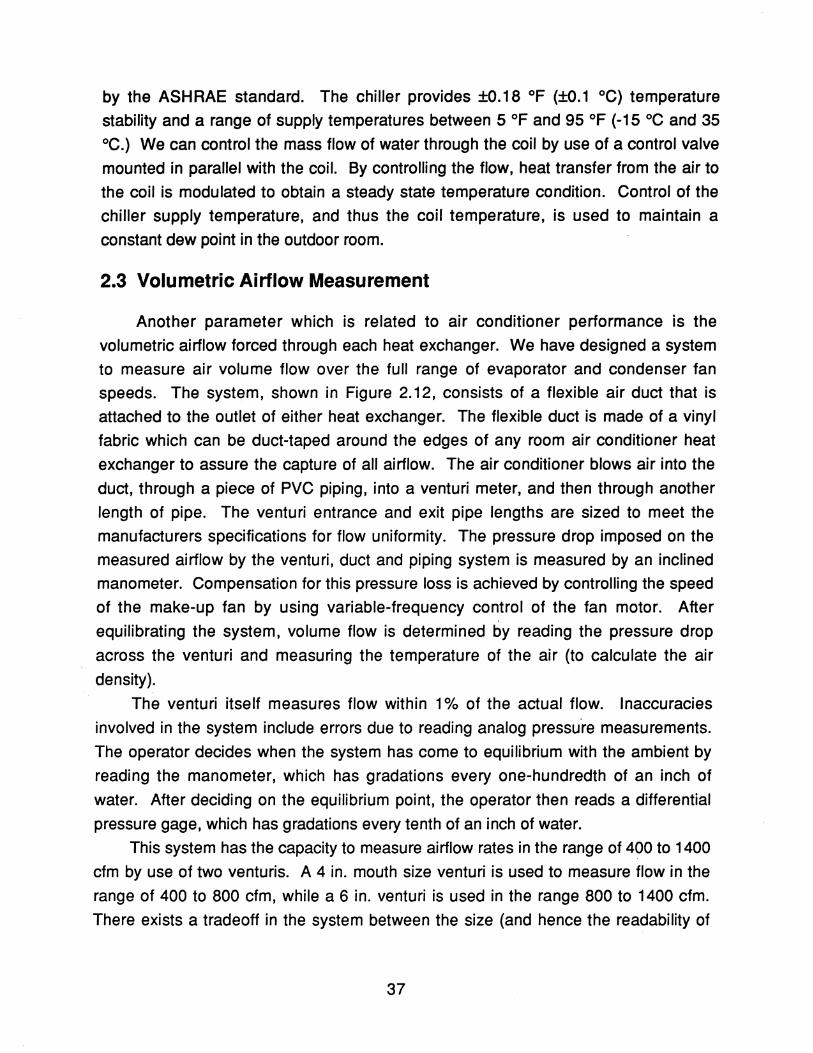
2.3 Volumetric Airflow Measurement
Another parameter which is related to air conditioner performance is the volumetric airflow forced through each heat exchanger. We have designed a system to measure air volume flow over the full range of evaporator and condenser fan speeds. The system, shown in Figure 2.12, consists of a flexible air duct that is
attached to the outlet of either heat exchanger. The flexible duct is made of a vinyl
fabric which can be duct-taped around the edges of any room air conditioner heat
exchanger to assure the capture of all airflow. The air conditioner blows air into the
duct, through a piece of PVC piping, into a venturi meter, and then through another
length of pipe. The venturi entrance and exit pipe lengths are sized to meet the manufacturers specifications for flow uniformity. The pressure drop imposed on the measured airflow by the venturi, duct and piping system is measured by an inclined manometer. Compensation for this pressure loss is achieved by controlling the speed of the make-up fan by using variable-frequency control of the fan motor. After
equilibrating the system, volume flow is determined by reading the pressure drop
across the venturi and measuring the temperature of the air (to calculate the air
density).
The venturi itself measures flow within 1 % of the actual flow. Inaccuracies
involved in the system include errors due to reading analog pressu're measurements.
The operator decides when the system has come to equilibrium with the ambient by
reading the manometer, which has gradations every one-hundredth of an inch of
water. After deciding on the equilibrium point, the operator then reads a differential
pressure gage, which has gradations every tenth of an inch of water.
This system has the capacity to measure airflow rates in the range of 400 to 1400 cfm by use of two venturis. A 4 in. mouth size venturi is used to measure flow in the
range of 400 to 800 cfm, while a 6 in. venturi is used in the range 800 to 1400 cfm.
There exists a tradeoff in the system between the size (and hence the readability of
37
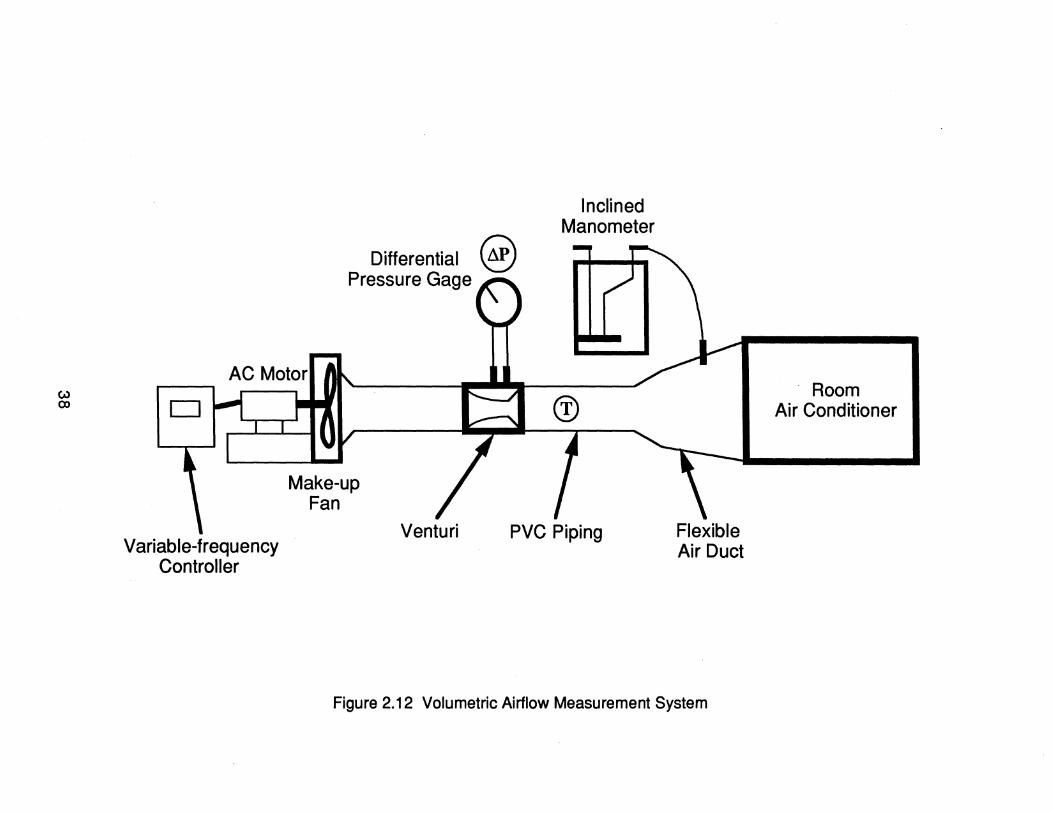
cu CD
Variable-frequency Controller
Inclined Manometer
Differential @ Pressure Gage
Make-up Fan
Venturi PVC Piping Flexible Air Duct
Figure 2.12 Volumetric Airflow Measurement System
. Room Air Conditioner
the pressure drop across the venturi) and the permanent pressure drop imposed by
the whole ducting system. As flow increases through the venturi, the permanent
pressure drop increases as the square of the velocity. This phenomenon results in a
very large load on the fan motor, which tries to compensate for the pressure loss. It
also increases the measured pressure drop across the venturi, which increases the
readability of the differential pressure measurement. The tradeoff between the high
load on the fan motor and better readability creates the need to have venturis for two
different ranges of flow.
39
3. OPERATING CHARACTERISTICS OF THE ROOM
A study of the steady-state and dynamic behavior of the indoor room was
undertaken to determine the important performance characteristics and to identify any
potential flaws in the design. Such data are essential for understanding and
interpreting the energy and moisture balances and for laying out a schedule of future
tests.
Before discussing the data, we shall describe a simple model of the indoor room
which is useful for interpreting the results. Figure 3.1 illustrates how the energy and
moisture balances are conceptualized. The major elements include (a) the air in the
indoor room, (b) the walls of the indoor room, (c) the test unit, (d) the reconditioning
equipment, (e) the air of the outdoor room and (f) the ambient. These last two
elements give rise to the unavoidable parasitic losses. The "ambient", consisting of
the total surroundings (including the outdoor room), is represented by a single area
weighted average temperature. The ambient is viewed as a large heat sink with which
the walls may freely exchange heat. Because great care was taken to avoid moisture
transfer to the walls of the room, there is no direct transfer of moisture to the walls.
However, it is impossible to seal against moisture transfer through the passageways of
the test unit itself. This exchange mechanism must be included in developing the
moisture balance for the air in the indoor room.
The basic features of the model are summarized in Table 3.1. Here, the key
assumptions are laid out, the governing equations are presented and their solutions
are given. A simple lumped-parameter approach is used. The most important results
of this analysis are as follows.
1. The model includes six parameters which characterize the exchange and storage
mechanisms of the room, and one parameter f which characterizes the
distribution of energy added by the reconditioning equipment. Using an electrical
analogy, we may say that these first six parameters characterize the resistances
and capacitances of the room. Specifically, the exchange mechanisms
(resistances) are characterized by the three parameters (U1 A1), (U2 A2), and (Um Am pg); and the storage mechanisms (capacitances) are characterized by the
three parameters (ma cpa), (mw cpw), and mao
2. At equilibrium, the energy removed by the test unit is equal to the energy added
by the reconditioning equipment less a correction which accounts for the parasitic
40
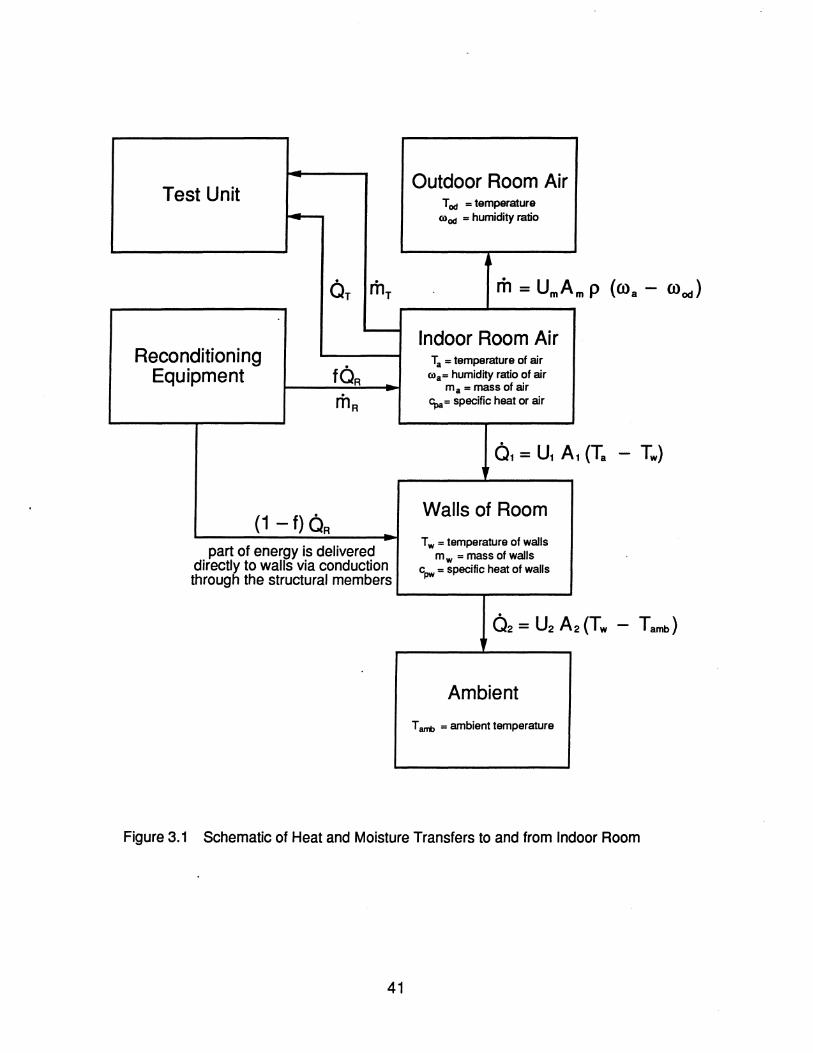
Test Unit
Reconditioning Equipment
part of energy is delivered directly to walls via conduction through the structural members
Outdoor Room Air T od = temperature
mod = humidity ratio
Indoor Room Air Ta = temperature of air
ma= humidity ratio of air ma = mass of air
Cpa= specific heat or air
Walls of Room
T w = temperature of walls m w = mass of walls
Cpw = specific heat of walls
Ambient
T amb = ambient temperature
Figure 3.1 Schematic of Heat and Moisture Transfers to and from Indoor Room
41
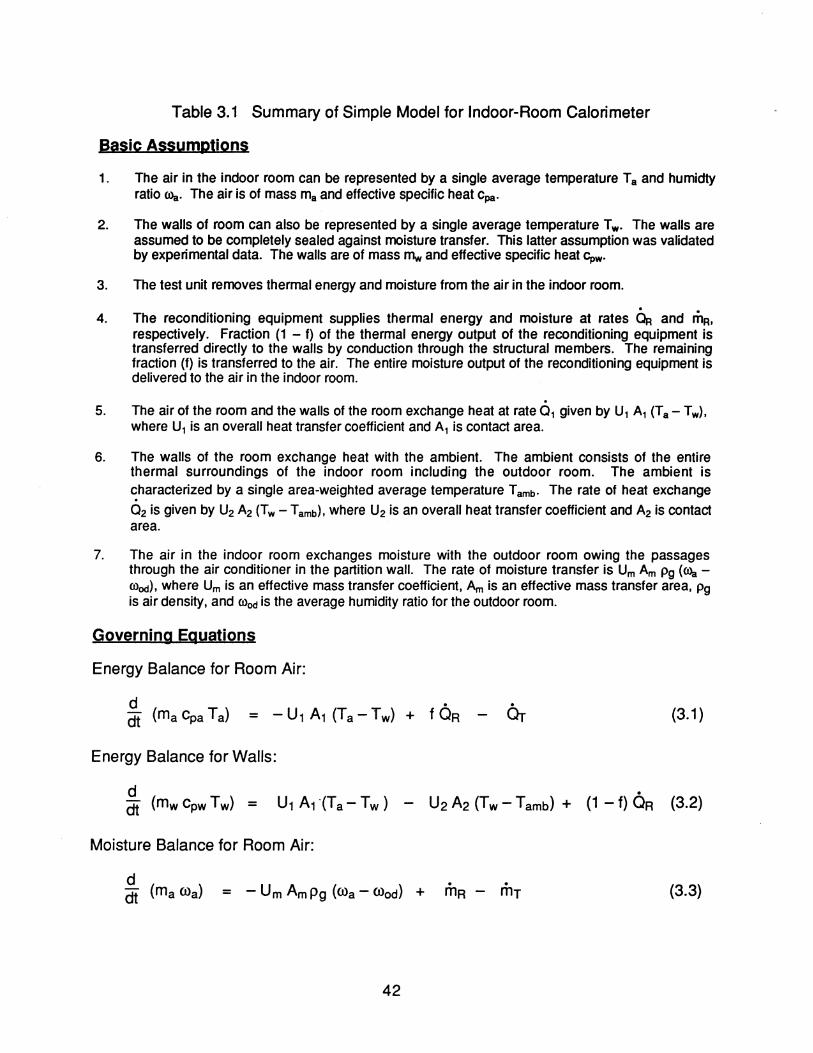
Table 3.1 Summary of Simple Model for Indoor-Room Calorimeter
Basic Assumptions
1. The air in the indoor room can be represented by a single average temperature Ta and humidty ratio COa. The air is of mass ma and effective specific heat cpa.
2. The walls of room can also be represented by a single average temperature T w' The walls are assumed to be completely sealed against moisture transfer. This latter assumption was validated by experimental data. The walls are of mass mw and effective specific heat Cpw.
3. The test unit removes thermal energy and moisture from the air in the indoor room.
4. The reconditioning equipment supplies thermal energy and moisture at rates ~ and mR. respectively. Fraction (1 - f) of the thermal energy output of the reconditioning equipment is transferred directly to the walls by conduction through the structural members. The remaining fraction (f) is transferred to the air. The entire moisture output of the reconditioning equipment is delivered to the air in the indoor room.
. 5. The air of the room and the walls of the room exchange heat at rate 0 1 given by U1 A1 (Ta - T w).
where U1 is an overall heat transfer coefficient and A1 is contact area.
6. The walls of the room exchange heat with the ambient. The ambient consists of the entire thermal surroundings of the indoor room including the outdoor room. The ambient is ~haracterized by a single area-weighted average temperature T ambo The rate of heat exchange
O2 is given by U2 A2 (Tw - Tamb). where U2 is an overall heat transfer coefficient and A2 is contact area.
7. The air in the indoor room exchanges moisture with the outdoor room owing the passages through the air conditioner in the partition wall. The rate of moisture transfer is Um Am Pg (COa -rood). where Um is an effective mass transfer coefficient. Am is an effective mass transfer area. Pg is air density. and rood is the average humidity ratio for the outdoor room.
Governing Eqyations
Energy Balance for Room Air:
Energy Balance for Walls:
Moisture Balance for Room Air:
42
(3.1 )
. mT (3.3)
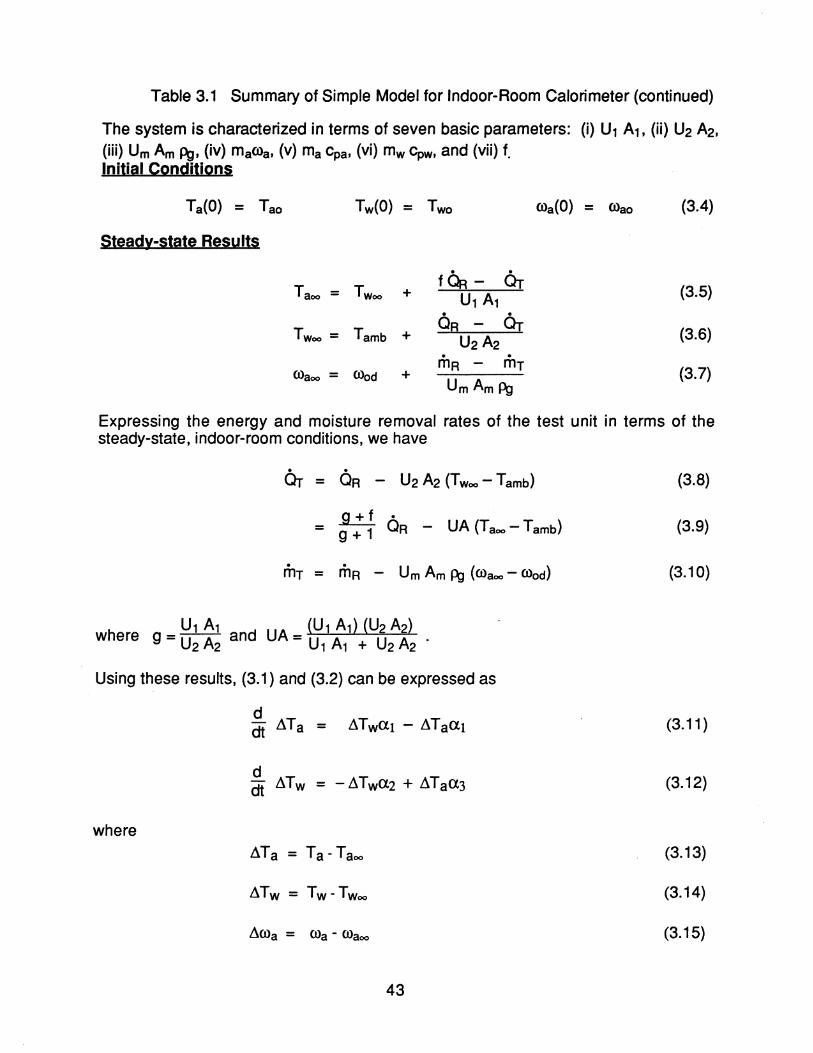
Table 3.1 Summary of Simple Model for Indoor-Room Calorimeter (continued)
The system is characterized in terms of seven basic parameters: (i) Ul Al. (ii) U2 A2. (iii) Um Am Pg. (iv) maCOa. (v) rna Cpa. (vi) mw cpw• and (vii) 1. Initial Conditions
Ta(O) = Tao
Steady-state Results
Tw(O) = Two
Twoo = Tamb +
maoo = Olod +
f~ - Ch Ul Al
OR - Ch U2 A2
rnR - rnT Um Am Pg
ma(O) = mao (3.4)
(3.5)
(3.6)
(3.7)
Expressing the energy and moisture removal rates of the test unit in terms of the steady-state. indoor-room conditions. we have
. . Or = OR - U2 A2 (Twoo - Tamb)
= .a.±.! . g + 1 OR - UA (Taoo - Tamb)
. . Um Am Pg (maoo - mod) mT = mR -
where g = ~~ ~~ and UA _ (U1 Al) (U2 A2) - Ul A1 + U2 A2 .
Using these results. (3.1) and (3.2) can be expressed as
where ~ T a = T a - T aoo
~Tw = Tw- Twoo
~ma = ma - maoo
43
(3.8)
(3.9)
(3.10)
(3.11 )
(3.12)
(3.13)
(3.14)
(3.15)
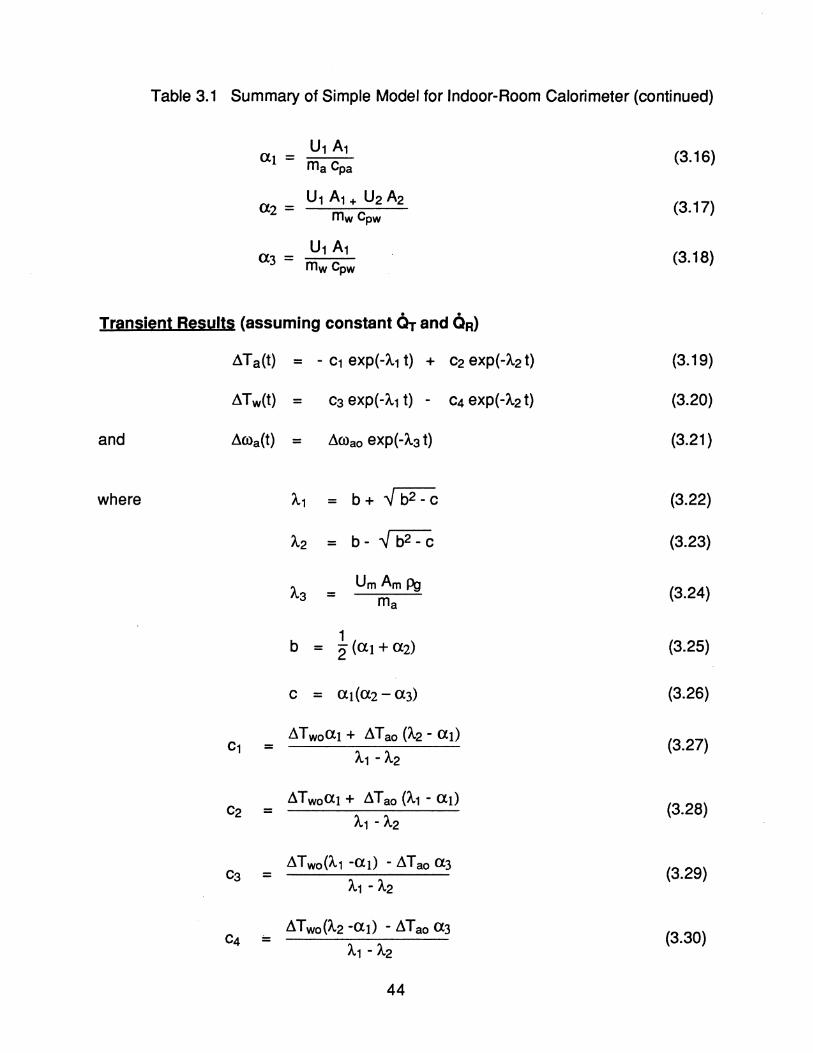
Table 3.1 Summary of Simple Model for Indoor-Room Calorimeter (continued)
al = U1 A1 rna cpa
a2 = U1 A1 + U2 A2 rnwcpw
a3 = U1 A1 rnwcpw
Transient Results (assuming constant Or and QR)
and Acoa(t) = Acoao exp(-A.3 t)
where 1..1 = b+ ~ b2 -c
1..2 = b-~b2-c
1..3 = Um Am Pg
rna
b 1
= 2 (al + (2)
c = al(a2 - (3)
C1 AT woal + ATao (1..2 - al)
= 1..1 - 1..2
C2 ATwoal + ATao (1..1 - al)
= 1..1 - 1..2
C3 AT wo(A.1 -al) - ATao a3
= 1..1 - 1..2
C4 AT wo(A.2 -al) - ATao a3
= 1..1 - 1..2
44
(3.16)
(3.17)
(3.18)
(3.19)
(3.20)
(3.21 )
(3.22)
(3.23)
(3.24)
(3.25)
(3.26)
(3.27)
(3.28)
(3.29)
(3.30)
loss through the walls to the ambient. This parasitic loss is a well-defined
function of the temperature difference between the air in the room and the
ambient temperature.
3. Similarly, the moisture removed by the test unit equals the moisture added by the
reconditioning equipment less a correction which accounts for the parasitic loss to
the outdoor room. This correction is a well-defined function of the difference in
humidity ratio between the indoor and outdoor rooms.
4. The transient response of the system is characterized by two time constants (11A1
and 1/'),,2). We shall refer to these as the "long" and "short" time constants,
respectively. The long time constant determines how quickly the system reaches
steady state.
5. Two parameters, ma and macpa , can be determined from geometric
considerations alone since only the air inside the room need be considered. The
remaining parameters, although physically meaningful, must be determined
empirically by analyzing the steady-state and transient behavior of the room.
6. The parameters of greatest practical interest are (i) the UA-value for parasitic heat loss from the room at steady state, (ii) the UApg-value for parasitic moisture
loss from the room at steady state, and (iii) the two time constants governing
transient behavior. The following discussion will focus primarily on these three
sets of parameters.
3.1 Test Facility Behavior without Room Air Conditioner Running
The first tests performed in the facility were run without the air conditioner
operating. These were used to determine the system behavior at both steady-state
and dynamic conditions. These tests are critical to the complete evaluation o~ the
facility because the data obtained is independent of the air conditioner, and is thus
more representative of the calorimeter itself.
3.1.1 Heat Loss Tests
Heat loss from the indoor room can be most easily measured by maintaining the
room at a constant temperature with a precisely known heat input. At steady-state, the
45
heat input equals the heat leakage through the walls. Such testing must be performed
without the air conditioner and reconditioning equipment running, since the energy
transfer associated with these devices easily overwhelms the losses being measured.
In fact, the fans of reconditioning equipment alone dissipate more energy than is lost
through the walls of the room over the range of temperature differences of interest to
us. Fortunately, the conduction resistance of the walls is more than 8500 times the
convection resistance between the air and the walls, so that the slight difference in
convection resistance between the stagnant room and the mixed room is negligibly
small indeed.
The heat exchange through the walls of the chamber was first measured with the
air conditioner window plugged with insulation of the same type and thickness as the
walls. A 100-W light bulb supplied the heat load for the indoor room. The voltage
applied to the light bulb was controlled by an autotransformer so that the heat input
could be regulated. We selected four levels of heat input at which to gather data.
After the room reached a steady-state temperature at each heat input level, we
measured the power drawn by the light bulb and recorded the indoor and outdoor
room temperatures. Heat loss is plotted versus the temperature difference between
the indoor and outdoor rooms in Figure 3.2. Here, we assume that the air spaces
surrounding the chamber were at the same temperature as the outdoor room. This
assumption produces some error in the heat loss calibration, but reasonable results
are nevertheless obtained for the overall heat transfer resistance of the walls. The
resistance calculated from a linear least-squares curve fit of the data in Figure 3.2
corresponds to an R-value of 77. This result compares favorably with the R-value of
84 calculated based on the quoted conductive resistance of the foam. Another small,
but unavoidable source of error in the calibration is the temperature gradient in the
room. Some care is necessary in placing the sensors. This point is especially
important when a test unit is present as is more fully addressed below.
A second test was performed with a Whirlpool 1.5-ton air conditioner mounted in
the partition wall. In this case, individual temperatures were measured at several
locations in the air space surrounding the indoor room, allowing for a more
representative ambient temperature to be calculated. Moreover, since we have some
experience operating this particular air conditioner, we also have a good idea where to
measure the average room temperature to minimize the effect of gradients.
The area-weighted-average ambient temperature is computed using the following
relationship.
46
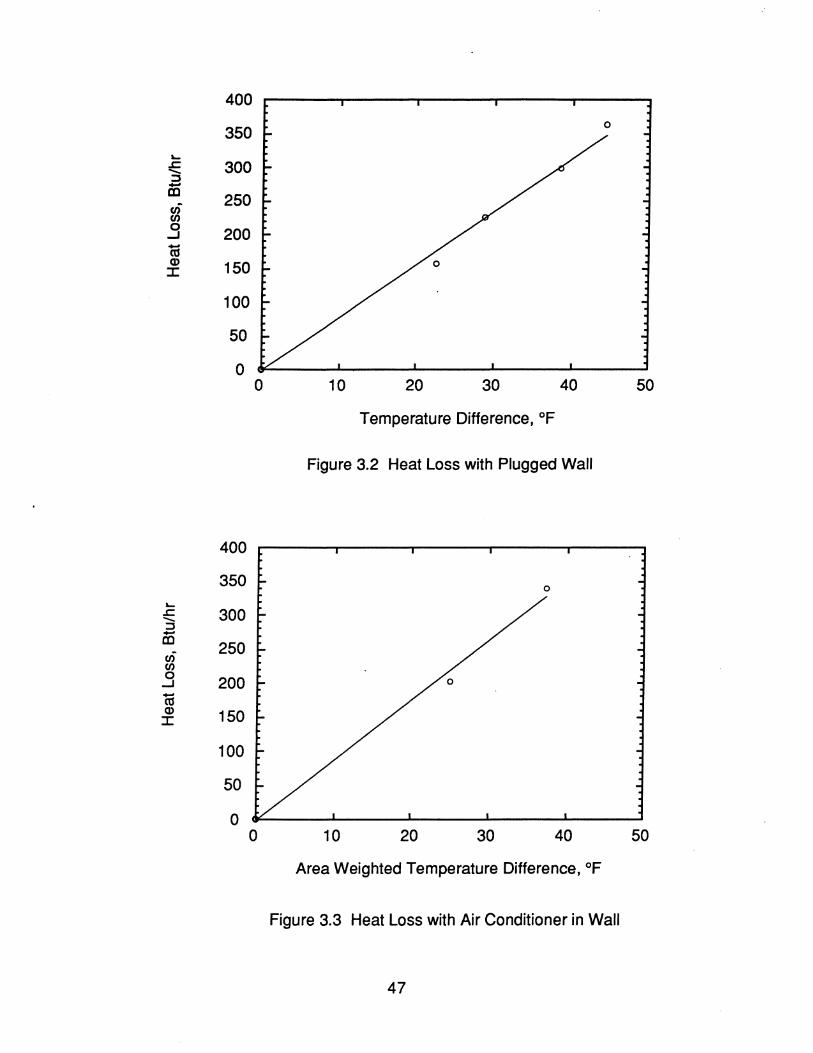
400
350 o
L.. .r:. 300 -::l as
250 ur en 0
200 ~
m (I)
150 ::c
100
50
0 0 10 20 30 40 50
Temperature Difference, OF
Figure 3.2 Heat Loss with Plugged Wall
400
350 o L.. .r:. 300 -::l as
250 ur en 0
200 ~
m CD 150 ::c
100
50
0 0 10 20 30 40 50
Area Weighted Temperature Difference, OF
Figure 3.3 Heat Loss with Air Conditioner in Wall
47
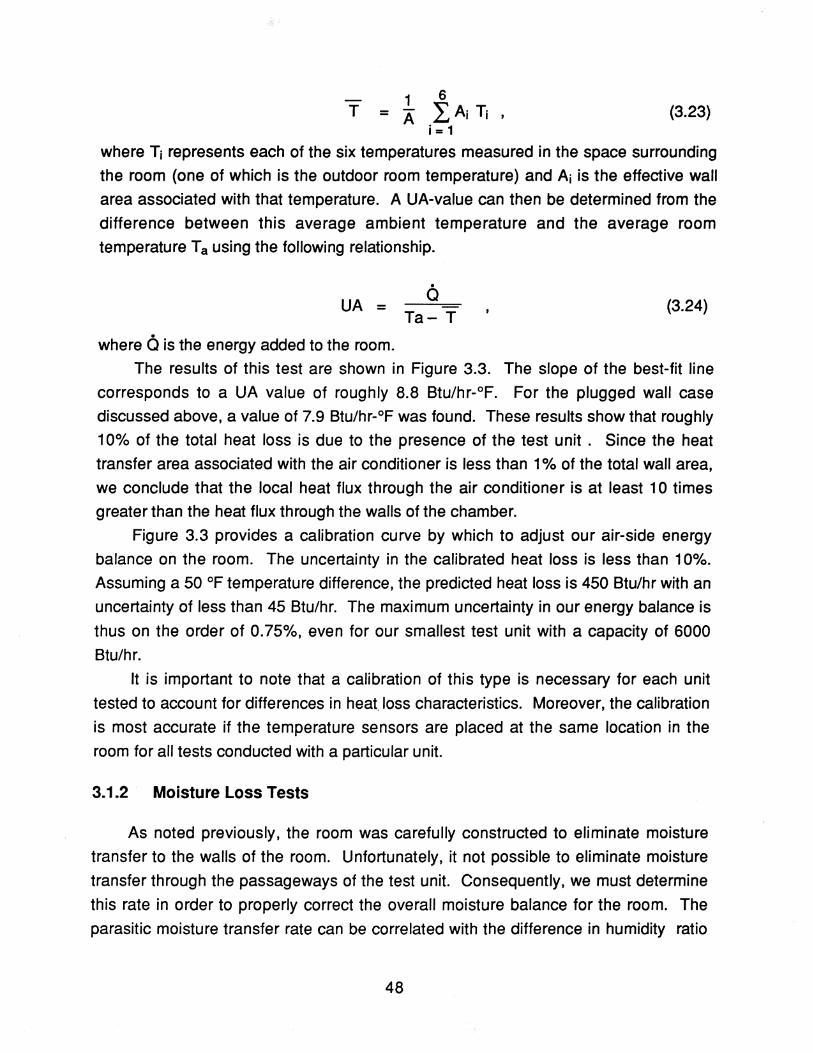
1 6 T = A L Ai Ti (3.23)
i = 1
where Ti represents each of the six temperatures measured in the space surrounding
the room (one of which is the outdoor room temperature) and Ai is the effective wall
area associated with that temperature. A UA-value can then be determined from the
difference between this average ambient temperature and the average room
temperature T a using the following relationship.
UA = Ta- T
(;) (3.24)
where 6 is the energy added to the room.
The results of this test are shown in Figure 3.3. The slope of the best-fit line
corresponds to a UA value of roughly 8.8 Btu/hr-oF. For the plugged wall case
discussed above, a value of 7.9 Btu/hr-oF was found. These results show that roughly
10% of the total heat loss is due to the presence of the test unit. Since the heat
transfer area associated with the air conditioner is less than 1 % of the total wall area,
we conclude that the local heat flux through the air conditioner is at least 10 times
greater than the heat flux through the walls of the chamber.
Figure 3.3 provides a calibration curve by which to adjust our air-side energy
balance on the room. The uncertainty in the calibrated heat loss is less than 10%.
Assuming a 50 OF temperature difference, the predicted heat loss is 450 Btu/hr with an
uncertainty of less than 45 Btu/hr. The maximum uncertainty in our energy balance is
thus on the order of 0.75%, even for our smallest test unit with a capacity of 6000
Btu/hr.
It is important to note that a calibration of this type is necessary for each unit
tested to account for differences in heat. loss characteristics. Moreover, the calibration
is most accurate if the temperature sensors are placed at the same location in the
room for all tests conducted with a particular unit.
3.1.2 Moisture Loss Tests
As noted previously, the room was carefully constructed to eliminate moisture
transfer to the walls of the room. Unfortunately, it not possible to eliminate moisture
transfer through the passageways of the test unit. Consequently, we must determine
this rate in order to properly correct the overall moisture balance for the room. The
parasitic moisture transfer rate can be correlated with the difference in humidity ratio
48
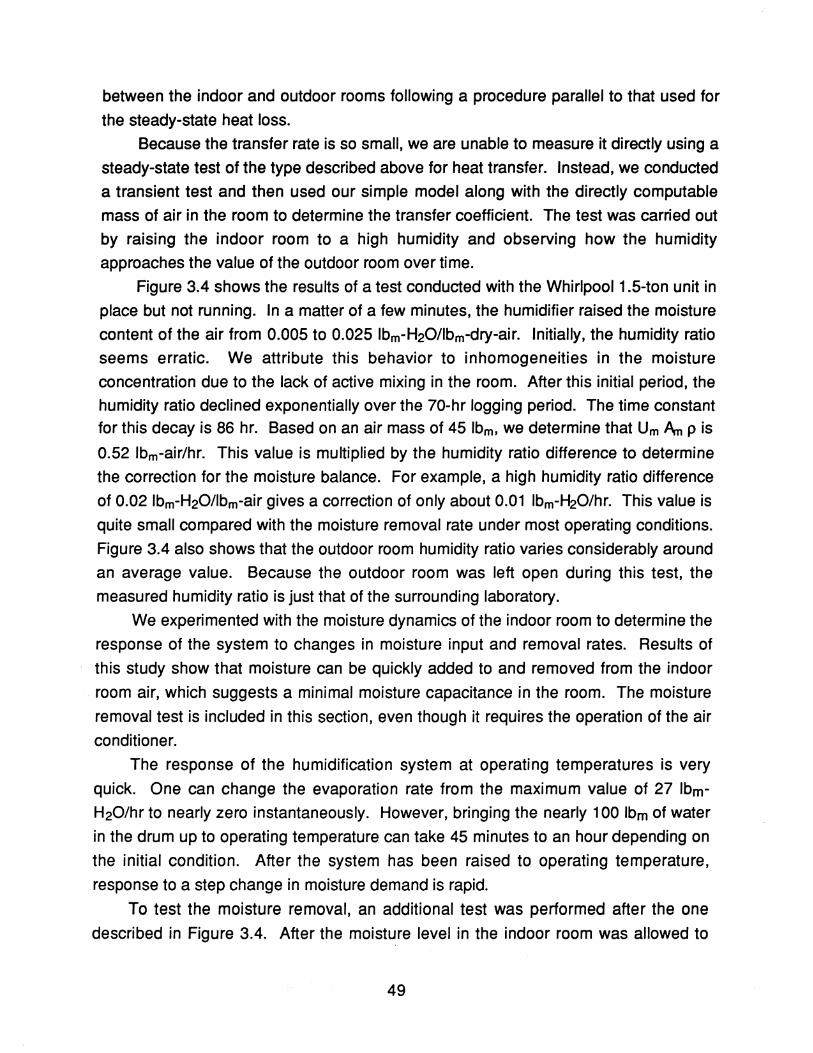
between the indoor and outdoor rooms following a procedure parallel to that used for
the steady-state heat loss.
Because the transfer rate is so small, we are unable to measure it directly using a
steady-state test of the type described above for heat transfer. Instead, we conducted
a transient test and then used our simple model along with the directly computable
mass of air in the room to determine the transfer coefficient. The test was carried out
by raising the indoor room to a high humidity and observing how the humidity
approaches the value of the outdoor room over time.
Figure 3.4 shows the results of a test conducted with the Whirlpool 1.5-ton unit in
place but not running. In a matter of a few minutes, the humidifier raised the moisture
content of the air from 0.005 to 0.025 Ibm-H20/Ibm-dry-air. Initially, the humidity ratio
seems erratic. We attribute this behavior to inhomogeneities in the moisture
concentration due to the lack of active mixing in the room. After this initial period, the
humidity ratio declined exponentially over the 70-hr logging period. The time constant for this decay is 86 hr. Based on an air mass of 45 Ibm, we determine that Um Am p is
0.52 Ibm-air/hr. This value is multiplied by the humidity ratio difference to determine
the correction for the moisture balance. For example, a high humidity ratio difference
of 0.02 Ibm-H20/lbm-air gives a correction of only about 0.01 Ibm-~O/hr. This value is
quite small compared with the moisture removal rate under most operating conditions.
Figure 3.4 also shows that the outdoor room humidity ratio varies considerably around
an average value. Because the outdoor room was left open during this test, the
measured humidity ratio is just that of the surrounding laboratory.
We experimented with the moisture dynamics of the indoor room to determine the
response of the system to changes in moisture input and removal rates. Results of
this study show that moisture can be quickly added to and removed from the indoor
room air, which suggests a minimal moisture capacitance in the room. The moisture
removal test is included in this section, even though it requires the operation of the air
conditioner.
The response of the humidification system at operating temperatures is very
quick. One can change the evaporation rate from the maximum value of 27 Ibm-
H20/hr to nearly zero instantaneously. However, bringing the nearly 100 Ibm of water
in the drum up to operating temperature can take 45 minutes to an hour depending on
the initial condition. After the system has been raised to operating temperature,
response to a step change in moisture demand is rapid.
To test the moisture removal, an additional test was performed after the one
described in Figure 3.4. After the moisture level in the indoor room was allowed to
49
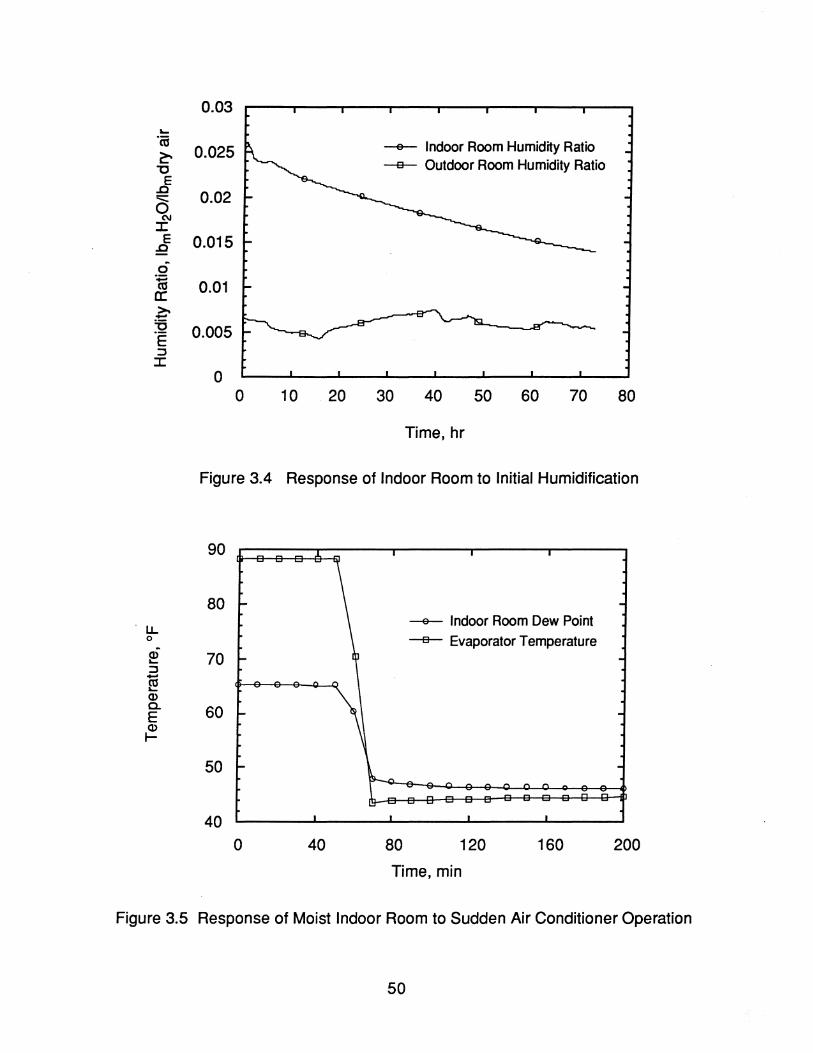
0.03 .... • (ij
0.025 ~ "0
---e-- Indoor Room Humidity Ratio -a- Outdoor Room Humidity Ratio
E .0
0.02 =::::::: 0
N I
E 0.015 :Q
0
~ 0.01 a: >. -=0 0.005 ·E ::J I
0 0 10 20 30 40 50 60 70 80
Time, hr
Figure 3.4 Response of Indoor Room to Initial Humidification
90 I I I
80 - -u.. ---e-- Indoor Room Dew Point 0 -a- Evaporator Temperature ~ 70 ... -::J -~ Q) a. 60 E Q) ....
,..
I- "\ -
50 -~.L'>
_1"\ 1"\ 1"\
~ ;:, ;:;,
."..
40 I
o 40 80 120 160 200
Time, min
Figure 3.5 Response of Moist Indoor Room to Sudden Air Conditioner Operation
50
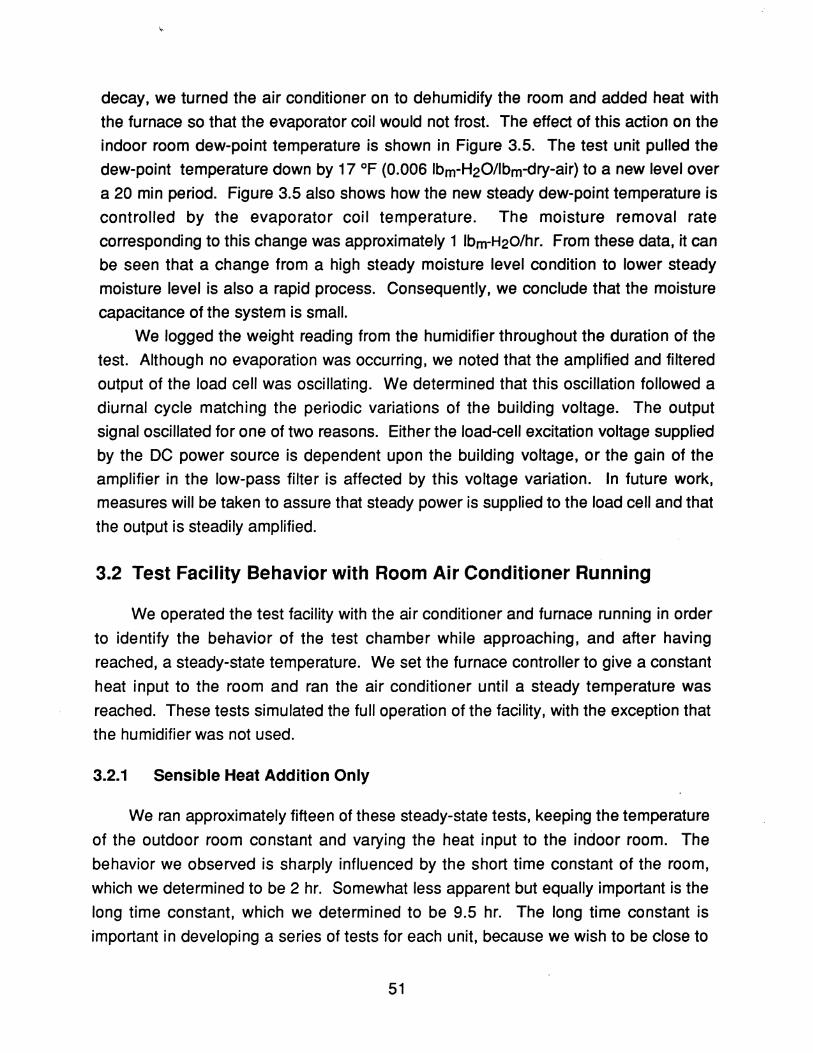
decay, we turned the air conditioner on to dehumidify the room and added heat with
the furnace so that the evaporator coil would not frost. The effect of this action on the
indoor room dew-point temperature is shown in Figure 3.5. The test unit pulled the
dew-point temperature down by 17 OF (0.006 Ibm-H20/lbm-dry-air) to a new level over
a 20 min period. Figure 3.5 also shows how the new steady dew-point temperature is
controlled by the evaporator coil temperature. The moisture removal rate
corresponding to this change was approximately 1 Ibm-H2o/hr. From these data, it can
be seen that a change from a high steady moisture level condition to lower steady
moisture level is also a rapid process. Consequently, we conclude that the moisture
capacitance of the system is small.
We logged the weight reading from the humidifier throughout the duration of the
test. Although no evaporation was occurring, we noted that the amplified and filtered
output of the load cell was oscillating. We determined that this oscillation followed a
diurnal cycle matching the periodic variations of the building Voltage. The output
signal oscillated for one of two reasons. Either the load-cell excitation voltage supplied
by the DC power source is dependent upon the building voltage, or the gain of the
amplifier in the low-pass filter is affected by this voltage variation. In future work,
measures will be taken to assure that steady power is supplied to the load cell and that
the output is steadily amplified.
3.2 Test Facility Behavior with Room Air Conditioner Running
We operated the test facility with the air conditioner and furnace running in order
to identify the behavior of the test chamber while approaching, and after having
reached, a steady-state temperature. We set the furnace controller to give a constant
heat input to the room and ran the air conditioner until a steady temperature was
reached. These tests simulated the full operation of the facility, with the exception that
the humidifier was not used.
3.2.1 Sensible Heat Addition Only
We ran approximately fifteen of these steady-state tests, keeping the temperature
of the outdoor room constant and varying the heat input to the indoor room. The
behavior we observed is sharply influenced by the short time constant of the room,
which we determined to be 2 hr. Somewhat less apparent but equally important is the
long time constant, which we determined to be 9.5 hr. The long time constant is
important in developing a series of tests for each unit, because we wish to be close to
51
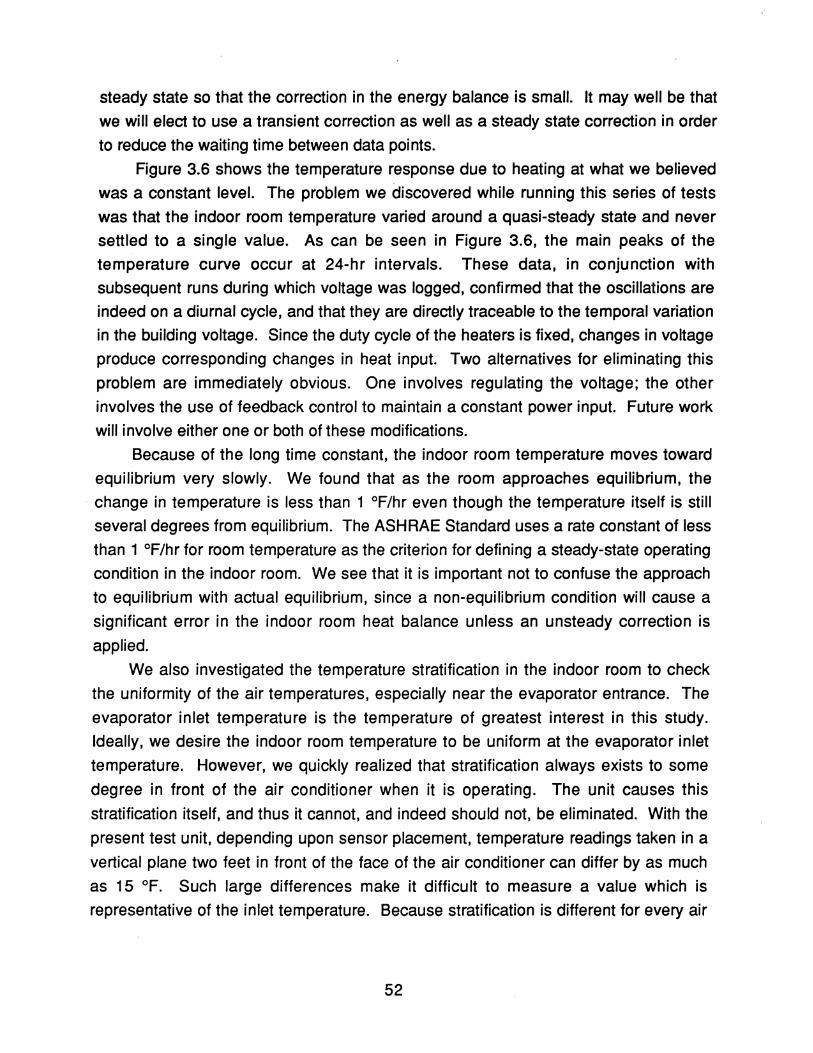
steady state so that the correction in the energy balance is small. It may well be that
we will elect to use a transient correction as well as a steady state correction in order
to reduce the waiting time between data points.
Figure 3.6 shows the temperature response due to heating at what we believed
was a constant level. The problem we discovered while running this series of tests
was that the indoor room temperature varied around a quasi-steady state and never
settled to a single value. As can be seen in Figure 3.6, the main peaks of the
temperature curve occur at 24-hr intervals. These data, in conjunction with
subsequent runs during which voltage was logged, confirmed that the oscillations are
indeed on a diurnal cycle, and that they are directly traceable to the temporal variation
in the building voltage. Since the duty cycle of the heaters is fixed, changes in voltage
produce corresponding changes in heat input. Two alternatives for eliminating this
problem are immediately obvious. One involves regulating the voltage; the other
involves the use of feedback control to maintain a constant power input. Future work
will involve either one or both of these modifications.
Because of the long time constant, the indoor room temperature moves toward
equilibrium very slowly. We found that as the room approaches equilibrium, the
change in temperature is less than 1 °F/hr even though the temperature itself is still
several degrees from equilibrium. The ASHRAE Standard uses a rate constant of less
than 1 °F/hr for room temperature as the criterion for defining a steady-state operating
condition in the indoor room. We see that it is important not to confuse the approach
to equilibrium with actual equilibrium, since a non-equilibrium condition will cause a
significant error in the indoor room heat balance unless an unsteady correction is
applied.
We also investigated the temperature stratification in the indoor room to check
the uniformity of the air temperatures, especially near the evaporator entrance. The
evaporator inlet temperature is the temperature of greatest interest in this study.
Ideally, we desire the indoor room temperature to be uniform at the evaporator inlet
temperature. However, we quickly realized that stratification always exists to some
degree in front of the air conditioner when it is operating. The unit causes this
stratification itself, and thus it cannot, and indeed should not, be eliminated. With the
present test unit, depending upon sensor placement, temperature readings taken in a
vertical plane two feet in front of the face of the air conditioner can differ by as much
as 15 OF. Such large differences make it difficult to measure a value which is
representative of the inlet temperature. Because stratification is different for every air
52
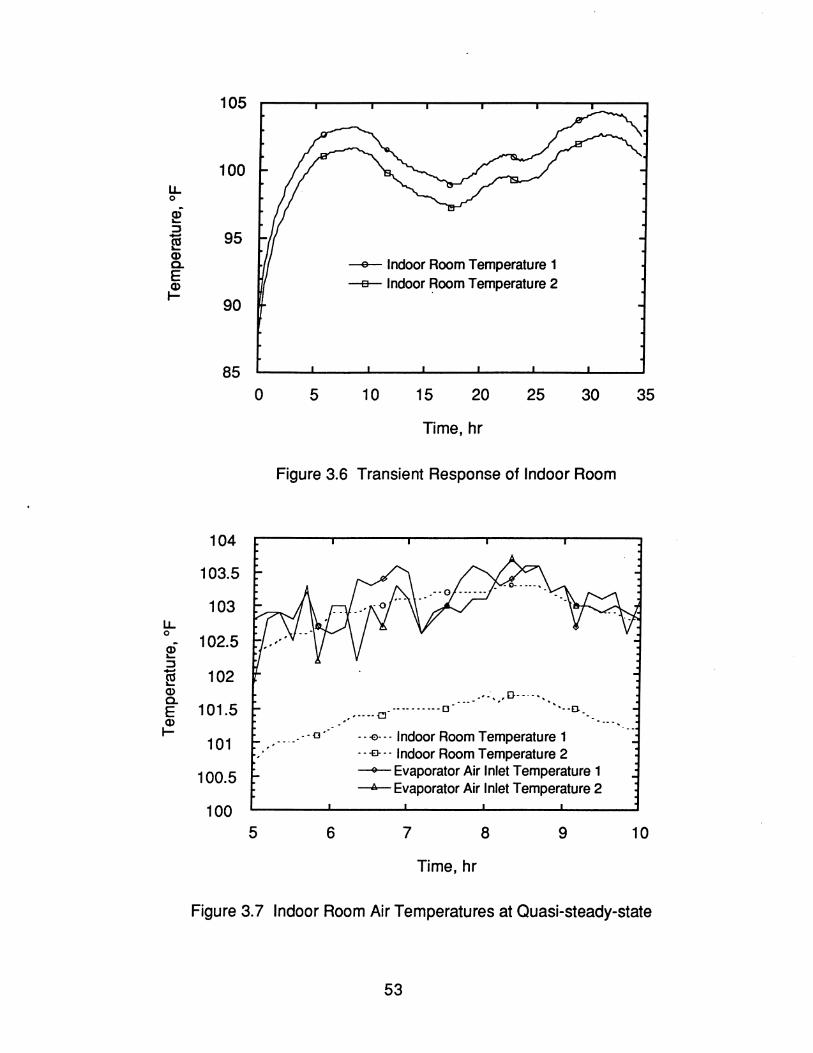
105
100
95
---e- Indoor Room Temperature 1 -e- Indoor ~oom Temperature 2
90
85 o 5 10 15 20 25 30 35
Time, hr
Figure 3.6 Transient Response of Indoor Room
104
103.5
103 u. 0
102.5 e ::J m .... 102 Q) a.
101.5 E Q)
... _. cJ" -- -- - - - .- - D -
." ... ~-
I-101 --0" ---0--- Indoor Room Temperature 1
---£1--- Indoor Room Temperature 2
100.5 ---Evaporator Air Inlet Temperature 1 -I!.- Evaporator Air Inlet Temperature 2
100 5 6 7 8 9 10
Time, hr
Figure 3.7 Indoor Room Air Temperatures at Ouasi-steady-state
53
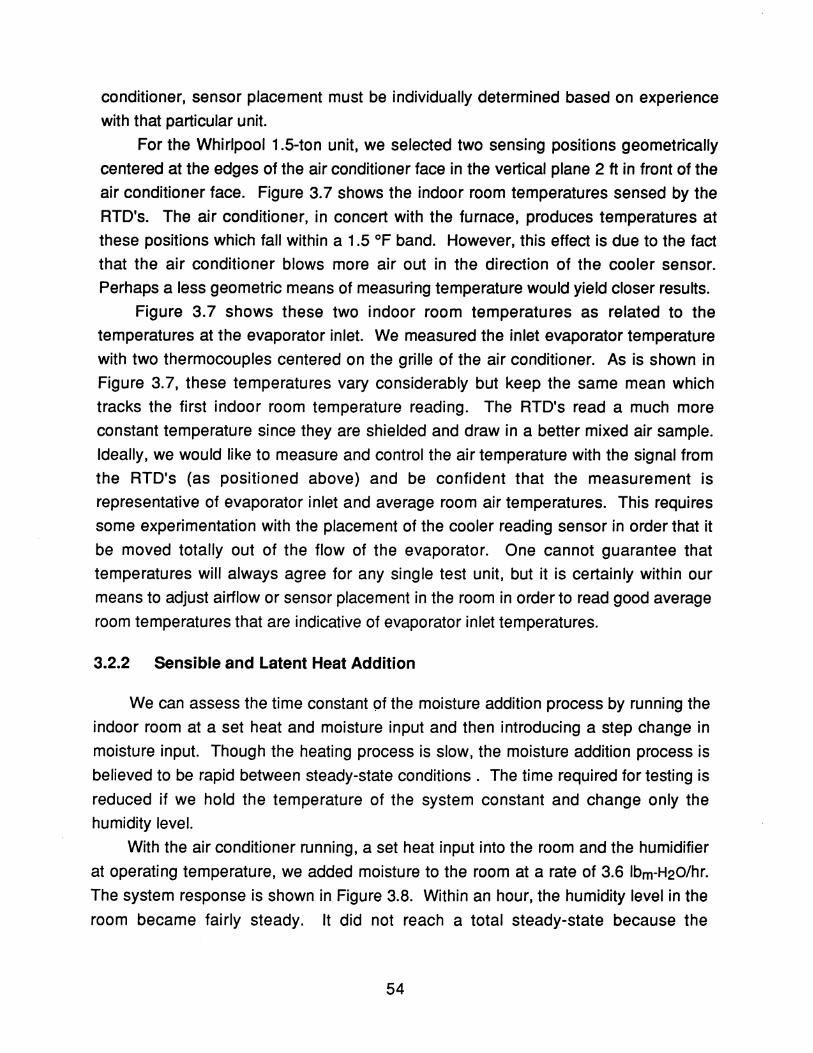
conditioner, sensor placement must be individually determined based on experience
with that particular unit.
For the Whirlpool 1.5-ton unit, we selected two sensing positions geometrically
centered at the edges of the air conditioner face in the vertical plane 2 ft in front of the
air conditioner face. Figure 3.7 shows the indoor room temperatures sensed by the
RTO's. The air conditioner, in concert with the furnace, produces temperatures at these positions which fall within a 1.5 OF band. However, this effect is due to the fact
that the air conditioner blows more air out in the direction of the cooler sensor.
Perhaps a less geometric means of measuring temperature would yield closer results.
Figure 3.7 shows these two indoor room temperatures as related to the
temperatures at the evaporator inlet. We measured the inlet evaporator temperature
with two thermocouples centered on the grille of the air conditioner. As is shown in
Figure 3.7, these temperatures vary considerably but keep the same mean which
tracks the first indoor room temperature reading. The RTO's read a much more
constant temperature since they are shielded and draw in a better mixed air sample.
Ideally, we would like to measure and control the air temperature with the signal from
the RTO's (as positioned above) and be confident that the measurement is
representative of evaporator inlet and average room air temperatures. This requires
some experimentation with the placement of the cooler reading sensor in order that it
be moved totally out of the flow of the evaporator. One cannot guarantee that
temperatures will always agree for any single test unit, but it is certainly within our
means to adjust airflow or sensor placement in the room in order to read good average
room temperatures that are indicative of evaporator inlet temperatures.
3.2.2 Sensible and Latent Heat Addition
We can assess the time constant Of the moisture addition process by running the
indoor room at a set heat and moisture input and then introducing a step change in
moisture input. Though the heating process is slow, the moisture addition process is
believed to be rapid between steady-state conditions. The time required for testing is
reduced if we hold the temperature of the system constant and change only the humidity level.
With the air conditioner running, a set heat input into the room and the humidifier
at operating temperature, we added moisture to the room at a rate of 3.6 Ibm-H20/hr.
The system response is shown in Figure 3.8. Within an hour, the humidity level in the
room became fairly steady. It did not reach a total steady-state because the
54
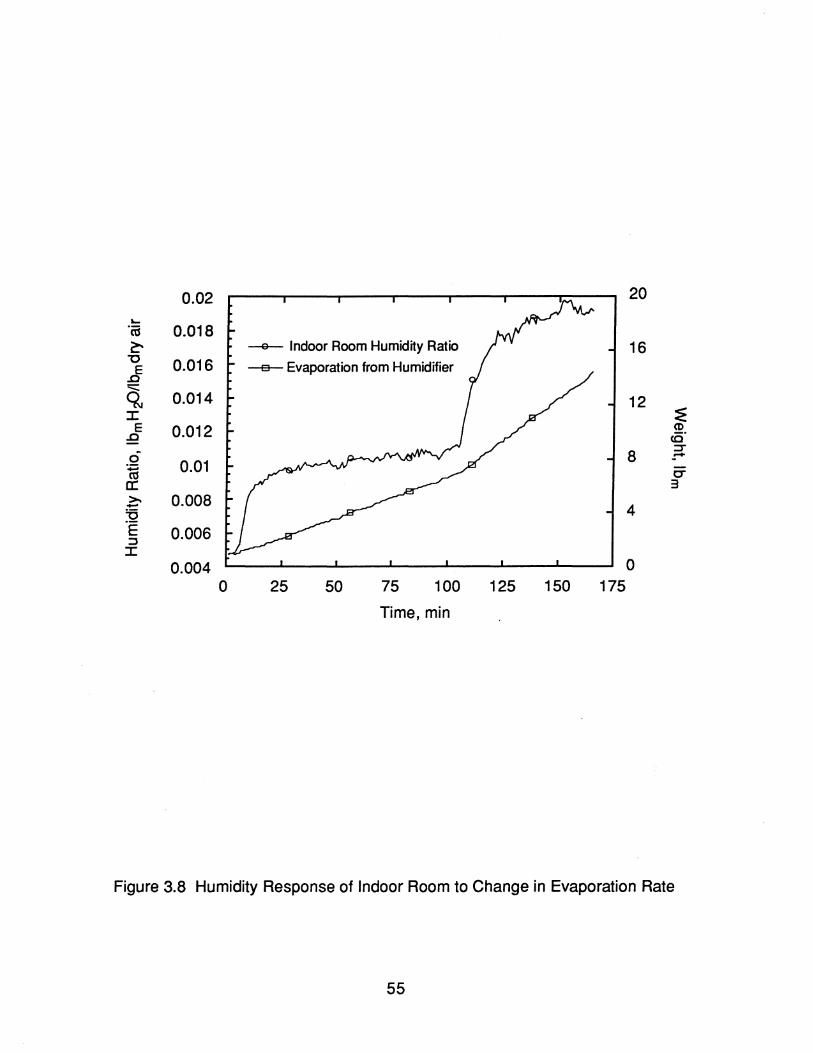
0.02 20
... ·as 0.018 ~ --e- Indoor Room Humidity Ratio 16
"C 0.016 -e- Evaporation from Humidifier ~ ~ 0.014 12 J: ~
E 0.012 CD .Ll cO·
8 ::::T
0 0.01 :+
~ c:::r 0: 3 >- 0.008 - 4 =a ·e 0.006 :J J:
0.004 0 0 25 50 75 100 125 150 175
Time, min
Figure 3.8 Humidity Response of Indoor Room to Change in Evaporation Rate
55
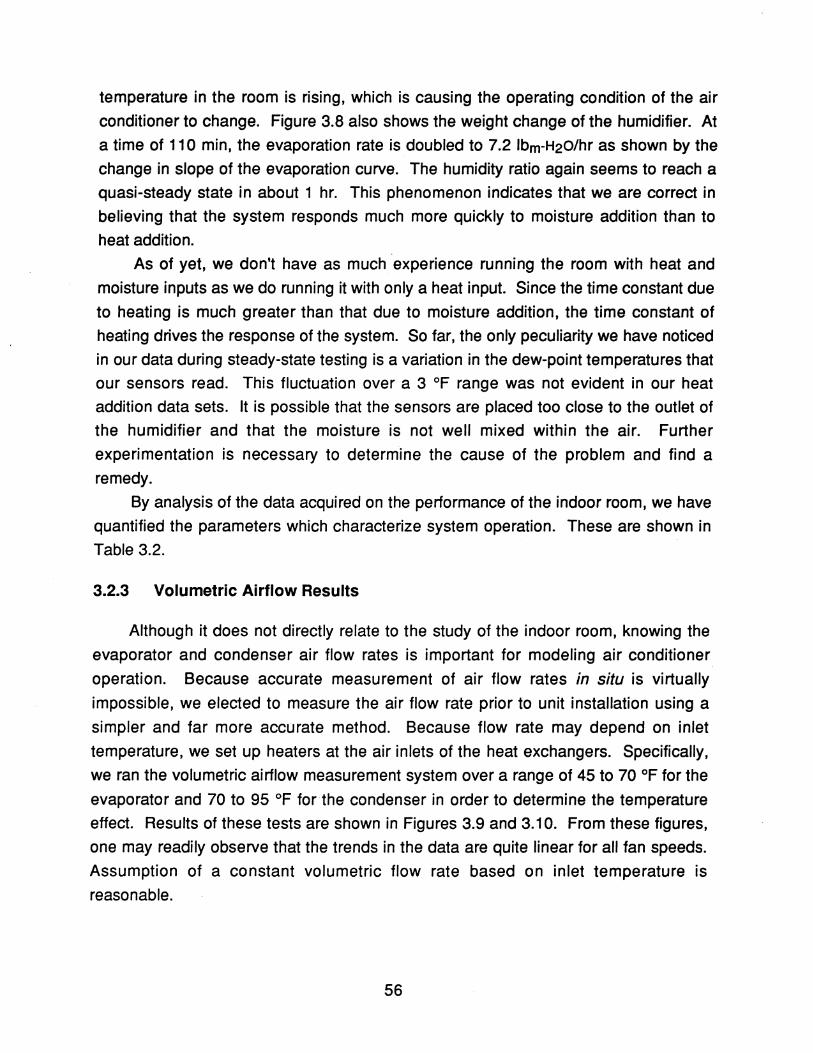
temperature in the room is rising, which is causing the operating condition of the air
conditioner to change. Figure 3.8 also shows the weight change of the humidifier. At
a time of 110 min, the evaporation rate is doubled to 7.2 Ibm-H20/hr as shown by the
change in slope of the evaporation curve. The humidity ratio again seems to reach a
quasi-steady state in about 1 hr. This phenomenon indicates that we are correct in
believing that the system responds much more quickly to moisture addition than to
heat addition.
As of yet, we don't have as much experience running the room with heat and
moisture inputs as we do running it with only a heat input. Since the time constant due
to heating is much greater than that due to moisture addition, the time constant of
heating drives the response of the system. So far, the only peculiarity we have noticed
in our data during steady-state testing is a variation in the dew-point temperatures that
our sensors read. This fluctuation over a 3 OF range was not evident in our heat
addition data sets. It is possible that the sensors are placed too close to the outlet of
the humidifier and that the moisture is not well mixed within the air. Further
experimentation is necessary to determine the cause of the problem and find a
remedy.
By analysis of the data acquired on the performance of the indoor room, we have
quantified the parameters which characterize system operation. These are shown in
Table 3.2.
3.2.3 Volumetric Airflow Results
Although it does not directly relate to the study of the indoor room, knowing the
evaporator and condenser air flow rates is important for modeling air conditioner
operation. Because accurate measurement of air flow rates in situ is virtually
impossible, we elected to measure the air flow rate prior to unit installation using a
simpler and far more accurate method. Because flow rate may depend on inlet
temperature, we set up heaters at the air inlets of the heat exchangers. Specifically,
we ran the volumetric airflow measurement system over a range of 45 to 70 of for the
evaporator and 70 to 95 of for the condenser in order to determine the temperature
effect. Results of these tests are shown in Figures 3.9 and 3.10. From these figures,
one may readily observe that the trends in the data are quite linear for all fan speeds.
Assumption of a constant volumetric flow rate based on inlet temperature is
reasonable.
56
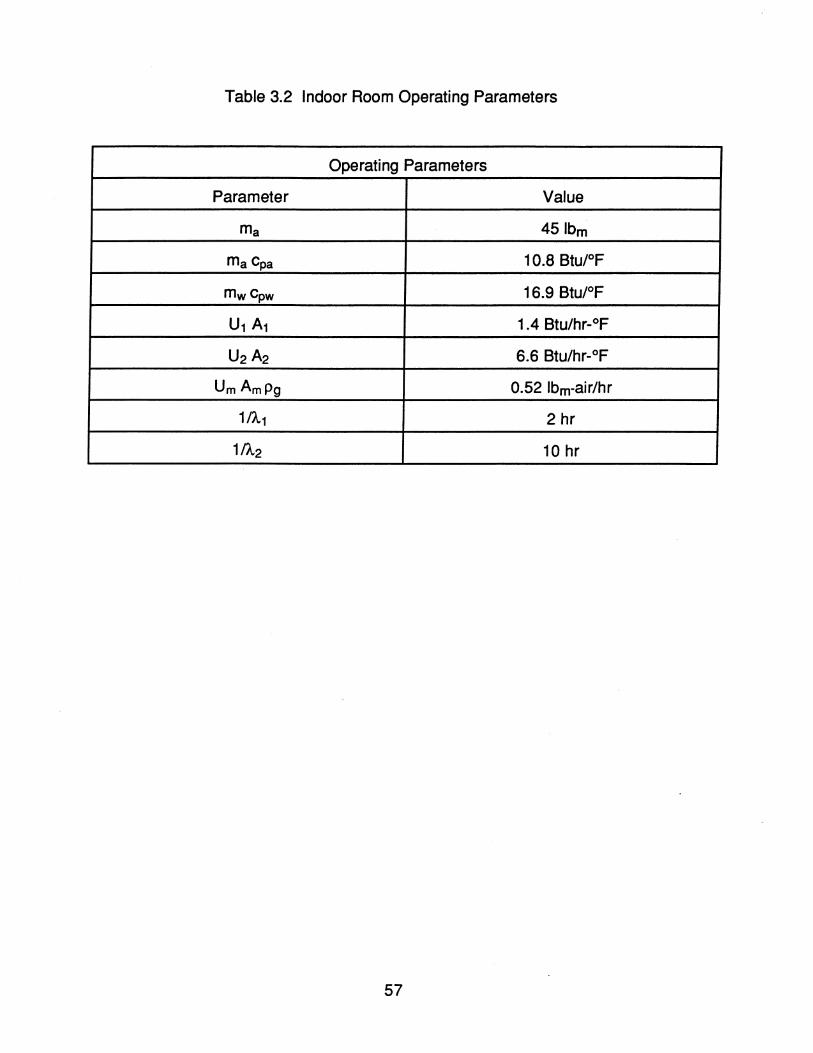
Table 3.2 Indoor Room Operating Parameters
Operating Parameters
Parameter Value
rna 45 Ibm
rna Cpa 10.8 Btu/oF
mwcpw 16.9 Btu/oF
U1 A1 1.4 Btu/hr-oF
U2 A2 6.6 Btu/hr-oF
Urn ArnPg 0.52 Ibm-air/hr
1IA.1 2 hr
1IA.2 10 hr
57
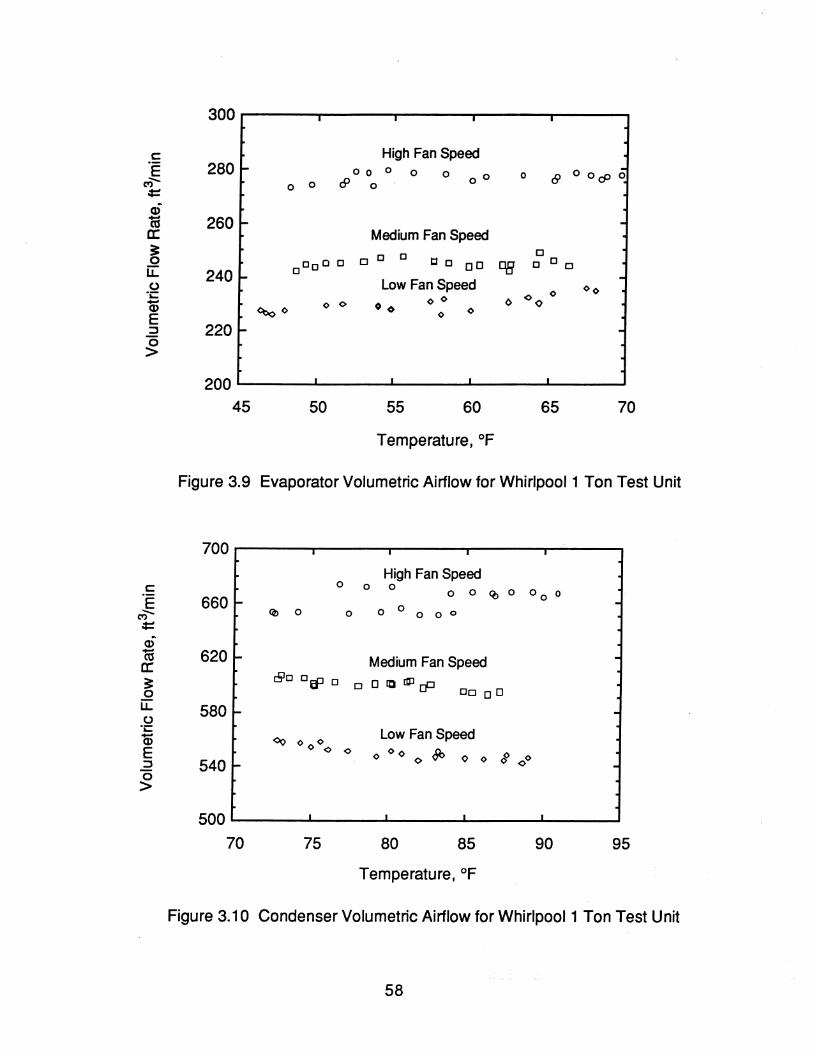
300 I I I I
c:: High Fan Speed ·e 280 f- o 0 0 0 0 0 c9 0 O,p 0 ",- 0 c9 0
00
= 0
ci 1a 260 I- -a: Medium Fan Speed 3= 0 0 0 0 0000 0 0 tI 0 00 DB o 0 0 u:: 240 ... 0 Low Fan Speed
0 00 .;;: 00 <>0 Q) o 0 00 <>
E <=boO 0 0
:::s 220 l- . 0 >
200 I
45 50 55 60 65 70
Temperature, of
Figure 3.9 Evaporator Volumetric Airflow for Whirlpool 1 Ton Test Unit
700 I I I
° High Fan Speed
c:: 0 0 0 ° <b 0 0 0 0 ·e 660 I-
",- q, 0 0 0 o 0 o 0 ·
= Q)
1a 620 I- Medium Fan Speed a: 3= c510 06=1 0 oOlOlIIJcP
00 00 0
·
u- 580 -0 -.;;:
Low Fan Speed Q) ~ 00 0 E <> <> o 00 0 ~ i <>0 <> 0 :::s 540 I-0 · >
500 I I I
70 75 80 85 90 95
Temperature, OF
Figure 3.10 Condenser Volumetric Airflow for Whirlpool 1 Ton Test Unit
58
4. SUMMARY AND CONCLUSIONS
Manufacturers of room air conditioners expend much time and effort testing and
improving the energy efficiency of their product. The need to assess the performance
of room air conditioners has intensified due to tightening government mandated
energy-efficiency standards on household appliances as well as the introduction of
new refrigerants triggered by the environmental impact of CFC's in the atmosphere.
This thesis has been written as part of an ongoing effort aimed at determining the
effects of refrigerant and design changes on system performance. The work
accomplished here in the design and construction of a test facility is the first step in a
continual process.
We have designed the test chamber to measure the COOling and dehumidifying
abilities of room air conditioners rated between 0.5 and 2.5 tons of refrigeration. The
indoor room of the chamber has been outfitted to provide an environment for testing
air conditioners over a wide range of psychrometric conditions. This method allows for
the acquisition of a rich set of data, which will provide a basis for determining the
effects of alternative refrigerants and their associated design changes on system
performance. These data will also facilitate the verification of a concurrently
developed room air conditioner simulation model.
Our design borrows heavily from the calibrated room calorimeter specified by
ASHRAE Standard 16-1983. However, we improved upon this concept by
constructing the chamber with very heavily insulated walls. The walls permit a very
small parasitic heat loss that we can calibrate and use to correct the overall heat
balance needed to determine the energy removal rate of the air conditioner. The error
in this energy balance, associated ~ith heat loss, is simply the error involved in our
prediction of heat loss. The maximum error is small. even as a percentage of the
smallest test unit capacity. The chamber has been sealed meticulously such that we
have almost unmeasurable moisture leakage and storage rates. These rates
introduce an error to our overall moisture balance which is on the same order as the
error associated with the heat loss calibration.
The test facility has been constructed and all of the SUb-systems associated with
the indoor room have been verified to be performing to their specifications. The
humidification system accurately measures the amount of moisture added to the indoor room to 0.05 Ibm. The error associated with predicting the moisture addition
rate is also small. This system, in combination with an accurate power measurement
59
system and the quantified heat and moisture transfers through the indoor room, will
provide the means by which we can make accurate performance measurements.
The dynamic response of the indoor room has been illustrated and time constants
associated with the heat and moisture addition processes have been quantified.
These results will aid the operator of the facility when planning a testing schedule.
The limiting time constants in the system are associated with heating the indoor room.
Heavy testing schedules will warrant the need for an advanced control scheme for
optimizing the amount of time needed to bring the system to steady-state and then
moving on the next steady-state condition. A method for over-relaxing the response of
the system may prove beneficial in reducing the response time required to reach
equilibrium.
We found that steady-state conditions were not easy to maintain in the indoor
room given the fact that the fluctuations in building voltage were causing fluctuations in
the heat input into the room. We must determine whether the specified closed-loop
temperature control is feasible for controlling temperature. If so, temperature will be
controlled to a constant level and the problems associated with fluctuations in heat
input will be eliminated. If we decide that controlling the power input into the room is a
better method of controlling temperature, we will need to regulate the power supplied
to the heating elements.
60
REFERENCES
ASHRAE (1984). Method of Testing for Rating Room Air Conditioners and Packaged Terminal Air Conditioners. Atlanta, ASH RAE Publications.
ASHRAE (1993). "ASHRAE supports revised Montreal Protocol." ASHRAE Journal 35(1): 6.
Feller, S. D. (1993). Design of the Outdoor Environmental Chamber of a Room Air Conditioner Test Facility. University of Illinois at Urbana-Champaign.
Gavin, P. M. (1983). A Theoretical and Experimental Investigation of Evaporation from Drops Containing Nonvolatile Solutes. University of Illinois at Urbana-Champaign.
Miro, C. R., J. E. Cox. (1993). "Refrigerant issues highlighted at Society meeting." ASHRAE Journal 35(3): 14.
NAECA. (1987). National Appliance Energy Conservation Act of 1987. Public Law 100-12.
Squair, P. (1993). ARI testifies at public hearing on accelerated phaseout rule. Koldfax (ARI). 19: 8.
United Nations Environmental Programme. (1987). Montreal protocol on substances that deplete the ozone layer. New York, United Nations.
Wexler, A., S. Hasegawa. (1954). "Relative Humidity-Temperature Relationships of Some Saturated Salt Solutions in the Temperature Range 00 to 500 C." Journal of Research of the National Bureau of Standards 53(1): 19-26.
61