Embed Size (px)
DESCRIPTION
HOW AMERICA RESPONDS A Survey Project at the Institute for Social Research The University of Michigan. - PowerPoint PPT Presentation
Citation preview
HOW AMERICA RESPONDSA Survey Project at the Institute for Social Research
The University of Michigan
Beginning on the afternoon of September 11, a multidisciplinary group of ISR researchers assembled to consider how they could contribute to an understanding of the impact of the attacks on the World Trade Center.

The group included economists, political scientists, psychologists, sociologists, demographers, and survey methodologists
They decided that fielding a survey to measure attitudes and behaviors and how they were related – and disseminating the findings widely – would be an appropriate and useful contribution.
DESIGN OF THE HAR SURVEY
Design discussions focused on 4 areas:
1. INITIAL ASSUMPTIONS
2. HYPOTHESIS FORMATION
3. INSTRUMENTATION
4. SAMPLE DESIGN

DESIGN OF THE HAR SURVEY
INITIAL ASSUMPTIONS
A large number of media polls would provide quick snapshots of reactions to current events
Their primary focus would be on telephone respondents, without much attention to families and children
Their data would be under-analyzed

ISR could do better than this by focusing on:
Longitudinal analysis (past and future)
Families and children
Multidisciplinary structure and analysis
Multivariate analysis

DESIGN OF THE HAR SURVEY
HYPOTHESIS FORMATION
Focus would be on:• psychological well being• political attitudes• social interactions and attitudes• behavioral intentions regarding the
economy
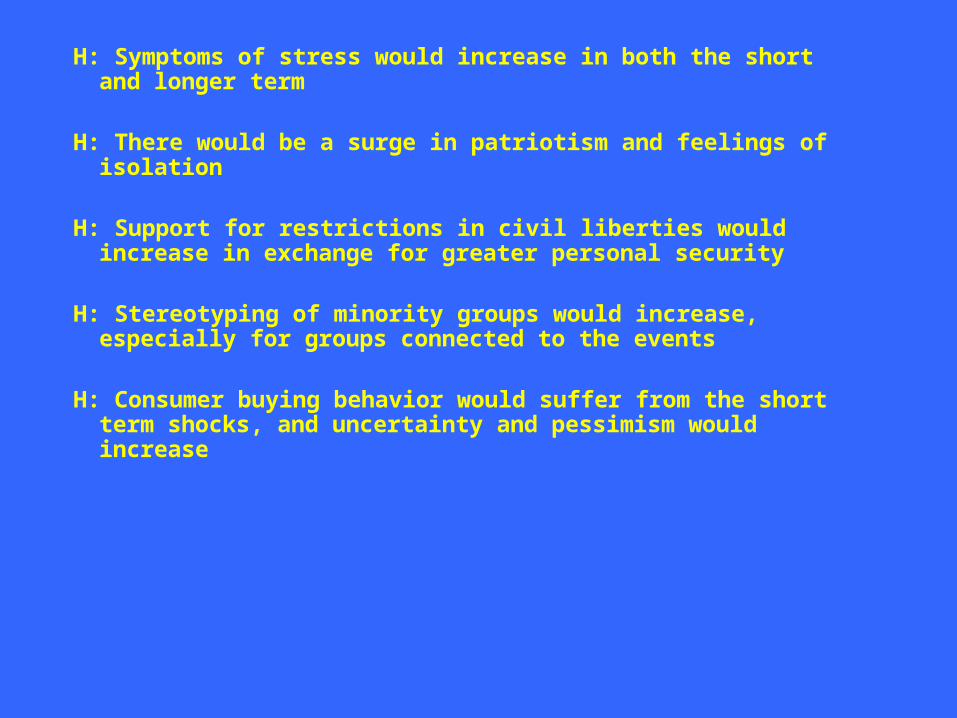
H: Symptoms of stress would increase in both the short and longer term
H: There would be a surge in patriotism and feelings of isolation
H: Support for restrictions in civil liberties would increase in exchange for greater personal security
H: Stereotyping of minority groups would increase, especially for groups connected to the events
H: Consumer buying behavior would suffer from the short term shocks, and uncertainty and pessimism would increase
DESIGN OF THE HAR SURVEY
INSTRUMENTATION
An emphasis was placed on using items from past surveys to produce longitudinal trend data (Oklahoma City, invasion of Iraq, Kennedy assassination)
A CATI application was designed to facilitate rapid data collection and analysis, as well as to provide for appropriate branching and randomization patterns for questions.
DESIGN OF THE HAR SURVEY
SAMPLE DESIGN
A list-assisted sample would be drawn for a national sample of telephone households
The goal would be 750 interviews with a response rate of 60% or greater
Recontact information would be obtained for future waves of interviewing

DESIGN OF THE HAR SURVEY
FIELD WORKInterviewing began on Saturday evening, September 15, after a day of training
The bulk of interviewing was completed by October 8, and initial results appeared in press releases shortly thereafter, based on 668 interviews
To date, 752 interviews have been completed for a response rate of 60%
RESULTS FROM THE HAR SURVEY
The analysis has focused on four main areas:
1. Reactions to the attacks
2. Psychological responses and coping
3. Attitudes about Patriotism and Civil Liberties
4. Economic Attitudes and Behavior
REACTIONS TO THE ATTACKS
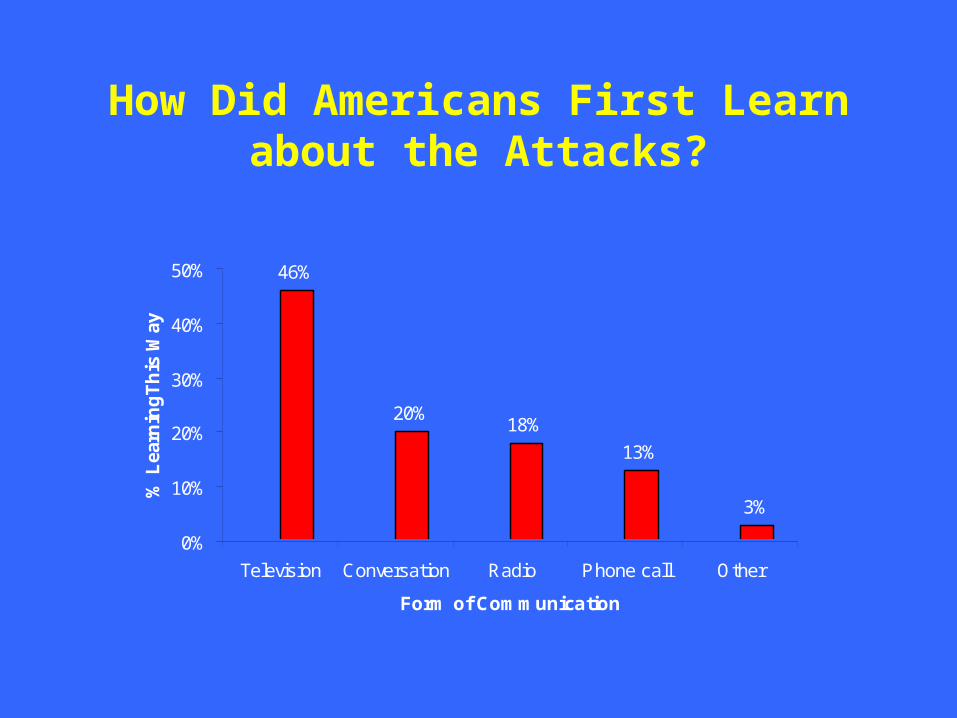
How Did Americans First Learn about the Attacks?
46%
20%18%
13%
3%
0%
10%
20%
30%
40%
50%
Television Conversation Radio Phone call Other
Form of Communication
% L
earn
ing
Th
is W
ay

Americans Followed The News about the Attacks Closely
How Closely Have You Been Following the News about the Recent Terrorist Attacks on New York and Washington D.C.?
Very Closely66%
Somewhat Closely
27%
A Little5%
Not Closely at All2%
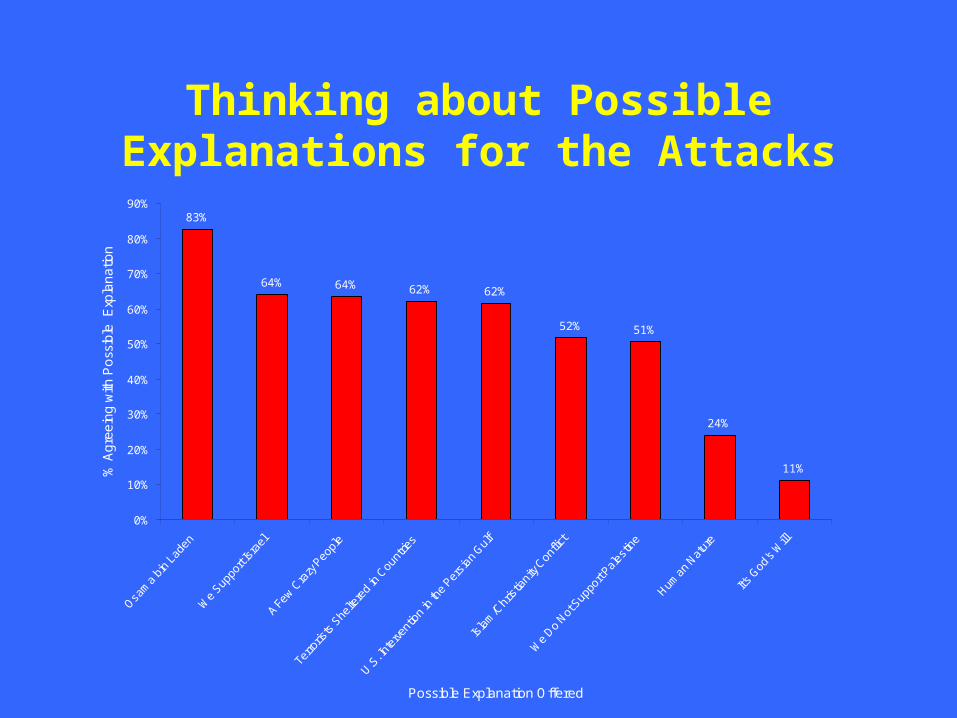
Thinking about Possible Explanations for the Attacks
83%
64% 64% 62% 62%
52% 51%
24%
11%
0%
10%
20%
30%
40%
50%
60%
70%
80%
90%
Osam
a bi
n La
den
We
Suppo
rt Is
rael
A Fe
w Cra
zy P
eopl
e
Terro
rists
She
ltere
d in
Cou
ntrie
s
U.S. In
terve
ntio
n in
the
Persi
an G
ulf
Isla
m/C
hris
tiani
ty Con
flict
We
Do Not
Sup
port
Pales
tine
Human
Nat
ure
It's G
od's
Will
Possible Explanation Offered
% A
gre
ein
g w
ith P
oss
ible
E
xpla
na
tion
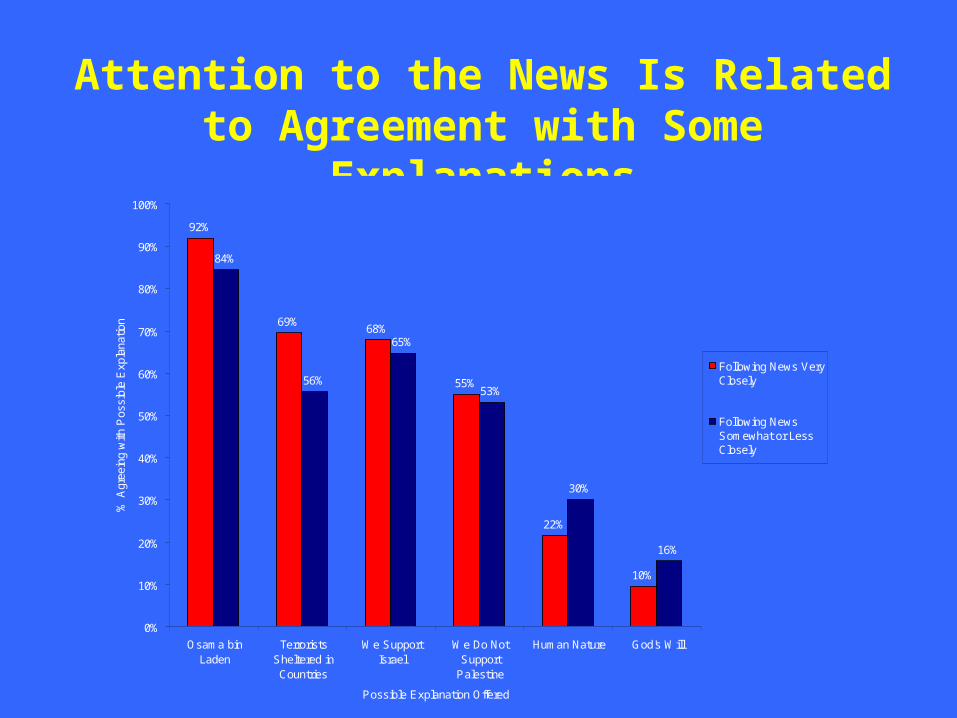
Attention to the News Is Related to Agreement with Some Explanations
92%
69%68%
55%
22%
10%
84%
56%
65%
53%
30%
16%
0%
10%
20%
30%
40%
50%
60%
70%
80%
90%
100%
Osama binLaden
TerroristsSheltered inCountries
We SupportIsrael
We Do NotSupport
Palestine
Human Nature God's Will
Possible Explanation Offered
% A
gree
ing
with
Pos
sibl
e E
xpla
natio
n
Following News VeryClosely
Following NewsSomewhat or LessClosely
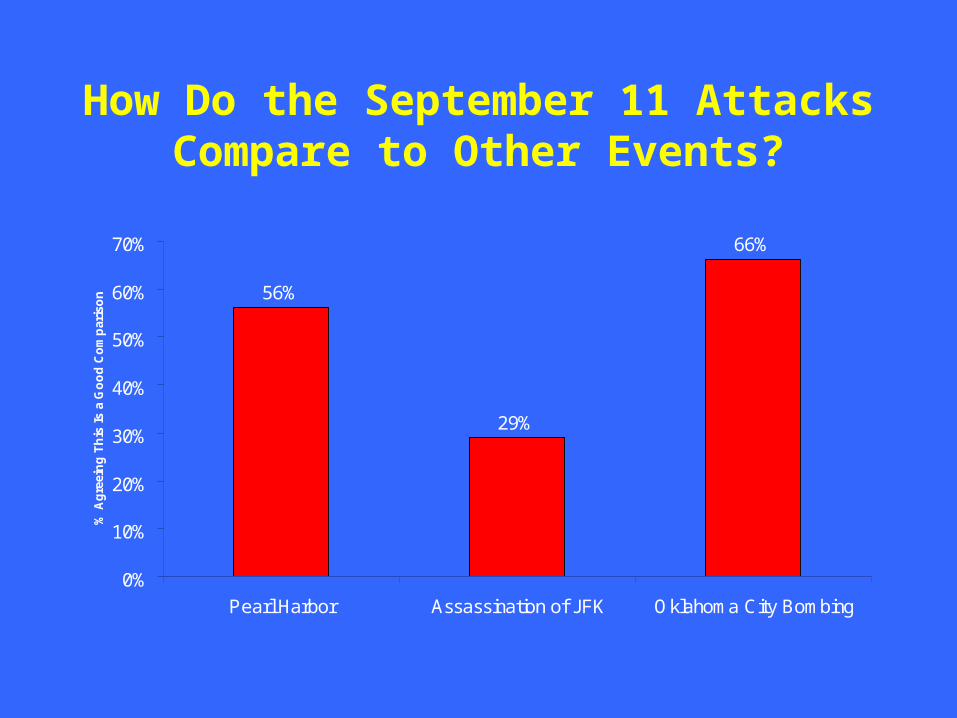
How Do the September 11 Attacks Compare to Other Events?
56%
29%
66%
0%
10%
20%
30%
40%
50%
60%
70%
Pearl Harbor Assassination of JFK Oklahoma City Bombing
% A
gre
ein
g T
his
Is
a G
oo
d C
om
par
iso
n

The Respondents’ Age Affects Which Comparisons They Draw
54%
30%
80%
56%
26%
65%67%
38%
66%
0%
10%
20%
30%
40%
50%
60%
70%
80%
90%
Pearl Harbor Assassination of JFK Oklahoma City Bombing
Comparative Event
% A
gree
ing
to C
ompa
rison
Under 30
30-59
60 and over
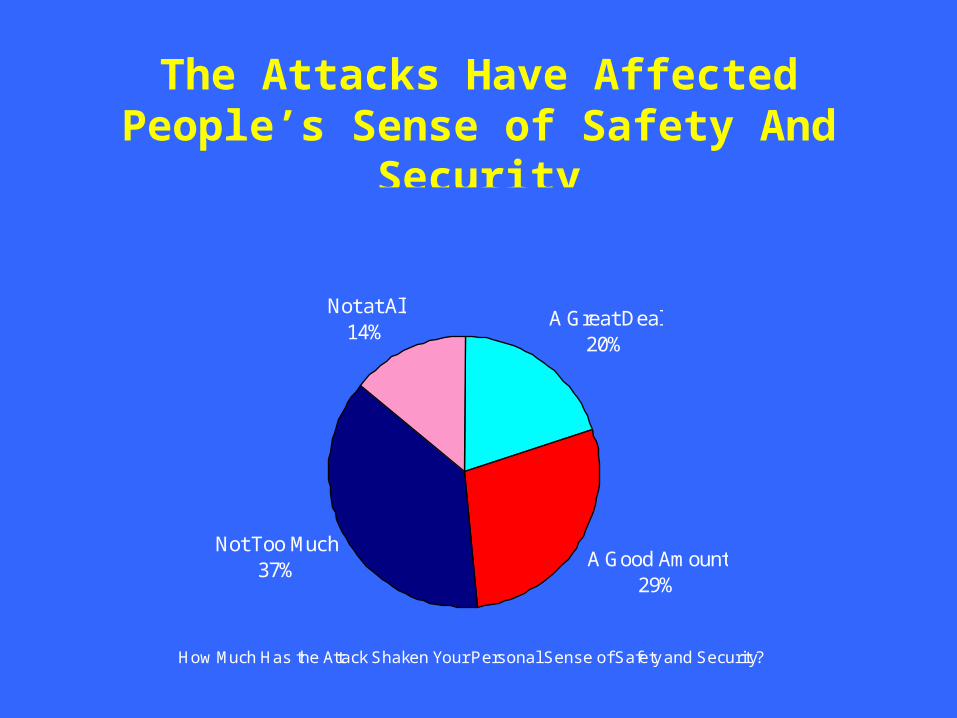
The Attacks Have Affected People’s Sense of Safety And Security
How Much Has the Attack Shaken Your Personal Sense of Safety and Security?
A Great Deal20%
A Good Amount29%
Not Too Much37%
Not at All14%
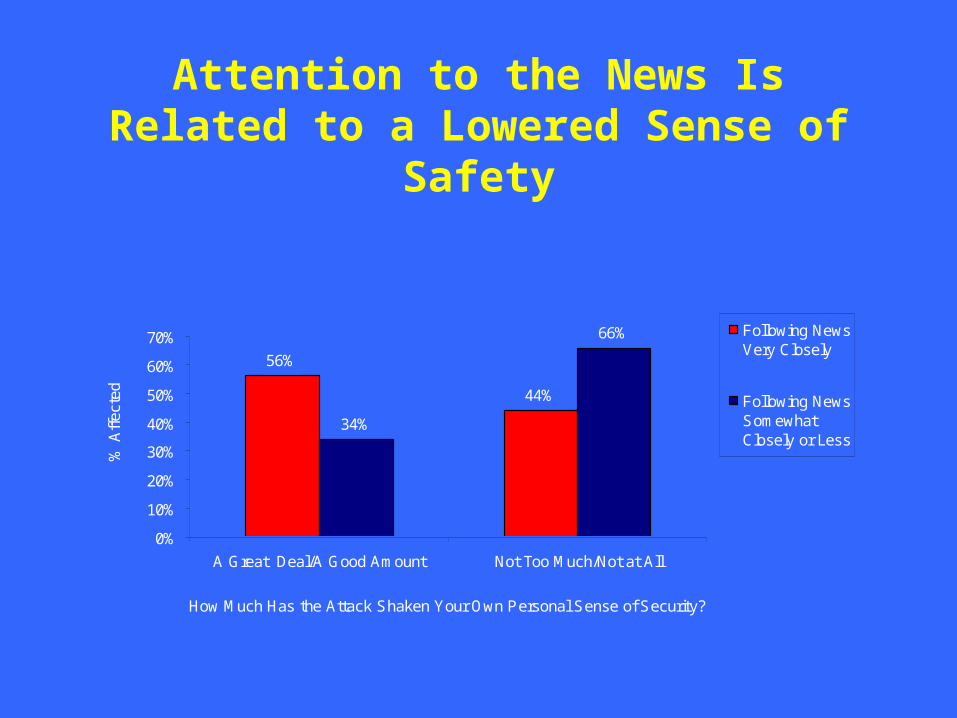
Attention to the News Is Related to a Lowered Sense of Safety
% A
ffec
ted
56%
44%
34%
66%
0%
10%
20%
30%
40%
50%
60%
70%
A Great Deal/A Good Amount Not Too Much/Not at All
How Much Has the Attack Shaken Your Own Personal Sense of Security?
Following NewsVery Closely
Following NewsSomewhatClosely or Less
PSYCHOLOGICAL RESPONSES TO THE ATTACKS AND COPING MECHANISMS
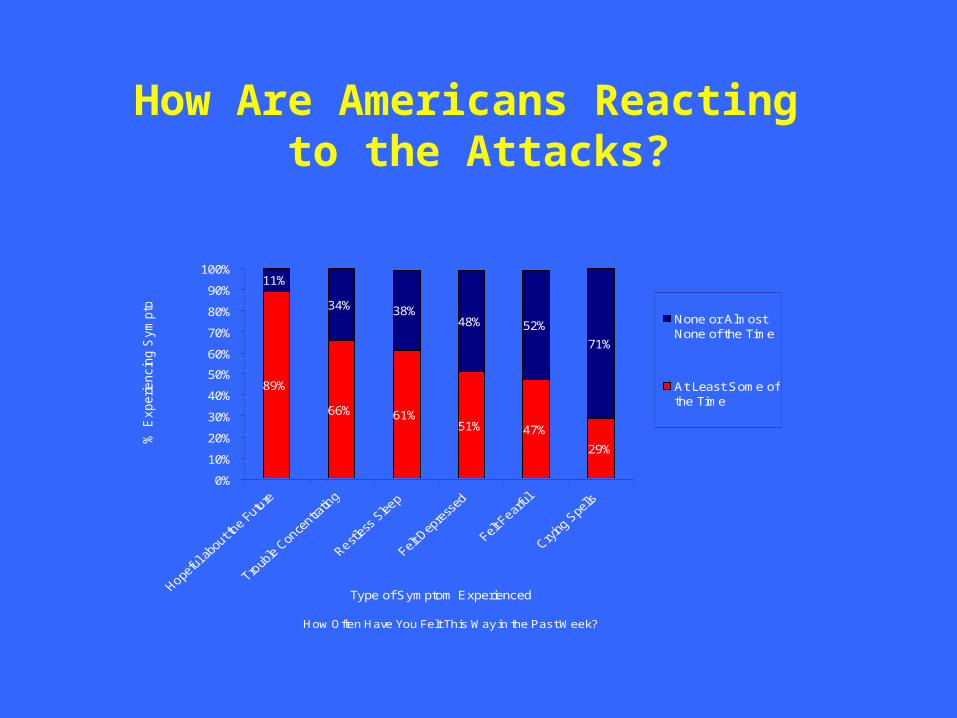
How Are Americans Reacting to the Attacks?
How Often Have You Felt This Way in the Past Week?
89%
66% 61%51% 47%
29%
11%
34% 38%48% 52%
71%
0%
10%
20%
30%
40%
50%
60%
70%
80%
90%
100%
Type of Symptom Experienced
% E
xperiencin
g S
ym
pto
m
None or AlmostNone of the Time
At Least Some ofthe Time
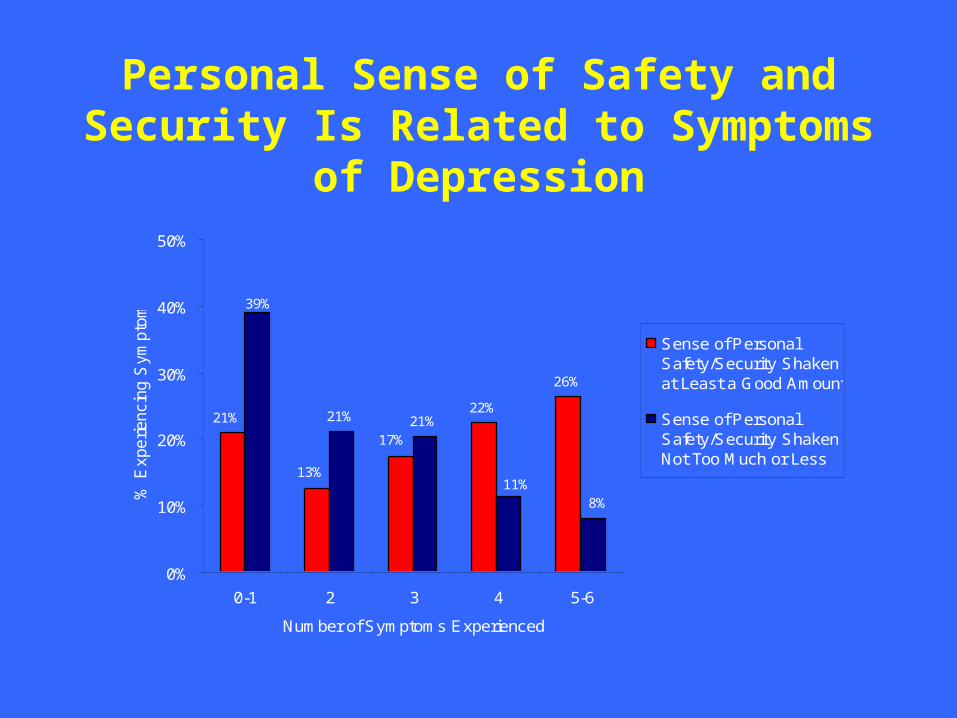
Personal Sense of Safety and Security Is Related to Symptoms of Depression
22%
26%
21% 21%17%
21%
13%
39%
11%8%
0%
10%
20%
30%
40%
50%
0-1 2 3 4 5-6
Number of Symptoms Experienced
% E
xperiencin
g S
ym
pto
m
Sense of PersonalSafety/Security Shakenat Least a Good Amount
Sense of PersonalSafety/Security ShakenNot Too Much or Less
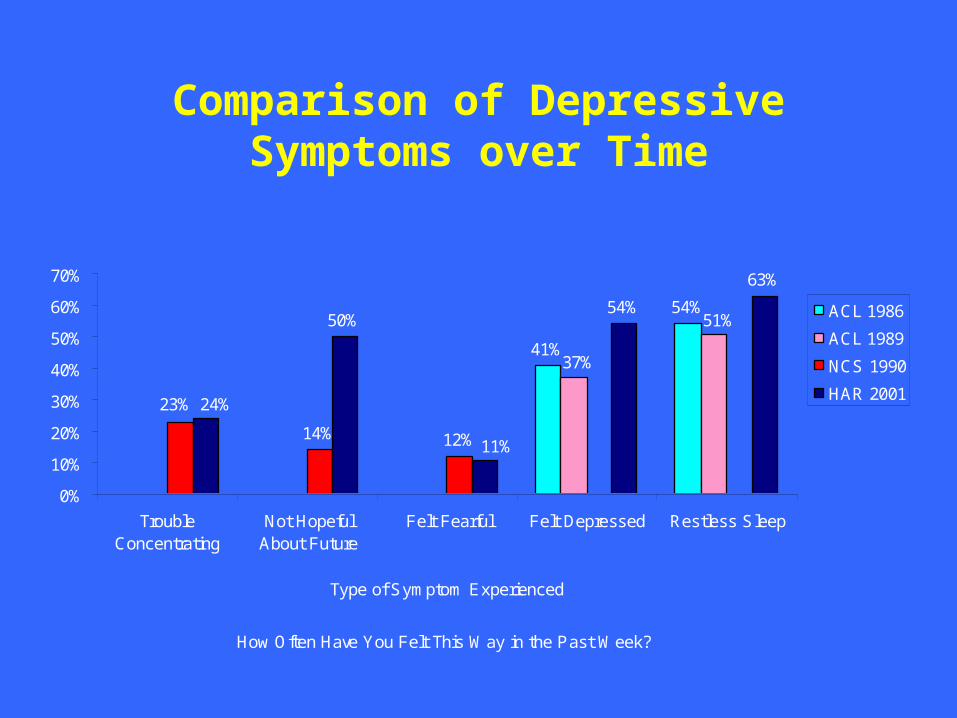
Comparison of Depressive Symptoms over Time
How Often Have You Felt This Way in the Past Week?
41%
54%
14% 12%
50%54%
63%
51%
37%
23% 24%
11%
0%
10%
20%
30%
40%
50%
60%
70%
TroubleConcentrating
Not HopefulAbout Future
Felt Fearful Felt Depressed Restless Sleep
Type of Symptom Experienced
ACL 1986
ACL 1989
NCS 1990
HAR 2001
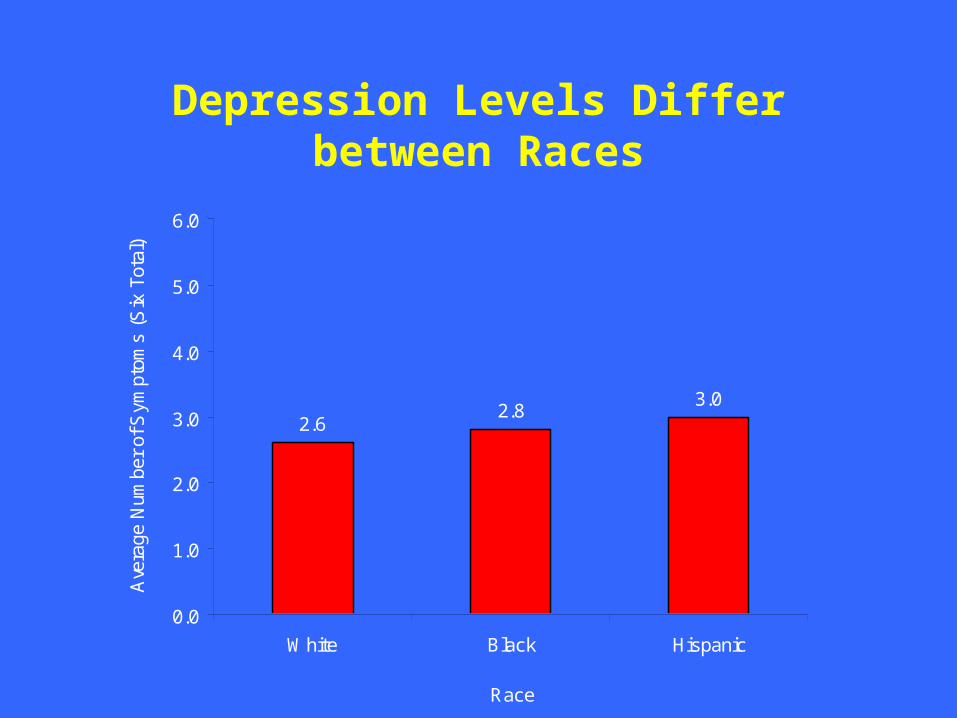
Depression Levels Differ between Races
2.62.8
3.0
0.0
1.0
2.0
3.0
4.0
5.0
6.0
White Black Hispanic
Race
Ave
rage
Num
ber
of S
ympt
oms
(Six
Tot
al)
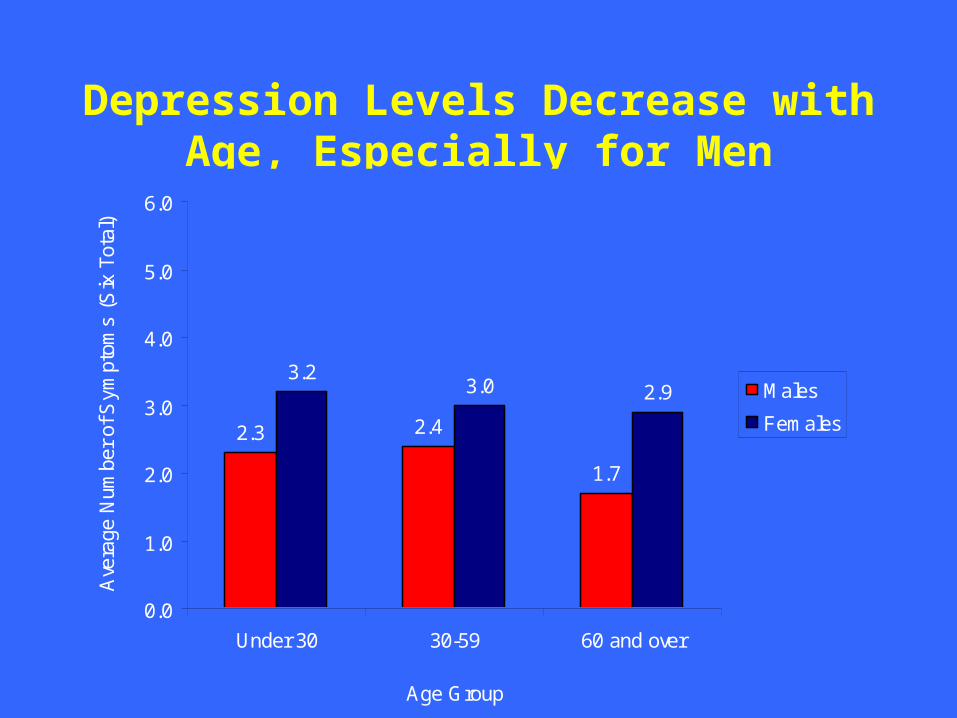
Depression Levels Decrease with Age, Especially for Men
2.3 2.4
1.7
3.23.0 2.9
0.0
1.0
2.0
3.0
4.0
5.0
6.0
Under 30 30-59 60 and over
Age Group
Ave
rage
Num
ber
of S
ympt
oms
(Six
Tot
al)
Males
Females
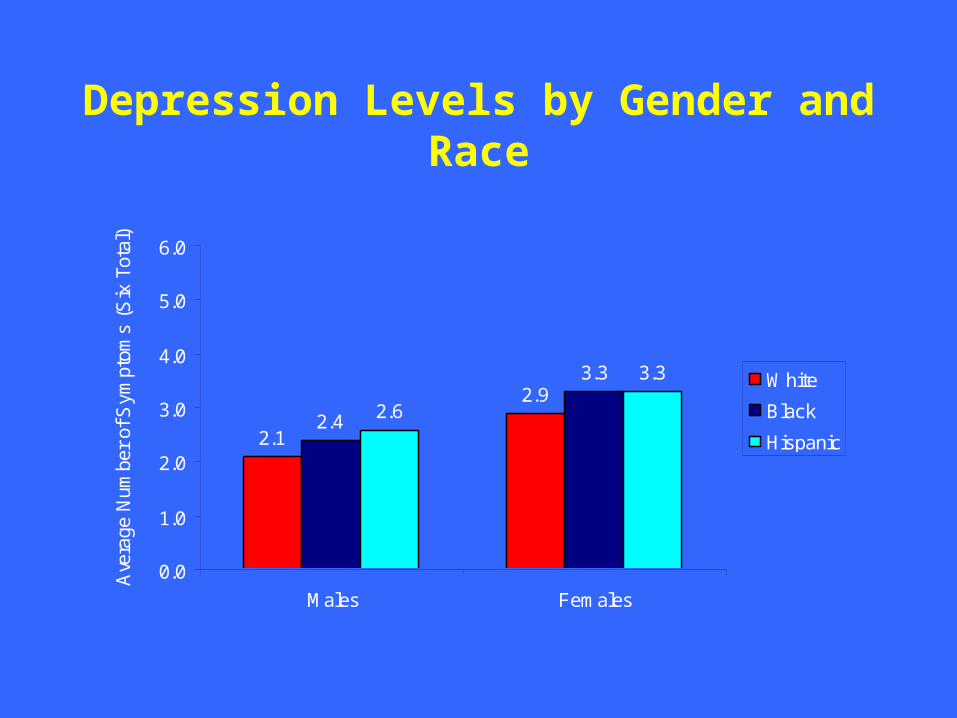
Depression Levels by Gender and Race
2.1
2.92.4
3.3
2.6
3.3
0.0
1.0
2.0
3.0
4.0
5.0
6.0
Males Females
Ave
rage
Num
ber
of S
ympt
oms
(Six
Tot
al)
White
Black
Hispanic
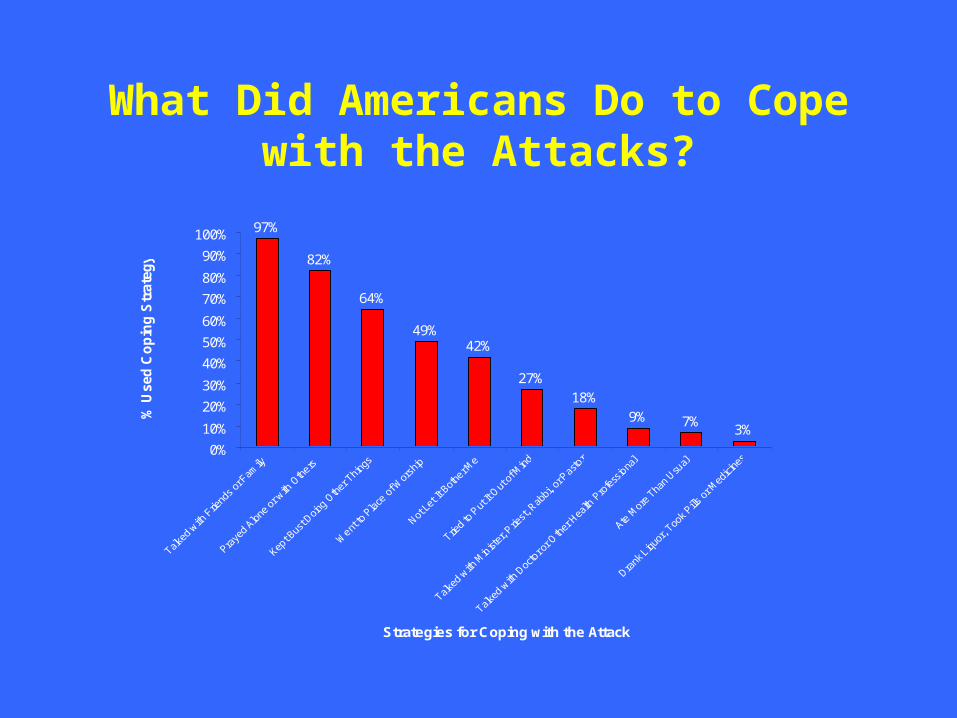
What Did Americans Do to Cope with the Attacks?
97%
82%
64%
49%42%
27%
18%
9% 7%3%
0%
10%
20%
30%
40%
50%
60%
70%
80%
90%
100%
Strategies for Coping with the Attack
% U
sed
Co
pin
g S
trat
egy
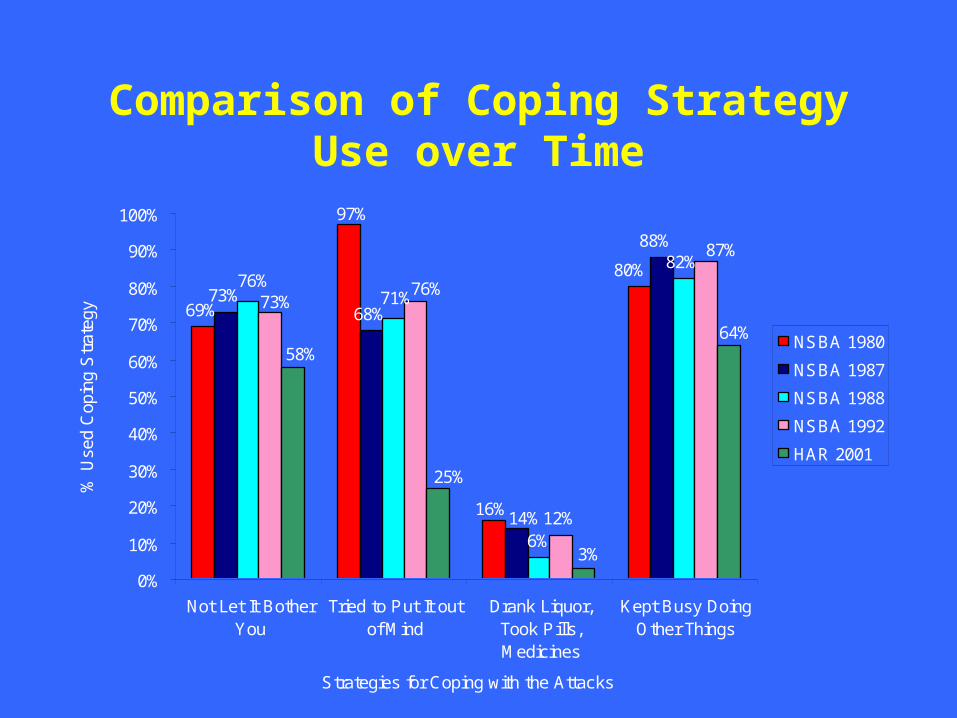
Comparison of Coping Strategy Use over Time
69%73%
68%
6%
82%
12%
80%
16%
97%
88%
14%
76%71%
87%
76%73%
64%
3%
25%
58%
0%
10%
20%
30%
40%
50%
60%
70%
80%
90%
100%
Not Let It BotherYou
Tried to Put It outof Mind
Drank Liquor,Took Pills,Medicines
Kept Busy DoingOther Things
Strategies for Coping with the Attacks
% U
sed
Cop
ing
Str
ateg
y
NSBA 1980
NSBA 1987
NSBA 1988
NSBA 1992
HAR 2001
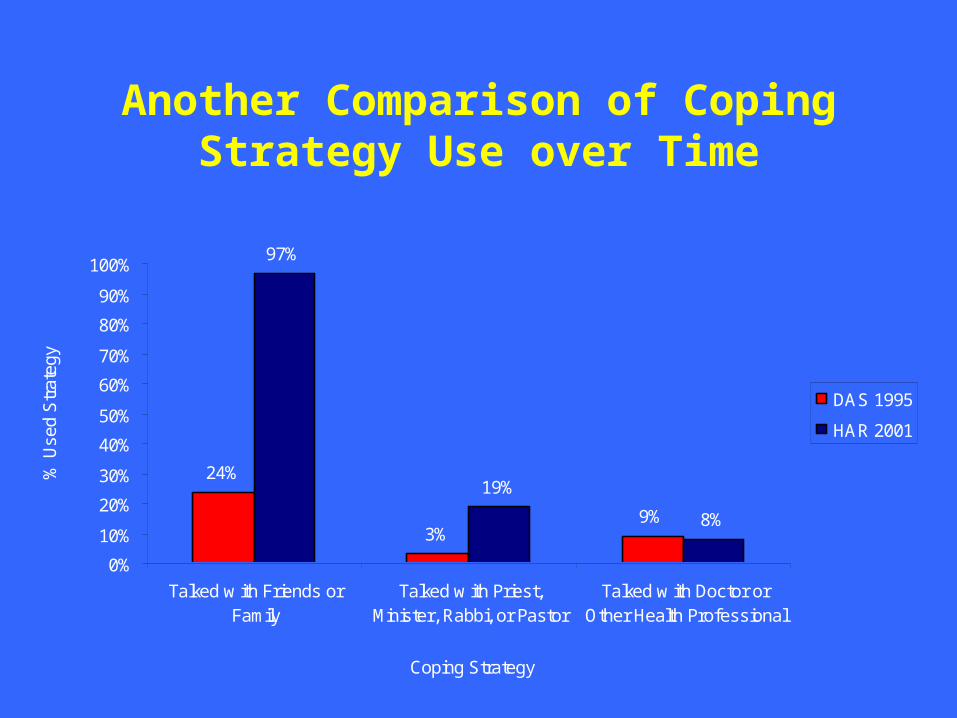
Another Comparison of Coping Strategy Use over Time
24%
3%9%
97%
19%
8%
0%
10%
20%
30%
40%
50%
60%
70%
80%
90%
100%
Talked w ith Friends orFamily
Talked w ith Priest,Minister, Rabbi, or Pastor
Talked w ith Doctor orOther Health Professional
Coping Strategy
% U
sed
Str
ateg
y
DAS 1995
HAR 2001
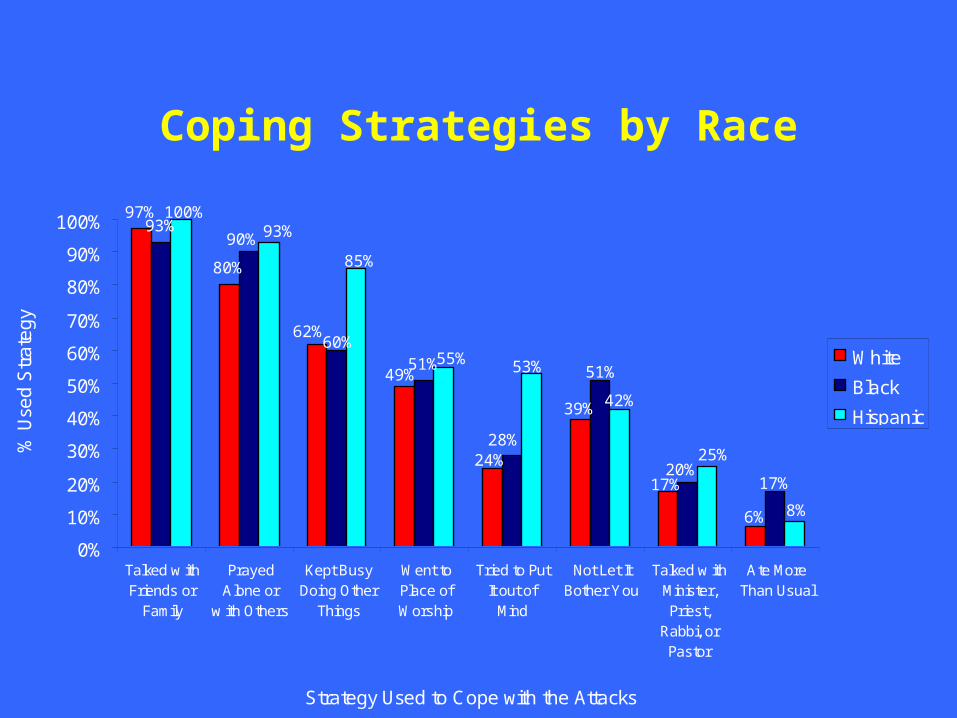
Coping Strategies by Race
97%
80%
93%
51%
62%
49%
24%
39%
6%
17%
90%
60%
28%
51%
17%20%
100%93%
85%
55% 53%
42%
8%
25%
0%
10%
20%
30%
40%
50%
60%
70%
80%
90%
100%
Talked w ithFriends or
Family
PrayedAlone or
w ith Others
Kept BusyDoing Other
Things
Went toPlace ofWorship
Tried to PutIt out of
Mind
Not Let ItBother You
Talked w ithMinister,Priest,
Rabbi, orPastor
Ate MoreThan Usual
Strategy Used to Cope with the Attacks
% U
sed
Str
ate
gy
White
Black
Hispanic
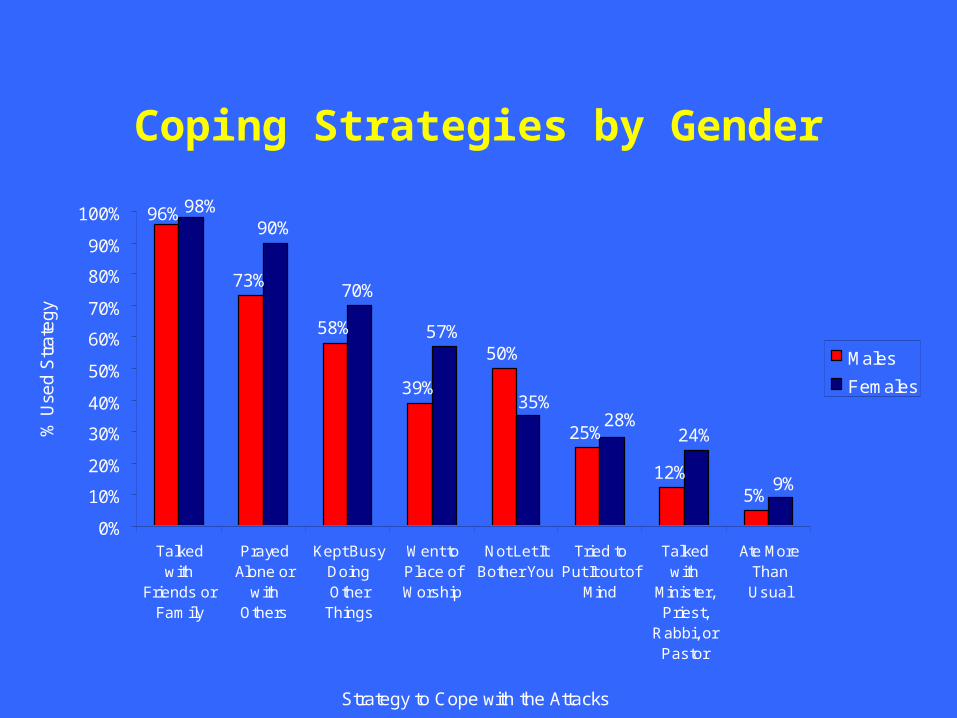
Coping Strategies by Gender
73%
58%
39%
50%
25%
12%5%
90%
70%
57%
24%
96%98%
28%
9%
35%
0%
10%
20%
30%
40%
50%
60%
70%
80%
90%
100%
Talkedwith
Friends orFamily
PrayedAlone or
withOthers
Kept BusyDoingOther
Things
Went toPlace ofWorship
Not Let ItBother You
Tried toPut It out of
Mind
Talkedwith
Minister,Priest,
Rabbi, orPastor
Ate MoreThanUsual
Strategy to Cope with the Attacks
% U
sed
Str
ate
gy
Males
Females
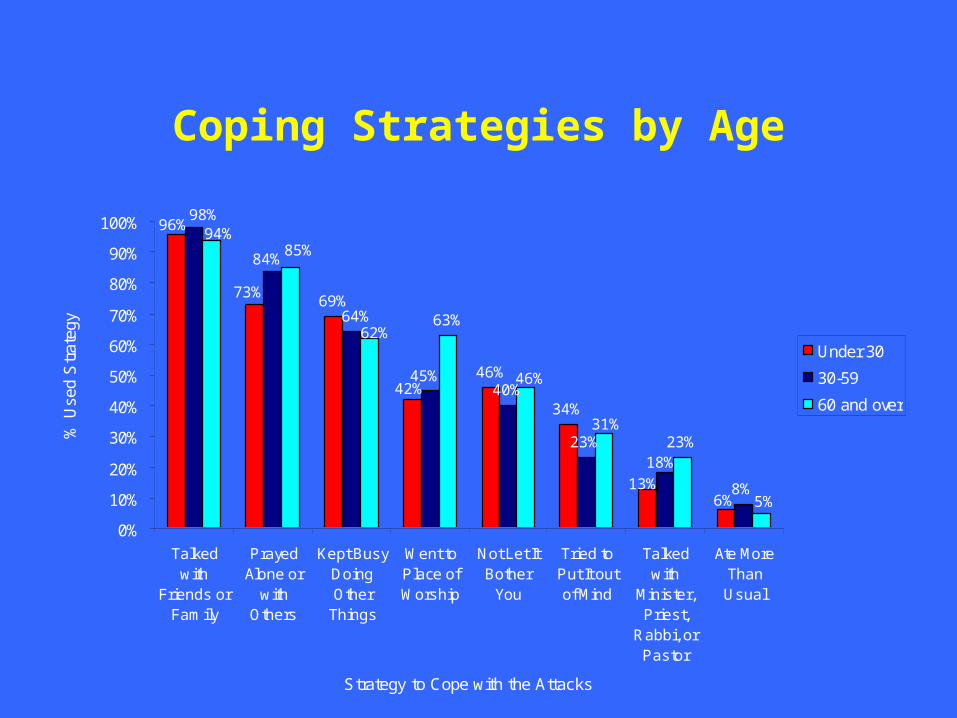
Coping Strategies by Age
69%
46%
34%40%
23%
8%
63%
23%
6%13%
42%
96%
73%
18%
64%
84%
98%
45%
5%
31%
46%
62%
85%94%
0%
10%
20%
30%
40%
50%
60%
70%
80%
90%
100%
Talkedwith
Friends orFamily
PrayedAlone or
withOthers
Kept BusyDoingOther
Things
Went toPlace ofWorship
Not Let ItBother
You
Tried toPut It outof Mind
Talkedwith
Minister,Priest,
Rabbi, orPastor
Ate MoreThanUsual
Strategy to Cope with the Attacks
% U
sed
Str
ateg
y
Under 30
30-59
60 and over
ATTITUDES ABOUT PATRIOTISM AND
CIVIL LIBERTIES

Willingness to Give Up Civil Liberties Is Negatively Related to Personal
Sense of Safety and Security
76% 75%
69%66%
0%
10%
20%
30%
40%
50%
60%
70%
80%
A Great Deal A Good Amount Not Too Much Not at All
How Much Has the Attack Shaken Your Personal Sense of Safety and Security?
% W
illin
g to
Giv
e U
p S
ome
Civ
il Li
bert
ies
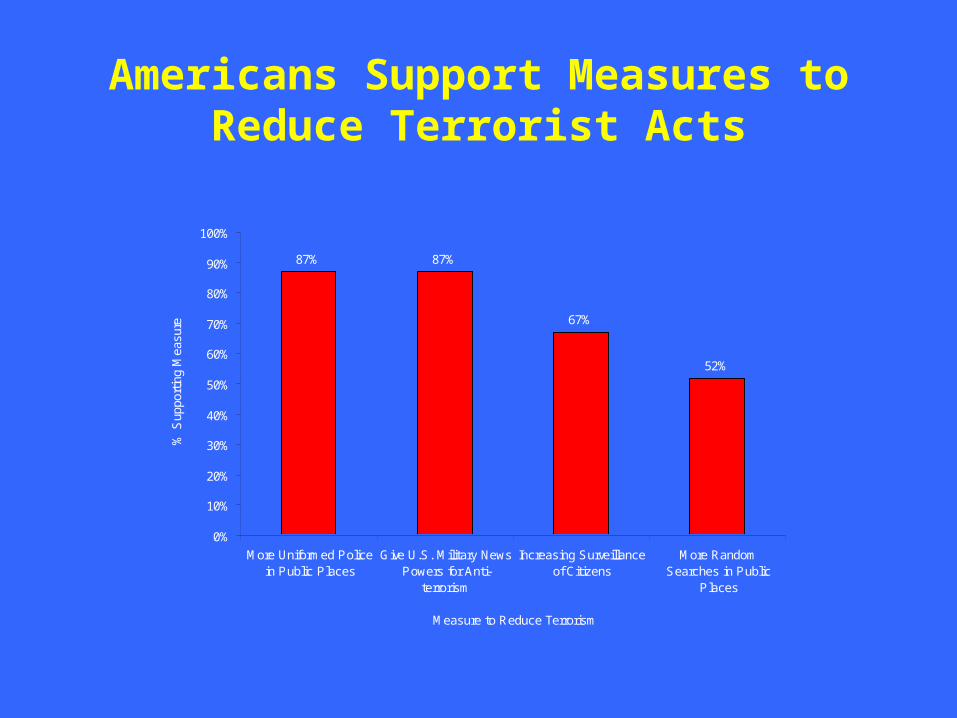
Americans Support Measures to Reduce Terrorist Acts
87% 87%
67%
52%
0%
10%
20%
30%
40%
50%
60%
70%
80%
90%
100%
More Uniformed Policein Public Places
Give U.S. Military NewsPowers for Anti-
terrorism
Increasing Surveillanceof Citizens
More RandomSearches in Public
Places
Measure to Reduce Terrorism
% S
uppo
rtin
g M
easu
re

Favorability Assessments of American Ethnic Groups Are Higher than Recently
63%58%
72%70%66% 64%
79%
63% 63% 61%
0%
10%
20%
30%
40%
50%
60%
70%
80%
90%
100%
AfricanAmericans
HispanicAmericans
Asian Americans
White Americans
Ethnic Group
% S
up
ply
ing
"P
osi
tive
" R
atin
g o
n F
ee
ling
T
he
rmo
me
ter
NES 1998
NES 2000
HAR 2001
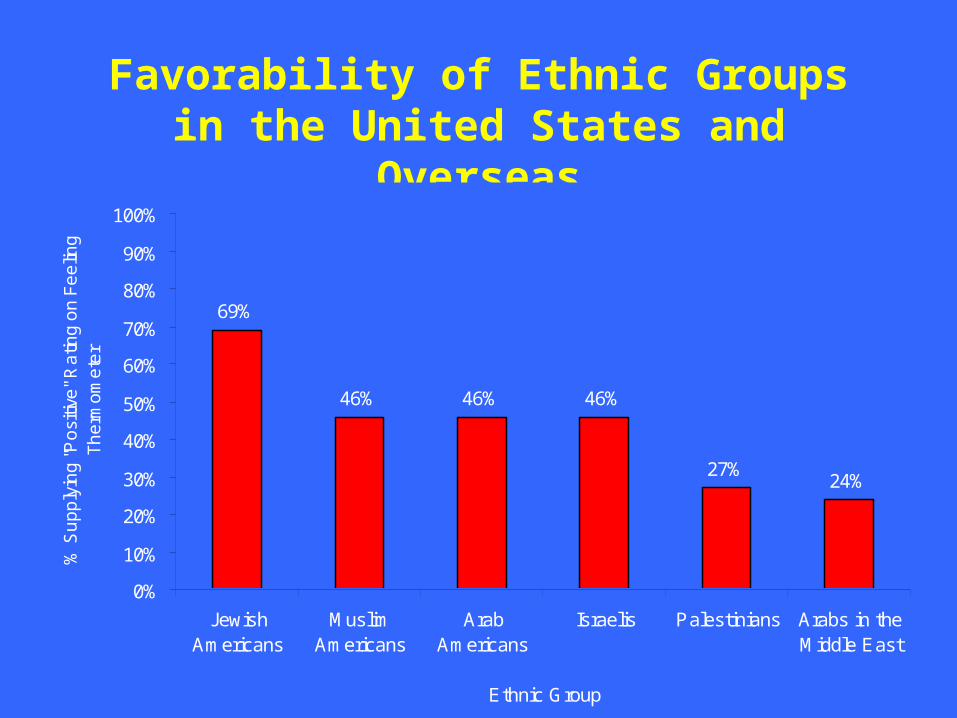
Favorability of Ethnic Groups in the United States and Overseas
69%
46% 46% 46%
27%24%
0%
10%
20%
30%
40%
50%
60%
70%
80%
90%
100%
JewishAmericans
MuslimAmericans
ArabAmericans
Israelis Palestinians Arabs in theMiddle East
Ethnic Group
% S
up
ply
ing
"P
osi
tive
" R
atin
g o
n F
ee
ling
T
he
rmo
me
ter
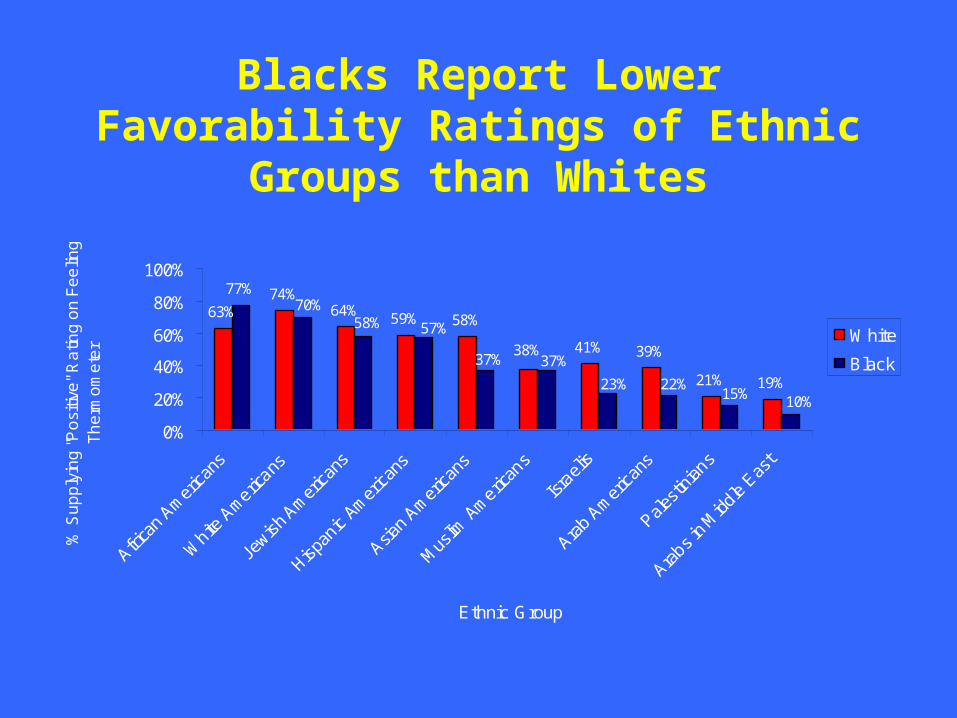
Blacks Report Lower Favorability Ratings of Ethnic Groups than Whites
63%74%
64% 59% 58%
41% 39%
21% 19%
77%
38%
70%58% 57%
37% 37%
23% 22%10%15%
0%
20%
40%
60%
80%
100%
Africa
n Am
erica
ns
White
Americ
ans
Jewish
Am
erica
ns
Hispan
ic Am
erica
ns
Asian A
mer
icans
Mus
lim A
meric
ans
Israeli
s
Arab A
mer
icans
Palesti
nians
Arabs i
n Midd
le Eas
t
Ethnic Group
% S
up
ply
ing
"P
osi
tive
" R
atin
g o
n F
ee
ling
T
he
rmo
me
ter
White
Black
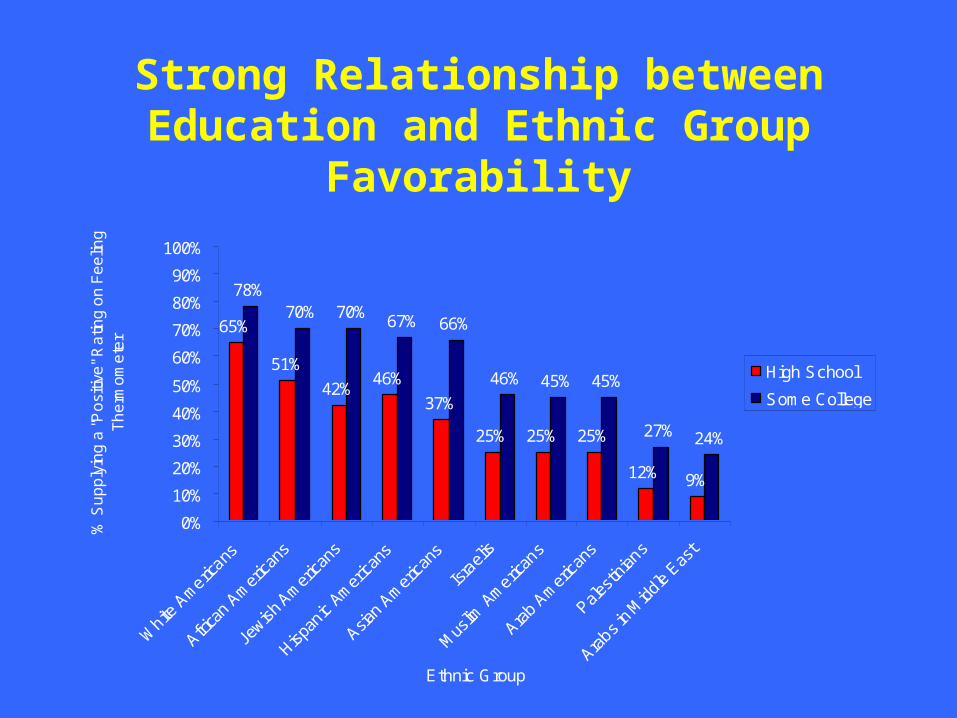
Strong Relationship between Education and Ethnic Group
Favorability
65%
51%
42%46%
37%
25% 25% 25%
12% 9%
78%70% 70% 67% 66%
46% 45% 45%
27% 24%
0%
10%
20%
30%
40%
50%
60%
70%
80%
90%
100%
White
Americ
ans
Africa
n Am
erica
ns
Jewish
Am
erica
ns
Hispan
ic Am
erica
ns
Asian A
mer
icans
Israeli
s
Mus
lim A
meric
ans
Arab A
mer
icans
Palesti
nians
Arabs i
n Midd
le Eas
t
Ethnic Group
% S
up
ply
ing
a "
Po
sitiv
e"
Ra
ting
on
Fe
elin
g
Th
erm
om
ete
r
High School
Some College
ECONOMIC ATTITUDES
AND BEHAVIOR
Consumer sentiment and behavioral intentions regarding the economy were negatively impacted by the attacks
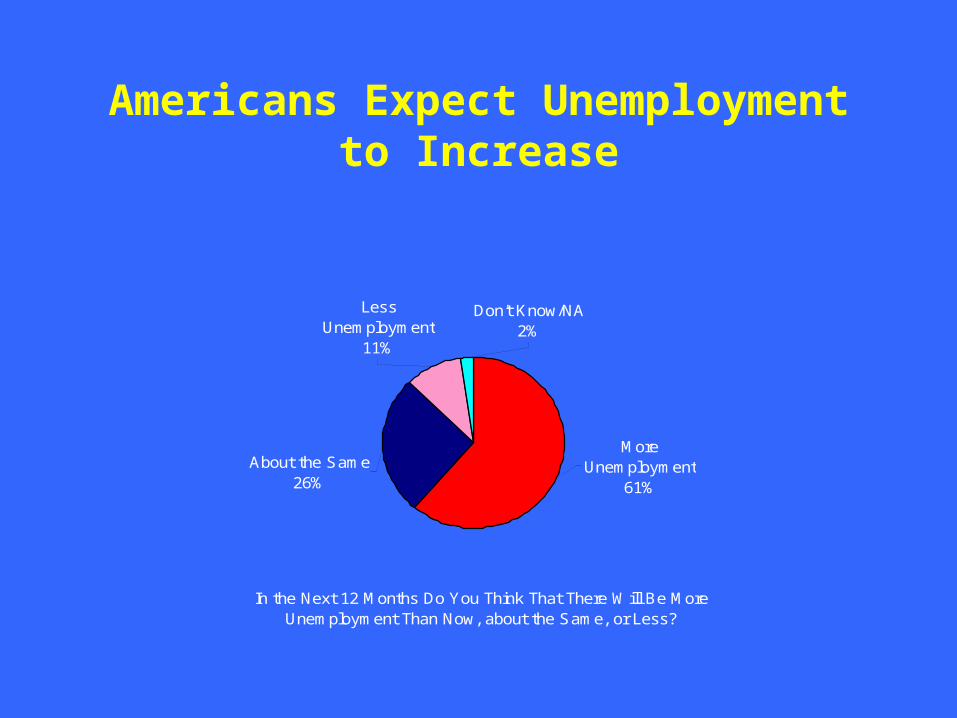
Americans Expect Unemployment to Increase
In the Next 12 Months Do You Think That There Will Be More Unemployment Than Now, about the Same, or Less?
More Unemployment
61%
Don't Know/NA2%
Less Unemployment
11%
About the Same26%
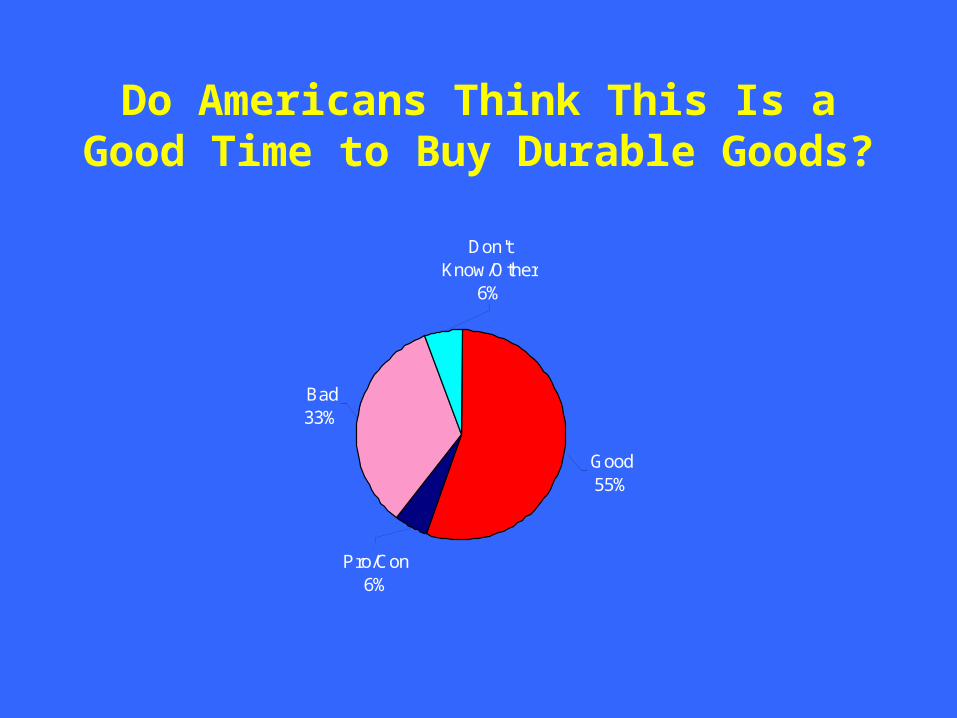
Do Americans Think This Is a Good Time to Buy Durable Goods?
Good55%
Pro/Con6%
Bad33%
Don't Know/Other
6%
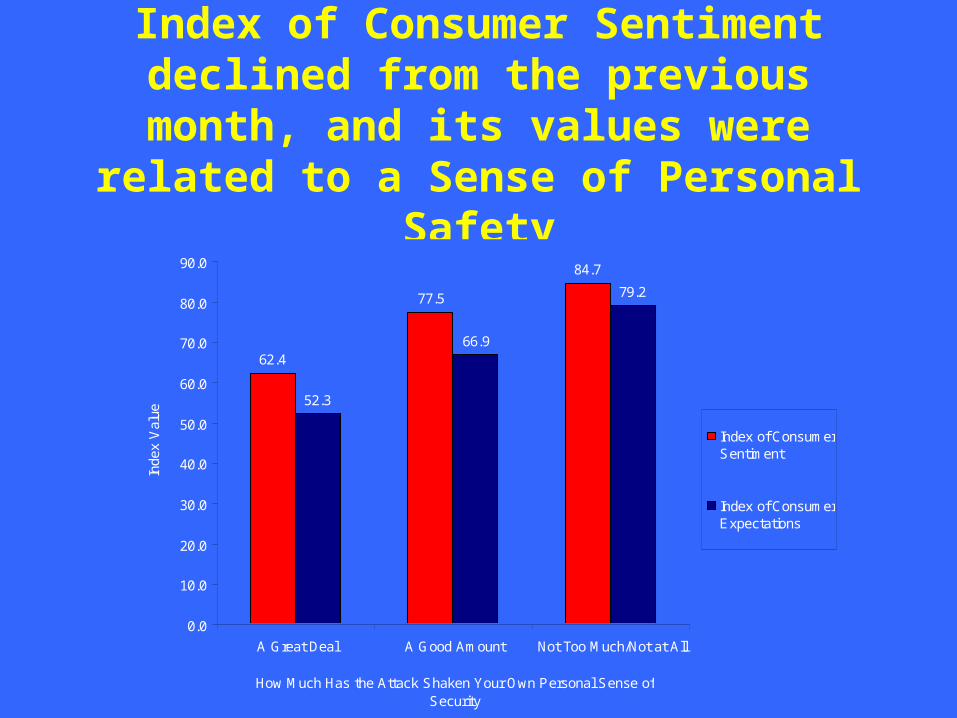
Index of Consumer Sentiment declined from the previous month, and its values were related to a Sense of
Personal Safety
62.4
77.5
84.7
52.3
66.9
79.2
0.0
10.0
20.0
30.0
40.0
50.0
60.0
70.0
80.0
90.0
A Great Deal A Good Amount Not Too Much/Not at All
How Much Has the Attack Shaken Your Own Personal Sense of Security
Inde
x V
alue
Index of ConsumerSentiment
Index of ConsumerExpectations
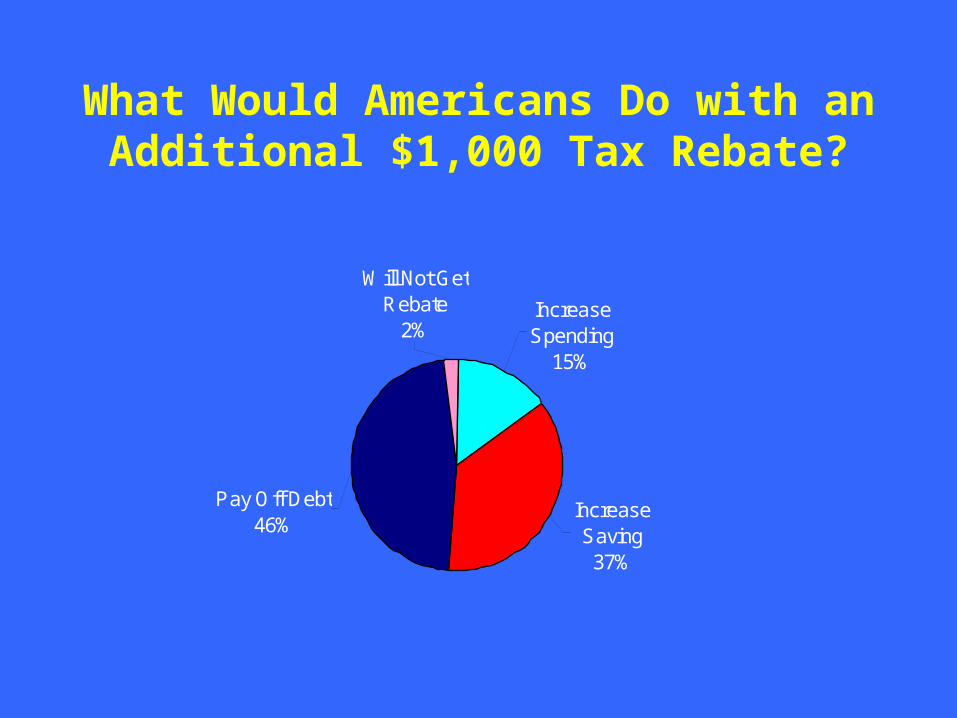
What Would Americans Do with an Additional $1,000 Tax Rebate?
Increase Saving37%
Increase Spending
15%
Will Not Get Rebate
2%
Pay Off Debt46%

Consumers See Stock Market Opportunities in the Next Year
Over the Next Year or So, Do You Think It Will Be a Good Time to Put Money into the Stock Market, Take Money out, or Neither?
Put Money In46%
Take Money Out9%
Neither45%