Embed Size (px)
Citation preview

60 Transportation Research Record 930
Design of Slab Thickness and Joint Spacing for
Jointed Plain Concrete Pavement JIHADS. SAWAN AND MICHAEL I. DARTER
A structural design procedu re for jointed plain concrete pavement (JPCP) is presented. The design system considers directly the slab thickness, slab length, concrete strength, traffic volume and distribution, foundation support, and thermal gradients, using fundamental structural principles. The .:.ru~Uun: WC15 caiibrateO lO actuai fie ia cond1t1ons by correlating the actual amount of transverse cracking and total computed fatigue damage in the sl ab. Field data from 11 agoncies were used . Tho design system shows that, for a given traffic level, climate, and foundation suppo" , there are definite combinations of slab thickness, strength, and length (joint spacing) that must be used to control slab cracking. A thicker slab permits an increase in slab
cracking is tolerated (as on lower-volume roads), a longer joint spacing is allowed. Decreasing the level of axlo load distribution from a heavy to a moderate level would decrease the slab thickness or allow a longer slab to be used or both. The effect of foundation suppo" (K) at a higher level of al· lowable cracking is appreciable compared with the effect at a lower level of cracking. The modulus of rupture (MR) has a pronounced effect on both slab thickness and joint spacing.
The structural design of jointed plain concrete pavement (JPCP) has traditionally been performed by determining a required slab thickness from fatigue (_!) or serviceability a nalys is <1> a nd i ndepende nt ly select ing a maximum j oint spaci ng t o minimize jointing costs (particularly when dowels are used) . This practice has led to a substantial amount of intermediate slab cracking over time and under traffic for the longer slabs.
For example, the 12-, 13-, 19- , 18-ft random spacing used by many agencies results in the 18- and 19-ft slabs cracking whereas the 12- and 13-ft slabs rarely crack. The 25- and 30-ft slabs constructed by several states have generally had substantial intermediate cracking over time under traffic. Most of the 12-, 13-, 19-, and 18-ft slabs have been 8 to 9 in. thick and the 30-ft slabs 10 in. thick. Many agencies have now reduced their. joint spacing to minimize slab cracking. Some agencies are also beginning to construct thicker slabs ( 10 to 14 in.) for heavily trafficked routes while using the same joint spacing as for thinner slabs.
In this paper, a design procedure is presented that provides both a required slab thickness and a corresponding maximum joint spacing to limit slab cracking for given traffic, thermal gradients, portland cement concrete (PCCJ strength, and foundation support. · The procedure was developed from basic structural concepts and correlated with extensive field data from several agencies.
BASIC DESIGN CONCEPT
The basic concept in developing a design procedure based ·on fatigue analysis is to prevent cracking of the slabs, which is one of the most serious types of pavement distress requiring rehabilitation.
Fini te-Element Model
An evaluation was conducted to determine the best structural analysis program for jointed concrete pavement. Several programs were evaluated <ll, and the results show that the finite-element slab analysis program developed by Huang and Wang (_~) has the desirable capabilities for analysis of JPCP slabs. This program has many important capabilities, including the determination of (a) stresses and de-
flections in concrete pavement slabs with full or partial subgrade contact, (b) variable load transfer of transverse and longitudinal joints, and (c) the effect of thermal gradiPnt" nn cn"." l in'l s t!'.!! S S!!S ;
both independently and in combination with traffic load. The method is based on the theory of minimum potential energy by dividing the slab into small elements, considered thin plates, interconnected only at a finite number of nodal points. Other
that computed stresses agree well with experimental results Cl), elements cf varying sizes can be easily incorporated in the analysis, and no special treatment is needed at a free edge.
Critic al Fa~igue Location in Sla b
The location of the c ritical point at which cracking init iates in the PCC slab is vital to the deve.lopment of a fatigue analysis when the objective is to prevent slab cracking. The location of the critical point is approached by usinq both field studies and a comprehensive slab fatigue analysis. Results from highway field studies (2,~) indicate that in slabs of normal thickness (>8 in.) cracking usually initiates at the slab edge and propagates transversely across the slab. These cracks are usually located in the center third of the slab. Available data (6i als o indicate that transverse cracking occurs much more often than longitudinal or corner cracking. However, where serious pumping has occurred at the transverse joint, corner breaks or diagonal cracks also occur. Longitudinal cracking in the wheel path or in the center of the slab is believed to be initiated by either large compressive stresses from joint infiltration or foundation settlement. However, some longitudinal cracks certainly are load caused and occur as second-stage slab breakup.
A comprehensive fatigue analysis was conducted by using the finite-element program and Miner's fatigue damage hypothesis to determine theoretically the critical point in the slab where crac king should initiate if caused by truck loodirigs. Two c ritical positions in the slab were evaluated based on the results from the field studies: (a) near the transverse joint in the wheel paths, where longitudinal cracking often initiates, and (b) along the outside edge at midslab between the transverse joints, where transverse cracking initiates. A fatigue analysis was conducted by considering typical variations in truck axle weights, axle types, and lateral displacement across the slab. Stresses in the slab were computed by using the finite-element program for different magnitudes and lateral positions of the load. Stresses were computed over a range of slab thickness (H) and modulus of foundation support (KJ • Fatique damage (DJ was then computed by using these stresses and Miner's cumulative damage hypothesis 11) •
Results from the analysis for midslab show that, when the mean lateral placement is less than 36 in., the critical fatigue damage point is clearly at the slab edge (see Figure 1). In addition, the fatigue damage at the midslab edge loading is much greater than the fatigue damage near the transverse joint

Transportation Research Record 930
Figure 1. Computed fatigue damage across slab due to lateral distri· bution of trucks in lane (at midpOint between transverse jointsl.
~~~~~~~~~~~~-.... 105
H ; 10 in k ; ZOO pc i
48 36 24 12
Distance From Slab Edge, in.
10 4
IOl
102
10
(1)
"" 0 E 0
0
for any lateral distance. These analytic results agree with the field studies mentioned ea.rlier, in which extensive pumping has not occurred. Beams cut from slabs show that the fatigue cracks initiate at the bottom of the slabs and work their way toward the top with increasing load applications.
DEVELOPMENT OF FATIGUE DAMAGE ANALYSIS
A comprehensive fatique damage analysis for FCC slabs was developed based on the following:
l. The critical fatigue damage location in the slab is at the longitudinal edge midway between transverse joints.
2. Critical edge stresses caused by both traffic loads and thermal gradient curl are considered to prevent transverse cracking.
3. Both load and thermal curl stresses are computed by using the finite-element program, which has been shown to provide accurate results.
4. The proportion of traffic occurrinq near the slab edge is used in the fatigue analysis.
5. Concrete strength changes with time and th4s the fatigue analysis must be time-dependent.
6. Fatigue damage is computed according to the Miner hypothesis.
7. A correlation between computed fatigue damage and measu·red cracking was determined, and thus a limiting damage to control slab cracking can be selected.
PCC Fatigue
Several laboratory studies have shown that plain PCC beams experience fatique failure when subjected to high repetitive flexural stresses C!-17). In addition, several road teats and many in-service PCC slabs have been observed to experience fatigue failure when subjected to many applications of heavy truc.k traffic (5,18). Fatigue damage is obvious on many multilane - pavements where the outside truck lane has much more slab cracking than the inner lanes. However, no correlation between laboratory ai:id field fatigue results has been attempted.
The results from laboratory studies provide siqnificant information about the fatigue properties of PCC applicable to pavement fa~igue conditions:
61
1. The number of repeated loads that PCC can sustain in flexure before fracture depends on the ratio of applied flexural stress to the ultimate static flexural strenqth or modulus of rupture.
2. PCC does not have a fatigue limit within 20 million load applications: hence, there is no limiting repeated stress below which the life will be infinite (8-10). The mean fatigue strength of PCC, which is Ui;-strength expressed as a percentage of the static ultimate strength, is approximately 55 percent at 10 million applications of load (11) •
3. Application of va r yinq flexural stress levels gives different fatigue results depending on the sequence of applied loads of varied intensity (10,11). Thus, Miner's damage hypothesis, which assumes linear accumulation of damage, doe"s not give an exact prediction of PCC failure. However, data from recent tests indicate that the inaccuracy of Miner's hypothesis is not very significant compared with the large variability in strength and fatique life that is typical of PCC (19). Hence, it was concluded that Miner's hypoth;;is represents the cumulative damage characteristics of concrete in a reasonable manner (19) •
4. Fatigue life"""Of PCC is highly variable: coefficients of variation range up to 100 percent.
5. Repeated rest periods during a fatigue test increase fatigue strength, and thus some recovery occurs during the rest periods (11).
6. The effect of moisture~conditions of FCC under flexural fatigue has not been fully determined. Some limited tests indicate that high moisture content gives lower fatigue strength (10,20). A recent limited study tends to indicate that saturation affects fatigue life but does not significantly change fatigue strength <l!.> : however, the results are not conclusive.
7 • . The increase in PCC modulus of rupture with time significantly affects the increase in fatigue life but not fatigue strength as long as the modulus of rupture at the specific time is used to compute the stress ratio <l!.> •
Fatigue data were obtained for plain PCC beams from thiee studies (~ 1 19,11.). A plot of stress/ strain versus number of load applications for 140 tests from these studies is shown in Figure 2. The data from the three studies generally overlap each other.
The applicability of these laboratory fatigue results from beam specimens to the fatigue of actual pavement slabs under field conditions has never been established. Many of the differences that exist between laboratory and field conditions probably result in different fatigue responses. Moreover, the uncertainty about many facto.rs that might affect PCC fatigue life is so great and available information so limited that any laboratory curves us ed to estimate fatigue damage in fie l d slabs must be calibrated based on field data, as done later in this paper.
A fatigue curve must be selected for design purposes. After consideration of a number of factors, the following curve was selected for design:
Log 10 N= !6.61- 17.6 ! (R) (!)
where N is the number of stress applications to failure and R is the ratio of repeated flexural stress to modulus of rupture. This expression, compared with the mean =egression curve (PF= 0.5), provides a safety margin of one decade of load application, as shown in Figure 2, and represents a failure probability of 24 percent.

62
Figure 2. Summary of PCC flexural fatigue data with curve used.
1.00~-~--.----.----.--.------....---.------.----,
0: 0 .80
..r:. c;. .~ 0.70 c;, ...... "' 0 .60 "' ~ U')
0 .50
0 .40 I
Key : ••
~ Kc:ter a Railhby and Galloway
o Bal linger
10 10') 10• 10~ 1cf 10
Load Applications To Failure, N1
10"
Figure 3. Change in PCC modulus of rupture with time.
.Q
0 n-
1.6
1.2
0.8
0.4
801
Rat io = i. 22 + 0.17 log 10 T - 0.05 ( log 10 T )2
•
0.1 1.0
0 0
11 AASHO o CAL • Ml o PCA 'V MN <> Mf)-1
10
T ime Since Construction (T) - yrs
PCC Strength Increase
20
PCC strength data were obta ined from five projects locate<! in as ·many states (22-25) and also from the Por tland Cement Associati on (!). The modulus of rupture at times ranqinq from 3 day s to 17 year s was obtaN:utQ_ from tests on beams cas t dur inq construction and then cured ove r time and beams cut from slabs over time (see Figure 3). The following equation was obtained by using multiple regression techniques:
(2)
where FA is the ratio of the modulus of rupture at time T to the modulus of rupture at 28 days and T is the time since slab construction (years) •
The modulus of rupture can be estimated at any time T by using the following expression:
(3)
where F is the modulus of rupture at time T and F28 is the modulus of rupture at 28 days (thirdpoint loading).
The above equations can be used to estimate the ultimate modulus of rupture at any time over the life of 'the pavement for use in the fatigue damage analysis.
Transportation Research Record 930
Figure 4. Lateral distribution of trucks in outer lane on four-lane freeway.
"' 'O 0 ~ 0
2 12
"' "' 'O 24 w .0
2 36 \[1
E 0 48 ,;:
l'l GO c:
1j; 0 nnt
. . O.t
I ITT J = 16.4 in er= 10 I in.
10
Lalera! Truck Placement IL TPI (Normal Distribution Poper)
' ' 30 50 70 90 98 99.8 99.99
Accumulative Percent Wheel Passes
Lateral Truck Distribution
The lateral placement of trucks in the traffic lane is crucial because of the high longitudinal edge stresses that develop when the wheel load is near the edge. The lateral distr ibu tion varies with several factors, such as the width of the traffic lane, the location of the edge stripe, paved or unpaved shoulders , any edge r estraints such as . retaining walls, a nd the e xiste nce of curb and gutter.
The lateral distribution should be measured for local conditions, and only general guidelines are given as to the typical range of the mean distance • If heavy trucks travel on the average down the cen~ ter lane, the mean distance (for a 12-ft-wide lane and an 8-ft-wide truck) would be 24 in. However, available evidence indicates that when there is a paved shoulder and no lateral obstruc tions, there is a o finite tendency for trucks to shift about 3 to 12 in. toward the slab edge, which gives a mean value for lateral distribution of approximately 12 to 21 in. Bureau of Public Roads measurements at 15 locations in 1956 for 12-ft concrete traffic lanes and paved shoulders on two-lane rural highways showed an average of 11 in. (26) . Stud ies by Emery (11) in 1975 showed a mean o f a ppro x i mately 16 to 18 in . on r ural f our- lane Intersta te highways. The lateral distribution obtained from Emery is approximately normal and the standard deviation is 10 in., as shown in Figure 4.
Results from the study by Emery (27) show that on rural I nterstate highways with paved shouldecs app roximately 10 percent of loads were with i n 6 in·. of the s lab edge . Several of our own observations tend to confirm that there is a significant proportion o f loads near the edge. Additional data are greatly needed to establish lateral placements of trucks for varying conditions.
Thermal Gradients
The thermal gradient in the PCC slab is defined as follows:
G = (Ttop -Tbott om)/H (4)
where
G
Ttop Tbottom
H
thermal gradient (°F/in.), temperature at the top of the slab (°F), temperature at the bottom of the slab (°F), and PCC slab thickness (in.).

Transportation Research Record 930
A positive gradient indicates that the top of the slab is warmer than the bottom, which normally occurs during the daytime. A negative gradient indicates that the bottom i s warmer than the top, which normally occ urs during the nighttime. A positive gradient results in tensile st ress at the bottom of the slab, and a negative gradient results in compressive stress at t he bottom o f the slab . our i ng t imes when the gradient is po_sitive (te rmed dayt i me), the t otal combi ned s tres E at the bo t t om o f the slab edge midway between the joints under traffic load will be much greater t han dur i ng the times when the g r ad i ent is negative (termed n i ght time).
The tempe r atur e gradient va ries conti nually throughout a 24-h r per i od and also va ries from month to month. A mean monthly positive daytime gradient and mean nighttime gradient can be used in design.
Computation of PCC Fatigue
A f atigue analysis procedure was developed based on the results d i scus sed pre v iously to provide a method of estimating traffic damage that could result in slab c rac king. The basic f atigue design philosophy for plain jointed pavements is t ha t transverse cracking must be controlled. This is possible through direct considerat ion of traff ic loadings, thermal gradients, j o i nt spacing, and foundation support. The PCC slab is s ubjected to many appl ications of heavy traff ic loads. At the same time , it a lso experi ences str esses due to t empe r ature gradients, which have been shown to have a significant effect. Curling of the slab also results in gaps between the slab and the subbase that increase the stress under load.
The major steps in the fatigue analysis are as follows:
l. Determine the number of axle applications in each single and tandem axle-load groupi
2. Select the trial slab-subbase structure, transverse joint spacing, PCC strength, thermal gradients, and other required factorsi and
3. Compute the fatigue damage occurring at the s lab edge f o r a give n month , both day a nd night , by using Mi ner ' s cumulative damage hypot hesis (]) and s um t he damage monthl y ove r t he ent i r e design per iod:
k =p j= 2 i= m Damage = k~ l i~l i~l (nijk/Nijk) (5)
where
Damage total accumulated fatigue damage occurring at the slab edge over the design period 1
nijk number of applied axle-load applications of magnitude over day or night for the month 1
Nijk number of allowable axle-load applications of magnitude over day or night for the month determined from the PCC fatigue curve 1 a counter for magnitude of axle load, both single and tandem axlei a counter for day and night (j~l is day and j=2 is night)i
k a counter for months over the design period 1
m total number of single and tandem axleload groupsi and
p total number of months in the design period.
The fatigue damage is computed at the slab longitudinal edge midway between joints.
63
Applied Traffic
The applied traffic (nij k) is computed by using the traffic data for the mont h under consideration:
nijk = (ADTm)(T/ 1 OO)(DD/ I OO)(LD/ I OO)(A)(30)(P/ I 00)
(C/ I OO)(DN/ I OO)(TF / 1OO)(CON/100)
where
(6)
ADT average daily traffic at the end of the specific month under consideration,
T trucks in ADT (%), DD traffic in direction of design lane (%) , LD land distribution factor (percentage of
trucks in design lane in one direction) , A mean number of axles per truck, P axles in ith load group (%), C total axles in the lane within 6 in. of the
edge (%),
DN = trucks during day or night (%), TF factor to either increase or decrease truck
volume for the specific month, and CON 1 for single axles, 2 for tandem axles.
Allowable Traffic
The allowable traffic (Nij kl is computed from the PCC fatigue model. First, the total stress occurring at the edge of the slab for a given axle load is computed by considering both traffic load and slab curling for the given month for e ither day or ni ght conditions. The stress is computed for edge l oading o f both single and tandem axles by using mode ls deve l oped from the finite-e lement program, wh i ch r eal istic al.ly cons i ders the combi na t i on of load stress and slab curling stresses; The stress equations were derived by using multiple stepwise regression techniques from a factorial of data obtained from the finite-element program over a wide range of design variables.
A computer program called JCP-1 was developed to compute the accumulated fatigue damage over the design life of the pavement. These data can be used to evaluate and design a JPCP with reference to fatigue damage.
LIMITING FATIGUE CONSUMPTION
The fa t igue anal ysis tha t has been developed i s qui t e comprehensive in t ha t it cons i ders direc tly t he effects of traffic l oad i ng s , thermal gradient t hr ough t he s l ab , j o i nt spac i ng , l oss of foundation support (pump i ng) , and inc rea se in PCC strength over time. Flowever , several fac t ox:s are not cons idered because of insufficient information. One of the most important of these factors may be the use of PCC fatigue curves obtained from small beams to estimate the fatigue life of large, fully supported pavement slabs. In addition, there are considerable differences between traffic loading conditions in the laboratory and in the field. Other inadequacies could be cited, but the point to be made is that the final accumulated fatigue damage based on the stress equations computed for a pavement slab must be correlated with measured slab crack i ng before a limiting fatigue consumption can be selected with confidence for design.
Accord ing t o Mi ner ' s hypothesis , a material should f r actu r e when the accu.mu la ted damage equals l. O. Even if t his hypothesis were exactly correct, the vai:iability of ma te rial strengt hs , l oads , and othe r prope r ties would caus e a va r i ation i n accumulated damage ranging from much less than 1.0 to much greater. For e xample , the PCC concrete laborato ry data shown in Figure 2 indicate a computed damage
64
Figure 5. Effect of fatigue damage on cracking of plain jointed PCC pavements.
10
0
-7 10
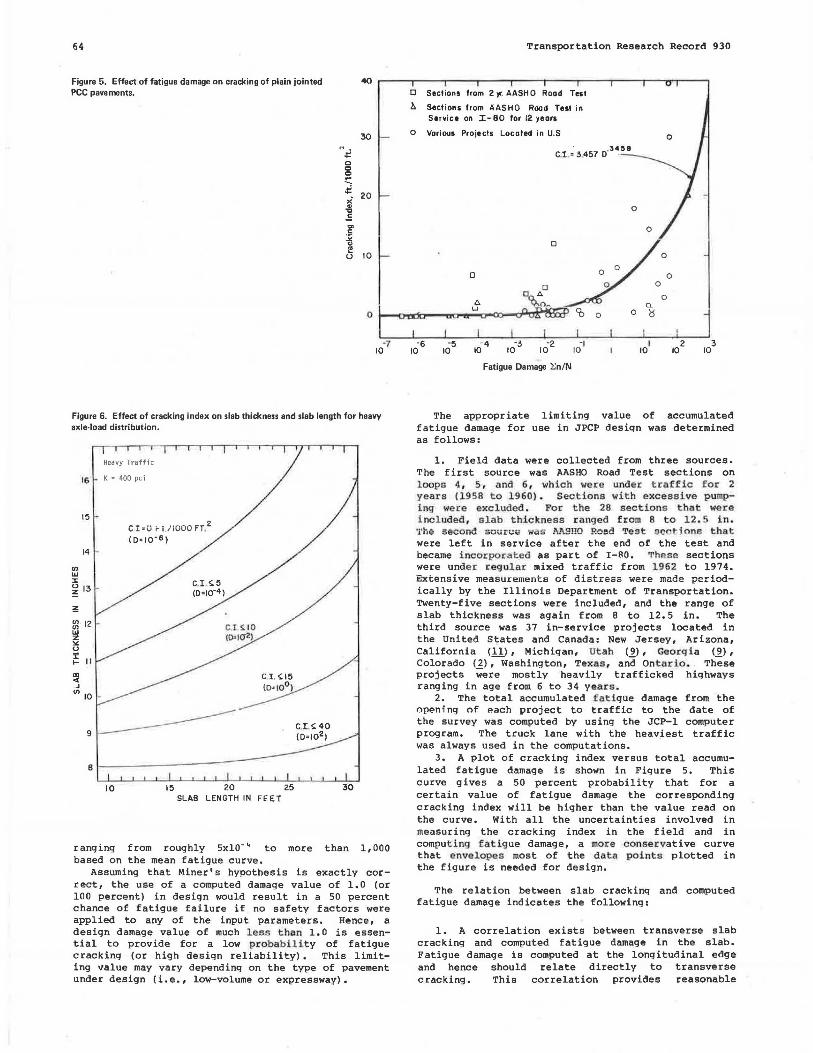
Figure 6. Effect of cracking index on slab thickness and slab length for heavy axle-load distribution.
Heavy Traffic
16 K = 400 pc i
(/) ... :r
15
14
~ 13
gi 12 ... z " u :I: I- II
~ ~
fl) 10
C.I .:: O i- i./1000 FT,2
(0•10"6)
9------10 15 20 25
SLAB LENGTH IN FEET 30
ranging from roughly 5x10·• to more than 1,000 based on the mean fatigue curve.
Assuming that Miner's hypothesis is exactly correct, the use of a computed damage value of 1.0 (or 100 percent) in design would result in a 50 percent chance of fatigue failure if no safety factors were applied to any of the input parameters. Hence, a design damage value of much l ess than 1.0 is essential to provide for a low probab ility of fatigue cracking (or high design reliability). This limiting value may vary depending on the type of pavement under design (i.e., low-volume or expressway).
Transportation Research Record 930
D Sections from 2 'fl. AASHO Rood Test
2> Sections from AASHO Rood Test in Service on I-BO for 12 yeors
o Vorious Projects Locoted in U.S 0
0
D Joo 0
D 0
D~l>. 0 A n- Q_
-6 10
-5 10
u
-4 10
-3 10
Fatigue Damage ~n/N
co 0 0 ~
I 10
2 10
3 10
The appropriate limiting value of accumulated fatigue damage for use in JPCP design was determined as follows:
1. Field data were collected from three sources. The first source was AASHO Road Test sections on l 00ps 4, 5 r a nd 6, which were unde r traffic f o r 2 y ears (1958 t o 1960). Sect ions with e xcessive pumping were excluded. Fo r the 28 secti.ons t hat we r e inc luded , slab thickness r anged from 8 to 1 2. 5 i n. 'i 1he sacond sou:rc;; was A.~9HO Roed Te st aco t: ione that were left in service after the end of the test and became incorporated as part of I-80. ~hese sections were under r egular mixed traffic from 1962 to 1974. Extensive measureme nts of distress were made periodically by the Illinois Department of Transportation. Twenty-five sections were included, and the range of slab thickness was again from 8 to 12. 5 in. The third source was 37 in-service projects located in the United States and Canada: New Jersey, Arizona, California (11), Michigan, Utah (.2_), Georg ia (~),
Colorado (2), Washington, Texas , and Ontario. These projects ;ere mostiy heavily trafficked highways ranging in age from 6 to 34 y ea r s .
2. The total accumulated fa t i gue damage from the npeni ng of P.ach project to traffic to the date of the survey was computed by using the JCP-1 computer program. The truck lane with the heav.iest traffic was always used in the computations.
3. A plot of cracking index versus total accumulated fatigue damage is shown in Figure s. This curve gives a 50 percent probability that for a certain value of fatigue damage the corresponding cracking index will be higher than the value read on the curve. With all the uncertainties involved in measuring the cracking index in the field and in computing fatig ue damage, a more conservative curve that e nvelopes most of the da t a poi nt s plotted in the figure is needed for design.
The relation between slab cracking and computed fatigue damage indicates the following:
1. A correlation exists between transverse slab cracking and computed fatigue damage in the slab. Fatigue damage is computed at the longitudinal edge and hence should relate directly to transverse cracking. This correlation provides reasonable

Transportation Research Record 930
verification of certain aspects of the fatigue computation procedure.
2. A limiting fatigue damage value can be selected for design based on how much cracking is acceptable in the pavement. The fatigue damage design limit must be chosen so that it corresponds
figure 7. Effett of crocking Index on slab thickness and slab length for moderate axle·load distribution.
"' UI x 0 ~
1:
"' "' UI z "' 0 :;: I-
~ ...J
"'
Moderate Traff1 c
IS K = 400 pci
15
14
13
12
II
10
9
8
10
2 C.l. • 0 FT.II 000 FT (0: I0-6)
CI.<;;.5 (O=I0-4)
15 20 ' 25 SLAB LENGTH IN FEET
Flguro 8. Effect of cracking index on slab thickness and slab length for very heavy axlo·load distribution.
Very Heavy Traff1c
16 K = 400 pci
15
14 ~ UI x 0
?:: 13
z
~ 12 UI z "' 0 :;: I-
m <I ...J Ill 10
9
e
10
C.I =OFT./IOOOFT2
l D=I0-6)
1:5 20 25 SLAB LENGTH IN FEET
30
65
to a specific tolerable level of transverse cracking. All projects that have less than 10- 6 damage either exhibited no cracking or only a very minor amount. The amounts of probable transverse cracking for various accumulated damage values determined from an envelope fit above most of the data are as follows:
Fatigue Damage lo · • lo-• 10· 2
10 10 2
Cracking Index (ft/l,000 ft 2
)
0 <s 3:10 ..::,1s _::40
APPLICATION TO DESIGN
The proposed JPCP design method provides a comprehensive procedure for determining concrete slab thickness and strength and the maximum joint spacing needed to carry the expected traffic and climatic loading conditions throughout the entire design life of the pavement. The procedure specifically considers slab cracking. The faulting of joints must also be prevented throuqh adequate load transfer (3).
The design procedures show that, for a specific slab thickness and other desiqn factors held constant, the amount of slab crackinq increases with the joint spacing. If more cracking is to be tolerated, then either the slab thickness should be decreased or the jpint spacing should be increased (or the PCC strength decreased) • The design method is unique in this respect. All other desiqn methods for rigid pavement design only for the slab thickness. The joint spacing is usually decided on irrespective of the slab thickness. The dependence of slab thickness and joint spacing on each other, with its effects on different important design variables and their applications to the design process, is discussed below.
cracking Level
As discussed earlier, this design method provides for designing the concrete slab for different levels of cracking. It has been shown in Figure 5 that, the higher the total fatigue damage in the concrete slab, the higher will be the cracking index. Therefor;e, the design engineer has flexibil i ty in dec i ding on the amount of cracking to be tolerated, depending on the site conditions that will exist during the pavement design life.
Figure 6 shows the effect of the level of cracking on slab thickness and joint spacing for a highway with a heavy axle-load distribution. As the amount of cracking increases, the slab thickness decreases for a constant joint spacing. On the other hand, if the slab thickness is held constant, longer joint spacing is allowed. For example, if a slab th±ckness of 12 in. is obtained and a zero cracking index is chosen, a joint spacing of about 10 ft is needed. However, if a higher cracking index is tolerated (CI <10 ft/l, 000 ft 1
) , a joint spacing fo 25. 0 ft is needed. On the other hand, if a joint spacing of 13 ft is fixed, a slab thickness of ll. 4 in. can be used. This cracking index effect is also shown in Figures 7 and 8 for a traffic level with moderate and very heavy axle-load distributions.
Traffic Level
The effect of the level of traffic on slab thickness and joint spacing is shown in Figures 6 to 8. Three levels of traffic were analyzed: moderate, heavy,

66
Table 1. Determination of axle-load distribution for use in design.
Design Axle-Load Distribution(%)
Axle-Load Group Weight (kips) Moderate Heavy Very Heavy
Single axle 0-3 7.87 7.28 7.28 3-7 17.59 16.28 16.28 7-8 8.37 7.75 7 .75 8-12 16.22 15.0l 15.01
12-16 5. J 3 4.75 4.75 16-18 2.10 l.94 I.94 18 -20 0.44 l.32 1.2 20-22 0.34 l.02 0.81 22-24 0. 14 0.42 0.55 L'l-Lo O.OJ 0.14 0.3 26-28 0.02 0.06 0.05 28-30 0.01 0.02 0.03 30-32 0.0 1 0.02 32-34 0.0 1 O.D2 34-36 0.01 36-38 0.01
Tandem axle U-6 O.u4 G.37 V,JI
6-12 10.54 9.76 9.76 I 2-18 4 .7 1 4-36 4.36 18-24 6.14 5.68 5.68 24-30 9.64 8.92 8.92 30-32 5.29 4.90 4 .90 32-34 2. 15 4.30 4.01 34-36 1.70 3.40 l.92 36-38 0.70 l.40 l.06 38-40 0.24 0.48 0.83 40-42 0.09 0.19 0.60 42-44 0.04 0 .08 0.35 44-46 0.03 0.06 0.29 46-48 0.02 0.03 0.3 1 48-50 0.01 0.02 0.27 50-52 0.01 0.02 0. 16 52-54 0.0 1 0.01 0.08 54-56 0.01 0.05 56-58 0.02 58-60 0.02 60-62 O.Dl 62-64 O.Dl 64-66 0.01
Total 100.00 100.00 100.00
and very heavy axle-load distributions with the same overall ADT volume. These axle-load distributions are given in Table 1.
The figures show that as the axle-load distribution gets heavier the s l ab thickness increases or the joint spacing is decreased for the same cra cking index. A cracking index of up to 5 ft/1,000 ft 2
is used to plot Figure 9 which shows the effect of dif f erent axle-load distribution levels on both slab thickness and ioint spacing. Decreasing the traffic from a very heavy to a moderate axle-load distribution level decreas es the slab thickness by approximately 1 in. for a constant slab length or increases the joint spacing by 3 ft for the same slab thickness.
Foundation Support
The effect of the pavement foundation support system (K) on s ·lab thickness and joint spacinq is shown in Figure 10. Different l evels of cracking index are also shown i n this figure . With the high cracking index (CI .S.40), using a stabilized base will decrease the slab thickness by 1 to 2 in. or (for the same slab thickness) will aliow the use of a much longer slab. As the l evel of crack i ng index decreases (CI <10 or CI <S), a thicker slab is required (12 to 16 in.). - Usinq a stabilized base will dec rease the slab thickness requ i rement within the shorter slab range, but it will increase the thickness requirement wi t h i n the l onger slab range. This is due to the greater effect of curling conditions on the longer slabs than on the shorter slabs.
Transportation Research Record 930
Higher curling stresses are also expected in longer slabs with a stabilized base than in slabs with a less stiff foundation. These conditions require a thicker slab or shorter joint spacing.
Figure 9. Effect of axle·load distribution 1.evel on slab thickness and joint spacing.
1.8 K = 400 pci
Cracking Index~ 5 f t/1000 ft2
16
Very Heavy Traff1c
Heavy Traffic
10
10 15 20 25
Sla b Length in Feet
30
Figure 10. Effect of foundation support on slab thickness and joint spacing for different levels of cracking index and heavy traffic.
16
~
" .c .... c
14 c
~ ~
~ .c >-.0 .. .,,
15 20 25 30
Slab Length i n Feet

Transportation Research Record 930
Figure 11. Effect of modulus of rupture on slab thickness and joint spacing for heavy traffic.
16
10
Cracking Index < 5 ft. /1000 ft ,
K • 400 pd
Heavy Traffic)---
Slab Length in Feet
Modulus of Rupture
The effect of modulus of rupture (MRI on slab thickness and joint spacinq is shown in Fiqures 11 and 12. A concrete pavement with a stabil ized base under typical traffic and environmental loading conditions is analyzed. The effect of three levels of modulus of rupture on slab thickness and length is shown in Fiqure 11. 11s modulus of rupture changes by ±100 psi, slab thickness changes by about ±1 -1,5 in. for the same joint spacinq. If slab thickness is held constant~ the joint spacing would be changed by about ±5 ft.
Figure 12 provides an adjustment factor that cou.ld be used to account for the change i n modulus of rupture. For example, the slab length obtained for a pavement under typical conditions [a heavy axle-load distribution, a foundation support of 400 pci, a modulus of rupture of 650 psi, a cracking index of ~5 ft/1,000 ft 2
, and a s lab thickness of 12 in. (Figure 6) J would be 16 ft. If MR is 750 psi, then the slab length is 16 * 1. 3 = 21 ft, On the other hand, if MR is 550 psi, the slab length is 16 * 0.7 = 11 ft.
SUMMARY
The structural design procedure for Jl'CP described in t his paper takes i nto direct consideration major design factors such as slab thickness, slab length, slab strength, traffic volume and distribution, foundation suppor.t, and climatic conditions throughout the pavement desiqn life. 11 comprehensive set of 76 in-service pavements was used to determine a correlation between the amount of transverse cracking, measured on site, versus the total fatigue damage accumulated by each section throughout its in-service life and computed by the JCP-1 computer program.
Figure 12. Effect of PCC modulus of rupture on adjustment factor for joint spacing for different slab thicknesses.
~ ., "'
l. 3
1.2
~ 1.1 .0 m
"' ~ 0 ,_
g 1.0
0.8
o. 7
Modulus of Rupture (PSI)
67
In this paper different applications of the method to concrete pavement design have been shown and a new concrete pavement design concept of considering slab thickness and strength wi th transverse joint spacing has been developed. It was found that if a thicker s lab were used a l onqer joint s pacing could be all owed for the same level of cracking. This has lonq been known i n airfield pavement design but is now quantified analytically.
The effect of the amount of cracki ng, traffic axle-load distribution level, foundation support (K) and modul us of rupture (MR) were also studied. 11s more cracking is tolerated in the concrete pavement, a longer joint s.pac i ng is allowed. The effect of different axle-load distribution levels on both slab thickness and j oint s pacing is such that decreasing the axle-load distribution leve.l from very heavy to moderate would decrease the slab thickness by approximately l in. or would increase the slab length by about 3 ft.
Foundation support has a q r eater effect on slab thickness and length if a higher: cracking index is tolerated (15-40 ft/1,000 ft'!. A decrease of up to 1.5 in. is noted in the slab thickness if a stabilized base is used and a high crackinq index is allowed. The modulus of rupture has an appreciable effect on both slab thickness and l ength. 11 chanqe of ±100 psi in MR will change the slab thickness by ±1 - 1.5 in. or will change the slab length by about ±s ft.
ACKNOWLEDCMENT
Most of this paper was prepared as part of a contract with the FHWA for research conducted at the University of Illinois. Some additional information

6B
was obtained from a recent contract study conducted by ERES Consultants , Inc. Data us ed in the analysis were obtained from the first contract and the FHWA cost allocation study. This paper does not constitute a standard, specification, or regulation.
1. Thickness Design for Concrete Pavements. Portland Cement Assn., Skokie, Ill., 1966.
2 . Interim Guide for the Design of Rigid Pavement Structures . AASHTO, Washington, D.C., 1981.
3 . M. I. Darter. Design of Zero- Maintenance Plain Jointed Concrete Pavement: Volume I--Development of Design Procedures. FHWA, Rept. FHWA-RD-77-111, June 1977.
4. Y.H. Huang and S.T. Wang. Finite-Element Analysis of Concrete Slabs and Its Implications for Rig id Pavement Design. HRB, Highway Research Record 466, 1973, pp. 55-69.
5. The ~~~Hn RnA~ Test: Report 5--Pavement Research. HRB, Special Rept. 61E, 1962.
6. E.A . Finney and L. T. Oehler. Final Report on Design Project, Michigan Test Road. HRB, Proc., Vol. 3B, 1959.
7. M.A. Miner. Cumulative Damage in Fatigue. Trans., American Society of Mechanical Engineer s , Vol . 67, 194 5 , pp. Al59- Al 64.
B. J.R. Mu r doc k. A Critical Review o f Research on Fatigue of Plain Conc r ete. Engi neering Experiment Sta tion , Univ . of 1:llinois , Ur ba na-Champai gn, Bull. 476, 1965, 32 pp.
9. G.M. Nordby. Fatigue of Concrete: A Review of Research. Proc., American Concrete Institute, Vol. 55, 1959, pp. 191-220.
10. B. Westerberg. Fatigue of Plain and Reinforced Concrete: A Survey of Literature. Statens Institute for Byggnadsforskning, Stockholm, Sweden, Rept. 22, 1969.
11. H.K. Hilsdorf a ml C.E. Ke!!ler . Fa tigue Strength of Concrete Under Varying Flexural Stresses. Proc., American Concrete Tnstitute, Vol, 63, 1966, pp. 1059-1976.
12. K.W. Raithby and A.C. Whiffin. Failure of Plain Concrete Under Fatigue Loading: A Review of Current Knowledge. Road Research Laboratory, Rept. LR 231, Crowthorne, Berkshire, England, 1968, 23 pp.
13. J.T. McCall. Probability of Fatigue Failure of Plain Concrete. Proc., American Concrete Institute, Vol. 55, 1959, pp. 233-245.
Transportation Research Record 930.
14. J.W. Murdock and C.E. Kesler. Effect of Range of Stress on Fatigue Strength of Plain Concrete Beams. Proc., American Concrete Institute, Vol. 55, 1959, pp. 221-231.
15. F.S. Ople, Jr. and c.L. Hulsbos. Probable Fatigue Life of Plain Concrete with Stress Gradient. Proc., American Concrete Institute, Vol. 63, 1966, pp 59-81 .
16. H.F. Clemmer. Fatigue of Concrete. Proc., ASTM, Vol. 22, Part 2, 1922, pp. 408-419,
17. C.E. Kesler. Effect of Speed of Testing on Flexural Strength of Plain Concrete. HRB, Proc., Vol. 32, 1953, pp. 251-258.
lH . M.I. Dart:er and E.J. Barenbe~g. Ze~c=Mainta-
nance Pavement: Results of Field Studies on the Performance Requirements and Capabilities of Conventional Pavement Systems. FHWA, April 1976.
19. C.A. Ballinger. Cumulative Fatigue Damage Characteristics o:t !'lain Concrete. HiW, iiighway Research Record 370, 1972, pp. 48-60.
20. w.H. Mills, Jr. and R.F. Dawson. Fatigue of Concrete. HRB, Proc., Vol. 7, 1927.
21. K.D. Raithby and J.W. Galloway. Effects of Moisture Condition, Age, and Rate of Loading on Fatigue of Plain Concrete. American Concrete Institute, Detroit, SP-41, 1974.
22. F.N. Hveem. Report on Experimental Project in California. HRB, Res. Rept. 17-B, 1956.
23. H.C. Coons. Report on Experimental Projection in Michiga n. HRB , Re s . Rept . 17-B, 1956 .
24. E.C. Carsberg a nd P. G. Velz . Repor t on Experimental Projec t i n Minnesota. RllB Re s . Rept. 17-B, 1956.
25. Road Test One--MD. HRB, Special Rept. 4, 1952. 26. A. Taragin. Lateral Placement of Truc ks on
Two-Lane Highways and Four-Lane Div ided Highways, Public Roads, Vol. 30, No. 3, Aug. 1958.
27. D.K. Emery. A Preliminary Report on the Transverse Lane Displacement for Design Trucks on Rural Freeways. Presented at ASCE Pavement Design Specialty Conference, Atlanta, Ga, June 1975.
Publication of this paper sponsored by Committee on Rigid Pavements.
Notice: The views expressed in this paper are our own and do not necessarily reflect the official views or policies of the Federal Highway Administration.