Embed Size (px)
Citation preview

Design of Experiments:a Paradigm Popper
Your job….
Your title defines your job responsibilities.However, your ability to locate, andminimize, or eliminate variation will defineyour level of success at that job.
TCB
Ted Karr, May 1998

Paradigm defined
...the set of experiences, beliefs and values that affect the way an individual perceives reality and responds to that perception.

S-I-P-O-C
S……Suppliers (internal or external)I……..Inputs (parts, supplies, info)P…….Process (steps or elements)O……Outputs (product or service)C……Customers (internal or external)

C-O-P-I-S
C……CustomersO……Outputs P…….Process I……..InputsS…….Suppliers

Design of Experiments
C……CustomersO……Outputs
P…….Process (steps)
I……..InputsS…….Suppliers
RESPONSES
FACTORS ORTREATMENTS

DOE Model
Factors or Process Outputs or Treatments Responses
vary the inputs for the process determine impact
CAUSE AND EFFECT

Responses--Maximize
HEAD™ brand tennis racquets: MAXIMIZE the “sweet spot”
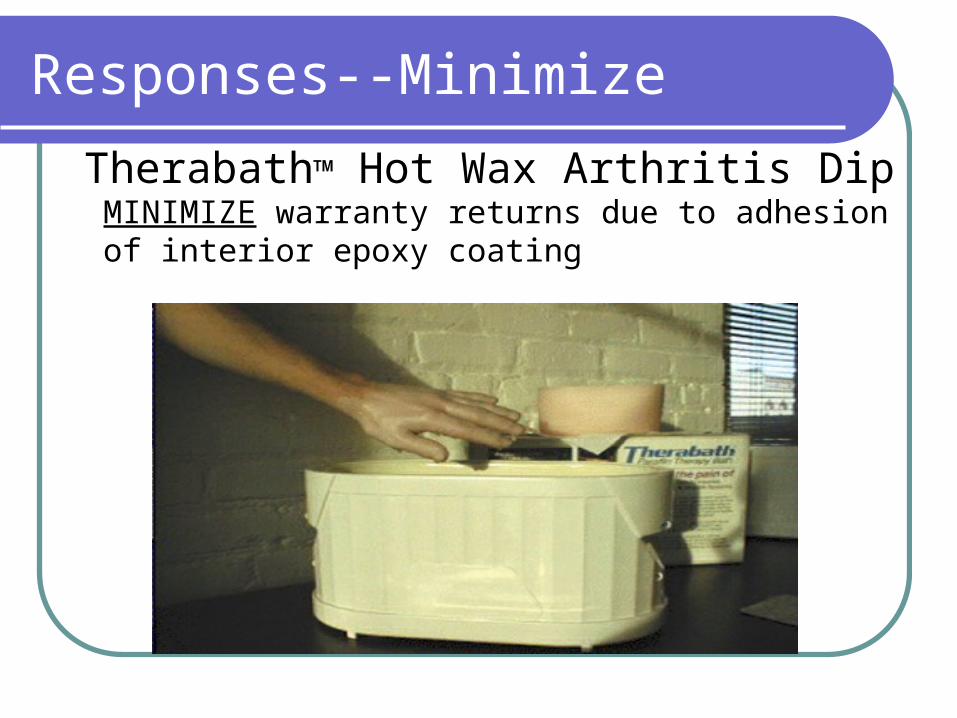
Responses--Minimize
Therabath™ Hot Wax Arthritis Dip MINIMIZE warranty returns due to adhesion of interior epoxy coating

Responses-Target
Coors ™ Bottling Co. –-Pop top cansTARGET VALUE of 3.0 +/- ½ lbs of force

(3) Basic Responses
Maximize—usually “good” attributes such as “sweet spots” or patient care.
Minimize—usually “bad” attributes such as wait time, or hospital caused infections.
Target—hitting a target value usually within a tolerance or allowance such as pop tops or average emergency response time.
NOTE: Tolerances and allowances are recognition that variation does occur and must be controlled.

Effects of Factors #1
1. Can shift the process average.

Effects of Factors #2
2. Can change process variation
AFTER
BEFORE

Effects of Factors #3
3. Can change both the average and variation.

Effects of Factors #4
4. Can have relatively little or no effect on the process.

Injection Molding Case Study
1. A small family owned business with less than 30 employees—12 of which were somehow related.
2. Products: High volume, low cost, low margin, thermoplastic parts.
3. Grandpa was CEO/Ops Manager.
Latest addition was grandson Joey as the “engineering staff.”

The Part--a base for a speaker
6 in.
4 in. diam. x ¼ in. deep
½ in.
+/- .010 in.
+/- .015 in
+/- .015 in

Problem Description
1. We are having to return molds to the mold-maker for rework because parts are undersize.
2. This causes schedule and shipping problems.
3. This causes $$$ problems.
What is causing these defects.?

Root Canal Analysis
Find a name, Make ‘em “feel our pain” Let’s focus now on…. who’s to blame.
Based upon “our tooling was checked, our process was checked—it must be the plastic material supplier’s fault!”

Available data & assumptions
1. The mold has been inspected and meets the drawing specs.
2. The process set up and production settings appear correct.
“Most likely” causes:
A. Supplier sending bad material
B. “Gremlins” sometime take control of our machines.

Injection Molding Machine
1
2
3

Root Cause Analysis — 6M’s
Part Var
Mold rework
MCH
MATL’S
METHODS
MANPOWERMOTHER NATURE
MEASUREMENT
S1 vs S2
% Regrind
Training
Experience
SOP’s
Set up
Ambient T
Humidity
Calibration
Location of
Injection Time
(time & temps)Injection P
Mold TempCycle timeBarrel Temp
Heater Temp

Types of Experiments
Screening Designs
Characterization
Designs
Optimization
Studies
Fractional Factorials
(We just don’t know)
Full Factorials
(Let’s zero in on these)
Response Surface Methods
(The best we can do)
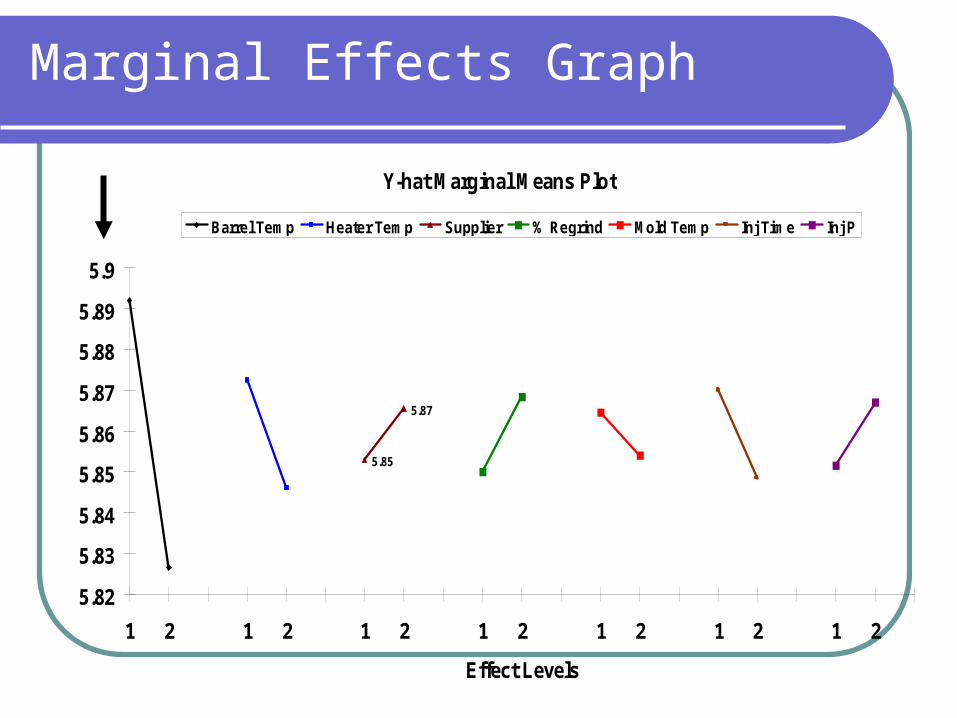
Marginal Effects Graph
Y-hat Marginal Means Plot
5.85
5.87
5.82
5.83
5.84
5.85
5.86
5.87
5.88
5.89
5.9
1 2 1 2 1 2 1 2 1 2 1 2 1 2
Effect Levels
Barrel Temp Heater Temp Supplier % Regrind Mold Temp Inj Time Inj P

Selecting factor levels
Factor Name Low High Exper
A Barrel Temp 1 2 1
B Heater Temp 1 2 1
C Supplier 1 2 2
D % Regrind 1 2 2
E Mold Temp 1 2 1
F Inj Time 1 2 1
G Inj P 1 2 2

The Computer Prediction Model
Prediction
Y-hat 5.9445
99% Prediction Interval
Lower Bound 6.1875491
Upper Bound 5.7014509

Process capability
6.0 in5.90 in 6.010
Desired (Spec)
5.94 in5.70 in 6.19 in(predicted)
Predicted

Crime Scene Investigation
DOE results give us “clues” and a direction towards what has happened. Using our education, experience, and process knowledge, it is our job to understand the “physics” of what the data shows.

Some clues
1.Parts undersize
2.Using less heat gives best results
3.Using more regrind gives better results
Our process experience tells us that “less heat” leads to less part shrinkage during the molding process.

Typical shrinkage allowances
Typical shrinkage values: Plastic Shrinkage, in/in
Nylon‑6,6 0.020
Polyethylene 0.025
Polystyrene 0.004
PVC 0.005
6 inch wide part expected to shrink .024 inches

Rechecking our assumptions
1. Mold meets per drawing specs.
The SOP—the inspector sends out a report saying mold for job number xxx “accepted” but does not list actual dimensions.
2. The actual size for the 6 inch square was 6.10”—to the high side of the tol.

The “truth” comes out
The mold maker was called…
Question: “why didn’t you add the shrinkage allowance to the mold?”
Reply: “Joey asked us to please make the molds to his drawing specs.”

A comedy of errors
1. Joey could make drawings but didn’t understand the molding process.
2. The inspector’s reports were his conclusion—not his data.
3. The moldmaker did as his customer asked and made the mold to the specs
4. The CEO assumed the mold was correct as he was told.

The Paradigm & the Irony
1. The first factor to be eliminated as the likely cause—the mold, was the true root cause.
2. Assumptions led the team down the wrong trail—the material supplier.
3. Conclusions and causes were being formed before:
A: the problem was adequately defined and
B: verifiable data was obtained

Paradigm defined
...the set of experiences, beliefs and values that affect the way an individual perceives reality and responds to that perception.
Sometimes leads to “group-think.”
(Bobble-head-ism)

Reality
What’s your perception of reality—
Can a steel knitting needle pass through a balloon without making it “pop?”
![Popper Bee&koven/ David Popper: Suite '1m Walde' / Anton ...€¦ · Popper Bee&koven/ David Popper: Suite '1m Walde' / Anton von Webern: 3 StiickeJìir Vidlonçello K7avier Op.]](https://img.pdfslide.us/doc/110x75/5f9c43259ad7976520145adf/popper-beekoven-david-popper-suite-1m-walde-anton-popper-beekoven.jpg)