Embed Size (px)
DESCRIPTION
Design of Engineering Experiments Part 8 – Overview of Response Surface Methods. Text reference, Chapter 11, Sections 11-1 through 11-4 Primary focus of previous chapters is factor screening Two-level factorials, fractional factorials are widely used Objective of RSM is optimization - PowerPoint PPT Presentation
Citation preview
DOX 6E Montgomery 1
Design of Engineering Experiments Part 8 – Overview of
Response Surface Methods
• Text reference, Chapter 11, Sections 11-1 through 11-4
• Primary focus of previous chapters is factor screening– Two-level factorials, fractional factorials are widely used
• Objective of RSM is optimization• RSM dates from the 1950s; early applications in
chemical industry
DOX 6E Montgomery 2
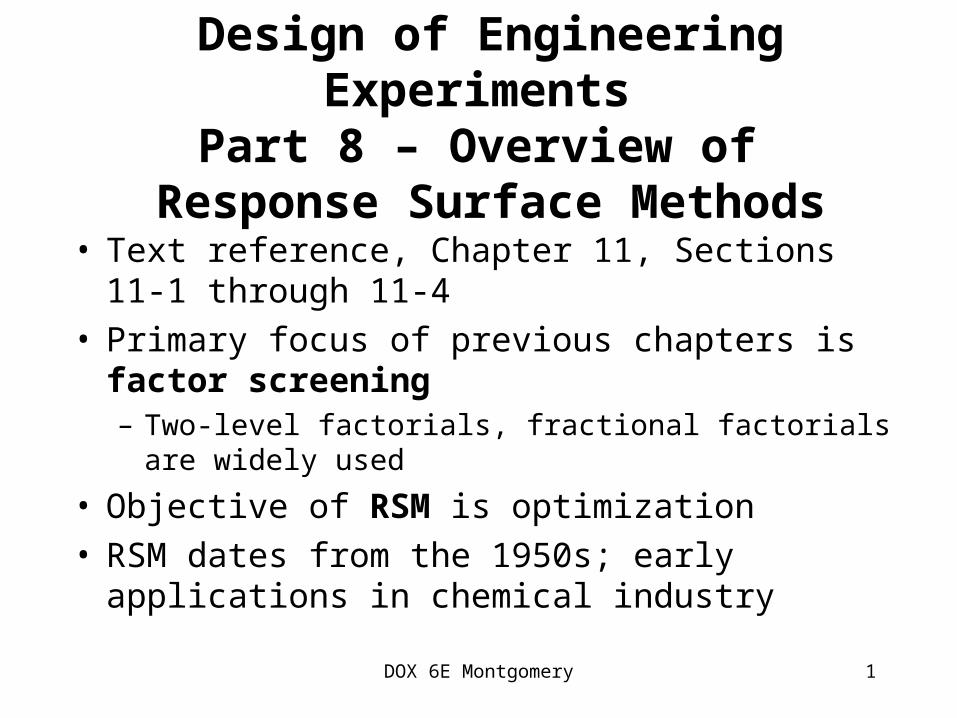
RSM is a Sequential Procedure
• Factor screening
• Finding the region of the optimum
• Modeling & Optimization of the response
DOX 6E Montgomery 3
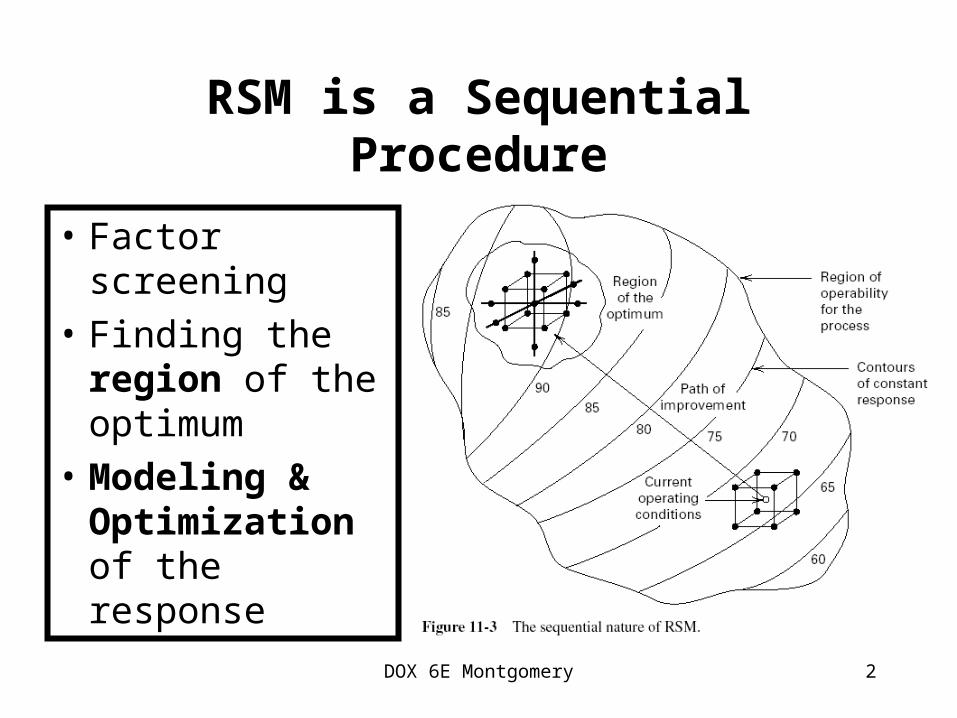
Response Surface Models
• Screening
• Steepest ascent
• Optimization
0 1 1 2 2 12 1 2y x x x x
0 1 1 2 2y x x
2 20 1 1 2 2 12 1 2 11 1 22 2y x x x x x x
DOX 6E Montgomery 4
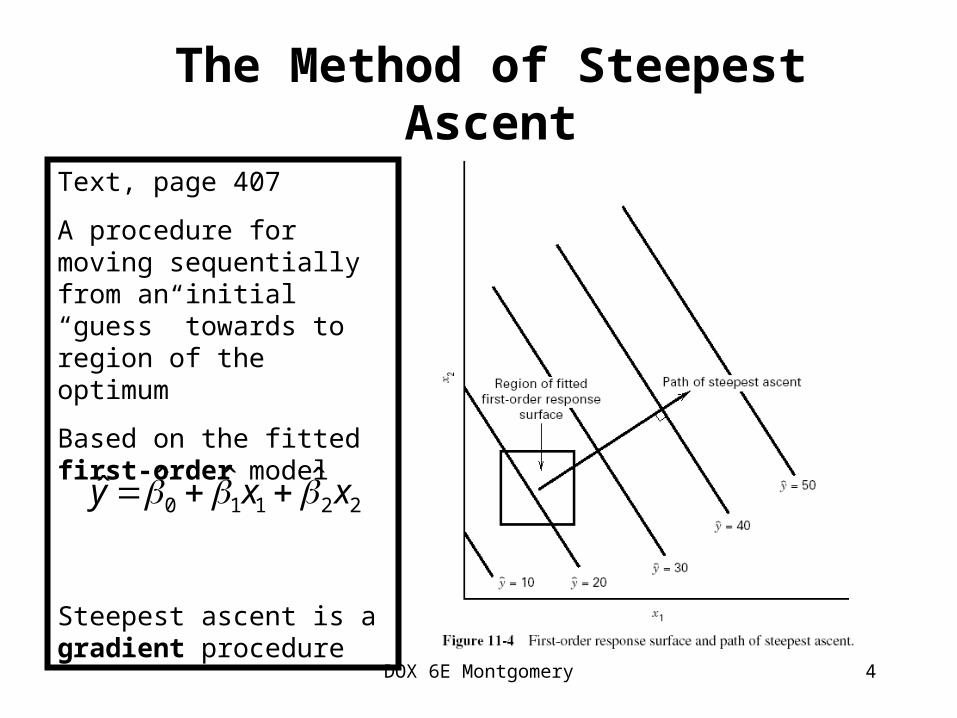
The Method of Steepest Ascent
Text, page 407
A procedure for moving sequentially from an initial “guess” towards to region of the optimum
Based on the fitted first-order model
Steepest ascent is a gradient procedure
0 1 1 2 2ˆ ˆ ˆy x x
DOX 6E Montgomery 5
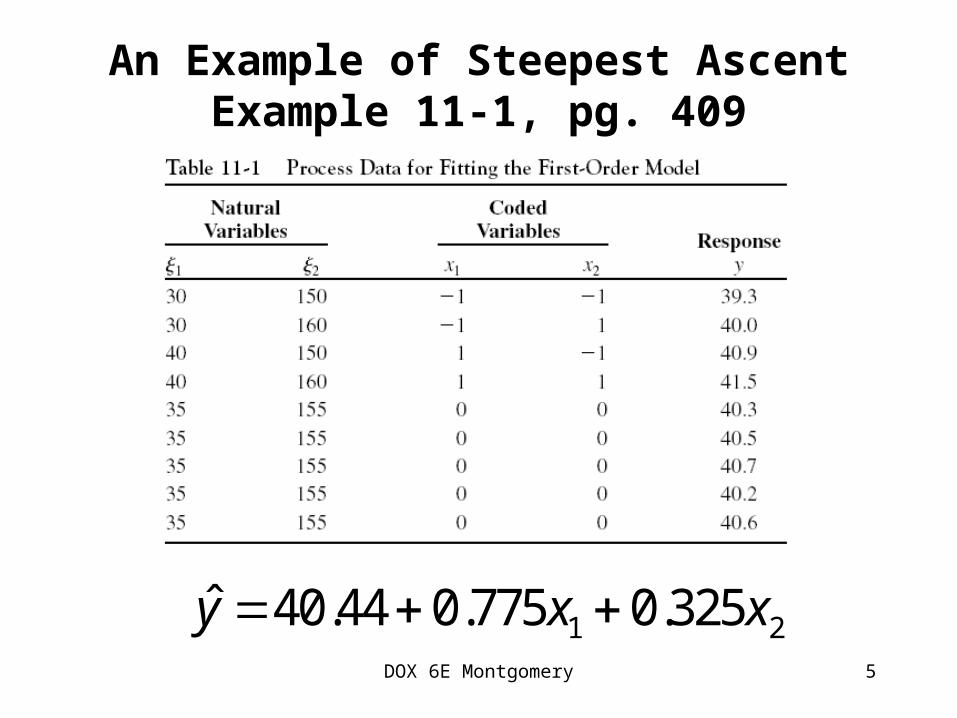
An Example of Steepest AscentExample 11-1, pg. 409
1 2ˆ 40.44 0.775 0.325y x x
DOX 6E Montgomery 6
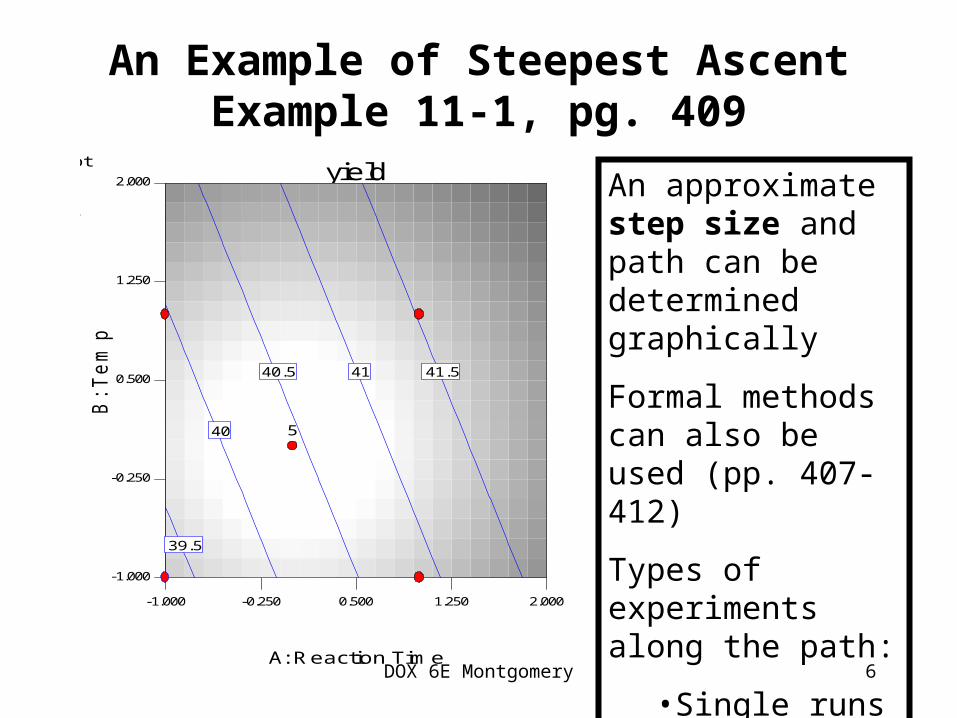
An Example of Steepest AscentExample 11-1, pg. 409
DESIGN-EXPERT Plot
yieldX = A: Reaction TimeY = B: Temp
Design Points
yield
A: Reaction Time
B: T
em
p
-1.000 -0.250 0.500 1.250 2.000
-1.000
-0.250
0.500
1.250
2.000
39.5
40
40.5 41 41.5
5
An approximate step size and path can be determined graphically
Formal methods can also be used (pp. 407-412)
Types of experiments along the path:
•Single runs
•Replicated runs
DOX 6E Montgomery 7
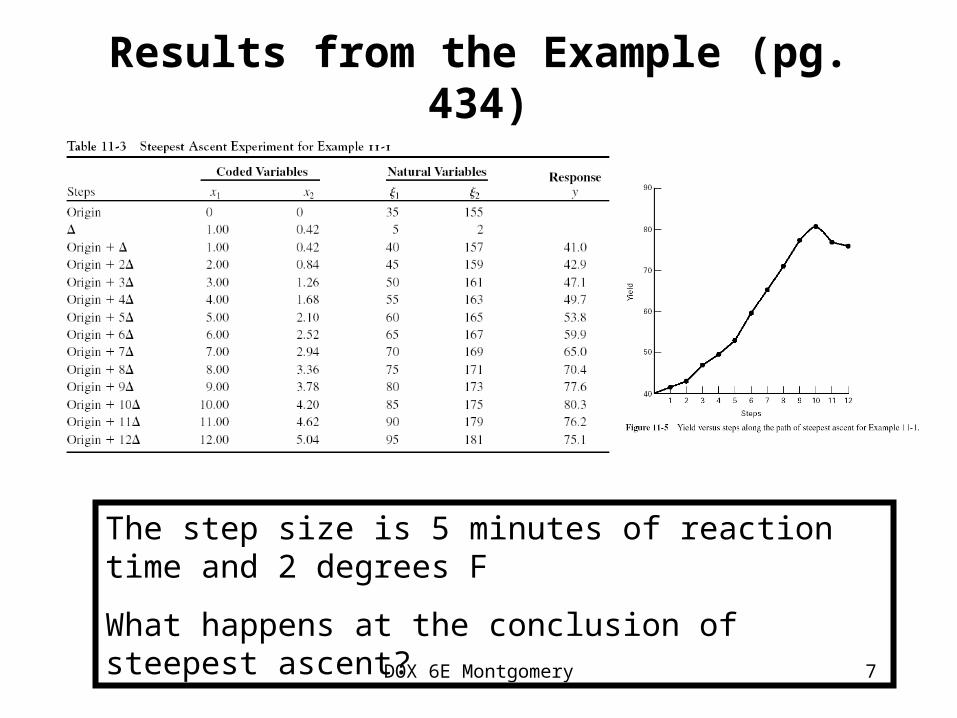
Results from the Example (pg. 434)
The step size is 5 minutes of reaction time and 2 degrees F
What happens at the conclusion of steepest ascent?

DOX 6E Montgomery 8
DOX 6E Montgomery 9
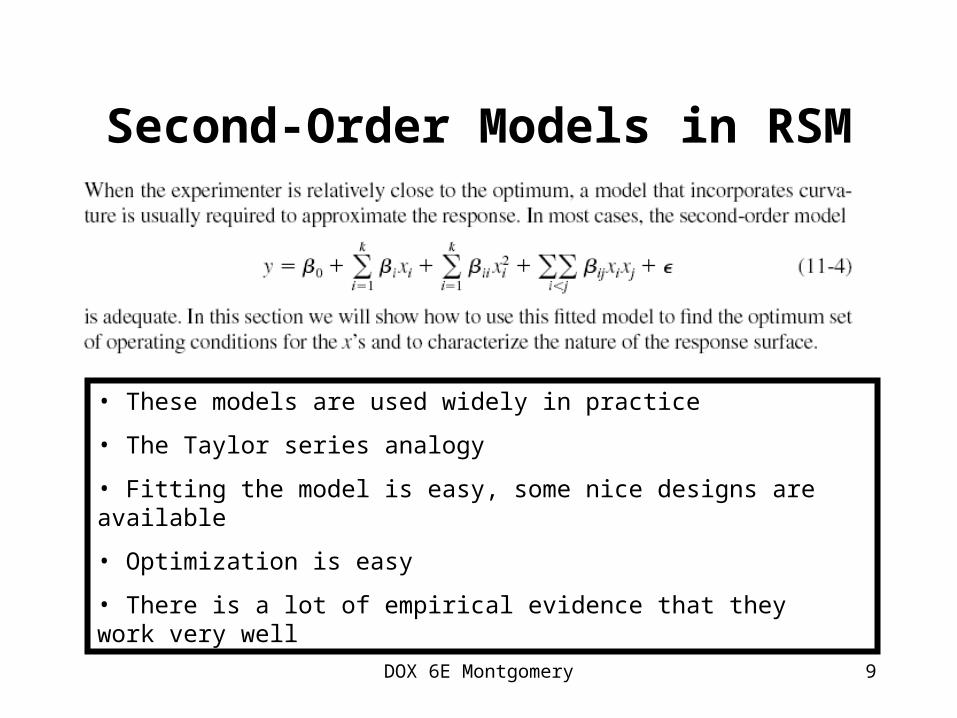
Second-Order Models in RSM
• These models are used widely in practice
• The Taylor series analogy
• Fitting the model is easy, some nice designs are available
• Optimization is easy
• There is a lot of empirical evidence that they work very well
DOX 6E Montgomery 10
DOX 6E Montgomery 11
DOX 6E Montgomery 12
DOX 6E Montgomery 13
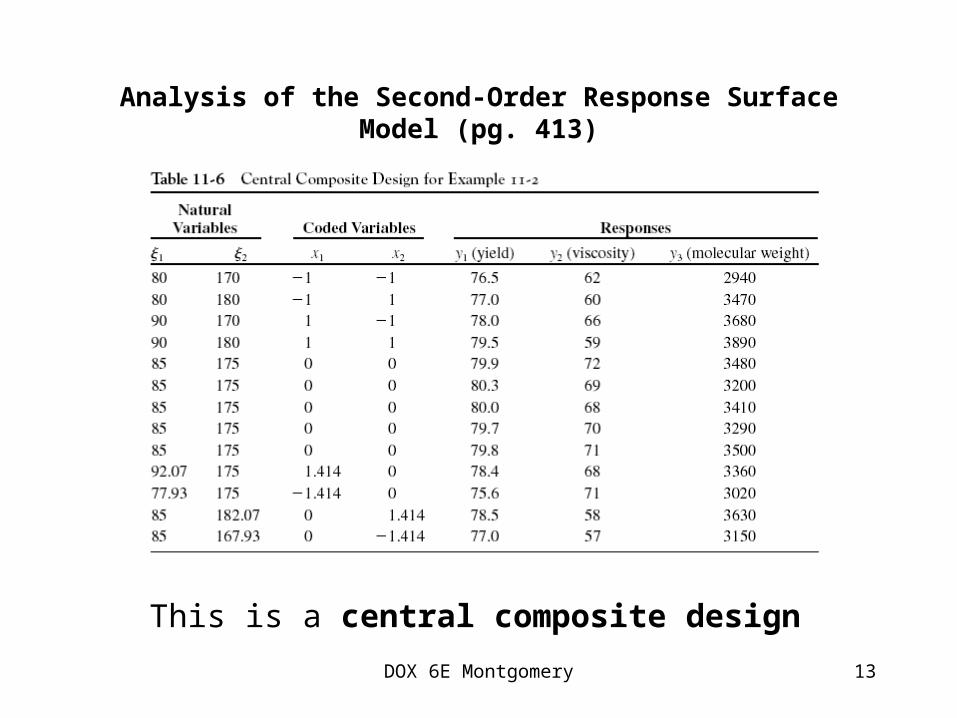
Analysis of the Second-Order Response Surface Model (pg. 413)
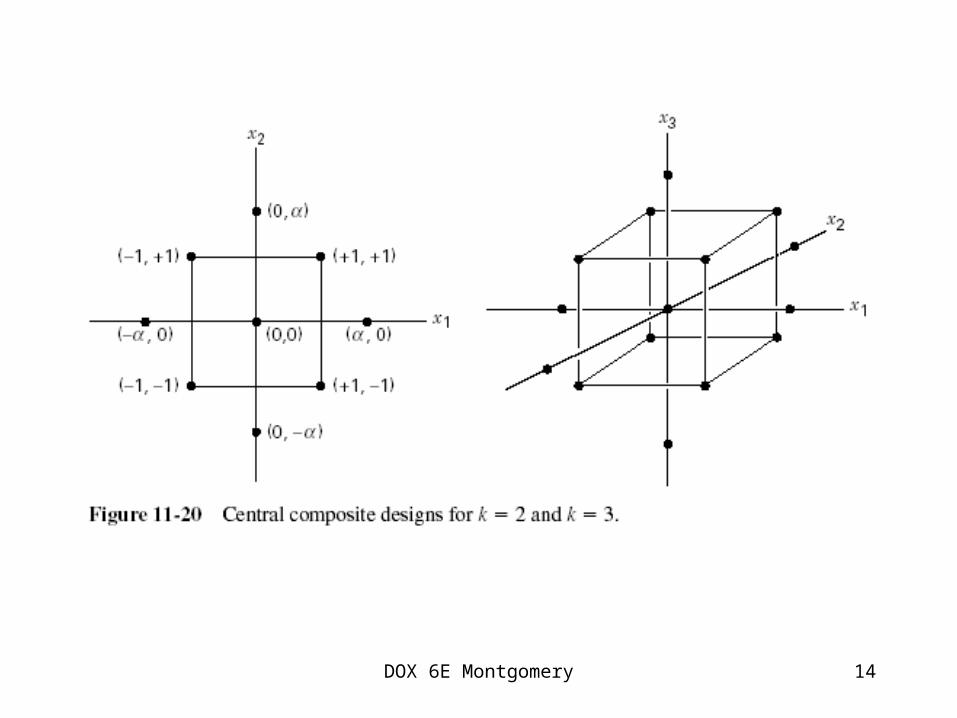
This is a central composite design
DOX 6E Montgomery 14
DOX 6E Montgomery 15
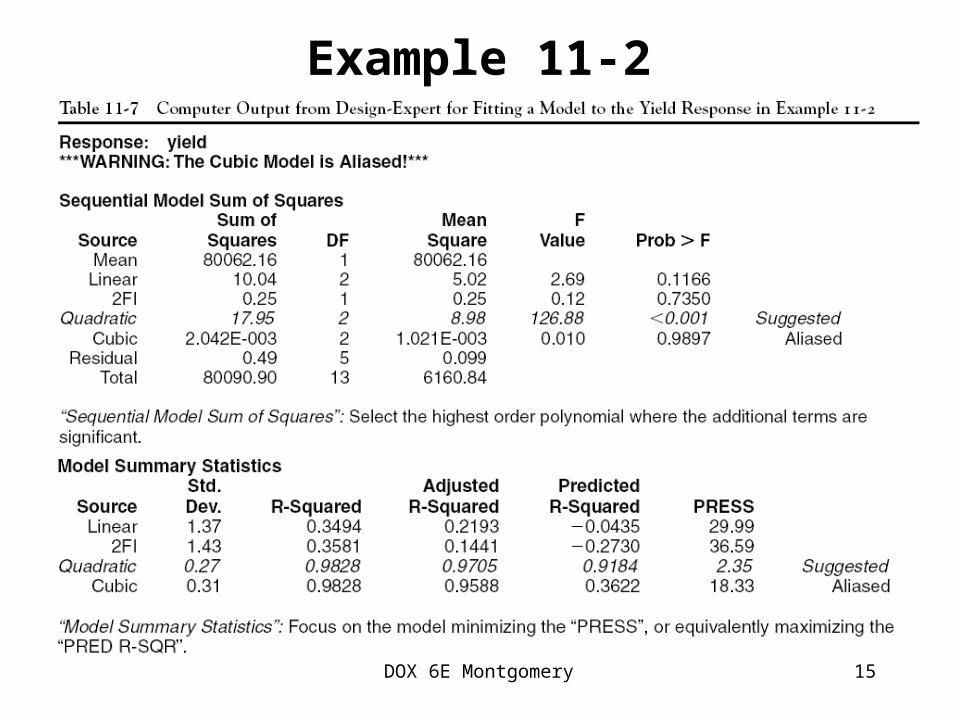
Example 11-2
DOX 6E Montgomery 16
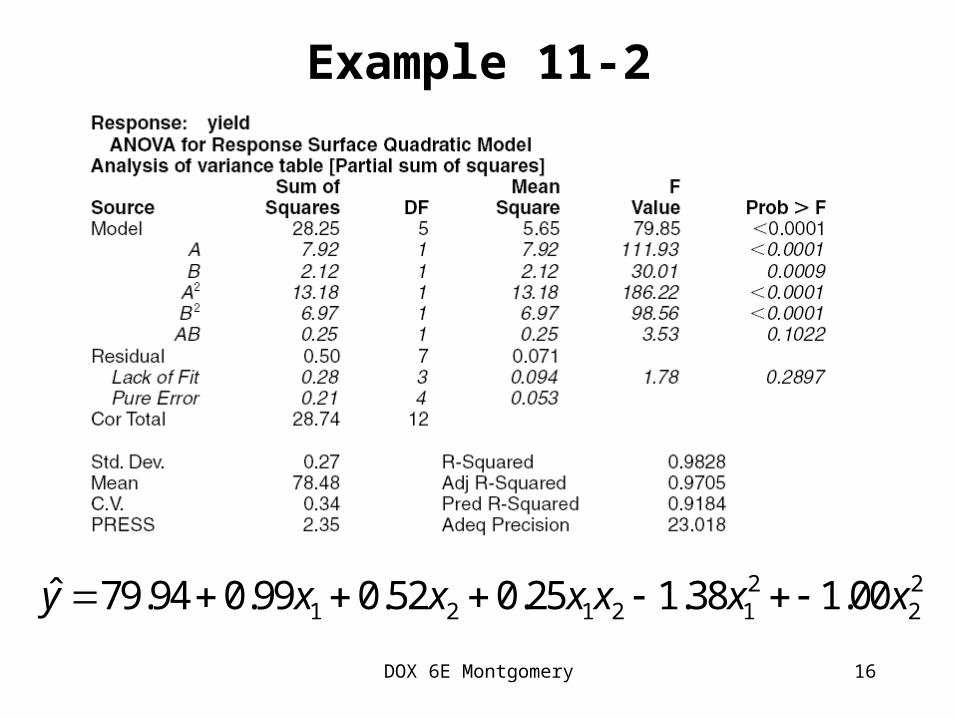
Example 11-2
2 21 2 1 2 1 2ˆ 79.94 0.99 0.52 0.25 1.38 1.00y x x x x x x
DOX 6E Montgomery 17
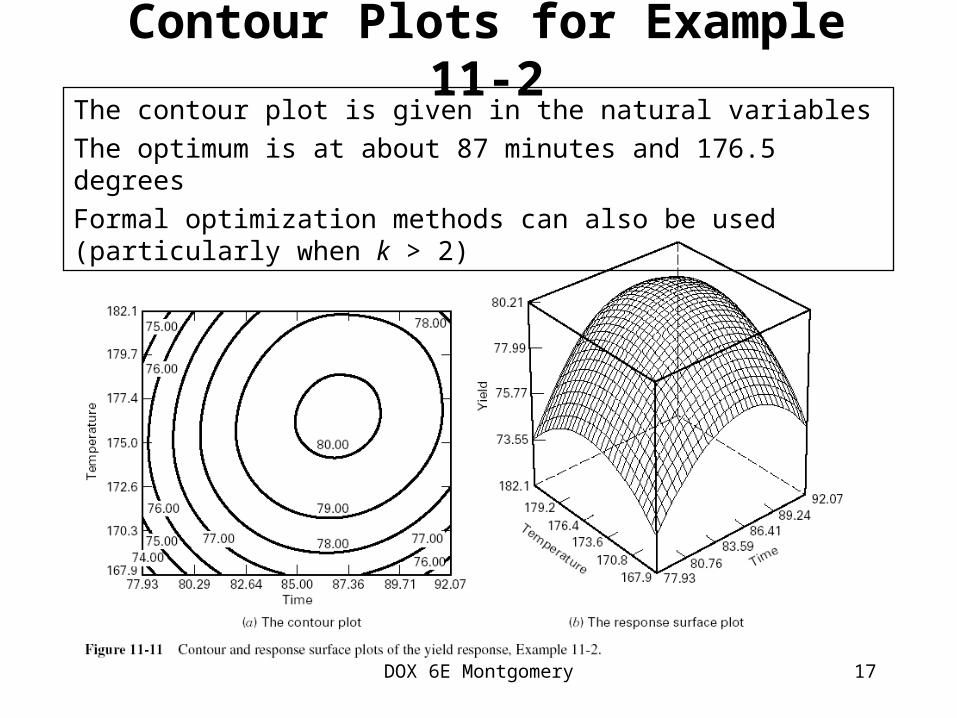
Contour Plots for Example 11-2The contour plot is given in the natural variables
The optimum is at about 87 minutes and 176.5 degrees
Formal optimization methods can also be used (particularly when k > 2)
DOX 6E Montgomery 18
Multiple Responses
• Example 11-2 illustrated three response variables (yield, viscosity and molecular weight)
• Multiple responses are common in practice• Typically, we want to simultaneously optimize all
responses, or find a set of conditions where certain product properties are achieved
• A simple approach is to model all responses and overlay the contour plots
• See Section 11-3.4, pp. 423 -427.
DOX 6E Montgomery 19
Designs for Fitting Response Surface Models
• Section 11-4, page 427• For the first-order model, two-level factorials (and
fractional factorials) augmented with center points are appropriate choices
• The central composite design is the most widely used design for fitting the second-order model
• Selection of a second-order design is an interesting problem
• There are numerous excellent second-order designs available
DOX 6E Montgomery 20
Other Aspects of RSM
• Robust parameter design and process robustness studies (Chapter 12)– Find levels of controllable variables that optimize mean response and
minimize variability in the response transmitted from “noise” variables
– Original approaches due to Taguchi (1980s)– Modern approach based on RSM
• Experiments with mixtures– Special type of RSM problem– Design factors are components (ingredients) of a mixture– Response depends only on the proportions– Many applications in product formulation