Embed Size (px)
Citation preview
Design of Earth Grid for a 33/11kV GIS
Substation at a High Soil Resistivity Site using
CYMGRD Software
Nevil Jose Substation Design Department
National Contracting Company Emirates Ltd.
Dubai, UAE
Abstract—Thispaper describes the design ofan earthing
system for aGas Insulated Switchgear (GIS) substation using
CYMGRD software.The buried earth grid design is based on the
soil resistivity of the substation site and the design is verified
through simulationsto make sure that the attainable potentials
are within the permissible limits ensuring safety of personnel as
well as equipments.The design confirms to the IEEE
standard80-2000. A 33/11kV indoor GIS substation with a 33kV
fault level of 40kA is considered. The soil conditions considered
are desert conditions and hence with poor resistivity. Soil
resistivity measurement is done using Wenner 4 point method.
The measured soil values are then analyzed using the Soil
Analysis module of CYMGRD software. The conductor spacing
and the ground rod quantity is arrived based on various
simulations. This paper also throws light into methods to
improve the earthing system when the soil resistivity is high.
Keywords—Soil Electrical Resistivity; Substation Earth
Grid;Touch Potential; Step Potential;CYMGRD; Ground Potential
Rise.
I. INTRODUCTION
Substations form an integral part of electric power distribution systems. An efficient earthing system ensures safe and reliable operation of substations. It ensures the safety of personnel inside or in the immediate vicinity of the station. The earthing system provides a low impedance path for electric current to the earth without exceeding the operating limits of equipment.Furthermore, it ensures that in the event of a fault,the current is easily dissipated into the earth without damaging the equipments or exposing personnel on site to dangerous touch and step voltages[2].Since the various factors to be considered while designing an earthing system such as soil electrical resistivity, system fault level, fault clearing time, area occupied by the substation plot, etc. varies from substation to substation, it is not possible to have a common design.
An earthing system for substation mainly consists of a buried grid comprising of interconnected horizontal conductors and vertical earth/ground rods forming an earth mat. All the power equipments and metallic parts on site are earthed by connecting them to this buried earth mat. An efficient earthing design should be able to clearly decide profile of the buried earthmat and the earth rods. Being a critical part of the system, the earthmat design should be in a way such that it is efficient and cost-effective.
Earth mat design can be done by manual calculations as well as with the help of computer software. Though manual
calculation is a good, software tools ensure a detailed design so that the earth mat is neither under-designed hence safe nor overdesigned hence cost effective.
This paper presents the complete design of earth mat for a 33/11kV indoor GIS (Gas Insulated Switchgear) Substationusing CYMGRD software. Soil resistivity measurement is done using Wenner four point Method and the measured values are then analyzed and verified.
II. BASICS OF EARTH GRID DESIGN While deigning an earthing system for any substation, the
prime focus should be on the fact that the actual touch and step voltages should not exceed the tolerable values. [1].Ground potential rise (GPR) is the maximum voltage that the earthing system may achieve relative to a remote point assumed to be at the potential of earth [2]. Touch voltage is the potential difference between the ground potential rise on a structure and the surface potential at the point where a person is standing while touching the structure. Step voltage is the surface potential difference experienced between the feet of a person standing on the surface [2].
The primary data required to design an effective earthing system are grid area, soil resistivity, grid fault clearing time and the maximum grid current. In general the design process of an effective earthing systeminvolves Soil resistivity measurement and its analysis, Estimation of permissible touch and step voltages, Estimation of maximum grid current, Buried earth grid design and Safety evaluation of the designed earthing system to ensure potentials are within limits.
In this paper, the focus is on According to IEEE 80-2000, the area of the grid is the single most important geometric factor in determining the grid resistance and they are inversely related. With a larger grid area, a lower grid resistance and hence lower GPR can be expected.
III. SOIL ELECTRICAL RESISTIVITY
Soil resistivity is one of the key factors in the earthing system design. Soil resistivity depends on various factors such as the soil type, depth, presence of moisture, electrolyte contents, temperature, etc and could vary seasonally [5].
Soil resistivity value has direct effect on the overall substation earth resistance and hence on the amount of conductors/ground rods required to achieve a safe earthing design [5]. Consequently, more accurate the measured soil resistivity values are, more accurate thedesign is. Soil
International Journal of Engineering Research & Technology (IJERT)
IJERT
IJERT
ISSN: 2278-0181
www.ijert.orgIJERTV3IS101000
(This work is licensed under a Creative Commons Attribution 4.0 International License.)
Vol. 3 Issue 10, October- 2014
1151
resistivity report gives an idea of how deep the ground rods are to be driven or how close the conductors shall be spaced. Hence, when the design is based on this report, considerable savings in material and installation cost shall be expected.
There are various methods by which soil resistivity can be measured like the Wenner four point method, Schlumberger array method, Driven rod (three pin) method, etc. The four point wenner method is the most efficient and widely used. This method adopts multiple depth testing along various axes of the proposed substation site and an overall soil resistivity profile of the site is developed. A detailed description of this method is available in [1].
IV. EARTH GRID DESIGN
Once the soil resistivity is measured, the earth grid can be designed. CYMGRD software confirms to IEEE standard 80-2000, 81-1983 and 837-2002 [3]. It makes use of Finite Element Methods (FEM) for calculating grounding indices. This software helps to design and analyze different profiles of the earthing grid and hence the most economic and technically safe design can be chosen.
A. Soil Resistivity Measurement
Soil resistivity measurement is done using Wenner 4 point
method. The average soil resistivity values observed are
tabulated in Table 1.
TABLE I. SOIL RESISTIVITY REPORT
Sl No. Probe Distance
(meters)
Resistivity
(Ohm-m)
1 1 1158.98
2 2 743.96
3 4 455.46
4 6 343.65
5 8 245.07
6 10 185.443
7 12.5 121.229
8 15 84.378
9 17.5 51.83
10 20 31.06
B. Input Parameters
In order to start with the design, other inputs required apart from soil resistivity values are described below:
1) Fault current and shock Duration - The fault current is
the current that would pass through the earth grid in the event
of a fault. The fault duration is the time for which the fault
current will flow through the grid before protective devices
operate and interrupt the fault. Here, a falut current of 40kA
is considered and fault duration of 3 seconds is cosidered for
conductor sizing whereas 1 second is used to estimate the
permissibe step and touch potential values.
2) Grid Dimension - This is the dimension of the area
which the buried earth grid will cover. As mentioned earlier,
area of the grid has a direct impact on the grid resistance.
This design is for a 77m X 77m grid. Eventhough the
substation plot is 75m X 75m, the grid is extended 1m
beyond the boundary on all sides of the plot to take care of
the high potentials that may occur along the plot boundary as
suggested in IEEE 80-2000.
3) Surface Layer - It is suggested that the use of a high
resistivity surface layer is capable of improving the safety
while designing substation earthing grid in high resistivity
soil [1]. When there is a surface layer that provides high
resistance between the ground grid and a person on surface,
only a smaller amount of grid current will flow to the surface
layer. Furthermore, amount of current that may flow through
the person to ground is reduced because of the layer of higher
resistivity between the person and ground [6]. In this design,
a 0.2m thick surface layer of river gravel whose resistivity is
5000Ω.m is considered [1].
4) Grid Conductors and Ground Rods - Both Copper and
Aluminium can be used, however,copper is chosen for its
better characteristics.
5) Split Factor - In actual case, the whole fault current
may not pass through the earth grid due to the presence of
overhead lines or ground wires. A part of the fault current
may flow to the source through overhead wires. This is
possible where there is an overhead neutral connected to the
substation from a remote end. Split factor takes care of this
current division phenomenon and avoids overdesigning the
grid. In this study, a split factor of 0.7 is used.
6) Rod Encaement – In cases where the soil resistivity is
high, an improvement in soil property can be obtained by
encasing the ground rods in a low resistivity material.
Bentonite is an excellent material forn this purpose and is
widely used. The resistivity of bentonite is found to be 2.5
Ohm-m [1]. CYMGRD has an option that allows the user to
encase the rods with any material of any diameter. The
encasement diameter and material resistivity has to be fed to
the program.
7) Depth of burial- IEEE 80-2000 suggests that the earth
grid be buried at a depth from 0.5m to 1.5m below the
surface.
C. Soil Analysis
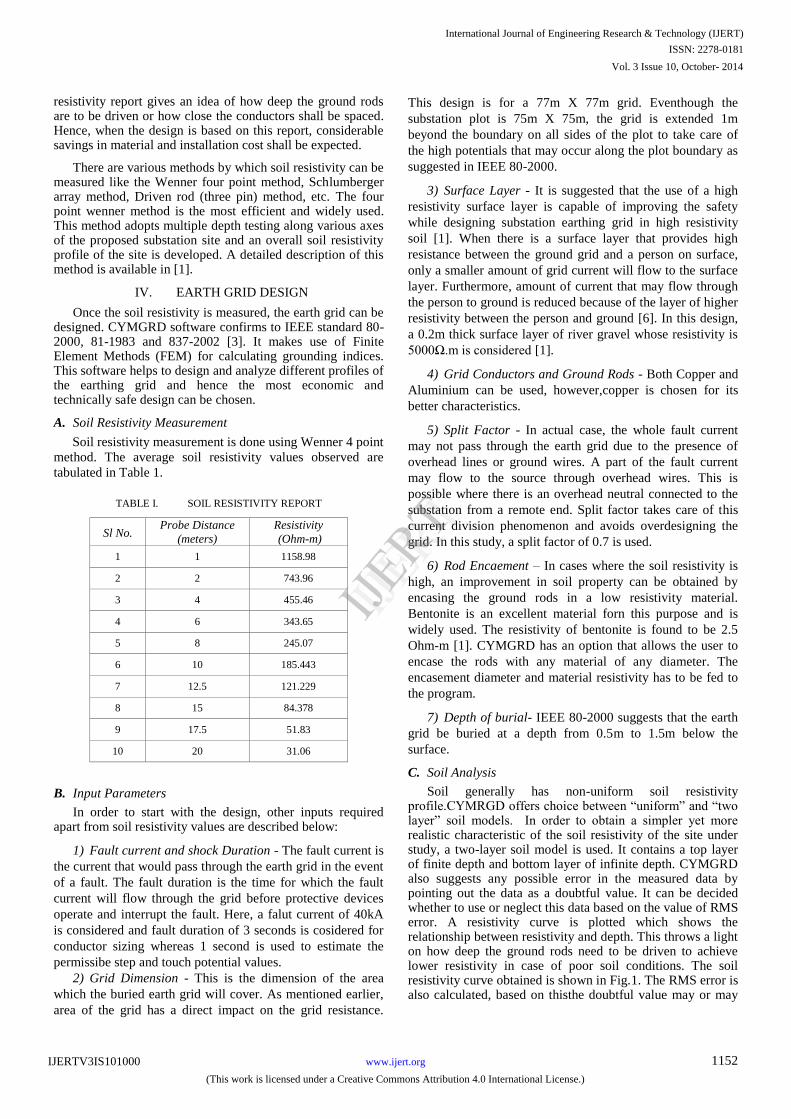
Soil generally has non-uniform soil resistivity profile.CYMRGD offers choice between “uniform” and “two layer” soil models. In order to obtain a simpler yet more realistic characteristic of the soil resistivity of the site under study, a two-layer soil model is used. It contains a top layer of finite depth and bottom layer of infinite depth. CYMGRD also suggests any possible error in the measured data by pointing out the data as a doubtful value. It can be decided whether to use or neglect this data based on the value of RMS error. A resistivity curve is plotted which shows the relationship between resistivity and depth. This throws a light on how deep the ground rods need to be driven to achieve lower resistivity in case of poor soil conditions. The soil resistivity curve obtained is shown in Fig.1. The RMS error is also calculated, based on thisthe doubtful value may or may
International Journal of Engineering Research & Technology (IJERT)
IJERT
IJERT
ISSN: 2278-0181
www.ijert.orgIJERTV3IS101000
(This work is licensed under a Creative Commons Attribution 4.0 International License.)
Vol. 3 Issue 10, October- 2014
1152
not be neglected. If to be neglected, the soil analysis shall be repeated after removing the doubtful value.
Fig 1 Soil Resistivity Curve
This curve shows that beyond a depth of 12 meters, the soil resistivity is very low. Hence it can be inferred that, if ground rods of depth 12m or more is employed, better design can be achieved. The soil analysis results are tabulated in Table II.
TABLE II. SOIL ANALYSIS REPORT
Sl No.
Calculated Results
Description Output
Value Unit
1 Upper Layer Thickness 5.17 Meters
2 Upper Layer Resistivity 653.46 Ohm-m
3 Lower Layer Resistivity 20.14 Ohm-m
4 Reduction Factor 0.84
5 Max. Permissible Touch Voltage 847.09 Volts
6 Max. Permissible Touch Voltage 3040.35 Volts
7 RMS Error 18.74 %
D. Conductor Sizing
The minimum required conductor size can be determined.
By enabling the required type of conductor, CYMGRD
calculates the minimum required conductor cross section.
Inthis project the minimum conductor size was found to be
269 mm2 and hence copper conductors of 300 mm
2 cross
section will be used. The conductor size can also be
calculated using the formulae given in Table 1 of IEEE 80-
2000 which is given below:
𝐴 = 1
𝑇𝐶𝐴𝑃∗10−4
𝑡𝑐∝𝑟𝜌𝑟 𝑙𝑛
𝐾0+𝑇𝑚
𝐾0+𝑇𝑎
(1)
where,
Ais the minimum cross sectional area of conductor
required.
TCAP is the thermal capacity factor of conductor
material,
tcis the time of current flow,
αr is thermal co-efficient of resistivity of the material
at reference temperature.
ρris the resistivity of the conductor,
K0 is the inverse of thermal coefficient of resistivity
at 0oC,
Tm is the maximum allowable temperature in 0C,
Ta is the ambient temperature in 0C.
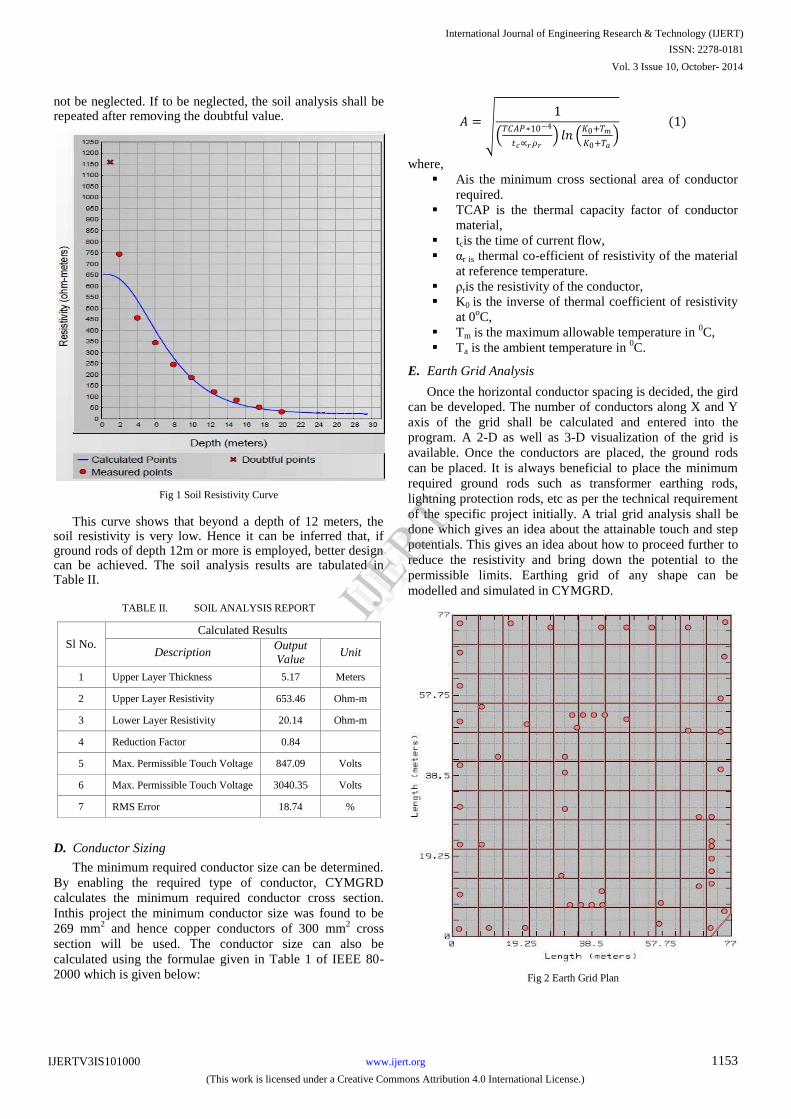
E. Earth Grid Analysis
Once the horizontal conductor spacing is decided, the gird
can be developed. The number of conductors along X and Y
axis of the grid shall be calculated and entered into the
program. A 2-D as well as 3-D visualization of the grid is
available. Once the conductors are placed, the ground rods
can be placed. It is always beneficial to place the minimum
required ground rods such as transformer earthing rods,
lightning protection rods, etc as per the technical requirement
of the specific project initially. A trial grid analysis shall be
done which gives an idea about the attainable touch and step
potentials. This gives an idea about how to proceed further to
reduce the resistivity and bring down the potential to the
permissible limits. Earthing grid of any shape can be
modelled and simulated in CYMGRD.
Fig 2 Earth Grid Plan
International Journal of Engineering Research & Technology (IJERT)
IJERT
IJERT
ISSN: 2278-0181
www.ijert.orgIJERTV3IS101000
(This work is licensed under a Creative Commons Attribution 4.0 International License.)
Vol. 3 Issue 10, October- 2014
1153
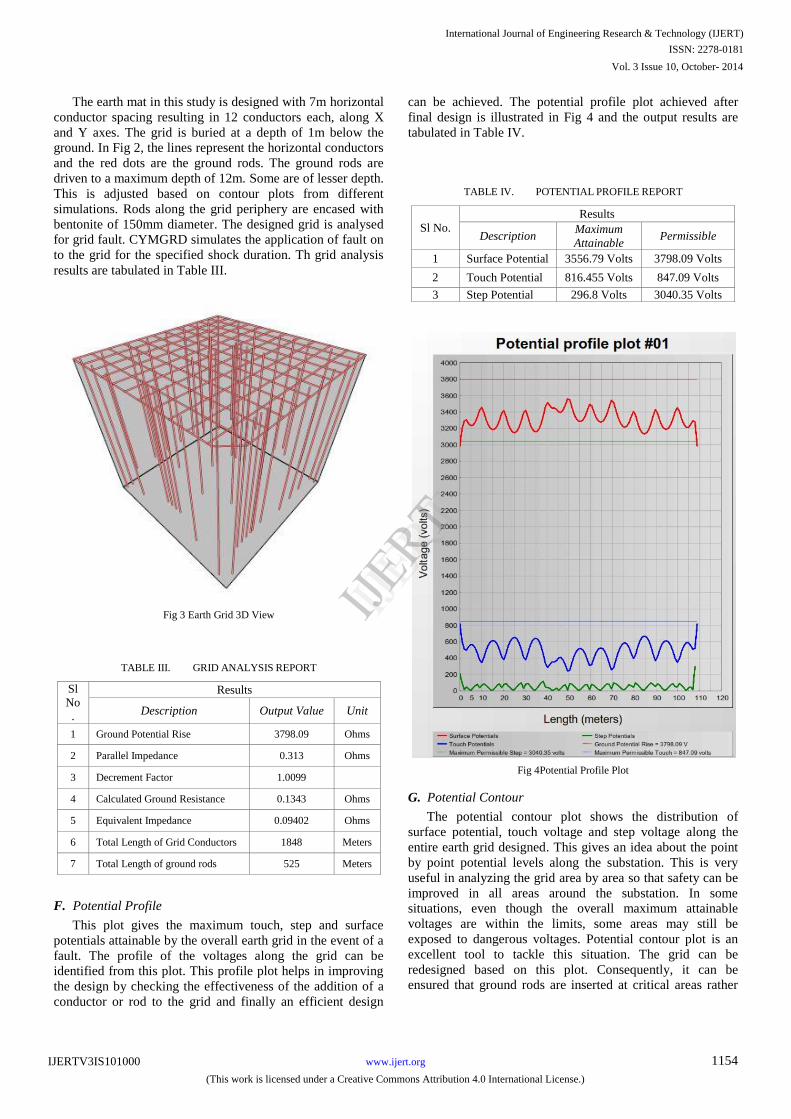
The earth mat in this study is designed with 7m horizontal
conductor spacing resulting in 12 conductors each, along X
and Y axes. The grid is buried at a depth of 1m below the
ground. In Fig 2, the lines represent the horizontal conductors
and the red dots are the ground rods. The ground rods are
driven to a maximum depth of 12m. Some are of lesser depth.
This is adjusted based on contour plots from different
simulations. Rods along the grid periphery are encased with
bentonite of 150mm diameter. The designed grid is analysed
for grid fault. CYMGRD simulates the application of fault on
to the grid for the specified shock duration. Th grid analysis
results are tabulated in Table III.
Fig 3 Earth Grid 3D View
TABLE III. GRID ANALYSIS REPORT
Sl
No
.
Results
Description Output Value Unit
1 Ground Potential Rise 3798.09 Ohms
2 Parallel Impedance 0.313 Ohms
3 Decrement Factor 1.0099
4 Calculated Ground Resistance 0.1343 Ohms
5 Equivalent Impedance 0.09402 Ohms
6 Total Length of Grid Conductors 1848 Meters
7 Total Length of ground rods 525 Meters
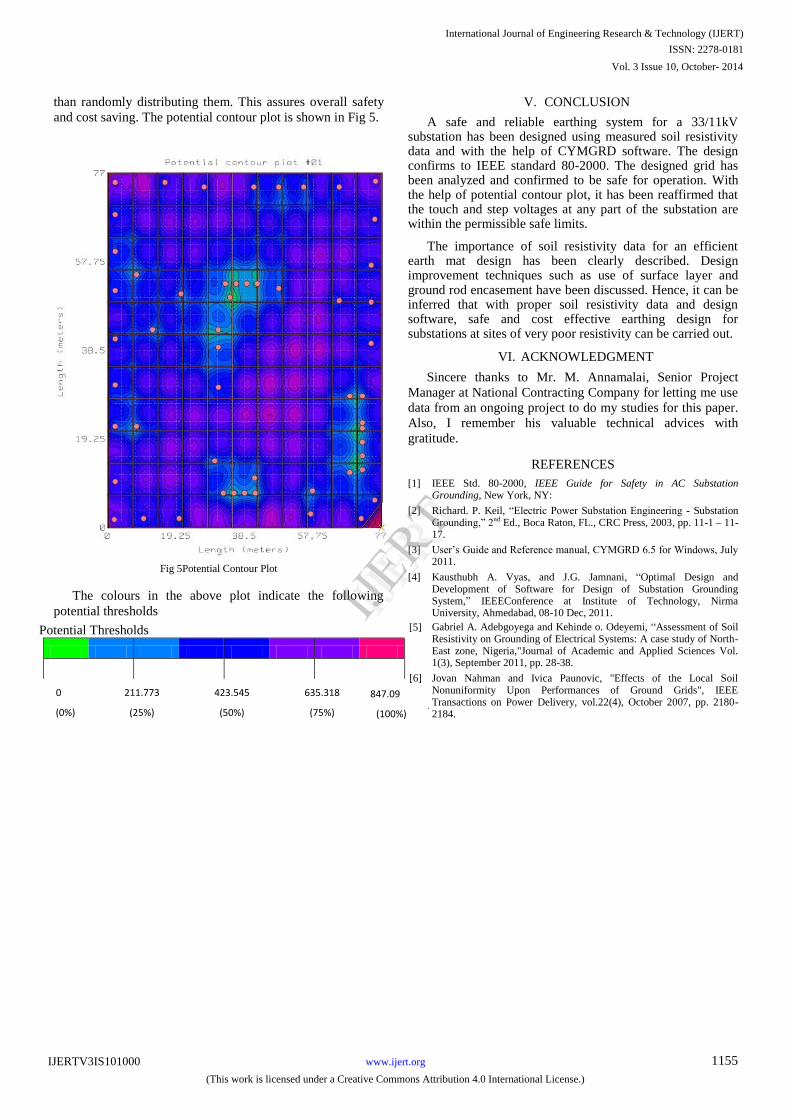
F. Potential Profile
This plot gives the maximum touch, step and surface
potentials attainable by the overall earth grid in the event of a
fault. The profile of the voltages along the grid can be
identified from this plot. This profile plot helps in improving
the design by checking the effectiveness of the addition of a
conductor or rod to the grid and finally an efficient design
can be achieved. The potential profile plot achieved after
final design is illustrated in Fig 4 and the output results are
tabulated in Table IV.
TABLE IV. POTENTIAL PROFILE REPORT
Sl No.
Results
Description Maximum
Attainable Permissible
1 Surface Potential 3556.79 Volts 3798.09 Volts
2 Touch Potential 816.455 Volts 847.09 Volts
3 Step Potential 296.8 Volts 3040.35 Volts
Fig 4Potential Profile Plot
G. Potential Contour
The potential contour plot shows the distribution of
surface potential, touch voltage and step voltage along the
entire earth grid designed. This gives an idea about the point
by point potential levels along the substation. This is very
useful in analyzing the grid area by area so that safety can be
improved in all areas around the substation. In some
situations, even though the overall maximum attainable
voltages are within the limits, some areas may still be
exposed to dangerous voltages. Potential contour plot is an
excellent tool to tackle this situation. The grid can be
redesigned based on this plot. Consequently, it can be
ensured that ground rods are inserted at critical areas rather
International Journal of Engineering Research & Technology (IJERT)
IJERT
IJERT
ISSN: 2278-0181
www.ijert.orgIJERTV3IS101000
(This work is licensed under a Creative Commons Attribution 4.0 International License.)
Vol. 3 Issue 10, October- 2014
1154
than randomly distributing them. This assures overall safety
and cost saving. The potential contour plot is shown in Fig 5.
Fig 5Potential Contour Plot
The colours in the above plot indicate the following
potential thresholds
Potential Thresholds
0
211.773
423.545
635.318
847.09
(0%)
(25%)
(50%)
(75%)
(100%)
V. CONCLUSION
A safe and reliable earthing system for a 33/11kV substation has been designed using measured soil resistivity data and with the help of CYMGRD software. The design confirms to IEEE standard 80-2000. The designed grid has been analyzed and confirmed to be safe for operation. With the help of potential contour plot, it has been reaffirmed that the touch and step voltages at any part of the substation are within the permissible safe limits.
The importance of soil resistivity data for an efficient earth mat design has been clearly described. Design improvement techniques such as use of surface layer and ground rod encasement have been discussed. Hence, it can be inferred that with proper soil resistivity data and design software, safe and cost effective earthing design for substations at sites of very poor resistivity can be carried out.
VI. ACKNOWLEDGMENT
Sincere thanks to Mr. M. Annamalai, Senior Project
Manager at National Contracting Company for letting me use
data from an ongoing project to do my studies for this paper.
Also, I remember his valuable technical advices with
gratitude.
REFERENCES
[1] IEEE Std. 80-2000, IEEE Guide for Safety in AC Substation Grounding, New York, NY:
[2] Richard. P. Keil, “Electric Power Substation Engineering - Substation Grounding,” 2nd Ed., Boca Raton, FL., CRC Press, 2003, pp. 11-1 – 11-17.
[3] User’s Guide and Reference manual, CYMGRD 6.5 for Windows, July 2011.
[4] Kausthubh A. Vyas, and J.G. Jamnani, “Optimal Design and Development of Software for Design of Substation Grounding System,” IEEEConference at Institute of Technology, Nirma University, Ahmedabad, 08-10 Dec, 2011.
[5]
Gabriel A. Adebgoyega and Kehinde o. Odeyemi, “Assessment of Soil Resistivity on Grounding of Electrical Systems: A case study of North-East zone, Nigeria,"Journal of Academic and Applied Sciences Vol. 1(3), September 2011, pp. 28-38.
[6]
Jovan Nahman and Ivica Paunovic, "Effects of the Local Soil Nonuniformity Upon Performances of Ground Grids", IEEE Transactions on Power Delivery, vol.22(4), October 2007, pp. 2180-2184.
International Journal of Engineering Research & Technology (IJERT)
IJERT
IJERT
ISSN: 2278-0181
www.ijert.orgIJERTV3IS101000
(This work is licensed under a Creative Commons Attribution 4.0 International License.)
Vol. 3 Issue 10, October- 2014
1155