Embed Size (px)
Citation preview

University of South FloridaScholar Commons
Graduate Theses and Dissertations Graduate School
January 2012
Design of Contact Line Friction MeasurementMachine ApparatusSeyed Kamran NajafiUniversity of South Florida, [email protected]
Follow this and additional works at: http://scholarcommons.usf.edu/etd
Part of the Art Practice Commons, and the Mechanical Engineering Commons
This Thesis is brought to you for free and open access by the Graduate School at Scholar Commons. It has been accepted for inclusion in GraduateTheses and Dissertations by an authorized administrator of Scholar Commons. For more information, please contact [email protected].
Scholar Commons CitationNajafi, Seyed Kamran, "Design of Contact Line Friction Measurement Machine Apparatus" (2012). Graduate Theses and Dissertations.http://scholarcommons.usf.edu/etd/4377
Design of Contact Line Friction
Measurement Machine Apparatus
by
Seyed Kamran Najafi
A thesis submitted in partial fulfillment of the requirements for the degree of
Master of Science in Mechanical Engineering Department of Mechanical Engineering
College of Engineering University of South Florida
Major Professor: Nathan Crane, Ph.D. Muhammad Rahman, Ph.D.
Rasim Guldiken, Ph.D.
Date of Approval: November 5, 2012
Keywords: Actuation force, Pinning force, Electrowetting, Modeling, Enclosure
Copyright © 2012, Seyed Kamran Najafi

DEDICATION
This is the story of a young engineer that has always loved to invent new toys
with all the junk that he found since he was 6 years old and his passion for being
an engineer was formed while he was watching his father work for an
engineering company. It was cool to see his father speak in other languages and
make connections with other people around the world, as well as getting to
know new and different cultures. When my father was taking me with him to
visit different projects of his where he was involved in making power plants, I
felt that this was amazing how they can make huge turbines and assemble them
all together to generate electricity, and by this they help humanity. This became
a dream for me to become an engineer; however, it wasn’t easy! I always
believed in my intelligence and this reason prevented me from working hard on
my goals, because I could figure out problems quickly but not very deeply. My
undergraduate in manufacturing engineering was pretty interesting and I learned
a lot that is very helpful for my career. I could say it was not a big success, but I
had a lot of fun and learned a lot about life which now I find them very helpful.
After that an immigration opportunity came up for me to travel to a new country.
I was thinking about my future and I had to sacrifice a lot of things I cared about
in order to have a better life. Immigration is not easy at all but with the support

of my family we were able to find our way. I had a hard time in settling down
and in getting to graduate school but once I started my master’s program my life
got better and better and now I am so happy. My parents are the best; I can’t
imagine any sacrifices that they didn’t make to help me and my sister to be
successful. I owe them for any happiness or success that I achieve in my life and
I am very grateful for them taking care of me and not leaving me alone, even in
the hardest time of my life, thus I dedicate this thesis to my mother, father and
sister. I also thank my good friends in Iran: Azadeh, Farzin, Shahram, Ashkan,
Flora and my dear grandmother that were giving me hope and making me happy
even from long distance. I appreciate Nick, Ben, Barbara, Ryan, Mehdi and
everyone who helped me with the writing of this thesis.

ACKNOWLEDGMENTS
I appreciate Dr. Nathan Crane for his support and for teaching me valuable
lessons and sharing his experiences with me on this project. I am happy for this
opportunity to work in a very educated group and meet absolutely intelligent
people on a very exciting project. Special thanks go to my committee members,
Dr. Rahman and Dr. Guldiken to helping me during my master’s program. I am
also grateful of the other project members, Timo and Qi for helping me during
this design project. Finally it was a pleasure to meet Jose, Sean and Sam in our
lab.
i
TABLE OF CONTENTS
LIST OF TABLES ............................................................................................ iii
LIST OF FIGURES .......................................................................................... iv V
ABSTRACT ..................................................................................................... vi
CHAPTER 1: INTRODUCTION .......................................................................... 1 1.1 Contacting Angle Definition .............................................................. 1 1.2 What is Electrowetting ..................................................................... 4 1.3 Measuring of Contact Angle Hysteresis ............................................. 4
1.3.1 Captive Needle ................................................................... 5 1.3.2 Tilted Plate ......................................................................... 6
1.4 Direct Pinning Force Measurement ................................................... 7
CHAPTER 2: DESIGN OF THE MEASUREMENT MACHINE ................................... 9 2.1 Functionality ................................................................................... 9
2.1.1 Actuation Force ................................................................ 10 2.1.2 Force Measurement .......................................................... 10 2.1.3 Motion Control ................................................................. 11 2.1.4 Adjustability ..................................................................... 11 2.1.5 Monitoring ....................................................................... 12
2.2 Design Concepts ........................................................................... 13 2.3 Linear Motion ................................................................................ 16 2.4 Controller ...................................................................................... 16 2.5 Measurement Force Sensor ............................................................ 17 2.6 Vibration Isolation ......................................................................... 19
2.6.1 Air Table .......................................................................... 19 2.6.2 Breadboard ...................................................................... 20
2.7 Hydrophobic Substrate .................................................................. 21 2.8 Vacuum Lifter System .................................................................... 22 2.9 Structure ...................................................................................... 24 2.10 Observation ................................................................................ 25 2.11 Conclusion .................................................................................. 26
CHAPTER 3: DESIGN OF CLEAN BOX .............................................................. 28
3.1 Concept ........................................................................................ 28 3.2 Transparent Box ............................................................................ 29
ii
3.3 Enclosure Structure ....................................................................... 30 3.4 Clean Room .................................................................................. 33
3.4.1 Positive Air Flow ............................................................... 34
CHAPTER 4: PROCESS ................................................................................... 37 4.1 Process of Measurement ................................................................ 37
4.1.1 Preparation ...................................................................... 37 4.1.2 Programming ................................................................... 39
4.2 Formula and Calculations ............................................................... 41 4.3 Test Configurations ....................................................................... 42
4.3.1 The Interfacial Tensions Between Liquid and Vapor ............ 42 4.3.2 Droplet ............................................................................ 43 4.3.3 Motion ............................................................................. 43
4.4 Programming ................................................................................ 44
CHAPTER 5: RESULTS ................................................................................... 45 5.1 Theoretical Measurement vs. Direct Measurement ........................... 45 5.2 Comparison................................................................................... 48
5.2.1 Force Measurement Mechanism ......................................... 49 5.2.2 Noise and Smooth Motion ................................................. 49 5.2.3 Accessibility...................................................................... 50 5.2.4 Transparent Box ............................................................... 51 5.2.5 Clean Room ..................................................................... 51 5.2.6 Flexibility ......................................................................... 51 5.2.7 Price and Transportation ................................................... 52
CHAPTER 6: CONCLUSION ............................................................................ 53
6.1 Conclusion .................................................................................... 53 6.2 Future Work .................................................................................. 53
REFERENCES ................................................................................................ 55
APPENDICES................................................................................................. 58
Appendix A Components Specifications ................................................. 59 Appendix B Customized Components Drawing ...................................... 64 Appendix C Copyright and Permissions ................................................ 67

iii
LIST OF TABLES Table 1: Component List of Measurement Machine. ........................................ 26 Table 2: The Box Components List ................................................................. 32 Table 3: Controlling Commands ..................................................................... 39 Table 4: Measuring the Advancing and Receding Contact Angle with
Captive Needle Method........................................................................ 46 Table 5: Measuring the Advancing and Receding Contact Angle with Tilting
Method ............................................................................................... 46 Table 6: Measuring the Contact Friction Force with Direct Method ................... 47 Table A: Stage Specifications ......................................................................... 59 Table B: Camera Specifications ...................................................................... 60 Table C: Rail Structure Specifications ............................................................. 61 Table D: Rail Carriers Specifications ............................................................... 61 Table E: MEMS Sensor Specifications.............................................................. 62 Table F: Breadboard Specifications ................................................................. 62 Table G: Manual Positioner Specifications ....................................................... 63
iv
LIST OF FIGURES Figure 1: A Droplet on the Hydrophilic Surface .................................................. 2 Figure 2: A Droplet on the Hydrophobic Surface ............................................... 2 Figure 3: Advancing Process with Captive Needle Method .................................. 5 Figure 4: Receding Process with Captive Needle Method ................................... 6 Figure 5: Contacting Angle by Tilting Method .................................................... 7 Figure 6: Function of Components ................................................................. 12 Figure 7: Stage Moves the Substrate under the Droplet and Causes Dragging
Force ................................................................................................. 13 Figure 8: Fiber Wire is Attached to the Top Glass Plate and Sensor .................. 14 Figure 9: Carriers and X, Y Manual Positioner ................................................. 14 Figure 10: Design Concept............................................................................. 15 Figure 11: MEMS Sensor (Right) - Tip of Sensor (Left) .................................... 18 Figure 12: Isolation Support System ............................................................... 20 Figure 13: Sandwich Breadboard.................................................................... 21 Figure 14: Picking up the Top Glass Plate with Fiber Chuck in a 3d Model......... 23 Figure 15: Vacuum Lifter ............................................................................... 24 Figure 16: Design Prototype .......................................................................... 27 Figure 17: Assembled Machine ....................................................................... 27 Figure 18: Front Box View Prototype (Left) - Right Box View Prototype (Right) . 30

v
Figure 19: Structure Prototype ....................................................................... 32 Figure 20: Assembled Box ............................................................................. 33 Figure 21: Fan (Left) Filter in The Customized Box (Right) ............................... 35 Figure 22: Isometric View of the Complete Machine Prototype ......................... 36 Figure 23: Programming the Stage ................................................................. 40 Figure 24: Programming Stage with Jogging Window ...................................... 40 Figure 25: Velocity-Time Diagram .................................................................. 42 Figure 26: Speed Stability at 10 µm/s – Sampling 50 Hz .................................. 44 Figure 27: Force (N) vs. Distance (mm) on Volume 41µl by Customized
Machine ............................................................................................. 48 Figure A: Focal Lens Length ........................................................................... 60 Figure B: Sensor Mount Block ........................................................................ 64 Figure C: Camera Mounting Bracket to Micro Positioner ................................... 64 Figure D: Under Stage Bracket ....................................................................... 65 Figure E: Vacuum Lifter Mount ....................................................................... 65 Figure F: Micro Positioner Mounting Bracket to Carrier .................................... 66 Figure G: Top Stage Bracket ......................................................................... 66 Figure H: Permission for Figure 12 Courtesy of Newport Co ............................. 67 Figure I: Permission for Figure 11 Courtesy of Nanoscience Instruments Co ..... 68 Figure J: Permission for Figure A Courtesy of Edmund Optics Co ...................... 69 Figure K: Direct Email for Figure 26 Courtesy of Newport Co ........................... 70

vi
ABSTRACT
The purpose of this project is to design and manufacture a high precision
machine to directly measure the surface force of fluids. Knowing how to move
droplets easier with less resistance can increase the potential of a wide range of
applications and improve the performance of things such as self-assembly
applications. This machine has the ability to measure forces of up to ±100 µN
with a MEMS based sensor. The motion system on this machine moves a
substrate underneath of a droplet for 100 mm and applies dragging force to the
sensor. It moves with a controlled speed with high accuracy and repeatability.
The machine also consists of three manual, three axis controls for positioning
key components for observation, control of the air vacuum lifter, and adjustment
of the sensor position. There is also an enclosure box that provides visibility to
operate and protects the inside environment from dirt during process and also by
applying positive air flow during setting up with open windows. The test
components were designed to provide maximum flexibility to adjust the setup. A
camera in the machine contributes to collect data during the test progress and
has the ability to capture pictures and record videos.

1
CHAPTER 1: INTRODUCTION
This chapter contains basic information about surface tension force and
traditional methods that are used to measure it. The potential use of this
measurement will be covered and how we improved the measurement to new
direct method and what are the advantages of this new method.
1.1 Contacting Angle Definition
Wetting a droplet on different surfaces has different effects. For instance when
the droplet rests on a horizontal glass plate without any coating, it spreads
widely on the surface. Yet the same droplet does not spread similarly on a brass
surface and looks more spherical [1]. A ratio of a droplet and the properties of
the surface material are effective in the shaping of the droplet. According to
Thomas Young’s theory, these phenomena result from interfacial tension
between gas and solid, liquid and solid, and liquid and gas. These interfacial
tensions affect the contacting angle between the droplet and the surface.[2], [3]
If a water droplet wets the surface, the surface is called hydrophilic, from Latin,
meaning “water loving”. The contact angle of static water with this surface will
be less than zero degrees. If the surface repels it, the contacting angle would be
more than 90° and this surface is called hydrophobic, which is Latin for “water

2
fearing.” This contact angle measurement depends on the properties of the
materials. Molecules of hydrophilic materials are polarized and tend to be
dissolved in water; conversely, this fact is reversed for hydrophobic molecules.
They are not polarized, so water can “slip” on a hydrophobic surface. [4]
Figure 1: A Droplet on the Hydrophilic Surface
Figure 2: A Droplet on the Hydrophobic Surface

3
Before water slips over a hydrophobic substrate, there is a resistant force that
needs to be overcome in order to start motion of the contact line. Thus the
resisting force can be defined as the hysteresis force. By measuring the
advancing and receding contact angle between droplet and surface, and applying
the Furmidge’s equation the hysteresis force can be calculated. [5]
( (1)
Young’s surface free energy formula is given by
(2)
where is the interfacial tension between solid and liquid, is the tension
between solid and vapor and is the tension between liquid and vapor.
Referring to Young’s equation = 0 and = W, which is the work done
by the adhesion of the fluid to the substrate. The pinning force can be defined by
following this equation by the method of tilting angle, noting that is the
normal angle on the surface, mg is the weight of droplet, L is the contacting
length between droplet and surface , are the interfacial tensions between
liquid and vapor and and are the receding and advancing angles. [6]
(3)

4
1.2 What is Electrowetting
Electrowetting is a phenomenon that describes the change in wetting on a
droplet due to an applied electric field. Applying potential difference to a droplet
and electrowetting substrate causes the contact angles to change. The
electrowetting substrate can be physically designed or positioned in a way that
the angles at the two ends of droplet are different. By rendering a net force to
the droplet in the direction where the droplet assumes smaller contact angle.
Electrowetting can be used on a variety of technologies such as microfluidic
devices for bio applications as well as on displays for different devices such as
smart phones and tablets with higher resolution and less power consumption
than conventional technologies. [1], [4], [7]
Electrowetting has a lot of usage in the medical field as well. Due to a change of
tension force on optical lenses, the focal distance is adjustable. Large use of this
technology in requires more research in this field to develop the knowledge of
this method in order to achieve more accurate results. One of the most
important matters in electrowetting is to find the resisting friction to motion of
the droplet.
1.3 Measuring of Contact Angle Hysteresis
In respect to formula 3, in order to find the hysteresis force that needs to move
the droplet, the advancing and receding angles need to be measured. Here we

5
talk about two different dynamic methods to measure these contacting angles.
For these dynamic methods either the shape of droplet would change, and
during the process the two contacting ends between the surface and the liquid
will be measured. It should be noted that with this method the contact angle will
be measured during a process of changing the volume of the droplet or its
shape. [8]
1.3.1 Captive Needle
In this method a programmable pump can be used to deposit and withdraw a
certain amount of fluid to form a droplet. The needle size with this method
should be very small in comparison with the diameter of the droplet. It is also
important to perform the process of adding and removing the water slowly to
minimize viscous effects. For this method, the droplet is added to a horizontal
hydrophobic substrate via a small needle. Water is then added to the substrate
at a constant rate. While the volume of the droplet changes, pictures are
recorded of its formation. There are some software such as IMAGEJ that are able
to measure contacting angle hysteresis. [8]
Figure 3: Advancing Process with Captive Needle Method
Liquid Flow Needle

6
By pumping water droplet on a substrate with constant deposit rate, advancing
contact angle can be defined at certain volume before end boundaries of droplet
move. For measuring the receding contact angle, reverse process as advancing
contact angle the water droplet will be drained and decrease the volume of
droplet. In conclusion, the adding process gives the advancing angle and
draining supplies the receding angle.[9] The difference between advancing and
receding angles gives the surface roughness. Unlike the advancing angle, it is
known that the receding angle is not appropriate to find surface energy. [8]
Figure 4: Receding Process with Captive Needle Method
1.3.2 Tilted Plate
This is the traditional method in which the substrate is tilted in relation to the
normal of the Earth’s gravitational field. The contacting angle hysteresis is
measured at the angle right before the droplet starts moving. Droplets with
bigger volume slide more easily with smaller tilt. The advancing angle is the rear
of the droplet and the receding angle would be the front toward the tilted
direction. The problem with this method is that when the substrate tilts the left
Liquid Flow
7
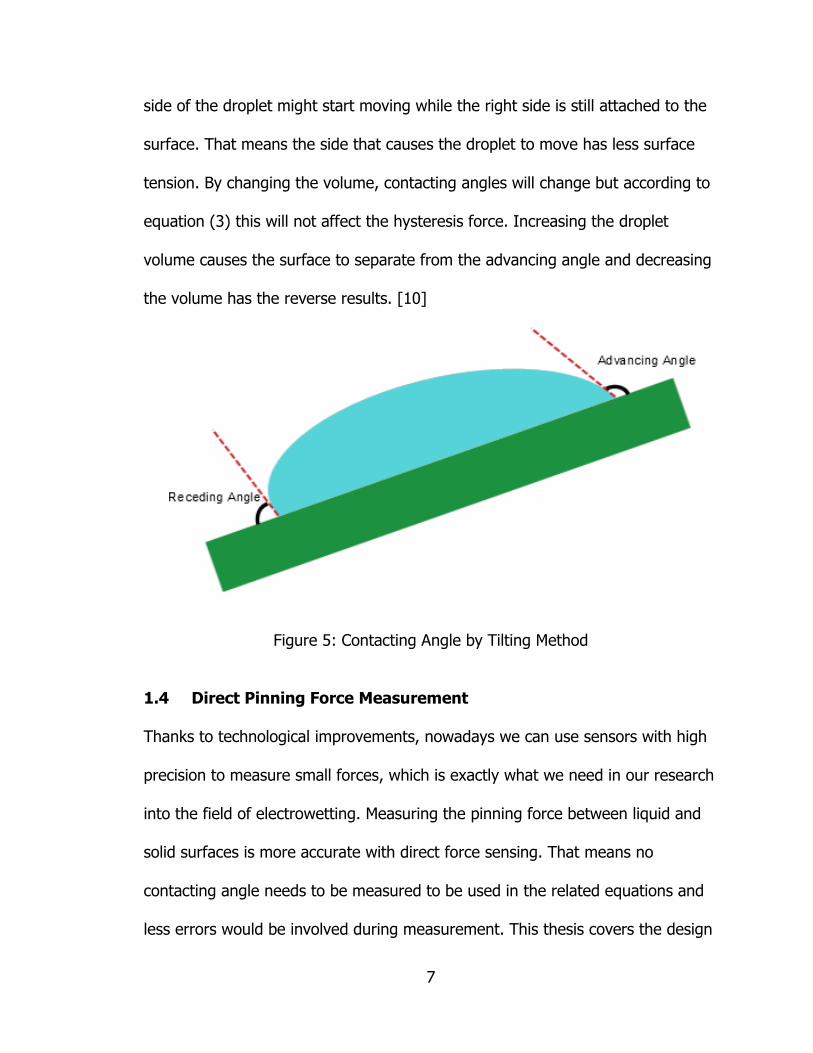
side of the droplet might start moving while the right side is still attached to the
surface. That means the side that causes the droplet to move has less surface
tension. By changing the volume, contacting angles will change but according to
equation (3) this will not affect the hysteresis force. Increasing the droplet
volume causes the surface to separate from the advancing angle and decreasing
the volume has the reverse results. [10]
Figure 5: Contacting Angle by Tilting Method
1.4 Direct Pinning Force Measurement
Thanks to technological improvements, nowadays we can use sensors with high
precision to measure small forces, which is exactly what we need in our research
into the field of electrowetting. Measuring the pinning force between liquid and
solid surfaces is more accurate with direct force sensing. That means no
contacting angle needs to be measured to be used in the related equations and
less errors would be involved during measurement. This thesis covers the design

8
of an X-axis (which induces motion to a substrate) and an adjustable setup for
the sensor. Another design task was in setting up the tests. According to initial
research data it was noted that a new generation of MEMS sensors are in the
market that are perfect for our research. The challenge in this project is to
minimize all the adverse effects due to the environment in order to capture the
most accurate data. This requires all the components to fit together precisely,
with a non-complicated design. It is also important to prevent direct handling of
the set up due to the high sensitivity of the sensors, which may be damaged
easily. This thesis also covers the process of fabrication as well as the test
results.

9
CHAPTER 2: DESIGN OF THE MEASUREMENT MACHINE
In this chapter you will discover required functions that are required for
designing of this machine and you will discover how the concept was figured.
Furthermore different components that are used in this machine will be reviewed
and how they are being used in the machine and what are their specifications.
Also we discuss more about how other ideas didn’t work and what the challenges
were during designing process.
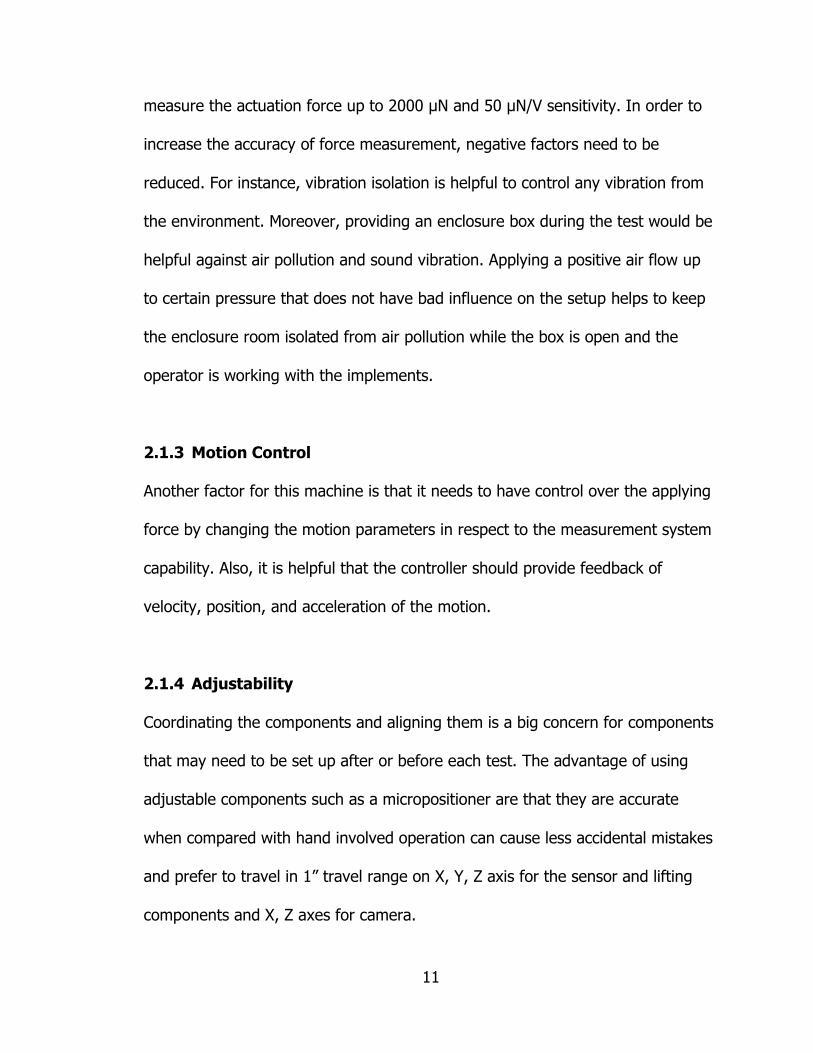
2.1 Functionality
The idea of designing this machine came through a need of a direct
measurement of contact life friction or actuation electrowetting force of a water
droplet over a hydrophobic substrate. For this purpose a list of functions are
required to accomplish the concept of design. These functions are:
1. Providing actuation force
2. Measuring the actuation force
3. Controlling and changing the actuation force
4. Set up and adjustability
5. Monitoring the test and observing the setup
10
2.1.1 Actuation Force
The machine should be able to supply either electrowetting actuation force or
contact line friction. A motion system can provide variety of the contact line
friction by applying different inputs. The velocity range on the motion system
should be between 10 µm/s and up to a certain point where the contact line
friction is not excessive on a linear direction for 100 mm. Also minimum
acceleration recommendation is around 40 µm/s² and maximum acceleration
should follow same principles as maximum velocity. Furthermore accuracy of this
motion is important criteria and it suggests to be around 6 µm and repeatability
could be important when there are continues test rounds with same
displacement range and it offers to be 4 µm in bi-direction. Due to this high
precision process, repeatability and accuracy are a big concern in the motion
system. Additionally, a strip substrate with patterns of oxide aluminum and a
layer of Cytop coating can be attached to conductors on each side of the
substrate. By applying differential voltage, actuation can be provided to move
the water droplet. [11]
2.1.2 Force Measurement
The machine also needs a precision force measurement system that is able to
record the actuation force directly. Following that concept a method is required
to transfer the applying force from the droplet to a sensor that is able measure
the tensile force in proper scale. The idea is to use a sensor that is able to
11
measure the actuation force up to 2000 µN and 50 µN/V sensitivity. In order to
increase the accuracy of force measurement, negative factors need to be
reduced. For instance, vibration isolation is helpful to control any vibration from
the environment. Moreover, providing an enclosure box during the test would be
helpful against air pollution and sound vibration. Applying a positive air flow up
to certain pressure that does not have bad influence on the setup helps to keep
the enclosure room isolated from air pollution while the box is open and the
operator is working with the implements.
2.1.3 Motion Control
Another factor for this machine is that it needs to have control over the applying
force by changing the motion parameters in respect to the measurement system
capability. Also, it is helpful that the controller should provide feedback of
velocity, position, and acceleration of the motion.
2.1.4 Adjustability
Coordinating the components and aligning them is a big concern for components
that may need to be set up after or before each test. The advantage of using
adjustable components such as a micropositioner are that they are accurate
when compared with hand involved operation can cause less accidental mistakes
and prefer to travel in 1” travel range on X, Y, Z axis for the sensor and lifting
components and X, Z axes for camera.
12
2.1.5 Monitoring
Having an observation system helps to monitor and study the droplet behavior
during the process. Also, this observation system helps with sensitive set up that
require more precision. For vertical field of view of 2.5 cm x 2.5 cm to the
substrate, a lens with compatible focal length is required to provide high level of
image quality with decent tolerance and simple installation.[12]
Figure 6: Function of Components

13
2.2 Design Concepts
The main purpose of designing this machine is to measure the pinning force and
actuation force between the droplet and the solid surface directly. The basic
concept is to apply a dragging force by a motion system to the droplet and thus
measure the contact line friction. However, this actuation can come from an
electrowetting process by applying a differential voltage to a resistive
hydrophobic substrate with aluminum oxide layers pattern along it.[11] A MEMS
sensor is able to measure tensile forces in micro scale. So the challenge is to
connect the droplet to the sensor on horizontal alignment. A typical square glass
plate rests on top of the droplet. The glass plate bonds to an end of a fiber wire
and the other end of the wire bonds to the tip of the sensor and can be
horizontally leveled by using a micro positioner. Due to higher surface tension
between the droplet and the glass plate, than between the droplet and the
substrate, these two objects will stay connected together while the droplet slides
on the substrate. This connection between the glass plate and the droplet causes
a drag force, thus the wire pulls the tip of the MEMS based sensor (Figure 7).
Figure 7: Stage Moves the Substrate under the Droplet and Causes Dragging Force

14
Figure 8: Fiber Wire is Attached to the Top Glass Plate and Sensor
Figure 9: Carriers and X, Y Manual Positioner

15
The vibration isolation system consists of an air table and a stiff breadboard to
reduce any vibration from the floor. The air table is adjustable by three pressure
valves that are located under its heavy and stiff table. Also, the Breadboard has
many thread holes on it that components can be installed on.
The visibility of the process and providing a clean room is another subject.
Following that concern, a transparent box was designed to protect the test
components from any dirt and environment noise, and a positive air flow was
used to prevent the outer air from entering into the box while the operator keeps
the windows open. A camera and lens also contribute to provide an observation
system (Figure 10).
Figure 10: Design Concept

16
2.3 Linear Motion
A linear stage provides a motion that moves the attached hydrophobic substrate.
In consequence of the static friction between the surface and the droplet, a
horizontal load is applied to the droplet. This load is the droplet force and can be
changed by changing the motion setting, or applied voltages in the case of
electrowetting. The motion parameters are velocity, acceleration, deceleration,
and traveling range. The stage is aligned with the sensor on X-axis. The linear
stage in this design is a Newport product (UTS100CC) and has a traveling range
of 100 mm. Its motion is produced by a ball bearing and some lead screw
mechanisms. The DC motor in this stage arranges for very smooth travel with
less noise, high acceleration, high velocity (of up to 40 mm/s) and a high
resolution of 2000 counts per revolutions, which allows for highly accurate
motion control. Another interesting note about this stage is the anti-backlash
nuts that are used to prevent the stage from any errors. Full description of the
stage is mentioned in Appendix A. [13] Respectively, because of the high
sensitivity of the process, a stage with this level of accuracy is needed. By
moving the stage the hydrophobic substrate which is attached to the stage
moves.
2.4 Controller
In order for the stage to be able to move, an actuation force is required. In this
application, it is important to have motion with different parameters. These

17
parameters include travel range, acceleration, deceleration and velocity. These
parameters are determined by a controller. Esp301 series 3 axis motion is the
controller model from Newport Co that we used. Programming of this controller
is based on a language that comes as software with 100 commands. The most
useful commands are acceleration (AC), deceleration (AG), absolute position
(PA), relative position (PR) and velocity (VA). All the commands will be typed on
the console and each line only accepts one command. Usually position command
is the last order that should be input into the console and this causes the stage
to start moving. The controller connects to a computer by a USB cable and has
the ability to provide feedback of time vs. position as well as receiving
commands directly from LABVIEW, so that after the data was collected we can
find out the force value at each point of stage travel. For the safety the stage will
stop traveling at the end point.
2.5 Measurement Force Sensor
The most important component in this machine is the measuring sensor. MEMS
based sensors are capable of measuring small forces of up to 10000 µN. MEMS is
an acronym for Micro Electro Mechanical Systems, which represents any device
that is made of parts that can be as small as 100 micrometers. [14] The MEMS
main body structure is mounted on polysilicon springs and enables the substrate
to move in two directions. Around the main body there are many branches that
are known as fingers. There are two fixed plates on the sides of each branch that

18
create a differential capacitor when the finger is moving back and forth. Labview
is a software program that enables us to measure the differential capacitance of
this process and converts it to force units. [15] The sensor that we used is one
of Nanoscience Instrumental’s Co products (FT-s100) with a measuring range of
±100 µN, a sensitivity of 50 µN/V (5 mg/V) and a resolution of 0.005 µN at
10Hz, which is a very high precision measuring device. The main issue of
working with this device is its high physical sensitivity. The dimensions of the
sensor tip is 3,000 µm x 300 µm x 50 µm and this means the tip can break easily
with any transverse force that causes bending. This makes working with this tip
very hard and handling should be avoided once the wire is attached to the tip
and the top glass. Thus a precise lifter is needed to elevate the glass plate
vertically after each test so that it can be prepared for the next round.
Figure 11: MEMS Sensor (Right) - Tip of Sensor (Left) (Picture is Taken from Nanoscience Co website, Used with Permission.)
19
2.6 Vibration Isolation
One important factor that can affect the results of the test is vibration. Vibrations
can source from the floor, from other environmental noise, or from circulating air
flow. In order to neutralize any physical vibrations, some techniques are applied
which help to reduce any interference with the results.
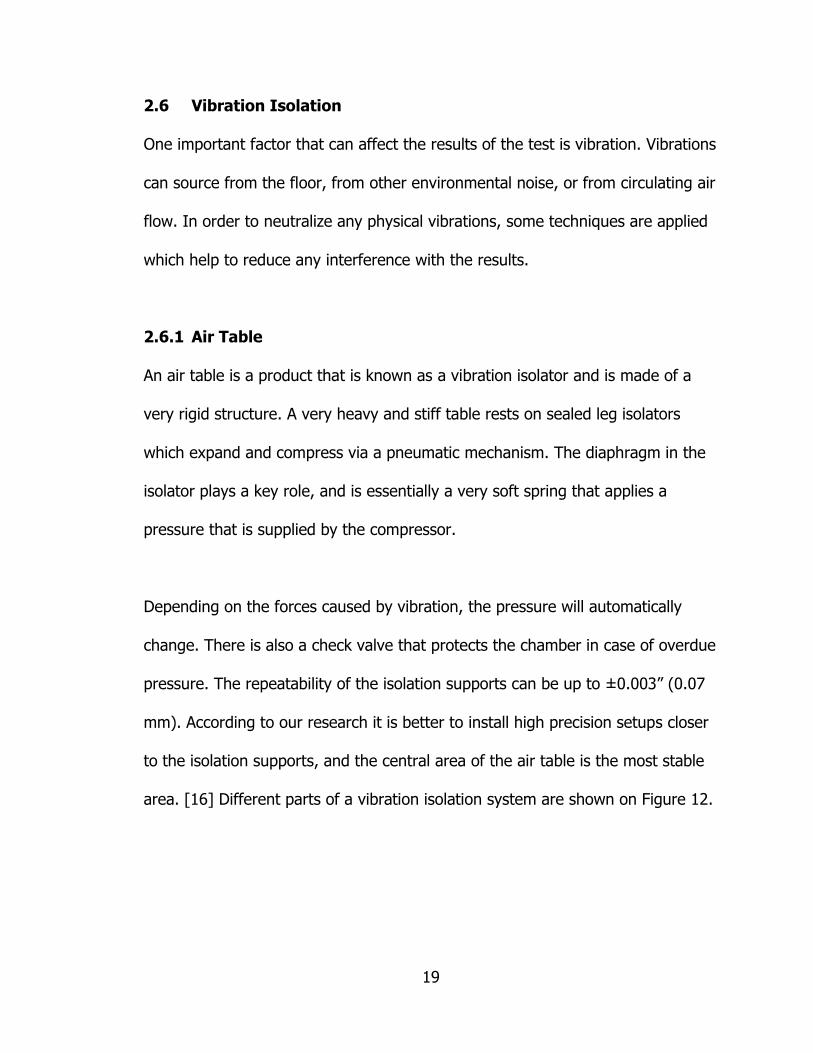
2.6.1 Air Table
An air table is a product that is known as a vibration isolator and is made of a
very rigid structure. A very heavy and stiff table rests on sealed leg isolators
which expand and compress via a pneumatic mechanism. The diaphragm in the
isolator plays a key role, and is essentially a very soft spring that applies a
pressure that is supplied by the compressor.
Depending on the forces caused by vibration, the pressure will automatically
change. There is also a check valve that protects the chamber in case of overdue
pressure. The repeatability of the isolation supports can be up to ±0.003” (0.07
mm). According to our research it is better to install high precision setups closer
to the isolation supports, and the central area of the air table is the most stable
area. [16] Different parts of a vibration isolation system are shown on Figure 12.
20
Figure 12: Isolation Support System (Used with Permission from Newport Co.)
2.6.2 Breadboard
The breadboard is one of the most important parts of each design because all of
the components and setup are installed on it in order to be a referenced for data
acquisition. Therefore it has to be very stable, and the material and structure
must be very stiff. This is not only to prevent deformation due to its large

21
weight, but also is due to the ratio of its strength to its weight which is a
concern.[17] Depending upon the application there are several different models
that can be used. The breadboard that we used for our application is known as a
sandwich. Two stiff stainless steel panels placed on each side of a honeycombed
structure are tabbed with 1/4-20 thread and a 1” grid distance pattern to help
the other components mount on the panels.
Figure 13: Sandwich Breadboard
2.7 Hydrophobic Substrate
A hydrophobic substrate is a surface with material properties that repels water
and in this project it is a simple glass plate with a special coating. The coating
process depends on the desired layer thickness and is different in terms of
spinning speed, baking temperature and time. Coating starts by injecting CYTOP
on ¾ of the glass surface very slowly (30 µl/hr). Then the glass spins for 500
RPM for 5 seconds and after that increases to 2000 RPM for 20 seconds to

22
spread CYTOP evenly on the surface. Throughout the next 5 seconds the
spinning will decrease until it stops and it is ready for pre bake. The coating will
then rest on a hot plate for the next 90 seconds at a temperature of 100°. Then
the coated glass is placed in a 200° oven for 1 hour. [18] After the process of
coating the hydrophobic glass attaches on the Stage. Some simple glass plates
were used underneath the coated substrate to align with the tip of the sensor.
2.8 Vacuum Lifter System
Each time the stage moves the substrate under the droplet causes the top glass
plate to drag the tip of sensor, but the sensitivity of the sensor is high and so the
tip can break very easily. This type of sensor is designed to drag the tip but not
to put pressure on it. Also, the fiber wire is bonded to the tip and the top glass,
and this dragging force can occur by moving the substrate on one direction. It
should be noted that substrate cannot move on reverse direction due to the
pushing force that it causes. That means after each test round, the top glass
plate should be position fixed and return the substrate to initial position. This
creates a challenge that how to pick up a very thin glass plate without causing
damage to the sensor and the other components. One concept was to vertically
bond a very thin tube on the glass plate and grab it with a fiber-chuck that is
mounted on a three axis micro positioner. There were two problems with this
idea that prevented it from being practical: firstly, adding a tube on the glass
plate would increase weight of the top glass plate which is supposed to be

23
negligible. Secondly, by girthing the fiber, a torque force is applied to the glass
plate and causes the plate to rotate and again this could result in breaking the
tip of the sensor. The next idea was to use a negative air flow that mounts on
the same manual positioner in order to adjust it slowly and coordinate it as close
as possible to the glass plate to prevent any shock to the sensor. The vacuum
system consists of 2 valves; one use for pressure control and the other one use
for turning the air flow on and off, as well as a 5 mm hose, a 2 mm needle and a
0.08” cup.
Figure 14: Picking up the Top Glass Plate with Fiber Chuck in a 3d Model
The advantages of vacuum lifting are that no more physical lifting process is
involved and moreover there is no need to coordinate the needle at the exact
position. It should be noted that high pressure might cause the glass to stick to
the cup and thus would not release when cutting the pressure. The micro
positioner that is used to mount the needle is a Newport product and the 1” hole
on it helps to place the needle in it and fix it by a set screw.
Top Glass
Plate
Fiber Chuck

24
Figure 15: Vacuum Lifter
2.9 Structure
The Breadboard is referenced to the other components. As a result the main
components such as the stage and the structure are installed on it. The structure
consists of two base plates that connect four side rails to the breadboard, three
rails with 0.5 m length, two right angle joint carriers with through holes, two
right angle joint carriers with taped holes and two right angle join carriers with
captive fastener screws that help to mount and remove the carriers from the rails
quickly. There are also some customized parts that are required to connect
different components such as the camera and the micro positioner to the
carriers. The four reinforcement ribs on the rail are the features that guide the
angle joints of the carriers. The extrusion manufacturing process provides easy
traveling for the carriers on a very smooth surface with less friction. All the
structure parts are made of aluminum which makes them light weight. Due to

25
the few adjustments that apply to the height of the structure, the right angles
joint carriers have the option to be positioned on the rail by two set screws.
2.10 Observation
It is important to monitor the process visually. Because of this, pictures and
videos can be helpful to document the study. In addition, depending on the
volume of the droplet, the camera helps to align the top glass plate to the tip of
the sensor. The camera can mount on a rail carrier and travel across the testing
area while recording picture/video vertically or it can be placed on a bracket on
the breadboard and have a side vision. The camera is mounted on the same
micro positioner as the vacuum lifter for small adjustment. There is a concern for
the focal length of the camera, as it has to be far enough to provide the best
picture quality. The camera (EO-0413M 1/3") is an Edmundoptic Co product with
a resolution of 752 x 480. There is a ¼-20 thread on this camera to use for
mounting. The minimum focal length of a lens that can have field of view of
1”x1” is 25 cm and respectively, the distance between the droplet and the
camera should be more than the focal length at least. Depending on the needs,
different lenses can be used. Focal length lenses can optimize the vision
performance while having high durability and the compact design was the
criterion used to be chosen in our application.

26
2.11 Conclusion
After understanding the functionality of the test and the results we are looking
for, the concept of design was figured. First, the basic design was configured by
SOLIDWORKS to simulate the design and model the required principals of the
test. Then the design was developed by applying some techniques to reduce
interference on the data, such as the vibration isolation system. Some equipment
was added to the machine in order to set the initial preparation of the test after
each round. A camera was added to the machine to record desired videos and
pictures. After the prototype was completed and all the issues and problems
solved, all the devices were purchased and all the required customized parts
were fabricated and then assembled together. In picture 13 and 14 different
parts of the machine are addressed in the final design.
Table 1: Component List of Measurement Machine
Item Number Component Item Number Component
1 Camera 6 Vacuum lifter
2 Micro positioner 7 Hydrophobic
Substrate
3 Structure 8 Stage
4 Right angle
carrier 9 Breadboard
5 MEMS Sensor 10 Air table

27
Figure 16: Design Prototype
Figure 17: Assembled Machine

28
CHAPTER 3: DESIGN OF CLEAN BOX
Through this set of contents the importance use of an enclosure box will be
discussed and how design concept was developed. Then in details each
component of the box will be argued over the usage and challenges of being
chosen. This section of the project was assisted by Timo Marschke.
3.1 Concept
The idea of using a box came once we figured out how much change on the data
can occur from different environments while running the test. Due to the small
scale of our force measurements anything small can make the results incorrect.
These can be caused by air flow, dirt, noise vibration or any accidental touch.
Following that concept, use of environment isolation was necessary. A box with
enough stiffness to minimize noise transmission and air flow was needed for this
design.
On the other hand this box is supposed to be transparent enough to enable us to
see the test operation. To be able to see the operation is important not only
because of the research study but in case something goes bad. The challenge
was to make the box isolated from the air in the environment in order to keep

29
the testing area clean. Also, during set up there needed to be a way to prevent
the outer air from getting in. Thus an air flow system was considered that starts
working when the access areas are open. The wall sheets of the box are
attached to a structure that stands on the floor to give more stiffness to the box
so that it can withstand any external force on it.
3.2 Transparent Box
The concept of the box was based on a clean experimental space to be big
enough to contain all the components above the air table. Additionally, the
transparency of the box is important, as it is crucial to have enough light inside
the box to observe the process. Due to the fact that the test process needs to be
repeatable and constantly rearranged, having easy access to the test setup is an
important concern. Along these lines the material we used for the wall sheets are
acrylics that are transparent. Using an acrylic sheet allows us to do modifications
on it without causing the sheet to break. Two sheets with dimensions of 33.7” x
32” x 0.5” are located on the front and back sides of the box, along with a 13” x
8” x 0.25” window on the front side, in order for the operator to have easy
access to the setup. Side wall dimensions are 37.8” x 32” x 0.5” with another
window on the right sheet with the same size as the other window. The top side
of the box is designed specifically for air flow entrance. It is made out of wood
and consists of a simple sheet with an 11” x 11” square hole on it. There is
another box on top of the wood sheet which is designed for the air filter. This

30
box is also made out of wood with dimensions of 16” x 16” x 4” with a thickness
of 0.5” that is secured by two clips on the sides.
There are some holes with diameters of 6.8 cm set around each wall sheet at
distances of 5” in order to attach the wall sheet to a structure and enhance the
stiffness of the wall sheets.
Figure 18: Front Box View Prototype (Left) - Right Box View Prototype (Right)
3.3 Enclosure Structure
The purpose of this structure is to support the wall sheets and offers a separated
support from the platform to the vibration isolation system. Hence any external
disturbance will not affect the measurement process. It is important for the
transparent box to be stiff enough to withstand any internal/external forces
because the box is actually the protector of our test components and test results.
In order to increase the stiffness of the box, the wall sheets are attached at
31
several points to a metal structure. The structure should be stiff enough to
support the acrylic sheets. This structure is shaped in T-slots and manufactured
by extrusion method. They are like a block with constant slots alongside them on
each four sides. These slots help to place a nut into them, slide it into position,
and attach a bolt to it. With this light weight precision product you can create the
structure, safe guards and a workstation without being worried about stresses
and bulking. Extrusions of these structures are done to convert raw material to
finished product. The advantages of using such a product are its light weight,
stiffness, anodized finish, it does not require welding or painting, it is corrosion
resistant and working with it is fast and easy. In order to enhance the structure,
a 12 mm corner bracket is used on each internal corner. As mentioned earlier,
there are some holes on the left, right and top sections of the acrylic sheets that
are used to attach the structure to them. There are four T-slots with dimensions
of 1” x 1” x 55.5” that are the legs of the structure. Also there are shorter
lengths T-slots with the size of 1” x 1” on the section and with lengths of 32.7”,
30.6” and 35.72” that are located between the standing legs. There is also a
22.5 mm gap between the box and measuring machine structure to prevent
vibration transferring from the box to the measurement machine. Assembling all
the box components were done by Timo Marschke and Qi NI.

32
Table 2: The Box Components List
Item Number Component Item Number Component
1 Filter Vent 6 Side T-slot
2 Inside Corner
Bracket 7 Standing T-slot
3 Front Window 8 Up Front T-slot
4 Side Window 9 Cable Vent
5 Down Front T-slot 10 Acrylic Sheet
Figure 19: Structure Prototype

33
Figure 20: Assembled Box
3.4 Clean Room
Any small interference on the test process might end up with the wrong results.
As mentioned earlier in previous chapters, the isolation box and vibration
isolation system are used to increase the accuracy of our measurement. There is
small gap between wall sheets and air table edges. However, the internal space
of the box keeps the experiment components clean. Another difficulty is in how
to keep the internal box isolated from pollution and dirt while the windows are
open and the operator is arranging the setup.

34
3.4.1 Positive Air Flow
After running each test and collecting data, it is necessary to pick up the top
glass plate and return the stage to its original position. To prevent the
environment air and dirt from entering the box, a positive air flow is needed
which is filtered and clean. The fan in our application is “Soler & Palau In-Line
Fan TD-250” with a duct size of 10”, can work in 2 speeds, and can induce air
flow between 475 to 754 CFM. It should be noted that filters that are applied in
the system cause to drop the pressure. (Research for the fan and filter was done
by Timo Marschke). That means with neglecting the resistance along the duct
and through the filters, the air speed from one window would be 1.91 m/s at its
highest speed. This speed is perfect for our application because higher air flow
might move the top glass and end up breaking the tip of the sensor. On the
other hand, less air flow would let external air and dirt get into the box. An air
filter with dimensions of 12.5” x 2.5” x 13” is inserted into the wood box and
used to clean the fan’s air flow. The other advantage of using an air filter is that
air flow does not pass through in certain sections and the filter spreads the flow
equally through the square hole. By attaching some Confined-Space Conical
Compression Springs to the filter box we can then clamp up the filter. The first
idea we used for starting the fan working was based on an automatic
mechanism. There is a switch that is called “push to break” that is used to keep
the electric circuit disconnected as long as the button is pressed. Once the
button releases the circuit will be connected and the fan starts working. By

35
mounting this switch on the wall sheet, the fan starts running when the window
opens. The problem with this idea is that it may take awhile for an air current to
start inside the box. As a result, a manual switch was used in order to turn the
fan on a few seconds before opening the window. Also, a one-way valve can be
added on one of the wall sheets to release any extra air pressure in case the
operator forgets to shut the fan off. The other components that are involved with
positive air flow are a 10” duct and clamps to secure the duct on the wood box
and the fan. A 2” hole on the left side of the box lets the cables enter and
connect to internal components.
Figure 21: Fan (Left) Filter in the Customized Box (Right)

36
Figure 22: Isometric View of the Complete Machine Prototype

37
CHAPTER 4: PROCESS
There are certain concerns to prepare the setups for each test process and
configure it for next round. First the process will be explained and what steps are
required to prepare the test process. Then it continues how data is being
collected and how the contact line friction force can be changed by defining the
motion parameters. Finally the parameters that are effective in the test process
will be discussed.
4.1 Process of Measurement
In order to measure the actuation force of any fluid droplet, there are
instructions that need to be followed. These instructions apply to the substrate,
the bonding wire to the sensor, the coordination of the sensor and the position
of the droplet on the substrate, the running of the stage with different
acceleration and velocity, and at the end preparing the setup for the next testing
round.
4.1.1 Preparation
Depending on the application, different components with a variety of material
properties can be used on the test. In initial experiments we used a hydrophobic
38
substrate with CYTOP coating on a glass plate. The substrate must be secured
on top of the stage in order to move with the stage and to let the droplet slip on
it. Due to the high sensitivity of the sensor, the fiber wire can only be attached
to the tip by bonding. It also should be noted that the top glass plate should be
level with the tip of sensor due the ability of the sensor to measure only tensile
force. Applying any transverse or bending forces damages the sensor. Thus, the
wire bonds to the top of the tip and top center of the 9 x 9 mm glass plate.
The next step would be to add the droplet. By using a pipette tip, the fluid is
deposited on the substrate in any amount of volume in micro scale. The glass
plate should be positioned as close as possible to the droplet with the micro
positioner that the vacuum needle is mounted on. Then by disconnecting the
negative air flow the glass plate would be released and would rest on the
droplet. It should be noted that during set up positive air flow inside the
transparent box is active and after closing the windows the fan should be shut
down. At this point the test is ready to run and collect data. The controller has
software that receives orders and can be programmed using commands. There is
also a tab for jogging the stage which is useful for quick traveling regardless of
the range and accuracy or in case the stage reaches the encoder switch point
when this option needs to be used.

39
4.1.2 Programming
Every time before running the test the motion setting should be checked. Table
commands are used to set up the stage configuration and start a movement.
Figure 23 shows the way that is recommended to enter the commands in the
terminal window. The “PA” command means the stage travels in respect to a
coordinate point which is defined by the “GG” command. On the other hand, the
“PR” command sends an order to the stage to travel in respect to its current
position. It should be noted that before each command the number of the axis
should be addressed. However, it is suggested to program the stage and send
the commands by Labview, which is faster, easier, and avoids having accidental
mistakes in typing commands. Also, it enables the position of the stage to be
recorded and synchronized along with its velocity and measuring forces.
Table 3: Controlling Commands
Command Function
AG Deceleration
AC Acceleration
VA Velocity
PA Travel Range Based on Absolute Position
PR Travel Range Based on Related Position

40
Figure 23: Programming the Stage
Figure 24: Programming Stage with Jogging Window

41
The other way of moving the stage is by using the jogging window, which is a
quicker method. By this option, the stage can travel along the linear axis as a
free run just by holding the mouse click.
4.2 Formula and Calculations
The following physics equations are related to the subject of kinematic motion
and can be used to calculate the position, velocity, time, acceleration,
deceleration and displacement of the process. The principals of the following
equations contribute to figure 25.
Total Travel Distance (5)
Constant Velocity Travel Time (6)
Maximum Speed
(7)
Deceleration/Acceleration Time
(8)
Constant Velocity Travel Time (9)
Deceleration/Acceleration Travel Distance
(10)
Total Travel Time
(11)

42
Figure 25: Velocity-Time Diagram
4.3 Test Configurations
In this set of experiments there are some configurations that are able to be
changed.
4.3.1 The Interfacial Tensions Between Liquid and Vapor
The Substrate material properties define this coefficient value and according to
The Young–Dupré equation (Thomas Young 1805, Lewis Dupré 1855) if the
spreading parameter of a droplet is positive, fluid is wetting. On the other hand
when this parameter is negative, fluid has little wetting. By having different
43
coating on the substrate, the interfacial tensions between liquid and vapor
changes ( ) and affects the slipping condition of the droplet.
(12)
4.3.2 Droplet
The actuation force of a variety of types of droplets with different viscosity can
be measured under optional volume control. However, very low volume under
influence of shear force causes the glass plate to be tilted. Large volume
encounter same problem and it might result from large torque that drives from
the larger distance that top glass plate has due the higher volume of droplet. If
this happens while it is close to the substrate and there is any interaction
between them, this can result in scratching on the substrate coating. Moreover,
having too much volume in the droplet might cause it to not stick to the top
glass plate while the substrate is moving. The possibility of this kind of deflection
increases if the stage moves with high acceleration.
4.3.3 Motion
The Stage can move with a minimum velocity of 10 µm/s with almost 6%
stability. The Graph in figure 26 is provided by Newport Co following our request
to estimate the lowest speed that the stage can move. Usually the minimum
acceleration is around 4X the speed, which means the slowest speed increment

44
is around 40 . Following that discussion the stage can move between 10
µm/s and 40 mm/s on a linear axis.
Figure 26: Speed Stability at 10 µm/s – Sampling 50 Hz (Used with Permission from Newport Co.)
4.4 Programming
Programming the stages with Hysitron’s machine is harder and more time
consuming due to software that is provided that has a lot of problems as it locks
up if the stage passes the limited range and needs some manual adjustment to
fix it. Moreover, the machine is made mainly to measure the hardness of the thin
films and the sensor tip is designed to have a vertical movement direction.
Although our machine is using the same stage it is also able to be synchronized
to LABVIEW software.
45
CHAPTER 5: RESULTS
Chapter 5 helps to compare traditional method of measuring the contact line
hysteresis with the direct measuring of contact line friction. Then a similar
commercial machine will be compared to manufactured design as aspects of
accuracy, price, user friendly and data results.
5.1 Theoretical Measurement vs. Direct Measurement
In chapter one different methods of measuring the water droplet contact angle
were mentioned. Contact angles can be used to calculate the hysteresis force.
However, with a new method we can directly measure pinning force and study
the differences or similarities between them. Table 4 shows the contacting
angles that were measured with captive needle. The depositing rate of the water
droplet is 5 µl/s, and after the first deposit, the needle should be very close to
the substrate and located in the center of the droplet. The process of adding
more droplets continues till the droplet reaches its maximum contacting angle
which is its advancing angle. That means the droplet shape will change suddenly.
Reversing this process defines the receding angle before the droplet moves. [19]
The contact angles that were measured by tilting are mentioned in table 5. In
this method certain volume of the droplet adds on the hydrophobic substrate and

46
by using a manual fixture, different angles applies to the substrate. A camera
records the ending angles before the droplet moves. As mentioned in section
1.3.2 advancing and receding angles were defined. The contact angles can be
plugged into formula (3) and hysteresis force can be calculated. The water/air
surface tension coefficient is considered as 72 mN/m. [19]
Table 4: Measuring the Advancing and Receding Contact Angle with Captive Needle Method (Table from [19])
Advancing (Degs) Receding (Degs)
115 112.9 98.6 99.5
115 116.4 101.9 101.4
114.6 114.8 98.6 97.9
114.7 115.7 98.6 97.9
114.5 114.9 99.4 99.1
Force/Unit Length (mN/m) 18.9
Std.Dev 2
Table 5: Measuring the Advancing and Receding Contact Angle with Tilting Method (Table from [19])
Volume Advancing (Degs) Receding (Degs)
10 117.7 114.5 106.2 96.8
114.5 116.0 100.3 109.4
15 115.9 115.5 97.4 108.9 120.4 117.5 105.6 99.0
115.6 117.0 117.8 105.9 103.2
115.6 116.9 106.6 103.9
25 114.3 115.8 102.4 104.4
114.4 116.1 100.6 107.2
Force/unit length (mN/m) 15
Average/Std.Dev 116.2/1.61 103.6/3.88

47
Table 6: Measuring the Contact Friction Force with Direct Method (Table from [19])
Max Force (µN) Force/unit length
(mN/m)
Acceleration (mm/s²)
42 µl Std
Dev.
63 µl Std
Dev.
42 µl 63 µl
0.3 X X 91.91 5.9 X 10.21
0.5
11
25
X X 91.4 23.5 X 10.16
1 97.4 8.47 103.9 17.4 10.83 11.55
2 112.9 21.3 109.1 21.1 12.74 13.73
3 114.7 8.93 123.6 25.1 12.74 13.73
6 120.5 7.58 132.5 13 13.39 14.72
9 125.2 1.39 128.5 15 13.91 14.27
In the direct measurement method contacting angle is not a concern and the
actuation force will be measured directly. The tests were performed under
different principals, namely velocity and acceleration. In the following graph
(Figure 27), friction force between a water droplet with a volume of 41 µl and a
hydrophobic surface was measured. In this set of tests, the stage runs with
velocities of 1 and 2 mm/s, as well as accelerations of 0.3, 2, 4, 5 and 6 mm/s.
According to the graph the force increases tremendously in the first few micro
meters and it grows even more by running the motion with higher accelerations.
By comparing the results from direct measurement with traditional dynamic
methods we notice that the data is close together and this could mean that
contact friction force and hysteresis force could be similar. The differences
between traditional measurement and direct measurement might come from
48
environmental influences like air pollution, mechanical noise or electrical noise.
Table 6 also shows that by increasing the motion’s acceleration, steady state
velocity decreases and the standard deviation of the force increases. Thus it is
suggested that by decreasing the motion acceleration we can approach
traditional measurement data to direct measurement data.[19]
Figure 27: Force (N) vs. Distance (mm) on Volume 41µl by Customized Machine [19]
5.2 Comparison
Hysitron is one of the companies that design and sell commercial products for
force measurement. TI 900 TriboIdenter is a model they have that looks very
similar to our actuation force measurement machine. TI 900 is able to measure

49
the hardness and elastic modulus of thin films and coating. This machine also
can measure force and displacement in two parallel axes to the vibration
platform. There are 3 axis motion systems in this machine, however only one
axis is enough for the actuation measurement. Travel Range for TI 900 is 150
mm on X direction and 250 mm on Y direction.
5.2.1 Force Measurement Mechanism
Hysitron machine is ability to measure lateral force is up to 2 mN with sensitivity
of 3.5 µN and for longitudinal force would be 30 mN with 30 µN. On the other
hand in our customized machine the force can measure the lateral force 100 µN.
Due to measuring of lateral force in our application it shows that customized
machine is more proper in this set of experiments.
5.2.2 Noise and Smooth Motion
Hysitron’s stages move with a stepper motor that is specifically designed for
them. [14] The mechanism of stepper motors is based on a rotary motion that
goes step by step. There are multiple electromagnetic teeth around the main
core. The core has a gear shape with teeth around it. In the first step in a two
phase mechanism, one of the electromagnets activates, which causes the
nearest core tooth to align itself with that electromagnetic tooth. [20] On servo
Motors (DC Motor) there are no steps and with it the rotary motion is consistent.
That means the stator magnets are permanent magnets and they provide a

50
consistent magnetic field around the central core. The Rotor (core) generates an
alternative magnetic field by external current. This current makes the rotor have
a changing magnetic pole and this causes it to attract and repel stators
alternatively. [21] The mechanism on these is important because of the type of
motion that they provide to the stage. Due to the many steps that a step motor
needs to have to make a complete rotation circle, the noise and vibration are
much higher when compared with DC motors which have a continuous process.
[20], [22] Also, stepper motors are not able to stop immediately.[22]
Moreover, the maximum velocity and acceleration of DC motors are more than
stepper motors. Stepper motors are also cheaper and have longer lifetimes when
compared with DC motors. Considering the high precision in this measurement
process, a stage with a DC motor was considered for the machine in order to
have more accurate data.
5.2.3 Accessibility
The Hysitron machine only has a small window on the front side, which makes
the working on the test setup hard for the operator. However, in our design
there are two wide windows on the front and the side which gives an easy
accessibility to most of important components inside the box.

51
5.2.4 Transparent Box
The advantages of having a transparent box is that enough light can enter into
the box and there is no need to install more light. Also, the process is observable
and the operator can notice any emergency or system failure by watching it.
Hysitron used a blank plastic box that makes the interior box dark.
5.2.5 Clean Room
Keeping the substrate and other components in a clean environment is an
essential concern in order to have accurate data. The sealed box used in
Hysitron’s machine and the enclosure box in our machine protects the test
components. However, only our device has positive air flow keeping the dirt and
other types of prolusions out while the operator is working inside the box with
open windows.
5.2.6 Flexibility
Most of the components in our machine are able to move and be positioned on
specific locations. For instance, the structure and the stage are installed on a
breadboard that has thread all over its surface, and by undoing their screws the
components can be relocated anywhere. The Camera, the sensor, the vacuum
grabber and the lateral structure can be adjusted and move. However, Hysitron’s
machine is based on granite and this prevents it from having the same option.
Our sensor is the only component that can move vertically up and down.

52
5.2.7 Price and Transportation
Hysitron’s machine costs almost $285000, which is a considerable amount of
money and shipping such a big and heavy machine also presents a large problem
and a large cost. Our machine costs much less than Hysitron’s commercial
product (around $15000) and overall is lighter and is easier to transport, as the
parts can be undone and assembled easily again.

53
CHAPTER 6: CONCLUSION
6.1 Conclusion
After doing research about the problems with traditional electrowetting force
measurements, the idea of direct measurement encouraged us to start research
in this field. As a result we designed a precision machine to be able to measure
actuation displacement force as well as electrowetting actuation force. The
machine includes a vibration isolation system to reduce disorder effects, an
actuation force that is provided by the motion mechanism, a force measurement
system with MEMS based sensor technology, adjustment and an enclosure box to
increase the accuracy of the experiment. This system is competitive with similar
commercial products due to aspects such as lower price, easy setting of motion
parameters and recording data by compatibility with LABVIEW software, high
repeatability, high accuracy, low scale of noises and simple design.
6.2 Future Work
This machine can be developed under some aspects. One would be to optimize
the machine’s components to increase the accuracy and measurement capacity.

54
Moreover the overall size of machine could be smaller and applying the actuation
force could be done by different methods such as continues electrowetting or
ultra-sonic waves. Increasing the sensitivity and contribution between
components is the main key that needs to be followed in future work.

55
REFERENCES
[1] Elaine G. Shafrin and William A. Zisman, “constitutive relations in the wetting of low energy surfaces and the theory of the retraction method of preparing monolayers,” no. u. s. naval research laboratory, 1959. [2] J. R. Rowlinson and B. Widom, molecular theory of capillarity. dover publications, 2003, p. 352. [3] T. Chow, “wetting of rough surfaces,” journal of physics: condensed matter, vol. 445, 1999. [4] B. D. N. Eustathopoulos, M.G. Nicholas, wettability at high temperatures, vol. 1999. elsevier, 1999, p. 420. [5] J. Berthier, P. Dubois, P. Clementz, P. Claustre, C. Peponnet, and Y. Fouillet, “actuation potentials and capillary forces in electrowetting based microsystems,” sensors and actuators a: physical, vol. 134, no. 2, pp. 471–479, mar. 2007. [6] Katherine Marie Smyth, “wetting hysteresis and droplet roll off behavior on superhydrophobic surfaces,” massachusetts institute of technology, 2010. [7] F. Mugele and J.-C. Baret, “electrowetting: from basics to applications,” journal of physics: condensed matter, vol. 17, no. 28, pp. r705–r774, jul. 2005. [8] Krüss Co, “measurement contact angle.” [online]. available: http://www.kruss.de/en/theory/measurements/contact-angle/measurement-contact-angle.html. [accessed: 20-oct-2012]. [9] P. D. Roger P. Woodward, “contact angle measurements using the drop shape method.” [10] D. Öner and T. J. Mccarthy, “ultrahydrophobic surfaces. effects of topography length scales on wettability,” langmuir, vol. 16, no. 20, pp. 7777–7782, oct. 2000.

56
[11] C. W. Nelson, C. M. Lynch, and N. B. Crane, “continuous electrowetting via electrochemical diodes.,” lab on a chip, vol. 11, no. 13, pp. 2149–52, jul. 2011. [12] Edmund Optics Co, “compact vis-nir fixed focal length lenses.” [online]. available: http://www.edmundoptics.com/imaging/imaging-lenses/edmund-optics-designed-lenses/compact-vis-nir-fixed-focal-length-lenses/3338. [accessed: 29-oct-2012]. [13] Newport Co, “mid-range travel linear stage, steel, 100 mm travel, dc motor, uts series.”. [14] Jean-Baptsite Waldner, nanocomputers and swarm intelligence. wiley-ieee press, 2008. [15] “how sensors work - mems sensor.” [online]. available: http://www.sensorland.com/howpage023.html. [accessed: 20-sep-2012]. [16] Newport Co, “legs and isolators : anatomy of a pneumatic vibration isolation system.” [17] “thorlabs - peformanceplus series, 110 mm (4.3") thick, enhanced stiffness, enhanced damping breadboards.” [online]. available: http://www.thorlabs.com/newgrouppage9.cfm?objectgroup_id=1860. [accessed: 22-oct-2012]. [18] J.-U. Shim, G. Cristobal, D. R. Link, T. Thorsen, Y. Jia, K. Piattelli, and S. Fraden, “control and measurement of the phase behavior of aqueous solutions using microfluidics.,” journal of the american chemical society, vol. 129, no. 28, pp. 8825–35, jul. 2007. [19] N. B Crane, Qi Ni, Timo Marschke, Samuel Steele, Seyed Najafi, “contact angle friction and contact angle hysteresis (CAH) though force measurements,” in imece2012, 2012, pp. 1–3. [20] “servo motor guide.” [online]. available: http://www.anaheimautomation.com/manuals/forms/servo-motor-guide.php. [accessed: 11-oct-2012]. [21] “clemson vehicular electronics laboratory: dc motors.” [online]. available: http://www.cvel.clemson.edu/auto/actuators/motors-dc.html. [accessed: 11-oct-2012].

57
[22] “hybrid motors - vibration and resonance - nmb technologies corporation.” [online]. available: http://www.nmbtc.com/step-motors/engineering/vibration-and-resonance.html. [accessed: 11-oct-2012].

58
APPENDICES
59
Appendix A: Components Specifications
This appendix shows the full details of the components that were used in the
design of this machine. These components are the stage, the camera, the lens,
the MEMS sensor, the breadboard, the micro positioners and the controller.
Specifications help the designer to choose the best device or component based
on the functionality, accuracy, repeatability.
Table A: Stage Specifications (Taken from Newport Co)
Spec Value Spec Value
Model UTS100CC Resolution 0.1 µm
Travel Range 100 mm Pitch 100 or ±55 µrad
Normal Load Capacity 200 N Weight 3.2 kg
Minimum Incremental Motion, Linear
0.3 µm Axial Load Capacity
50 N
On-Axis Accuracy 5.5 or ±2.75
µm Thread Type M4 and M6
Maximum Speed 40 m/s Motor Type DC
Bi-direction Repeatability
4 or ±2.0 µm Bearings Linear ball bearings
60
Appendix A (Continued)
Table B: Camera Specifications (Taken from Edmundsoptic Co)
Specs Value/Model
Model Number EO-0413M
Type of Sensor MT9V032
Camera Sensor Format 1/3”
Sensing Area H x V (mm) 4.5 x 2.8
Pixels H x V 752 x 480
Pixel Size, H x V (µm) 6 x 6
Pixel Depth 8-bit
Frame Rate (FSP) 87
Type of shutter Global
Synchronization Internal or Via Software
Video Output USB 2
Dimensions 44 x 44 x 25.4
Mount C-Mount
Mounting Thread 1/4- 20
Figure A: Focal Lens Length (Sketch is Taken from Edmundsoptic Co with Permission)

61
Appendix A (Continued)
Table C: Rail Structure Specifications (Taken from Newport Co)
Specs Value/Model
Model X95-0.5
Rail Length 19.69 in. (500 mm)
Width 3.74 in. (95 mm)
Height 3.74 in. (95 mm)
Material Aluminum
Thread Type M6
Weight 3.7 lb/ft (5.5 kg/m)
Table D: Rail Carriers Specifications (Taken from Newport Co)
Specs Value/Model
Model CXL95-80
Width 6.5 in. (31.5 mm)
Height 1.24 in. (31.5 mm)
Length 3.15 in. (80 mm)
Material Aluminum
Thread Type 3.15 in. (80 mm)

62
Appendix A (Continued)
Table E: MEMS Sensor Specifications (Taken from Nanoscience Instrumental Co)
Specs Value/Model
Model FTS-100
Force Range ± 100 µN, 10 mg
Sensitivity / Sensor Gain 50 µN/V, 5 mg/V
Output Signal 0 - 5 V
Output Voltage at Zero Load 2.25 V
Power Supply Voltage 5 V
Resolution at 1,000 Hz 0.05 µN, 0.005 mg
Resolution at 10 Hz 0.005 µN, 0.0005 mg
Probe Material Single Crystal Silicon
Probe Thickness 50 µm
Probe Width 300 µm
Probe Length 3,000 µm
Overall Assembly Dimensions 28 x 8x 5.2 mm
Table F: Breadboard Specifications (Taken from Newport Co)
Specs Value/Model
Model RG-34-2
Thread Type 1/4-20
Width 3 ft.
Length 4 ft.
Thickness 2.4 ft.
Mounting Hole pattern 1 in. grid
Surface Flatness ±0.004 in.
Working Surface 400 Series ferromagnetic stainless
steel
Type of shutter Global
Maximum Dynamic Deflection Coefficient
<9.4 x 10⁻⁴
63
Appendix A (Continued)
Table G: Manual Positioner Specifications (Taken from Newport Co)
Specs Value/Model
Model 460A-XZ
Travel Range 0.5 in. (12.7 mm)
Axes of Travel X, Z
Load Capacity 15 lb. (67 N)
Bearings Ball Bearings
Material Aluminum
Thread Type 1/4-20
Load Capacity, Vertical 5 lb. (22 N)
Angular Deviation <150 µrad

64
Appendix B: Customized Components Drawing
There are many customized components that are designed and fabricated in the
machine. Mostly these parts are used to mount different components and
devices on them.
Figure B: Sensor Mount Block
Figure C: Camera Mounting Bracket to Micro Positioner

65
Appendix B (Continued)
Figure D: Under Stage Bracket
Figure E: Vacuum Lifter Mount

66
Appendix B (Continued)
Figure F: Micro Positioner Mounting Bracket to Carrier
Figure G: Top Stage Bracket

67
Appendix C: Copyright and Permissions
Figure H: Permission for Figure 12 Courtesy of Newport Co

68
Appendix C (Continued)
Figure I: Permission for Figure 11 Courtesy of Nanoscience Instruments Co

69
Appendix C (Continued)
Figure J: Permission for Figure A Courtesy of Edmund Optics Co

70
Appendix C (Continued)
Figure K: Direct Email for Figure 26 Courtesy of Newport Co