Embed Size (px)
Citation preview
1
DESIGN OF AN AUTOMATED VEHICLE DETECTION SYSTEM FOR BICYCLES:
FIREWORKS CYCLING SENSOR
By:
Jason Cheng
Peter Kim
Tory Morgan
Clay Young
California Polytechnic State University
San Luis Obispo
2015
2
Contents Abstract...................................................................................................................................... 4
Introduction ................................................................................................................................ 6
Background and Literature Review ............................................................................................ 6
Systems Engineering .............................................................................................................. 7
Scope ................................................................................................................................. 7
Resources ........................................................................................................................... 8
Reaction as a System Parameter ........................................................................................ 9
Speed Disparity..................................................................................................................12
Drivers ...............................................................................................................................12
Cyclist ................................................................................................................................13
Scaling ...............................................................................................................................14
Meeting Objectives ............................................................................................................15
New Product Development ....................................................................................................18
Bike Safety ............................................................................................................................21
Team Dynamics ....................................................................................................................23
Dynamic Leadership ..........................................................................................................23
Decision Making.................................................................................................................25
Barriers and Gateways to Communication .........................................................................27
Conclusion of Literary Review ...............................................................................................29
Design ......................................................................................................................................29
Feedback Methodology .........................................................................................................36
Consumer Feedback Methodology ....................................................................................36
Feedback Justification........................................................................................................37
Traffic control familiarity .....................................................................................................38
Methods ....................................................................................................................................38
Experiment 1: Stationary Range Limit Under Optimal Conditions ..........................................38
Experiment 2: Field of View Limits and Accuracy ..................................................................40
Experiment 3: Detection Rate Comparison to Light Conditions ..............................................42
Future Development .................................................................................................................44
Improving upon the Sensor’s Capabilities ..............................................................................45
Results ......................................................................................................................................46
Conclusion ................................................................................................................................52
3
Recommendations ....................................................................................................................55
Systems-Level Requirements ................................................................................................55
Passing or Veering Vehicles ..................................................................................................56
Completing Tasks and Working on Tasks ..............................................................................56
Milestones .............................................................................................................................57
Balancing Collaboration and Delegation ................................................................................57
Scheduling Fun Activities.......................................................................................................57
Bibliography ..............................................................................................................................58
Appendix A: Figures and Tables ...............................................................................................61
Appendix B: Facilities Planning .................................................................................................68
4
Abstract
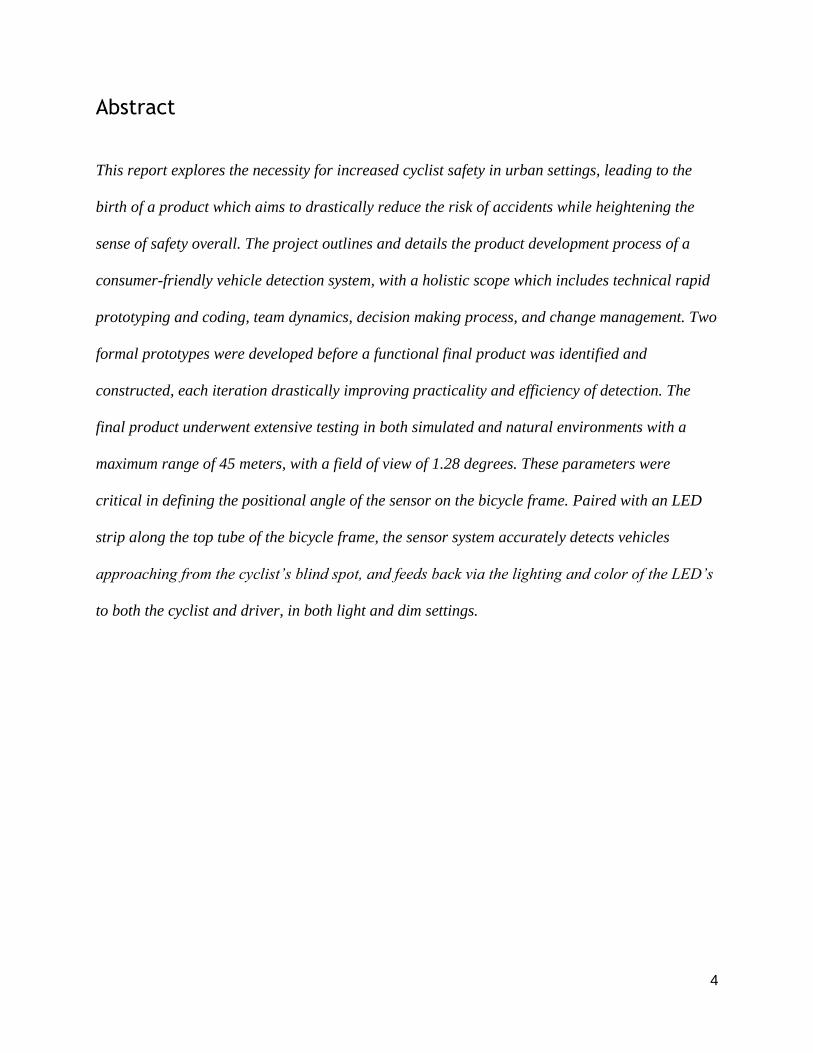
This report explores the necessity for increased cyclist safety in urban settings, leading to the
birth of a product which aims to drastically reduce the risk of accidents while heightening the
sense of safety overall. The project outlines and details the product development process of a
consumer-friendly vehicle detection system, with a holistic scope which includes technical rapid
prototyping and coding, team dynamics, decision making process, and change management. Two
formal prototypes were developed before a functional final product was identified and
constructed, each iteration drastically improving practicality and efficiency of detection. The
final product underwent extensive testing in both simulated and natural environments with a
maximum range of 45 meters, with a field of view of 1.28 degrees. These parameters were
critical in defining the positional angle of the sensor on the bicycle frame. Paired with an LED
strip along the top tube of the bicycle frame, the sensor system accurately detects vehicles
approaching from the cyclist’s blind spot, and feeds back via the lighting and color of the LED’s
to both the cyclist and driver, in both light and dim settings.
5
Tables Table 1: Technical Data Sheet for the 5050 RGB LED Strip......................................................37
Table 2: General improvements and final layout .......................................................................45
Table 3: Sample from output data from Experiment 1 ...............................................................46
Table 4: Sample from output data from Experiment 2 ...............................................................48
Table 5: Complete Output Data from Experiment 2 ...................................................................63
Table 6: Initial and Phantomized Storage Facility Costs ............................................................73
Table 7: Initial and Phantomized Material Handling Technology ...............................................74
Table 8: Cost Savings Analysis on Phantomization of Manufacturing Process ..........................75
Table 9: General Improvements and Final Layout .....................................................................76
Figures Figure 1: Degree of Arousal Compared to Reaction time (Kosinski, 2013, p. 2). .......................10
Figure 2: Degree of Arousal Compared to Performance Ability (Athanasiou, page 143, 2010) ..11
Figure 3: QFD Chart Displaying Ordered Steps (Blanchard 2003, p. 26)...................................17
Figure 4: Prototype Bike Sensing Mechanism (Smaldone: 2010) ..............................................22
Figure 5: Representation of the Arduino software serial monitor ...............................................39
Figure 6: Experiment 2 Setup ....................................................................................................42
Figure 7: Experiment 3 Setup ....................................................................................................43
Figure 8: Sample of Code to show logic on distance ranges .....................................................48
Figure 9: Probability Plot to determine field of view of the LIDAR-Lite .......................................49
Figure 10: Detection rate of passing objects compared to light conditions .................................50
Figure 11: Front view of the final design for the Firework Cycling Sensor..................................53
Figure 12: ISO view from the left for the Firework Cycling Sensor .............................................53
Figure 13: ISO view from the right for the Firework Cycling Sensor ...........................................54
Figure 14: Histogram of Detection Angle to determine field of view of the LIDAR-Lite ...............63
Figure 15: Ultrasonic Sensor Prototype .....................................................................................64
Figure 16: Design Iteration 2 of the Firework Cycling Sensor ....................................................65
Figure 17: LED Strip emitting red color due to no desired object ...............................................66
Figure 18: LED Strip emitting yellow color due to approaching desired object ...........................66
Figure 19: LED Strip emitting red color due to desired object in dangerous zone ......................67
Figure 20: Side shot showing confirmation of desired object in dangerous zone .......................67
Figure 21: Product Structure for the Firework Cycling Sensor ...................................................69
Figure 22: Phantomized Structure for the Firework Cycling Sensor ...........................................69
Figure 23: 3D Phantomized Facility Design for the Firework Cycling Sensor…………………….72
Figure 24: 2D Phantomized Facility Design for the Firework Cycling Sensor ............................73
Figure 25: Code block 1 through Arduino Software ………………………………..…………….…78
Figure 26: Code block 2 through Arduino Software ………………………………..…………….…79
Figure 27: Code block 3 through Arduino Software ………………………………..…………….…80
Figure 28: Code block 4 through Arduino Software ………………………………..…………….…81
Figure 29: Code block 5 through Arduino Software ………………………………..…………….…82
6
Introduction
This report centers around the development of the Firework Cycling Sensor. Currently, the
dangerous conditions of a cyclist commute in an urban environment demands safety protocols
that are not easily available. The amount of safety gear a cyclist must wear in order to comply
with traffic law, or further more traffic safety, can still be ineffective at promoting safety. More
specifically, cyclists often struggle with car recognition when making turns into preceding lanes.
This device acts as an indicator to cyclist and cars of each other’s presence through the use of a
large LED strip, attached to the body of the bicycle which reacts similarly to a stoplight. For the
cyclist, green indicates that it is safe to maneuver into a lane, yellow indicates an approaching
vehicle and that safety should be advised, and red indicates that maneuvering into a lane will
cause harm. The report travels through a Literature Review, focused on bicycle safety; Design
considerations, reasoning, and prototypes; Methods of testing, to validating the effectiveness of
the prototypes; Results, explicitly stating the findings from the Methods; and Conclusions for the
final ability of the Firework to perform according to our specifications. These specifications
centered on the improvement of safety for a commuting cyclist and a reliability of our robust
design. The project was completed through the Industrial Engineering Department at California
Polytechnic State University in the Interdisciplinary Senior Project Course, IME 471, IME 481,
and IME 482
Background and Literature Review
The literature review involves four sections in an attempt to gain understanding concerning
cycling safety product development. The first section of the literature review explores the
concept of systems engineering and how it helps to establish project parameters. The second
7
section of the literature review list and explains the steps and strategies involved with new
product development. The third section of the literature review discusses the importance of
bicycle safety. The fourth section of the literature review covers team dynamics in a product
development process and its relation to cycling safety.
Systems Engineering
A system, according to document EIA/IS-632, incorporates “an integrated composite of people,
products, and processes that provide a capability to satisfy a stated need or object” (Blanchard,
2008, p.3). In this section we will discuss the application of Systems engineering to a complex
development process.
Scope
The boundaries of the cycling safety procedures and equipment system must be defined for
understanding. For this project the Scope does venture beyond the components. All physical
parts of the bicycle itself are included. Even attachment and casings are integral to the system as
a whole. The systems approach follows a consumer minded methodology, concerned with the
design integrity almost as much as the functional integrity. As in any system within the scope,
feedback must be included, and must reach either the cyclist effectively as defined, or it must
reach the environment as targeted. In the case of this project, the environment and cyclist are not
necessarily part of the system, but are considered to be on the threshold of the system boundary.
The comparison can be made to a slot machine that has just produced a winning sequence and is
producing money or tokens. The party involved who “won” this prize is not required to take it or
to stop playing. The machine alone can be placed into a category as a system. While one would
expect the winner to make one decision, but a slot machine does not succeed or fail dependent on
the uses decision. It succeeds when it receives input or command, produces a sequence and
8
responds correctly. In this manner, cycling safety procedure and equipment will succeed as a
system when it produces the correct output, and when that output can be interpreted correctly by
the cyclist or environment involved as needed.
The failure of the system must also be included, because the scope does not limit itself to only
success, but all observed results. These undesired events are necessary to a degree, because in
order to attain complete quality control, one must accept hardware, or external error, as a
building block to failure (Sage 2011, et al). The failure here is a significant part of research and
development, in order to eradicate it when the system is in the hands of the consumer.
Resources
The constituent resources define the project's complexity in the form of “human beings,
materials, equipment, software, facilities, data, money and so on” (Blanchard 2008, p. 3). The
human beings involved include the stakeholders and those effective in an environment with
cycling traffic. Stakeholders may include the developers of procedures and equipment applicable
to cycling safety, consumers and users of the procedures and equipment, those providing
financial capital for these projects, and those who must respond to these projects as they become
present in the environment. While a cyclist appears to be the top priority, their affected
surrounding and those who bring these projects to fruition need to be equally concerned with its
quality and effectiveness. Materials and equipment make tangible as otherwise conceptual
design. The microcontroller, sensor, casing, and other components make up the physical parts of
the system. Software drives the safety systems such as lights and other activated hardware with a
sense of logic, producing the desired goal much as a puppeteer to his show. The less “visible”
this component of the system, the more accomplished it will be. In this case, facilities are
marginal, and progress occurs among university halls and garages. Data may be the most
9
important piece of the system since it will ultimately constitute accuracy and produce results that
meet all goals. Feedback must be driven by extremely accurate data, and special attention is
brought to the topic in the following paragraph. Money is an overarching factor because the
system can be labeled as a consumer product. As a resource, it pervades the life cycle. Capital
drives the initial stages of the research and system development, revenue sustains the
organization producing the system. These resources, in the form of human beings, materials,
equipment, software, facilities, data, and money must be succinctly organized in order to
succeed.
Reaction as a System Parameter
Cognitive and physical overload by maintaining high levels of awareness while on a bicycle
means that any alert method cannot add to the strain of the cyclist. For instance, another visual
signal may detract from the user’s focus on surroundings, thereby defeating the purpose of
increased safety. With this consideration, method of establishing non-intrusive feedback must be
determined.
The theory of mental reaction times, translating to physical reaction times involves variables
similar to line balancing with independent events. In order for the environment to remain safe,
meaning that neither the cyclist nor the vehicle involved feels as if a dangerous situation has
been initiated, both parties involved must have enough time to react after notification. The
reactions therein may be as significant a factor in avoiding a dangerous situation as a feedback
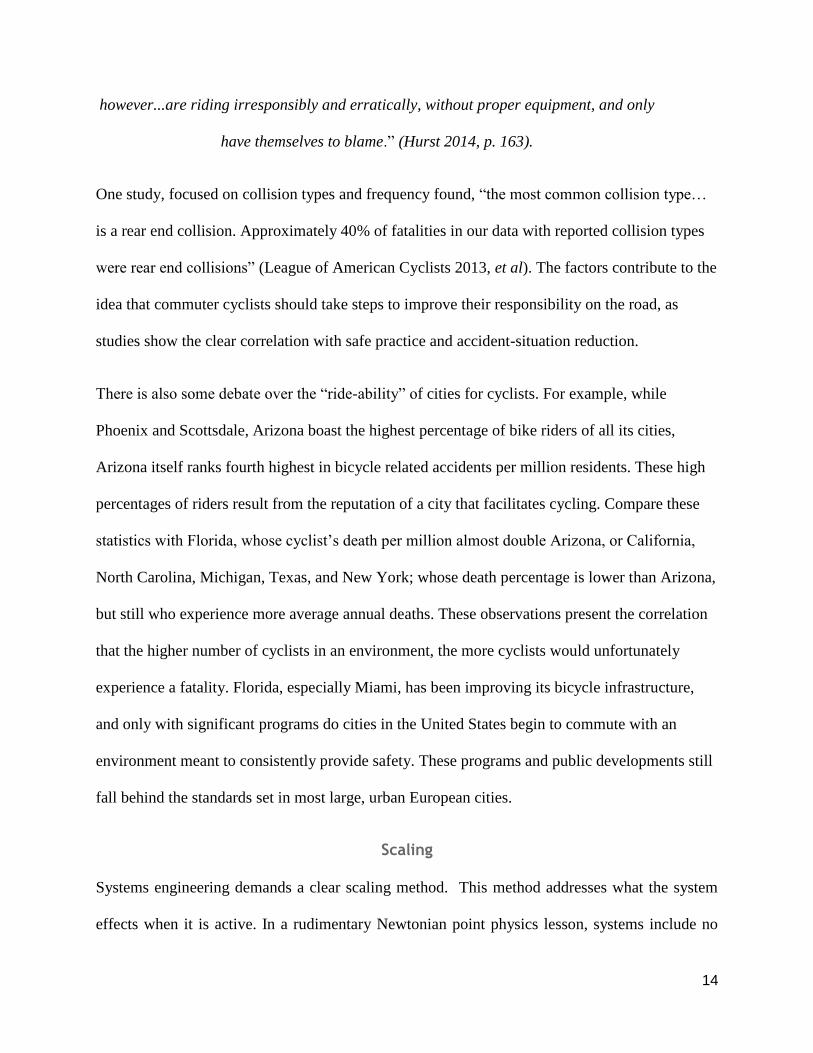
method. “One of the most investigated factors affecting reaction time is 'arousal' or state of
attention, including muscular tension. Reaction time is fastest with an intermediate level of
arousal, and deteriorates when the subject is either too relaxed or too tense. That is, reaction time
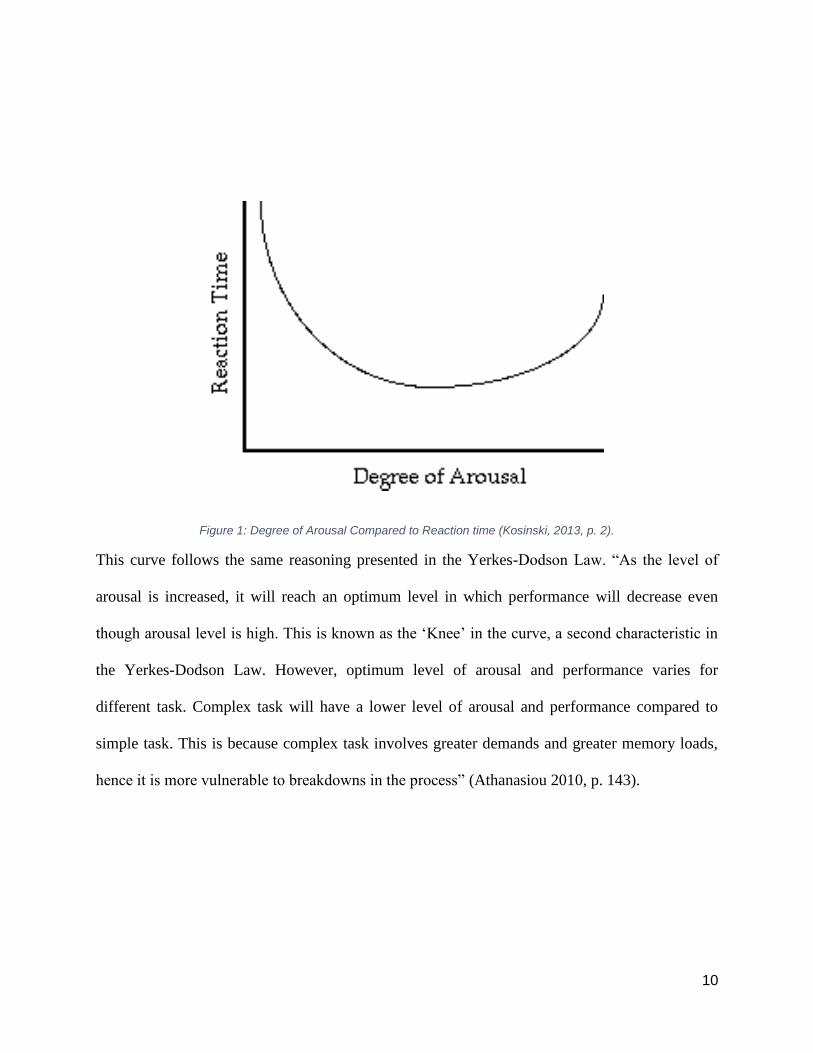
response to arousal is as follows:” (Kosinski 2013, p. 2).
10
Figure 1: Degree of Arousal Compared to Reaction time (Kosinski, 2013, p. 2).
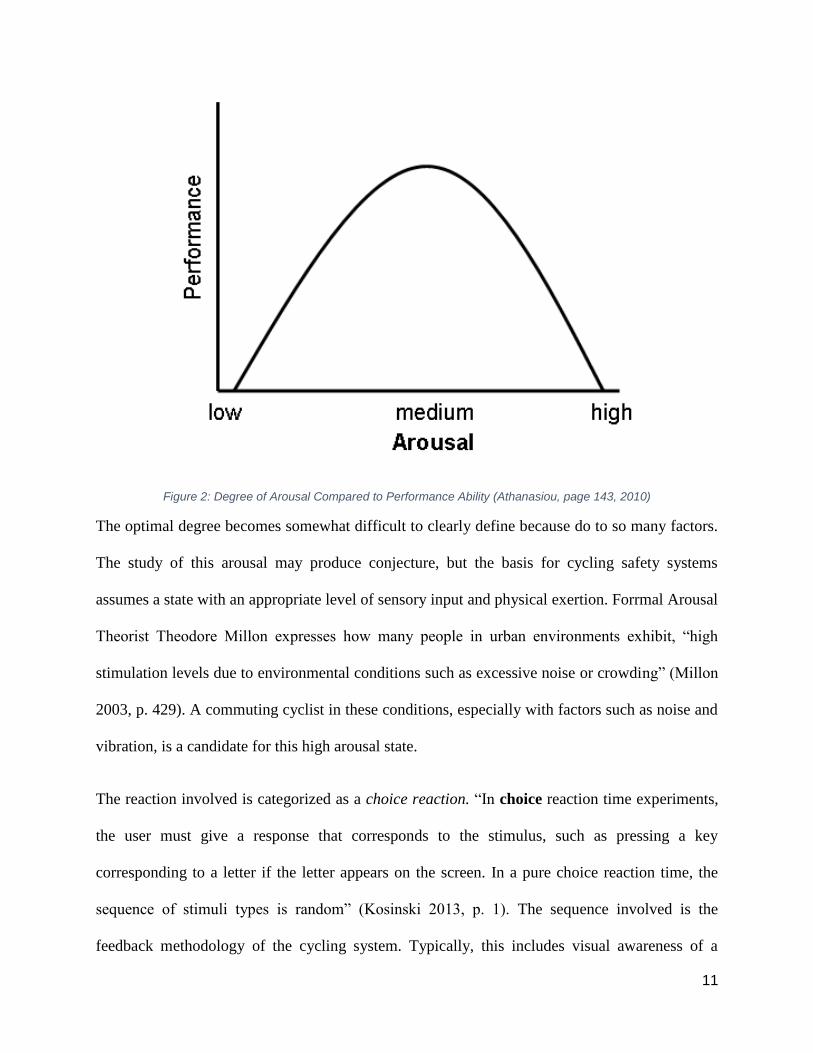
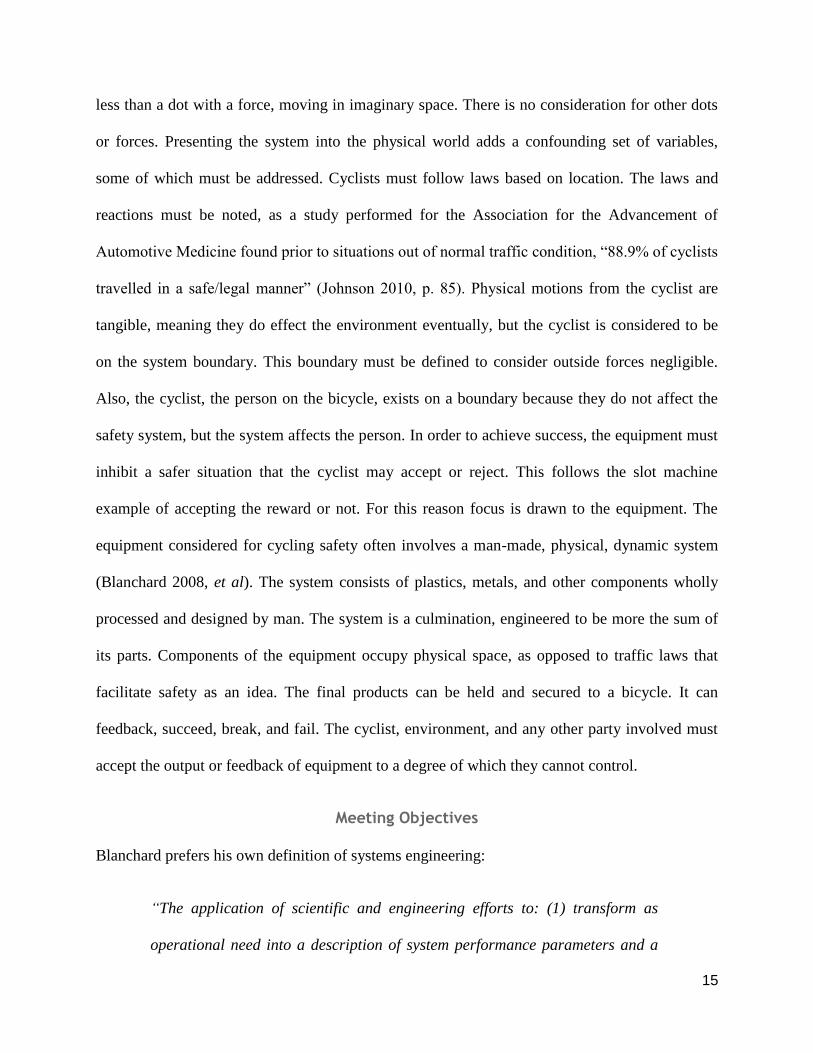
This curve follows the same reasoning presented in the Yerkes-Dodson Law. “As the level of
arousal is increased, it will reach an optimum level in which performance will decrease even
though arousal level is high. This is known as the ‘Knee’ in the curve, a second characteristic in
the Yerkes-Dodson Law. However, optimum level of arousal and performance varies for
different task. Complex task will have a lower level of arousal and performance compared to
simple task. This is because complex task involves greater demands and greater memory loads,
hence it is more vulnerable to breakdowns in the process” (Athanasiou 2010, p. 143).
11
Figure 2: Degree of Arousal Compared to Performance Ability (Athanasiou, page 143, 2010)
The optimal degree becomes somewhat difficult to clearly define because do to so many factors.
The study of this arousal may produce conjecture, but the basis for cycling safety systems
assumes a state with an appropriate level of sensory input and physical exertion. Forrmal Arousal
Theorist Theodore Millon expresses how many people in urban environments exhibit, “high
stimulation levels due to environmental conditions such as excessive noise or crowding” (Millon
2003, p. 429). A commuting cyclist in these conditions, especially with factors such as noise and
vibration, is a candidate for this high arousal state.
The reaction involved is categorized as a choice reaction. “In choice reaction time experiments,
the user must give a response that corresponds to the stimulus, such as pressing a key
corresponding to a letter if the letter appears on the screen. In a pure choice reaction time, the
sequence of stimuli types is random” (Kosinski 2013, p. 1). The sequence involved is the
feedback methodology of the cycling system. Typically, this includes visual awareness of a
12
vehicle. The choice for the cyclist involves either proceeding into a traffic lane, remaining in the
current lane, and others.
Speed Disparity
The speed at which the cyclist and vehicle are traveling is also a consideration in systems design.
The disparity in speed between the parties involved must be noted, and in urban environments
especially, pedestrian traffic plays a factor. During work commutes, “a trip speed of 25 mph as
the probable US average for cars” (Tranter 2004, p. 74), with a +/- 5 mph range to capture a 95%
CI. While, “A more average cyclist can travel 12 miles an hour,” (Forester 1994, p. 360), with a
+/- 4 mph range to capture a 95% CI in a situations where strong acuity is needed. These
commuting speeds occur where the trip length measures less than 10 miles, capturing at least
74% of the commute length for vehicles and 85% of commute length for bicycles. With this data
vehicles may have a 22 mph advantage in speed over cyclists in a commuting situation.
Pedestrians present the least aroused party using the Yerkes-Dodson curve. An average walking
pace ranges from 3 to 5 mph. The ideal environment would not present any interaction between
cyclists and pedestrians or vehicles and pedestrians. They would breach the system in head on
situations, as a pedestrian overcoming a cyclists or car is unheard of. Also, difference in speed
between pedestrian and cyclist is less than between a vehicle and a cyclist. Cycling safety
systems typically must confront vehicles, so as to consider them a higher priority. There are also
the special cases of a non-moving party, such as urban structures and opening car doors; and
other cyclists who are the cause of danger by improperly following traffic laws.
Drivers
Driver reaction times are a factor, which must be addressed almost as a design limit. It is
practical to use a “time standard reaction time number, such as 1.5 seconds, when analyzing a
13
case” (Green 2013, p. 458) in a system with a driver and a vehicle. This standard, from Doctor
Green, is quite long because it is applied to “Surprise Expectations”, in which the driver
encounters very unusual circumstances. Green addresses how “‘standard human reaction time’ of
0.75 seconds for response often is not applicable in non-laboratory settings and tasks” (Green
2013, p. 458). The fact remains that many cyclists place themselves into dangerous situations.
The Uniform Motor Vehicle Code has set visibility standards for cyclists to be seen at a
minimum 600 feet to the rear. Many manufacturers state “they were not aware of the UMV
Code” (Green, James 2001, p. 164). Without the use of fluorescent clothing, cyclists with a rear
light are perceived by vehicles at roughly 150 feet at night. Coupling this statements and data
establishes the need to better alert vehicles of cyclists.
Cyclist
Several factors are involved with the cyclist, those which hinder and those that aid in decreasing
the choice reaction time. An analysis of the head movements of 2,112 cyclists found an
association between more frequent head movements and greater caution (Räsänen 1998 et al.).
While these cyclists demonstrate simple methods of environmental safety checks, many do not
utilize the technique while observing traffic laws. “In 52% of urban and 67% or rural car-bike
collisions the collision type itself shows that the cyclist was disobeying a rule of the road” and
“populations of college and young adult cyclists score between 50% and 80%” in a competency
test (Forester 1994, p. 59). At night, even more problems arise.
“Night cycling looks very dangerous on paper. About half of cyclist traffic fatalities
occur between six o'clock in the evening and six o’clock in the morning. This amazing
stat is even more impressive when you consider that relatively few cyclists ride at night.
Many of these night victims are run down from behind...Some of these victims,
14
however...are riding irresponsibly and erratically, without proper equipment, and only
have themselves to blame.” (Hurst 2014, p. 163).
One study, focused on collision types and frequency found, “the most common collision type…
is a rear end collision. Approximately 40% of fatalities in our data with reported collision types
were rear end collisions” (League of American Cyclists 2013, et al). The factors contribute to the
idea that commuter cyclists should take steps to improve their responsibility on the road, as
studies show the clear correlation with safe practice and accident-situation reduction.
There is also some debate over the “ride-ability” of cities for cyclists. For example, while
Phoenix and Scottsdale, Arizona boast the highest percentage of bike riders of all its cities,
Arizona itself ranks fourth highest in bicycle related accidents per million residents. These high
percentages of riders result from the reputation of a city that facilitates cycling. Compare these
statistics with Florida, whose cyclist’s death per million almost double Arizona, or California,
North Carolina, Michigan, Texas, and New York; whose death percentage is lower than Arizona,
but still who experience more average annual deaths. These observations present the correlation
that the higher number of cyclists in an environment, the more cyclists would unfortunately
experience a fatality. Florida, especially Miami, has been improving its bicycle infrastructure,
and only with significant programs do cities in the United States begin to commute with an
environment meant to consistently provide safety. These programs and public developments still
fall behind the standards set in most large, urban European cities.
Scaling
Systems engineering demands a clear scaling method. This method addresses what the system
effects when it is active. In a rudimentary Newtonian point physics lesson, systems include no
15
less than a dot with a force, moving in imaginary space. There is no consideration for other dots
or forces. Presenting the system into the physical world adds a confounding set of variables,
some of which must be addressed. Cyclists must follow laws based on location. The laws and
reactions must be noted, as a study performed for the Association for the Advancement of
Automotive Medicine found prior to situations out of normal traffic condition, “88.9% of cyclists
travelled in a safe/legal manner” (Johnson 2010, p. 85). Physical motions from the cyclist are
tangible, meaning they do effect the environment eventually, but the cyclist is considered to be
on the system boundary. This boundary must be defined to consider outside forces negligible.
Also, the cyclist, the person on the bicycle, exists on a boundary because they do not affect the
safety system, but the system affects the person. In order to achieve success, the equipment must
inhibit a safer situation that the cyclist may accept or reject. This follows the slot machine
example of accepting the reward or not. For this reason focus is drawn to the equipment. The
equipment considered for cycling safety often involves a man-made, physical, dynamic system
(Blanchard 2008, et al). The system consists of plastics, metals, and other components wholly
processed and designed by man. The system is a culmination, engineered to be more the sum of
its parts. Components of the equipment occupy physical space, as opposed to traffic laws that
facilitate safety as an idea. The final products can be held and secured to a bicycle. It can
feedback, succeed, break, and fail. The cyclist, environment, and any other party involved must
accept the output or feedback of equipment to a degree of which they cannot control.
Meeting Objectives
Blanchard prefers his own definition of systems engineering:
“The application of scientific and engineering efforts to: (1) transform as
operational need into a description of system performance parameters and a
16
system configuration through the use of an iterative process of definition,
synthesis, analysis, design, test and evaluation, and validation; (2) integrate
related technical parameters and ensure the compatibility of all physical,
functional, and program interfaces in a manner that optimizes the total
definition and design; and (3) integrate reliability, maintainability, usability
(human factors), safety producibility, supportability (serviceability),
disposability, and other such factors into a total engineering effort to meet
cost, schedule, and technical performance objectives.”
The operational need, or pain of the system in this case, is that cyclists run the risk of
encountering many dangerous situations, no matter the environment. Performance parameters
can be developed through Quality Function Deployment drafted into a House of Quality. When
these are met in tangent, a system, focused on cycling safety, can be deemed successful. From an
entrepreneurial view, this translates loosely into the development of a target market.
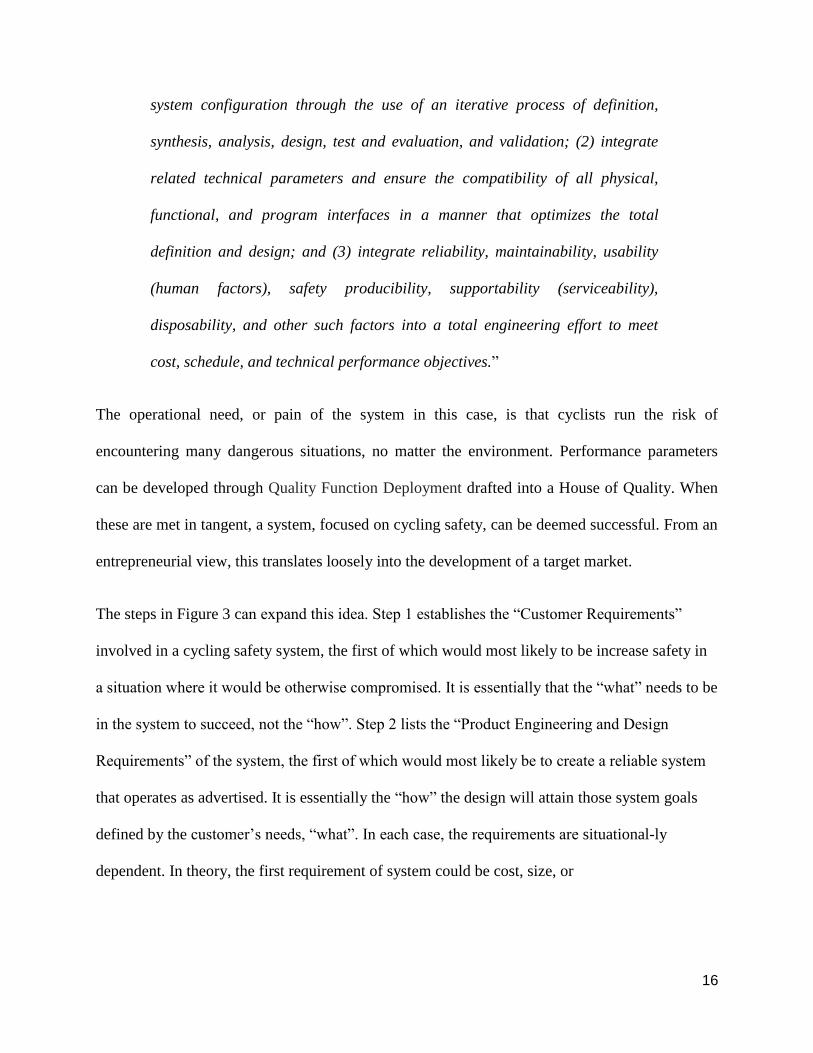
The steps in Figure 3 can expand this idea. Step 1 establishes the “Customer Requirements”
involved in a cycling safety system, the first of which would most likely to be increase safety in
a situation where it would be otherwise compromised. It is essentially that the “what” needs to be
in the system to succeed, not the “how”. Step 2 lists the “Product Engineering and Design
Requirements” of the system, the first of which would most likely be to create a reliable system
that operates as advertised. It is essentially the “how” the design will attain those system goals
defined by the customer’s needs, “what”. In each case, the requirements are situational-ly
dependent. In theory, the first requirement of system could be cost, size, or
17
Figure 3: QFD Chart Displaying Ordered Steps (Blanchard 2003, p. 26)
weight, both from a customer and engineering perspective. The design cycle using the QFD chart
produces a definite iterative process. Step 3 relates these requirements in relation to each other
requirement. A higher ranking shows a heavier influence between requirements, with discrete
scores typically of 0, 1, 3, and 9. A + (plus) and - (minus) system is also used as a representation
of these common integers. The relationship between size and weight can represent a simple
example of this ranking. As an example, if customers place a heavy desire to bathe in large
bathtubs, the design requirement of the weight of those large tubs may become a heavy
dependency. The two requirements correlate strongly. Step 4 evaluates the effectiveness of a
competitor to meet the previously mentioned Customer Requirements. A scale is defined and
each competitor is placed according to how effectively they achieve each Customer
Requirement. This is another way to break down equipment as a system into more addressable
18
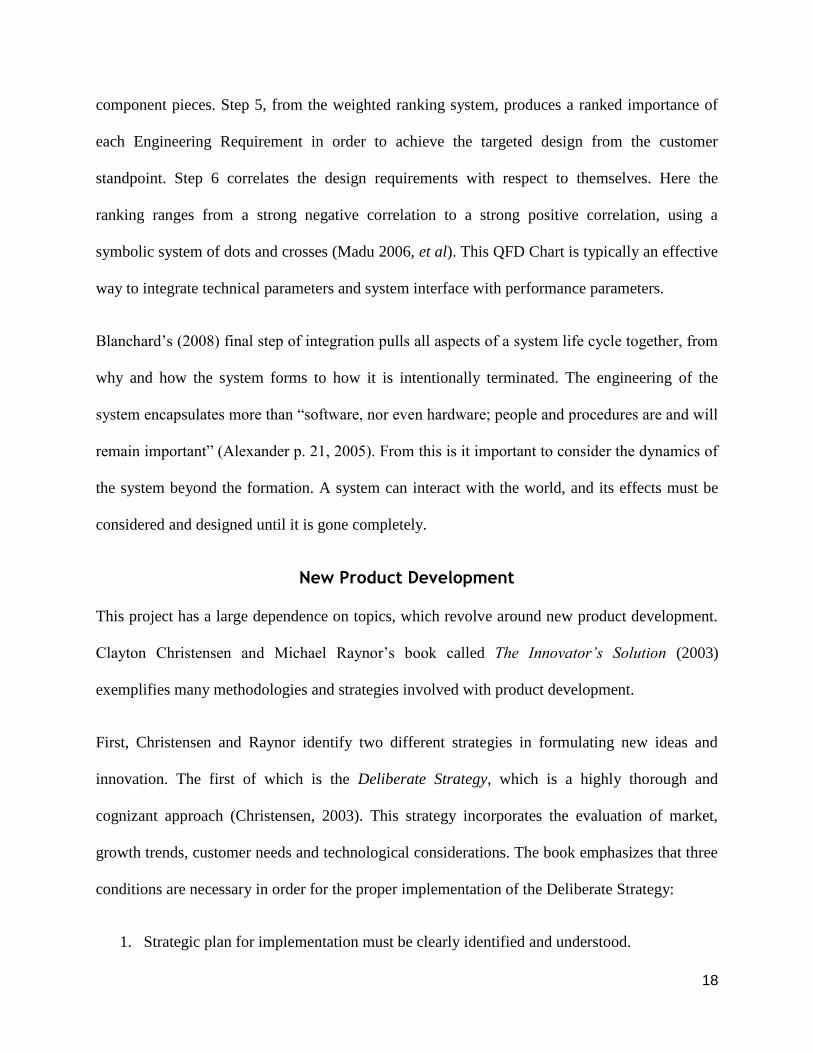
component pieces. Step 5, from the weighted ranking system, produces a ranked importance of
each Engineering Requirement in order to achieve the targeted design from the customer
standpoint. Step 6 correlates the design requirements with respect to themselves. Here the
ranking ranges from a strong negative correlation to a strong positive correlation, using a
symbolic system of dots and crosses (Madu 2006, et al). This QFD Chart is typically an effective
way to integrate technical parameters and system interface with performance parameters.
Blanchard’s (2008) final step of integration pulls all aspects of a system life cycle together, from
why and how the system forms to how it is intentionally terminated. The engineering of the
system encapsulates more than “software, nor even hardware; people and procedures are and will
remain important” (Alexander p. 21, 2005). From this is it important to consider the dynamics of
the system beyond the formation. A system can interact with the world, and its effects must be
considered and designed until it is gone completely.
New Product Development
This project has a large dependence on topics, which revolve around new product development.
Clayton Christensen and Michael Raynor’s book called The Innovator’s Solution (2003)
exemplifies many methodologies and strategies involved with product development.
First, Christensen and Raynor identify two different strategies in formulating new ideas and
innovation. The first of which is the Deliberate Strategy, which is a highly thorough and
cognizant approach (Christensen, 2003). This strategy incorporates the evaluation of market,
growth trends, customer needs and technological considerations. The book emphasizes that three
conditions are necessary in order for the proper implementation of the Deliberate Strategy:
1. Strategic plan for implementation must be clearly identified and understood.
19
2. The strategy must be fully understood from the employees of the organization from their
view of their own context.
3. All aggregate intentions must be comprehended with minimal influence from outside
sources.
When these three requirements are all satisfied, the Deliberate Strategy becomes the optimal
approach. However, Christensen and Raynor mention that it is often difficult to completely
achieve these three conditions. For this reason, the book also outlines a second approach, the
Emergent Strategy, defined as the result of the day-to-day effort in observations and analysis
(Christensen, 2003). This is somewhat of a non-conscious exercise. In circumstances in which
the future of technology, or changing markets is unclear, this strategy should be used almost
exclusively. In all other situations it is recommended to utilize a combination of both strategies.
The book identifies the three different paths to new-growth innovations:
Sustaining Innovation: Sustaining innovation introduces a higher-performing product to a pre-
existing market. Sustaining innovation is often described as “building a better mousetrap”. Some
sustainable innovations are simply regular or semi-regular upgrades, while others may be
relatively large incremental steps improving the technology, interface, etc.
Low-End Disruptions: This approach provides Innovations that target existing, mature markets
that have lower profitability. Established companies will usually dominate in this area and can
easily compete with smaller companies attempting to gain space in the market. These smaller
companies often struggle to gain traction in these markets mainly due to a lack of resources.
20
New-Market Disruptions: This type of innovation targets a population segment called “non-
consumers”. Non-consumers have an unfulfilled need that cannot be fully satiated by existing
products available. New-market disruptions offer very simple and affordable products that enable
the population of non-consumers to begin to acquire these products at will. These innovations
must be sufficiently capable to pull customers away from other mainstream markets because
“these customers [will] find it more convenient to use the new product”(Christensen, 2003, p.
97).
As CEO of IDEO, Tim Brown is widely considered an expert in design thinking and new-
product development. His book Change by Design offers extensive knowledge on best practices
for innovation. Brown places heavy emphasis on the utilization of prototyping and indicates the
benefits which go far beyond the incremental step of ensuring the product works as intended.
Contrary to popular belief, prototyping brings about results in less time than proceeding without
this critical step. The assessed results serve not only to test the functionality of the product, but
also analyze customer feedback. It is an invaluable opportunity to detect the onset of issues, test
different manufacturing processes, and eliminate any ambiguities among potential customers and
team members (Brown, 2009). Prototypes should require as little time, effort, and expense
necessary to provoke beneficial feedback. It is entirely unnecessary to develop an elaborate, full-
fledged prototype-- any break from this can possibly lead to instinctively augmenting the
prototype too far for meaningful use, or neglecting the opportunity to encounter potential
improvements at minimal cost (Brown, 2009).
An abundant number of ideas will spur from prototyping, but its important to note that building
on the ideas of others can further develop successful in a collaborative setting. In doing this, the
21
development team excels significantly further in terms of refining and improving upon every
iteration of the product.
Bike Safety
With the onset of green initiatives and sustainability requirements imposed by governing bodies,
the number of hobby and commuter cyclists in traffic is on a gradual rise (cite). However,
bicycle safety has not received due attention, since traffic regulations and safety has largely
focused only on motorized vehicles—for example, with the growing population, there is an equal
or greater growth in the cyclist population (League of American Bicyclists). Consequently, there
is a severe lack of cyclist products, which can mitigate the risk of sharing the road with
automobiles, the most perceivably dangerous situation being an approaching or overtaking
vehicle from behind the cyclist. Most available products involve mitigating damage upon impact
rather than mitigating the risk itself, such as helmets and body armor. Moreover, the performance
of these protective gears is unclear when a motor vehicle is involved, intended to protect the
cyclist from collision with non-mobile objects (Smaldone: 2010). With over 700 bicyclists dying
annually in accidents with automobiles and over 44,000 annually reported cases of injuries due
to bicycle-automobile accidents (Smaldone: 2010), there is a necessity for a safety-enhancing
product. Furthermore, during a single year, “33 million Americans used their bicycles, in an
average of six times per month for 1 hour of cycling...assuming that 85% of cyclists will develop
one or more injuries during their lifetime, approximately 23 million cyclists will get injured at
some point.” (Bini and Carpes year, p. 55). This article aims to identify the need and current
developments toward this initiative and to present a necessity for further product development.
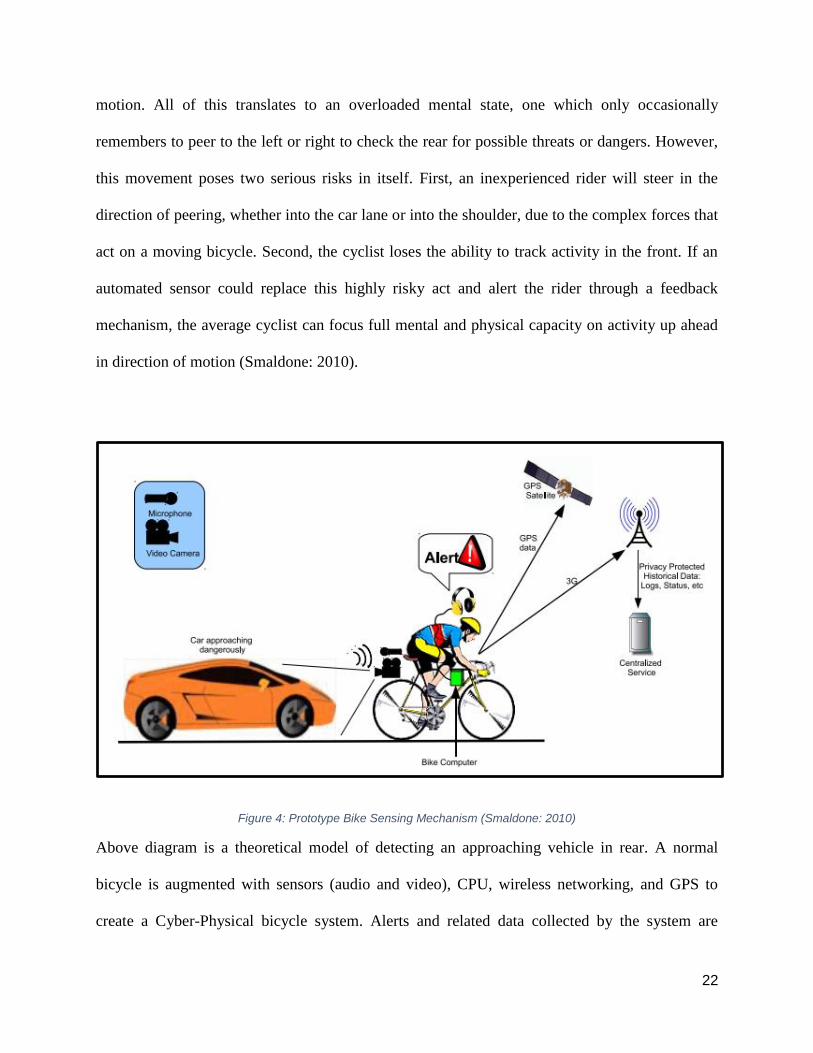
An average cyclist is on highly loaded sensually. Visually, the scenery, path, and traffic are
constantly being monitored. Physically, the arms and legs are in constant, repetitive, strenuous
22
motion. All of this translates to an overloaded mental state, one which only occasionally
remembers to peer to the left or right to check the rear for possible threats or dangers. However,
this movement poses two serious risks in itself. First, an inexperienced rider will steer in the
direction of peering, whether into the car lane or into the shoulder, due to the complex forces that
act on a moving bicycle. Second, the cyclist loses the ability to track activity in the front. If an
automated sensor could replace this highly risky act and alert the rider through a feedback
mechanism, the average cyclist can focus full mental and physical capacity on activity up ahead
in direction of motion (Smaldone: 2010).
Figure 4: Prototype Bike Sensing Mechanism (Smaldone: 2010)
Above diagram is a theoretical model of detecting an approaching vehicle in rear. A normal
bicycle is augmented with sensors (audio and video), CPU, wireless networking, and GPS to
create a Cyber-Physical bicycle system. Alerts and related data collected by the system are

23
transmitted to a centralized service where they are logged and stored. This design has not been
fully implemented to date owing much to the complexity and accuracy of all its components. For
the sole purpose of properly detecting a vehicle, the larger number of components may lead to
greater accuracy and reliability, but also to increased complexity and malfunctioning.
Furthermore, as a viable consumer product, the detection system should not be overbearing on
the cyclist or the bicycle, compromising its performance in any significant manner.
Team Dynamics
Because this project is a year-long and we will be working as a team all year, we wanted a focus
of our project to be developing our abilities to work in a team setting. The topics we will focus
on in this section of the literature review are dynamic leadership, decision-making, and team
communication.
Dynamic Leadership
Because this project group was formed organically and there was no hierarchy,
there will be no single leader for the entirety of the project. While we will not assign a leader to
the project, leadership is very important to getting tasks done in a timely manner and we will
rotate leadership for each section of the project. Leadership is the key to allowing a group of
diverse people to work together toward a common goal. In our case we will examine leadership
at the individual and group levels. Leadership is the process by which the individual influences
the group to deeply influence members of the group in the development of a common mission.
Effective leadership relies heavily on the interpersonal processes. While leadership is commonly
believed to be an inborn trait, it can in fact be learned (Hogan, pg. 495) . There is a difference
between leadership and management. Management is important when the process being carried
out by the group are familiar, but in an innovative situation like our senior project, leadership
24
will be more important than management. Managers carry out responsibilities, exercise authority,
and how about how things get done, whereas leaders attempt to understand people’s beliefs and
gain their commitment to work for the common mission. Leaders trust the abilities of the group
members (Hogan, pg. 495) and this is something we would like to maintain as the leadership
roles shift throughout the project. Leaders challenge the status quo, and this is how we would
like to lead in our project; we will lay all of our assumptions on the table to be challenged by
other group members. By challenging our deeply held assumptions about how a project should
be carried out, we will learn to let go of our assumptions and take calculated risks in creatively
completing the project (Hogan, pg. 495).
Because the members of our team come from different educational backgrounds,
it is important for the leaders to develop a vision and set an explicit direction for the group’s
work. Due to the technical nature of this project, the vision should be explicit with objective
numbers to ensure that the achievement of our goals is measurable. Next, leader should develop
strategies for producing change toward their vision. Because of the scope of this project, there
will be a lot of failure along the way and it is up to the leader to motivate the team to try new
actions that may seem likely to fail. While the vision may make sense logically, the leader should
monitor the actions of the team members as they carry out the vision. It is probable that the team
members will fall into their typical tendencies when new processes are necessary. In order to be
an effective leader for this senior project, interpersonal and technical communication are the
most important skills. While the vision and the strategies may be excellent, the leader should put
significant stake in helping the team members understand the vision and the plan. The process of
communicating with a group of engineers could be the biggest lesson we take away from the
project. When the vision and the strategies for carrying out the vision have been communicated

25
to the group, the final step for the leader is motivating and inspiring the team members to carry
out the vision. This final step will also rely heavily on communication. In the communication
section below, barriers and gateways to communication will be defined. We will rotate the
position of leadership depending on the task we are working on. There can be multiple leaders
for each task, but we would like it if every member of the group got the opportunity to practice
their leadership skills. Some of us may have had experience with team leadership and we will
want to practice the role of follower to understand what motivates people as subordinates
(Hogan, pg. 495).
Decision Making
Due to the lack to hierarchy and defined roles in our group, we could benefit from
understanding the different ways of making decisions. In order to coordinate meetings and
effectively work through the project, we will want to practice our decision-making skills.
Decision-making often stems from the group problem solving process. In the group problem
solving process, it is important for the group to come to an agreement on the goals of the process.
In packaging a device, some of the group members may be focused on the functionality, while
the rest of the members may be focused on aesthetics. Both goals are equally important and the
group will want to address both the goals when they are designing the packaging.
In this case, we are attempting to solve the problems of bike safety. First, we will
begin by brainstorming our goals in this project. Hopefully we can establish many goals and
work to edit our goals to a few that are commonly held among the group members. Next, we will
establish a shared understanding of the problems we are attempting to solve. For a bike safety
product, a problem may be reliability in the evening. We will use diagrams and collaboration to
create a shared understanding of how reliability at night can be an issue. Once the problems have
26
been explicitly stated to the group, we will establish ground rules for how we will work as a
team. These ground rules include how we will plan meetings, how we will communicate between
meetings, and how we will make decisions. After creating the ground rules of our team culture,
we establish a shared understanding of basic assumptions and priority issues in solving the
problem. In the case of bike safety, we will test our assumptions the safety for bicyclists can be
improved with current technology and we will choose the aspects of bike safety that are the most
important (Edmondson, pg. 67[LS1] ).
Because three of our group members are avid bike commuters, we may approach
this problem with strong ideas of how we can improve bike safety. While those assumptions are
important to consider incorporating into our goals, we will also take into consideration the
alternative solutions. Testing our assumptions and considering alternatives will be difficult, but it
is important to consider even impossible solutions when looking for the solution to the problem
of bike safety. Considering all the alternatives, even if they are risky or illogical, can help expand
our creativity in reasonably solving the problem. Next, we will develop criteria for evaluating all
of our alternatives. The criteria should include our experience, time constraints, and resources.
Each part of the design process will include the consideration of the criterion for evaluating our
alternatives. With our other classes and the locked in end date, our decisions should be calculated
to ensure we can finish the project. While failures are welcomed for learning, it is important for
the whole team to be on board for the directions we decide to go with the project. Once the
alternative has been chosen, this plan will be compared to the problem statement to show that we
are working within our scope (Edmondson, 68).
When the group makes decisions, we will use the consensus process to be sure
that all of the group can live with our decisions. While it is common to vote on issues in group
27
settings, we will use the consensus process because it accounts for the reasoning behind
everyone’s opinion. In the consensus process, each member will give his opinion on a decision.
If everyone can live with the decision, it will pass and we will go in that direction. If a member
will not allow a decision to pass, the plans must be revised so that every member feels like his
needs are being met. While the consensus process can be time consuming, we want the opinions
of the whole group to be valued and voting tends alienate the members with the dissenting views
(Edmondson, 73).
Barriers and Gateways to Communication
In the process of meeting and discussing actions to be taken by the team, effective
communication is the key to teamwork. With an interdisciplinary project where the scope is not
fully defined and the group is inexperienced with the design processes, barriers to effective
communication can often arise. The tendency to evaluate, judge, and approve or disapprove of
the statement of another group member is a natural tendency. The instant evaluation of another’s
statement will cause a misunderstanding of the point of view of another and block interpersonal
communication (Rogers, 104).
In order to avoid the pitfalls on evaluative listening, it is important to dig deeper
into the position of another and identify their interests in making that statement. While one
member may have a strong background in solid modeling, another member may have never used
a solid modeling program and it is tough for this person to admit they are not comfortable using
solid modeling to design a prototype. While the member with solid modeling experience could
get fed up with the other team member and lash out over a step that seems simple and
worthwhile, it is important to address these conflicts with the goal of understanding why there is
a disagreement in the next steps without offending anyone. It is important to ask questions with
28
the intent of understanding the position of another person. The goal of this questioning is to help
the group feel like it can share their interests. According to psychologist Carl R. Rogers (1991) ,
it is important to restate the ideas of the other people involved in a conflict. This can help ensure
that the members of the group are all talking about the same thing. Fully understanding the other
party’s point of view does not mean there is an agreement between the two parties, but it does
mean that communication has been achieved and communication is the most important aspect of
effective teamwork. While Cal Poly does provide its engineering students with a relatively sound
technical education, the institution does not train most of the students in effective interpersonal
communication. In a year-long project with many hours of meeting weekly, our abilities to
combine technical and interpersonal communication techniques invaluable to the success of our
senior project. While listening with understanding may seem like common sense, it is rarely
practiced in organizational settings for the following reasons: lack of courage and heightened
emotions (Rogers, pg. 105).
Because listening with understanding can change a person’s mind about the best
way to go about a project, there is very often a lack of courage to withhold judgments and see
things from another’s point of view. We identify with our deeply held beliefs about effectiveness
and productivity and it is therefore too risky to question our own beliefs. This shift in perspective
will not happen immediately and we are prepared to fail in order to learn to work more
effectively as a team (Rogers, pg. 105).
Because conflict creates heated emotions among group members, this is the
hardest time to listen with understanding and it is time when effective listening is the most
necessary. When the members of the group are unable to come to a shared understanding during
conflict situations, it can be effective to involve a neutral third party in the dispute to bring
29
clarity to the situation. In the case of our senior project group, we will involve Kurt, Liz, and Jim
in our unresolved conflicts to help us develop a shared understanding of our point of view.
Because this project is a brand new idea and involves a process that we are unfamiliar with, we
are prepared to speak with Kurt, Liz, and Jim early and often to resolve our disputes. Mediation
by a third party can lead to improved communication, to greater acceptance of each other, and to
attitudes that are more positive and more problem solving in nature. The presence of a third party
can cause a decrease in defensiveness, in exaggerated statements, in evaluative and critical
statements. Because we are working with this group all year, we would like our conflict to
productive and avoid alienating any group members (Rogers, pg. 106).
Conclusion of Literary Review
Having a focus on systems engineering, new product development, bicycle safety, and team
dynamics has assisted in identifying studies, models, and methodologies to support our topic.
Clearly, there is seemingly an unlimited amount of information regarding these areas, however,
the team must keep in mind what has been taught through this research in order to have the
highest means of success.
Design
For the Interdisciplinary Senior project this year, we formed as a group interested in
exploring an entrepreneurial venture. All of the group members had taken an introductory
entrepreneurship course at Cal Poly and we liked the idea of creating a start-up as part of our
senior project. We met weekly during the initial quarter to discuss ideas and get to know each
other. Some people from our class showed interest, but ultimately we ended up with the four
group members we have today. During our meetings to discuss ideas, we would use the “Points
30
of Pain” exercise to come up with ideas of problems in our daily lives. The “Points of Pain”
exercise was done individually and shared with the group. It was fun to create lists of ideas for
problems that we deal with regularly and typically filter out. Sharing the points of pain exercise
was comical and many of our ideas were similar.
Unfortunately, it felt like we were reluctant to share all of our ideas and it could have
been more effective to post all the ideas anonymously on a public forum (lots of research to
support that ideation is done better virtually… we have an unconscious reluctance to say our true
ideas in a public setting, and these are my personal feelings) . After our first time sharing our
points of pain, we realized that we spend much of our day at a desk working on school and
internet surfing. An issue that we all faced from hours in front of a computer was back pain and
excessive slouching. While we are young and our bodies account for the negative effects of poor
posture, we are aware of the long term effects that slouching can have on the human body and
we would like to avoid these effects (any studies or actual medical issues to mention??). With the
current popularity of standing desks for people in all occupations, we wanted to explore the
possibility of designing and producing our own standing desk. Because standing desks tend to be
our of the price range of college students, our initial idea for entering the market would be
creating an inexpensive.
Professor of Entrepreneurship at Cal Poly, Jon York, met with us and reminded us that it
is impossible to enter a market with the lowest price. In the case of the standing, large furniture
companies such as IKEA would quickly make our product for cheaper and sell it for cheaper.
They would quickly take over our market niche and we would go out of business. Instead of our
initial idea to enter the standing desk market, we decided to explore the idea of creating luxury
standing desks. These stylish desks would different design styles, beautiful patterns, and luxury
31
branding. When we decided on high-quality, expensive standing desks, we started doing the
customer development process.
With customer development, we decided to start with potential customer interviews.
First, we spoke with a kinesiology professor at Cal Poly. Because of her recent pregnancy, this
professor was experiencing back and knee pain and she was committed to trying a standing desk
to give her more range of motion for her joints. We went to her office and spoke with her about
her requirements for the decision to purchase a standing desk.
After this customer interview, we worked on some team building. With this team
building, we shared our backgrounds and interests on a Google Document. In this forming stage
of the team, sharing our backgrounds gave us the comfort with each other to express that we
were no longer interested in the standing desk or doing a entrepreneurial venture with our senior
project. First, we decided against the standing desk because it was a boring product to work on
and we thought a lot of customer development would need to be done before we could start
creating a luxury standing desk. Next, we decided against doing an entrepreneurial venture.
While we are all still interested in entrepreneurship and we used many of our entrepreneurial
skills in developing our senior project, we decided against focusing on creating a start-up
because of the time commitment necessary to do proper customer development. Now we had no
idea what we were going to work on for senior project and it was the beginning of November.
We went back to the drawing board and did another points of pain exercise. From this
exercise, we found that 3 of the 4 of us had issues with bike safety. Because we commuted to Cal
Poly daily and we enjoyed cycling for recreation, we decided that bike safety was an issue that
we had on a regular basis. When we discussed our issues with bike safety, it boiled down to two
32
main concerns of blind spot monitoring and visibility at night. When we bike on busy roads, we
are anxious about the cars passing us at high speeds. In order to feel more secure about our
situations as sitting ducks on the busy roads, we peek over our shoulders to check when cars are
passing and how close they are passing us riding in the bike lane. This peeking over our
shoulders can often put us off course and we risk veering into the curb or the bike lane. While we
all use reflective vests and lights when riding at night, these measures are only so effective and
more visibility could help our chances of getting home safe. After looking at the current options
for bicyclist safety, we realized that there was not a well-known product that could monitor the
blind spot and maintain a high level of visibility at all hours. We decided we wanted to create a
sensor system that could monitor the blind spot for the rider.
Because we did not have experience with sensor systems, we decided to research the
components to go into a sensor system. First, we looked into sensor options. Our initial criterion
for picking a sensor was keeping it under $100. Our options for a sensor for under $100 were
ultrasonic sensors, passive infrared (PIR) sensors, and the LIDAR-Lite sensor. The ultrasonic
sensor is commonly used in DIY robotics and it only cost $4 a piece. Because this sensor was
cheap and there was tons of info online about how to use the sensor, we decided we would start
the prototyping process with an ultrasonic sensor. The ultrasonic sensor’s maximum theoretical
range is 5 meters. This range would give us a distance that could measure a dangerous proximity
for a car in a passing situation. An issue with the ultrasonic sensor is the inconsistent field of
view. As the range of the sensor increases out to 5 meters, the field of view angle decreases from
30 degrees down to 0 degrees at 5 meters.
Next, we decided what kind of microcontroller we would use to process the proximity
data from the ultrasonic sensor. Microcontrollers are essentially small computers on an
33
integrated circuit that can be programmed to carry out various simple tasks. We ultimately chose
the Arduino because it was easier to use than the Raspberry Pi for beginners and it could handle
analog signal from our sensors. Because we were unsure of the functionality of the Arduino and
all the components we would need for our project, we each decided to each order a kit that
included servo motors, LEDs, temperature sensors, and a breadboard. Then, we acquired
ultrasonic sensors for each group member. From there we created our initial prototypes. This first
prototype was composed of an ultrasonic sensor, an Arduino board, a breadboard, a feedback
mechanism, and a 9V battery. We tried two different types of feedback: a piezoelectric buzzer
speaker and colored LEDs. With these prototypes, we were able to understand coding in Arduino
and interfacing components with the Arduino. Because Arduino uses a C-based programming
language and some of us had experience with this language, our coding went smoothly for this
prototype. Arduino is also an open source application with many users posting codes online. For
much of our code, we modified code we found on the open source coding resources. Because we
are relatively inexperienced in programing, this boost gave us a chance to learn and move
forward in the project at a steady pace.
For our prototype with the piezoelectric speaker, the various proximity values picked up
by the ultrasonic sensor would change the pitch of the speaker. While this prototype was
effective in showing us we could successfully work with the ultrasonic sensor and the Arduino,
the speaker’s high pitch was annoying and we decided to discontinue using it in our prototyping
process. For our prototype with the colored LEDs, the various proximity values picked up by the
ultrasonic sensors would cause each LED to brighten for each different range of distances. There
was a green LED, a yellow LED, and a red LED. For measured distances between 0 meters and 1
meter, the red LED would brighten and flash. For measured distances between 1 meter and 3
34
meters, the yellow LED would brighten and flash. For measured distances greater than 3 meters,
the red LED would brighten and flash. While the colored LEDs worked well for a prototype, we
decided this feedback mechanism was too small to effectively alert a cyclist of the proximity of a
passing car. If we kept the three LEDs, the cyclist would have to constantly be looking down at
the feedback mechanism and taking his eyes off the road. In order to help the cyclist refrain from
taking his eyes off the road, we decided to increase the surface area of the feedback mechanism
for our second prototype. Before we found a larger feedback mechanism, we decided to test the
accuracy of the ultrasonic sensor outdoors for monitoring moving objects. While the ultrasonic
sensor gave us accurate distance measurements indoors, the measurements were far less than our
expected values when we moved the sensor system outdoors. This was disappointing because
these sensors cost only $4 apiece. While we initially did not understand why the sensors were
inaccurate outdoors, we learned that ultrasonic sensors are highly sensitive to noise. Noise is the
random fluctuation of an electrical signal due to other electrical signals in the environment. In
our case, the sources of noise affecting our sensor were likely cell phone signals, electrical
towers, and naturally occurring environmental sources.
While we could have used filtering to delete the noise signals, we are inexperienced with
Electrical Engineering and we decided to try a different sensor that would handle noise better
than the ultrasonic sensor. Our options were a passive infrared (PIR) sensor or a LASER sensor.
While the PIR sensor had a 120 degree field of view and maximum range of 7 meters, our
research of the device showed us that the PIR sensor is susceptible to same noise issues as the
ultrasonic sensor. When we researched LASER sensors, we found a brand new sensor called the
LIDAR-Lite from PulsedLight3D. While we were unfamiliar with using this sensor and there
was very little info online about other people’s experiences, we chose to try this sensor because it
35
used a special optical signature system that eliminated the noise problem. The sensor emits a
unique optical signature that matches to a stored template. When the sensor receives its signal,
the signature is matched to the template and the distance is calculated from the location of this
match. This sensor costs $90, which is highly competitive in comparison to similar products. its
accuracy and filtering mechanism made it worthwhile for our needs and experience with sensors.
This sensor had a field of view angle of 3 degrees and a theoretical maximum range of 40
meters. When the team had acquired the LIDAR sensor, its functionality was tested with the
Arduino and colored LED feedback mechanism. Two exciting aspects of the LIDAR’s
functionality were the acquisition rate that got as low as 5 ms and an experimental maximum
range of 40 meters. This testing also confirmed PulsedLight3D’s claims that the LIDAR was
impervious to noise. Because of the accuracy of the LIDAR, more testing was planned to check
to complete functionality of the sensor. Before testing the LIDAR’s field of view angle and its
accuracy with moving objects, the team researched a feedback mechanism with a larger surface
area. Ultimately, the individual colored LEDs were replaced with a one meter long strip of 32
colored LEDs. Because of the increased surface area of the new feedback mechanism, the cyclist
could theoretically be able to keep his eyes on the road and notice the LED’s color changes out
of his peripheral vision. It is important for the cyclist to keep his eyes on the road to avoid
veering into the curb or into the driving lane. Though the team had set out to create a device that
alerted the cyclist of a dangerous passing situation, the illuminated, meter long LED strip could
be used to alert the passing drivers of the cyclist’s presence. With the addition of the LED strip
and LIDAR-Lite, the prototype could accurately alert the cyclist and the driver of a dangerous
passing situation. With this new prototype, a battery of tests were performed to ensure the
functionality of the cyclist safety sensor. Because of the bursts of light emitted by the LED strip,
36
the team decided to call the device the Firework Cycling Sensor. For the first test, the team
established the maximum range for the LIDAR. Next, the field of view angle was determined for
the LIDAR. Finally, the accuracy of the device was tested on moving vehicles. The results of
these tests will be explained in the Methodology section.
In order to effectively monitor the cyclist’s blind spot, the LIDAR was attached to the
seat post of the bike. The 3D printed case enclosed the LIDAR, the Arduino, and the 9V battery.
The attachment piece allows the case to rotate vertically and aim at the cars depending on the
height of the bike. The LED strip was attached to the top tube of the bike with double-sided tape.
The final design for the Firework Cycling Sensor incorporated the LIDAR-Lite sensor, an
Arduino UNO, a 3D printed case, a 9V battery, and a meter-long strip of 32 LEDs.
Feedback Methodology
Consumer Feedback Methodology
It is worth noting the methods of consumer products currently available. Backtracker, a product
from iKuba, who, based out of South African, developed a “low-energy bike radar, a device that
provides unparalleled situational awareness by giving the cyclist the speed and distance of
vehicles that are approaching from behind” (Garmin 2015 Their radar system focuses on distance
location and low visibility situations during the day. iKubu argues these situations are dangerous
for cyclists, and that determining the speed of an approaching vehicle is too difficult even with
perfect visibility. Therefore, a visual aid provides the right information, and leads to the solution
of these oncoming vehicles from the rear.
37
Feedback Justification
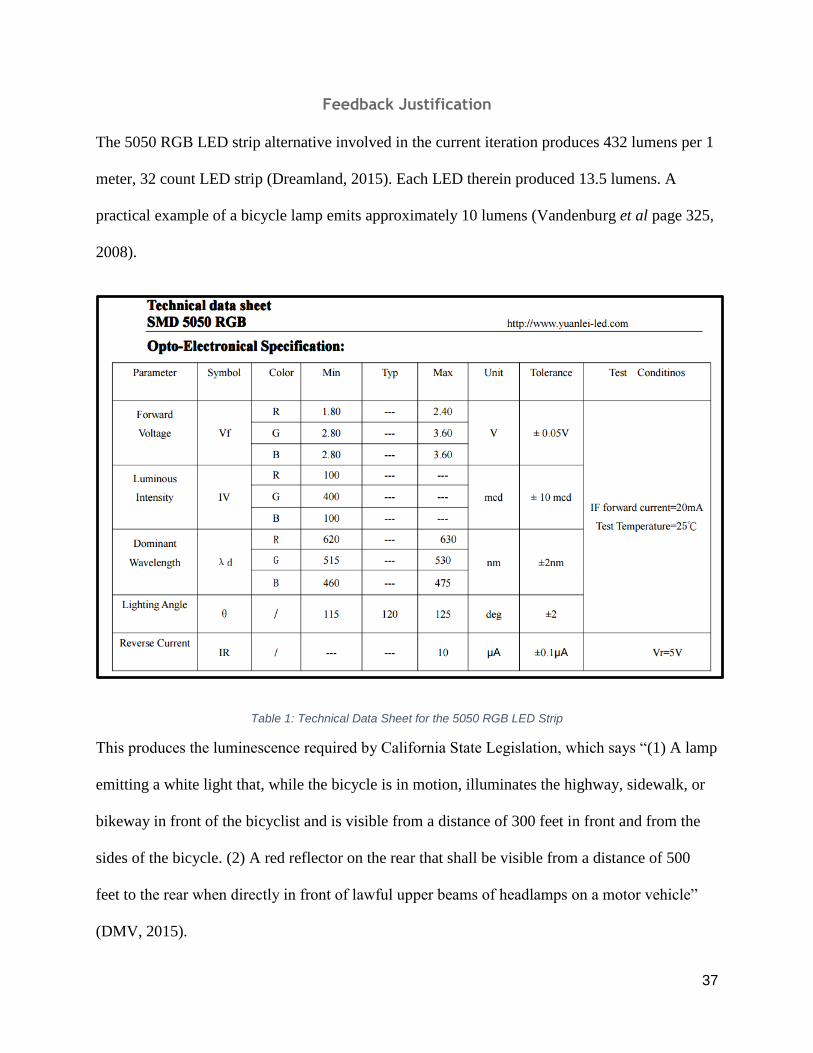
The 5050 RGB LED strip alternative involved in the current iteration produces 432 lumens per 1
meter, 32 count LED strip (Dreamland, 2015). Each LED therein produced 13.5 lumens. A
practical example of a bicycle lamp emits approximately 10 lumens (Vandenburg et al page 325,
2008).
Table 1: Technical Data Sheet for the 5050 RGB LED Strip
This produces the luminescence required by California State Legislation, which says “(1) A lamp
emitting a white light that, while the bicycle is in motion, illuminates the highway, sidewalk, or
bikeway in front of the bicyclist and is visible from a distance of 300 feet in front and from the
sides of the bicycle. (2) A red reflector on the rear that shall be visible from a distance of 500
feet to the rear when directly in front of lawful upper beams of headlamps on a motor vehicle”
(DMV, 2015).
38
Traffic control familiarity
The use of lights to control traffic has been a staple for roadways. The first traffic light in the
United States to feature what is called a “staggered” or “progressive” system. “General Electric
installed the first of these… light systems on prestigious Sixteenth Street in Washington D.C., in
1926” (McShane page 388, 1999). The established system of these color changing indicators
possibly produces an automatic association when circles of red, yellow, and green are seen. The
age of comparable traffic light technology should seem relevant to a citizen of the United States
who is at least 79 years old or younger, as it is what they have grown up with as a traffic
standard. This age group comprises 96.5% of the population in the United States. Citizens even
older than this would certainly recognize the three color traffic system as well. Traffic lights are
used worldwide, and therefore, the consideration of misunderstanding from non-US citizen can
be marginalized to an insignificantly low percentage. There is some evidence that, “Through our
evolutionary development as a species we have inherited reaction to color that we cannot
control” (Mahnke, page 87, 1997). Mahnke even states boldly, “Color is essential to life”. These
indicators legitimize the use of the current color scheme.
Methods
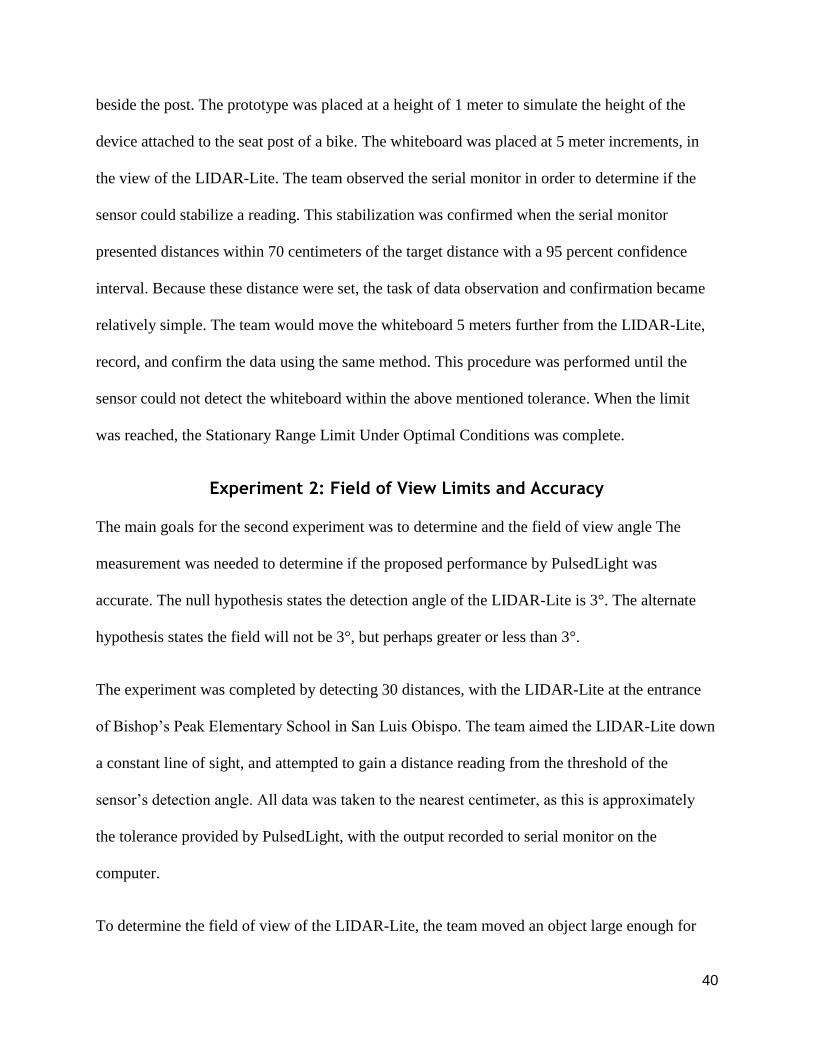
Experiment 1: Stationary Range Limit Under Optimal Conditions
The main goals for the first experiment was to determine the maximum range of detection of the
LIDAR-Lite, a PulsedLight product. The null hypothesis states the “Max Range Under Optimal
Conditions” is 40 meters. The alternate hypothesis states the range of detection will not be 40
meters, but perhaps greater or less than 40 meters. The experiment was completed by detecting
30 distances, with the Lidar-Lite at the entrance of Bishop’s Peak Elementary School in San Luis
Obispo, outside on a partly cloudy day with minimal wind. The team aimed the LIDAR-Lite
39
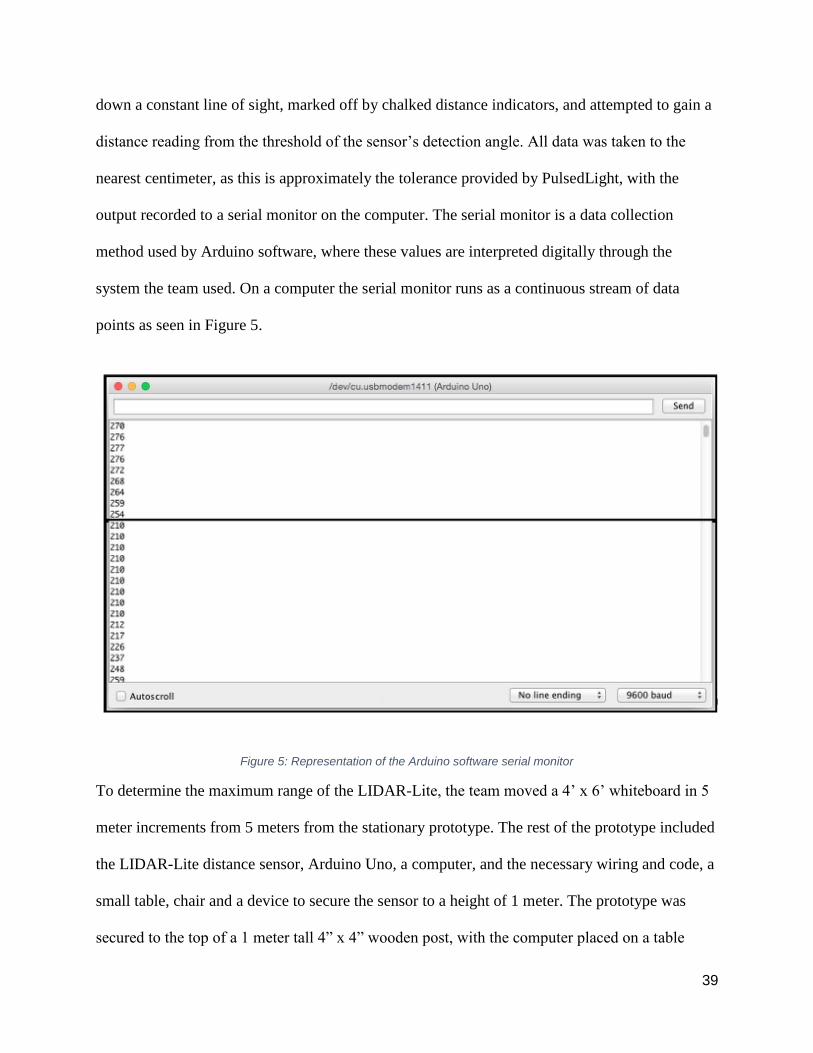
down a constant line of sight, marked off by chalked distance indicators, and attempted to gain a
distance reading from the threshold of the sensor’s detection angle. All data was taken to the
nearest centimeter, as this is approximately the tolerance provided by PulsedLight, with the
output recorded to a serial monitor on the computer. The serial monitor is a data collection
method used by Arduino software, where these values are interpreted digitally through the
system the team used. On a computer the serial monitor runs as a continuous stream of data
points as seen in Figure 5.
Figure 5: Representation of the Arduino software serial monitor
To determine the maximum range of the LIDAR-Lite, the team moved a 4’ x 6’ whiteboard in 5
meter increments from 5 meters from the stationary prototype. The rest of the prototype included
the LIDAR-Lite distance sensor, Arduino Uno, a computer, and the necessary wiring and code, a
small table, chair and a device to secure the sensor to a height of 1 meter. The prototype was
secured to the top of a 1 meter tall 4” x 4” wooden post, with the computer placed on a table
40
beside the post. The prototype was placed at a height of 1 meter to simulate the height of the
device attached to the seat post of a bike. The whiteboard was placed at 5 meter increments, in
the view of the LIDAR-Lite. The team observed the serial monitor in order to determine if the
sensor could stabilize a reading. This stabilization was confirmed when the serial monitor
presented distances within 70 centimeters of the target distance with a 95 percent confidence
interval. Because these distance were set, the task of data observation and confirmation became
relatively simple. The team would move the whiteboard 5 meters further from the LIDAR-Lite,
record, and confirm the data using the same method. This procedure was performed until the
sensor could not detect the whiteboard within the above mentioned tolerance. When the limit
was reached, the Stationary Range Limit Under Optimal Conditions was complete.
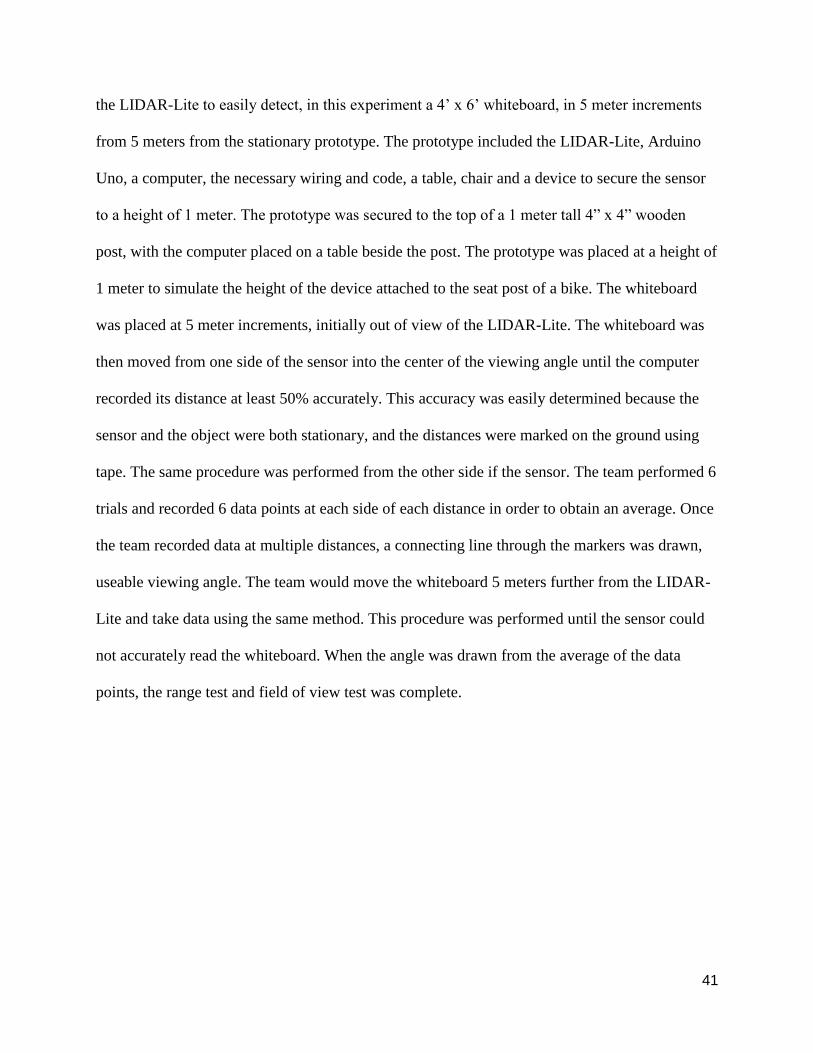
Experiment 2: Field of View Limits and Accuracy
The main goals for the second experiment was to determine and the field of view angle The
measurement was needed to determine if the proposed performance by PulsedLight was
accurate. The null hypothesis states the detection angle of the LIDAR-Lite is 3°. The alternate
hypothesis states the field will not be 3°, but perhaps greater or less than 3°.
The experiment was completed by detecting 30 distances, with the LIDAR-Lite at the entrance
of Bishop’s Peak Elementary School in San Luis Obispo. The team aimed the LIDAR-Lite down
a constant line of sight, and attempted to gain a distance reading from the threshold of the
sensor’s detection angle. All data was taken to the nearest centimeter, as this is approximately
the tolerance provided by PulsedLight, with the output recorded to serial monitor on the
computer.
To determine the field of view of the LIDAR-Lite, the team moved an object large enough for
41
the LIDAR-Lite to easily detect, in this experiment a 4’ x 6’ whiteboard, in 5 meter increments
from 5 meters from the stationary prototype. The prototype included the LIDAR-Lite, Arduino
Uno, a computer, the necessary wiring and code, a table, chair and a device to secure the sensor
to a height of 1 meter. The prototype was secured to the top of a 1 meter tall 4” x 4” wooden
post, with the computer placed on a table beside the post. The prototype was placed at a height of
1 meter to simulate the height of the device attached to the seat post of a bike. The whiteboard
was placed at 5 meter increments, initially out of view of the LIDAR-Lite. The whiteboard was
then moved from one side of the sensor into the center of the viewing angle until the computer
recorded its distance at least 50% accurately. This accuracy was easily determined because the
sensor and the object were both stationary, and the distances were marked on the ground using
tape. The same procedure was performed from the other side if the sensor. The team performed 6
trials and recorded 6 data points at each side of each distance in order to obtain an average. Once
the team recorded data at multiple distances, a connecting line through the markers was drawn,
useable viewing angle. The team would move the whiteboard 5 meters further from the LIDAR-
Lite and take data using the same method. This procedure was performed until the sensor could
not accurately read the whiteboard. When the angle was drawn from the average of the data
points, the range test and field of view test was complete.
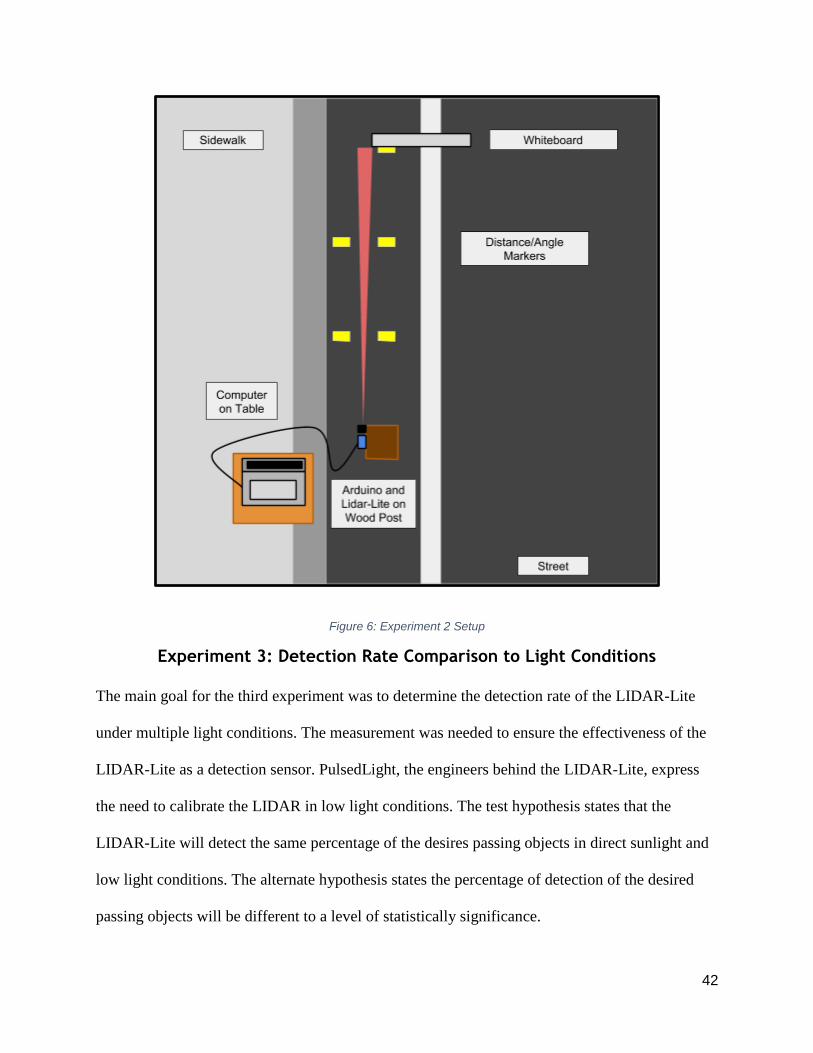
42
Figure 6: Experiment 2 Setup
Experiment 3: Detection Rate Comparison to Light Conditions
The main goal for the third experiment was to determine the detection rate of the LIDAR-Lite
under multiple light conditions. The measurement was needed to ensure the effectiveness of the
LIDAR-Lite as a detection sensor. PulsedLight, the engineers behind the LIDAR-Lite, express
the need to calibrate the LIDAR in low light conditions. The test hypothesis states that the
LIDAR-Lite will detect the same percentage of the desires passing objects in direct sunlight and
low light conditions. The alternate hypothesis states the percentage of detection of the desired
passing objects will be different to a level of statistically significance.
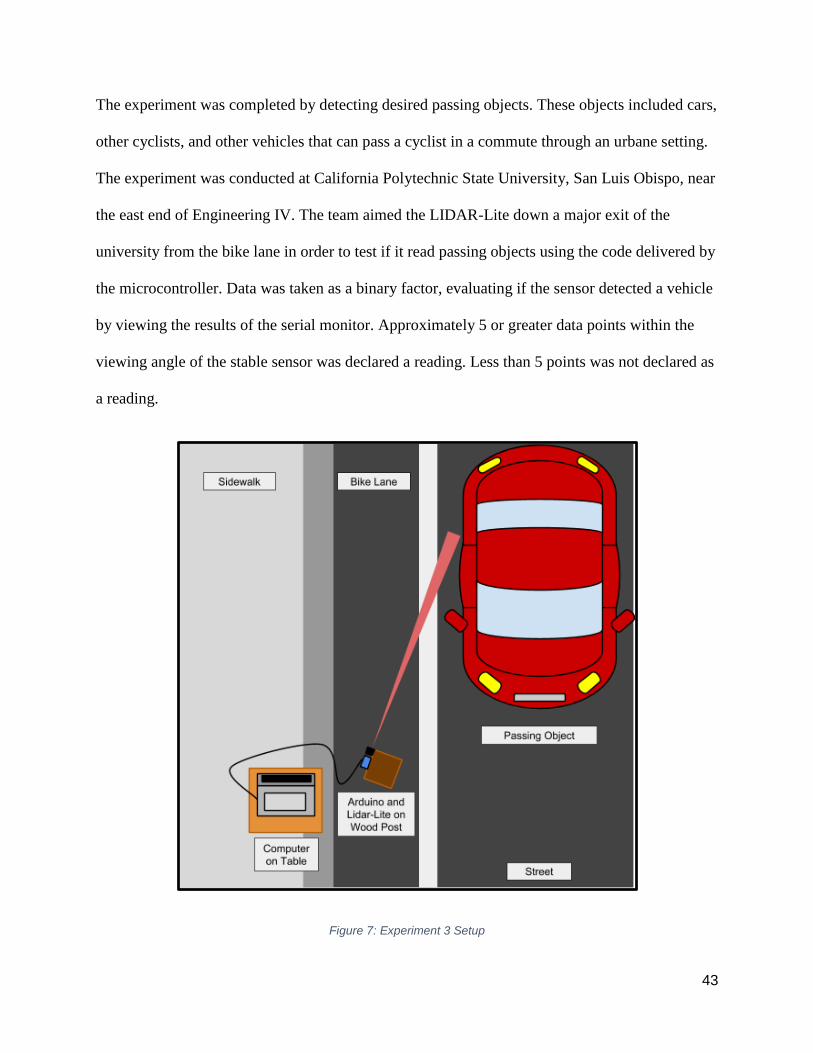
43
The experiment was completed by detecting desired passing objects. These objects included cars,
other cyclists, and other vehicles that can pass a cyclist in a commute through an urbane setting.
The experiment was conducted at California Polytechnic State University, San Luis Obispo, near
the east end of Engineering IV. The team aimed the LIDAR-Lite down a major exit of the
university from the bike lane in order to test if it read passing objects using the code delivered by
the microcontroller. Data was taken as a binary factor, evaluating if the sensor detected a vehicle
by viewing the results of the serial monitor. Approximately 5 or greater data points within the
viewing angle of the stable sensor was declared a reading. Less than 5 points was not declared as
a reading.
Figure 7: Experiment 3 Setup
44
As seen in Figure 7 setup included the LIDAR-Lite, Arduino Uno, a computer, and the necessary
wiring and code. The prototype was secured to the top of a 1 meter tall 4” x 4” wooden post,
with the computer placed on a table beside the post. The prototype was placed at a height of 1
meter to simulate the height of the device attached to the seat post. The serial monitor was started
on the computer in order to monitor the data sent from the LIDAR-Lite back to the Arduino.
Before the data collection began, initial readings were taken in order to establish a sense of
where a passing object should be detected. At time 0, the serial monitor read 0 cm, as expected,
as the sensor was set to a location beyond its accuracy range, beyond 45 meters, sending a null
value to the Arduino, interpreting the value as a 0 in the serial monitor. Once at least 50 objects
passed the LIDAR-Lite, the experiment was complete.
Future Development
The team feels the need to discuss possible development of the Firework Cycling Sensor in the
future if given the opportunity. This discussion can be found in Appendix B. The Firework is
treated as a consumer product, and so a flow process of its production may be useful. The flow
process creates a viable starting point for production planning and begins to develop control over
the entire system.
The team chose an iterative process of completing the proposed production planning. Appendix
B presents the benefits of a phantomized facility layout, specializing in Just in Time production
and control. The key metrics to note are the Net Present Worth of $349,842, a Return on
Investment of $429,200, and a Payback Period of 0.43 years. Upon completion of this aggregate
plan, the team has not only demonstrated the usefulness of production planning but the core
concept of continuous improvement.
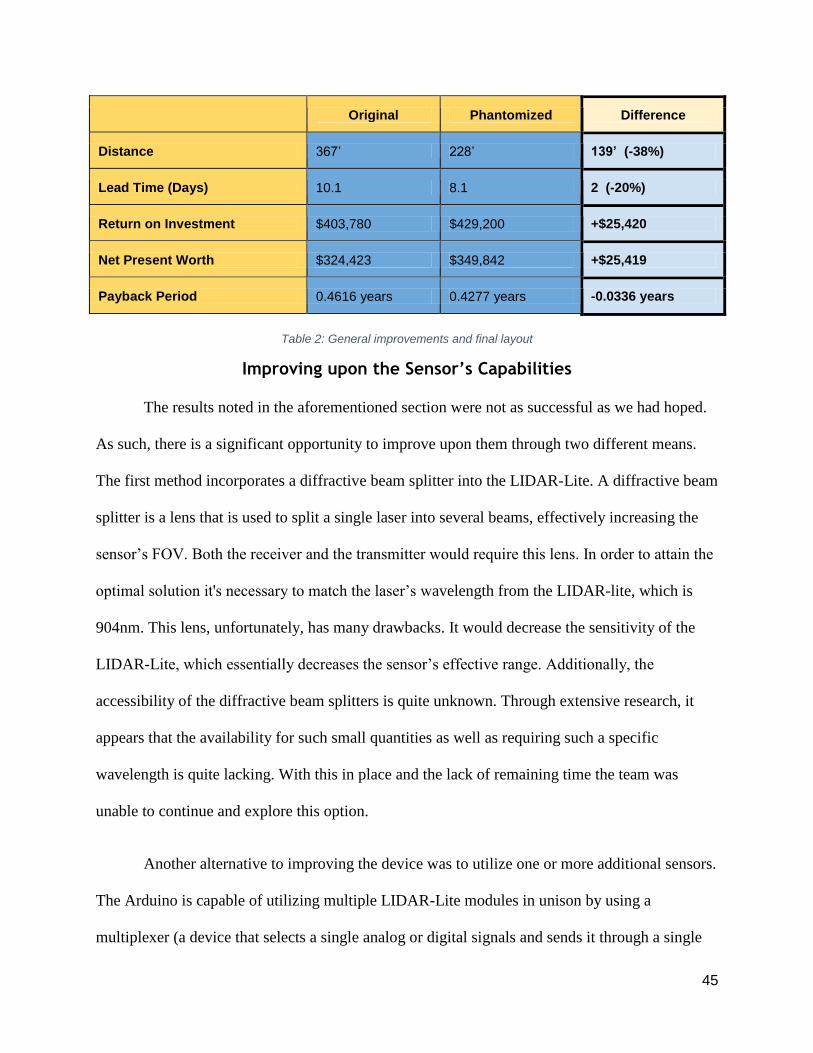
45
Original Phantomized Difference
Distance 367’ 228’ 139’ (-38%)
Lead Time (Days) 10.1 8.1 2 (-20%)
Return on Investment $403,780 $429,200 +$25,420
Net Present Worth $324,423 $349,842 +$25,419
Payback Period 0.4616 years 0.4277 years -0.0336 years
Table 2: General improvements and final layout
Improving upon the Sensor’s Capabilities
The results noted in the aforementioned section were not as successful as we had hoped.
As such, there is a significant opportunity to improve upon them through two different means.
The first method incorporates a diffractive beam splitter into the LIDAR-Lite. A diffractive beam
splitter is a lens that is used to split a single laser into several beams, effectively increasing the
sensor’s FOV. Both the receiver and the transmitter would require this lens. In order to attain the
optimal solution it's necessary to match the laser’s wavelength from the LIDAR-lite, which is
904nm. This lens, unfortunately, has many drawbacks. It would decrease the sensitivity of the
LIDAR-Lite, which essentially decreases the sensor’s effective range. Additionally, the
accessibility of the diffractive beam splitters is quite unknown. Through extensive research, it
appears that the availability for such small quantities as well as requiring such a specific
wavelength is quite lacking. With this in place and the lack of remaining time the team was
unable to continue and explore this option.
Another alternative to improving the device was to utilize one or more additional sensors.
The Arduino is capable of utilizing multiple LIDAR-Lite modules in unison by using a
multiplexer (a device that selects a single analog or digital signals and sends it through a single
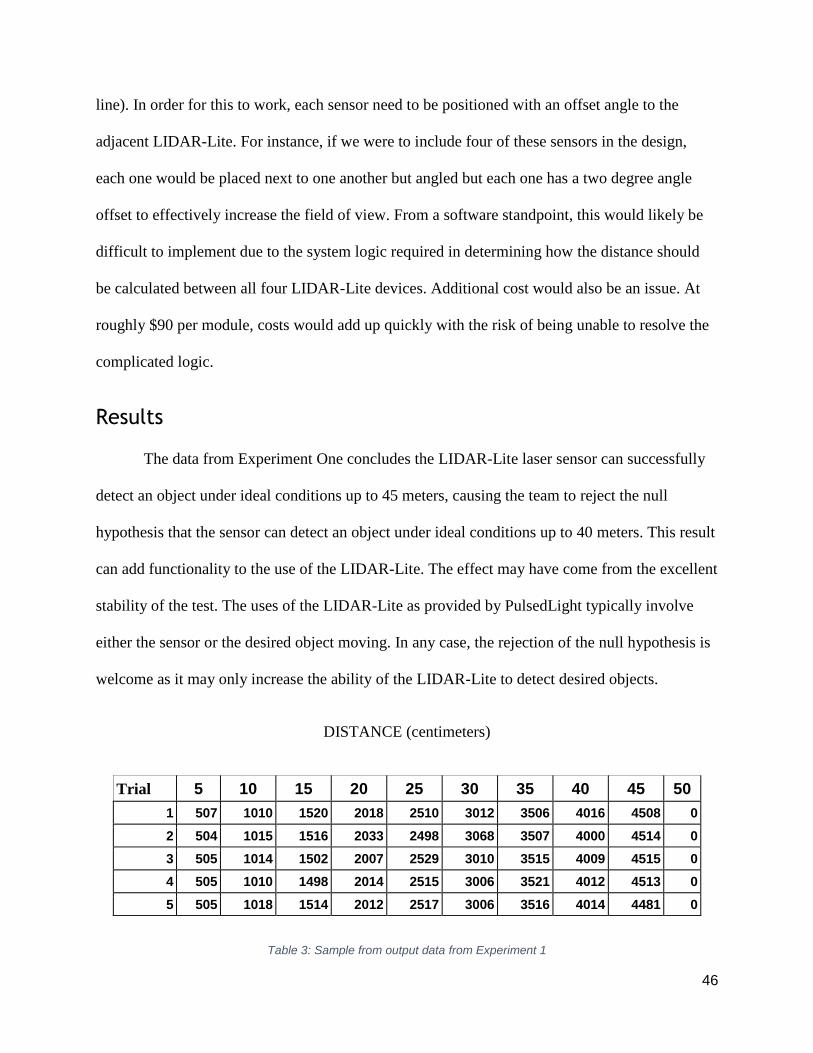
46
line). In order for this to work, each sensor need to be positioned with an offset angle to the
adjacent LIDAR-Lite. For instance, if we were to include four of these sensors in the design,
each one would be placed next to one another but angled but each one has a two degree angle
offset to effectively increase the field of view. From a software standpoint, this would likely be
difficult to implement due to the system logic required in determining how the distance should
be calculated between all four LIDAR-Lite devices. Additional cost would also be an issue. At
roughly $90 per module, costs would add up quickly with the risk of being unable to resolve the
complicated logic.
Results
The data from Experiment One concludes the LIDAR-Lite laser sensor can successfully
detect an object under ideal conditions up to 45 meters, causing the team to reject the null
hypothesis that the sensor can detect an object under ideal conditions up to 40 meters. This result
can add functionality to the use of the LIDAR-Lite. The effect may have come from the excellent
stability of the test. The uses of the LIDAR-Lite as provided by PulsedLight typically involve
either the sensor or the desired object moving. In any case, the rejection of the null hypothesis is
welcome as it may only increase the ability of the LIDAR-Lite to detect desired objects.
DISTANCE (centimeters)
Trial 5 10 15 20 25 30 35 40 45 50
1 507 1010 1520 2018 2510 3012 3506 4016 4508 0
2 504 1015 1516 2033 2498 3068 3507 4000 4514 0
3 505 1014 1502 2007 2529 3010 3515 4009 4515 0
4 505 1010 1498 2014 2515 3006 3521 4012 4513 0
5 505 1018 1514 2012 2517 3006 3516 4014 4481 0
Table 3: Sample from output data from Experiment 1
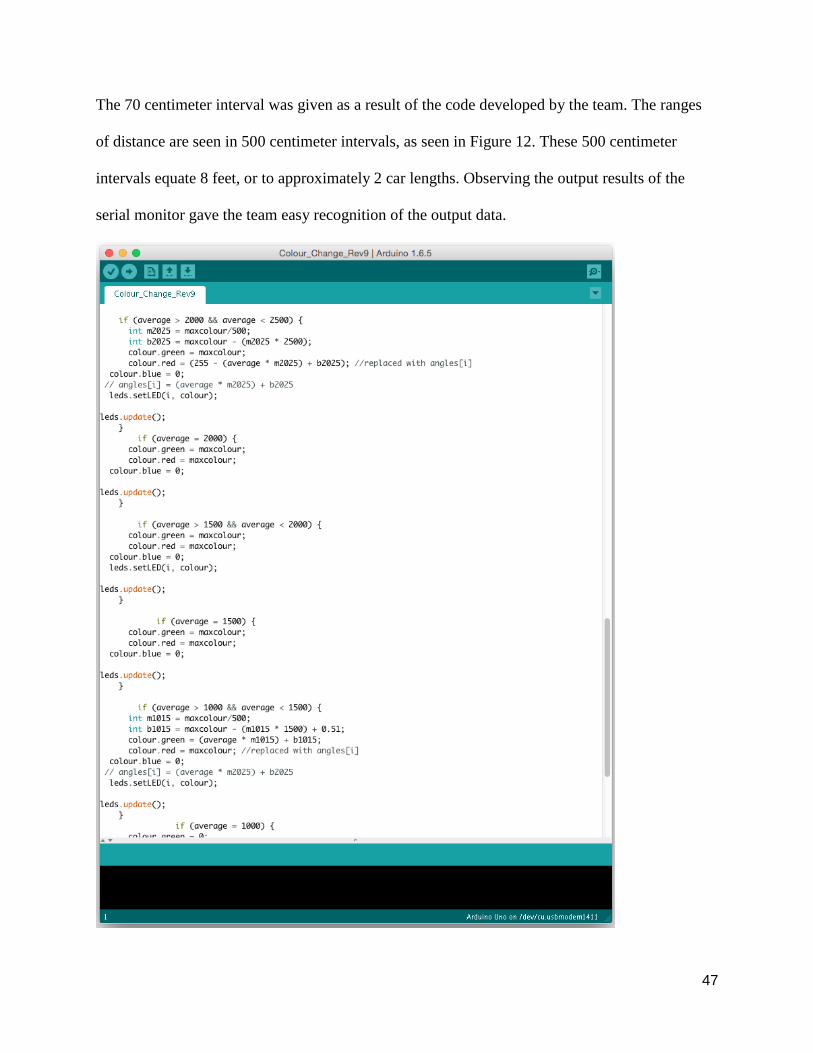
47
The 70 centimeter interval was given as a result of the code developed by the team. The ranges
of distance are seen in 500 centimeter intervals, as seen in Figure 12. These 500 centimeter
intervals equate 8 feet, or to approximately 2 car lengths. Observing the output results of the
serial monitor gave the team easy recognition of the output data.
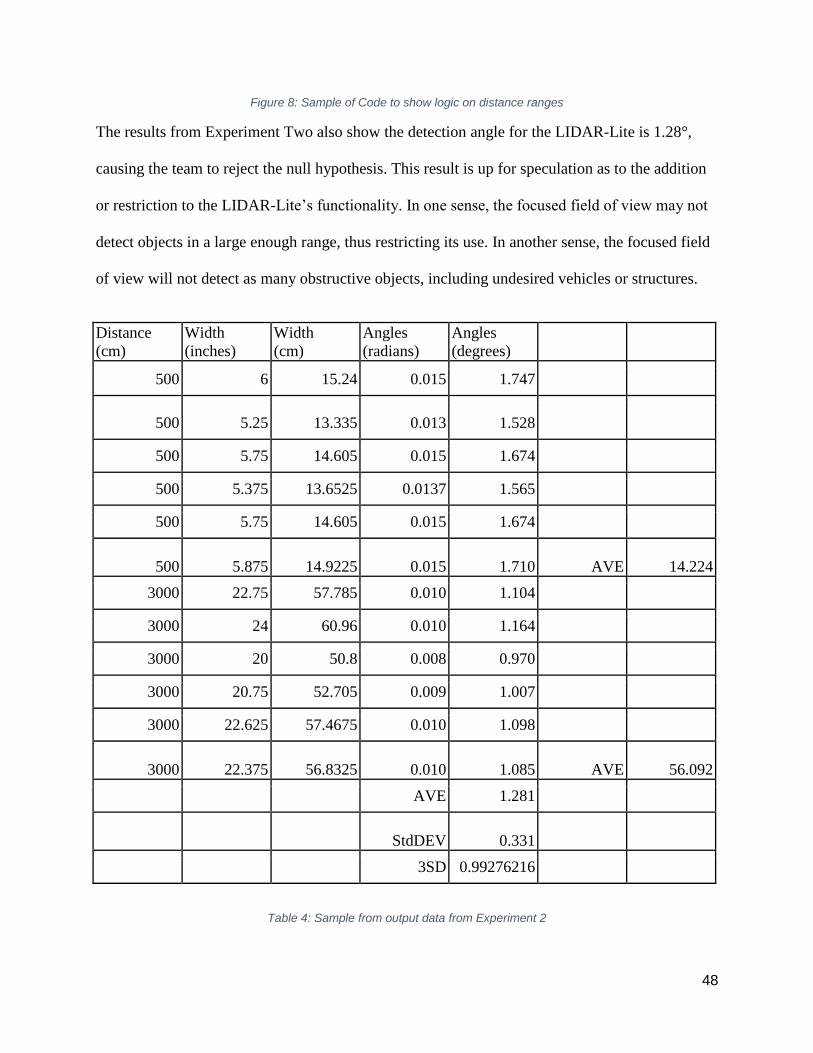
48
Figure 8: Sample of Code to show logic on distance ranges
The results from Experiment Two also show the detection angle for the LIDAR-Lite is 1.28°,
causing the team to reject the null hypothesis. This result is up for speculation as to the addition
or restriction to the LIDAR-Lite’s functionality. In one sense, the focused field of view may not
detect objects in a large enough range, thus restricting its use. In another sense, the focused field
of view will not detect as many obstructive objects, including undesired vehicles or structures.
Distance
(cm)
Width
(inches)
Width
(cm)
Angles
(radians)
Angles
(degrees)
500 6 15.24 0.015 1.747
500 5.25 13.335 0.013 1.528
500 5.75 14.605 0.015 1.674
500 5.375 13.6525 0.0137 1.565
500 5.75 14.605 0.015 1.674
500 5.875 14.9225 0.015 1.710 AVE 14.224
3000 22.75 57.785 0.010 1.104
3000 24 60.96 0.010 1.164
3000 20 50.8 0.008 0.970
3000 20.75 52.705 0.009 1.007
3000 22.625 57.4675 0.010 1.098
3000 22.375 56.8325 0.010 1.085 AVE 56.092
AVE 1.281
StdDEV 0.331
3SD 0.99276216
Table 4: Sample from output data from Experiment 2
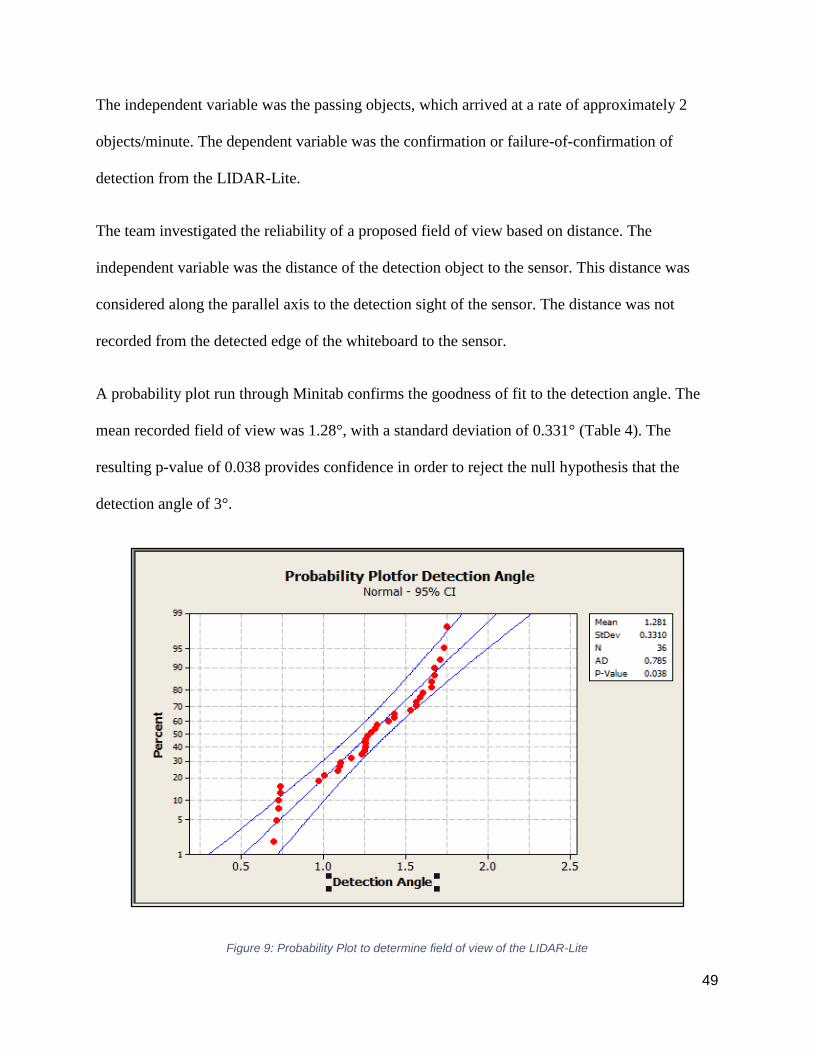
49
The independent variable was the passing objects, which arrived at a rate of approximately 2
objects/minute. The dependent variable was the confirmation or failure-of-confirmation of
detection from the LIDAR-Lite.
The team investigated the reliability of a proposed field of view based on distance. The
independent variable was the distance of the detection object to the sensor. This distance was
considered along the parallel axis to the detection sight of the sensor. The distance was not
recorded from the detected edge of the whiteboard to the sensor.
A probability plot run through Minitab confirms the goodness of fit to the detection angle. The
mean recorded field of view was 1.28°, with a standard deviation of 0.331° (Table 4). The
resulting p-value of 0.038 provides confidence in order to reject the null hypothesis that the
detection angle of 3°.
Figure 9: Probability Plot to determine field of view of the LIDAR-Lite
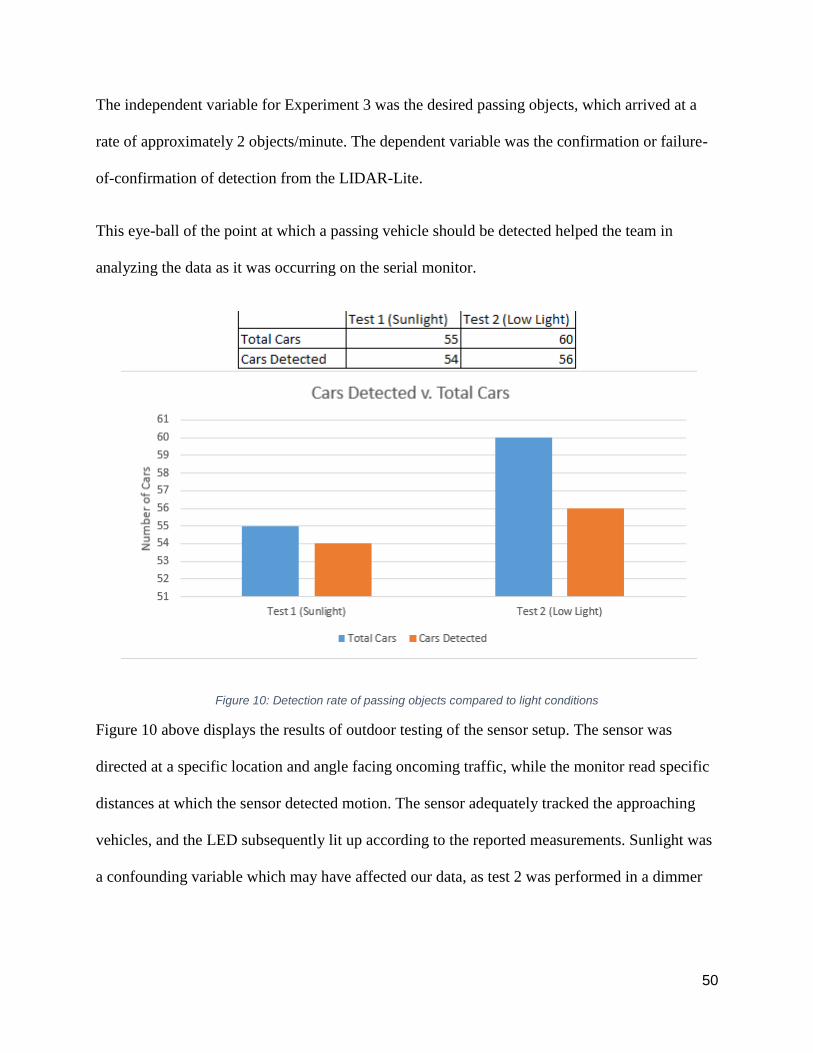
50
The independent variable for Experiment 3 was the desired passing objects, which arrived at a
rate of approximately 2 objects/minute. The dependent variable was the confirmation or failure-
of-confirmation of detection from the LIDAR-Lite.
This eye-ball of the point at which a passing vehicle should be detected helped the team in
analyzing the data as it was occurring on the serial monitor.
Figure 10: Detection rate of passing objects compared to light conditions
Figure 10 above displays the results of outdoor testing of the sensor setup. The sensor was
directed at a specific location and angle facing oncoming traffic, while the monitor read specific
distances at which the sensor detected motion. The sensor adequately tracked the approaching
vehicles, and the LED subsequently lit up according to the reported measurements. Sunlight was
a confounding variable which may have affected our data, as test 2 was performed in a dimmer
51
setting. In summary, in light conditions, the sensor detected 98% of all cars, and under dim
lighting, 93%.
Based on the three tests performed with the LIDAR prototype, the team concluded that our
device did not meet the initial requirements. While the accuracies found in Test 3 were
promising, the experimental field of view angle was too small to effectively monitor the blind
spot of the cyclist. In order to increase the accuracy of the prototype, the field of view angle shall
be increased by testing with a second LIDAR-Lite or a diffractive beam splitter.
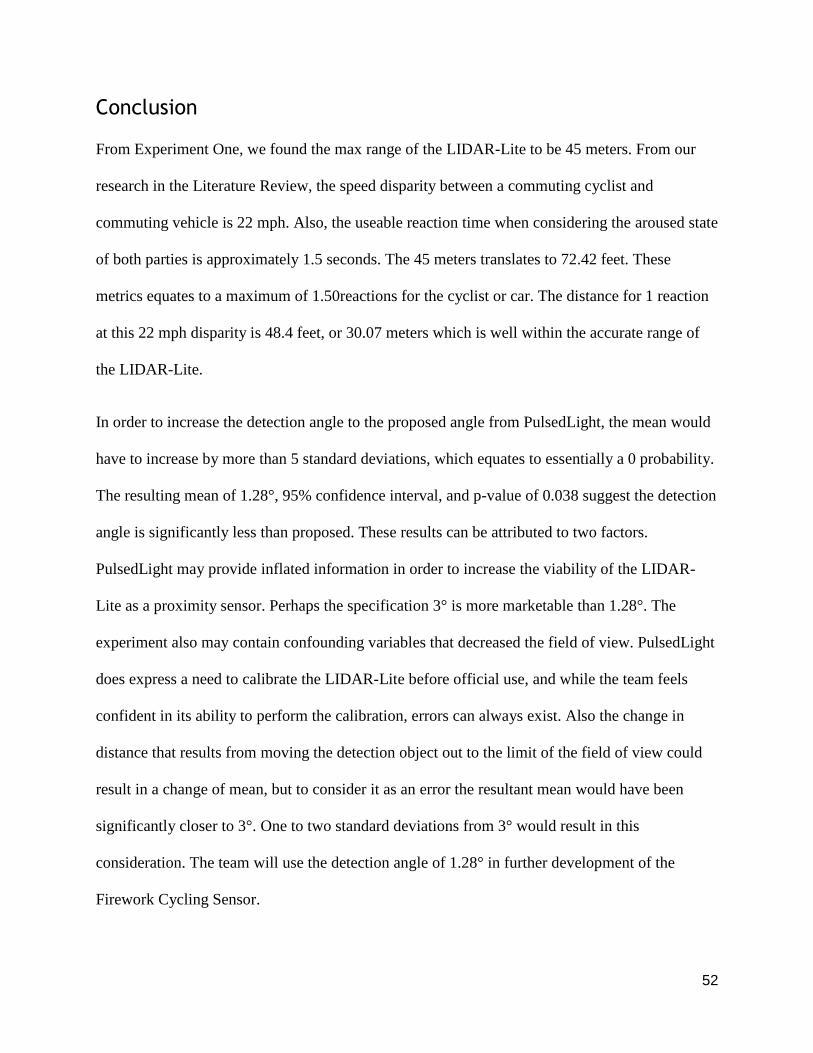
52
Conclusion
From Experiment One, we found the max range of the LIDAR-Lite to be 45 meters. From our
research in the Literature Review, the speed disparity between a commuting cyclist and
commuting vehicle is 22 mph. Also, the useable reaction time when considering the aroused state
of both parties is approximately 1.5 seconds. The 45 meters translates to 72.42 feet. These
metrics equates to a maximum of 1.50reactions for the cyclist or car. The distance for 1 reaction
at this 22 mph disparity is 48.4 feet, or 30.07 meters which is well within the accurate range of
the LIDAR-Lite.
In order to increase the detection angle to the proposed angle from PulsedLight, the mean would
have to increase by more than 5 standard deviations, which equates to essentially a 0 probability.
The resulting mean of 1.28°, 95% confidence interval, and p-value of 0.038 suggest the detection
angle is significantly less than proposed. These results can be attributed to two factors.
PulsedLight may provide inflated information in order to increase the viability of the LIDAR-
Lite as a proximity sensor. Perhaps the specification 3° is more marketable than 1.28°. The
experiment also may contain confounding variables that decreased the field of view. PulsedLight
does express a need to calibrate the LIDAR-Lite before official use, and while the team feels
confident in its ability to perform the calibration, errors can always exist. Also the change in
distance that results from moving the detection object out to the limit of the field of view could
result in a change of mean, but to consider it as an error the resultant mean would have been
significantly closer to 3°. One to two standard deviations from 3° would result in this
consideration. The team will use the detection angle of 1.28° in further development of the
Firework Cycling Sensor.
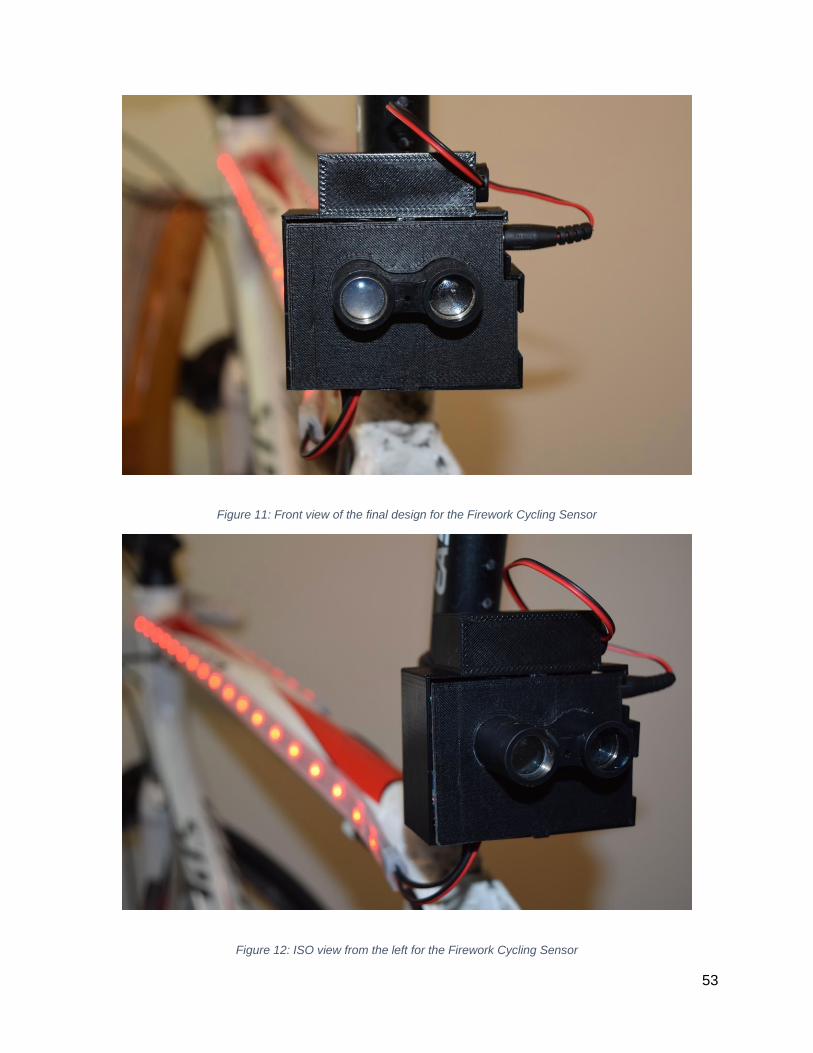
53
Figure 11: Front view of the final design for the Firework Cycling Sensor
Figure 12: ISO view from the left for the Firework Cycling Sensor
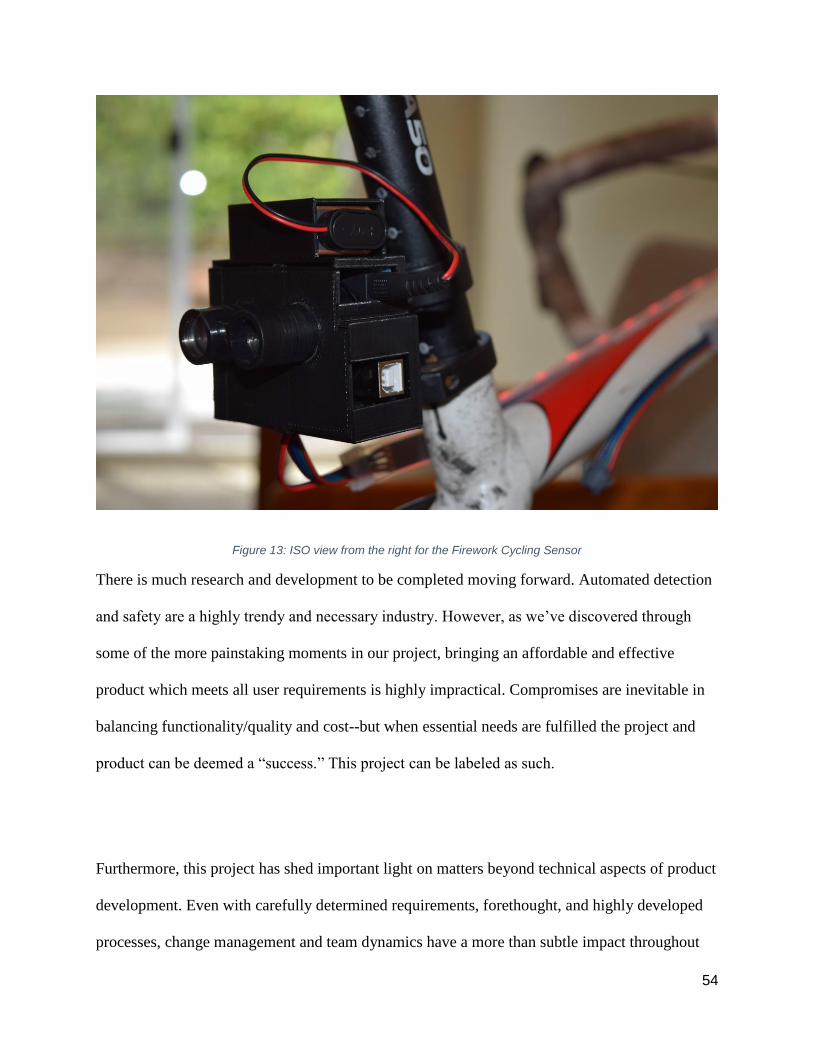
54
Figure 13: ISO view from the right for the Firework Cycling Sensor
There is much research and development to be completed moving forward. Automated detection
and safety are a highly trendy and necessary industry. However, as we’ve discovered through
some of the more painstaking moments in our project, bringing an affordable and effective
product which meets all user requirements is highly impractical. Compromises are inevitable in
balancing functionality/quality and cost--but when essential needs are fulfilled the project and
product can be deemed a “success.” This project can be labeled as such.
Furthermore, this project has shed important light on matters beyond technical aspects of product
development. Even with carefully determined requirements, forethought, and highly developed
processes, change management and team dynamics have a more than subtle impact throughout
55
the development process and the end product. Having initially been inspired by the open-
workspace and inspiration-based rapid prototyping approach, this project threatened to derail
each instance of rigidity and structure, as required by, for instance, the testing phase. As
previously recommended, balancing creativity with structure seems to be key not just for
successful product development, but also in the broader realm of project and people
management. This project certainly warrants further research into discovering new insights on
project management and team dynamics.
Recommendations
Systems-Level Requirements
In creating complex systems, it is a common mistake for a project team to refrain from
creating objective, systems-level requirements. Systems-level requirements are technical
explanations of the user requirements. While the user in the case of the cycling sensor would
want an accurate, inexpensive, lightweight, and easy-to-use device, it is up to the engineers to
create explicit requirements. Because terms like “accurate” and “inexpensive” are subjective,
explicit numbers shall be created to give the design team objective values to refer to during the
design process. Instead of creating objective parameters to test against and work toward, we all
had different ideas of an effective field of view for our sensor and how it should pick up cars.
Because the team was inexperienced in designing and synthesizing complex systems, it was
difficult to nail down explicit values to work toward after the initial testing phase. Examples of
these parameters are the field of view of our sensor, the range of our sensor, and the percentage
of cars detected on both stationary and moving bicycles. While these parameters were important
to our design process and we considered them throughout the year, we did not have explicit
values to refer to during our design and test process. This lack of explicit requirements created
56
confusion for the team about the success of the testing. When the test for the field of view angle
yielded a value much more narrow than expected, the team scrambled to add a new component
that would increase the field of view angle of the sensor system. At the advice of Kurt and Liz,
the team decided to respect the fast approaching deadline and finished the development process
with the narrow field of view angle. If the requirements had been defined early in the design
process, the team may have had time to explore using multiple LIDAR Lite sensors to maximize
accuracy and field of view.
Passing or Veering Vehicles
We did not consider if there should be different feedback to the cyclist for passing cars
and cars that are veering into the bike lane. While this would have taken extensive coding logic
in Arduino to identify the possibility of a car moving too close to a cyclist, we did not carry this
need through the design process. Although some cars pass cyclists at too close a distance, the
sensor would have been more effective if it alerted the rider of a car passing at a safe distance.
This option would likely need multiple sensors and a more complex code.
Completing Tasks and Working on Tasks
While meetings can be effective for working of the project, completing tasks are the key
to finishing the project in a timely manner. Though the team met to work about three times per
week, meeting for completion could have given the team small victories to boost morale. This
can be accomplished by splitting up tasks into subtasks to ensure completion in each three hour
session.

57
Milestones
Because this project allowed each team to create its own schedule, it was important for
the team to set its own milestones and hold the team to completing these tasks. With this project,
tasks often got close to completion by the projected date and then were completed in the next
week. While mistakes can happen and tasks can get pushed back, extending tasks for an extra
week can get confusing and stressful for the team.
Balancing Collaboration and Delegation
Because of the complexity of this project, collaboration was key to making sound design
decisions. Meetings were focused on communicating design options and testing prototypes.
Unfortunately, meetings were not always convenient and the project would get left alone for a
week at a time. This could have been solved with delegation of tasks between meetings.
Scheduling Fun Activities
Because senior project can become stressful and task conflicts can happen, it is important
to schedule fun activities to take the team’s mind off the project. Play time is important at all
ages to improve morale in group situations. The team used bowling and video games to keep the
mood light during stressful times in the project.
58
Bibliography
Alexander, F., Maiden, Neil, (2005). “Scenarios, Stories, Use Cases: Through the Systems
Development Life Cycle.” John Wiley and Sons, 5-36. Print.
Anathasiou, Thanos, Debas, H., Darzi, Ara, (2010). “Key Topics Surgical Research
Methodology.” Springer Science & Business Media, 134-157. Print.
Blanchard, Benjamin S. (2012). “System Engineering Management.” John Wiley & Sons, New
Jersey, et al.
Bini, Rodrigo R., and Felipe P. Carpes. "Non-traumatic Injuries in Cycling." Biomechanics of
Cycling.
Brown, Tim. “Change By Design.” N.p.: HarperBusiness, 2009. Print.
Christensen, Clayton M., and Michael E. Raynor. “The Innovator's Solution.” N.p.: Harvard
Business School Publishing Company, 2003. Print.
Edmondson, Amy C., (2012). “Teaming: How Organizations Learn, Innovate, and Compete in
the Knowledge Economy.” San Francisco: Jossey-Bass, 2012. Print.
Forester, John, (1994). “Bicycle Transportation: A Handbook for Cycling.” MIT Press, Boston,
Massachusetts, 49-134. Print.
Green, James M., (2001). “Bicycle Accident Reconstruction for the Forensic Engineer.”
Trafford Publishing, 164-168. Print.

59
Green, Marc. (2013). “Forensic Vision.” Laywers and Judges Publishing Company, Inc., 88-95.
Print.
Hogan, R., Curphy, G. J., & Hogan, J. (1994). “What We Know about Leadership.” American
Psychologist, 49(6), 493-504.
Hurst, Robert, (2014). “Art of Cycling: Staying Safe on Urban Streets.” Rowman & Littlefield,
163-173.
Johnson, Marilyn, Charlton, Judith, Oxley, Jennifer, Newstead, Stuart, (2010). “Annual
Advancement of Automotive Medicine.” Association for the Advancement of Automotive
Medicine, Bethesda, Maryland, 54, 275-283.
Kosinski, Robert J. (2013). “A Literature REview on Reaction Time.” Clemson University
Publishing, Clemson, North Carolina, et al. Print.
League of American Bicyclists. "Analysis of Bicycling in American Cities." 2013 American
Community Survey Data Report (2013).
Millon, Theodore, Lerner, Melvin J., Weiner, Irving B., (2003). “Handbook of Psychology,
Personality and Social Psychology.” John Wiley and Sons, New Jersey, (427-431). Print.
Räsänen M, Summala H., (1998). “Attention and expectation problems in bicycle-car collisions:
an in-depth study.” Accident Analysis & Prevention, 30: 657–666.
Rogers, Carl R., & Roethlisberger, F. J. (1991). “Barriers and Gateways to Communication.”
Harvard Business Review, 91610, 104-111.
60
Sage, Andrew P. (2011). “Handbook of System Engineering and Management.” John Wiley &
Sons, New Jersey, 35-47.
Smaldone, Stephen, Cheatan Tonde, Vancheswaran K. Ananthanarayanan, Ahmed Elgammal,
and Liviu Iftode. "Improving Bicycle Safety through Automated Real-Time Vehicle Detection."
(2010)
Tranter, Paul J. (2004). “Effective Speeds: Car Costs are Slowing Us Down” Australian
Greenhouse Office, Canberra, Australia, 1-15. Print.
Warwick, K., (1996). “An Introduction to Control Systems.” World Scientific, 3-8. Print.
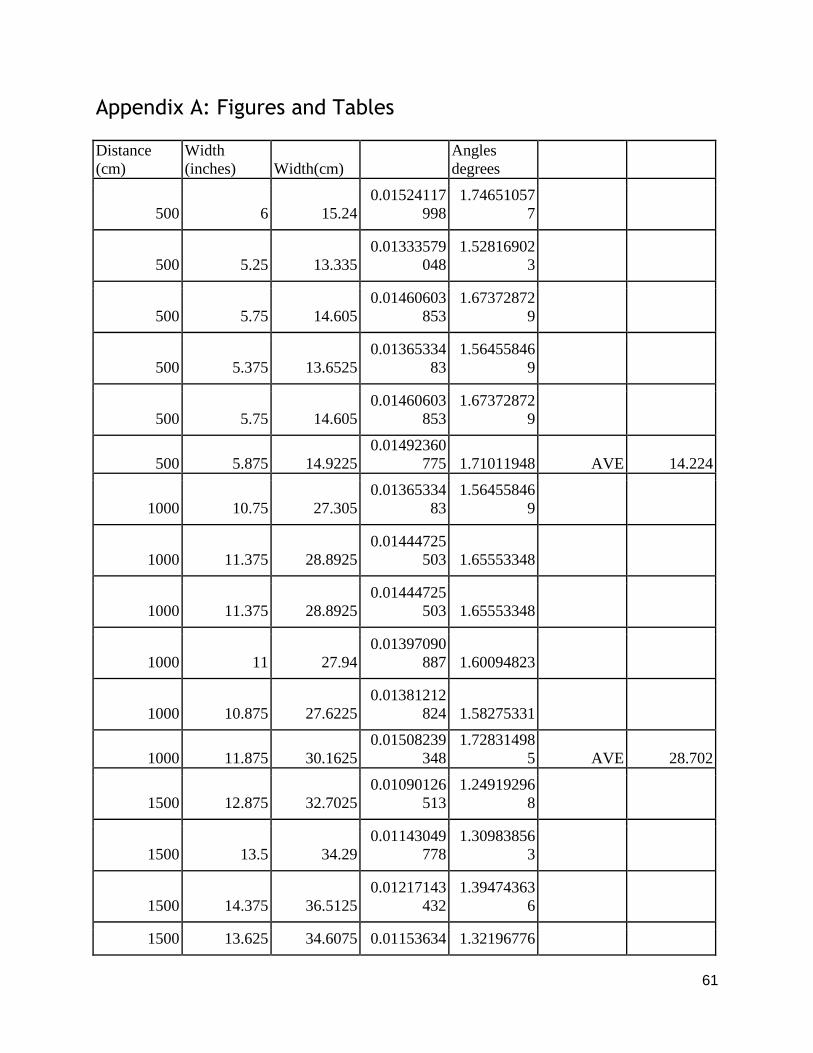
61
Appendix A: Figures and Tables
Distance
(cm)
Width
(inches) Width(cm)
Angles
degrees
500 6 15.24
0.01524117
998
1.74651057
7
500 5.25 13.335
0.01333579
048
1.52816902
3
500 5.75 14.605
0.01460603
853
1.67372872
9
500 5.375 13.6525
0.01365334
83
1.56455846
9
500 5.75 14.605
0.01460603
853
1.67372872
9
500 5.875 14.9225
0.01492360
775 1.71011948 AVE 14.224
1000 10.75 27.305
0.01365334
83
1.56455846
9
1000 11.375 28.8925
0.01444725
503 1.65553348
1000 11.375 28.8925
0.01444725
503 1.65553348
1000 11 27.94
0.01397090
887 1.60094823
1000 10.875 27.6225
0.01381212
824 1.58275331
1000 11.875 30.1625
0.01508239
348
1.72831498
5 AVE 28.702
1500 12.875 32.7025
0.01090126
513
1.24919296
8
1500 13.5 34.29
0.01143049
778
1.30983856
3
1500 14.375 36.5125
0.01217143
432
1.39474363
6
1500 13.625 34.6075 0.01153634 1.32196776
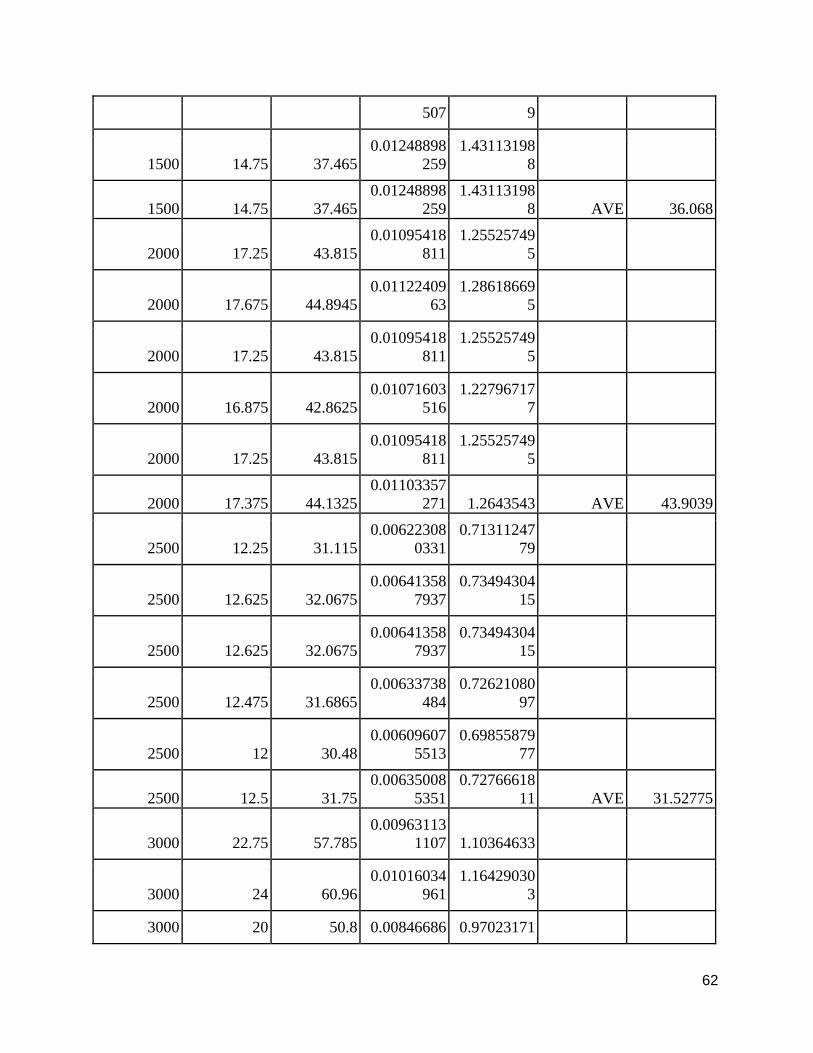
62
507 9
1500 14.75 37.465
0.01248898
259
1.43113198
8
1500 14.75 37.465
0.01248898
259
1.43113198
8 AVE 36.068
2000 17.25 43.815
0.01095418
811
1.25525749
5
2000 17.675 44.8945
0.01122409
63
1.28618669
5
2000 17.25 43.815
0.01095418
811
1.25525749
5
2000 16.875 42.8625
0.01071603
516
1.22796717
7
2000 17.25 43.815
0.01095418
811
1.25525749
5
2000 17.375 44.1325
0.01103357
271 1.2643543 AVE 43.9039
2500 12.25 31.115
0.00622308
0331
0.71311247
79
2500 12.625 32.0675
0.00641358
7937
0.73494304
15
2500 12.625 32.0675
0.00641358
7937
0.73494304
15
2500 12.475 31.6865
0.00633738
484
0.72621080
97
2500 12 30.48
0.00609607
5513
0.69855879
77
2500 12.5 31.75
0.00635008
5351
0.72766618
11 AVE 31.52775
3000 22.75 57.785
0.00963113
1107 1.10364633
3000 24 60.96
0.01016034
961
1.16429030
3
3000 20 50.8 0.00846686 0.97023171
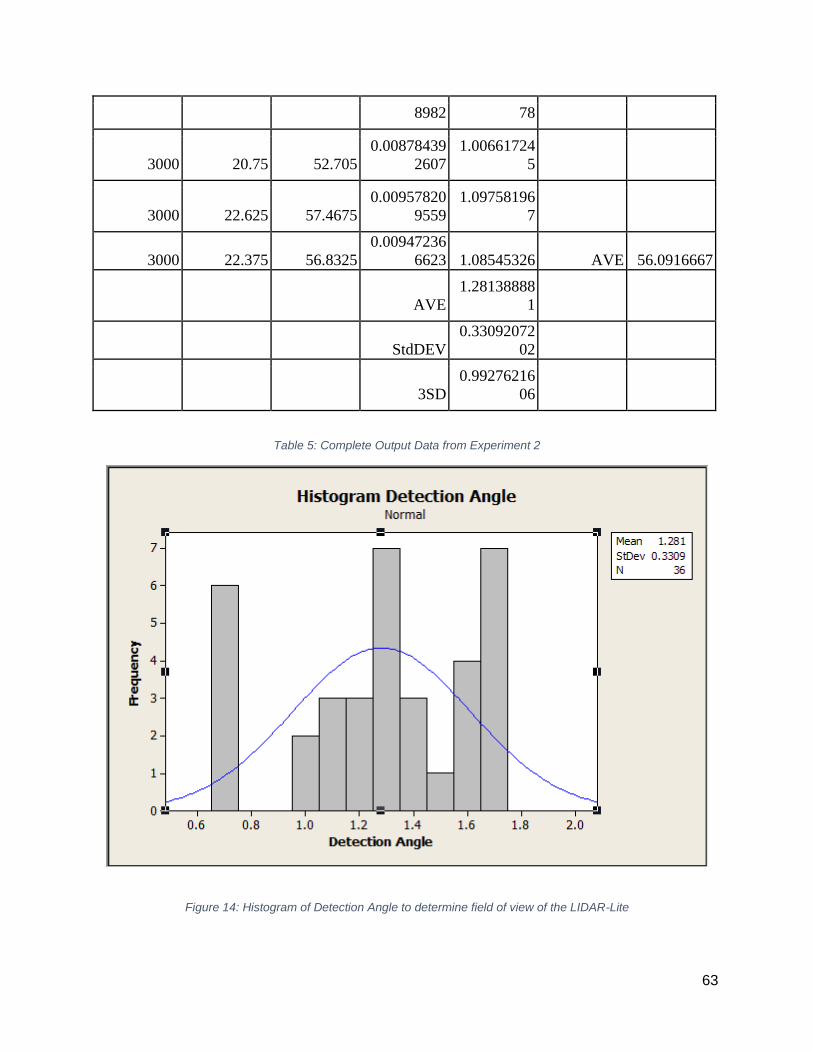
63
8982 78
3000 20.75 52.705
0.00878439
2607
1.00661724
5
3000 22.625 57.4675
0.00957820
9559
1.09758196
7
3000 22.375 56.8325
0.00947236
6623 1.08545326 AVE 56.0916667
AVE
1.28138888
1
StdDEV
0.33092072
02
3SD
0.99276216
06
Table 5: Complete Output Data from Experiment 2
Figure 14: Histogram of Detection Angle to determine field of view of the LIDAR-Lite
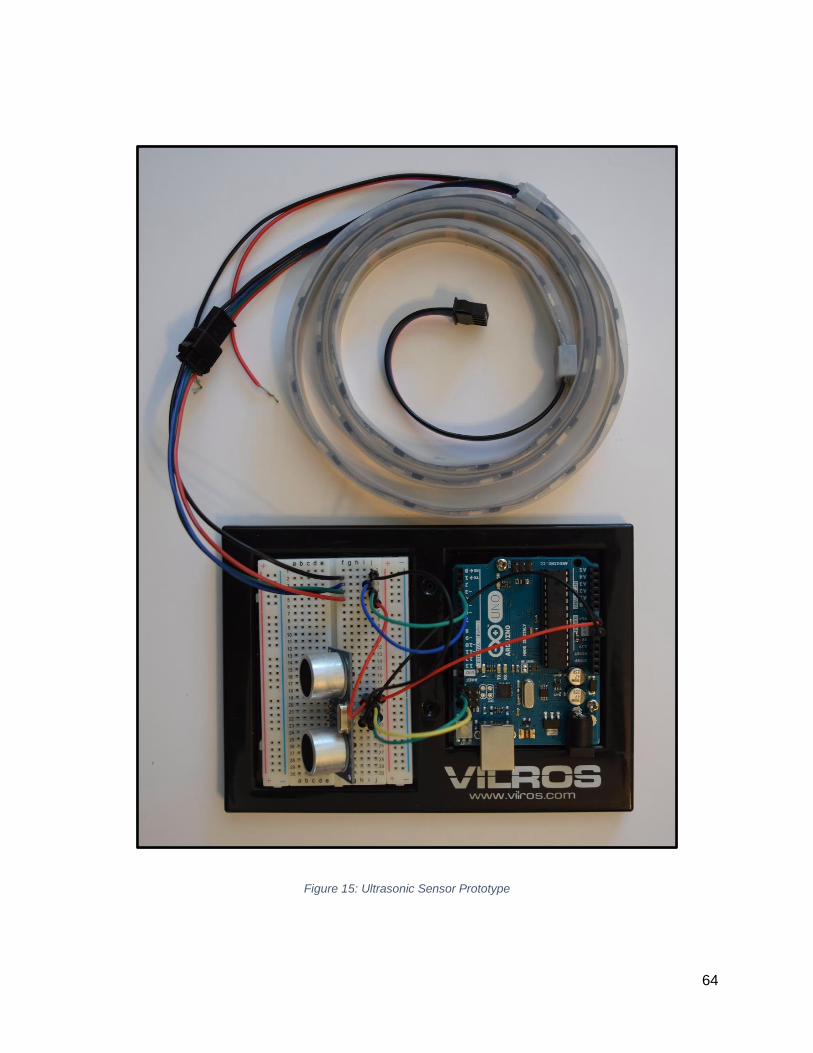
64
Figure 15: Ultrasonic Sensor Prototype
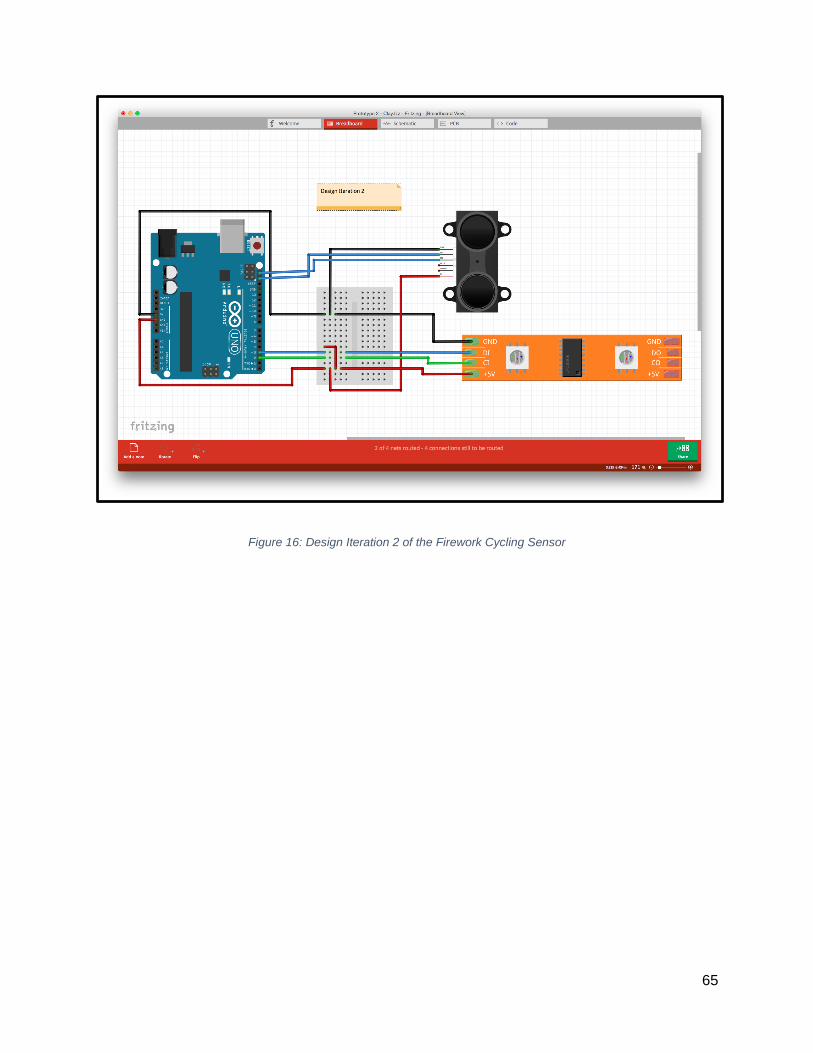
65
Figure 16: Design Iteration 2 of the Firework Cycling Sensor
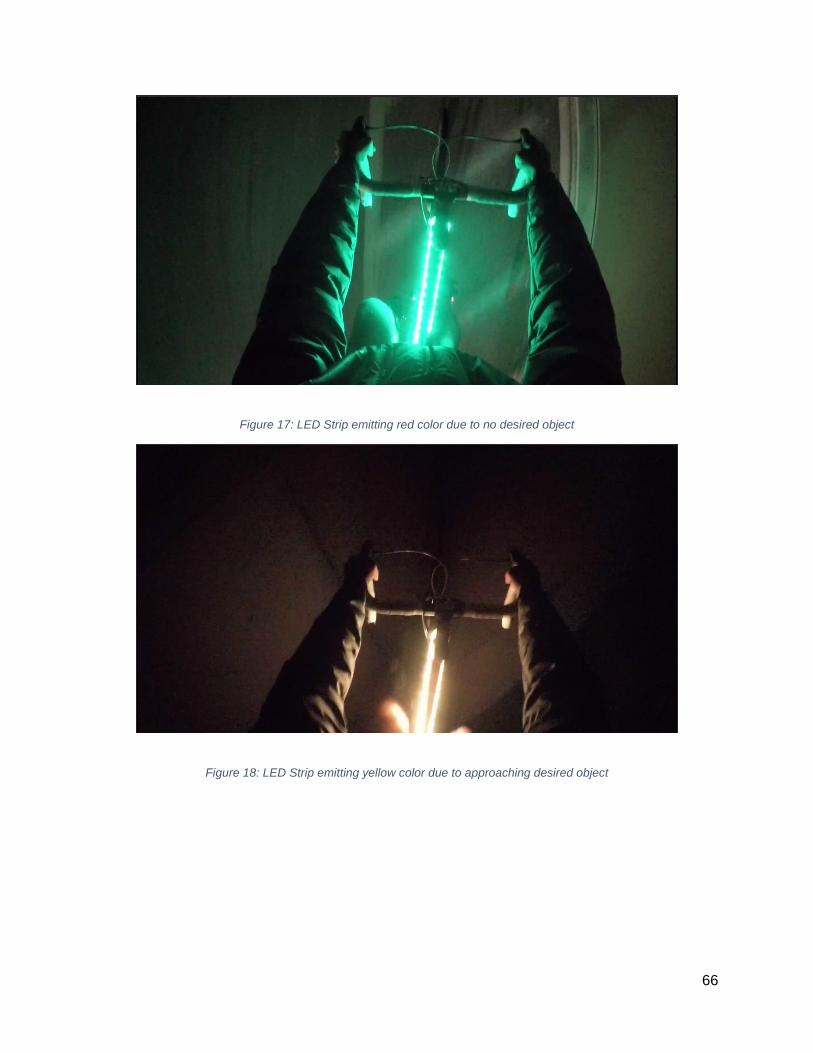
66
Figure 17: LED Strip emitting red color due to no desired object
Figure 18: LED Strip emitting yellow color due to approaching desired object
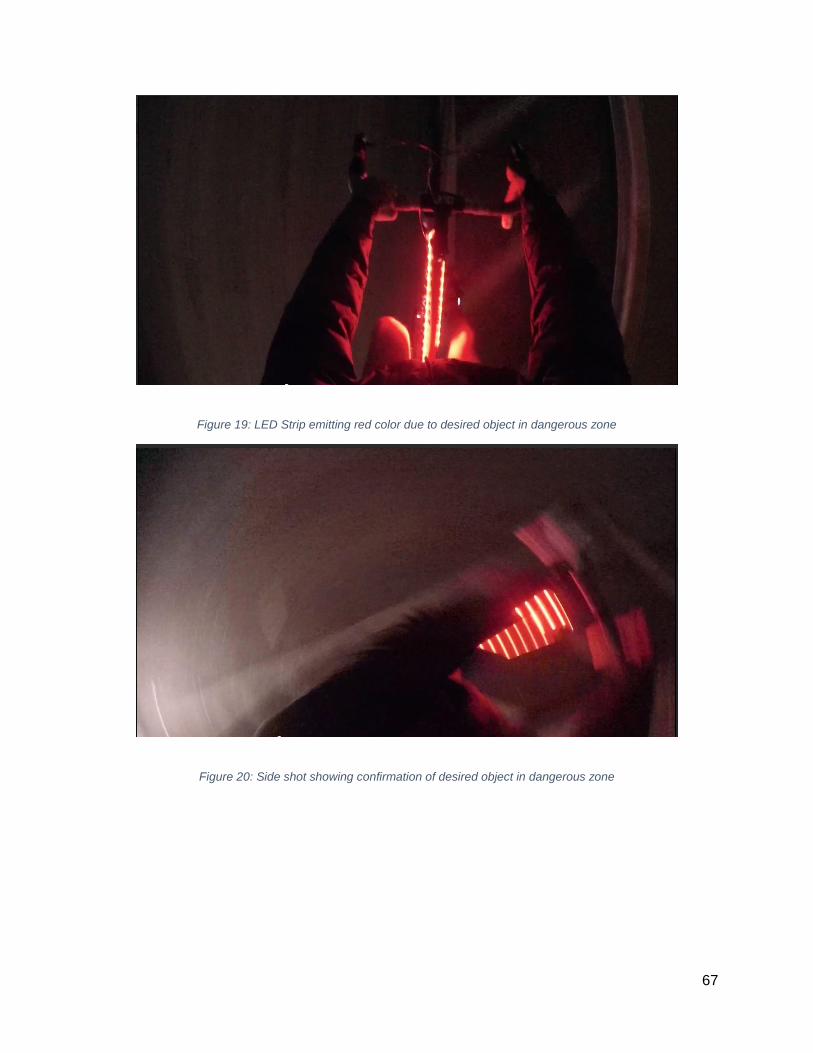
67
Figure 19: LED Strip emitting red color due to desired object in dangerous zone
Figure 20: Side shot showing confirmation of desired object in dangerous zone
68
Appendix B: Facilities Planning
Figure 21 shows a possible product structure for an initial revision of the Firework Cycling
Sensor. This structure combines the use of purchased parts, assembled parts and manufactured
parts. From this a phantomized structure, seen in Figure 22, was developed in order to add
control to the manufacturing system. To achieve the final product the parts are assembled from
bottom to top, following the path of the arrows. In this case for the product structure, the cover
cannot be completed before the sensor subassembly. This subassembly cannot be completed
before the circuit board has been soldered. The phantomization of the assembly allows for parts
to be in constant flow in order to reduce material handling cost, inventory, and cumulative lead
time. This phantomization, if scheduled before production begins, may lead to higher initial
investment. The technique forces parts to move constantly, with no downtime while in process.
The largest reduction from this technique is the required storage effort, including monetary,
spatial, and organizational. The reduction in these metrics can possibly lead to a more
competitive product as the production cost is reduced.
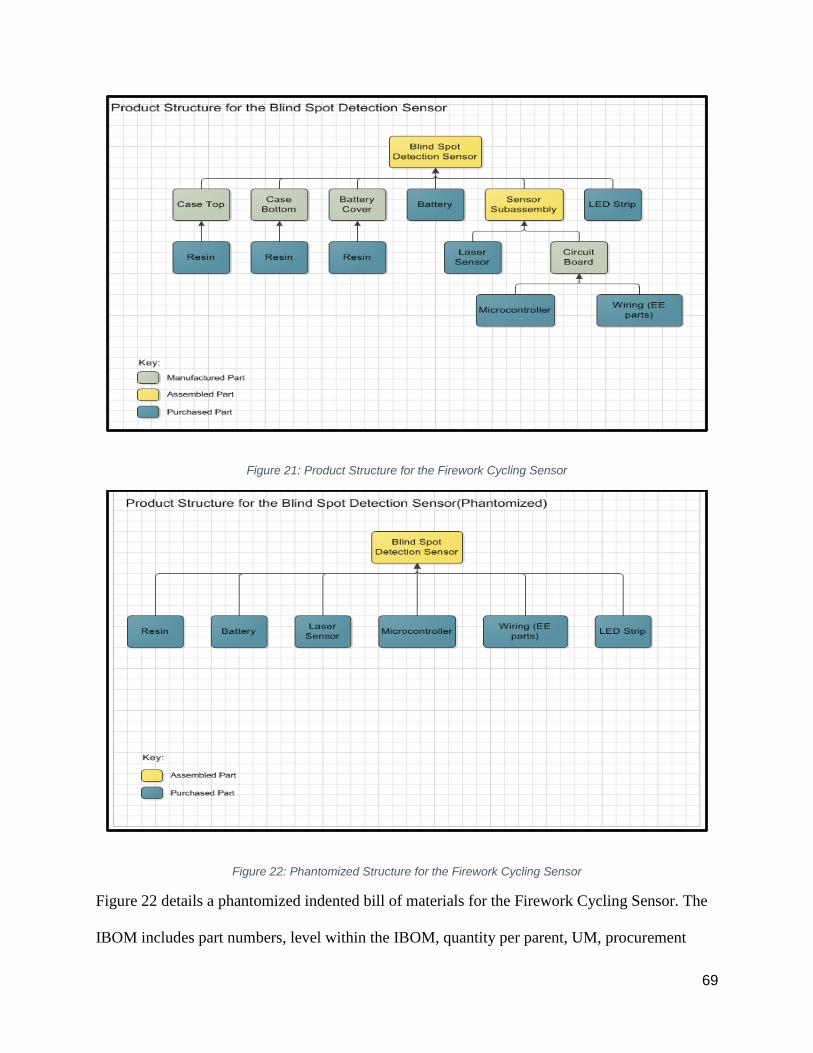
69
Figure 21: Product Structure for the Firework Cycling Sensor
Figure 22: Phantomized Structure for the Firework Cycling Sensor
Figure 22 details a phantomized indented bill of materials for the Firework Cycling Sensor. The
IBOM includes part numbers, level within the IBOM, quantity per parent, UM, procurement
70
status, phantomization confirmation, lead time, cumulative lead time, and the product phase
included in its life cycle. The IBOM’s standard times are approximations based on the proposed
equipment in the facility layout. The parts included in the design include the LED strip, battery,
plastic resin, battery cover, case bottom, case top, LIDAR-Lite sensor, wiring, and
microcontroller. The circuit board, sensor subassembly, and final assembly are a result of the
manufacturing operations inside the facility.
Eventually, the team would personalize its circuit board for the specific needs of the Firework
Cycling Sensor. The current assembly utilizes an Arduino Uno, which provides a great stepping
stone into the realm of microcontroller technology. Even other Arduino models, such as the
Arduino Nano, present alternatives to the comparatively large Uno. As the team considers its
customer requirements for the Firework Cycling Sensor to be lightweight and aerodynamic.
These consideration will push the development of the microcontroller into an extremely
personalized model, which perhaps is already in development and can be placed into the IBOM
as a purchased part. If the team had the means, and if it presented a more financially viable
option, a microcontroller would be fabricated and not purchased. The same technique applies to
every part of the Firework Cycling Sensor.
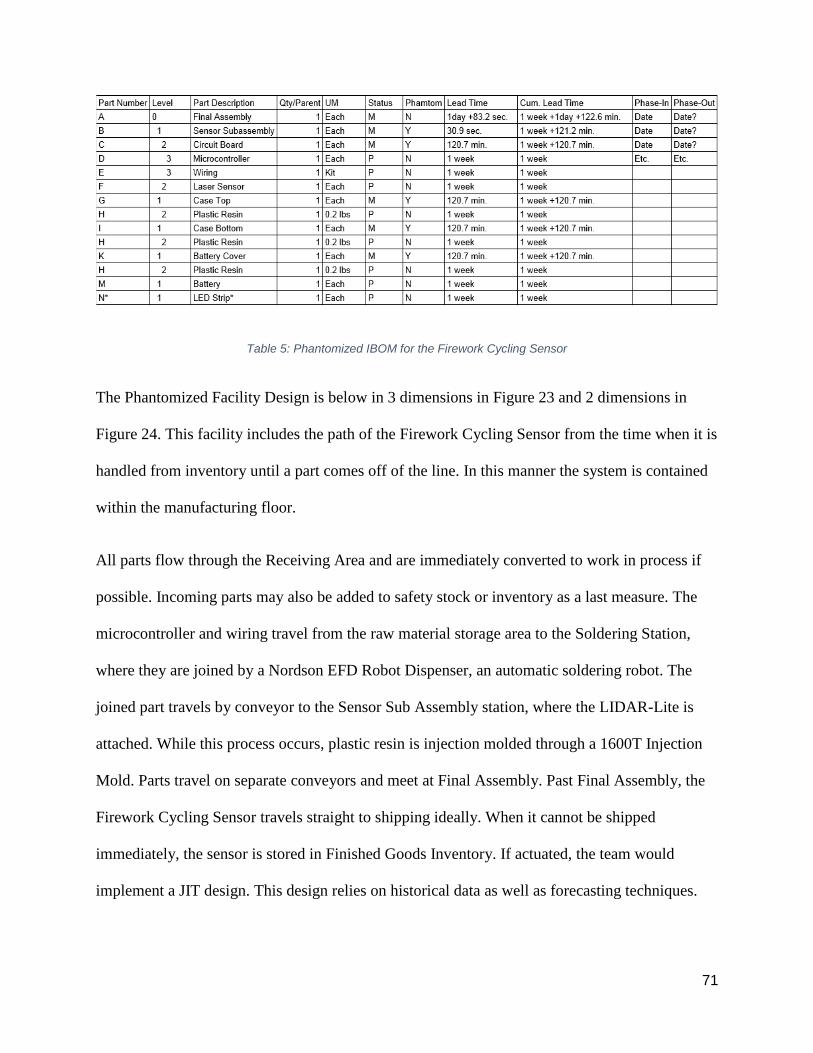
71
Table 5: Phantomized IBOM for the Firework Cycling Sensor
The Phantomized Facility Design is below in 3 dimensions in Figure 23 and 2 dimensions in
Figure 24. This facility includes the path of the Firework Cycling Sensor from the time when it is
handled from inventory until a part comes off of the line. In this manner the system is contained
within the manufacturing floor.
All parts flow through the Receiving Area and are immediately converted to work in process if
possible. Incoming parts may also be added to safety stock or inventory as a last measure. The
microcontroller and wiring travel from the raw material storage area to the Soldering Station,
where they are joined by a Nordson EFD Robot Dispenser, an automatic soldering robot. The
joined part travels by conveyor to the Sensor Sub Assembly station, where the LIDAR-Lite is
attached. While this process occurs, plastic resin is injection molded through a 1600T Injection
Mold. Parts travel on separate conveyors and meet at Final Assembly. Past Final Assembly, the
Firework Cycling Sensor travels straight to shipping ideally. When it cannot be shipped
immediately, the sensor is stored in Finished Goods Inventory. If actuated, the team would
implement a JIT design. This design relies on historical data as well as forecasting techniques.
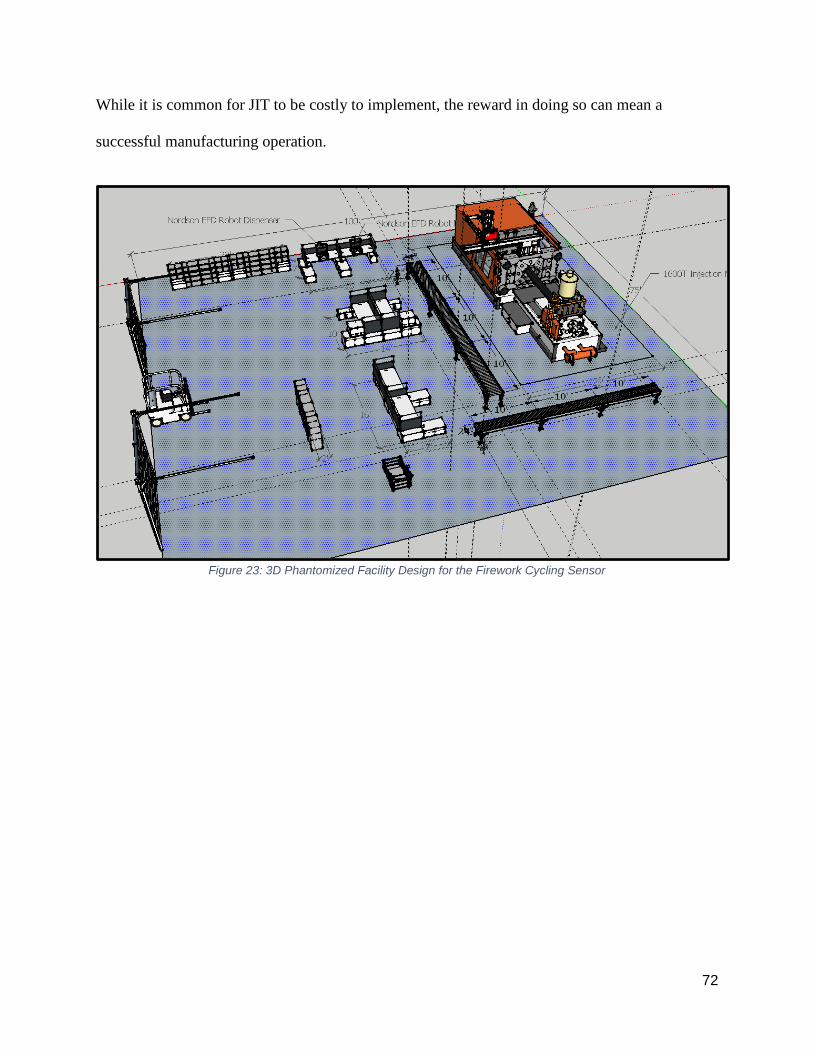
72
While it is common for JIT to be costly to implement, the reward in doing so can mean a
successful manufacturing operation.
Figure 23: 3D Phantomized Facility Design for the Firework Cycling Sensor
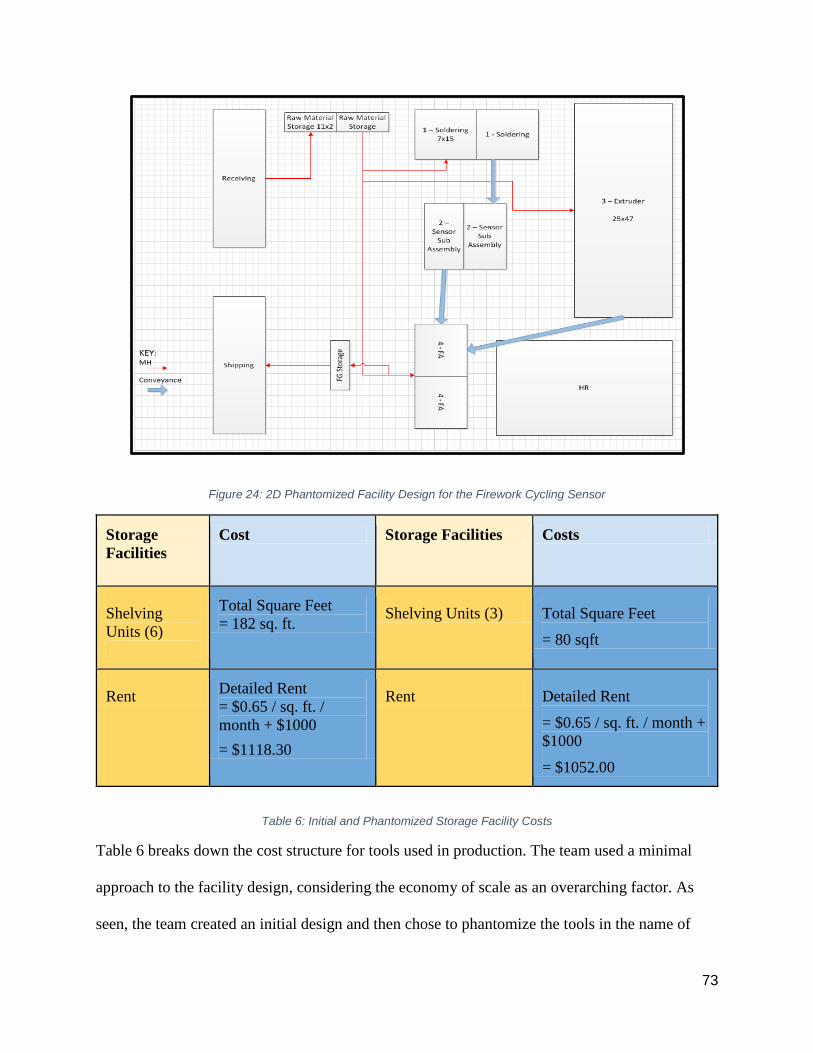
73
Figure 24: 2D Phantomized Facility Design for the Firework Cycling Sensor
Storage
Facilities
Cost Storage Facilities Costs
Shelving
Units (6)
Total Square Feet
= 182 sq. ft. Shelving Units (3) Total Square Feet
= 80 sqft
Rent Detailed Rent
= $0.65 / sq. ft. /
month + $1000
= $1118.30
Rent Detailed Rent
= $0.65 / sq. ft. / month +
$1000
= $1052.00
Table 6: Initial and Phantomized Storage Facility Costs
Table 6 breaks down the cost structure for tools used in production. The team used a minimal
approach to the facility design, considering the economy of scale as an overarching factor. As
seen, the team created an initial design and then chose to phantomize the tools in the name of
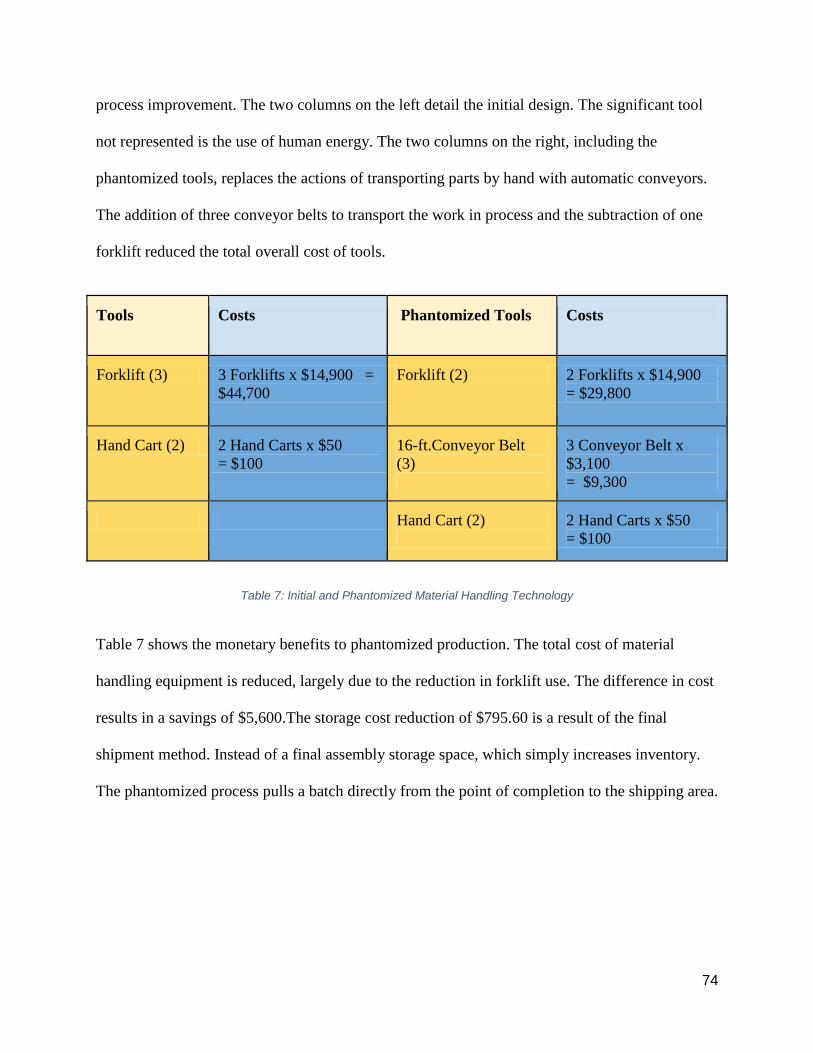
74
process improvement. The two columns on the left detail the initial design. The significant tool
not represented is the use of human energy. The two columns on the right, including the
phantomized tools, replaces the actions of transporting parts by hand with automatic conveyors.
The addition of three conveyor belts to transport the work in process and the subtraction of one
forklift reduced the total overall cost of tools.
Tools Costs Phantomized Tools Costs
Forklift (3) 3 Forklifts x $14,900 =
$44,700
Forklift (2) 2 Forklifts x $14,900
= $29,800
Hand Cart (2) 2 Hand Carts x $50
= $100
16-ft.Conveyor Belt
(3)
3 Conveyor Belt x
$3,100
= $9,300
Hand Cart (2)
2 Hand Carts x $50
= $100
Table 7: Initial and Phantomized Material Handling Technology
Table 7 shows the monetary benefits to phantomized production. The total cost of material
handling equipment is reduced, largely due to the reduction in forklift use. The difference in cost
results in a savings of $5,600.The storage cost reduction of $795.60 is a result of the final
shipment method. Instead of a final assembly storage space, which simply increases inventory.
The phantomized process pulls a batch directly from the point of completion to the shipping area.
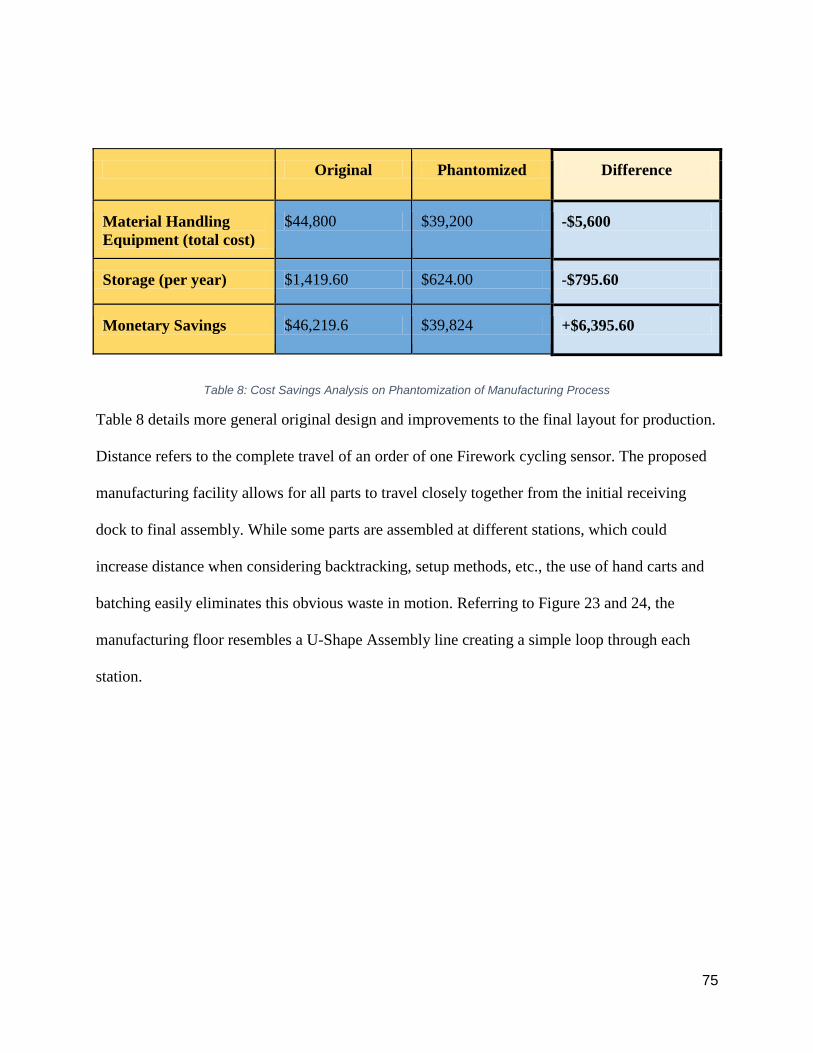
75
Original Phantomized Difference
Material Handling
Equipment (total cost)
$44,800 $39,200 -$5,600
Storage (per year) $1,419.60 $624.00 -$795.60
Monetary Savings $46,219.6 $39,824 +$6,395.60
Table 8: Cost Savings Analysis on Phantomization of Manufacturing Process
Table 8 details more general original design and improvements to the final layout for production.
Distance refers to the complete travel of an order of one Firework cycling sensor. The proposed
manufacturing facility allows for all parts to travel closely together from the initial receiving
dock to final assembly. While some parts are assembled at different stations, which could
increase distance when considering backtracking, setup methods, etc., the use of hand carts and
batching easily eliminates this obvious waste in motion. Referring to Figure 23 and 24, the
manufacturing floor resembles a U-Shape Assembly line creating a simple loop through each
station.
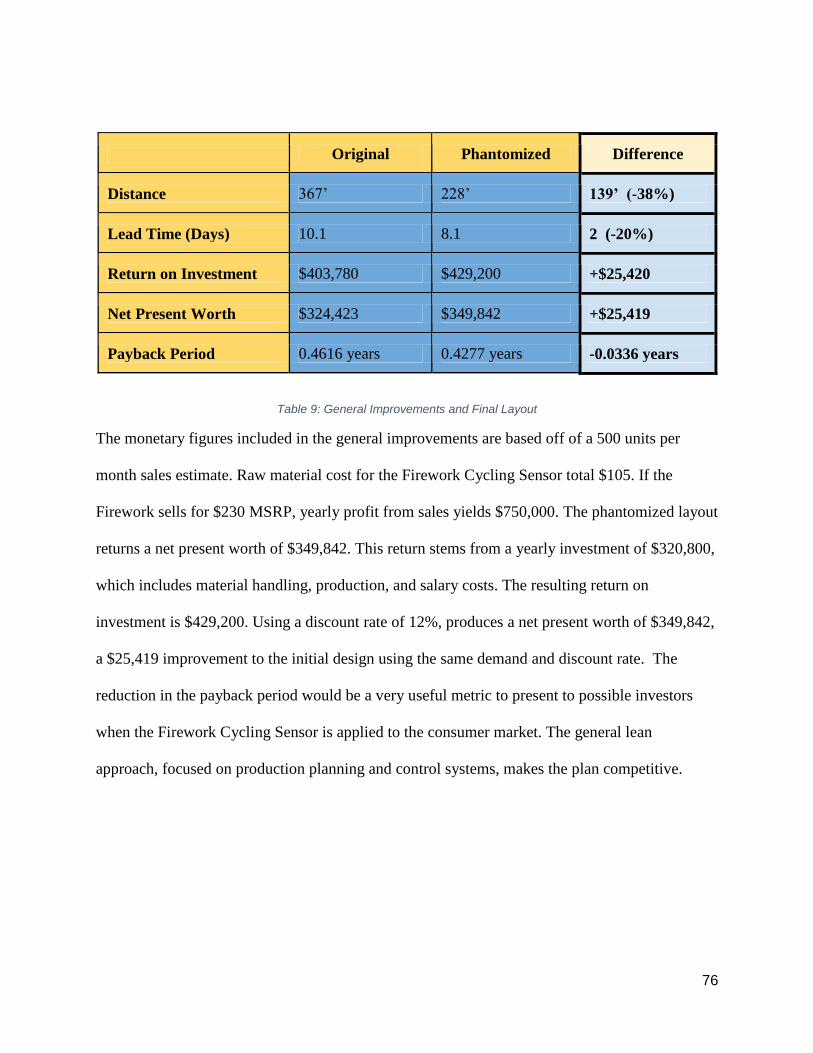
76
Original Phantomized Difference
Distance 367’ 228’ 139’ (-38%)
Lead Time (Days) 10.1 8.1 2 (-20%)
Return on Investment $403,780 $429,200 +$25,420
Net Present Worth $324,423 $349,842 +$25,419
Payback Period 0.4616 years 0.4277 years -0.0336 years
Table 9: General Improvements and Final Layout
The monetary figures included in the general improvements are based off of a 500 units per
month sales estimate. Raw material cost for the Firework Cycling Sensor total $105. If the
Firework sells for $230 MSRP, yearly profit from sales yields $750,000. The phantomized layout
returns a net present worth of $349,842. This return stems from a yearly investment of $320,800,
which includes material handling, production, and salary costs. The resulting return on
investment is $429,200. Using a discount rate of 12%, produces a net present worth of $349,842,
a $25,419 improvement to the initial design using the same demand and discount rate. The
reduction in the payback period would be a very useful metric to present to possible investors
when the Firework Cycling Sensor is applied to the consumer market. The general lean
approach, focused on production planning and control systems, makes the plan competitive.
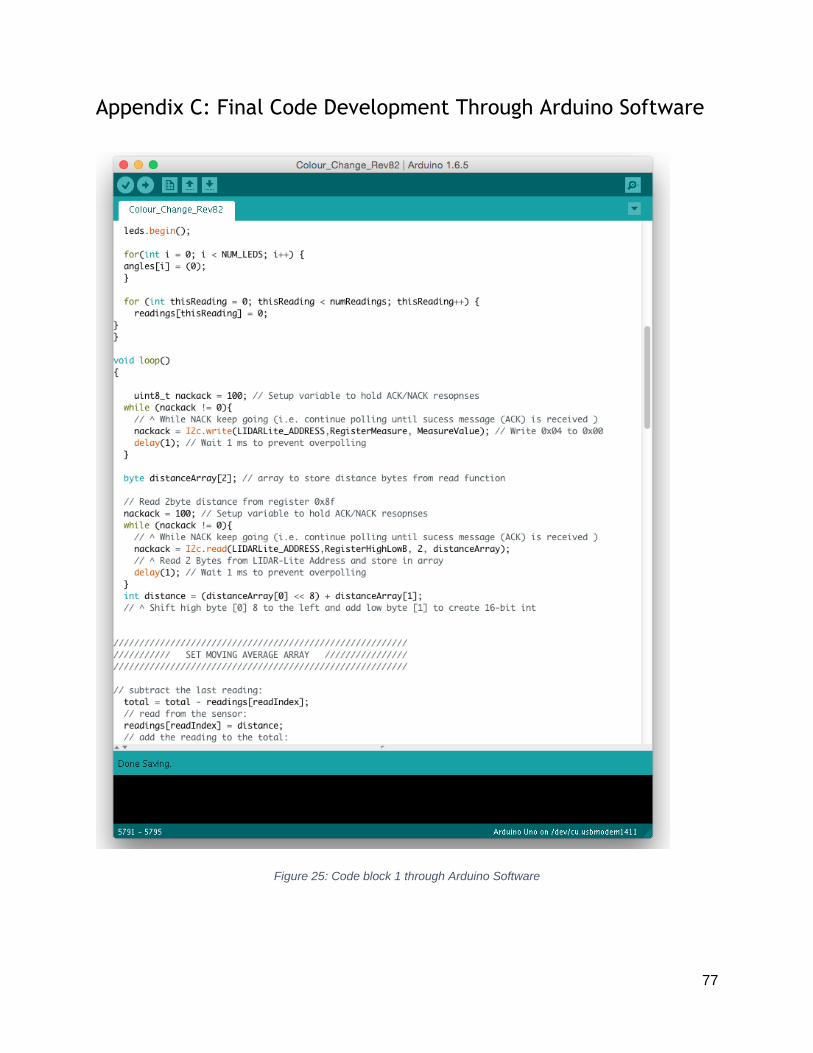
77
Appendix C: Final Code Development Through Arduino Software
Figure 25: Code block 1 through Arduino Software
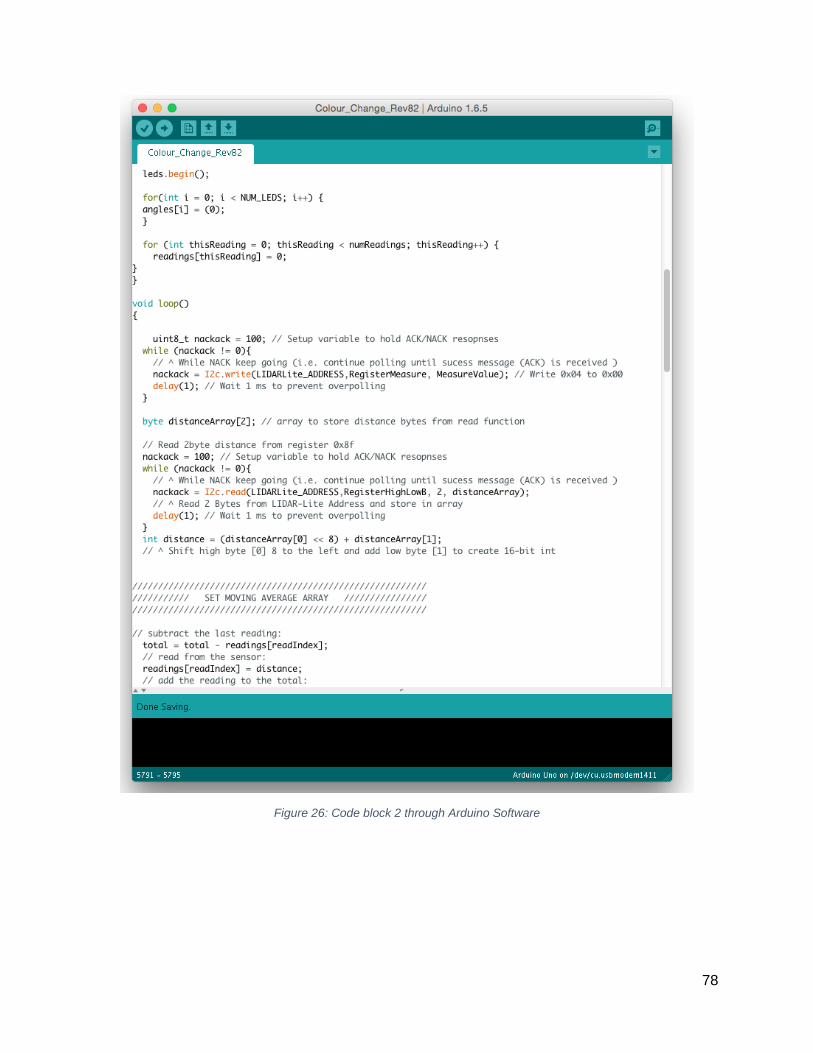
78
Figure 26: Code block 2 through Arduino Software
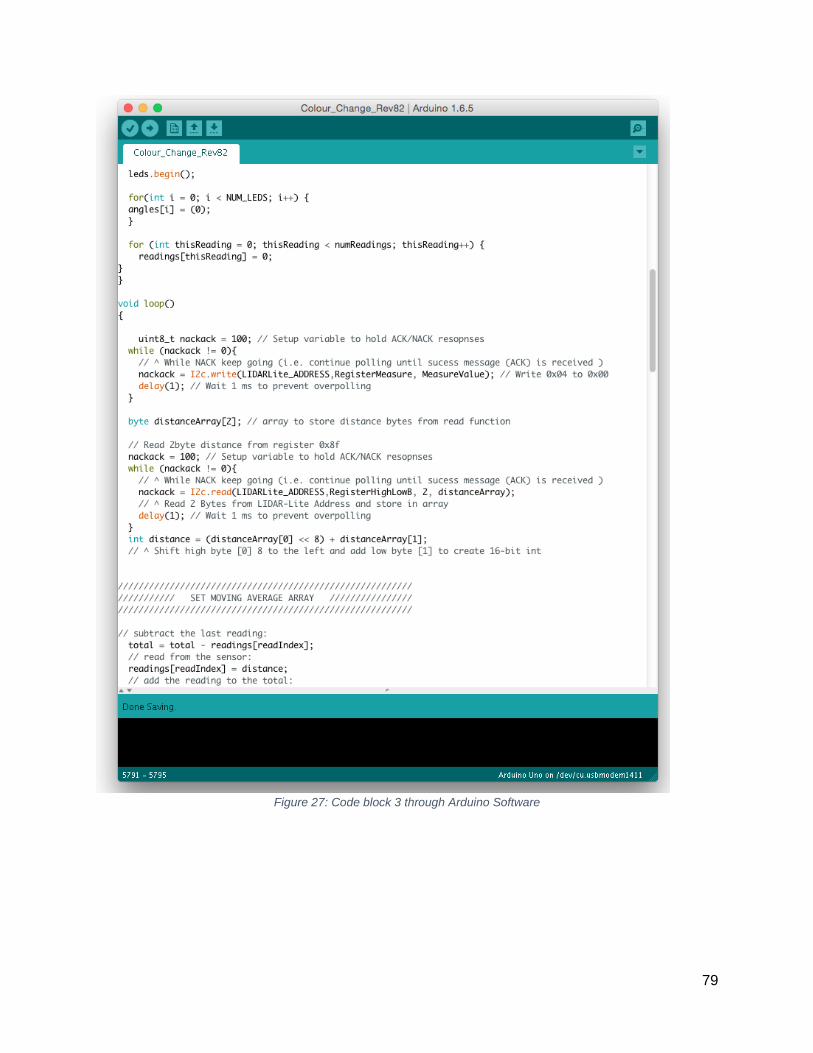
79
Figure 27: Code block 3 through Arduino Software
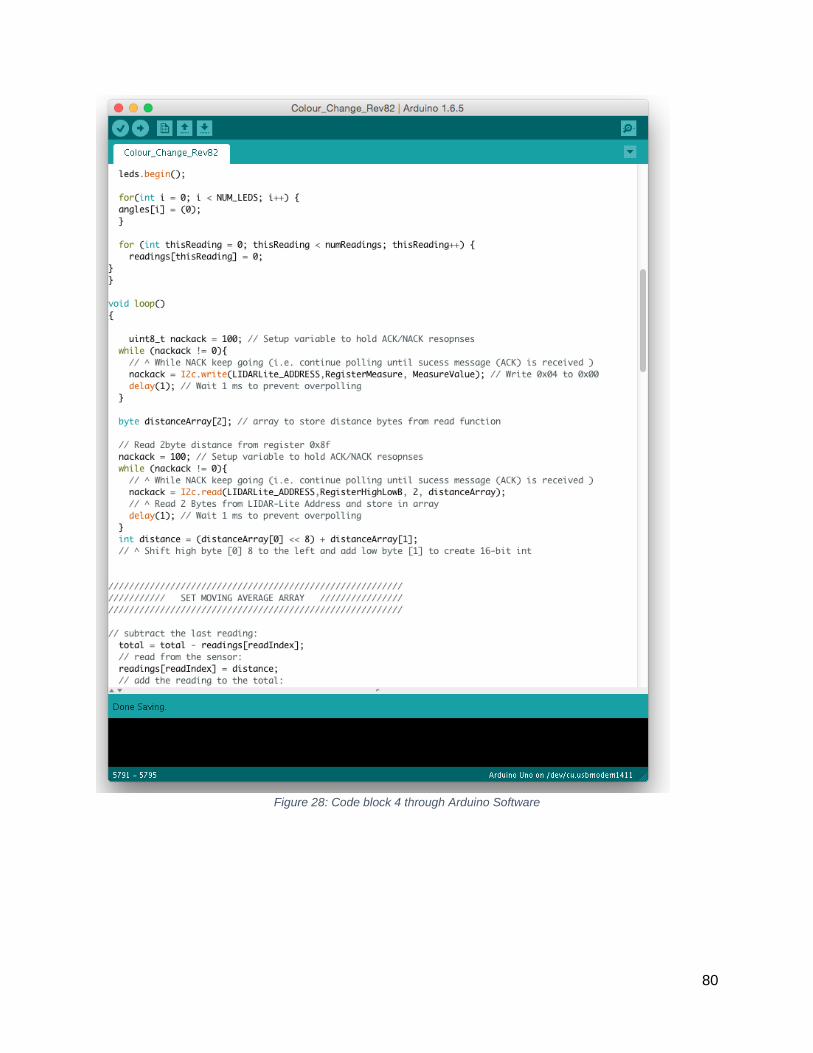
80
Figure 28: Code block 4 through Arduino Software

81
Figure 29: Code block 5 through Arduino Software