Embed Size (px)
Citation preview
BBAA VI International Colloquium on:Bluff Bodies Aerodynamics & Applications
Milano, Italy, July, 20–24 2008
DESIGN OF AN AERODYNAMIC AID FOR THE UNDERBODY OF ATRAILER WITHIN A TRACTOR-TRAILER COMBINATION
Gandert M.R. Van Raemdonck? and Michel J.L. van Tooren†
?Design Integration and Operations of Aircraft and RotorcraftTU Delft, Faculty of Aerospace Engineering, Kluyverweg 1, 2628HS Delft, The Netherlands
e-mail: [email protected]
†Design Integration and Operations of Aircraft and RotorcraftTU Delft, Faculty of Aerospace Engineering, Kluyverweg 1, 2628HS Delft, The Netherlands
e-mail: [email protected]
Keywords: Aerodynamic Aid, Underbody Trailer, Experimental research
Abstract: The significant increase of road transport combined with the increasing environ-mental issues and fuel prices has renewed the interest in truck design. Reducing the aero-dynamic drag has a large positive influence on the fuel economy, and the belch of harmfullexhaust gasses.Extensive experimental design of aerodynamic concepts in the wind tunnel resulted in severalsolutions which fit within the today’s European regulations. A straight side skirt with a leadingedge profile reduces the drag up to 14% which results in a reduction of fuel consumption of 7%.
1
Van Raemdonck Gandert and van Tooren Michel
1 INTRODUCTION
Background. Cargo transport by road using trucks is still one of the most efficient transportsolutions within the European context. This fact manifests itself in an increasing amount oftrucks on the road and the associated increased total volume of fuel consumed. The rising fuelprices force the transport companies to cut cost in order to stay competitive in this aggressive,fast changing and growing market. The expected significant road transport demand in the nexttwenty years and the increasing environmental constraints has renewed the interest in truck de-sign; any reduction in truck fuel consumption can be associated with large annual fuel cost andconsiderable emission savings.Generally there are two ways to reduce the fuel consumption of a vehicle. One can improvethe efficiency of the power delivered by the engine, the available power, or one can lower therequired power to overcome the different forces acting on a truck traveling over the road. Thelatter can be achieved by reducing the weight of the vehicle, reducing its aerodynamic drag andby reducing the friction resistance of the tires. When driving at highway speeds of 85km/h,more than 40% of the trucks fuel consumption is caused by aerodynamic drag, [16].
Past research. The reduction of fuel consumption of trucks by aerodynamic means has be-come an accepted practice in the last decades by installing a combination of add-on devices forthe tractor and the trailer, while keeping its original boxed shape. Also modifications of thegeneral shape of the vehicle improved the aerodynamic efficiency in a positive way.In the past several aerodynamic devices were developed for the front and top of the tractor, theback of the trailer and for the gap between the tractor and trailer, [9, 18, 19]. Also several aero-dynamic aids for the underside of the trailer were investigated and tested in the wind tunnel. Thesolution of Ortega [12] for a trailer underbody included some kind of side skirt but then placedas a long wedge. They achieved a maximum drag reduction of 6.25% in the situation of zeroyaw angle. The investigation team of Wood and Bouwer [19] developed a high momentum mudflap which achieved a drag reduction of more than 10%. Storms [15] and his assistants executedseveral wind tunnel tests with a generic tractor-trailer model in a pressurized wind tunnel at ascale of 1/8, among which solutions for the undertray of the trailer. They tested several types ofside skirts and obtained drag reductions between 6.2% and 11.8%.
Present research. Within a research program of the Delft University of Technology the lastyears, several aerodynamic add-ons for the underside of a trailer were designed and tested inthe wind tunnel . The chosen region of the vehicle to improve the aerodynamic behavior of theflow was the underside of the trailer. This choice is supported by the fact that the underbodyflow of trailers is characterized by highly turbulent and separated flows [17]. About 30% of thetotal drag of tractor-trailer combination originates from the underside of the vehicle, [17]. Theunderside of the trailer there allows enough space to incorporate an aerodynamic add-on withinthe European regulations [21].With the aid of a scaled model an aerodynamic add-on for the underside of the trailers is devel-oped by iterative design processes in the wind tunnel. Besides drag measurements, the pressurecoefficients are determined at the back of the vehicle to give an indication of the influence ofdrag decrease and the pressure at the back surface. The design together with the mutual dragreduction differences of several aerodynamic devices for the underbody of a trailer in a tractor-trailer combination is presented in this paper.
2

Van Raemdonck Gandert and van Tooren Michel
2 EXPERIMENTAL SET-UP
2.1 Aerodynamic add-ons
Two different types of add-ons are being designed in this work: side skirts and a full under-body. Both types will be discussed briefly below.
Side skirts. Side skirts are well known structural, aesthetic and aerodynamic aids in the body-work and transport sector. Skirts are vertical plates which are mounted in the longitudinal di-rection of the vehicle. The main idea of the side skirts is preventing the flow to go under thetrailer with all its disturbances like support legs, storage boxes, suspension, axles and wheels,see fig.2. Transport companies are obliged to install side bars due to safety reasons to havea sideways protecting construction (guide line 89/297/EEG, [21]) which prevents cyclists andpedestrians to end up under the trailer. All the side skirts applied during the wind tunnel testswere designed according to this European guideline.
Underbody. The underbody for the trailer was inspired by the underbodies of personal andrace cars. The purpose of the underbody for the trailer is to guide the flow around the obstacleslike the support legs, the pallet box, the axles and the wheels (see fig.1) in order to decrease thedisturbances and thus the aerodynamic drag. The front part of the underbody catches the flowcoming from the front of the tractor and guides it along the support legs over the pallet box.Behind this a channel is formed which directs the flow over the axles and between the wheels.The rear part can be seen as a diffuser which expands the flow into the wake of the trailer. Thedimensions of the different parts of the underbody are defined by the geometrical shape of themodel. A diffuser angle of 10◦ is chosen based on the work of Ruhrmann and Zang [20].
2.2 Wind tunnel model
Figure 1: Truck underbody configuration togetherwith mounting position
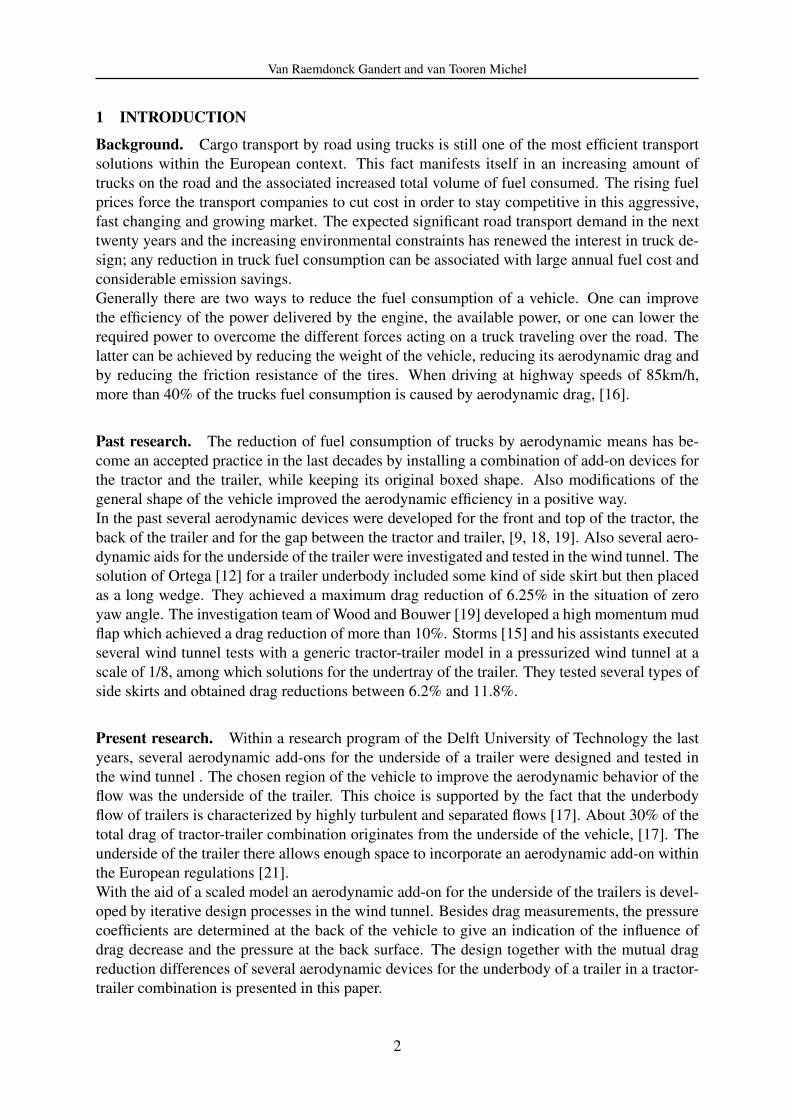
A 1/14th scaled truck model (TAMIYAMercedes Benz 1838LS truck and TAMIYAContainer-Trailer) was used to execute the ex-periments. The width, height and width of thetruck model is respectively 205mm, 298mm and1100mm, fig.2. The model is adapted in order togenerate a turbulent attached boundary layer di-rectly to the back-end of the trailer. The initialtruck model had sharp corners which would resultin flow separation at the front edges and is not arealistic representation. Any aerodynamic improvement at the bottom and back of the trailerwould be ineffective. A new cover, fig.2, with properly chosen round-off edges [10] has beenmade that prevent flow separation at the front cabin corners and initiates a turbulent boundarylayer before it reaches the back edges of the tractor [4]. The model was not equipped with acooling and fans system and is mounted with several supporting points together with a supportplate belly-up due to the location of the balance system, fig.1 and fig.3.
3
Van Raemdonck Gandert and van Tooren Michel
The Reynolds number for a full scale truck, based on the square root of the frontal area ofA = 10.34m2, air density ρ = 1.225kg/m3, air viscosity µ = 1.7894 × 10⁻⁵ and a drivingvelocity of 25m/s, becomes 5.5 × 10⁶ [4]. The operating velocity during the experiments was60m/s and the scaled wind tunnel model had a frontal area of 0.057m2. This gives a Reynoldsnumber of 0.80 × 10⁶ which is high enough to test bluff bodies in proper manner in the windtunnel, [14]. After measuring the drag coefficient in a velocity range of 50m/s-120m/s, noReynolds effects were deducted: the drag coefficient stayed constant over the Reynolds numberrange. No wind tunnel corrections methods were applied on the dynamic pressure, because oneis only interested in the 4CD of the several configurations.
Figure 2: Wind tunnel model dimensions Figure 3: Experimental set-up with ground board inLTT
2.3 Wind tunnel configuration
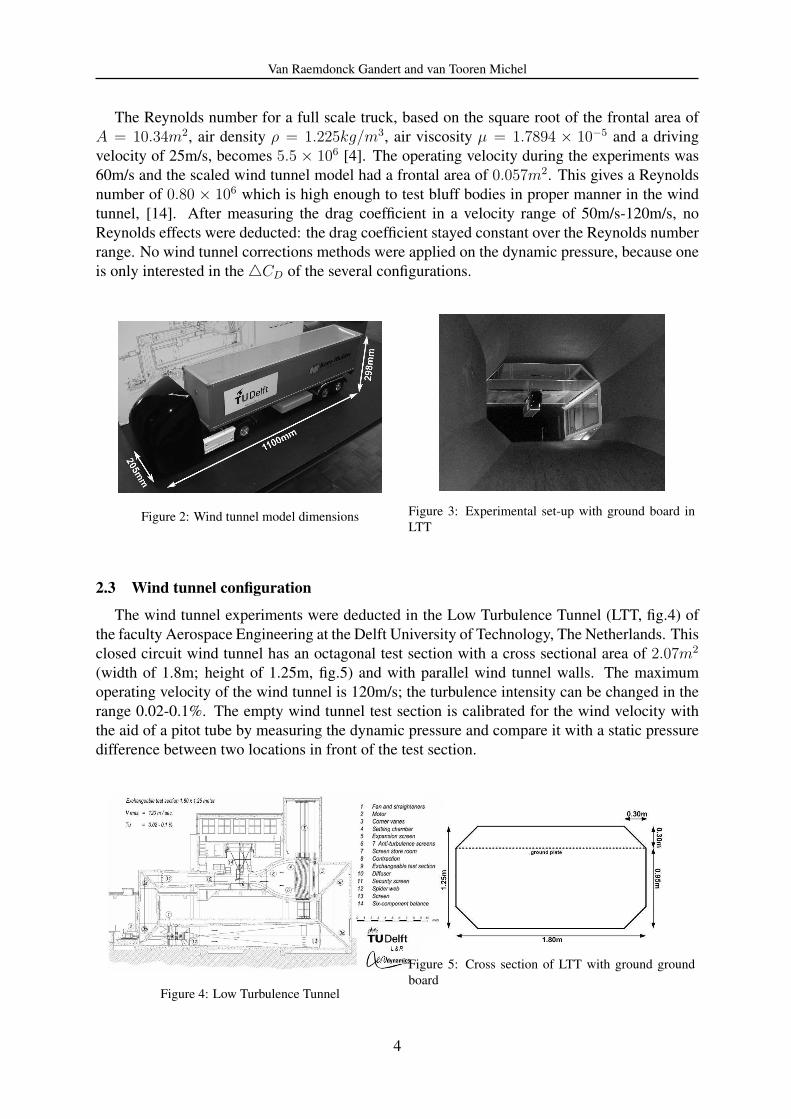
The wind tunnel experiments were deducted in the Low Turbulence Tunnel (LTT, fig.4) ofthe faculty Aerospace Engineering at the Delft University of Technology, The Netherlands. Thisclosed circuit wind tunnel has an octagonal test section with a cross sectional area of 2.07m2
(width of 1.8m; height of 1.25m, fig.5) and with parallel wind tunnel walls. The maximumoperating velocity of the wind tunnel is 120m/s; the turbulence intensity can be changed in therange 0.02-0.1%. The empty wind tunnel test section is calibrated for the wind velocity withthe aid of a pitot tube by measuring the dynamic pressure and compare it with a static pressuredifference between two locations in front of the test section.
Figure 4: Low Turbulence Tunnel
Figure 5: Cross section of LTT with ground groundboard
4
Van Raemdonck Gandert and van Tooren Michel
Buckley [2] concluded after testing aerodynamic devices on the road and in the wind tunnelthat the non-simulation of wind turbulence in the wind tunnel tests appears to be a significantcontributing factor to the source of disagreement between the wind tunnel and over the roaddrag reductions. Although the turbulence intensity of the flow has influences on its behaviorthere is decided to perform the tests with the maximum turbulence intensity of the LTT, whichis 0.1%, and no further effort was put into artificially increasing the turbulence intensity.
2.4 Ground effect
Due to the presence of a road vehicle a boundary layer is developing on the road itself.This boundary layer and thus the presence of a ground floor influences the boundary layer ofthe lower surface of the vehicle and its drag behavior. The wind tunnel used is not equippedwith a moving belt which is desirable to investigate the ground effect of, for instance, race cars.Ground simulations and its study have been the subject of many research projects [1, 3, 7, 8, 11].The most basic simulation approach used for passenger cars is the most direct and simple one:to test a vehicle on a fixed surface. The major issue is a too thick approaching floor boundarylayer. According to Cooper [4, 5] one can conclude that a fixed-floor with a thinned bound-ary layer is sufficient for current automotive and commercial vehicle applications, particularlywhere the underbody clearances are large and the underbodies are rough which is the case withtractor-trailer combinations.To test the vehicle the model is suspended on a parallel floor which has an offset of 300mm withrespect to the upper (horizontal) wind tunnel wall and has the same width as the test section,fig.3 and fig.5. On the rounded front edge of this ground plate develops a new thinner bound-ary layer in comparison with the thick boundary layer on the wind tunnel wall. This solutiontogether with the conclusion of Cooper [4] and the fact that one was interested in the drag coef-ficient differences between the several aerodynamic aids and not in absolute values, will satisfyfor these experiments.
2.5 Measuring techniques
The six-component mechanical balance system measures the resulting aerodynamic forcesacting on the truck model. Here only the drag coefficient CT of the vehicle will be discussed.The direction of CT is orientated in the longitudinal direction of the vehicle. The drag coeffi-cient was averaged by 20 measuring points.The pressure at the back surface of the trailer is measured to calculate a corresponding pres-sure coefficient Cp,back in order to investigate its relation to the change in drag coefficient CT
and its response towards different aerodynamic add-ons. The pressure measurements were exe-cuted with the aid of Esterline Pressure Scanners [22] which can measure 30 different pressureorifices, nicely divided over the back surface in a raster. The diameter of each pressure tab is0.4mm and had a length of 15mm. The pressure taps were connected with the pressure scannerby flexible PVC tubes with an internal diameter of 1mm. The pressure scanner itself is placedin the back of the trailer. Each pressure measurement is an average of 15 000 pressures. Thismeasuring process takes approximately 1.5 seconds meaning each pressure tap is measured 500times. From Duel and George [6] it turned out that the fluctuation of the near wake is about15Hz: the averaged pressure field is captured.
5
Van Raemdonck Gandert and van Tooren Michel
3 EXPERIMENTAL RESULTS
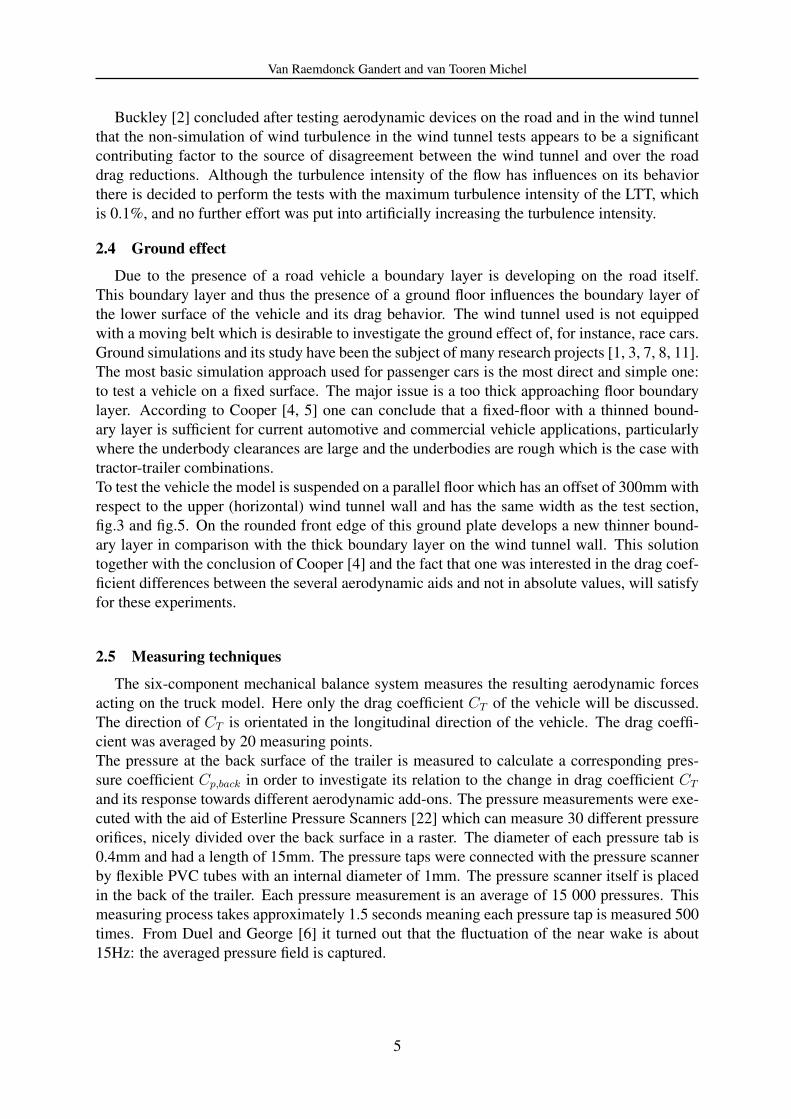
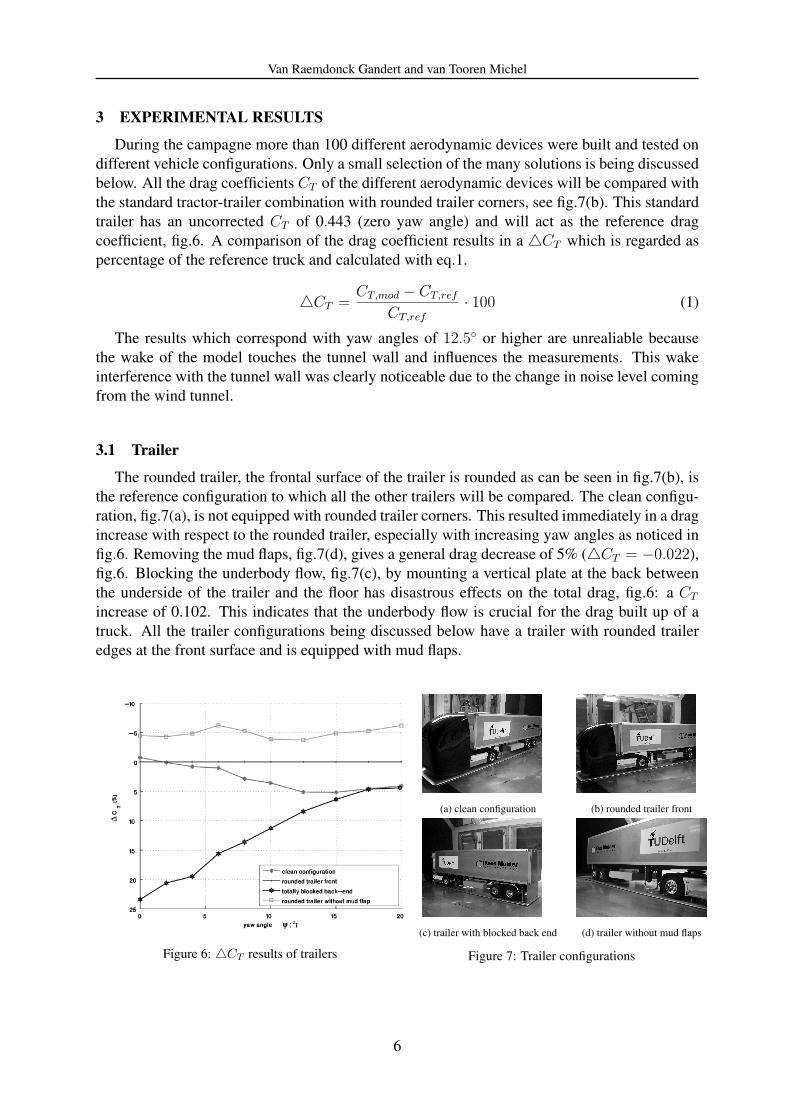
During the campagne more than 100 different aerodynamic devices were built and tested ondifferent vehicle configurations. Only a small selection of the many solutions is being discussedbelow. All the drag coefficients CT of the different aerodynamic devices will be compared withthe standard tractor-trailer combination with rounded trailer corners, see fig.7(b). This standardtrailer has an uncorrected CT of 0.443 (zero yaw angle) and will act as the reference dragcoefficient, fig.6. A comparison of the drag coefficient results in a 4CT which is regarded aspercentage of the reference truck and calculated with eq.1.
4CT =CT,mod − CT,ref
CT,ref
· 100 (1)
The results which correspond with yaw angles of 12.5◦ or higher are unrealiable becausethe wake of the model touches the tunnel wall and influences the measurements. This wakeinterference with the tunnel wall was clearly noticeable due to the change in noise level comingfrom the wind tunnel.
3.1 Trailer
The rounded trailer, the frontal surface of the trailer is rounded as can be seen in fig.7(b), isthe reference configuration to which all the other trailers will be compared. The clean configu-ration, fig.7(a), is not equipped with rounded trailer corners. This resulted immediately in a dragincrease with respect to the rounded trailer, especially with increasing yaw angles as noticed infig.6. Removing the mud flaps, fig.7(d), gives a general drag decrease of 5% (4CT = −0.022),fig.6. Blocking the underbody flow, fig.7(c), by mounting a vertical plate at the back betweenthe underside of the trailer and the floor has disastrous effects on the total drag, fig.6: a CT
increase of 0.102. This indicates that the underbody flow is crucial for the drag built up of atruck. All the trailer configurations being discussed below have a trailer with rounded traileredges at the front surface and is equipped with mud flaps.
Figure 6: 4CT results of trailers
(a) clean configuration (b) rounded trailer front
(c) trailer with blocked back end (d) trailer without mud flaps
Figure 7: Trailer configurations
6

Van Raemdonck Gandert and van Tooren Michel
3.2 Add-on: side skirt
The most basic straight side skirt with covered wheels, fig.9(a), reduces the drag coefficientCT with 11% (4CT = −0.049) at a yaw angle of zero degrees and stays almost the same withincreasing yaw angle, fig.8. Existing side skirts often have the front and rear edge cut off foraesthetic purposes and aerodynamic reasons. The results show that a steep cut back-edge, fig.8,reduces the drag coefficient even further. If the front edge of the straight side skirt also has a cutoff corner, fig.9(c), a 12% drag reduction is obtained that rises smoothly until 13% at 10◦, seefig.8. The above different configurations for the straight side skirt have covered wheels, whilereal trucks often have open wheels. The existing side skirts with uncovered wheels, see fig.9(d),perform aerodynamically much worse. Fig.8 tells us that uncoverd wheels introduce a lot ofturbulence which results in lesser drag reduction: about 4% at zero yaw angle, or an increase ofCT with 0.018.
Figure 8: 4CT results of side skirts (1)
(a) straight side skirt (b) cut rear-edge
(c) cut front and rear-edge (d) uncovered wheels
Figure 9: Side skirts configurations (1)
A first modification on this type of aerodynamic aid is the round side skirt, fig.11(a), whichencapsulates the pallet box in a round curve and covering the wheels towards the back of thetrailer. The reduction in aerodynamic drag is 12.5% or 4CT = −0.055 at a yaw angle of zerodegrees and has its maximum at of 14.5% (4CT = −0.064) at 6◦ as plotted in fig.10. If thebottom of round front side skirt and the back end is closed, as shown in fig.11(b), the drag mea-surements show that the drag reduction was less then the solution with the open bottom, fig.10.
The side skirt with the sharp front, fig.11(c), is an alternative for the round front side skirtand can be produced more easily. In stead of a curved surface, the two side-skirts are comingtogether in a point just before the pallet box. The side-skirt with the sharp front has almost thesame results, fig.10, than the round front side skirt. The difference between these two at zeroyaw angle is small, even with increasing yaw angles.The last side skirt discussed in fig.10 is the solution with the hollow front, fig.11(d), instead ofthe more spherical round front side skirt. This hollow front lies parallel with the turning radiusof the tractor. At yaw angle of zero degree the hollow side skirt induces the biggest benefit indrag coefficient, fig.10, but is not that efficient as the round front side skirt when the yaw angleincreases.
7

Van Raemdonck Gandert and van Tooren Michel
Figure 10: 4CT results of side skirts (2)
(a) round front (b) side round front and with bottom
(c) sharp front (d) hollow front
Figure 11: Side skirts configurations (2)
The straight side skirt with the vertical front edge and the straight side skirt with steep cutback-edge shows a tendency of decreasing benefit with increasing yaw angles, fig.8. At largeryaw angles the flow can not handle the sharp vertical edge without immediate separation of thelocal flow. Rounding-off the sharp edges with half circles made of foam should give a dragbenefit.Three different set-ups were tried: the half circles on the inside, fig.13(a), on the outside only,fig.13(b) and on the in- and outside. The situation with the half circles on the outside, fig.12,performed worst over the range of yaw angles: at a yaw angle of zero degrees the flow has toovercome an extra obstacle which causes more drag and at a yaw angles of 6 − 10◦ the flowseparates on the inside causing drag. With the half circles on the in- and outside one can noticein fig.12 a slight improvement in drag benefit at the higher yaw angles. The best of the threeconfigurations is obtained with the side skirt which has the half circles on the inside. At a yawangle of zero degrees this solution produces 11% less drag in comparison to the base configu-ration instead of 7% for the other two, see fig.12. Also with increasing yaw angles for the sideskirt with half circle on the inside increasing benefits are obtained in comparison to the oneswith the half circles on the outside.The half circle is not an ideal aerodynamic shape in this case, therefor an airfoil profile (patentpending) was mounted at the front inside. With the profile a drag reduction of 14% or 4CT =−0.061 at zero degrees yaw angle and a maximum of 16% (4CT = −0.069) at a yaw angle of8◦ is obtained which is considerably more than with the half circle at the front, fig.12. With thisprofile at the inside of the front edge the flow does not separate at the edge and causes a lot lessaerodynamic drag.
3.3 Add-on: underbody
The second group of aerodynamic add-ons consists of the so-called underbodies. The mea-sured drag benefit of the complete underbody, fig.15(a), is plot in fig.14: it generates at zeroyaw angle 7% less drag (4CT = −0.030) and 12% or 4CT = −0.052 at 6◦ yaw angle.A second version of the underbody had covered wheels, fig.15(b), to show their influence onthe drag coefficient CT . Fig.14 demonstrates again that better results were achieved with the
8

Van Raemdonck Gandert and van Tooren Michel
Figure 12: 4CT results of side skirts (3)
(a) rounded inside frontal edge
(b) rounded outside frontal edge
Figure 13: Side skirts configurations (3)
wheels covered: a decrease of 3% (4CT = −0.013) of the drag coefficient with respect to thesimilar configuration with the open wheels. Once more the results show that the wheels are asource of extra irregularities and thus drag. This increase of 3% was also found with the straightside skirt with the uncovered wheels which can be noticed in fig.8.The last variation is the underbody with covered wheels but without the diffuser, fig.15(c). Thismodification improved the results marginally. A possible reason for the fact that the configura-tion without the diffuser works better than with the diffuser can lie in the fact that the diffuser isprobably badly designed for this model set-up: a wrong diffuser angle initiates flow separation.
Figure 14: 4CT results of underbodies
(a) full underbody (b) covered wheels
(c) underbody without diffuser
Figure 15: Underbody configurations
9
Van Raemdonck Gandert and van Tooren Michel
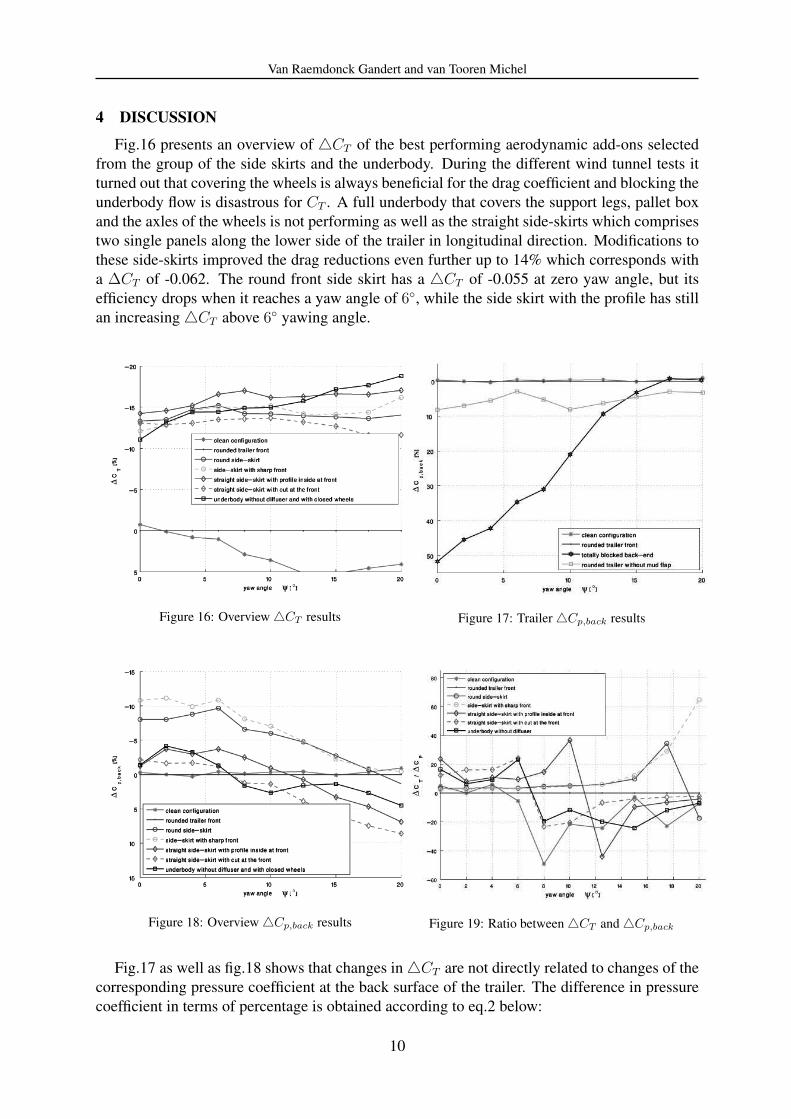
4 DISCUSSION
Fig.16 presents an overview of 4CT of the best performing aerodynamic add-ons selectedfrom the group of the side skirts and the underbody. During the different wind tunnel tests itturned out that covering the wheels is always beneficial for the drag coefficient and blocking theunderbody flow is disastrous for CT . A full underbody that covers the support legs, pallet boxand the axles of the wheels is not performing as well as the straight side-skirts which comprisestwo single panels along the lower side of the trailer in longitudinal direction. Modifications tothese side-skirts improved the drag reductions even further up to 14% which corresponds witha ∆CT of -0.062. The round front side skirt has a 4CT of -0.055 at zero yaw angle, but itsefficiency drops when it reaches a yaw angle of 6◦, while the side skirt with the profile has stillan increasing 4CT above 6◦ yawing angle.
Figure 16: Overview 4CT results Figure 17: Trailer 4Cp,back results
Figure 18: Overview 4Cp,back results Figure 19: Ratio between 4CT and 4Cp,back
Fig.17 as well as fig.18 shows that changes in 4CT are not directly related to changes of thecorresponding pressure coefficient at the back surface of the trailer. The difference in pressurecoefficient in terms of percentage is obtained according to eq.2 below:
10
Van Raemdonck Gandert and van Tooren Michel
4Cp,back =Cp,mod − Cp,ref
Cp,ref
· 100 (2)
Cp,ref is the average pressure coefficient at the back surface of trailer with the rounded frontcorners, while Cp,mod is the average pressure coefficient at the back of the related modifiedtrailer. A negative 4Cp,back in terms of percentage corresponds with a less negative Cp,back (alower suction force) of a trailer equipped with an aerodynamic aid with respect to the Cp,back
of the reference trailer. The relation between the two quantities, 4CT and 4Cp,back, is in ad-dition a function of the yawing angle. Considering fig.17, only the totally blocked back-endconfiguration demonstrates a comparable behavior, but the difference in terms of percentage ofthe pressure coefficient decrement is double compared to the drag increase. Removing the mudflaps around the wheels results in a drag decrease of the vehicle but results in a more negativeunderpressure at the back surface.All the aerodynamic devices in fig.18 are showing rather the same influence: at zero yaw anglesthere is a certain benefit, a less negative Cp,back, only the amount of this benefit in terms ofpercentage is dependent of the corresponding aid. This benefit is constant or slightly increasesover the range 2◦ − 4◦ and then decreases with yaw angles above the 4◦.The side skirt with the sharp front, fig.9(c) performs the best in terms of pressure coefficientsincrease which can be regarded in fig.18. While this configuration was responsible for a dragcoefficient decrease of 12% which was less than the straight side skirt with the profile: 14%.According to Rose [13] this drag reduction corresponds with a fuel economy decrease of 7% athigh way speeds.Fig.19 shows the ratio between 4CT and 4Cp,back. One can notice that the changes of respec-tively 4CT and 4Cp,back for the side skirt with the sharp and round front are over the range ofyaw angles rather constant and positive. The latter signifies that the change in pressure coeffi-cient did not switch of sign. All the 4Cp,back of the other aerodynamic aids swithc of sign. It isnot easy to understand why the benefit in terms of percentage is decreasing with increasing yawangles without proper flow investigation techniques to determine the flow behavior. Literaturealso does not provide an explanation for this mechanism, apparently the relation of the changeof pressure coefficients with the yaw angle has not been investigated yet.
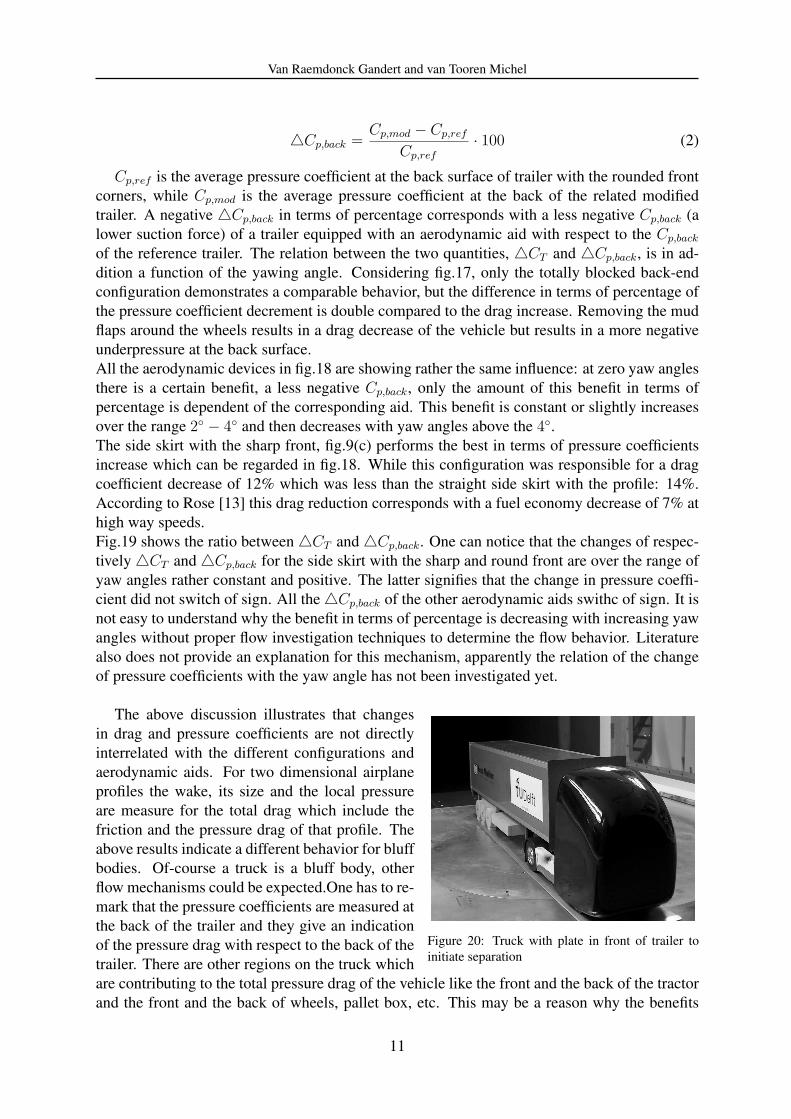
Figure 20: Truck with plate in front of trailer toinitiate separation
The above discussion illustrates that changesin drag and pressure coefficients are not directlyinterrelated with the different configurations andaerodynamic aids. For two dimensional airplaneprofiles the wake, its size and the local pressureare measure for the total drag which include thefriction and the pressure drag of that profile. Theabove results indicate a different behavior for bluffbodies. Of-course a truck is a bluff body, otherflow mechanisms could be expected.One has to re-mark that the pressure coefficients are measured atthe back of the trailer and they give an indicationof the pressure drag with respect to the back of thetrailer. There are other regions on the truck whichare contributing to the total pressure drag of the vehicle like the front and the back of the tractorand the front and the back of wheels, pallet box, etc. This may be a reason why the benefits
11
Van Raemdonck Gandert and van Tooren Michel
in drag coefficients are not immediately translated in pressure coefficients benefits measured atthe back of the trailer. Therefore one can state that the tested aerodynamic aids provide the bestlocal drag reduction and that depending on the aerodynamic aid the drag benefit is translated toa pressure coefficient benefit at the back of the trailer.
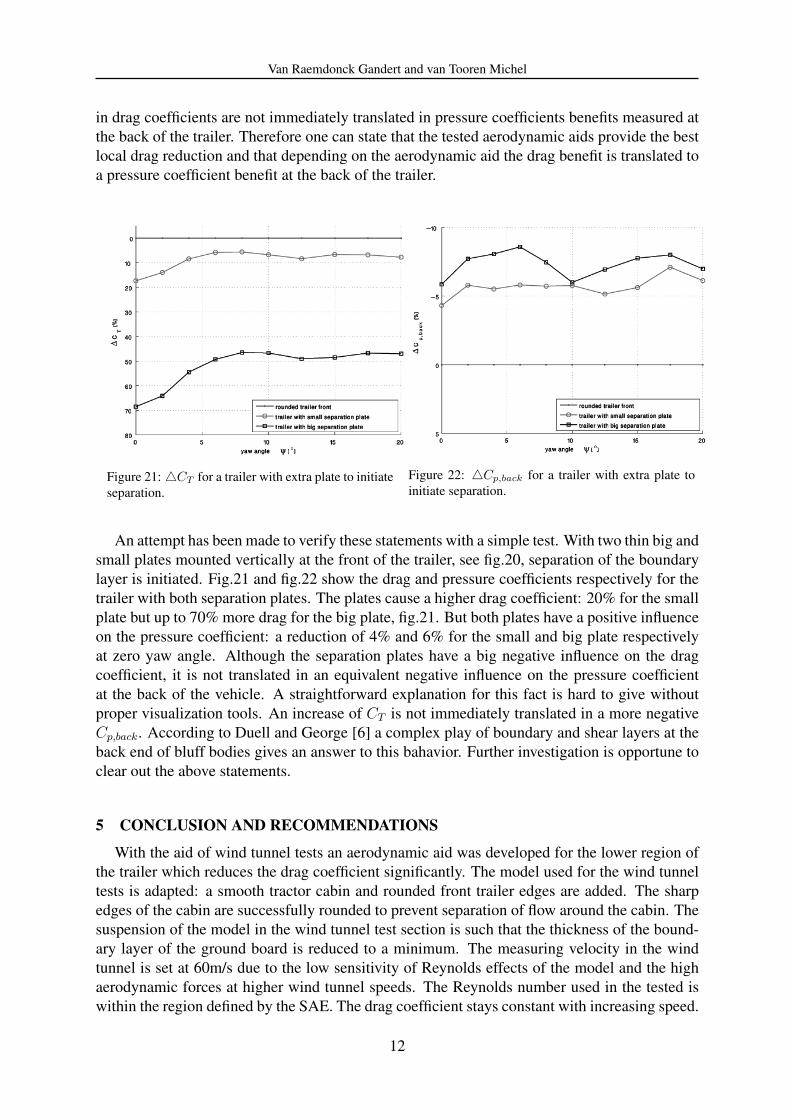
Figure 21: 4CT for a trailer with extra plate to initiateseparation.
Figure 22: 4Cp,back for a trailer with extra plate toinitiate separation.
An attempt has been made to verify these statements with a simple test. With two thin big andsmall plates mounted vertically at the front of the trailer, see fig.20, separation of the boundarylayer is initiated. Fig.21 and fig.22 show the drag and pressure coefficients respectively for thetrailer with both separation plates. The plates cause a higher drag coefficient: 20% for the smallplate but up to 70% more drag for the big plate, fig.21. But both plates have a positive influenceon the pressure coefficient: a reduction of 4% and 6% for the small and big plate respectivelyat zero yaw angle. Although the separation plates have a big negative influence on the dragcoefficient, it is not translated in an equivalent negative influence on the pressure coefficientat the back of the vehicle. A straightforward explanation for this fact is hard to give withoutproper visualization tools. An increase of CT is not immediately translated in a more negativeCp,back. According to Duell and George [6] a complex play of boundary and shear layers at theback end of bluff bodies gives an answer to this bahavior. Further investigation is opportune toclear out the above statements.
5 CONCLUSION AND RECOMMENDATIONS
With the aid of wind tunnel tests an aerodynamic aid was developed for the lower region ofthe trailer which reduces the drag coefficient significantly. The model used for the wind tunneltests is adapted: a smooth tractor cabin and rounded front trailer edges are added. The sharpedges of the cabin are successfully rounded to prevent separation of flow around the cabin. Thesuspension of the model in the wind tunnel test section is such that the thickness of the bound-ary layer of the ground board is reduced to a minimum. The measuring velocity in the windtunnel is set at 60m/s due to the low sensitivity of Reynolds effects of the model and the highaerodynamic forces at higher wind tunnel speeds. The Reynolds number used in the tested iswithin the region defined by the SAE. The drag coefficient stays constant with increasing speed.
12

Van Raemdonck Gandert and van Tooren Michel
Both facts underline that the chosen measuring velocity is sufficient to perform the tests.
The research was focused on two different types of aerodynamic aids: the side skirt and theunderbody principle. The drag force of the total vehicle and the pressure at the back of thevehicle were measured to investigate the influence of the different aerodynamic aids. In totalmore than 100 different configurations are tested in the wind tunnel. The configurations withthe straight side skirts and profile generated the highest drag reductions: up to 14%. This canbe translated in a fuel economy reduction of 7%. The reasons that this new aerodynamic add-on reduces the drag further then standard side skirts can be found in the fact that the locallyapplied modifications prevent flow separation at the sharp vertical edge of the normal side skirtat yaw angles higher than 0◦. Numerical analysis of the truck model with the new aerodynamicaid should clarify the total drag decrease of the vehicle and make it possible to optimize andincrease the efficiency of the device.
Pressure measurements are performed at the back of the trailer for all the different configura-tions in order to gather more information about its mutual relation. Just like the drag coefficient,the pressure coefficient stays constant with increasing Reynolds number: no Reynolds effectsare occurring. The comparison of the pressure coefficients between the different trailer configu-rations revealed other results with respect to the corresponding values and behavior of the dragcoefficient differences. A reason for these differences is that the corresponding aerodynamic aidreduces the drag locally and that this is not always translated into a pressure coefficient benefitat the back of the vehicle. Aerodynamic devices as for example side skirts do not only influencethe pressure drag of the back but apparently also other parts of the flow. Proper breakdown ofthe different (pressure) drag contribution of the model (front, middle and rear) with the aid ofnumerical analysis of generalized vehicle together with flow visualization and other measuringtechniques should help with gathering a more fundamental insight in the flow mechanisms inthe wake of bluff bodies to design a second generation of aerodynamic add-ons with an evenhigher fuel efficiency.
13
Van Raemdonck Gandert and van Tooren Michel
REFERENCES[1] Berndtsson, A., Mason, W. E., and Mercker, E., The Effect of Ground Plane Boundary Layer Control on
Automotive Testing in a Wind Tunnel. SAE Paper 880248, 1988.[2] Buckley, F.T.jr. Comparison of On-Road and Wind-Tunnel Tests for Tractor-Trailer Aerodynamic Devices,
and Fuel Savings Predictions. SAE Paper 850286, 1985.[3] Carr, G., A Comparison of The Ground-Plane-Suction and Moving-Belt Ground-Representation Techniques.
SAE Paper 880249, 1988.[4] Cooper, K., Bluff-Body Aerodynamics as Applied to Vehicles. Journal of Wind Engineering and Industrial
Aerodynamics. Vol. 49, 1993, pp. 1-21.[5] Cooper, K., The Wind Tunnel Testing of Heavy Duty Trucks to Reduce Fuel Consumption. SAE Paper
821285, 1982.[6] Duell, E.G. and George, A.R. Experimental Study of Ground Vehicle Body Unsteady Near Wake. SAE Paper
1999-01-0812, 1999.[7] Eckert, W., Singer, N., and Vagt, J.-D., The Porsche Wind Tunnel Floor-Boundary-Layer Control - A Com-
parison with Road Data and Results form Moving Belt. SAE Paper 920346, 1992.[8] Hacket, J., Baker, H., Williams, J., and Wallis, S., On the Influence of Ground Movements and Wheel
Rotation in Tests on Modern Car Shapes. SAE Paper 750245, 1975.[9] Harwell and Didcot, Truck Aerodynamic Styling. Oxfordshire, 2001.
[10] Hoerner, S., Fluid-Dynamic Drag. Hoerner Fluid Dynamics, Vancouver, 1965.[11] Mercker, E. and Knape, H., Ground Simulation with Moving Belt and Tangential Blowing for Full-Scale
Automotive Testing in a Wind Tunnel. SAE Paper 890367, 1989.[12] Ortega, J. and Salari, K., An Experimental Study of Drag Reduction Devices for a Trailer Uderbody and
Base. AIAA Journal 2004-2252, 2004.[13] Rose, M.J., Commercial Vehicle Fuel Economy - The Correlation Between Aerodynamic Drag and Fuel
Consumption of a Typical Truck. Journal of Wind Engineering and Industrial Aerodynamics, Vol. 9:89-100,1981.
[14] Society of Automotive Engineers, SAE Wind Tunnel Test Procedure for Truck and Buses. SAE J1252, 1981.[15] Storms, B., Satran, D., Heinick, J., and Walker, S., A Study of Reynolds Number Effects on Drag Reduction
Concepts on a Genereic Tractor-Trailer. AIAA Journal 2004-2251, 2004.[16] Van Raemdonck, G., Data Acquisition System of a Tractor-Trailer Combination to Register Aerodynamic
Performances. Aerodynamic of Heavy Duty Vehicles II: Trucks, Busses and Trains, to be publised.[17] Van Raemdonck, G., Design of an Aerodynamic Aid for a Tractor-Trailer Combination. Master’s thesis,
Delft University of Technology, Faculty of Aerospace Engineering, 2006.[18] Wood, R., Impact of Advanced Aerodynamic Technology on Transportation Energy Consumption. SAE Pa-
per 2004-01-1306, 2004.[19] Wood, R. and Bauer, S., Simple and Low-Cost Aerodynamic Drag Reduction Devices. SAE Paper 2003-01-
337, 2003.[20] Ruhrmann, A. and Zang, X., Influence of Diffuser Angle of a Bluff Body in Ground Effect. Journal of Fluids
Engineering, Vol. 125, 2003.[21] Guide line 89/297/EEG. http://www.focwa.nl/assets/carrosseriebouw/richtlijnen/carrosserie/89-
297%20zij%20afscherming.pdf[22] Esterline Pressure Systems, http://www.pressure-systems.com/esp scanners.html.
14