Embed Size (px)
Citation preview
i
Design of a universal phantom for quality
assurance in diagnostic radiology x-ray
imaging
by
Annemari Groenewald
Dissertation presented for the degree of
Doctoral (Medical Physics)
in the Faculty of Health Sciences at Stellenbosch University
Radiodiagnosis Division
Department of Medical Imaging and Clinical Oncology
Faculty of Medicine and Health Sciences
Supervisor: Dr Willem Adolf Groenewald
Date: December 2017

ii
Declaration
By submitting this dissertation electronically, I declare that the entirety of the work
contained therein is my own, original work, that I am the sole author thereof (save to
the extent explicitly otherwise stated), that reproduction and publication thereof by
Stellenbosch University will not infringe any third party rights and that I have not
previously in its entirety or in part submitted it for obtaining any qualification.
Date: December 2017
Copyright © 2017 Stellenbosch University
All rights reserved
Stellenbosch University https://scholar.sun.ac.za
iii
Abstract
Introduction
In medical X-ray imaging several diagnostic x-ray imaging modalities are applied to
enable disease diagnosis, i.e. general projection radiography, fluoroscopy,
mammography and Computed Tomography (CT) scanning. X-ray images must be of
sufficient quality to enable accurate diagnosis. Image quality is quantified using
suitable phantoms to ensure that equipment failure is detected before patient care is
affected.
A variety of phantoms are commercially available. However, these are modality
specific, expensive and often complicated to use. In resource limited institutions, like
many in Africa including South Africa, three problems are identified in the field of
diagnostic radiology X-ray image quality control (QC). These are cost, man power
and expertise and time constraints. A gap thus exists in the market for a single
universal image quality assurance (QA) phantom, capable of doing all required QC
tests for all X-ray imaging modalities. A phantom, answering to this requirement, in
addition must be user-friendly and cost- and time-efficient.
Aim
To design, develop, manufacture, test and validate a universal image QA phantom for
diagnostic radiology X-ray imaging. The phantom must be compact, unique, universal
(i.e. not modality specific), easy and quick to use and manufactured at a substantially
reduced cost compared to the commercially available options.
Materials and methods
Using literature studies on existing commercial phantoms for guidance, a prototype
universal phantom was designed, manufactured and tested for all X-ray imaging
modalities. From the prototype results, adjustments were made and the universal
image quality phantom was developed and manufactured. The phantom is made from
high density polyethylene and houses several inserts of different materials to asses
Stellenbosch University https://scholar.sun.ac.za
iv
sensitometry, image uniformity, limiting resolution, image noise, i.e. signal-to-noise
(SNR) and contrast-to-noise (CNR) ratios, geometry and measurement tools, standard
signal, low contrast detectability, positioning and alignment, artefacts and visual image
quality inspection. For CT scanning the phantom measures slice thickness and for
mammography masses, fibres and micro-calcifications are evaluated. Data analysis
software was developed for analysis of obtained images and a complete step-by-step
user’s manual was prepared. Reproducibility testing was performed on the phantom,
using Department of Health (DoH) specified limits. Independent validation of the
phantom package (i.e. phantom, software and manual) was done by three
independent medical physicists. They compared the phantom to the commercial
phantoms in general use in their institutes.
Results
The universal image QA phantom and accompanying data analysis software produced
reproducible results for all imaging modalities, within the accepted DoH tolerance
levels. The independent validation results proofed that the phantom package was
easy to transport, light weight and compact, easy to set-up and use, versatile, cost
effective and user friendly.
Discussion and conclusion
From the reproducibility testing and independent validation results it may be concluded
that the universal image QA phantom, with accompanying data analysis software and
user’s manual, offers an acceptable single phantom solution for medical X-ray
imaging. The universal phantom is a cost and time saver and as such could fill a gap
in the existing market. In addition, the phantom could also be used by radiographers
in resource limited institutions.
Stellenbosch University https://scholar.sun.ac.za

v
Opsomming
Inleiding
Mediese X-straalbeelding gebruik verskeie diagnostiese X-straal beeldingsmodaliteite
om siekte te diagnoseer. Dít sluit algemene projeksieradiografie, fluoroskopie,
mammografie en rekenaartomografie- (RT-)skandering in. Die X-straalbeelde moet
van ’n voldoende gehalte wees om akkurate diagnose moontlik te maak. Beeldgehalte
word met behulp van geskikte fantome gekwantifiseer om te sorg dat onklaar
toerusting opgespoor word voordat dit pasiëntesorg beïnvloed.
’n Verskeidenheid fantome is kommersieel verkrygbaar. Tog is dit metodespesifiek,
duur en dikwels ingewikkeld om te gebruik. By hulpbronbeperkte instellings,
waaronder baie instellings in Afrika, wat Suid-Afrika insluit, word veral drie probleme
met die gehaltebeheer van diagnostiese X-straalbeelding ondervind, naamlik koste,
menslike hulpbronne en kundigheid, en tydsbeperkinge. Daar is dus ’n leemte in die
mark vir ’n enkele, universele beeldgehalteversekeringsfantoom wat alle nodige
gehaltebeheertoetse vir alle X-straalbeeldingsmetodes kan uitvoer. Daarbenewens
moet so ’n fantoom gebruikersvriendelik en sowel koste- as tyddoeltreffend wees.
Doelwit
Die doelwit is om ’n universele beeldgehalteversekeringsfantoom vir diagnostiese
radiologie-X-straalbeelding te ontwerp, te ontwikkel, te vervaardig, te toets en te staaf.
Die fantoom moet kompak, uniek en universeel (d.w.s. nie metodespesifiek nie) wees,
sowel as maklik en vinnig om te gebruik. Boonop moet dit aansienlik goedkoper wees
om te vervaardig as die huidige kommersieel verkrygbare fantome.
Materiaal en metodes
Aan die hand van ’n literatuurstudie oor bestaande kommersiële fantome is ’n
prototipe- universele fantoom vir alle X-straalbeeldingsmetodes ontwerp, gebou en
getoets. Die ontwerp is op grond van die prototiperesultate aangepas, waarna die
universele beeldgehaltefantoom ontwikkel en vervaardig is. Die fantoom word
Stellenbosch University https://scholar.sun.ac.za
vi
gemaak van hoëdigtheid-poliëtileen en bestaan uit verskeie invoegsels van
verskillende materiale vir die evaluering van sensitometrie, beeldeenvormigheid,
resolusiebeperking, beeldgeruis (met ander woorde sein-tot-geruis- en kontras-tot-
geruis-verhoudings), geometrie en meetgereedskap, standaardsein,
laekontrasopsporing, posisionering en belyning, artefakte, en visuele beeldgehalte.
Vir RT-skandering meet die fantoom snitdikte, en vir mammografie word die opsporing
van gewasse, vesels en mikroverkalkings geëvalueer. Dataontledingsagteware is
ontwikkel om opgeneemde beelde te ontleed, en ’n volledige stapsgewyse
gebruikershandleiding is saamgestel. Herhaalbaarheidstoetse is aan die hand van
die Departement van Gesondheid se gespesifiseerde perke met die fantoom
uitgevoer. Drie onafhanklike mediese fisici het die fantoompakket (d.w.s. fantoom,
sagteware en handleiding) onafhanklik gestaaf. Hulle het die fantoom vergelyk met
die kommersiële fantome wat hulle onderskeie instellings oor die algemeen gebruik.
Resultate
Die universele beeldgehaltesekerheidsfantoom en gepaardgaande
dataontledingsagteware lewer herhaalbare resultate vir alle beeldingsmetodes op, wat
ook binne die Departement van Gesondheid se toleransieperke val. Die onafhanklike
geldigheidsresultate bewys dat die fantoompakket maklik vervoer, liggewig en kompak
is, maklik is om op te stel en te gebruik, en boonop veelsydig en kostedoeltreffend is.
Bespreking en gevolgtrekking
Die herhaalbaarheidstoetse en onafhanklike geldigheidsresultate dui daarop dat die
universele beeldgehaltesekerheidsfantoom, tesame met die gepaardgaande
dataontledingsagteware en gebruikershandleiding, ’n aanvaarbare enkele
fantoomoplossing vir mediese X-straalbeelding bied. Die universele fantoom spaar
geld en tyd, en kan dus ’n leemte in die bestaande mark vul. Dit kan veral goed te pas
kom vir radiografiste in hulpbronbeperkte instellings.
Stellenbosch University https://scholar.sun.ac.za

vii
Dedication
This thesis is dedicated to Blue.
Stellenbosch University https://scholar.sun.ac.za

viii
Acknowledgements
I am grateful to my supervisor and co-supervisor, Dr Wilhelm Groenewald and Dr
Harry Delis, for their guidance, valuable input and much appreciated support.
A special word of thanks to Johan Braasch, of Gebrateq Advanced Engineering, for
his assistance in the design and manufacturing of the proposed phantom, and to Ernst
Uys for development of the data analysis software. I also thank the Medical Physics
Divisions at Groote Schuur, Charlotte Maxeke Johannesburg Academic and Inkosi
Albert Luthuli Central Hospitals for independent validation of the phantom package.
Thank you to Elsie Bester and the team from Winelands Radiology in Vergelegen Medi
Clinic for allowing and arranging imaging of the phantom. Thank you to Dr Alan
Chamberlain for proof reading the thesis.
Grateful acknowledgement is made to the following instances:
Harry Crossley bursary fund for awarding me a bursary for my research.
Innovus for registration of the international patent PCT/IB2016/051165.
Chris Vine-Soanes, from Gartech Equipment, for the assistance and supply of different
plastics and specifications.
Hendrik de Vos, of Netcare, for supplying commercial phantoms for validation of the
phantom.
Cobus Visser and Wayne Swart from the Department of Mechanical and Mechatronic
Engineering at Stellenbosch University for 3-D printing of inserts.
The staff of the radiology and medical physics departments at Tygerberg Academic
Hospital for their assistance and for allowing me to conduct the study in their
departments.
Equra Health for allowing me to conduct research during office hours.
A final word of thanks to anyone who supported me in any way throughout the project.
Stellenbosch University https://scholar.sun.ac.za

ix
Table of contents
Heading Page
Chapter 1 – Introduction 1
Chapter 2 - Diagnostic radiology imaging and quality assurance 7
2.1 The physics of image formation 7
2.1.1 X-rays 7
2.1.2 Interactions of x-rays with matter 9
2.1.2.1 Rayleigh scatter 9
2.1.2.2 Compton scatter 10
2.1.2.3 Photoelectric effect 11
2.1.3 X-ray attenuation coefficients 13
2.2 Evaluation of image quality 14
2.2.1 Image contrast 15
2.2.1.1 Local (Weber) contrast 16
2.2.1.2 Subject contrast 16
2.2.1.3 Image contrast 17
2.2.2 Image resolution 17
2.2.3 Image noise 19
2.3 Image quality assurance in South African practice 20
Chapter 3 - Current image quality assurance systems 23
3.1 General x-ray imaging 23
3.1.1 Image formation 24
3.1.1.1 Film-screen radiography 26
3.1.1.2 Computed radiography (CR) 26
3.1.1.3 Digital radiography (DR) 27
3.1.2 Image QA parameters 28
Stellenbosch University https://scholar.sun.ac.za

x
3.1.3 Current image QA phantoms 29
3.1.3.1 TOR CDR® phantom 29
3.1.3.2 NORMI 13® phantom 30
3.2 Fluoroscopy imaging 32
3.2.1 Image formation 32
3.2.2 Image QA parameters 33
3.2.3 Current image QA phantoms 35
3.2.3.1 TOR 18FG® phantom 36
3.2.3.2 RD/FL® contrast-resolution test phantom 36
3.2.3.3 Pro-RF® phantom 37
3.2.3.4 Fluoro-test resolution tool 38
3.2.3.5 L600® alignment phantom 38
3.2.3.6 Fluoroscopy phantom 07-649 CDRH® 39
3.2.3.7 SFS set 39
3.2.3.8 R/F QC® phantom 39
3.2.3.9 CIRS model 903® radiography/fluoroscopy QA phantom 40
3.2.3.10 Gammex rad/fluoro kit 184D® 41
3.2.3.11 Fluoroscopic imaging test phantom 42
3.2.3.12 NORMI Rad/Flu® phantom 42
3.3 Mammography imaging 45
3.3.1 Image formation 46
3.3.2 Image QA parameters 47
3.3.3 Current image QA phantoms 49
3.3.3.1 Gammex 156® mammographic accreditation phantom 49
3.3.3.2 Tissue equivalent model 011A® phantom 50
3.3.3.3 Gammex 183® mammographic QC kit 51
3.3.3.4 CIRS high contrast resolution phantom 51
3.3.3.5 Artefact identification and contrast detail phantoms 51
3.3.3.6 CIRS model 020 BR3-D® phantom 52
3.3.3.7 CIRS mammographic step wedge 53
3.3.3.8 NORMI PAS® phantom 53
3.4 Computed tomography scanning 56
3.4.1 Image formation 56
3.4.2 Image QA parameters 60
Stellenbosch University https://scholar.sun.ac.za

xi
3.4.3 Current image QA phantoms 63
3.4.3.1 Gammex ACR® phantom 63
3.4.3.2 Gammex 451A® head/body phantom 65
3.4.3.3 CIRS model 61D® AAPM CT performance phantom 65
3.4.3.4 Spiral/helical CT phantom 66
3.4.3.5 Catphan phantom 67
Chapter 4 – Design and development of the universal image quality
assurance phantom 71
4.1 Initial concepts 71
4.1.1 Initial design 72
4.1.2 Second design 75
4.2 First prototype of the universal phantom 80
4.2.1 Prototype inserts and materials 80
4.2.2 Prototype machining and manufacturing 83
4.2.3 Initial prototype imaging and evaluation 87
4.3 Validation of the first prototype of the universal phantom 92
4.3.1 General x-ray imaging validation 94
4.3.2 Fluoroscopy imaging validation 96
4.3.3 Mammography imaging validation 98
4.3.4 Computed tomography scanning validation 101
4.4 Final phantom 103
4.4.1 Phantom inserts and materials 104
4.4.2 Phantom machining and manufacturing 106
4.4.3 Initial phantom imaging and evaluation 110
Chapter 5 - The universal phantom as image quality assurance solution 113
5.1 Image quality assurance using the universal phantom 113
5.1.1 Image quality tests applicable to general x-rays, fluoroscopy,
mammography and CT scanning 113
5.1.2 Automatic exposure control image quality tests applicable to
general x-rays, fluoroscopy and mammography 120
5.1.3 Image quality tests applicable to mammography 120
5.1.4 Image quality tests applicable to CT scanning 122
Stellenbosch University https://scholar.sun.ac.za

xii
5.2 Overview of the universal phantom user’s manual and data
analysis software 123
Chapter 6 – Reproducibility testing of the universal phantom 125
6.1 General x-ray imaging reproducibility testing 125
6.2 Fluoroscopy imaging reproducibility testing 134
6.3 Mammography imaging reproducibility testing 144
6.4 CT scanning reproducibility testing 153
Chapter 7 - Independent validation of the universal phantom package 162
7.1 General x-ray imaging validation 168
7.1.1 Response from CMJAH 168
7.1.2 Response from GSH 169
7.1.3 Response from IALCH 169
7.2 Fluoroscopy imaging validation 170
7.2.1 Response from CMJAH 171
7.2.2 Response from GSH 171
7.2.3 Response from IALCH 172
7.3 Mammography imaging validation 173
7.3.1 Response from CMJAH 174
7.3.2 Response from GSH 175
7.4 Computed Tomography scanning validation 176
7.4.1 Response from CMJAH 176
7.4.2 Response from GSH 177
7.4.3 Response from IALCH 178
7.5 Evaluation of the complete package 179
7.5.1 Response from CMJAH 180
7.5.2 Response from GSH 181
7.5.3 Response from IALCH 184
7.6 Conclusions from independent validation 186
Chapter 8 – Conclusion 188
Bibliography 193
Stellenbosch University https://scholar.sun.ac.za
xiii
Appendices
Appendix A - Universal image quality assurance phantom user’s
manual Ai
Appendix B - Data analysis software B1
Appendix C - Density calculations C1
Appendix D – Publication and presentation D1
Stellenbosch University https://scholar.sun.ac.za

xiv
List of Figures
Figure Page
Figure 2.1: Basic schematic representation of an x-ray tube 8
Figure 2.2: An x-ray spectrum 9
Figure 2.3: Raleigh scatter 10
Figure 2.4: Compton scatter 11
Figure 2.5: The photoelectric effect 12
Figure 2.6: Window width and window level in digital imaging 14
Figure 2.7: MTF 18
Figure 3.1: The first radiograph by Wilhelm Conrad Roentgen 24
Figure 3.2: The concept of projection radiography 25
Figure 3.3: Image formation in CR imaging 27
Figure 3.4: An x-ray image of the TOR CDR® phantom 30
Figure 3.5: The NORMI 13® phantom 31
Figure 3.6: The Leads TOR 18FG® phantom 36
Figure 3.7: The RD/FL® contrast- resolution test phantom 37
Figure 3.8: The Pro-RF® resolution test phantom 37
Figure 3.9: The fluoro-test resolution tool 38
Figure 3.10: CIRS L600® fluoroscopic alignment device 38
Figure 3.11: The CDRH® test phantom 39
Figure 3.12: The SFS® set for fluoroscopy image quality assurance 40
Figure 3.13: The R/F® phantom 40
Figure 3.14: CIRS Model 903® phantom 41
Figure 3.15: Gammex Rad/Fluoro® kit 41
Figure 3.16: The Fluoroscopic Imaging Test Phantom 42
Figure 3.17: The NORMI Rad/Flu® fluoroscopy phantom 43
Figure 3.18: Mammography imaging 47
Figure 3.19: The Gammex 156® mammographic accreditation
phantom 49
Stellenbosch University https://scholar.sun.ac.za

xv
Figure 3.20: The CIRS Tissue Equivalent Model 011A® phantom 50
Figure 3.21: The CIRS Model 016B bar phantom 51
Figure 3.22: CIRS mammography phantoms 52
Figure 3.23: The CIRS Model 020 BR3-D phantom® 52
Figure 3.24: CIRS mammographic step wedge® 53
Figure 3.25: The NORMI PAS® phantom 54
Figure 3.26: CT back projection 57
Figure 3.27: The Gammex ACR® CT phantom modules 64
Figure 3.28: The Gammex 461A® head/body phantom 65
Figure 3.29: The CIRS model 610® AAPM CT performance phantom 66
Figure 3.30: The Universal Medical spiral/helical CT phantom 66
Figure 3.31: The Catphan® phantom 67
Figure 4.1: Initial universal phantom concept 73
Figure 4.2: X-ray image of a golf ball 75
Figure 4.3: Developed universal image quality assurance phantom
concept 77
Figure 4.4: 3-D printed PLA (green) and Hips (white) cubes 80
Figure 4.5: Working drawings of the phantom prototype housing 81
Figure 4.6: Prototype insert materials and layout 82
Figure 4.7: Machining of the phantom housing 83
Figure 4.8: Positioning the inserts in the phantom housing 86
Figure 4.9: First prototype of the universal image quality assurance
phantom 87
Figure 4.10: First images of the first universal image quality assurance
phantom prototype 88
Figure 4.11: Slice thickness calculation for a.) a ramp made of a slab
(as in the universal image quality assurance phantom) and
b.) a wire ramp 90
Figure 4.12: Slice thickness is measured in the red line direction in the
universal image quality assurance phantom and prototype 91
Figure 4.13: The universal image quality assurance phantom prototype
with the commercial phantoms used for prototype validation 93
Figure 4.14: Comparison of prototype to NORMI® 13 phantom with
general x-ray imaging parameters as in Table 4.6 95
Stellenbosch University https://scholar.sun.ac.za

xvi
Figure 4.15: Comparison of prototype to NORMI® Rad/Flu phantom
with fluoroscopy imaging parameters as in Table 4.7 97
Figure 4.16: Comparison of prototype to NORMI® PAS phantom with
mammography imaging parameters as in Table 4.8 100
Figure 4.17: Comparison of prototype to Catphan® 600 phantom with
CT scanning parameters as in Table 4.9 101
Figure 4.18: CT scanning set-up plate 103
Figure 4.19: Universal phantom insert materials and dimensions 105
Figure 4.20: Making the universal phantom 107
Figure 4.21: The completed phantom bottom half with inserts in place 109
Figure 4.22: The universal image quality assurance phantom 109
Figure 4.23: Comparison of the prototype (bottom in the images) and
phantom (top in the images) 110
Figure 4.24: Initial images of the universal image quality assurance
phantom 112
Figure 5.1: ROI location for sensitometry assessment indicated in red 114
Figure 5.2: ROI location for low contrast detectability assessment.
Cubes are pointed out in red 115
Figure 5.3: ROI location illustrated in red used for uniformity
assessment 116
Figure 5.4: Metallic ball location for resolution MTF assessment,
as shown in red 116
Figure 5.5: ROI location, in red, for SNR and CNR assessment 117
Figure 5.6: X-ray to light field coincidence 118
Figure 5.7: Measurements for distance accuracy and scaling
assessment, indicated with red lines 118
Figure 5.8: ROI location for standard signal assessment, as shown
in red 119
Figure 5.9: Location of fibre simulating inserts, included in red outline 121
Figure 5.10: Location of micro-calcification simulating inserts in the red
circle outline 122
Figure 5.11: The red circle shows the location of ramp for CT slice
thickness measurement 123
Figure 6.1: General x-rays reproducibility images 128
Stellenbosch University https://scholar.sun.ac.za

xvii
Figure 6.2: General x-rays data analysis software
reproducibility results for sensitometry for bone and
Teflon with tolerance limits of ± 2 % 128
Figure 6.3: General x-rays data analysis software reproducibility
results for sensitometry for lung and RGD240 with
tolerance limits of ± 2 % 129
Figure 6.4: General x-rays data analysis software
reproducibility results for sensitometry for air and
Supawood with tolerance limits of ± 2 % 130
Figure 6.5: General x-rays data analysis software reproducibility
results for uniformity with tolerance limits of ± 5 %,
limiting resolution results with tolerance limits of – 25 %
and SNR results with tolerance limits of ± 10 % 131
Figure 6.6: General x-rays data analysis software reproducibility
results for CNR with tolerance limits of ± 10 % 131
Figure 6.7: General x-rays data analysis software
reproducibility results for geometry and measurement
tools for horizontal measurement with tolerance limits of
± 5 mm 132
Figure 6.8: General x-rays data analysis software
reproducibility results for geometry and measurement
tools for vertical measurement with tolerance limits of
± 5 mm 132
Figure 6.9: General x-rays data analysis software reproducibility
results for standard signal with tolerance limits of ± 2 % 133
Figure 6.10: Fluoroscopy reproducibility images 135
Figure 6.11: Fluoroscopy data analysis software reproducibility
results for sensitometry for air, bone, Teflon and RGD240
with tolerance limits of ± 2 % 139
Figure 6.12: Fluoroscopy data analysis software reproducibility
results for sensitometry for lung with tolerance limits of
± 2 % 139
Stellenbosch University https://scholar.sun.ac.za

xviii
Figure 6.13: Fluoroscopy data analysis software reproducibility
results for sensitometry for supawood with tolerance limits
of ± 2 % 140
Figure 6.14: Fluoroscopy data analysis software reproducibility results
for uniformity and SNR with tolerance limits of ± 10 % 140
Figure 6.15: Fluoroscopy data analysis software reproducibility
results for limiting resolution results with tolerance limits
of – 25 % 141
Figure 6.16: Fluoroscopy data analysis software reproducibility results
for CNR with tolerance limits of ± 10 % 141
Figure 6.17: Fluoroscopy data analysis software reproducibility results
for geometry and measurement tools results for horizontal
measurement with tolerance limits of ± 5 mm 142
Figure 6.18: Fluoroscopy data analysis software reproducibility results
for geometry and measurement tools for vertical
measurement with tolerance limits of ± 5 mm 142
Figure 6.19: Fluoroscopy data analysis software reproducibility
results for standard signal results with tolerance limits of
± 2 % 143
Figure 6.20: Mammography reproducibility images 144
Figure 6.21: Mammography data analysis software
reproducibility results for sensitometry for bone and
Teflon with tolerance limits of ± 2 % 148
Figure 6.22: Mammography data analysis software
reproducibility results for sensitometry results for air,
lung, Supawood and RGD240 with tolerance limits of
± 2 % 149
Figure 6.23: Mammography data analysis software
reproducibility results for uniformity and CNR with
tolerance limits of ± 10 % 150
Figure 6.24: Mammography data analysis software reproducibility
results for limiting resolution and SNR with tolerance
limits of – 2 for limiting resolution and ± 10 % for SNR 150
Stellenbosch University https://scholar.sun.ac.za

xix
Figure 6.25: Mammography data analysis software
reproducibility results for geometry and measurement
tools results for horizontal measurement with tolerance
limits of ± 2 % 151
Figure 6.26: Mammography data analysis software reproducibility
results for geometry and measurement tools for vertical
measurement with tolerance limits of ± 2 % 151
Figure 6.27: Mammography data analysis software reproducibility
results for standard signal with tolerance limits of ± 2 % 151
Figure 6.28: CT scanning reproducibility images 153
Figure 6.29: CT scanning data analysis software reproducibility
results for sensitometry results for bone, Teflon and
RGD240 with tolerance limits of ± 10 % 157
Figure 6.30: CT scanning data analysis software reproducibility
results for sensitometry for air, lung and supawood with
tolerance limits of ± 10 % 157
Figure 6.31: CT scanning data analysis software reproducibility results
for uniformity and CNR results with tolerance limits of
± 10 % 158
Figure 6.32: CT scanning data analysis software reproducibility
results for limiting resolution with tolerance limits of
– 25 % and SNR results with tolerance limits of ± 10 % 158
Figure 6.33: CT scanning data analysis software reproducibility results
for geometry and measurement tools for horizontal
measurement with tolerance limits of ± 5 mm 159
Figure 6.34: CT scanning data analysis software reproducibility results
for geometry and measurement tools for vertical
measurement with tolerance limits of ± 5 mm 159
Figure 6.35: CT scanning data analysis software reproducibility results
for standard signal with tolerance limits of ± 10 % 160
Figure 6.36: CT scanning data analysis software reproducibility
results for slice thickness with tolerance limits of ± 10 % 160
Figure 7.1: The universal image quality assurance phantom package 163
Stellenbosch University https://scholar.sun.ac.za

xx
Figure 7.2: Evaluation sheets used by independent evaluators to
assess the universal image quality assurance phantom
package and compare it to commercially available options 164
Figure 7.3: Independent evaluation results from CMJAH for general
x-ray imaging 168
Figure 7.4: Independent evaluation results from GSH for general
x-ray imaging 169
Figure 7.5: Independent evaluation results from IALCH for general
x-ray imaging 170
Figure 7.6: Independent evaluation results from CMJAH for
fluoroscopy imaging 171
Figure 7.7: Independent evaluation results from GSH for
fluoroscopy imaging 172
Figure 7.8: Independent evaluation results from IALCH for
fluoroscopy imaging 173
Figure 7.9: Independent evaluation results from CMJAH for
mammography imaging 174
Figure 7.10: Independent evaluation results from GSH for
mammography imaging 175
Figure 7.11: Independent evaluation results from CMJAH for CT
scanning 177
Figure 7.12: Independent evaluation results from GSH for CT
scanning 178
Figure 7.13: Independent evaluation results from IALCH for CT
scanning 179
Figure 7.14: Independent evaluation results from CMJAH for overall
evaluation of the phantom package 181
Figure 7.15: Independent evaluation results from GSH for overall
evaluation of the phantom package 183
Figure 7.16: Independent evaluation results from IALCH for overall
evaluation of the phantom package 184
Stellenbosch University https://scholar.sun.ac.za

xxi
List of Tables
Table Page
Table 2.1: DoH recommendations for image QC for general x-rays
and fluoroscopy, unless otherwise stated. (adapted from
DoH requirements for QC document7) 21
Table 3.1: Summary of commercially available modality specific
general x-ray phantoms compared to the universal image
quality assurance phantom 32
Table 3.2: Summary of commercially available modality specific
fluoroscopy phantoms compared to the universal image
quality assurance phantom 44
Table 3.3: Summary of commercially available modality specific
mammography phantoms compared to the universal
image quality assurance phantom 55
Table 3.4: Typical CT-number values and possible CT-number
value ranges 59
Table 3.5: Summary of commercially available modality specific CT
phantoms compared to the universal image quality
assurance phantom 69
Table 4.1: Possible phantom housing materials 76
Table 4.2: Possible low contrast detectability material 77
Table 4.3: Possible grey scale insert materials 78
Table 4.4: Prototype insert materials 83
Table 4.5: First prototype imaging parameters 89
Table 4.6: Prototype slice thickness measurements 92
Table 4.7: General x-ray exposure parameters 94
Table 4.8: Fluoroscopy exposure parameters 97
Table 4.9: Mammography exposure parameters 98
Table 4.10: CT scanning exposure parameters 101
Stellenbosch University https://scholar.sun.ac.za
xxii
Table 4.11: Prototype insert materials 106
Table 4.12: Phantom imaging parameters 111
Table 6.1: Reproducibility testing exposure technique factors for
general x-ray imaging 125
Table 6.2: General x-ray reproducibility testing visual inspection
results. (Appendix A, A.2.3.4) 126
Table 6.3: General x-ray reproducibility testing data analysis
software results. (Appendix A, A.2.3.5) 126
Table 6.4: Reproducibility testing exposure technique factors for
fluoroscopy imaging 135
Table 6.5: Fluoroscopy x-ray reproducibility testing visual
inspection results. (Appendix A, A.2.3.4) 136
Table 6.6: Fluoroscopy x-ray reproducibility testing data analysis
software results. (Appendix A, A.2.3.5) 137
Table 6.7: Reproducibility testing exposure technique factors for
mammography imaging 145
Table 6.8: Mammography reproducibility testing visual
inspection results. (Appendix A, A.2.4.4) 145
Table 6.9: Mammography reproducibility testing data analysis
software results. (Appendix A, A.2.4.5) 146
Table 6.10: Reproducibility testing exposure technique factors for
CT scanning 153
Table 6.11: CT scanning reproducibility testing visual inspection
results. (Appendix A, A.2.5.4) 154
Table 6.12: CT scanning reproducibility testing data analysis
software results. (Appendix A, A.2.5.5) 155
Stellenbosch University https://scholar.sun.ac.za

xxiii
List of abbreviations
AAPM American Association of Physicists in Medicine
ABC Automatic Brightness Control
ABS Acylonitrile Butadiene Styrene
ACR American College of Radiology
AEC Automatic exposure control
ALARA As low as reasonably achievable
arb. Arbitrary
CCD Charge-coupled device
cm Centimetre
CNR Contrast to noise ratio
CT Computed tomography
CR Computed radiography
DoH Department of health
DR Digital Radiography
ESF Edge spread function
FOV Field of view
FWHM Full width at half maximum
HDPE High density polyethylene
HU Hounsfield unit
IBs Inspection bodies
kV Kilo voltage
lp/cm Line pairs per centimetre
lp/mm Line pairs per millimetre
LSF Line spread function
mAs Milli-ampere seconds
mm Millimetre
MTF Modulation transfer function
OD Optical Density
PLA Poly Lactic Acid
Stellenbosch University https://scholar.sun.ac.za

xxiv
PMMA Poly-methyl methacrylate
PMT Photo-multiplier tube
PSF Point spread function
PSP Photo-stimulable phosphor
SOP Standard operating procedure
QA Quality assurance
QMS Quality management system
QC Quality control
ROI Region of interest
SANAS South African National Accreditation System
SDNR Signal-difference-to-noise ratio
SID Source-to-image distance
SNR Signal-to-noise ratio
USA United States of America
WL Window level
WW Window width
2-D Two dimensional
3-D Three dimensional
Stellenbosch University https://scholar.sun.ac.za

1
Chapter 1
Introduction
Medical imaging requires the application of radiation, for example x-rays, that
have the ability to penetrate the tissues of the human body. X-rays are able to enter
the body and interact with tissues, producing an image of the internal anatomy of the
body.1 These images, produced by different imaging modalities in diagnostic
radiology, assist radiologists to diagnose and follow up a wide variety of diseases and
pathologies.
To ensure that the obtained images are of acceptable quality, i.e. can be used clinically
for accurate diagnosis, image quality should be evaluated and maintained. Image
quality is a subjective concept that requires certain measures to be objectively
quantified. Quantification may be done by using phantoms during routine quality
control.
In a radiology practice a framework for a Quality Management System (QMS) plays
an essential role. The QMS considers the objectives and policies of the division,
whether documents and procedures in line with these objectives and policies are
available, provides practical written instructions for staff and monitors, records, audits
and corrects all procedures and practises. Quality assurance (QA) covers all factors
affecting the intended outcome, which is an accurate clinical diagnosis in the field of
diagnostic radiology. QA thus includes all actions needed to ensure that equipment
satisfies quality requirements. In diagnostic radiology the aim will specifically be to
perform the most appropriate x-ray investigation for correct diagnosis, with optimised
exposure factors, giving consistent high quality images with acceptable patient doses.
A QA program will be designed and implemented to maintain quality and safety of
imaging techniques. Quality control (QC) involves the processes through which
relevant performance parameters are measured and compared to existing standards,
baseline values and accepted tolerances. QC also includes actions taken to correct
Stellenbosch University https://scholar.sun.ac.za
2
out-of-tolerance results. Quality standards are a set of accepted criteria used for
assessing the quality of activities.2
The clinical performance of imaging systems may be assessed by applying a good
QC program, under a comprehensive QA system. QA provides a framework for
continuous improvement through routine feedback and assists in identification of
deviations from ideal performance, which could negatively impact patient care.
Possible staff training needs may also be identified. An effective QA program is easy
to implement clinically and its proposed tests would enable subjective and objective
evaluation of the entire imaging system. The program should also be cost effective
and easy to maintain.3 The QA program for equipment should cover acceptance
testing and commissioning, periodic testing, corrective action when results are out of
tolerance, record keeping of all procedures, results and actions and finally optimisation
of QA protocols through review and auditing as time goes by.2
Acceptance testing or commissioning is important to ensure that equipment conforms
to specifications and meets legal requirements and it is done prior to clinical use. The
results obtained from the commissioning process will form the baseline values for
comparison to routine QC results, and deviations from these baseline values serve as
indications of possible problems. If equipment was already installed and acceptance
testing results were unavailable, new baseline values should be determined. If a
problem was identified in routine testing with deviations from baseline values, its cause
should be determined using more sophisticated tests.4
Commissioning ensures that equipment is ready for clinical use and establishes
baseline values to which periodic QC results can be compared. These baseline values
are re-established after any major intervention on the equipment. Routine or periodic
QC testing determines whether equipment performance has changed and whether
corrective action would be needed. Equipment maintenance and routine QC are
complimentary.2
Radiology equipment should be appropriate for the task it must perform. It must also
be able to perform this task accurately at an acceptable cost to patients and the
hospital or clinic, considering monetary expenses and down time. Routine evaluation
Chapter 1 - Introduction
Stellenbosch University https://scholar.sun.ac.za

3
of equipment, in the form of a formal QC program, is necessary to ensure continued
and reliable performance by detecting changes that could influence patient diagnosis,
treatment or care.5 X-ray equipment does drift out of calibration and develop defects.
This is detected with routine QC.5
The frequency at which QC is done, depends on the purpose, age, reliability and
frequency of use of the equipment and its importance in the medical imaging field.5
The stability of the QC parameter being assessed and its importance on the overall
imaging system performance also influences the frequency of QC test performance.
QC tests vary in frequency from daily to yearly and can be divided into essential, i.e.
the recommended minimum standard, and desirable, i.e. testing at best practise level.2
Variable processes should be monitored more frequently, as do older and less reliable
equipment that are less stable. Establishing baseline values for QC are not only
important for comparison to future QC results, but also gives valuable experience in
use and operation of equipment. QC test frequencies should be increased from
recommendations in literature when setting baseline values and after component
failure to ensure that corrective action taken was appropriate.5 The performance
standards can be acceptable, i.e. performance within accepted limits, and achievable,
i.e. the level of performance that should be achieved. Test types include repeatability,
which shows that results are within limits for several measurements done at the same
time, and consistency, which shows that results are not changing over time.2
All QC results should be meticulously recorded and kept for analysis. The
performance of each unit must be evaluated and units should be compared to each
other to determine consistency between devices.6 An individual equipment record
must be compiled and maintained for every equipment device. This includes the unit
make and model, licence number, date of installation, user’s manual, acceptance and
routine QC test results, dates and details of services and replacements and details of
persons performing tests, upgrades or services. A QC manual and in house
developed standard operating procedures (SOPs), describing the tests in a step-by-
step manner, must be available.7
According to the literature “Image quality depends only on intrinsic, objective physical
characteristics of an imaging system, and can be measured independently of an
Chapter 1 - Introduction
Stellenbosch University https://scholar.sun.ac.za

4
observer.6” This implies that it should be objective and only equipment dependent.
Clinical image quality “is whatever the observer says it is (i.e. it is a subjective
perception of the image, ‘in the eye of the beholder’)6”, which implies that it also
depends on the observer or interpreter. And it “is defined by an observer’s ability to
achieve an acceptable level of performance for a specified task6”, hence certain limits
or minimum achievable standards exist. Image quality therefore depends on imaging
technology, proper equipment design, proper set-up of equipment parameters, proper
utilisation of equipment and knowledge and skill of the person operating the
equipment. It is also influenced by observer knowledge, ability, skill and viewing
conditions. By using image quality indices, from suitable phantoms for example,
observer dependence is minimised. The obtained image quality is described in terms
of contrast, noise, sharpness, saturation and artefacts.6 QA and QC ensure image
quality within specified limits. The importance of investigating image quality with
routine QC is therefore clear, i.e. ensuring accurate diagnosis in diagnostic radiology.
However, many limitations occur in actual practise.
In resource limited institutions and countries, such as many in Africa and including
South Africa, three main problems may be identified in the field of image quality
assessment. These are firstly cost, secondly man power and expertise and thirdly
time constraints. A variety of commercially available phantoms, as discussed in
Chapter 3 in this dissertation, are in use. However, these are often expensive and
modality specific. This results in a multitude of phantoms to be purchased at
substantial costs to enable the radiology practice to do comprehensive image quality
assurance. Evaluation and interpretation of results from these phantoms are
complicated and take time. In addition it is recommended that QA programs should
be developed, implemented, overseen and managed by a qualified medical physicist.5
However, resource limited institutions are already understaffed and rarely employ
sufficiently trained personnel, like medical physicists, to work with the complicated
phantoms. The solution for these institutions could be a universal image quality
assurance phantom, capable of doing all required routine image quality control
consistency tests on the existing diagnostic radiology x-ray imaging equipment,
including, x-ray units (fixed and mobile), fluoroscopy, mammography and computed
tomography (CT) scanning.
Chapter 1 - Introduction
Stellenbosch University https://scholar.sun.ac.za

5
The aim of this research is to design, develop, manufacture, test and validate a
universal image quality assurance phantom for diagnostic radiology x-ray image
quality assurance, i.e. for equipment commissioning in setting baseline values and for
routine image QC comparing obtained results to the set baseline values. This
phantom should be cost effective and easy and quick to use. To achieve this a
prototype phantom will be planned, produced and tested. The shortcomings of the
prototype will be addressed and a final version of the phantom will be developed. This
phantom will be tested for reproducibility of results and compared to commercially
available phantoms by independent evaluators, to determine if its image quality
assessment results are adequate, if it is easy to use and cheaper to acquire compared
to other phantoms. To aid this evaluation, semi-automatic data analysis software will
be developed and a user’s manual for the phantom and the analysing software will be
written. For the research to remain unique, a patent will be registered, protecting the
concept.
The proposed phantom, user’s manual and data analysis software would be designed
by a qualified medical physicist and optimised for easy implementation, maintenance
and record keeping by radiography personnel in the division. A complete user’s
manual, Appendix A in this dissertation, would be included as part of the research as
well as semi-automatic data analysis software, as described in Chapter 5 and
Appendix B. The data analysis software would simplify the QC process, resulting in
less needed involvement of medical physicists and better information communication
to technologists for repairs. Periodic, remote review of results by a medical physicist
would be considered sufficient. The proposed universal phantom, user’s manual and
data analysis software would be simple to use and implement, with clear instructions,
ensuring suitability for the full spectrum of diagnostic radiology practices and clinics.
Practices that would benefit, include those with maximum workload using CT,
mammography, general x-rays (including mobile x-ray units) and fluoroscopy, to small
clinics using a single or only a few imaging units with fewer patients. The proposed
universal phantom would be compact, robust, easy to use and cheaper to
manufacture, addressing the above mentioned problems in resource limited
institutions.
Chapter 1 - Introduction
Stellenbosch University https://scholar.sun.ac.za

6
The basic physics involved in the production of radiographic x-ray images is discussed
in Chapter 2. Image quality is defined and evaluators of image quality are discussed.
Mention is made of the state of affairs in diagnostic radiology in South Africa. The
current image quality assurance solutions are detailed in Chapter 3. The commercially
available phantoms, required improvements and proposed solutions for each modality
are explored and the need for a universal phantom solution is identified. The design
and development of such a phantom is discussed in Chapter 4 and its relevance to
general x-ray imaging, fluoroscopy, mammography and CT scanning is explored in
Chapter 5. Chapter 6 discusses the reproducibility testing of the universal phantom
and Chapter 7 the independent evaluation of the universal image quality assurance
phantom, its user’s manual and data analysis software. The semi-automatic data
analysis software is described in Appendix B, with a complete user’s manual
presented in Appendix A. The dissertation concludes with recommendations in
Chapter 8.
Chapter 1 - Introduction Chapter 1 - Introduction
Stellenbosch University https://scholar.sun.ac.za
7
Chapter 2
Diagnostic radiology imaging and quality assurance
Image quality assurance, in terms of acceptance testing, commissioning of
equipment and routine QC, is an essential tool in the identification of faulty equipment
and maintenance of clinically acceptable image quality for accurate disease diagnosis,
follow up and minimising repeat exposures. For improved patient care, image quality
assurance should therefore be part of the basic operations of a diagnostic radiology
practice. This chapter considers the physics involved in the formation of x-ray images,
describes the measures of image quality and the importance of routine image quality
control in diagnostic radiology, with reference to the South African situation.
2.1 The physics of x-ray imaging
The quality of a radiological image is essentially determined by the physics of image
formation. The formation of an image can be described in four stages, i.e. the
interaction of x-rays with the detector to generate a detectable response, the
temporary storage of the response, measurement of the response and erasing of the
image for subsequent use in digital systems. It involves detecting objects of which the
size and contrast are limited by quantum statistics and the efficiency of the image
receptor in detecting incident x-ray quanta.8
2.1.1 X-rays
Radiation is energy in movement. X-rays are electromagnetic radiation. X-rays are
photons with no mass, constant speed in a vacuum and are not affected by electric or
magnetic fields. X-rays are described by the wave-particle duality, i.e. in terms of both
waves or discrete quanta of energy called photons. X-rays are ionising radiation, as
it could produce ionised atoms and molecules by removing electrons from atomic
shells during interactions.9
Stellenbosch University https://scholar.sun.ac.za
8
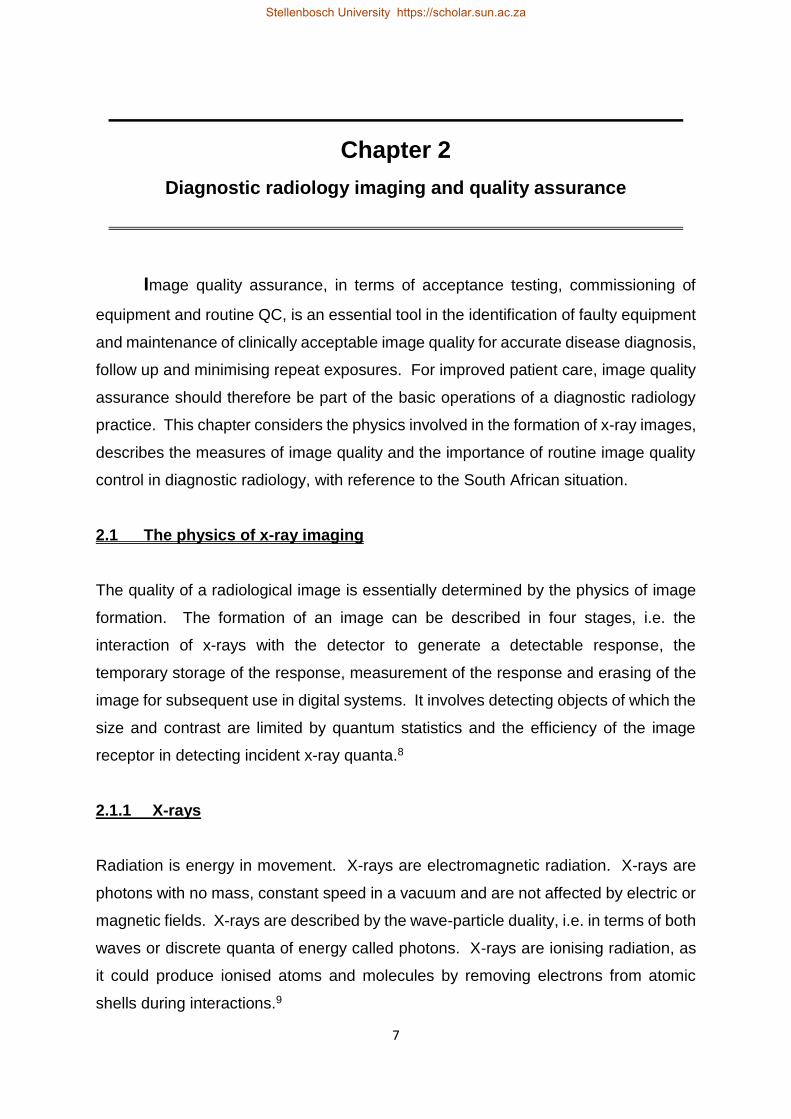
X-rays are produced when electrons with high kinetic energies interact with materials
and kinetic energy is converted to electromagnetic radiation. An x-ray tube contains
an electron source, i.e. the cathode, and a target, i.e. the anode. These are housed
in a vacuum, with a high voltage supplied by an x-ray generator, for the acceleration
of the electrons from the cathode to the anode. A schematic representation of an x-
ray tube is included in Figure 2.1.
Figure 2.1: Basic schematic representation of
an x-ray tube.
An x-ray spectrum consists of Bremsstrahlung and characteristic x-rays, as shown in
Figure 2.2. Bremsstrahlung radiation is produced when the positively charged nucleus
attracts the negatively charged electron, slowing it down. Kinetic energy is lost and
converted to a Bremsstrahlung x-ray. The incident accelerated electron can eject an
inner shell electron, leaving a vacancy. This vacancy is filled by an electron from an
adjacent higher shell. The difference in binding energy of the shells is emitted as a
characteristic x-ray photon.10
Chapter 2 – Diagnostic radiology imaging and quality assurance
Stellenbosch University https://scholar.sun.ac.za

9
Figure 2.2: An x-ray spectrum.
2.1.2 Interactions of x-rays with matter
As x-rays pass through matter they interact with the atomic electrons of the material
causing ionisations and excitations. Ionisation interactions are classified as
photoelectric attenuation and incoherent (or Compton) scattering. Excitation transfers
energy to an inner shell electron, exciting it to a higher energy level and shell and
leaving a vacancy in the original shell. If the transferred energy is more than the
binding energy of the shell, the electron is ejected from the atom and ionisation occurs.
The inner shell vacancy is filled by an electron from an outer shell, which creates a
vacancy in this shell. This cascade process continues and the energy released in
each transition is emitted as characteristic x-rays and the outer shell electron ejected
from the atom is called an Auger electron. The released energy is the difference in
the binding energies between the inner and outer shells. Charged particles can also
have inelastic interactions with atomic nuclei of the material they pass through,
resulting in the particle path being deflected and the energy transferred to a photon
which is emitted as Bremsstrahlung.1
2.1.2.1 Raleigh scatter
In coherent, classical or Rayleigh scattering no energy is lost by the incident photon,
but it is scattered through an angle, i.e. its path is changed.11 The incident photon
interacts with the atom as a whole. The incident photon’s electromagnetic wave
transfers energy to all the electrons in the interaction atom, causing in phase
oscillation. This energy is radiated by the electrons as a photon with the same energy,
Chapter 2 – Diagnostic radiology imaging and quality assurance
Stellenbosch University https://scholar.sun.ac.za

10
but in a different direction. As electrons are not ejected, ionisation does not occur. It
occurs at low energies, for example those used in mammography. This interaction is
more likely to occur with high atomic number materials and at low photon energies. At
high photon energies, coherent scatter occurs mostly in a forwards direction with a
small angle of deflection. Raleigh scattering is shown in Figure 2.3.12
Figure 2.3: Raleigh scatter.
When scattered photons are detected, image quality is degraded. Object contrast and
image sharpness are decreased by scatter, as a general mottled background noise is
caused on the image. Scatter does not contribute to image formation, but increases
patient absorbed dose if attenuated in the patient.
2.1.2.2 Compton scatter
In Compton scattering, the incident photon interacts with a free electron and energy is
transferred to the electron.11 Compton scatter is also called inelastic, incoherent or
non-classical scatter. In the diagnostic radiology range, this is the most common type
of interaction. It occurs between a photon and an outer shell electron, i.e. a valence
electron, which is ejected from the atom, causing ionisation. The photon is scattered
with reduced energy. The energy of the incident photon must be greater than the
binding energy of the valence electron for Compton scatter to occur. Compton scatter
is illustrated in Figure 2.4.12
+
Chapter 2 – Diagnostic radiology imaging and quality assurance
Stellenbosch University https://scholar.sun.ac.za

11
Figure 2.4: Compton scatter.
The probability of Compton interactions depends on the number of electrons in the
atom, i.e. on the density of the material and the number of electrons per unit mass of
the material. The number of electrons per unit mass is relatively constant for different
materials, thus the probability of Compton interactions is dependent on the density of
the interacting material. Compton interaction probability is independent of material
atomic number and incident photon energy. These interactions therefor occur at all
energies applicable in the diagnostic radiology range. Compton scatter decreases
image spatial resolution, thus reducing image quality. It adds a background haze to
the image, which obscures small attenuation differences and causes blurred object
borders.
2.1.2.3 Photoelectric effect
In this interaction, all of the incident photon’s energy is transferred to an inner shell
electron, which is ejected from the atom. This is called a photoelectron. The atom is
left in an ionised state. The energy of the incident photon must be greater than the
binding energy of the inner shell electron. The created vacancy is filled by an electron
from a shell with a lower binding energy. The difference in binding energies of the
shells is emitted as a characteristic x-ray or Auger electron. The resultant vacancy is
filled with an electron from a shell with even lower binding energy and the filling and
emission process continues in a cascade.12 The photoelectric effect depends directly
Inci
den
t p
ho
ton
+
Compton electron
Θ
Angle of deflection
Chapter 2 – Diagnostic radiology imaging and quality assurance
Stellenbosch University https://scholar.sun.ac.za

12
on atomic number and inversely on photon energy, i.e. 𝑍3
𝐸3 where 𝑍 is the atomic
number and 𝐸 is the photon energy.11 The probability of a photoelectric interaction
increases with increasing atomic number and decreases with increased incident
photon energy. There are no scattered photons, which degrade image quality, with
photoelectric effect. Figure 2.5 shows the photoelectric effect.12
Figure 2.5: The photoelectric effect.
At the binding energy of an electron shell, the absorption coefficient increases as more
electrons are available for the interaction. This energy is called the absorption edge
and it is characteristic for every material. The photoelectric effect dominates at lower
photon energies and Compton scatter for the rest of the diagnostic energy range.11
The photoelectric effect assists in the development of image contrast. The absorption
differences between soft tissues, like muscle, is enhanced by the photoelectric effect,
due to the strong dependence of interaction probability on material atomic number. In
diagnostic radiology, the strong inverse dependence of photoelectric interactions on
incident photon energy decreases the attenuation difference between bone and soft
tissue. To counteract this the kV is reduced, increasing contrast, however this also
increases the absorbed dose to the patient. A delicate balance between image quality
and patient dose thus exists. A practical example is chest radiography, where bone,
Incident photon +
Photoelectron
Characteristic x-rays
Chapter 2 – Diagnostic radiology imaging and quality assurance
Stellenbosch University https://scholar.sun.ac.za
13
at lower incident photon energies, will attenuate strongly through photoelectric
interactions, obscuring visualisation of the lungs. Due to the higher atomic number of
bone, photoelectric interactions occur in bone preferentially, compared to surrounding
soft tissues. These attenuation differences determine the contrast of the chest x-ray
image.
Another interaction mechanism is pair production. It only occurs at energies of 1022
keV or more and is therefore not significant in diagnostic radiology.11
2.1.3 X-ray attenuation coefficients
Attenuation is the removal of photons from the x-ray beam as it transverses matter
through absorption and scattering of the photons. When the x-ray beam is mono-
energetic the linear attenuation coefficient, 𝜇, in units of cm-1, refers to the fraction of
photons removed from the incident photon beam per unit thickness of traversed
material. It depends on the number of atoms per unit distance, i.e. the density of the
material.12 The attenuation of the incident photons is governed by the mass
attenuation coefficient, 𝜇
𝜌 , which is independent of the density, 𝜌 , and has units of
cm2/g. The total mass attenuation coefficient is the sum of the mass attenuation
coefficients of each of the individual interaction mechanisms, as shown in Equation
2.1. Here 𝜏
𝜌 is the photoelectric effect mass attenuation coefficient,
𝜇𝑐𝑜ℎ
𝜌 and
𝜇𝑖𝑛𝑐
𝜌 are
the mass attenuation coefficients for Rayleigh and Compton scattering and 𝜔
𝜌 is the
mass attenuation coefficient for pair production.
𝜇
𝜌=
𝜏
𝜌+
𝜇𝑐𝑜ℎ
𝜌+
𝜇𝑖𝑛𝑐
𝜌+
𝜔
𝜌 [Equation 2.1]
For compounds and mixtures, the mass attenuation coefficient is the weighted sum of
the constituent elements, as in Equation 2.2, where 𝑤𝑖 is the weight fraction of element
𝑖.11
Chapter 2 – Diagnostic radiology imaging and quality assurance Chapter 2 – Diagnostic radiology imaging and quality assurance
Stellenbosch University https://scholar.sun.ac.za
14
𝜇
𝜌= ∑ 𝑤𝑖 (
𝜇
𝜌)
𝑖𝑖 [Equation 2.2]
2.2 Evaluation of image quality metrics
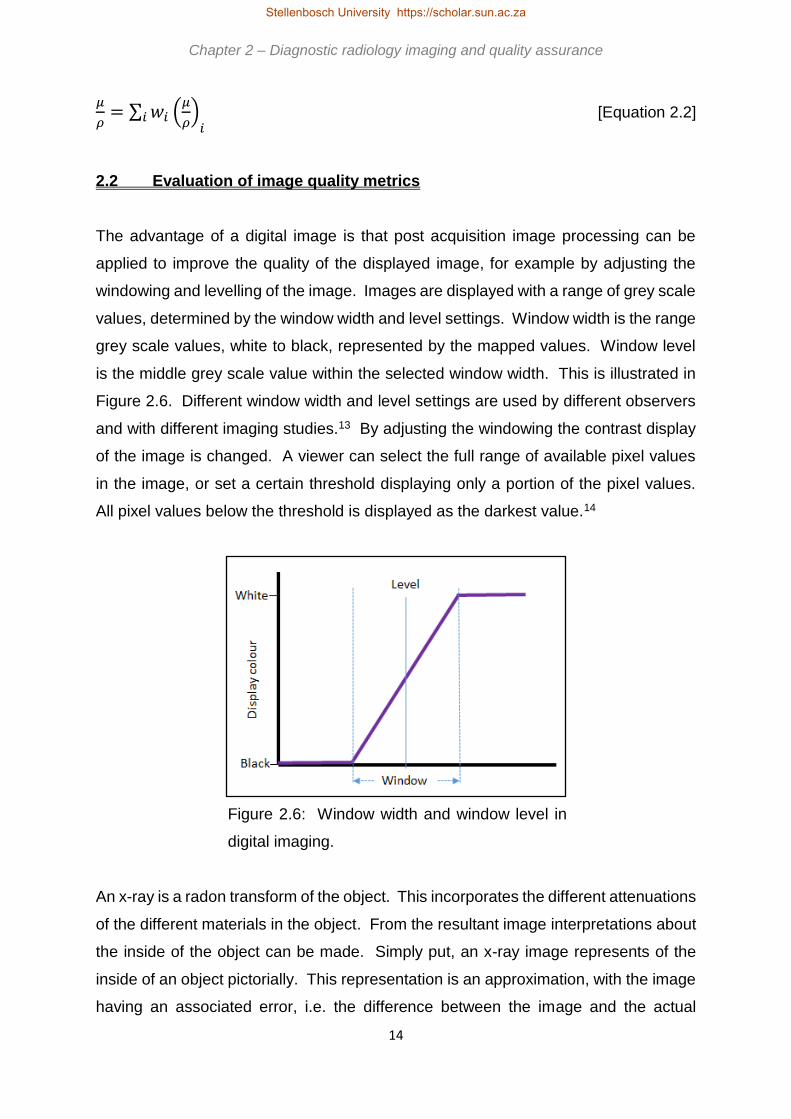
The advantage of a digital image is that post acquisition image processing can be
applied to improve the quality of the displayed image, for example by adjusting the
windowing and levelling of the image. Images are displayed with a range of grey scale
values, determined by the window width and level settings. Window width is the range
grey scale values, white to black, represented by the mapped values. Window level
is the middle grey scale value within the selected window width. This is illustrated in
Figure 2.6. Different window width and level settings are used by different observers
and with different imaging studies.13 By adjusting the windowing the contrast display
of the image is changed. A viewer can select the full range of available pixel values
in the image, or set a certain threshold displaying only a portion of the pixel values.
All pixel values below the threshold is displayed as the darkest value.14
Figure 2.6: Window width and window level in
digital imaging.
An x-ray is a radon transform of the object. This incorporates the different attenuations
of the different materials in the object. From the resultant image interpretations about
the inside of the object can be made. Simply put, an x-ray image represents of the
inside of an object pictorially. This representation is an approximation, with the image
having an associated error, i.e. the difference between the image and the actual
Chapter 2 – Diagnostic radiology imaging and quality assurance
Stellenbosch University https://scholar.sun.ac.za

15
object. Therefore, two images of the same object, taken with the same imaging
system, will not be identical due to inherent image noise. In order to determine how
accurately an image represents the actual object the quality of the image must be
determined in a quantifiable manner.15 Image quality is quantified in terms of image
contrast, resolution and noise.
2.2.1 Image contrast
Image contrast is defined as differences in the grey scale values of adjacent areas in
an image. A uniformly grey image exhibits no contrast. High contrast is depicted in
images with sharp transitions between dark and light grey. Contrast is produced by
differences in tissue composition, i.e. densities, atomic numbers and mass energy
attenuation and absorption coefficients.9 The contrast of an object depends on the
thickness of the object and is different for objects with different mass attenuation
coefficients and densities. The contrast is inversely proportional to the effective
energy kilovolt (kV) setting, as the mass attenuation coefficient decreases as the kV
setting increases. At low kV the contrast is high as the photoelectric effect dominates.
However, the incident low energy photons have little penetration ability and this
increases the radiation dose delivered to the patient. At higher kV settings the contrast
is reduced due to the predominance of scatter interactions, although the delivered
patient dose will also be decreased.16 The image quality and delivered radiation dose
relationship is therefore demonstrated when considering image contrast.
Both the photoelectric effect and Compton scatter interactions influence image
contrast. From sections 2.1.2.2 and 2.1.2.3 above it is seen that the probability for
Compton scatter depends on material density and photoelectric effect on material
atomic number and incident photon energy. If image contrast results from differences
in material densities, it is due to Compton interactions and independent of photon
energy and material atomic number. If a difference in atomic numbers and changes
in photon energy, i.e. kV, results in changes in image contrast, it is due to the
predominance of photoelectric interactions. In practice this means that kV changes
for soft tissues does not affect image contrast substantially, unless low kV settings are
considered. In materials like bone, with high atomic numbers, the kV dependence of
contrast is seen over a wider range of kV settings.
Chapter 2 – Diagnostic radiology imaging and quality assurance
Stellenbosch University https://scholar.sun.ac.za

16
Contrast can be defined as the ratio of a difference in signal to the average signal. A
small difference is therefore negligible if the average signal is large, but it is visible if
the average signal is small. The goal in medical imaging is to achieve a high contrast
so that abnormal structures can easily be seen.15
2.2.1.1 Local (weber) contrast
The local, or Weber, contrast is given by Equation 2.3, where 𝑓𝑓 and 𝑓𝑏 are the
signals of the feature and background.15
𝐶 =𝑓𝑓−𝑓𝑏
𝑓𝑏 [Equation 2.3]
Weber contrast is usually used when small structures are present in a background
area of uniformity. Modulation or Michelson contrast, as in Equation 2.4, describes
patterns of dark and bright structures in an image and is used in image Fourier
analysis. Here 𝑓𝑚𝑖𝑛 is the lowest and 𝑓𝑚𝑎𝑥 the highest signal.15
𝐶𝑊 =𝑓𝑚𝑎𝑥−𝑓𝑚𝑖𝑛
𝑓𝑚𝑎𝑥+𝑓𝑚𝑖𝑛 [Equation 2.4]
2.2.1.2 Subject contrast
Subject or physical contrast is the local or modulation contrast of the structure in the
imaged object. With x-ray imaging it depends on the x-ray spectrum and the
attenuation of the structure and the object.15 It describes the differences in x-ray
intensities exiting the patient as a result of different degrees of photoelectric
interactions in different materials, i.e. it maps attenuation in the patient. Therefore it
depends on material thickness, density and atomic number. As the photoelectric effect
is also incident photon energy dependent, subject contrast also depends on the
energy, improving with a decrease in kV and resulting in increased absorbed dose.
Chapter 2 – Diagnostic radiology imaging and quality assurance
Stellenbosch University https://scholar.sun.ac.za

17
2.2.1.3 Image contrast
Image or detector contrast depends on the subject contrast and the imaging detector
characteristics. It expresses the subject contrast attenuation differences as recorded
in the produced x-ray image. In x-ray imaging it is influenced by the x-ray spectrum,
the image detector thickness, composition and grey scale characteristics, i.e. film or
digital. The display contrast is the final contrast of the image, as it is viewed. It
depends on the image contrast and image processing.15
When image blurring does not occur the ratio of image to subject contrast is called the
transfer function of the imaging system. Blurring spreads the signal laterally, causing
a focused point to become a diffused point, thus decreasing the contrast of small
structures. This lateral diffusion only occurs if the size of the structure is smaller than
the width of the blurring function, hence larger structures are not as severely
affected.15 This decreases images sharpness.
2.2.2 Image resolution
Spatial resolution describes an imaging system’s ability to display two objects, close
together, as separate, or as the ability to visualise small detail in an image. If a system
can display smaller structures, the spatial resolution is high, and vice versa. The
maximum spatial frequency, for which modulation is maintained without aliasing, or
the smallest object the imaging system can resolve, is referred to as the limiting spatial
resolution. For most imaging systems the limiting spatial resolution where the
modulation transfer function (MTF) reaches 10 %.9,14
The MTF illustrates an object’s percentage contrast recorded by the imaging system
as a function of the size of the object.17 Figure 2.7 shows examples of MTFs.
Chapter 2 – Diagnostic radiology imaging and quality assurance
Stellenbosch University https://scholar.sun.ac.za

18
Figure 2.7: a.) MTF for a system with
a higher resolution, i.e. can display
smaller objects. b.) MTF for a system
with a lower resolution.
A basic measure of resolution properties of an imaging system is point spread function
(PSF). The PSF is the response of the imaging system to an input point source, like
a small ball. The line spread function (LSF) is the response of the imaging system to
a line source, e.g. a slit in attenuating material. When a sharp edge is used as
stimulus, an edge spread function (ESF) results from the edge gradient. By calculating
the Fourier transform of a PSF, LSF or ESF a curve called the MTF is obtained. This
is shown in Equation 2.5 where the modulation transfer function, 𝑀𝑇𝐹(𝑓), is the
modulus of the Fourier transform of the line spread function, 𝐿𝑆𝐹 (𝑓), and 𝑖 = √−1.18
The MTF is a complete descriptor of spatial resolution.14
𝑀𝑇𝐹 (𝑓) = √(∫ 𝐿𝑆𝐹(𝑥)𝑒−2𝜋𝑖 ∫ 𝑥𝑑𝑥∞
−∞)
2 [Equation 2.5]
Resolution is measured with high contrast objects with sharp edges, like bar
phantoms, and is expressed in line pairs per unit length.15 It is influenced by image
detector characteristics and by factors unrelated to the detector, like geometrical
unsharpness, x-ray source size and motion blurring.8 The ability to detect and resolve
a structure therefore depends on the signal to noise ratio of the structure.15
a.)
b.)
Chapter 2 – Diagnostic radiology imaging and quality assurance
Stellenbosch University https://scholar.sun.ac.za

19
2.2.3 Image noise
Images are degraded by noise.15 Quantum mottle or white noise, is inherently present
in images and can be quantified with region of interest (ROI) analysis using the
equations described below.
Contrast resolution describes the ability to detect and distinguish small grey scale
changes from background noise. It is described by the signal-to-noise ratio (SNR).14
High contrast resolution is restricted by imaging system blurring. Low contrast
structures, even large ones, may not be visible due to the signal of the structure is
lower than the noise in the region surrounding the structure. The quantum SNR is
given by Equation 2.6, where ⟨𝑔⟩ is the mean and 𝜎𝑔 the standard deviation in a
ROI.15
𝑆𝑁𝑅 =⟨𝑔⟩
𝜎𝑔 [Equation 2.6]
The amplitude of a signal is compared to the background noise using Equation 2.7,
the signal-difference-to-noise ratio (SDNR), where ⟨𝑥𝑎⟩ and ⟨𝑥𝑏⟩ are the mean values
of a ROI in structure 𝑎 compared to background 𝑏 and 𝜎𝑏 is the standard deviation of
the background ROI. This is also called the contrast-to-noise ratio (CNR).15
𝑆𝐷𝑁𝑅 =⟨𝑥𝑎⟩−⟨𝑥𝑏⟩
𝜎𝑏 [Equation 2.7]
The CNR is object size independent and a measure of the signal level in the presence
of noise.14 Structure detection is influenced by quantum noise, artefacts, anatomy and
the observer.15
The amount of scattered radiation depends on the radiographic procedure, x-ray field
size, thickness of the object being imaged and position of the object in relation to the
x-ray source and image receptor. Scatter interactions dominate in soft tissue, whilst
in bone photoelectric interactions occur most often. Scatter increases with x-ray field
Chapter 2 – Diagnostic radiology imaging and quality assurance
Stellenbosch University https://scholar.sun.ac.za

20
size and object thickness, up to an upper cut off point, i.e. the scatter saturates for
large fields and thick objects. Scatter can be reduced by using anti-scatter grids,
through collimation, i.e. reducing field size carefully as to not exclude objects of
interest resulting in retakes and thus additional dose, increasing the distance between
the object and image receptor so that divergent scattered photons do not reach the
image receptor, and by decreasing object thickness by using compression, which
results in a shorter exposure time hence reducing movement blur and allowing for a
lower kV setting which improves contrast and SNR.16
2.3 Image quality assurance in South African practice
In diagnostic radiology the aim is to obtain clinically useful images, i.e. images with
acceptable image quality for accurate diagnosis of different disease conditions, while
adhering to the ALARA principle, i.e. the radiation dose delivered to the patient must
be kept As Low As Reasonably Achievable (ALARA). The clinical relevance of images
can be monitored with quantification of image quality, assessing the parameters as
discussed above. For this, routine image quality assurance is required on each
imaging device.
In South Africa, the QC requirements for diagnostic radiology equipment image quality
are stipulated by the Directorate Radiation Control of the South African Department of
Health (DoH), in the document for QC tests for diagnostic x-ray imaging systems.7
The image quality assurance tests required by DoH are summarised in Table 2.1. As
seen from Table 2.1 a good diagnostic radiology QA program involves periodic testing
and checking of all components in the image formation chain.
Table 2.1 shows the essential QC tests, i.e. the recommended minimum standards.
However, from a best practise level additional testing is desirable.2 It is clear that
these tests require sufficient man power and expertise and are lengthy to conduct, two
of the greatest limitations in the South African setting.
Chapter 2 – Diagnostic radiology imaging and quality assurance
Stellenbosch University https://scholar.sun.ac.za

21
Table 2.1: DoH recommendations for image QC for general x-rays and fluoroscopy,
unless otherwise stated. (adapted from DoH requirements for QC document7)
Test Frequency Limits
X-ray / light beam centring Acceptance, 3 monthly ≤ ± 1 cm at 100 cm SID
Constancy or reproducibility 4 monthly Baseline ± 0.3 OD
Uniformity
Acceptance, 3 monthly
Mammography: Acceptance,
weekly
Mean ± 10 % (± 5 % for DR)
Mammography: Mean pixel
value < ± 15 %
Sensitivity Acceptance, 3 monthly Baseline ± 25 %
Distance accuracy / scaling
errors Acceptance, 3 monthly ± 0.5 cm or ≤ 2 %
Low and high contrast
resolution
Acceptance, 3 monthly
Mammography: Acceptance,
daily
Mammography: Yearly
Limiting spatial resolution
baseline minus 25 %, 2.5 – 3
lp/mm
Mammography: All patches
visible
Mammography: 11 - 13 lp/mm
Optical density consistency Acceptance, 3 monthly Baseline OD ± 0.20
Image quality visual inspection Acceptance, 3 monthly
Mammography: Weekly
Reproducible
Mammography: 4 fibres, 3 spec
groups, 3 masses (ACR
phantom) (5 fibres, 4 spec
groups, 4 masses for DR)
Image noise Acceptance, daily CT: Baseline ± 10 %
CT number values Acceptance, daily Water: Baseline ± 5 HU
Other: Baseline ± 10 HU
Scan plane localisation in CT Acceptance, 3 monthly ≤ ± 0.2 cm
Reproducibility
Mammography: Acceptance,
weekly
Acceptance, yearly
Mammography: SNR < ± 10 %
Baseline ± 30 % and mean ± 20
%
Artefacts Mammography: Acceptance,
daily No visible artefacts
Geometrical distortion Mammography: Acceptance,
daily
Mammography: No distortion
visible
AEC repeatability Acceptance, yearly Mean OD ± 0.2
AEC consistency between
chambers Acceptance, yearly
Baseline ± 30 % and mean ± 20
%
CT slice thickness Acceptance, yearly Baseline ± 20 % or ± 0.1 cm
Chapter 2 – Diagnostic radiology imaging and quality assurance
Stellenbosch University https://scholar.sun.ac.za

22
In South Africa 3173 fixed and mobile x-ray units, 1347 fluoroscopy units, 288
mammography units and 297 CT scanners were licenced by DoH. The majority of
these were located in state or government sector with a significant number, although
fewer, in private practice.19 (Statistics as at March 2016) According to the secretary
of the South African Association for Physicists in Medicine and Biology (SAAPMB), 71
medical physicists registered with the association are employed in state sector and 37
are employed in private sector.20 (Statistics as at October 2015) It is important to
note that not all registered medical physicists are working in diagnostic radiology. The
majority of the South Africa medical physicists were employed in radiotherapy at that
time, with an estimated 15 employed full time in diagnostic radiology. (as at
September 2017)
A clear burden on man power and lack of suitably qualified personnel thus exist in the
South African setting. With this burden, time for essential QC is already limited and
desirable QC rarely occurs. In addition to these limitations, departmental financial
constraints and expensive modality specific commercial QC equipment result in a lack
of required basic QC tools. This is to the detriment of patient care. The unfortunate
truth is that the situation in the rest of Africa is even more adverse than in South Africa.
The three major problems of cost, man power and expertise and time constraints, as
identified in Chapter 1, are a reality in South Africa, as well as in the rest of Africa. The
proposed solution to this situation could be a cost effective and easy to use universal
image quality assurance phantom, as described in Chapter 4.
Chapter 2 – Diagnostic radiology imaging and quality assurance Chapter 2 – Diagnostic radiology imaging and quality assurance
Stellenbosch University https://scholar.sun.ac.za

23
Chapter 3
Current* image quality assurance systems
Commercially available image quality assessment phantoms are modality
specific. In addition, some of these phantoms can only investigate certain image
quality parameters. This chapter considers the production of images in general x-rays,
fluoroscopy, mammography and CT scanning, introduces the image quality assurance
parameters to be assessed in each modality and describes some of the commercially
available image quality assurance phantoms in use. These phantoms are used in the
design of the universal image quality assurance phantom, as discussed in Chapter 4.
Each section concludes with a tabulated comparison between commercially available
phantoms and the proposed universal image quality assurance phantom, as described
in Chapters 4-7, to indicate that the universal image quality assurance phantom is a
useful routine QC tool capable of doing comprehensive image quality control in
different x-ray imaging modalities. The universal image quality assurance phantom is
intended as a constancy check tool, to compare routine QC values to baseline values
set with the phantom. It fills an identified gap in the existing commercial market, with
specific focus on resource limited institutions, as mentioned in Chapter 1. It is not
intended to replace any of the commercially available phantoms.
3.1 General x-ray imaging
Radiography was the first type of medical imaging that originated with the discovery
of x-rays in 1895. The first radiograph is shown in Figure 3.1.9
* Current refers to the situation as in 2016
Stellenbosch University https://scholar.sun.ac.za
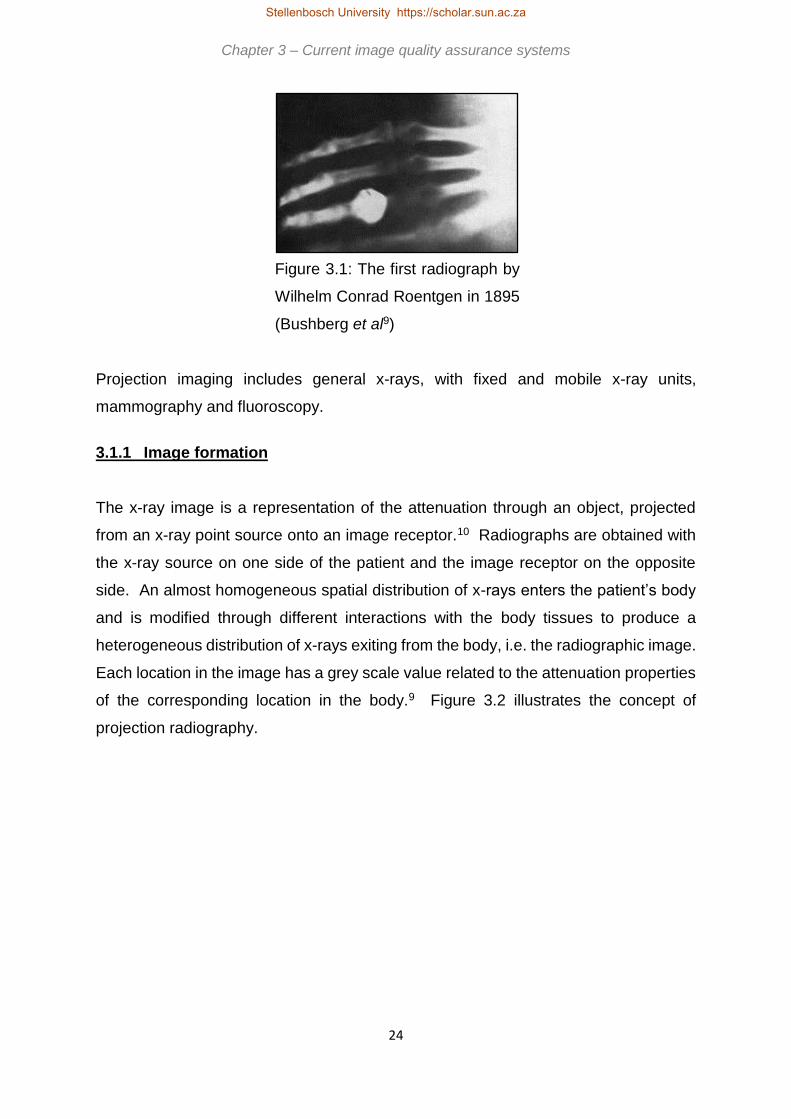
24
Figure 3.1: The first radiograph by
Wilhelm Conrad Roentgen in 1895
(Bushberg et al9)
Projection imaging includes general x-rays, with fixed and mobile x-ray units,
mammography and fluoroscopy.
3.1.1 Image formation
The x-ray image is a representation of the attenuation through an object, projected
from an x-ray point source onto an image receptor.10 Radiographs are obtained with
the x-ray source on one side of the patient and the image receptor on the opposite
side. An almost homogeneous spatial distribution of x-rays enters the patient’s body
and is modified through different interactions with the body tissues to produce a
heterogeneous distribution of x-rays exiting from the body, i.e. the radiographic image.
Each location in the image has a grey scale value related to the attenuation properties
of the corresponding location in the body.9 Figure 3.2 illustrates the concept of
projection radiography.
Chapter 3 – Current image quality assurance systems
Stellenbosch University https://scholar.sun.ac.za
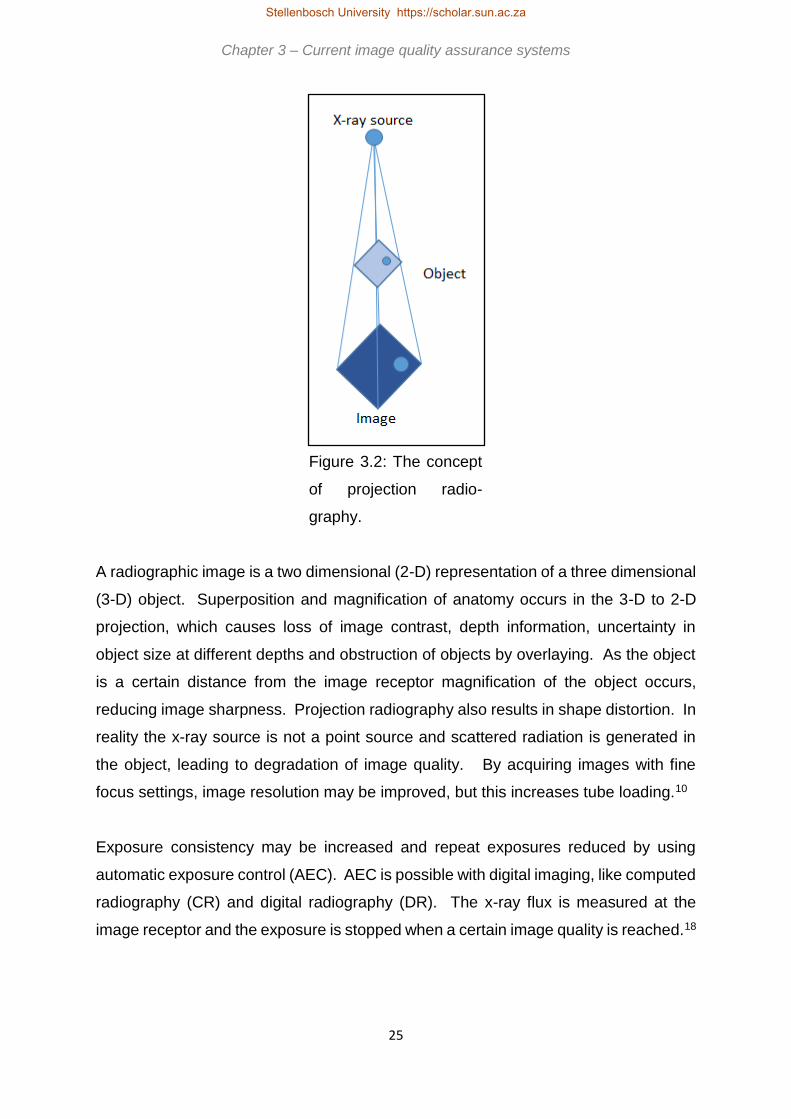
25
Figure 3.2: The concept
of projection radio-
graphy.
A radiographic image is a two dimensional (2-D) representation of a three dimensional
(3-D) object. Superposition and magnification of anatomy occurs in the 3-D to 2-D
projection, which causes loss of image contrast, depth information, uncertainty in
object size at different depths and obstruction of objects by overlaying. As the object
is a certain distance from the image receptor magnification of the object occurs,
reducing image sharpness. Projection radiography also results in shape distortion. In
reality the x-ray source is not a point source and scattered radiation is generated in
the object, leading to degradation of image quality. By acquiring images with fine
focus settings, image resolution may be improved, but this increases tube loading.10
Exposure consistency may be increased and repeat exposures reduced by using
automatic exposure control (AEC). AEC is possible with digital imaging, like computed
radiography (CR) and digital radiography (DR). The x-ray flux is measured at the
image receptor and the exposure is stopped when a certain image quality is reached.18
Chapter 3 – Current image quality assurance systems Chapter 3 – Current image quality assurance systems
Stellenbosch University https://scholar.sun.ac.za

26
3.1.1.1 Film-screen radiography
Film-screen radiography is the historically conventional method of acquiring
radiographic images. In screen-film radiography a light sensitive film is placed
between intensifying screens in a cassette. The film is a plastic sheet coated with
photosensitive emulsion containing silver halide grains. Contact between the screens
and film is necessary to prevent artefacts in the image. The screens are made from
scintillating phosphor material which emits visible or ultraviolet light upon x-ray
interaction. This light primarily causes the darkening of the film. The screens reduce
spatial resolution, but also patient dose due to efficient light emission. The front
surface of the cassette allows for maximal transmission of incident x-rays. The x-rays
and light emitted from the screens interact with the emulsion, changing the chemical
bonds to form a latent image. The cassette must be light tight to prevent exposure of
the film to ambient light and the film is developed in a dark room to produce the image
for viewing. With chemical processing in the dark room the silver halide is converted
into silver grains to form the image. With film, increased exposure results in a darker
image, i.e. higher optical density (OD). Optical density is a measure of the film
transparency is defined in Equation 3.1, where 𝐼0 is the intensity measured with a
densitometer in the absence of film and 𝐼 is the intensity measured through the film.10
𝑂𝐷 = 𝑙𝑜𝑔10 (𝐼0
𝐼) [Equation 3.1]
3.1.1.2 Computed Radiography (CR)
CR imaging uses a photostimulable phosphor (PSP) plate housed in a cassette. When
the PSP plate is exposed to x-rays, electrons are excited from the valence to the
conduction band and are trapped. This forms the latent image, a distribution of
electrons trapped in high energy states representative of the amount of energy
deposited at each location in the image. Laser light stimulates the release of the
trapped energy in the read-out process, with electrons returning to the conduction
band and the emission of blue-green light. The intensity of the emitted light is
proportional to the absorbed energy from the incident x-rays. This process is shown in
Figure 3.3. The PSP plate is then exposed to bright white light for clearing and it can
Chapter 3 – Current image quality assurance systems
Stellenbosch University https://scholar.sun.ac.za

27
be reused. The emitted light is detected by photomultiplier tubes (PMTs) which
produce a proportional electronic signal. These signals are digitised and displayed.
Figure 3.3: Image formation in CR imaging.
3.1.1.3 Digital Radiography (DR)
In DR imaging, digital sensors or flat panel detectors are used and the image is
immediately available for display and viewing. Indirect flat panel detectors use an x-
ray intensifying screen to convert x-rays to visible light, which is detected. The flat
panel consists of several detector elements. Each detector element has a light
sensitive area and electronics. With exposure to x-rays charge is build up in each
element and stored in a capacitor. The charge is proportional to the amount of light
detected. The size of the detector elements determines the spatial resolution of the
imaging system. Direct flat panel detectors consist of a thin-film transistor array with
a layer of photoconductor material, for example selenium. The electrons produced in
the detector layer by incident x-rays are used to directly produce the image by using
a negative voltage electrode. The number of produced electrons is proportional to the
incident x-ray energy. As electrons travel with high precision in the applied electric
field, very little blurring occurs. The electrons are collected at the detector elements
and the corresponding image is displayed.14
Laser light
Valence band
Conduction band
X-rays
e-
Latent image
Emitted light
Chapter 3 – Current image quality assurance systems
Stellenbosch University https://scholar.sun.ac.za

28
3.1.2 Image quality assurance parameters
Image quality should remain constant and reproducible over time. According to the
American Association of Physicists in Medicine (AAPM) and American College of
Radiology (ACR) this could be achieved and evaluated with routine imaging of a
phantom.22 Images can be acquired with manual setting of technique factors or with
AEC. Where both these options are used, both must be tested in routine quality
assurance. AEC should give a constant optical density, or image grey scale,
regardless of patient or phantom thickness and this must be verified.6
Low and high contrast detectability influence image quality. Low contrast detectability
assesses the ability to differentiate objects similar to the background material as they
become smaller. High contrast detectability considers small objects of high contrast
compared to background and determines the smallest that can be seen. System
contrast is assessed monthly and after equipment service using a typical exposure.23
Resolution is evaluated in terms of modulation transfer functions or by using suitable
bar phantoms, as in the TOR CDR® phantom, discussed in section 3.1.3, for example.
Images should also be uniform, i.e. the same grey scale or OD values should be
obtained in different areas of an image of a uniform material. As the resultant OD or
grey scale value is related to the attenuation, and density, of different materials,
sensitometry or grey scale linearity must be assessed to ensure correct display. It is
recommended by DoH that these parameters are evaluated three monthly.7 Image
quality is degraded by image noise and the presence of artefacts. These should be
assessed quarterly and after service interventions.23
In addition to the image quality tests, set-up and geometrical accuracy should be
checked by using software measurement tools and comparing the results to the known
actual distances. This includes evaluation of the coincidence of the set light field and
the delivered x-ray field.
Chapter 3 – Current image quality assurance systems
Stellenbosch University https://scholar.sun.ac.za
29
3.1.3 Current* image QA phantoms
For general x-ray imaging quality assurance, a variety of different phantoms are in
use. As the TOR CDR® and NORMI 13® phantoms are used more commonly in South
Africa, these are discussed below.
3.1.3.1 The TOR CDR® phantom
The phantom is available from Leeds Test Objects provides a continuing check of
image quality assurance parameters, with emphasis on parameters that are likely to
worsen. Image quality is assessed by identifying the number details and bar-patterns
visible. Sensitometry is done with 10 inserts of 5.6 mm diameter each. Resolution is
assessed as 0.5 to 14.3 lp/mm. Low contrast and large detail is determined with 17
details of 11 mm diameter and contrast range of 0.002 to 0.075 at 70 kVp and 1mm
Cu. The number of details visible is recorded. High contrast and small detail
detectability is done visually with 17 inserts of contrast range 0.39 to 0.954 at 70 kVp
and 1 mm Cu. The number of visible inserts are counted and recorded. The diameter
of these inserts is 0.5 mm.24 A x-ray image of the phantom is shown in Figure 3.4.
* Current refers to the situation as in 2016
Chapter 3 – Current image quality assurance systems
Stellenbosch University https://scholar.sun.ac.za

30
Figure 3.4: An x-ray image of the TOR CDR®
phantom. a.) Sensitometry inserts. b.) Bar
phantom for spatial resolution. c.) Low contrast
large detail inserts. d.) High contrast small detail
inserts. (Leads Test Objects Limited24)
3.1.3.2 The NORMI 13® phantom
Figure 3.5 shows this phantom. It is available from PTW Freiburg GmbH. It is
designed for acceptance and constancy tests for digital projection radiography. The
phantom tests signal standardisation by measuring the brightness of an image at a
central area. It has seven dynamic steps, consisting of different thickness copper
plates from 0.0 mm to 2.3 mm, for evaluation of contrast resolution. The steps should
be separately identifiable. For low contrast evaluation, six disks with contrasts of 0.8
% to 5.6 % are visually inspected at an image window setting where all seven dynamic
steps are depicted differently. At least three low contrast disks must be visible. For
homogeneity the optical density or luminance is measured in five different areas, at
the centre and at the four corners of the image. The difference between the central
and corner values is recorded. Variation from reference values should be less than ±
30 % OD or -50 % to +100 % luminance when AEC is used. A lead foil test pattern is
used to evaluate spatial resolution, using a magnifying glass. The lp/mm of the
a.)
c.)
d.)
b.)
Chapter 3 – Current image quality assurance systems
Stellenbosch University https://scholar.sun.ac.za

31
smallest line group that can be discerned is recorded. Image geometry is assessed
by measuring the distances between different lines. A tolerance of ± 3 % is
acceptable. These lines are also used to assess scaling and are checked for
distortions. The variation between the light field and x-ray field is investigated using
the different field size radiopaque field edge marker lines. The image is also evaluated
for the presence of artefacts. An additional copper plate is supplied for use with higher
kV setting, e.g. 100 kV. The phantom can also evaluate delivered radiation dose by
establishing a dose indicator versus image brightness relationship at acceptance
testing.25
Figure 3.5: The NORMI 13® phantom. a.) Areas used for
homogeneity and signal standardisation evaluation. b.) Dynamic
contrast resolution steps. c.) Lead foil spatial resolution test
pattern. d.) Light field alignment markings. e.) Low contrast disks.
(PTW Freiburg GmbH25).
Chapter 3 – Current image quality assurance systems
a.) b.) a.) c.) d.) e.) a.)
Stellenbosch University https://scholar.sun.ac.za

32
Table 3.1 summarises the image quality assurance parameters that can be assessed
with the discussed phantoms in comparison to the capabilities of the proposed
universal image quality assurance phantom. The universal image quality assurance
phantom is at least similar to the commercially available phantoms for routine QC.
Table 3.1: Summary of commercially available modality specific general x-ray
phantoms compared to the universal image quality assurance phantom.
Image quality
parameter
Sensitometry Low contrast
detectability
Uniformity Resolution
TOR CDR® X X X
NORMI 13® X X X X
Universal phantom X X X X
Image quality
parameter
Noise Positioning and
alignment
Geometry and
measurement tools
Artefacts
TOR CDR® X X X
NORMI 13® X X X X
Universal phantom X X X X
Image quality
parameter
Field size Standard signal High contrast
resolution
TOR CDR® X X
NORMI 13® X X X
Universal phantom X X X
3.2 Fluoroscopy imaging
Continuous acquisition of a series of x-ray images over a period of time is called
fluoroscopy or real time radiography.9 Fluoroscopy is the main medical imaging
contributor of radiation exposure in the United States of America (USA).6 It is therefore
extremely important that image quality is maintained to ensure that additional dose is
not needed for satisfactory image formation.
3.2.1 Image formation
Fluoroscopy uses an x-ray beam and a suitable image detector to view images of
processes in the human body in real time.26 Real time imaging gives the appearance
Chapter 3 – Current image quality assurance systems
Stellenbosch University https://scholar.sun.ac.za

33
of continuous movement. Fluoroscopy produces real time images at high frame rates
and relatively low doses per image.27 Image detectors or receptors are called x-ray
image intensifiers.26 Modern day image detectors are direct and indirect flat panels.
X-ray image intensifiers convert incident photons into visible light photons at the input
phosphor, typically made of caesium iodide. The light photons strike a photocathode
and electrons are emitted, repelled and accelerated towards an anode, where the
electrons are converted to light photons at the output phosphor, characteristically
made of zinc cadmium sulphate. The x-ray image is intensified through electronic flux
gain, due to the kinetic energy gained by the electrons as they are accelerated, and
through magnification gain, due to the reduction of a large x-ray image at the input
phosphor to a smaller output phosphor. A measure of system performance is
brightness gain, and this is the product of the electronic and magnification gains. The
conversion factor is the ratio of the luminance produced at the output phosphor to the
incident air Kerma rate at the input phosphor. It decreases over time.26
In fluoroscopy, AEC, or Automatic Brightness Control (ABC), controls the incident air
Kerma rate on the x-ray image intensifier in order to prevent changes in the brightness
of the displayed image, which could alter diagnosis and navigation.26
In continuous fluoroscopy the x-ray beam is constantly on. This is a basic approach
to fluoroscopy image acquisition. With pulsed fluoroscopy lower radiation doses,
improved image quality and reduced tube loading can be achieved.26 The x-ray
generator produces a number of short x-ray pulses, at a certain pulse rate for example
30, 15, 7.5, 4 or 2 pulses per second, which decreases motion artefacts. The frame
rate is the image acquisition rate and should be set as low as possible for the
examination being done to decrease delivered radiation dose.27
3.2.2 Image QA parameters
Routine quality control checks are used as constancy checks. Image quality should
be assessed routinely using a phantom that has sufficient attenuation to simulate a
patient. Daily assessment before the first patient is imaged for reproducibility is
recommended.23
Chapter 3 – Current image quality assurance systems Chapter 3 – Current image quality assurance systems
Stellenbosch University https://scholar.sun.ac.za

34
Image quality assessment in fluoroscopy includes contrast, noise, sharpness,
artefacts, distortions in the image and temporal resolution. These parameters are
affected by the design, configuration and use of the fluoroscopic equipment.26 Grey
scales and circular geometry should also be assessed.28,29 The investigation of these
parameters are discussed below.
Spatial resolution and contrast resolution must be evaluated using a suitable phantom
with attenuator, wire mesh and a step wedge. The step wedge can also be used to
monitor contrast and brightness settings. A line pair phantom with 0.7 – 5.0 line pairs
per millimetre (lp/mm) can be used to evaluate spatial resolution. Fluoroscopic
contrast resolution is acceptable if 11 mm disks at less than 2 % contrast level can be
seen.6 Contrast resolution in fluoroscopy is low compared to general x-rays, due to
low SNR, and can be increased by increasing exposure rates. However, this also
increases the radiation dose delivered to the patient. Scattered radiation from the
patient also degrades contrast resolution. Fluoroscopic temporal resolution is better
than in general x-ray imaging. Several temporal frames are blurred together,
improving the SNR, as the x-ray photons from different frames are combined in an
image, reducing temporal resolution.27 The noise levels are generally high due to
reduced incident air Kerma rates which are used to minimise patient dose. The image
sharpness is influenced by the display and video camera matrix, field of view (FOV),
magnification, noise and motion.26 It is recommended that contrast resolution should
be checked monthly.23
Fluoroscopic subject contrast is improved by using radiopaque markers and contrast
agents, like iodine, barium, gadolinium and carbon dioxide, and by using spectral
shaping. In spectral shaping copper filtration is used to attenuate the low energy
photons that contribute to patient dose and not to image formation. However this also
reduces energy fluence and hence milliampere-seconds (mAs) must be increased.26
This can be addressed using AEC.
AEC optimises the relationship between patient thickness, copper filtration and tube
current by reducing the copper filtration and increasing tube current with increased
patient thickness.26 Obtained phantom images should also be investigated for image
blurriness, i.e. the image is not in focus. Automatic brightness control is the ability of
Chapter 3 – Current image quality assurance systems
Stellenbosch University https://scholar.sun.ac.za
35
a fluoroscopic system to adjust the mAs and/or kV (and/or pulse width with pulsed
fluoroscopy) with patient or phantom thickness to maintain image quality. Image
quality of a suitable phantom should be investigated for different thickness of phantom
or with different attenuator plates. The visualised image quality should remain almost
the same.5 It is therefore important that different phantom thickness depths are used
during QC to ensure the correct operation of AEC.
In fluoroscopy centring is important. Any portion of the fluoroscopic field outside of the
image receptor does not contribute to the useful image and hence patient exposure is
increased. This alignment should be checked.30 According to the AAPM and
American College of Radiology (ACR) collimation and radiation beam alignment,
image artefacts, resolution and phantom image quality should be assessed routinely,
in addition to dosimetry quality control.22 Dose measurements are beyond the scope
of this dissertation.
Image quality is also affected by artefacts. A hazy image of which the contrast is
reduced, is affected by veiling glare. It is caused by the scatter in the x-ray image
intensifier. A fall-off in light intensity towards the image edge is referred to as
vignetting. It is caused by deterioration of the video camera and can be reduced by
restricting aperture size. Blooming occurs when the signals to the video camera
exceed the dynamic range, causing lateral spread in the camera target, resulting in a
diffuse image that is larger than the original. This has been addressed in charge-
coupled device (CCD) cameras. Enlargement of the image at the image edges is
called pincushion distortion and is due to the curvature of the input phosphor.
Pincushion effects are reduced by using a smaller FOV. Distortion occurs when
straight objects appear curved. This happens when electrons are accelerated in the
x-ray image intensifier in the presence of an external magnetic field.26
3.2.3 Current* image QA phantoms
The NORMI Rad/Flu® phantom is popular in private practice fluoroscopy image quality
assurance in South African catheterization laboratories. It, together with a variety of
other commercially available phantoms, are considered below, with comparison to
* Current refers to the situation as in 2016
Chapter 3 – Current image quality assurance systems
Stellenbosch University https://scholar.sun.ac.za

36
the proposed universal image quality assurance phantom prototype as described in
Chapter 4 section 4.3.
3.2.3.1 TOR 18FG® phantom
Leeds Test Objects medical imaging phantoms has a TOR 18FG® fluoroscopy and
fluorography phantom. Constancy checks with the phantom include a grey scale
check, resolution limit with 0.5 to 5.0 lp/mm, circular geometry with a lead circle and
low-contrast large-detail detectability with 18 inserts of 8 mm diameter at contrast
range 0.009 to 0.167 at 70 kVp and 1 mm Cu filtration.28 The phantom and a x-ray
image of the phantom are shown in Figure 3.6.
Figure 3.6: a.) The Leads TOR 18FG® phantom. b.) X-ray image of the phantom.
(Leads Test Objects Limited28)
3.2.3.2 RD/FL® contrast-resolution test phantom
The RD/FL® contrast-resolution test phantom, shown in Figure 3.7, is available from
CIRS. It contains three mesh patterns ranging from 0.8 to 3.9 lines per mm (20-100
lines per inch) and four low contrast targets of 2, 4, 6 and 8 mm diameter. It allows for
the assessment of resolution and contrast in one exposure.29
a.) b.)
Chapter 3 – Current image quality assurance systems
Stellenbosch University https://scholar.sun.ac.za

37
Figure 3.7: The RD/FL® contrast-
resolution test phantom. (CIRS Tissue
Simulation and Phantom
Technology29)
3.2.3.3 Pro-RF® phantom
JRT Associates supplies several similar fluoroscopic resolution phantoms. The Pro-
RF® phantom has eight wire mesh patterns and are available for standard and high
resolution systems. Figure 3.8 illustrates the phantom.31
Figure 3.8: The Pro-RF® resolution test
phantom. (JRT Associates31)
Chapter 3 – Current image quality assurance systems
Stellenbosch University https://scholar.sun.ac.za
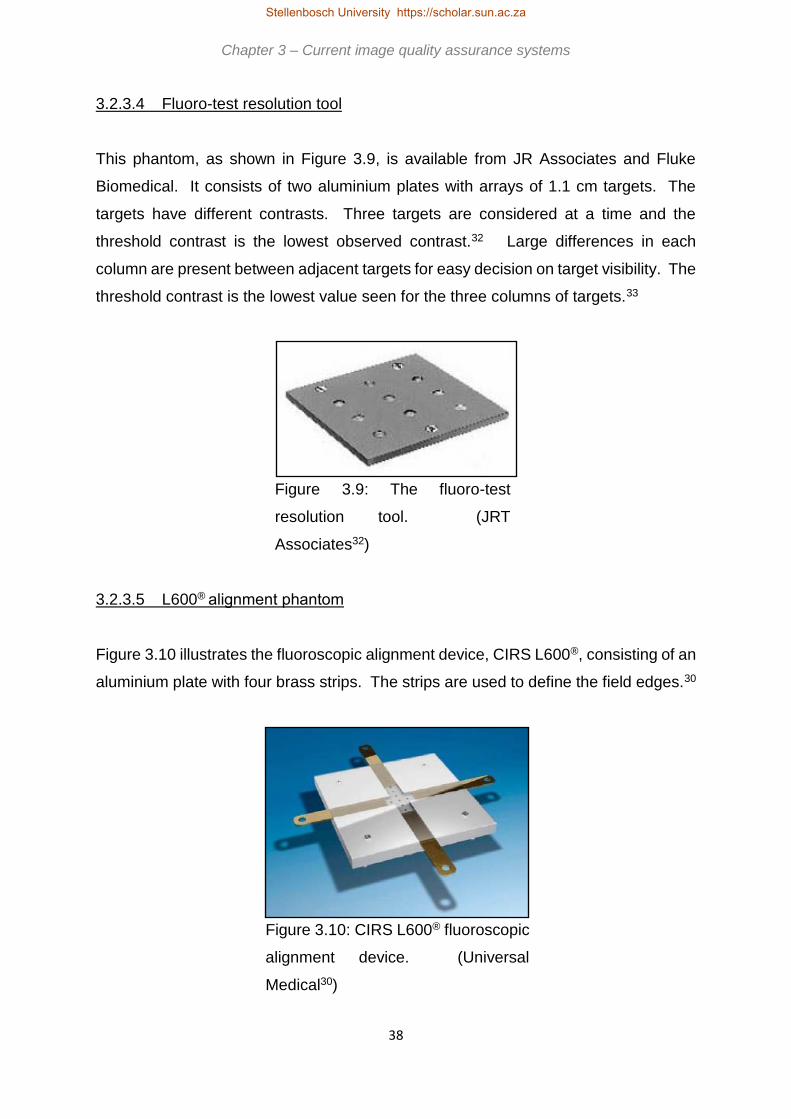
38
3.2.3.4 Fluoro-test resolution tool
This phantom, as shown in Figure 3.9, is available from JR Associates and Fluke
Biomedical. It consists of two aluminium plates with arrays of 1.1 cm targets. The
targets have different contrasts. Three targets are considered at a time and the
threshold contrast is the lowest observed contrast.32 Large differences in each
column are present between adjacent targets for easy decision on target visibility. The
threshold contrast is the lowest value seen for the three columns of targets.33
Figure 3.9: The fluoro-test
resolution tool. (JRT
Associates32)
3.2.3.5 L600® alignment phantom
Figure 3.10 illustrates the fluoroscopic alignment device, CIRS L600®, consisting of an
aluminium plate with four brass strips. The strips are used to define the field edges.30
Figure 3.10: CIRS L600® fluoroscopic
alignment device. (Universal
Medical30)
Chapter 3 – Current image quality assurance systems
Stellenbosch University https://scholar.sun.ac.za

39
3.2.3.6 Fluoroscopy phantom 07-649 CDRH®
Another contrast/resolution test tool is the 07-649 CDRH® fluoroscopic phantom.
Figure 3.11 shows it has eight low contrast test holes of 9.5 mm diameter and
thicknesses of 0.2 to 1.7 mm. For resolution eight wire meshes of 0.5 – 2.4 lines per
mm are included.34
Figure 3.11: The CDRH® test
phantom. (Fluke Biomedical34)
3.2.3.7 SFS set
The SFS set by Radcal® contains different phantoms. Contrast is assessed with 108
inserts, 12 sizes, 0.25 – 11 mm, and 9 contrasts of each size. A step wedge is used
to evaluate grey scales and a circle for geometry check. Resolution is 0.5 – 5.0 lp/mm.
Figure 3.12 illustrates the set.35
3.2.3.8 R/F QC® phantom
The R/F QC® phantom, as in Figure 3.13, has pie shaped wedges with 0.8 – 3.9 lines
per mm for high contrast resolution. Four low contrast “masses” of 2, 4, 6 and 8 mm
diameter and a density difference patch are used for contrast evaluation. Lines on the
phantom are used for alignment with the light field.36
Chapter 3 – Current image quality assurance systems
Stellenbosch University https://scholar.sun.ac.za

40
Figure 3.12: The SFS® set for
fluoroscopy image quality
assurance. (Radcal35)
Figure 3.13: The R/F® phantom.
(JRT Associates36)
3.2.3.9 CIRS Model 903® radiography/fluoroscopy QA phantom
The phantom is made from PMMA equivalent epoxy and is 25.4 cm wide and long and
20.7 cm high. It has lead markers at known distances for measurement accuracy.
Different depth low contrast holes, 9.5 mm in diameter, in an aluminium disk are used
for low contrast assessment. Hole depths range from 1.73 mm to 0.10 mm. High
contrast mesh inserts have from 3.15 to 0.47 lines per mm. A contrast detail insert of
9.53 mm thick, 30.00 mm wide and 70.00 mm long is also included. It has 24 holes of
6 different depths and 4 different diameters as shown in Figure 3.14.37
Chapter 3 – Current image quality assurance systems Chapter 3 – Current image quality assurance systems
Stellenbosch University https://scholar.sun.ac.za

41
Figure 3.14: CIRS Model 903®
phantom. (Medical Device Depot
Inc37)
3.2.3.10 Gammex rad/fluoro kit 184D®
Gammex has a similar kit, as in Figure 3.15, the Gammex Rad/Fluoro Kit 184D®, that
contains an aluminium step wedge, high and low contrast test tools and beam
alignment device.38
Figure 3.15: Gammex Rad/Fluoro® kit.
(Gammex38)
Chapter 3 – Current image quality assurance systems
Stellenbosch University https://scholar.sun.ac.za

42
3.2.3.11 Fluoroscopic imaging test phantom
Fluke Biomedical’s Fluoroscopic Imaging Test Phantom, schematically shown in
Figure 3.16, has lead disks to set the black level, white dots for resolution check and
grey scale steps.39
Grey scale values can be assessed with a perspex step wedge.40 The grey scale
value of each of the steps is recorded and compared to the values at commissioning.23
Figure 3.16: The Fluoroscopic Imaging Test Phantom. (Fluke
Biomedical39)
3.2.3.12 NORMI Rad/Flu® phantom
This phantom is used for acceptance and constancy testing in fluoroscopy. It
incorporates a copper step wedge for sensitometry assessment, a resolution test
pattern, a grid plate and eight low contrast detection inserts.41 The resolution is
assessed visually by reading the lp/mm resolved from the lead-foil grid. Resolutions
from 0.6 to 5.0 lp/mm are included. Contrast is visually evaluated with a copper step
wedge, with 17 steps of thickness 0.00 to 3.48 mm at depths of 13 mm and 5 mm.42
The readings and difference between the grey scale values of two specified steps is
recorded for signal standardisation and contrast calculation. Contrast detail inserts
are visually inspected for visibility.43 Eight inserts of 10 mm diameter and depth of 0.4
to 4.0 mm are used as well as sixteen inserts, one in each step wedge step, of 4 mm
Chapter 3 – Current image quality assurance systems
Stellenbosch University https://scholar.sun.ac.za

43
diameter at 2.5 mm depth.42 For position verification the distance between the mid-
marks on the test object and the centre of the radiation limiting field is measured. The
diameter of the object is also measured.43 A radiograph of the phantom is shown in
Figure 3.17.42
Figure 3.17: The NORMI Rad/Flu® fluoroscopy phantom. a.) Copper
step wedge. b.) Contrast detail inserts. c.) Resolution test pattern.
(PTW Freiburg GmbH42)
The routine QC ability of the commercially available phantoms discussed above are
summarised in Table 3.2, in comparison to the universal image quality assurance
phantom, which is a suitable solution for wide-ranging QC in fluoroscopy.
a.)
b.)
c.)
Chapter 3 – Current image quality assurance systems
Stellenbosch University https://scholar.sun.ac.za

44
Table 3.2: Summary of commercially available modality specific fluoroscopy
phantoms compared to the universal image quality assurance phantom.
Image quality parameter Sensitometry Low
contrast
detectability
Uniformity Resolution
TOR 18FG® X X X X
RD/FL® X X X
Pro-RF® X X
Fluoro-Test® X X X
CIRS L600® X
CDRH® X X X
SFS Set® X X X X
RF QC® X X X
CIRS 903® X X X
Gammex Rad/Fluoro® X X X
Fluke Imaging Test Phantom® X X X
NORMI Rad/Flu X X X
Universal phantom X X X X
Image quality parameter Noise Positioning
and
alignment
Geometry and
measurement
tools
Artefacts
TOR 18FG® X X X
RD/FL® X X X
Pro-RF® X X X
Fluoro-Test® X X X
CIRS L600® X X X
CDRH® X X X
SFS Set® X X X
RF QC® X X X
CIRS 903® X X X
Gammex Rad/Fluoro® X X X X
Fluke Imaging Test Phantom® X X X
NORMI Rad/Flu® X X X X
Universal phantom X X X X
Chapter 3 – Current image quality assurance systems
Stellenbosch University https://scholar.sun.ac.za

45
Image quality parameter Field size Standard
signal
High contrast
resolution
TOR 18FG® X
RD/FL®
Pro-RF®
Fluoro-Test®
CIRS L600® X
CDRH® X
SFS Set®
RF QC® X
CIRS 903®
Gammex Rad/Fluoro® X
Fluke Imaging Test Phantom® X
NORMI Rad/Flu® X X X
Universal phantom X X X
3.3 Mammography imaging
Mammography is used to detect early stage breast cancer, as diagnostic
mammography for symptomatic patients and as screening mammography for
asymptomatic individuals. It is also used to localise suspicious areas and as guidance
imaging when doing breast biopsies. On a mammogram the distinctive morphology
of a tumour mass, patterned appearances of mineral deposits, called micro-
calcifications, architectural changes of normal anatomy and differences in the
appearance of the same area between the left and right breasts may be indicative of
cancer. The image quality of a mammogram must therefore be maintained at a level
suitable for these identifications. The resolution of the imaging system must be such
that small objects can easily be identified. Breast tissues have low subject contrast,
necessitating the use of low energy x-ray spectra to obtain suitable image contrast.
Breast tissue is radiation sensitive, and hence the delivered radiation dose must be
kept as low as reasonably achievable (ALARA), whilst maintaining acceptable image
quality.44
Chapter 3 – Current image quality assurance systems
Stellenbosch University https://scholar.sun.ac.za

46
Awareness about early detection of breast cancer is increasing. This creates a need
for image quality to be optimal, to aid in accurate detection of early stage cancers,
minimising false negative results, which in turn requires routine and accurate image
quality assurance. A structured quality assurance program monitors performance of
mammography equipment and provides a record of machine failure. Quality control
procedures should be performed regularly and records meticulously kept, and
compared to baseline values, to identify trends and possible equipment issues before
patient care is affected. When problems are detected, appropriate action should be
taken to correct the problem and further testing should be done to confirm the problem
is solved.45
3.3.1 Image formation
Due to the unique image quality requirements in mammography, i.e. superior system
resolution and contrast from low contrast breast tissues, specific image acquisition
parameters are used. For typical breast thicknesses of 3 - 5 cm, best contrast is
obtained using molybdenum target with a beryllium window x-ray tube and 0.03 mm
molybdenum filtration. Typical exposures for film screen are made at 25 - 35 kVp and
20 - 30 mA for 3 - 6 s. Resolution can be as high as 16 cycles per millimetre with
mammography imaging. It is recommended that AEC is used.45
Another unique feature of mammography is the use of compression during image
acquisition. Compression techniques reduce overlapping anatomy, i.e. spread
tissues, and decrease tissue thickness and motion. This reduces scatter, geometric
blurring and the delivered radiation dose.46
X-ray tube orientation is angled so that a more intense x-ray beam is obtained on
chest-wall side, where a greater thickness of breast tissue is encountered, with x-ray
intensity fall-off towards the nipple side. The x-ray beam is parallel to the chest-wall
to decrease the radiation dose received by the heart. The angled anode absorbs those
x-rays parallel to it. The basic concept of mammography imaging is shown in Figure
3.18.
Chapter 3 – Current image quality assurance systems
Stellenbosch University https://scholar.sun.ac.za

47
Figure 3.18: Mammography imaging.
Mammography is performed at low tube voltages, below 40 keV, to increase obtained
image contrast. Mammography anodes are made from Tungsten or Molybdenum.
Tungsten has a higher melting point to accommodate high filament and tube currents,
and allows for more efficient x-ray production, due to its higher atomic number.
Molybdenum and rhodium are also used, as the K-shell energies are between 17.5
and 22.7 keV, which is optimal for breast imaging.46
With screen-film mammography light diffusion results in image blurring. This is
influenced by the screen phosphor thickness and particle size, light absorbing dyes
and pigments in the screen and by film-screen contact. Single screens can be used
to counteract this. Resolution in film-screen mammography is very high. Radiographic
noise is caused by film granularity, quantum mottle and screen structure mottle. It
results in random optical density variations on a film exposed with a uniform radiation
dose.45 Nowadays CR and DR mammography units are more commonly used than
film-screen units.
3.3.2 Image QA parameters
Mammography imaging allows early detection of breast cancer by showing small
lesions and micro-calcification details. Changes in breast tissue are subtle and hence
mammography image quality must be sensitive enough for accurate detection and
diagnosis. Routine image quality evaluation, i.e. image quality consistency testing, is
thus very important. Image quality can be evaluated objectively or subjectively.
Objective evaluation is done by calculation of SNR, CNR and MTF for example.
Mathematical functions give objective and comparable results. Subjective image
Chapter 3 – Current image quality assurance systems
Stellenbosch University https://scholar.sun.ac.za

48
quality evaluation is the visual investigation of phantom or clinical images.47 Image
quality is assessed visually, by counting the number of specks, fibres and masses
seen and noting the smallest or finest of these that are visible. Images are also
investigated for the presence of artefacts. As obtained image quality will depend on
the imaging technique factors used, these should be noted and used in future. Image
quality analysis then becomes a reproducibility test.
QC in mammography should test image acquisition intensively, image processing
according to manufacturer’s specifications, and image display, including monitors and
printers. Recommended tests include image noise, signal homogeneity, artefacts,
contrast and spatial resolution and SNR.3
Mammography phantoms should allow for easy assessment of resolution, contrast
and overall system performance. Resolution can be tested with a bar phantom with
up to 20 cycles per millimetre. Micro-calcifications are simulated with groups of SiC,
Al2O3 or CaCO3 specks with dimensions 200 - 400 µm. An image of a uniform
phantom assesses the uniformity of the x-ray field, the presence of artefacts and the
consistency of AEC. Contrast is evaluated using a step wedge of aluminium sheets
each of 0.4 mm thickness in 15 steps. Low contrast is assessed with a PMMA disk of
2 - 5 mm thickness.4 Image contrast is assessed by obtaining the differences in optical
density, or image grey scale, behind two selected steps of an aluminium step wedge
or behind a PMMA disk and another region in a phantom. Contrast indicates overall
changes in system performance. However to diagnose specific issues more specific
tests are needed.45 These tests must be performed for all used manual settings,
target/filter combinations and for AEC.
Additionally, for AEC the optical density should remain within ± 0.15 units over the
range of different breast thicknesses with uniform phantoms of different thicknesses
being imaged.4
Chapter 3 – Current image quality assurance systems
Stellenbosch University https://scholar.sun.ac.za

49
3.3.3 Current* image QA phantoms
The most commonly used phantom for mammography image quality assurance in
South Africa is the Gammex 156® mammographic accreditation phantom. It is the
number one phantom listed by the ACR and is the standard phantom used in USA and
Canada. The NORMI PAS® phantom is also used in mammography private practice
and was used in Chapter 4 section 4.3 for validation of the universal image quality
assurance phantom prototype. These phantoms, and a variety of other commercially
available phantoms, are described below.
3.3.3.1 Gammex 156® mammographic accreditation phantom
The IAEA recommends the phantom used should contain structures mimicking those
found in breast tissue.3 Figure 3.19 shows the Gammex 156® mammographic
accreditation phantom.48
Figure 3.19: a.) The Gammex 156® mammographic accreditation phantom.
b.) Insert layout of the phantom. (Gammex48)
* Current refers to the situation as in 2016
b.) a.)
Chapter 3 – Current image quality assurance systems
Stellenbosch University https://scholar.sun.ac.za
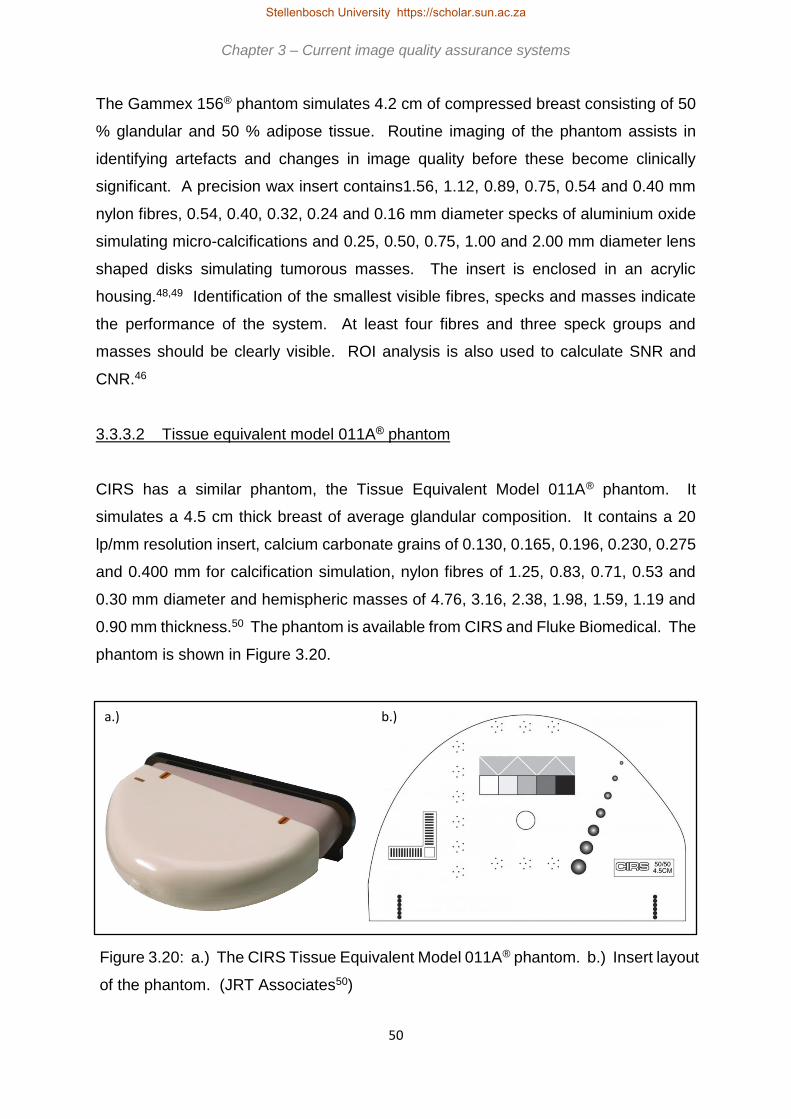
50
The Gammex 156® phantom simulates 4.2 cm of compressed breast consisting of 50
% glandular and 50 % adipose tissue. Routine imaging of the phantom assists in
identifying artefacts and changes in image quality before these become clinically
significant. A precision wax insert contains1.56, 1.12, 0.89, 0.75, 0.54 and 0.40 mm
nylon fibres, 0.54, 0.40, 0.32, 0.24 and 0.16 mm diameter specks of aluminium oxide
simulating micro-calcifications and 0.25, 0.50, 0.75, 1.00 and 2.00 mm diameter lens
shaped disks simulating tumorous masses. The insert is enclosed in an acrylic
housing.48,49 Identification of the smallest visible fibres, specks and masses indicate
the performance of the system. At least four fibres and three speck groups and
masses should be clearly visible. ROI analysis is also used to calculate SNR and
CNR.46
3.3.3.2 Tissue equivalent model 011A® phantom
CIRS has a similar phantom, the Tissue Equivalent Model 011A® phantom. It
simulates a 4.5 cm thick breast of average glandular composition. It contains a 20
lp/mm resolution insert, calcium carbonate grains of 0.130, 0.165, 0.196, 0.230, 0.275
and 0.400 mm for calcification simulation, nylon fibres of 1.25, 0.83, 0.71, 0.53 and
0.30 mm diameter and hemispheric masses of 4.76, 3.16, 2.38, 1.98, 1.59, 1.19 and
0.90 mm thickness.50 The phantom is available from CIRS and Fluke Biomedical. The
phantom is shown in Figure 3.20.
Figure 3.20: a.) The CIRS Tissue Equivalent Model 011A® phantom. b.) Insert layout
of the phantom. (JRT Associates50)
b.) a.)
Chapter 3 – Current image quality assurance systems
Stellenbosch University https://scholar.sun.ac.za

51
3.3.3.3 Gammex 183® mammographic QC kit
The Gammex 183® routine mammographic QC kit contains, amongst others, a
mammographic accreditation phantom (as discussed above) and ACR
mammographic quality control manual. The kit allows for image quality, compression
force, film-screen contact and processor performance evaluation.51 A similar kit is
offered by CIRS.52
3.3.3.4 CIRS high contrast resolution phantoms
The Model 016B® phantom is a bar pattern with 5 to 28 lp/mm. Each bar pattern is
positioned at 90 degrees to allow resolution assessment parallel and perpendicular to
the anode-cathode direction with a single exposure. It is made from 17.5 micron thick
gold-nickel alloy.53 The CIRS Model 016A®, shown in Figure 3.21, has 5 to 20 lp/mm.54
Figure 3.21: The CIRS Model 016B
bar phantom. (JRT Associates54)
3.3.3.5 Artefact identification and contrast detail phantoms
Artefacts can be assessed by imaging a scratch free perspex object. The Artefact
Identification Phantom® from JRT Associates is 3.8 x 30.0 x 24.0 cm3.55 They also
supply a model 18-252 Contrast Detail Mammography Phantom® with 49, in a 7 x 7
matrix, holes with subtle contrast differences. The diameters range from 4.29 to 0.18
mm and contrast from 6.6 % to 0.41 %.56 These phantoms are shown in Figure 3.22
below.
Chapter 3 – Current image quality assurance systems
Stellenbosch University https://scholar.sun.ac.za

52
Figure 3.22: CIRS mammography phantoms. a.) The Artefact
identification phantom®. (JRT Associates55) b.) The 18-252
contrast/detail phantom®. (JRT Associates56)
3.3.3.6 CIRS model 020 BR3-D® phantom
The phantom consists of 6 half circle slabs with 50 % glandular and 50 % adipose
equivalence swirled in each slab. Each slab has a unique swirl pattern, resulting in
different backgrounds when stacked together in different thicknesses and
combinations. One slab contains calcium carbonate specks of 0.130, 0.165, 0.196,
0.230, 0.275 and 0.400 mm, spheroidal masses of epoxy resin of 1.80, 2.38, 3.18,
3.96, 4.76 and 6.32 mm and fibres of 10 mm length and 0.15, 0.18, 0.23, 0.28, 0.38,
0.41 and 0.60 mm diameter.57 The phantom is shown in Figure 3.23.
Figure 3.23: a.) The CIRS Model 020 BR3-D phantom®. b.) Insert
layout of the phantom. (JRT Assocaites57)
a.) b.)
a.) b.)
Chapter 3 – Current image quality assurance systems
Stellenbosch University https://scholar.sun.ac.za
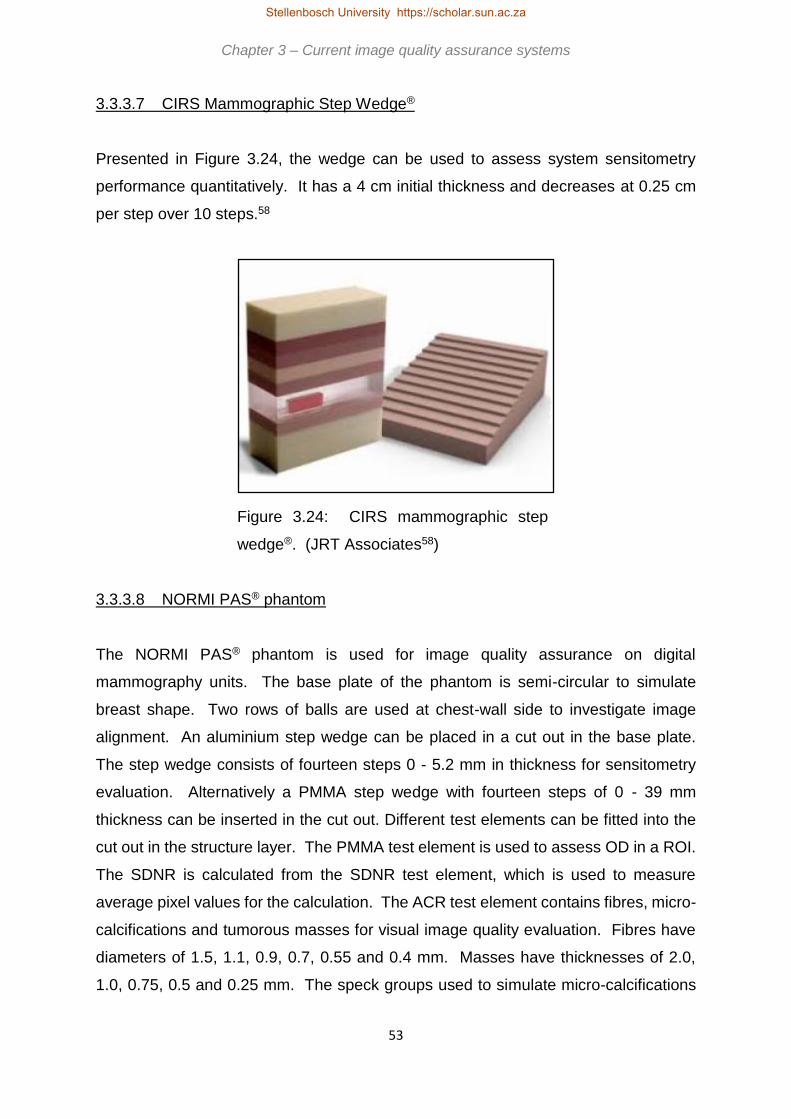
53
3.3.3.7 CIRS Mammographic Step Wedge®
Presented in Figure 3.24, the wedge can be used to assess system sensitometry
performance quantitatively. It has a 4 cm initial thickness and decreases at 0.25 cm
per step over 10 steps.58
Figure 3.24: CIRS mammographic step
wedge®. (JRT Associates58)
3.3.3.8 NORMI PAS® phantom
The NORMI PAS® phantom is used for image quality assurance on digital
mammography units. The base plate of the phantom is semi-circular to simulate
breast shape. Two rows of balls are used at chest-wall side to investigate image
alignment. An aluminium step wedge can be placed in a cut out in the base plate.
The step wedge consists of fourteen steps 0 - 5.2 mm in thickness for sensitometry
evaluation. Alternatively a PMMA step wedge with fourteen steps of 0 - 39 mm
thickness can be inserted in the cut out. Different test elements can be fitted into the
cut out in the structure layer. The PMMA test element is used to assess OD in a ROI.
The SDNR is calculated from the SDNR test element, which is used to measure
average pixel values for the calculation. The ACR test element contains fibres, micro-
calcifications and tumorous masses for visual image quality evaluation. Fibres have
diameters of 1.5, 1.1, 0.9, 0.7, 0.55 and 0.4 mm. Masses have thicknesses of 2.0,
1.0, 0.75, 0.5 and 0.25 mm. The speck groups used to simulate micro-calcifications
Chapter 3 – Current image quality assurance systems
Stellenbosch University https://scholar.sun.ac.za

54
are 0.5, 0.4, 0.3, 0.2 and 0.12 mm in diameter. A dose detector can also be fitted in
the phantom. The NORMI PAS phantom is shown in Figure 3.25.59
Figure 3.25: The NORMI PAS® phantom. (PTW Freiburg
GmbH59)
For image quality constancy checks, the NORMI PAS® phantom assesses radiation
field limits and centre, average grey scale value, SNR, CNR, artefacts, spatial
resolution and contrast resolution.
The commercially available mammography phantoms discussed above are
summarised in Table 3.3. Included in the table are the image quality assurance
parameters that can be assessed with the universal image quality assurance phantom.
The universal image quality assurance phantom therefore presents an acceptable
solution for consistency QC in mammography.
Chapter 3 – Current image quality assurance systems
Stellenbosch University https://scholar.sun.ac.za

55
Table 3.3: Summary of commercially available modality specific mammography
phantoms compared to the universal image quality assurance phantom.
Image quality parameter Sensitometry Low contrast
detectability
(masses)
Uniformity Resolution
Gammex 156® X X
CIRS tissue equivalent® X X X
CIRS model 016 A & B® X
CIRS artefact identification®
CIRS contrast/detail 18-252®
CIRS 020 BR3-D® X X
CIRS step wedge® X
NORMI PAS® X X X X
Universal phantom X X X X
Image quality parameter Noise Positioning and
alignment
Geometry and
measurement
tools
Artefacts
Gammex 156® X X X X
CIRS tissue equivalent® X X
CIRS model 016 A & B® X X
CIRS artefact identification® X X X
CIRS contrast/detail 18-252® X X
CIRS 020 BR3-D® X X
CIRS step wedge® X X
NORMI PAS® X X X X
Universal phantom X X X X
Image quality parameter Standard
signal
High contrast
resolution
Micro-
calcifications
Fibres
Gammex 156® X X X X
CIRS tissue equivalent® X X X
CIRS model 016 A & B®
CIRS artefact identification® X
CIRS contrast/detail 18-252® X X
CIRS 020 BR3-D® X X X
Chapter 3 – Current image quality assurance systems
Stellenbosch University https://scholar.sun.ac.za

56
CIRS step wedge®
NORMI PAS® X X X X
Universal phantom X X X X
3.4 Computed Tomography (CT) scanning
CT scanning became available in the 1970s. Its biggest advantage is that anatomical
information is displayed as transverse images that, when added, provide a three
dimensional representation of the scanned anatomy.9 The three dimensional image
sets, i.e. axial, coronal and sagittal, have isotropic spatial resolution.19
3.4.1 Image formation
For CT image formation, a number of transmission profiles through the patient are
acquired. The logarithm of the inverse normalised profiles is calculated and the
Fourier transform is obtained. The result is filtered and the inverse Fourier transform
is calculated. This describes the essence of filtered back projection. Filtered back
projection, as opposed to simple back projection, decreases image blurring in the
obtained CT slice or image.15 Figure 3.26 a.) illustrates simple back projection, with
filtered back projection shown in Figure 3.26 b.).60
Chapter 3 – Current image quality assurance systems
Stellenbosch University https://scholar.sun.ac.za

57
Figure 3.26: a.) Simple back projection. b.) Filtered back
projection (Steven et al60)
Simple back projection smears each view along the path it was acquired to form an
image, resulting in a blurred version of the correct image. By setting all the pixel values
along a ray to the same value and summing the back projected views the final image
is obtained. To correct for the blurring effect of simple back projection, filtered back
projection is used. As Figure 3.26 b.) shows, each view is filtered before back
projection by convolution with a filter kernel to create a set of filtered views. By back
projecting the filtered views the resultant image is a better representation of the correct
image. Using an infinite number of views will improve the image quality of the resultant
image, making it more like the correct one.60
a.)
b.)
Chapter 3 – Current image quality assurance systems
Stellenbosch University https://scholar.sun.ac.za

58
A CT scan image is a display of grey scale values derived from the linear attenuation
coefficients, 𝜇, of the materials imaged.61 For a number of different views, the x-ray
transmission profiles through the patient are measured in CT scanning. Each view is
obtained by rotating the detector and x-ray source around the patient. The
transmission profiles are used to reconstruct the CT image, which consists of a matrix
of image voxels. Each voxel has a value related to the attenuation of the x-ray beam
through the associated tissue, i.e. to the linear attenuation coefficient15, which
depends on the material density, atomic number and x-ray beam energy.61
CT scanner attenuation measurements are quoted as relative to water. For small kVp
and small atomic number changes the CT-numbers relative to water will remain quite
independent of kVp and object size. The mean CT number of water is obtained from
ROIs at different locations in an image of a uniform water bath. It should not vary by
more than the standard deviation of a centrally placed ROI in such an image.61
Different tissues have different linear attenuation coefficients. The matrix of linear
attenuation coefficients, 𝜇𝑚𝑎𝑡𝑒𝑟𝑖𝑎𝑙 , is converted to a matrix of CT-numbers,
𝐶𝑇𝑛𝑢𝑚𝑏𝑒𝑟𝑚𝑎𝑡𝑒𝑟𝑖𝑎𝑙 , relative to the linear attenuation coefficient of water at room
temperature, 𝜇𝑤𝑎𝑡𝑒𝑟 , by Equation 3.2.15 CT-numbers are also referred to as
Hounsfield Units (HU).
𝐶𝑇𝑛𝑢𝑚𝑏𝑒𝑟𝑚𝑎𝑡𝑒𝑟𝑖𝑎𝑙 =𝜇𝑚𝑎𝑡𝑒𝑟𝑖𝑎𝑙−𝜇𝑤𝑎𝑡𝑒𝑟
𝜇𝑤𝑎𝑡𝑒𝑟× 1000 [Equation 3.2]
CT scanners generally use a polychromatic x-ray source, or an x-ray spectrum. The
obtained CT-numbers are averaged, based on the linear attenuation coefficients of
each material at each x-ray energy. The CT-number of a material, relative to that of
water, therefore depends on the size and properties of the object being scanned.61
CT-numbers are quantitatively meaningful, unlike grey scale values in other x-ray
imaging modalities.19 Differences between expected and obtained CT-numbers may
occur as a result of the reconstruction filter and FOV used. Such differences are
expected for a scanner over time.15 Typical CT-number values are shown in Table
3.4, produced from Dance et al15.
Chapter 3 – Current image quality assurance systems
Stellenbosch University https://scholar.sun.ac.za
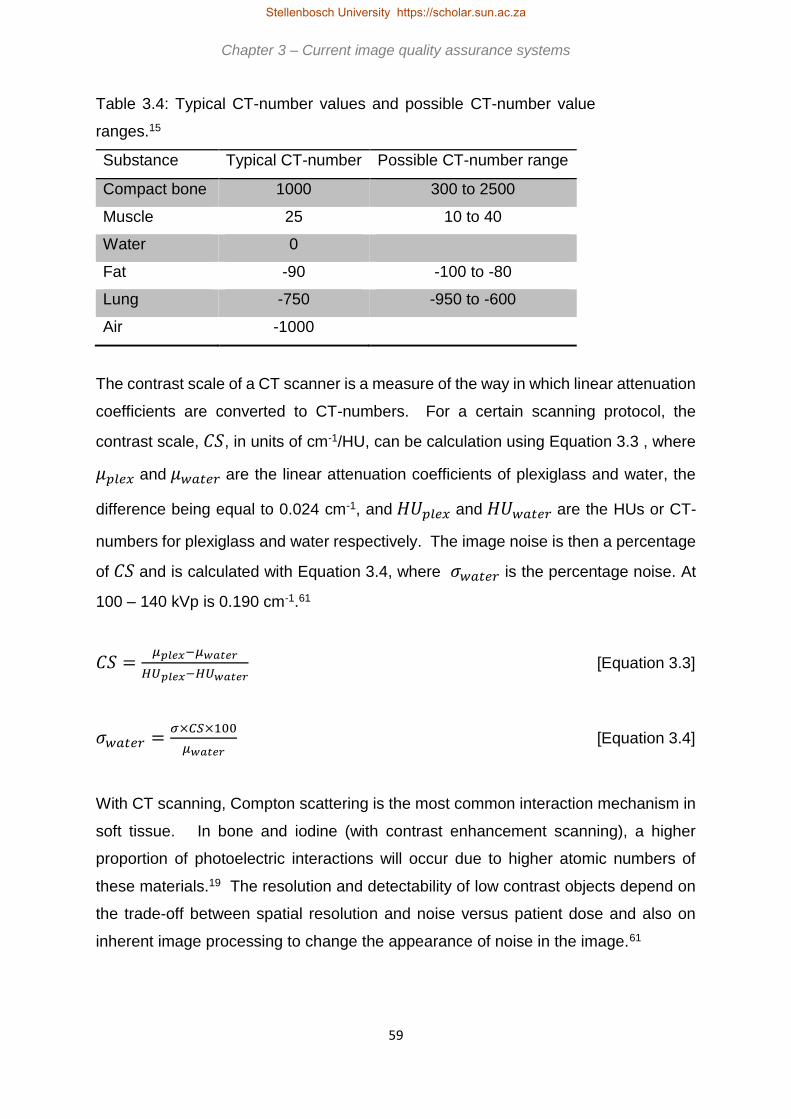
59
Table 3.4: Typical CT-number values and possible CT-number value
ranges.15
Substance Typical CT-number Possible CT-number range
Compact bone 1000 300 to 2500
Muscle 25 10 to 40
Water 0
Fat -90 -100 to -80
Lung -750 -950 to -600
Air -1000
The contrast scale of a CT scanner is a measure of the way in which linear attenuation
coefficients are converted to CT-numbers. For a certain scanning protocol, the
contrast scale, 𝐶𝑆, in units of cm-1/HU, can be calculation using Equation 3.3 , where
𝜇𝑝𝑙𝑒𝑥 and 𝜇𝑤𝑎𝑡𝑒𝑟 are the linear attenuation coefficients of plexiglass and water, the
difference being equal to 0.024 cm-1, and 𝐻𝑈𝑝𝑙𝑒𝑥 and 𝐻𝑈𝑤𝑎𝑡𝑒𝑟 are the HUs or CT-
numbers for plexiglass and water respectively. The image noise is then a percentage
of 𝐶𝑆 and is calculated with Equation 3.4, where 𝜎𝑤𝑎𝑡𝑒𝑟 is the percentage noise. At
100 – 140 kVp is 0.190 cm-1.61
𝐶𝑆 =𝜇𝑝𝑙𝑒𝑥−𝜇𝑤𝑎𝑡𝑒𝑟
𝐻𝑈𝑝𝑙𝑒𝑥−𝐻𝑈𝑤𝑎𝑡𝑒𝑟 [Equation 3.3]
𝜎𝑤𝑎𝑡𝑒𝑟 =𝜎×𝐶𝑆×100
𝜇𝑤𝑎𝑡𝑒𝑟 [Equation 3.4]
With CT scanning, Compton scattering is the most common interaction mechanism in
soft tissue. In bone and iodine (with contrast enhancement scanning), a higher
proportion of photoelectric interactions will occur due to higher atomic numbers of
these materials.19 The resolution and detectability of low contrast objects depend on
the trade-off between spatial resolution and noise versus patient dose and also on
inherent image processing to change the appearance of noise in the image.61
Chapter 3 – Current image quality assurance systems
Stellenbosch University https://scholar.sun.ac.za

60
Post-acquisition image processing and reconstruction, improving the visibility of
certain tissues or structures, is possible with CT scanning. Different reconstruction
filters can be used, depending on the tissue of importance. Ram-Lak or Ramp filters
give ideal spatial resolution with a lot of image noise. These are used to visualise
bony structures. A Shepp-Logan filter gives images with less noise and better low
contrast resolution for visualisation of soft tissues. The low contrast resolution of CT
is superior to planar imaging modalities.15
3.4.2 Image QA parameters
The AAPM lists the CT performance tests as noise or contrast scale, spatial resolution
in the imaging plane, slice thickness, sensitivity, small lesion detection or low contrast
detectability, artefacts (for example motion, beam hardening and alignment artefacts)
and image uniformity. The results from these tests must be reproducible over time,
i.e. consistency testing.61 Other image quality assurance parameters of concern in CT
scanning include CT-number linearity and CT-number of water consistency.62,63
CT spatial resolution is determined by the fundamental resolution properties of
acquiring the image and the resolution characteristics of the applied filter and
mathematical algorithms.19 MTFs can be obtained from wedge or spoke phantoms,
edge response used to calculate ESF and then MTF or by using an impulse response
from a small wire or bead to calculate the MTF from the PSF. Generally resolution is
limited by pixel size, therefore the PSF stimulus must be smaller than a pixel.
Resolution can also be determined by measuring the disappearance of moderate
contrast holes, for example water filled holes in Plexiglass.61 It can also be tested
using rods of different sizes that image as dots or plates of different sizes that image
as lines and must be made of a material with significantly higher CT-number than the
surrounding phantom material.6 Spatial resolution of at least 6 line pairs per centimetre
(lp/cm) is recommended.62
Contrast resolution is affected by exposure technique factors, slice thickness, filtered
back projection and reconstruction. Contrast resolution is assessed by visual
evaluation of a contrast detail phantom. Smaller objects have lower SNRs and are
more difficult to visualise.19
Chapter 3 – Current image quality assurance systems
Stellenbosch University https://scholar.sun.ac.za

61
The variation in CT numbers among pixels of a scan of a uniform material is referred
to as noise. The variation of the CT number among ROIs indicates on image
uniformity. Noise must be assessed for all scan protocols, using a uniform phantom,
at the centre and periphery of the images, using ROIs containing at least 25 pixels61
by calculating the standard deviation, 𝜎 .19 As the difference in the attenuation
coefficient between normal and pathological tissues is usually small, noise can result
in such pathologies being invisible.61 This necessitates the evaluation of low contrast
detectability.
Low contrast detectability, or sensitivity, is investigated with different sized low contrast
inserts. Subjectively it is assessed by visualisation and objectively by SNR
calculation.15 It investigates the ability to differentiate between objects with subtle
differences in density or attenuation coefficient.62 Sensitivity hence describes the
minimum detectable linear attenuation coefficient difference.61 Image noise can
degrade low contrast objects visibility. If noise is decreased to improve visibility of low
contrast objects, patient dose is increased. Detectability therefore depends on object
size or spatial resolution, contrast and noise, and therefore on dose.61
Slice thickness is defined as the FWHM of the response across the slice.61 Axial slice
width can be measured using a sequence of wires on a ramp at an angle to the axial
plane, arranged with 0.5 mm spaces between the wires. By counting the well-seen
wires and dividing by 2 the slice width is calculated. This can be done for different
slice thicknesses, with an accepted tolerance of 1.5 mm from prescribed width.62 The
AAPM recommends that the width at half maximum response should be used to
quantify slice thickness.61
Image uniformity ensures an image that is completely even and without artefacts. It
is assessed by obtaining the CT-number in identical ROIs in different areas of an
image of a homogeneous section of the phantom. The difference should be less than
or equal to 5 CT-numbers. Evaluation is done at specified window width and window
level settings.62
Chapter 3 – Current image quality assurance systems
Stellenbosch University https://scholar.sun.ac.za
62
CT-numbers should vary linearly with linear attenuation coefficients. This establishes
a constancy of the contrast scale over the range of linear attenuation coefficients of
interest clinically. CT-number linearity is assessed using different phantom inserts
with different electron and physical densities.61 Typical inserts include polyethylene,
water, PMMA, polycarbonate, nylon, polystyrene and Teflon.6 Each pixel value in a
CT scan image should echo the density of the material imaged in that pixel. In general,
the CT-number of water is taken as 0 and that of air as -1000. The CT-numbers of
different materials will vary depending on the x-ray spectrum used to obtain the CT
scan and is dependent on beam hardening and scatter effects. An average value has
been determined for different CT phantom materials, based on different scanners and
scanning protocols, accepted with an allowed tolerance. For example water is
accepted as 0 ± 7 CT-number. For evaluation of CT-number or CT-number linearity,
ROIs are drawn in the inserts and the displayed CT-number is compared to the
accepted value. The average CT-number of a material should remain constant for the
same exposure protocol.62
Images must also be free of artefacts, which could obscure clinically relevant
information. Artefacts in CT are acquisition, reconstruction and patient related.
Acquisition related artefacts include ring artefacts, due to miscalibration or failure of
detector elements. Moire artefact results from under sampling of the projection data.
When thick acquisition slices are used, averaging of the linear attenuation coefficients
leads to partial volume effects, giving a larger lower density image of a small high
density object. Dense bone or metal attenuates the x-ray beam strongly resulting in
beam hardening artefacts.15 As CT x-ray beams are polychromatic, beam hardening
artefacts may occur due to unequal filtration in the different image views. It can be
assessed by investigating the change in the mean CT-number in a uniform phantom
when a variety of higher atomic number objects are introduced in the phantom.61 Metal
or streak artefacts can be so severe that the x-ray beam is almost completely
attenuated, giving dark areas in the image surrounding the metal with streaky artefact
over the image.15 Ring artefacts are best evaluated with a narrow window width
setting of about 500 – 1000 CT-number.6 Patient related artefacts can be minimised
by reducing patient motion, e.g. breath holding and using short rotation times.15
Patient misalignment and motion produce streaking from high contrast objects. It can
Chapter 3 – Current image quality assurance systems
Stellenbosch University https://scholar.sun.ac.za

63
be evaluated by scanning aluminium pins in a uniform material and setting the WL low
and noting any significant streaks from the pins.61
The CT-number of water, image noise, image uniformity and artefacts should be
evaluated daily. It is recommended that CT number scale stability and accuracy
should be evaluated monthly to semi-annually. Spatial resolution should also be
evaluated at these intervals. Low contrast detectability is evaluated quarterly to
annually and as this is a subjective test, all precautions should be taken to minimise
result variability due to subjectivity.6
3.4.3 Current image QA phantoms
The most popular phantom for CT image quality control, not only in South Africa but
in general, is probably the Catphan® phantom. Different Catphan® phantom models
are available, of which more recent models are better suited for advanced multi-slice
CT scanner QC.
3.4.3.1 Gammex ACR® phantom
Commercially available CT scanner phantoms include the Gammex ACR® CT
phantom, accredited by the ACR Accreditation Program, as shown in Figure 3.27.63,64
Chapter 3 – Current image quality assurance systems
Stellenbosch University https://scholar.sun.ac.za

64
Figure 3.27: The Gammex ACR® CT phantom modules. (Gammex64)
The Gammex ACR® CT phantom is made from solid water and has a 20 cm diameter
and 16 cm length. It contains water equivalent, bone equivalent, acrylic, air and
polyethylene inserts for CT-number linearity assessment. A 0.011 mm diameter
tungsten carbide bead is used for MTF calculation. Aluminium and polystyrene line
pair material is used for resolution assessment with bar phantoms 4, 5, 6, 7, 8, 9, 10
and 12 lp/cm. Steel balls of 1 mm diameter are used for positioning and alignment
checks and 0.28 mm ball bearings for distance measurements on an axial slice. A low
contrast rod module is used for low contrast resolution with 6, 5, 4, 3 and 2 mm
diameter cylinders at a contrast 0.6 % different from background. Four cylinders of
each diameter are included. CT-number uniformity is assessed with ROI analysis.
Slice thickness is checked with two wire ramps evident in 0.5 mm z-axis
increments.63,64 For analysing low contrast detectability, a set window width (WW) and
window level (WL) should be used. The Gammex ACR® CT phantom recommends
WW=100 and WL=100 and for uniformity settings of WW=100 and WL=0. With this
phantom CT-number linearity is -107 to -87 CT-number for polyethylene, -7 to +7 CT-
number for water, +110 to +130 CT-number for acrylic, +850 to +970 CT-number for
bone and -1005 to -970 CT-number for air.62
Chapter 3 – Current image quality assurance systems
Stellenbosch University https://scholar.sun.ac.za

65
3.4.3.2 Gammex 461A® head/body phantom
The Gammex 461A® head/body CT phantom, shown in Figure 3.28, assesses noise,
CT number, uniformity, spatial resolution, low contrast detectability, alignment, slice
thickness (with 26.6o slope), phantom position and different artefacts. Spatial
resolution is assessed from 1.5 to 0.4 mm and low contrast detectability to 0.6%.65
Figure 3.28: The Gammex 461A®
head/body phantom (Gammex65)
3.4.3.3 CIRS model 610® AAPM CT performance phantom
Figure 3.29 illustrates the phantom, which can be filled with water, has a 21.59 cm
diameter and is 39.37 cm in length. It has inserts for the evaluation of CT-number
linearity, high contrast resolution, and slice thickness determination. It can also test
noise, uniformity, low contrast sensitivity or detectability (with cavities ranging from
2.54 to 0.32 cm), beam hardening effects, with a bone equivalent ring that fits over the
inserts, and has an insert for TLD dose measurements. Its set-up tests mechanical
alignment. It is designed based on the AAPM Task Force on CT Scanner Phantoms
Report 1, which aims to define the performance of a CT scanner and to describe
performance testing using phantoms.66 According to JRT Associates “one phantom
does it all” describes the CIRS phantom for CT QA.67
Chapter 3 – Current image quality assurance systems
Stellenbosch University https://scholar.sun.ac.za

66
Figure 3.29: The CIRS model 610®
AAPM CT performance phantom (CIRS
Tissue Simulation and Phantom
Technology66)
3.4.3.4 Spiral/helical CT phantom
The Universal Medical spiral/helical CT phantom is designed for low contrast lesion
detection with different scanning protocols. It contains targets with contrast 5, 10 and
20 CT-number above background.68 It is shown in Figure 3.30.
Figure 3.30: The Universal Medical
spiral/helical CT phantom (Universal
Medical68)
Chapter 3 – Current image quality assurance systems
Stellenbosch University https://scholar.sun.ac.za

67
3.4.3.5 Catphan phantom
Catphan® phantoms are used for axial, helical and spiral CT QA. The phantoms are
constructed of solid-cast materials, eliminating water leaks. It tests slice thickness (in
terms of FWHM of a wire ramp), as in Figure 3.31 b.), resolution with 1 to 21 lp/cm, as
in Figure 3.31 c.), position verification and alignment check, as in Figure 3.31 b.), low
contrast sensitivity, as in Figure 3.31 a.), spatial uniformity, noise, sensitometry and
MTF from a PSF of a tungsten carbide bead, as in Figure 3.31 c.). Additionally it
investigates sub-slice (with 3, 5, 7 and 9 mm diameter rods of 3, 5 and 7 mm length)
and supra-slice (with 40 mm length rods of 2, 3, 4, 5, 6, 7, 8, 9 and 15 mm diameter)
low contrast sensitivity, scan incrementation and circular symmetry. CT-number
linearity is tested with Teflon, air, low density polyethylene, derlin, acrylic and
polymethylpentene inserts. In Catphan 600 slice thickness is assessed using 23o
angled ramps with tungsten beads in a 40 mm thick section. The beads are arranged
in two opposing ramps, one with 0.3mm diameter beads at 1.0 mm spacing arranged
horizontally. The second ramp contains 0.17 mm beads vertically positioned at 0.25
mm spacing. Slice thickness is determined by counting the seen beads and
multiplying by the know distance between them.69,70
Figure 3.31: The Catphan® phantom. a.) Low
contrast detectability module. b.) Sensitometry,
alignment and slice thickness module. c.) Resolution
module. (The Phantom Laboratory70)
a.) b.) c.)
Chapter 3 – Current image quality assurance systems
Stellenbosch University https://scholar.sun.ac.za

68
AAPM Report No. 161 provides recommendations on the design of an acceptable CT
image quality assessment phantom. Noise assessment phantoms can either be water
filled or made from uniform plastic material. It should be circular in cross section, with
a diameter of 20.3 cm for a head phantom or 33.0 cm for a body phantom. The wall
of the phantom must be thinner than 1.0 cm plexiglass. Changes in the standard
deviation in ROIs at least 25 pixels in size located at the centre and periphery of the
phantom can be used to assess noise. This should be done for all scanning protocols
used. A 2.5 cm diameter plexiglass rod can be positioned in the centre of a water
phantom for contrast scale determination. Spatial resolution can be measured with an
edge phantom, like a plexiglass block placed in the noise phantom with the surface
exactly parallel to the rotational axis of the scanner. Alternatively, a spatial resolution
hole phantom can be used, with holes drilled into plexiglass, at a centre to centre
distance equal to twice the diameter of the hole, and filled with water. Hole diameters
are recommended as 0.75, 1.00, 1.25, 1.50, 1.75, 2.00 and 2.50 mm ± 5 %.
Investigation should be done centrally and peripherally in an image. Slice thickness
can be assessed by scanning across a 0.5 mm thick x 25.4 mm wide aluminium strip
positioned at 45o across the beam. The FWHM can be measured from a profile across
the strip and should be assessed at the centre and periphery of an image. For
sensitivity assessment pins or holes 3.0 mm to 20.0 mm in diameter can be used.
Press fitting pins is difficult and expensive, so liquid solutions in holes are
recommended. Linearity evaluation can be done with 2.5 cm diameter cylinders of
plexiglass, lexan, nylon, polystyrene and polyethylene at the centre of the noise
phantom.61
Chiarot et al71 developed a phantom for advanced imaging technology, like multi-
detector CT and cone beam CT, evaluation. The phantom addressed shortcomings
in current phantoms by having 3-D symmetry using spherical inserts and modules with
known contrast simulating real tissue. It is difficult to minimise air pockets, especially
around the spherical inserts. The head section contains spheres simulating brain
lesions. The left lung’s contrast detail spheres approximate lung modules. The right
lung is an accessible structure for insertion of different assessment devices and the
abdomen simulates kidneys, colon, rectum and prostate. Plastics like Teflon, acetal,
acrylic, nylon, polystyrene, polyethylene and polypropylene are used. Sphere
diameters are 12.7, 9.5, 8.0, 6.4, 4.8, 3.2 and 1.6 mm. Groups of 12.7 mm diameter
Chapter 3 – Current image quality assurance systems
Stellenbosch University https://scholar.sun.ac.za

69
spheres with different contrasts are also incorporated, with one sphere very close to
that of the background material. Contrast is manipulated by adding antimony to
polyurethane.71
Table 3.5 summarises the required CT image quality assurance parameters and
indicates which of these can be assessed using the described commercially available
phantoms and the universal image quality assurance phantom. The proposed
phantom can assess the identified required CT image quality assurance parameters,
as an additional tool in routine CT scanning QC.
Table 3.5: Summary of commercially available modality specific CT phantoms
compared to the universal image quality assurance phantom.
Image quality parameter CT-number
linearity
Low contrast
detectability
Uniformity Resolution
Gammex ACR® X X X X
Gammex 461A® X X X X
CIRS 610® X X X X
Universal Medical® X
Catphan® X X X X
Universal phantom X X X X
Image quality parameter Noise Positioning
and alignment
Slice
thickness
Geometry and
measurement tools
Gammex ACR® X X X X
Gammex 461A® X X X X
CIRS 610® X X X X
Universal Medical® X X
Catphan® X X X X
Universal phantom X X X X
From the results in Tables 3.1, 3.2, 3.3 and 3.5 it may be concluded that the universal
phantom could typically measure the same image quality assessment parameters as
the commercially available phantoms. In some instances measurements are less
elegant and accurate than the commercially available options, as discussed in Chapter
5, but overall the requirements for commissioning of x-ray units, i.e. setting baseline
Chapter 3 – Current image quality assurance systems
Stellenbosch University https://scholar.sun.ac.za

70
values, and for routine image QC are satisfied. The outstanding advantage of the
universal phantom remains the fact that it offers a single solution phantom covering
the full range of x-ray modalities as applied within Diagnostic Radiology.
Chapter 3 – Current image quality assurance systems
Stellenbosch University https://scholar.sun.ac.za
71
Chapter 4
Design and development of the universal image quality assurance
phantom
Image quality parameters that should be investigated for comprehensive
image quality assurance in general x-rays, fluoroscopy, mammography and CT
scanning were identified from literature sources as discussed in Chapter 3. These
were tabulated in Tables 3.1, 3.2, 3.3 and 3.5 and include sensitometry determination
(grey scale linearity or CT number consistency), low contrast detectability, image
uniformity, resolution, noise, position and alignment checks, geometry and distance
measurements, presence of artefacts, field size or x-to-light field coincidence,
standard signal and high contrast resolution. For mammography masses, fibres and
micro-calcifications should be considered as well as CT slice thickness in CT
scanning. Apart from being able to test all of these parameters, the universal image
quality assessment phantom should firstly be of a single unique structure and not a
combination of already existing phantoms, secondly be small enough for ease of
handling but also large enough to accommodate all the required image quality
assessment inserts and thirdly cheap to manufacture and easy to use. The phantom
is intended to fill an identified gap in the existing market, as described in Chapter 1,
and not to replace any of the commercially available phantoms, with emphasis on cost,
man power and expertise and time constraint limitations in resource limited institutions.
The design and development of the phantom were based on these requirements. As
this study faced a practical problem, requiring a practical approach to finding a
solution, experimental iterative derivation of the final phantom was appropriate.
4.1 Initial concepts
The phantom was developed from first principles to be a proper image quality
assurance tool based on an extensive literature review of image quality assurance,
testing and commercially available phantoms, consultation with medical physicists and
Stellenbosch University https://scholar.sun.ac.za

72
engineers and through experimentation. The process will be discussed in the following
sections.
4.1.1 Initial design
The initial concept for the universal image quality assurance phantom is illustrated in
Figure 4.1. At the time of the first design, insert and phantom dimensions had not
been determined. For planar imaging resolution a bar phantom (1) was included, with
its surface perpendicular to the x-ray beam. A small metallic plate (4) was used to
calculate MTF from ESF in planar imaging. A small central bead (5) was used to
calculate MTF from PSF for resolution in CT scanning. The central bead was also
used for set up, i.e. it was perfectly central in the phantom in all dimensions and should
therefore be seen on the 0-slice CT scan position and in the centre of a planar image.
Spherical inserts were suggested to make use of spherical symmetry, when the
phantom was upright (as in Figure 4.1 a.)) for CT scanning and placed flat (as in Figure
4.1 b.)) for planar imaging. Inserts made from materials with different densities (2)
were used to assess sensitometry. In CT scanning this is CT number consistency.
Another set of inserts, made from the same material but with different radii (3), were
used to visually assess low contrast detectability or contrast resolution. These
spherical inserts were used in CT scanning and planar imaging. For positioning in CT
scanning, a flat side was suggested (as in Figure 4.1 a.)), that would allow the phantom
to remain upright without support. The inserts were arranged in different layers to
prevent metal or streak artefacts from the bar phantom and metal plate on the
spherical insert images during CT scanning.
Chapter 4 – Design and development of the universal image quality assurance phantom
Stellenbosch University https://scholar.sun.ac.za

73
Figure 4.1: Initial universal phantom concept. a.) Set up for CT scanning. b.) Set
up for planar imaging. c.) Lateral view showing inserts in different layers.
With reference to Figure 4.1, in general x-rays, fluoroscopy and mammography, i.e.
planar imaging, low contrast resolution was assessed with the circular sphere
arrangement (3). These spheres were also used to assess masses in mammography.
Grey scale linearity was assessed with the spheres of the same size but made from
different materials. The MTF was calculated from the central bead (5) PSF and from
the ESF of the metal plate (4). High contrast resolution was determined with the bar
phantom (1). It was assumed that the bar phantom will additionally be used as fiber
analysis tool in mammography. SNRs, CNRs and image uniformity were calculated
with the semi-automatic data analysis software, as explained in Chapter 6. Cross wire
centering was checked with the bead (5) that was placed exactly centrally, using the
scribe lines on the phantom. The bead was also used as micro-calcification
assessment tool for mammography. The image quality assurance parameters for CT
scanning evaluated with the proposed phantom were low contrast resolution (with
circular sphere arrangement) (3), CT-number linearity (with circular sphere
arrangement) (2), MTF from PSF of central bead (5), SNR, CNR and uniformity
calculation with the semi-automatic data analysis software, 0-slice position (with
1 2
3
4
a.) b.)
5
c.) Key: 1 Bar phantom 2 Sensitometry inserts 3 Contrast reso- lution inserts 4 Plate 5 Central bead
Chapter 4 – Design and development of the universal image quality assurance phantom
Stellenbosch University https://scholar.sun.ac.za

74
centrally placed bead) (5) and checking room lasers used for patient positioning, using
scribe lines on the phantom that correspond to the central bead. Further development
of the initial concept was necessary, with consideration given to insert sizes and
possible materials.
Diagnostic radiology CT scanner table tops are concavely shaped to accommodate
the patient. The phantom was adjusted to be a disk with a suitable stand to allow
positioning of the phantom in the upright position for CT scanning. The physical and
geometrical properties of the different imaging modalities were considered. For CT
scanning, the phantom was in an upright position with an acceptable diameter. For
planar imaging the phantom was positioned lying flat and with a suitable thickness.
Additionally, the diameter was limited by mammography bucky size. For CT scanning
the inserts were placed in a circular pattern when the phantom was placed upright on
the couch. These inserts should not overlap the planar imaging inserts when the
phantom was placed flat. A circular arrangement of spheres was used for low contrast
detectability and sensitometry assessment.
Spherical symmetry allowed for the phantom to be used in upright CT and flat planar
imaging orientations. However, the machining of perfect spheres was difficult,
especially at the small sizes needed, and also very expensive. It was also anticipated
that the attenuation of an x-ray beam through a sphere was non-uniform and will result
in an image with intensity or grey scale increasing radially outwards from the centre of
the object. ROI analysis will therefore consider a ROI in a non-uniform object. To
overcome this, the object size must be increased substantially, in order to have a ROI
of acceptable size in a uniform region of the object. This is illustrated in Figure 4.2,
showing an x-ray image of a golf ball.
Chapter 4 – Design and development of the universal image quality assurance phantom
Stellenbosch University https://scholar.sun.ac.za

75
Figure 4.2: X-ray image of
a golf ball.
For these reasons, i.e. cost, ease of machinability and non-uniform attenuation, the
concept of spherical symmetry was abandoned and cuboids were recommended.
4.1.2 Second design
The initial concept was further developed, now employing cubic inserts, and
consideration was given to suitable sizes and materials. Tissue equivalence for
phantom inserts was extensively researched in the principal investigator’s MScMedSc
(Medical Physics) dissertation.72,73 However, as the primary focus of this study was
image quality phantom assessment only, tissue equivalence was not important. The
adjusted concept is shown in Figure 4.3. In general, the phantom would be circular in
planar view with 200 mm diameter and 40 mm thickness. It would be constructed of
suitable strength polystyrene or a hard plastic as in Table 4.1. The phantom housing
could also be 3-D printed. Printing plastic options are included in Table 4.1.
Chapter 4 – Design and development of the universal image quality assurance phantom
Stellenbosch University https://scholar.sun.ac.za

76
Table 4.1: Possible phantom housing materials.
Material Density (gcm-3)
Polystyrene 1.05 74
Perspex 1.18 74
High density polyethylene 0.95 75
3-D printing materials
Acylonitrile Butadiene Styrene (ABS) 1.01 76
Hips 1.04 76
Poly Lactic Acid (PLA) 1.25 76
The inserts for grey scale or CT-number linearity evaluation and low contrast
detectability are cuboids, arranged with a face perfectly perpendicular to the phantom
top surface for planar imaging and a face perfectly perpendicular to the x-ray beam for
rotational imaging, i.e. CT scanning. This ensures that the same thickness of material
was seen in each view. One 20 mm thick and two 10 mm thick clear plates, made
from the phantom housing material, will be supplied additional to the phantom, to be
used with the phantom for automatic exposure control (AEC) and artefact evaluation.
Chapter 4 – Design and development of the universal image quality assurance phantom
Stellenbosch University https://scholar.sun.ac.za

77
.
Figure 4.3: Developed universal image quality assurance phantom concept. a.)
Perspective showing different inserts. b.) Perspective showing inserts centred in one
plane. c.) Zoomed in image of central bead group and fibres.
For low contrast detectability, cubic inserts (3) made from the same material, but with
different thicknesses were decided on. Possible materials are included in Table 4.2.
Table 4.2: Possible low contrast
detectability materials
Seven of these low contrast inserts were used with proposed thicknesses of 2, 3, 4, 6,
8, 10, 20 mm. These sizes corresponded to recommendations in literature and would
finally be based on machinability and cost. These cubes were also used to visually
inspect masses in mammography imaging.
a.)
2
3
5 1
4 6
Key: 1 Fibres 2 Sensitometry inserts 3 Contrast reso- lution inserts 4 Ramp 5 Central bead group 6 Plate 7 Scribe lines
c.)
5
1
7
b.)
7
Material Density (gcm-3)
Polystyrene 1.05 74
Perspex 1.18 74
Nylon 1.15 74
Chapter 4 – Design and development of the universal image quality assurance phantom
Stellenbosch University https://scholar.sun.ac.za

78
For grey scale or CT-number linearity seven inserts of a single thickness of 20 mm,
but of different materials, were utilized, (2) in Figure 4.3. Proposed materials are
included in Table 4.3. All the cubic inserts were arranged along the phantom periphery
Table 4.3: Possible grey scale insert materials.
Material Density (gcm-3)
Acylonitrile Butadiene Styrene (ABS) 1.01 76
Hips 1.04 76
Poly Lactic Acid (PLA) 1.25 76
Polystyrene 1.05 74
Perspex 1.18 74
Nylon 1.15 74
Teflon 2.20 74
Gammex SB3 bone tissue equivalent plastic 1.82 77
Gammex LN300 lung tissue equivalent plastic 0.30 77
Low density polyethylene 0.91 74
Gammex solid water 1.05 77
Supawood 0.74 *
Air 0.00
* Density as calculated in Appendix C.
A small metallic bead, of 2 mm in diameter, was placed exactly at the center of the
phantom, Figure 4.3 (5). Scribe lines (7) were made on the phantom for set-up with
lateral and top lasers. Once correctly set-up the scan zero was set at this point. The
metallic ball should appear on the central slice, i.e. zero-slice. Position accuracy, zero-
slice position and set-up lasers were therefore assessed.
Image uniformity was assessed with ROI analysis with the semi-automatic data
analysis software with four ROIs of a specified size at specified different locations in
an image. The mean and standard deviation in these ROIs were used to calculate
image uniformity, i.e. the values in each of the ROIs must be within a specified
percentage of each other. Similarly, the software calculated SNRs and CNRs with
Equations 4.1 and 4.2, where 𝑆0and 𝜎0 were the mean signal and standard deviation
Chapter 4 – Design and development of the universal image quality assurance phantom
Stellenbosch University https://scholar.sun.ac.za
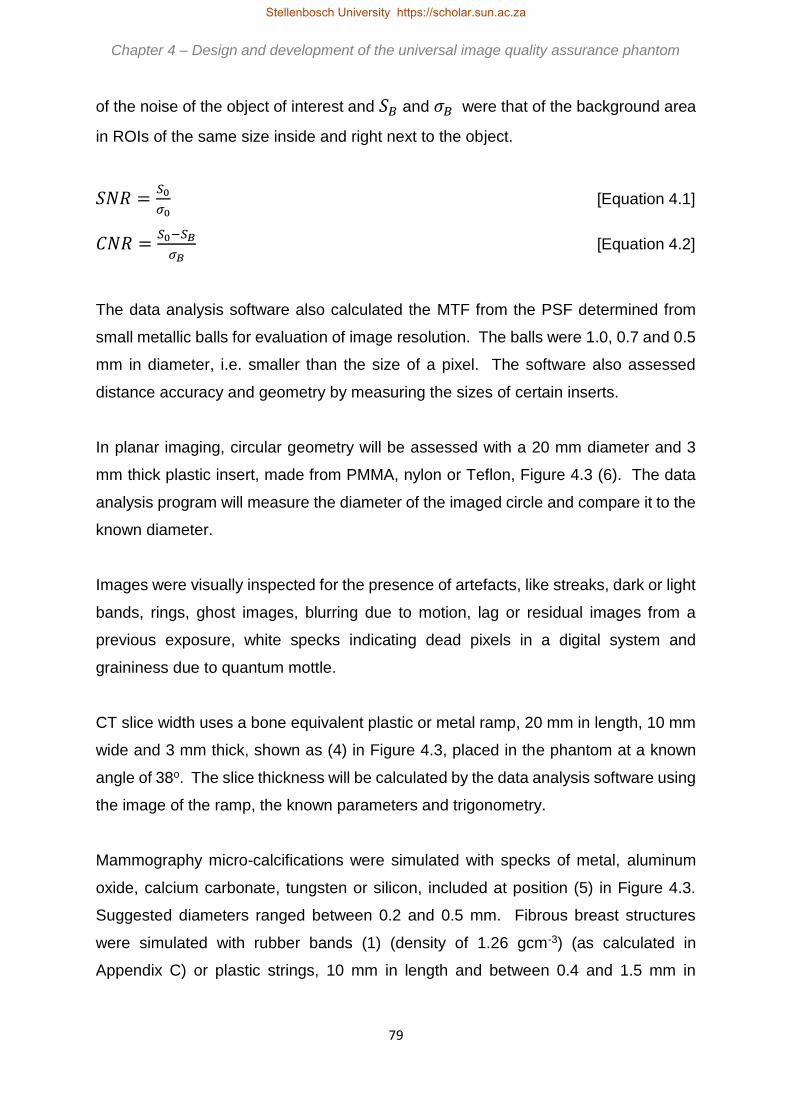
79
of the noise of the object of interest and 𝑆𝐵 and 𝜎𝐵 were that of the background area
in ROIs of the same size inside and right next to the object.
𝑆𝑁𝑅 =𝑆0
𝜎0 [Equation 4.1]
𝐶𝑁𝑅 =𝑆0−𝑆𝐵
𝜎𝐵 [Equation 4.2]
The data analysis software also calculated the MTF from the PSF determined from
small metallic balls for evaluation of image resolution. The balls were 1.0, 0.7 and 0.5
mm in diameter, i.e. smaller than the size of a pixel. The software also assessed
distance accuracy and geometry by measuring the sizes of certain inserts.
In planar imaging, circular geometry will be assessed with a 20 mm diameter and 3
mm thick plastic insert, made from PMMA, nylon or Teflon, Figure 4.3 (6). The data
analysis program will measure the diameter of the imaged circle and compare it to the
known diameter.
Images were visually inspected for the presence of artefacts, like streaks, dark or light
bands, rings, ghost images, blurring due to motion, lag or residual images from a
previous exposure, white specks indicating dead pixels in a digital system and
graininess due to quantum mottle.
CT slice width uses a bone equivalent plastic or metal ramp, 20 mm in length, 10 mm
wide and 3 mm thick, shown as (4) in Figure 4.3, placed in the phantom at a known
angle of 38o. The slice thickness will be calculated by the data analysis software using
the image of the ramp, the known parameters and trigonometry.
Mammography micro-calcifications were simulated with specks of metal, aluminum
oxide, calcium carbonate, tungsten or silicon, included at position (5) in Figure 4.3.
Suggested diameters ranged between 0.2 and 0.5 mm. Fibrous breast structures
were simulated with rubber bands (1) (density of 1.26 gcm-3) (as calculated in
Appendix C) or plastic strings, 10 mm in length and between 0.4 and 1.5 mm in
Chapter 4 – Design and development of the universal image quality assurance phantom
Stellenbosch University https://scholar.sun.ac.za

80
diameter, for example 0.4, 0.6, 0.9, 1.2 and 1.5 mm. Visual inspection was used to
determine the smallest inserts visible.
For AEC the image quality as discussed above will be re-evaluated using 40 mm of
additional clear attenuator plates, made from the same plastic as the phantom housing
material.
3-D printing with different materials was investigated. The results from HIPS and PLA
are shown in Figure 4.4. Due to the poor printing resolution these plastics could not
be used. The low contrast detectability inserts were accurately 3-D printed from
perspex (density of 1.18 gcm-3) and hence high density polyethylene (HDPE) (density
of 0.95 gcm-3) was selected as phantom housing material for the prototype.
Figure 4.4: 3-D printed PLA (green) and Hips
(white) cubes.
4.2 First prototype of the universal phantom
The initial concept was developed and refined into the first working prototype of the
universal phantom. The prototype is described in the following sections.
4.2.1 Prototype inserts and materials
The first prototype for the universal image quality assurance phantom is shown
diagrammatically in Figure 4.5.
Chapter 4 – Design and development of the universal image quality assurance phantom
Stellenbosch University https://scholar.sun.ac.za

81
Figure 4.5: Working drawings of the phantom prototype housing. a.) First half of the
housing. b.) Mirrored second half of the housing. (created by Gebrateq Advanced
Engineering)
The materials and dimensions used in the prototype are indicated in Figure 4.6 with
the corresponding densities in Table 4.4. The mammography fibres were made from
rubber gasket o-rings that were used in watch manufacturing. The micro-calcifications
were small cut offs from wires with the required diameters. The metallic balls used for
MTF calculation were the balls from ball point pens.
6
a.) b.)
1
2
3
4
5
6
7
8
9
2
3
5
9
Key: 1 Fibres. 2 Sensitometry inserts. 3 Contrast resolution inserts. 4 Ramp. 5 Central bead. 6
Plate. 7 Micro-calcifications. 8 MTF beads. 9 Distance accuracy holes.
Chapter 4 – Design and development of the universal image quality assurance phantom
Stellenbosch University https://scholar.sun.ac.za

82
Figure 4.6: Prototype insert materials and layout. (created by Gebrateq Advanced
Engineering)
3-D printed PMMA
20x20x20 mm3
3-D printed PMMA
10x10x10 mm3
3-D printed PMMA
8x8x8 mm3
3-D printed PMMA
6x6x6 mm3
3-D printed PMMA
4x4x4 mm3
3-D printed PMMA
3x3x3 mm3
3-D printed PMMA
2x2x2 mm3
Teflon
20x20x20 mm3
Gammex SB3 bone
20x20x20 mm3
Supawood
20x20x20 mm3
Gammex LN300 lung
20x20x20 mm3
Air
20x20x20 mm3
Housing HDPE
190 mm diameter, 20 mm thickness
Gammex SB3 bone
20x10x3 mm
Metallic bead
2.27 mm diameter
Metallic beads
1.0; 0.7; 0.5 mm diameter
Metallic specks
0.2; 0.3; 0.4; 0.5 mm diameter
Rubber bands
0.4; 0.6; 0.9; 1.2; 1.5 mm diameter
PMMA
20x20 mm cylinder
Chapter 4 – Design and development of the universal image quality assurance phantom
Stellenbosch University https://scholar.sun.ac.za

83
Table 4.4: Prototype insert materials.
Insert Material Density (gcm-3)
Housing High density polyethylene (HDPE) 0.95 75
Sensitometry Polymethyl methacrylate (PMMA) 1.18 74
Contrast resolution Teflon 2.20 74
Gammex SB3 bone 1.82 77
Supawood 0.74 *
Gammex LN300 lung 0.30 77
Air 0.00
Fibres Rubber 1.26 *
Slice thickness ramp Gammex SB3 bone 1.82 77
Circular geometry cylinder Polymethyl methacrylate (PMMA) 1.18 74
Micro-calcifications Metal Not known
MTF beads Metal Not known
* As calculated in Appendix C
4.2.2 Prototype machining and manufacturing
The machining of the two halves of the phantom housing is illustrated in Figure 4.7.
a.) b.) c.)
d.) e.) f.)
g.) h.)
j.) k.)
Chapter 4 – Design and development of the universal image quality assurance phantom
Stellenbosch University https://scholar.sun.ac.za

84
Figure 4.7: Machining of the phantom housing. a.) The cutter is kept cool
using high pressure air. b-d.) The voids are machined in the bottom half
of the phantom housing. e.) The bottom half of the phantom housing. f-
j.) The circular housing was cut from the square HDPE slab. k.) The
finished bottom half of the phantom housing. l-m.) Close-up views of the
machined voids. n.) Machining the top half of the phantom housing. o.)
The finished phantom housing top half.
The prototype housing was constructed from solid slabs of HDPE material. Voids were
machined into these slabs at the required depths, with the required dimensions. The
machining procedure was programmed using SolidWorks 2015 Premium CAD
software. Machining was done on a Multicam 3000 series router machine. This was
done with assistance from Johan Braasch of Gebrateq Advanced Engineering. The
top half of the prototype was a mirror image of the bottom half, excluding the voids for
fibres and micro-calcification simulation, the MTF balls and the slice thickness ramp.
During construction of the prototype it was found difficult to accurately machine a 20
cm diameter phantom housing disk from a 200x200x20 mm3 HDPE slab. It was
decided to use 220x220x20 mm3 slabs for manufacturing of the final phantom, unless
the overall size of the phantom could be reduced. HDPE was also a very soft material,
and thus the machining was not completely perfect. Although a logic concept, thought
g.) h.) i.)
j.) k.) l.)
m.
)
n.) o.)
Chapter 4 – Design and development of the universal image quality assurance phantom
Stellenbosch University https://scholar.sun.ac.za

85
was not given to fitting size to size before prototype manufacturing. The 3-D printed
inserts were measured to be accurate with ± 0.5 mm. All the inserts thus did not fit
into exact size voids cut in the housing, e.g. 20.05 mm did not fit into 20.0 mm. The
programming for the machining of the voids in the housing was adjusted to be cut 0.1
mm larger with a 2 mm cutter. However, when the 10 mm and 8 mm cubes were fitted
it was found that +0.1 mm was too big for the smaller inserts. The programming was
adjusted again to +0.05 mm for the remainder of the voids smaller than 20 mm in the
bottom half and for the entire top half. However, when the 6 mm cube was fitted at
+0.05 mm it was a loose fit. It was decided to adjust the programming to +0.1 mm for
all 20x20x20 mm3, 10x10x10 mm3 and 8x8x8 mm3 cubes and to leave it at size-to-
size for all the smaller inserts.
The central ball was measured with a vernier calliper to be 2.27 mm in diameter and
the programming for machining the hole for the ball in the housing halves was adjusted
for this, i.e. 2.36 mm diameter hole. For micro-calcification simulation, the design was
adapted to have 3 small voids per metallic speck size to allow a speck to be placed in
every hole, instead of three specks per hole which would be difficult to place
accurately. Once all the voids were machined the circular housing had to be cut from
the square block, as in Figure 4.7 f-j.). For this the circular housing was held down in
a secure manner to prevent movement during machining, which would lead to a non-
circular finish. Two drill holes, 4 mm in diameter, were added at 60 mm from the
central bead to screw the HDPE plate into position.
The rate of machining was very important. Cutting too fast or too deep would damage
the cutter and cutting too slow would melt the plastic. Machining was therefore done
in a layer by layer manner, as shown in Figure 4.7 f). It was also important to keep
the cutter cool with high pressure air during machining, as shown in Figure 4.7 a).
The different inserts were then fitted in the phantom housing bottom half as shown in
Figure 4.8. Cartel super glue was used to secure the inserts in place.
Chapter 4 – Design and development of the universal image quality assurance phantom
Stellenbosch University https://scholar.sun.ac.za
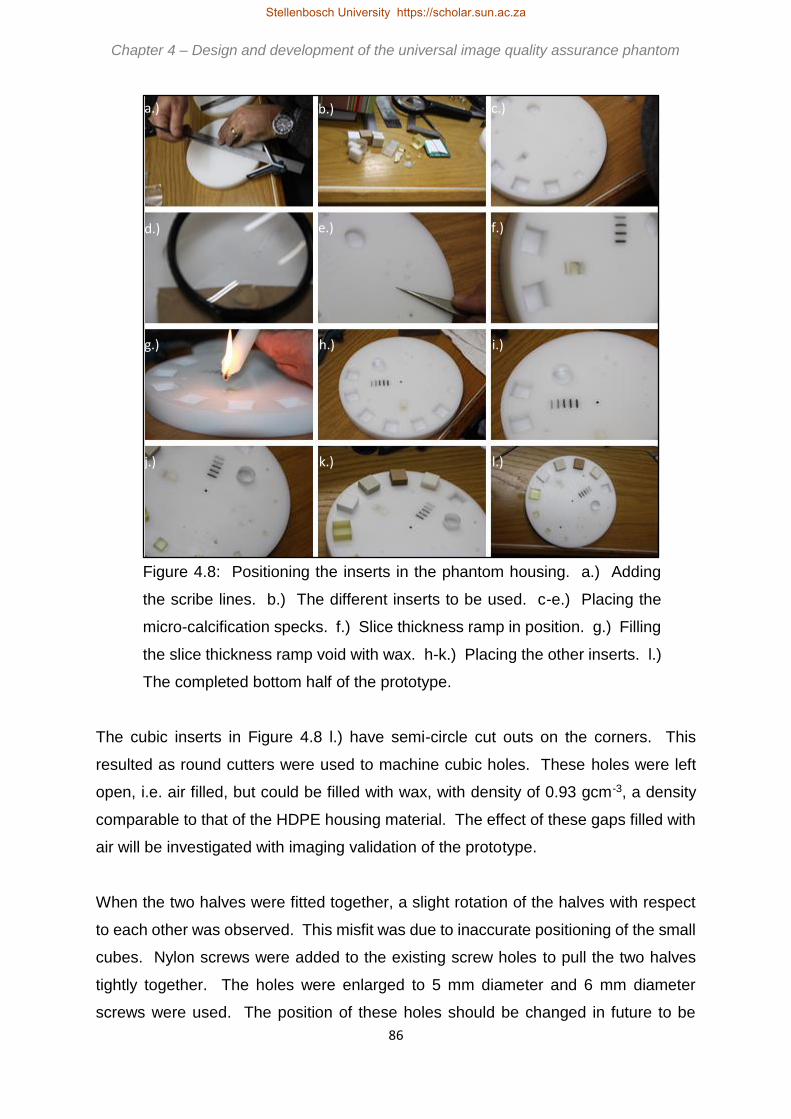
86
Figure 4.8: Positioning the inserts in the phantom housing. a.) Adding
the scribe lines. b.) The different inserts to be used. c-e.) Placing the
micro-calcification specks. f.) Slice thickness ramp in position. g.) Filling
the slice thickness ramp void with wax. h-k.) Placing the other inserts. l.)
The completed bottom half of the prototype.
The cubic inserts in Figure 4.8 l.) have semi-circle cut outs on the corners. This
resulted as round cutters were used to machine cubic holes. These holes were left
open, i.e. air filled, but could be filled with wax, with density of 0.93 gcm-3, a density
comparable to that of the HDPE housing material. The effect of these gaps filled with
air will be investigated with imaging validation of the prototype.
When the two halves were fitted together, a slight rotation of the halves with respect
to each other was observed. This misfit was due to inaccurate positioning of the small
cubes. Nylon screws were added to the existing screw holes to pull the two halves
tightly together. The holes were enlarged to 5 mm diameter and 6 mm diameter
screws were used. The position of these holes should be changed in future to be
a.) b.) c.)
d.) e.) f.)
g.) h.) i.)
j.) k.) l.)
Chapter 4 – Design and development of the universal image quality assurance phantom
Stellenbosch University https://scholar.sun.ac.za

87
closer to the small cubic inserts, as the largest misfit effect was seen in that position.
Countersunk screws were also recommended. Future machining should also be done
void-by-void, fitting each insert before progressing to the next void. For small inserts,
the voids should initially be machined marginally smaller than the insert, extending the
size incrementally as needed. Scribe lines were made on the prototype using a centre
finder, as in Figure 4.8 a.). It was recommended that scribe lines should be machined
in future.
The completed first prototype is shown in Figure 4.9. The prototype weighed 1.14 kg.
Figure 4.9: First prototype of the
universal image quality
assurance phantom.
4.2.3 Initial prototype imaging and evaluation
The first prototype, in Figure 4.9 above, was imaged at Winelands Radiology,
Vergelegen Medi Clinic, Somerset West, South Africa. Figure 4.10 shows the
obtained images.
Chapter 4 – Design and development of the universal image quality assurance phantom
Stellenbosch University https://scholar.sun.ac.za

88
Figure 4.10: First images of the first universal image
quality assurance phantom prototype. a.) CT scan. b.)
General x-ray. c.) Fluoroscopic image. d.)
Mammogram.
The parameters used for obtaining the images in Figure 4.10 are tabulated in Table
4.5.
a.) b.)
c.) d.)
Chapter 4 – Design and development of the universal image quality assurance phantom
Stellenbosch University https://scholar.sun.ac.za

89
Table 4.5: First prototype imaging parameters.
Modality Unit kV mAs Additional
CT scan Siemens
Somatom
Definition Edge
scanner
120 kV 298 mAs 5 mm slices, 235 cm
FOV, J30s median
smooth filter and
pitch of 0.8
General x-ray Siemens Ysio
DR unit
40 kVp 2 mAs 100 cm SID, large
focus outside of
bucky
Fluoroscopy
image
Siemens Axiom
Luminos DRF
unit
62.5 kV 10.2 mA
and 0.01 ms
Mammogram Siemens
Mammomat
Inspiration unit
28 kV 62.1 mAs AEC (the standard
for image quality
assurance in the
department)
From these initial images, future development and changes were recognised. These
were confirmed with validation of the prototype, as discussed in section 4.3 below.
With the CT scan the artefact from the central bead can be lessened if a smaller bead
was used, which would still be acceptable for the other imaging modalities too, as seen
in Figure 4.10 a-d.). A 1 mm diameter bead was proposed. A smaller diameter fibre
group, 0.3 mm diameter, should be added for mammography. A smaller speck group
was also proposed, i.e. cuttings from a 0.1 mm diameter wire. The cuttings should
also be made smaller as to represent specks better. The overall size of the phantom
could be reduced. From Figure 4.10 d.) above it was seen that the peripheral low
contrast resolution or mammography mass cubes could be positioned closer to each
other, hence reducing the diameter of the phantom. This will make the phantom more
manageable, easier to handle, lighter (for transport or courier cost purposes) and
slightly cheaper to manufacture. A 1x1x1 mm3 3-D printed PMMA cube should be
added to the phantom for low contrast detectability in all imaging modalities and as
additional mass for mammography. In all images the effect of the air filled semi-
Chapter 4 – Design and development of the universal image quality assurance phantom
Stellenbosch University https://scholar.sun.ac.za

90
a.)
b.)
circular voids at the corners of the cubic inserts was negligible and hence wax filling
was not necessary.
The orientation of the slice thickness ramp needed further investigation. Slice
thickness can be calculated with Equation 4.3, as explained in Figure 4.11, using
trigonometry.
𝑆𝑙𝑖𝑐𝑒 𝑡ℎ𝑖𝑐𝑘𝑛𝑒𝑠𝑠 =𝑅𝑎𝑚𝑝 𝑚𝑒𝑎𝑠𝑢𝑟𝑒𝑚𝑒𝑛𝑡
tan 𝜃 [Equation 4.3]
Figure 4.11: Slice thickness calculation for a.) a ramp made of a
slab (as in the universal image quality assurance phantom) and
b.) a wire ramp.
Chapter 4 – Design and development of the universal image quality assurance phantom
Stellenbosch University https://scholar.sun.ac.za

91
In the prototype a slice thickness slab, 20x10x3 mm3, was used instead of a wire, with
3 mm the thickness of the slab. It was inserted in the phantom at an angle of 38o. Due
to the finite thickness of the ramp, a correction is needed for the thickness in the
calculation in Equation 4.3 above. This is illustrated in Figure 4.11. For a ramp with
a significantly small thickness, as in Figure 4.11 b.), such a correction is not needed
and the reconstructed image measured can be used directly in the calculation of slice
thickness with good approximation. With the universal image quality assurance
phantom it was found that slice thickness does not have to be calculated, it can be
measured directly from the obtained image, as in Figure 4.12. This was due to two
errors cancelling out, i.e. the tan of 38 degrees and the thickness, 𝐿2, of the ramp.
Ideally the ramp should be constructed of a gold sheet with micro-meter thickness at
an angle of 45o (where tan45 = 1 ). For such an ideal ramp, the reconstructed
displayed image would represent an almost exact measurement of the slice thickness
without any required correction for slab thickness or angle. However, the thickness of
3 mm was a machining limitation. For a thinner slab the manufacturing costs will
increase significantly. As cost reduction was one of the main aims of this study, and
the current slice thickness assessment slab performed its function satisfactory, the
design was not adjusted to include a thinner ramp.
Figure 4.12: Slice thickness is
measured in the red line
direction in the universal image
quality assurance phantom and
prototype.
Chapter 4 – Design and development of the universal image quality assurance phantom
Stellenbosch University https://scholar.sun.ac.za

92
It was necessary to determine what exactly was measured by the slice thickness
parameter in the prototype, i.e. the actual scan slice thickness or the reconstructed
slice thickness. After a scan has been performed, the scanner software allows the
user to reconstruct the actual scan into slices of a thickness selected by the user. This
is referred to as the reconstructed slice thickness. It is therefore possible to
reconstruct a scan performed with 3 mm slices into a data set consisting of 5 mm
slices. Scans were done by scanning in 3 mm and 5 mm slices. The 3 mm scan was
also reconstructed to 5 mm slice thickness. The obtained images were analysed in
ImageJ software. The window width (WW) was set as low as possible and the window
level (WL) was adjusted until the slice thickness ramp just disappeared. This WL value
was recorded as the maximum value. Background was measured in a ROI next to the
ramp and was subtracted from the maximum WL value. The WL value at 50 % of the
background corrected peak value, background was added to the result and the WL
was adjusted to this setting. This method is proposed in the Catphan® manual.78 The
slice thickness was measured in the direction indicated in Figure 4.12, with the
obtained results in Table 4.6.
Table 4.6: Prototype slice thickness measurements.
Scanning slice thickness Reconstructed slice
thickness
Measured slice thickness
3 mm 3 mm 2.997 mm
3 mm 5 mm 5.713 mm
5 mm 5 mm 5.062 mm
It is suggested that the slice thickness measurement will be performed by the semi-
automatic data analysis software.
4.3 Validation of the first prototype of the universal phantom
The prototype was compared to commercially available phantoms that were used for
routine quality assurance in x-ray diagnostic radiology. The phantoms selected for
this comparison are commonly used in diagnostic radiology quality assurance in South
Africa. Included were the NORMI® 13 for general x-rays, NORMI® Rad/Flu for
Chapter 4 – Design and development of the universal image quality assurance phantom
Stellenbosch University https://scholar.sun.ac.za

93
fluoroscopy, NORMI® PAS for mammography and Catphan® 600 for CT scanning.
The phantoms were supplied by Netcare and are shown, with the universal image
quality assurance phantom prototype, in Figure 4.13.
Figure 4.13: The universal image quality assurance
phantom prototype with the commercial phantoms used
for prototype validation.
The aim of this pilot study was to determine if the prototype was acceptable for routine
image quality assurance, i.e. would the phantom be able to measure the image quality
parameters assessed with commercial phantoms, and to derive the changes and
improvements required for construction of the final phantom.
Prototype
Catphan® 600
NORMI® Rad/Flu
NORMI® 13
NORMI® PAS
Chapter 4 – Design and development of the universal image quality assurance phantom
Stellenbosch University https://scholar.sun.ac.za

94
4.3.1 General x-ray imaging validation
For general x-ray imaging, the prototype was compared to the NORMI® 13 phantom.
This phantom was described in Chapter 3 section 3.1.3. Two Philips Bucky Diagnost
units were used with Fujifilm FCR IP Cassette Type CC. Exposures were made with
manual and AEC settings, as in Table 4.7 and the obtained images are shown in
Figure 4.14.
Table 4.7: General x-ray exposure parameters.
Unit Technique kV mAs FFD Focus Figure 4.14
1 Manual 70 40 100 cm Large a.) NORMI
b.) Prototype
AEC 70 8.06 NORMI
0.78 Prototype
100 cm Large c.) NORMI
d.) Prototype
2 Manual 70 40 100 cm Large e.) NORMI
f.) Prototype
AEC 70 6.26 NORMI
0.85 Prototype
100 cm Large g.) NORMI
h.) Prototype
Chapter 4 – Design and development of the universal image quality assurance phantom Chapter 4 – Design and development of the universal image quality assurance phantom
Stellenbosch University https://scholar.sun.ac.za
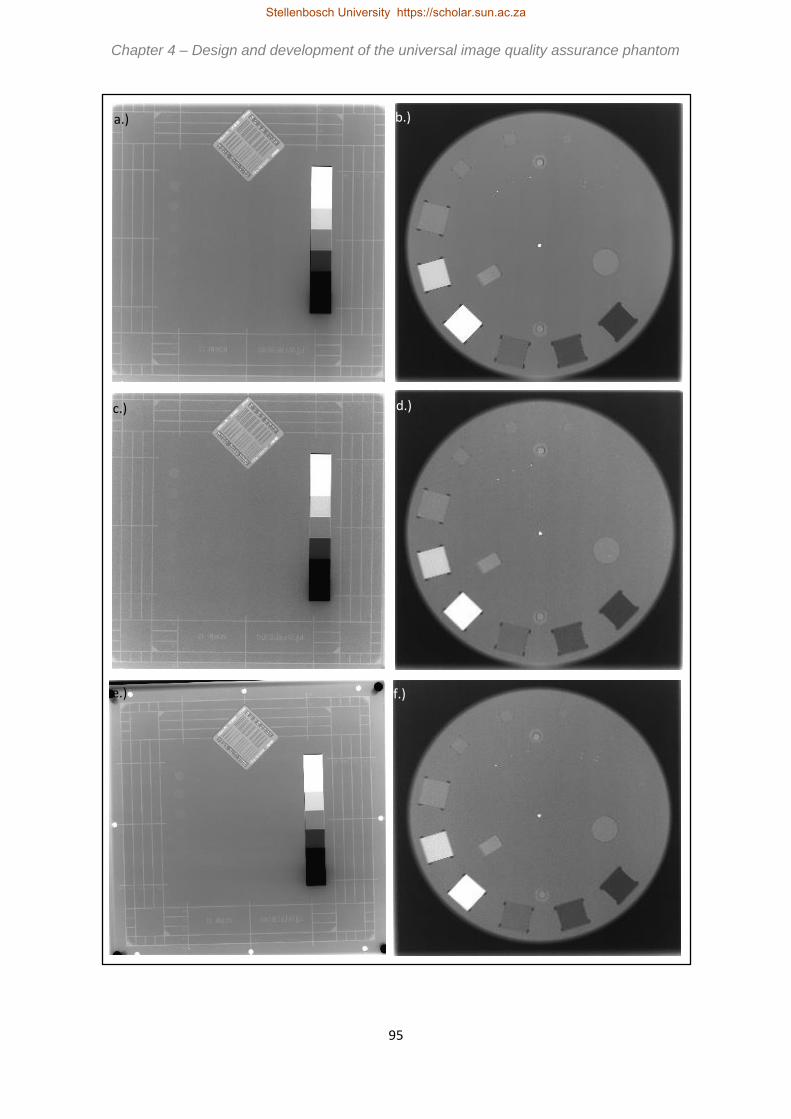
95
b.)
d.) c.)
a.)
e.) f.)
Chapter 4 – Design and development of the universal image quality assurance phantom Chapter 4 – Design and development of the universal image quality assurance phantom
Stellenbosch University https://scholar.sun.ac.za

96
Figure 4.14: Comparison of prototype to NORMI® 13 phantom with general x-ray
imaging parameters as in Table 4.7. a,e.) Manual exposures of NORMI® 13
phantom. b,f.) Manual exposures of prototype. c,g.) AEC exposures of NORMI®
13 phantom. d,h.) AEC exposures of prototype.
The mAs values in Table 4.7 were low for the prototype as the prototype was only 4
cm in thickness and not representative of patient thickness. For this additional 4 cm
attenuation plates will be included. From Figure 4.14 the conclusions in Chapter 4
section 4.2 were confirmed. A smaller 1x1x1 mm3 low contrast detectability insert
should be added in the final design to make the proposed phantom more sensitive.
The central bead should be made smaller, 1 mm diameter, for a neater appearance.
The prototype performed all the required image quality assurance tests verified with
the NORMI® 13 phantom, as seen from Chapter 3 Table 3.1 also. The prototype in
addition measured sensitometry, noise and position and alignment. For general x-ray
imaging the prototype was hence an acceptable solution for comprehensive image
quality assurance.
4.3.2 Fluoroscopy imaging validation
The NORMI® Rad/Flu phantom, as discussed in Chapter 3 section 3.2.3, was used for
comparison in fluoroscopy. A Superix 164 Tecmed 3000 unit was used with an AEC
exposure. The resultant parameters are shown in Table 4.8 and the obtained images
in Figure 4.15.
h.) g.)
Chapter 4 – Design and development of the universal image quality assurance phantom
Stellenbosch University https://scholar.sun.ac.za

97
Table 4.8: Fluoroscopy exposure parameters.
Technique kV mA s Figure 4.15
AEC 74 NORMI
45 Prototype
50
50
2
2
a.) NORMI
b.) Prototype
Figure 4.15: Comparison of prototype to NORMI® Rad/Flu phantom with fluoroscopy
imaging parameters as in Table 4.7. a.) AEC exposure of NORMI® Rad/Flu phantom.
b.) AEC exposure of prototype.
From Figure 4.15 no special additions or changes to the prototype were derived for
fluoroscopic imaging and it was concluded that the prototype was an acceptable
solution for fluoroscopic image quality assurance. The biggest disadvantage of the
NORMI® Rad/Flu phantom was that the insert used for investigation of resolution was
separate and needs to be fitted into the phantom prior to exposure. The prototype
was a ready-assembled phantom, with all inserts included. From Figure 4.15 and
Table 3.2 in Chapter 3 section 3.2.3, it was seen that the prototype assessed at least
the same parameters as the NORMI® Rad/Flu phantom.
a.) b.)
Chapter 4 – Design and development of the universal image quality assurance phantom
Stellenbosch University https://scholar.sun.ac.za

98
4.3.3 Mammography imaging validation
The universal image quality assurance phantom prototype was compared to the
NORMI® PAS phantom in mammography. The images were acquired with a Siemens
Mammomat Inspiration unit with exposure technique factors as in Table 4.9. Figure
4.16 shows the obtained images.
Table 4.9: Mammography exposure parameters.
Technique kV mAs Target/Filter Focus Figure 4.16
AEC 28 131.1 NORMI
19.3 Prototype
Mo/Rh Large a.) NORMI
b.) Prototype
Manual 28 62.9 NORMI
63.1 Prototype
Mo/Rh Large c.) NORMI
d.) Prototype
The NORMI® PAS phantom is described in Chapter 3 section 3.3.3. The disadvantage
of the NORMI® PAS phantom was that different test elements had to be fitted into the
structure plate cut out and several exposures were needed for comprehensive image
quality assurance. All the inserts of the prototype were contained in the phantom and
only one exposure was needed for overall image quality analysis. Although the
universal image quality assurance phantom prototype assessed all the parameters
measured with the NORMI® PAS phantom, as well as image uniformity and geometry
and measurement tools (as in Chapter 3 Table 3.3), certain improvements were
derived for final phantom design, as commented in section 4.2.
Suggested improvements included addressing the geometric distortion seen in Figure
4.16. Geometric distortion resulted from the depth dimension of the inserts. This could
be addressed by orientating the phantom such that the larger inserts were more
perpendicular to the x-ray beam, i.e. at the chest wall side. Proper scribe lines,
orientation markers and detailed explanation in the user’s manual (Appendix A) would
achieve this set-up. The depth dimension of the 20x20x20 mm3 inserts could be
changed to 10 mm, reducing the geometric distortion artefact. For the fibres, scribe
lines were made with a 1 mm diameter cutter. This resulted in air trapped around the
rubber bands. With construction of the final phantom wax, with density of 0.93 g/cm3,
will be used to fill the air gaps. A smaller diameter rubber band, 0.3 mm, will also be
Chapter 4 – Design and development of the universal image quality assurance phantom Chapter 4 – Design and development of the universal image quality assurance phantom
Stellenbosch University https://scholar.sun.ac.za

99
added. The specks of the different speck groups will be cut more accurately and a
smaller group, made from 0.1 mm diameter wire, will also be added. As previously
recommended, a 1x1x1 mm3 low contrast detectability and mammography mass cube
should be added. In Table 4.9 the mAs for AEC exposure of the prototype was again
low comparted to the NORMI® PAS phantom, as explained in section 4.3.1 due to the
prototype not being patient thickness representative. Additional attenuator plates will
address this.
Chapter 4 – Design and development of the universal image quality assurance phantom
Stellenbosch University https://scholar.sun.ac.za

100
Figure 4.16: Comparison of prototype to NORMI® PAS phantom with mammography
imaging parameters as in Table 4.8. a.) AEC and c.) manual exposure of the NORMI®
PAS phantom. b.) AEC and d.) manual exposure of the prototype. (created by author)
a.) b.)
c.) d.)
Chapter 4 – Design and development of the universal image quality assurance phantom
Stellenbosch University https://scholar.sun.ac.za

101
4.3.4 Computed tomography scanning validation
For CT scanning the universal phantom prototype was compared to the Catphan® 600
phantom. This phantom was described in Chapter 3 section 3.4.3. Scan parameters
as in Table 4.10 were used to obtain CT scan study sets of the Catphan® 600 and
prototype phantoms, with selected slices included in Figure 4.17. A Toshiba Aquillion
1 helical CT scanner was used.
Table 4.10: CT scanning exposure parameters.
kV mA s FOV Pitch Slice thickness Filter Figure 4.17
120 300 13.0 Catphan
4.5 Prototype
240 3 5 mm FC30/ORG a-e.) Catphan
f.) Prototype
c.) d.)
a.) b.)
Chapter 4 – Design and development of the universal image quality assurance phantom
Stellenbosch University https://scholar.sun.ac.za

102
Figure 4.17: Comparison of prototype to Catphan® 600 phantom with CT
scanning parameters as in Table 4.9. a.) Bead for MTF calculation. b.)
Low contrast supra- and sub-slice inserts. c.) Uniformity module. d.) Slice
thickness ramps, sensitometry, distance accuracy and patient alignment
check slice. e.) Resolution module. f.) Single slice of prototype with all
required inserts.
From Table 3.5 in Chapter 3 section 3.4.3 and from Figure 4.17 it was clear that the
Catphan® 600 phantom and the universal image quality assurance phantom prototype
could measure all the parameters required for CT image QC. The universal phantom
has multi-modality applicability, i.e. not limited to CT scanning only as Catphan® 600
is. In addition, all of the required parameters can be evaluated from a single slice of
the universal image quality assurance phantom, where several slices have to be
considered for Catphan® 600 as seen from Figure 4.17.
From Figure 4.17 it was concluded that the central bead’s diameter should be
decreased to reduce streaking metal artefacts. This was in accordance with the
recommendations for the planar imaging modalities. As with general x-ray imaging
and mammography, also for CT scanning a smaller 1x1x1 mm3 low contrast resolution
insert should be included.
Consideration was now given to the stand for upright CT set-up. It was decided that
the easiest, smallest and cheapest solution would be the first design of the initial
concept, i.e. making a flat side on the phantom. A plate of HDPE material, 10 mm
e.) f.)
Chapter 4 – Design and development of the universal image quality assurance phantom
Stellenbosch University https://scholar.sun.ac.za

103
thick, 500 mm in length and 50 mm wide, will be supplied as stand, to be fitted across
the CT couch, with the phantom placed flat side down on the plate. This is shown in
Figure 4.18.
Figure 4.18: CT scanning set-up
plate.
Having a flat side on the phantom makes orientation for set-up for CT scanning and
for mammography easier, as the flat side is positioned on the chest wall side.
The recommendations derived from Figures 4.14 to 4.17 were implemented in the
design of the final universal image quality assurance phantom, as described in section
4.4.
4.4 Final phantom
A descriptive user’s manual will be supplied with the phantom, as included in Appendix
A. The manual explains in detail how to set up and use the universal phantom for
setting baseline values and for routine image quality control. It explains comparing
the routine results to the baseline values for the same phantom, states accepted
tolerance values and describes the use of the data analysis software.
The user will be required to position and image the phantom, as explained in detail
with illustrations and examples in the user’s manual, to enable the user to evaluate all
images visually and to load images into the data analysis software. The data analysis
software will use ROI analysis to measure the mean and standard deviation values for
sensitometry, SNR, CNR and uniformity calculations. It will also measure known
distances for geometry and scaling evaluation and display the loaded image for the
Set-up slab
Phantom
Chapter 4 – Design and development of the universal image quality assurance phantom
Stellenbosch University https://scholar.sun.ac.za

104
visual image quality analysis tests, e.g. low contrast detectability. If tests fail, the user
should perform further tests or call in a technician or medical physicist, as described
in the user’s manual. The functioning of the data analysis software is described in
Chapter 5 and Appendix B. The user will also have to record these results, as
explained in the manual.
The user’s manual and data analysis software is used with the final universal image
quality assurance phantom for comprehensive routine diagnostic radiology x-ray
image quality control. The phantom composition and assembly is described in this
section.
4.4.1 Phantom inserts and materials
The changes as derived in section 4.3 were used to improve the design of the
phantom. A 1x1x1 mm3 low contrast resolution cube was suggested from the findings
of section 4.3. Accurate 3-D printing at such small scale was only available from the
Department of Mechanical and Mechatronic Engineering at Stellenbosch University,
using a Stratasys Objet 30 Scholar micro-medical printer and RGD 240 photopolymer
material. The low contrast resolution inserts were reprinted and the density of the
material was calculated as in Appendix C. Although a 1 mm diameter central bead
was suggested, it was not possible to accurately position such a small bead exactly
centrally in the phantom in three dimensions. A 2 mm diameter bead was therefore
used. The geometrical distortion from the 20 mm thick inserts (sensitometry blocks
and circular geometry cylinder) seen in mammography imaging, as in section 4.3.3,
was addressed by decreasing the thickness dimension to 10 mm. Also from this
section, wax filling of the mammography fiber scribe lines, the addition of a 0.3 mm
diameter rubber band as thinnest mammography fiber simulator and adding a 0.1 mm
diameter mammography micro-calcification speck group was done in the phantom.
Scribe lines were accurately machined onto the phantom top surface and sides and a
flat phantom surface was introduced for upright set-up on a CT scanning stand, as in
Figure 4.18 above. The materials of the inserts for the phantom are shown in Figure
4.19 and Table 4.11.
Chapter 4 – Design and development of the universal image quality assurance phantom
Stellenbosch University https://scholar.sun.ac.za

105
Figure 4.19: Universal phantom insert materials and dimensions. (created by
Gebrateq Advanced Engineering)
Chapter 4 – Design and development of the universal image quality assurance phantom
Stellenbosch University https://scholar.sun.ac.za

106
Table 4.11: Prototype insert materials.
Insert Material Density (gcm-3)
Housing High density polyethylene (HDPE) 0.95 75
Sensitometry Objet RGD240 1.17 *
Contrast resolution Teflon 2.20 74
Gammex SB3 bone 1.82 77
Supawood 0.74 *
Gammex LN300 lung 0.30 77
Air 0.00
Fibres Rubber 1.26 *
Slice thickness ramp Gammex SB3 bone 1.82 77
Circular geometry cylinder Polymethyl methacrylate (PMMA) 1.18 74
Micro-calcifications Metal Not known
MTF beads Metal Not known
* As calculated in Appendix C
4.4.2 Phantom machining and manufacturing
The inserts and phantom housing was machined from the plastics in Table 4.11. A
similar process to that described in section 4.2.2 was followed. It is illustrated in Figure
4.20.
Chapter 4 – Design and development of the universal image quality assurance phantom
Stellenbosch University https://scholar.sun.ac.za

107
Figure 4.20: Making the universal phantom. a.) Cutter is kept cool with high
pressure air. b.) Voids are machined in HDPE slab. c.) Phantom housing is cut
from the slab once all voids are machined. d.) The process is repeated for the
top half. e.) Completed top and bottom half phantom housings. f.) Using a jig,
the top half is turned over to machine scribe lines. g.) Scribe lines on phantom
side and top half. h.) Wax is used to fill the ramp void. i.) Rubber fibers are
placed. j.) Micro-calcification specks are placed. k.) MTF balls are placed. l.)
The small inserts, i.e. 1x1x1 mm3 low contrast detectability cube, micro-
calcifications and MTF balls.
The machining procedure was programmed using SolidWorks 2015 Premium CAD
software. Machining was done on a Multicam 3000 series router machine. This was
done with assistance from Johan Braasch of Gebrateq Advanced Engineering.
Machining was done on a layer-by-layer manner, cutting voids from a slab of HDPE
housing material. One void was machined at a time, its insert was fitted and only if
a.) b.) c.)
d.) e.) f.)
g.) h.) i.)
j.) k.) l.)
Chapter 4 – Design and development of the universal image quality assurance phantom
Stellenbosch University https://scholar.sun.ac.za

108
the fit was correct was the next void cut. The 20 mm voids were machined with a 3
mm diameter cutter at 0.1 mm bigger than the insert, i.e. 20.1 mm voids were cut. For
the 4, 6, 8 and 10 mm voids a 1.5 mm diameter cutter was used at 0.1 mm bigger and
for 1, 2 and 3 mm voids a 1 mm diameter cutter was used with size-to-size machining.
In the prototype the small voids were slightly large. By machining the small voids size-
to-size compared to the actual insert, a tighter fit was achieved in the phantom.
In the bottom half, the mammography fiber slots were cut with a 1 mm diameter cutter
at 1 mm depth for the 0.3, 0.4 and 0.6 mm diameter rubbers and 2 mm diameter cutter
and 2 mm depth for the 0.9, 1.3 and 1.5 mm diameter rubbers. The voids were filled
with wax once the rubbers were fitted. The central bead was a 2 mm diameter ball
bearing and a 2 mm diameter cutter was used to machine a 2 mm diameter and 1 mm
deep void. For the MTF balls and micro-calcification speck groups, a 1 mm diameter
cutter was used to make 1 mm deep and 2 mm diameter holes. The inserts were
secured in place with Cartel super glue. The completed bottom half is shown in Figure
4.21.
The top half was fitted over the bottom half containing the inserts and he nylon screws
were put in to keep the two halves together. The completed phantom is included in
Figure 4.22.
Chapter 4 – Design and development of the universal image quality assurance phantom
Stellenbosch University https://scholar.sun.ac.za

109
Figure 4.21: The completed phantom bottom half with
inserts in place.
Figure 4.22: The universal image quality
assurance phantom.
Chapter 4 – Design and development of the universal image quality assurance phantom
Stellenbosch University https://scholar.sun.ac.za

110
The phantom weighs 0.87 kg and is substantially smaller than the prototype, as shown
in Figure 4.23.
Figure 4.23: Comparison of the prototype phantom and final phantom with
the prototype below the final phantom in the images.
This method of phantom manufacturing is crude and introduces some inaccuracies in
insert locations and sizes. This is the main identified draw back of the universal image
quality assurance phantom. Improvement in phantom manufacturing accuracy would
greatly improve accuracy of the obtained results and is necessary when several
phantoms will be produced, i.e. all phantoms should be nearly identical.
4.4.3 Initial phantom imaging and evaluation
The phantom was imaged at Winelands Radiology, Vergelegen Medi Clinic, in
Somerset West with imaging parameters as tabulated in Table 4.12 and the obtained
images shown in Figure 4.24.
Chapter 4 – Design and development of the universal image quality assurance phantom
Stellenbosch University https://scholar.sun.ac.za

111
Table 4.12: Phantom imaging parameters.
Modality Unit kV mAs Additional
General x-ray Siemens Ysio
DR unit
40 kV 2 mAs 100 cm FFD, large
focus, outside of
bucky
Fluoroscopy
image
Siemens Axiom
Luminos DRF
unit
50 kV 2.5 mAs 115 cm FFD, outside
of bucky
Mammogram Siemens
Mammomat
Inspiration unit
28 kV 105.4 mAs AEC (the standard
for image quality
assurance in the
department)
CT scan Siemens
Somatom
Definition Edge
scanner
120 kV 278 mAs 3 mm slices, pitch of
0.8
Chapter 4 – Design and development of the universal image quality assurance phantom
Stellenbosch University https://scholar.sun.ac.za

112
Figure 4.24: Initial images of the universal image quality assurance phantom. a.)
General x-ray. b.) Fluoroscopy image. c.) Mammogram. d.) CT scan slice.
Considering the phantom in Figure 4.24, and comparing it to the images of the
prototype in Figure 4.10 in section 4.2.3, the improvements in the phantom are clear.
The recommendations as derived in section 4.3 were all incorporated and the resultant
phantom is a comprehensive diagnostic radiology x-ray image quality assurance tool.
The phantom, user’s manual and data analysis software must be validated individually,
and as a complete package, and this is discussed in Chapters 5 and 6.
a.) b.)
c.) d.)
Chapter 4 – Design and development of the universal image quality assurance phantom Chapter 4 – Design and development of the universal image quality assurance phantom Chapter 4 – Design and development of the universal image quality assurance phantom Chapter 4 – Design and development of the universal image quality assurance phantom
Stellenbosch University https://scholar.sun.ac.za

113
Chapter 5
The universal phantom as image quality assurance solution
In this chapter, the routine image quality control parameters that can be
assessed with the universal phantom are described. The inserts in the universal
image quality assurance phantom are used with the data analysis software for
comprehensive routine image quality control in general x-rays, fluoroscopy,
mammography and CT scanning, i.e. the phantom is not modality specific. A complete
user’s manual and description of the data analysis software is included as Appendices
A and B, however a summary of these are given in conclusion to this chapter. The
universal image quality assurance phantom is intended to simplify routine x-ray image
quality control, making it available in resource limited institutions at reduced cost, as
an additional image QC tool for diagnostic radiology.
5.1 Image quality assurance using the universal phantom
The universal phantom and accompanying data analysis software can be used for
commissioning, i.e. setting baseline values, and routine image QC, as required in
diagnostic radiology x-ray equipment licence conditions. Refer to Table 2.1 in Chapter
2 for the image quality control tests required by the Directorate Radiation Control of
the South African DoH.
5.1.1 Image quality tests applicable to general x-rays, fluoroscopy,
mammography and CT scanning
The universal image quality assurance phantom assesses the following image quality
parameters for all projection radiography modalities as well as for CT scanning. The
stated limits are derived from the DoH recommendations, as described in Chapter 2.
Stellenbosch University https://scholar.sun.ac.za

114
1.) Sensitometry, grey scale linearity or CT number reproducibility
Using the 20x20x10 mm3 cubic inserts including air, Gammex LN300 Lung tissue
equivalent plastic, Supawood, Gammex SB3 Bone equivalent plastic, Teflon and
RGD240, a ROI is drawn in each cube. The ROI is approximately half the diameter of
the insert and must not be close to or extend beyond the cube edge. The mean value
and standard deviation in each ROI are displayed and recorded. The locations of
these ROIs are illustrated in red in Figure 5.1. The quantitative value obtained in
routine quality control is compared to the baseline value for each insert. The accepted
limit is baseline grey scale value ± 0.2 for projection radiography and ± 10 HU for CT
scanning.
Figure 5.1: ROI location for sensitometry assessment, indicated in red.
2.) Low contrast detectability
RGD 240 cubes of 20, 10, 8, 6, 4, 3, 2 and 1 mm3, as in Figure 5.2, are visually
inspected, i.e. subjective analysis, by the observer to determine the smallest cube that
is visible. The size of this cube is recorded. This must remain reproducible over time.
Chapter 5 – The universal phantom as image quality assurance solution
Stellenbosch University https://scholar.sun.ac.za

115
.
Figure 5.2: ROI location for low contrast detectability assessment. Cubes are pointed
out in red.
3.) Image uniformity
The data analysis software quantitatively calculates uniformity using ROIs of similar
size at four different locations in the HDPE phantom housing area. The ROIs are
drawn as shown in red in Figure 5.3. The obtained value is compared to the set
baseline value. A tolerance of baseline ± 5 % for DR and ± 10 % for CR, film-screen
and CT scanning is accepted.
4.) Resolution
The data analysis software quantitatively calculates the MTF from a PSF produced
from different sized metallic balls, using a ball with diameter smaller than a pixel size.
From the graph the software also reports the limiting spatial resolution as the
frequency (cycles/mm) at which the MTF has 10 % value. The tolerance used is
baseline - 25 %. Figure 5.4 shows the location of the metallic balls in red.
Chapter 5 – The universal phantom as image quality assurance solution
Stellenbosch University https://scholar.sun.ac.za

116
Figure 5.3: ROI location illustrated in red used for uniformity assessment.
Figure 5.4: Metallic ball location for resolution MTF assessment, as shown in red.
5.) Noise
Image noise is quantitatively calculated by the data analysis software using ROI
analyses and Equations 5.1 and 5.2. The location of the ROIs is shown in red in Figure
5.5. The noise is expressed as the SNR and CNR. A tolerance of baseline value ±
10 % is used.
𝑆𝑁𝑅 =𝑚𝑒𝑎𝑛
𝑠𝑡𝑎𝑛𝑑𝑎𝑟𝑑 𝑑𝑒𝑣𝑖𝑎𝑡𝑖𝑜𝑛 [Equation 5.1]
Chapter 5 – The universal phantom as image quality assurance solution Chapter 5 – The universal phantom as image quality assurance solution Chapter 5 – The universal phantom as image quality assurance solution
Stellenbosch University https://scholar.sun.ac.za

117
𝐶𝑁𝑅 =𝑚𝑒𝑎𝑛(𝑎)−𝑚𝑒𝑎𝑛(𝑏)
𝑠𝑡𝑎𝑛𝑑𝑎𝑟𝑑 𝑑𝑒𝑣𝑖𝑎𝑡𝑖𝑜𝑛(𝑏) [Equation 5.2]
Figure 5.5: ROI location, in red, for SNR and CNR assessment as in Equations 5.1
and 5.2.
6.) Positioning and alignment
This refers to zero slice position or scan plane localisation for CT scanning and x-ray
to light beam centring for planar imaging. Scribe lines on the phantom surface are
used to position the phantom on the bed for imaging using the displayed cross wires
or lasers. If set-up correctly, the centrally placed metallic ball will appear in the middle
of the image or on the CT slice that was given the 0-coordinate position. The user
evaluates the obtained image, thus subjective analysis, which was acquired with
collimation to just enclose the entire phantom. Deviations, for example in Figure 5.6,
are noted as results. The accepted tolerance is ± 2 % of source-to-image distance
(SID) for planar imaging and 2 mm for CT scanning.
Chapter 5 – The universal phantom as image quality assurance solution
a b
a b
Stellenbosch University https://scholar.sun.ac.za
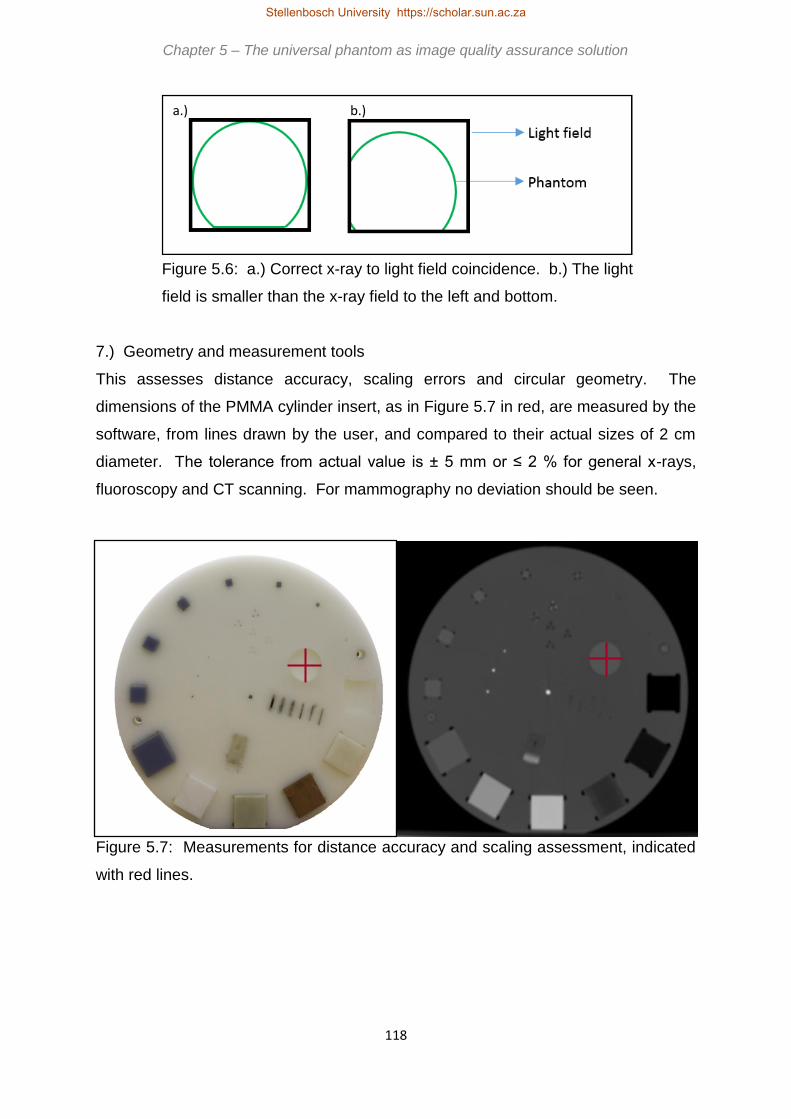
118
Figure 5.6: a.) Correct x-ray to light field coincidence. b.) The light
field is smaller than the x-ray field to the left and bottom.
7.) Geometry and measurement tools
This assesses distance accuracy, scaling errors and circular geometry. The
dimensions of the PMMA cylinder insert, as in Figure 5.7 in red, are measured by the
software, from lines drawn by the user, and compared to their actual sizes of 2 cm
diameter. The tolerance from actual value is ± 5 mm or ≤ 2 % for general x-rays,
fluoroscopy and CT scanning. For mammography no deviation should be seen.
Figure 5.7: Measurements for distance accuracy and scaling assessment, indicated
with red lines.
a.) b.)
Chapter 5 – The universal phantom as image quality assurance solution
Stellenbosch University https://scholar.sun.ac.za

119
8.) Artefacts
In this subjective analysis, the image is visually inspected by the user for the presence
of artefacts under normally used clinical WW and WL settings. The image should be
free of dots, lines, streaks, ghost images or any other disturbance.
9.) Image quality visual inspection
The obtained images are visually inspected by the user at clinically used WW and WL
settings, noting the inserts seen, any artefacts and any changes from the previously
obtained or baseline images. An overall impression of the image is recorded as result
and this should remain reproducible over time. The results from this test are therefore
subjective.
10.) Standard signal
The data analysis software quantitatively measures the mean and standard deviation
in a ROI, consistently positioned in the HDPE housing of the phantom. This is shown
in Figure 5.8 with a red circle. This value should remain constant over time, compared
to the baseline value, with a tolerance of ± 0.2 for planar imaging or ± 10 HU for CT
scanning.
Figure 5.8: ROI location for standard signal assessment, as shown in red.
Chapter 5 – The universal phantom as image quality assurance solution
Stellenbosch University https://scholar.sun.ac.za

120
5.1.2 Automatic exposure control image quality tests applicable to general x-
rays, fluoroscopy and mammography
These tests are performed in addition to those discussed in section 5.1 for general x-
rays, fluoroscopy and mammography. They are designed to assess the effectiveness
of AEC to produce acceptable image quality.
1.) AEC performance
The image quality should be maintained at an acceptable level for different
thicknesses of phantom. AEC exposures should compensate for phantom thickness.
The user makes an AEC exposure with no additional attenuator HDPE, i.e. 0 cm, and
then also with 2 cm and 4 cm additional HDPE added on top of the phantom and
repeats the tests in sections 5.1.1 and 5.1.3. The obtained results will be quantitative
and subjective, as mentioned in sections 5.1.1 and 5.1.3.
2.) AEC repeatability
Image quality should remain constant with repeat exposures of the same phantom
thickness using AEC. The user makes three AEC exposures with the same phantom
thickness and compares the quantitative and subjective results of the tests in sections
5.1.1 and 5.1.3. Image quality should vary within 5 %.
5.1.3 Image quality tests applicable to mammography
In addition to the tests described in sections 5.1 and 5.2, there are three additional
parameters to be assessed in mammography, i.e. fibres, masses and micro-
calcifications. The universal image quality assurance phantom houses inserts for this
application.
1.) Fibres
The user must subjectively identify the number of fibre simulating inserts that can be
seen and note the size of the smallest seen insert. The location of these inserts in the
universal phantom is shown in red in Figure 5.9. All the fibres in the phantom should
be visible and remain so over time.
Chapter 5 – The universal phantom as image quality assurance solution
Stellenbosch University https://scholar.sun.ac.za

121
Figure 5.9: Location of fibre simulating inserts, included in red outline.
2.) Masses
The low contrast detectability inserts, as in Figure 5.2, are used to simulate mass like
structures in mammography. The user must visually determine the smallest mass that
can be seen, i.e. subjective analysis. Ideally all the inserts should be visible and the
results must remain constant with periodic testing.
3.) Micro-calcifications
Metallic specs are included in five different clusters, with three specs of a size in each
cluster, as indicated by the red circle in Figure 5.10. These simulate micro-
calcifications in mammography. The user visually determines if all the specs in each
of the five clusters can be seen and the obtained subjective result should be
reproducible over time.
Chapter 5 – The universal phantom as image quality assurance solution
Stellenbosch University https://scholar.sun.ac.za

122
Figure 5.10: Location of micro-calcification simulating inserts in the red circle outline.
5.1.4 Image quality tests applicable to CT scanning
In addition to the tests described in section 5.1, slice thickness must also be
investigated for CT scanning.
1.) Slice thickness
A Gammex SB3 bone equivalent ramp inserted in the phantom at an angle is used to
measure slice thickness with user input into the data analysis software. The ramp is
shown in Figure 5.11, in the red outline.
The data analysis software uses the FWHM to measure the slice thickness from the
ramp. By adjusting the WW and WL, correcting for background, finding the 50%
background corrected peak WL value and setting the image grey scales to this value,
the data analysis software then measures the actual scanned slice thickness from a
subjective line drawn by the user. This is compared to the slice thickness selected for
the scan. The difference between the selected and actual slice thicknesses has a
tolerance of ± 20 % or 1 mm, whichever is smaller.
Chapter 5 – The universal phantom as image quality assurance solution
Stellenbosch University https://scholar.sun.ac.za

123
Figure 5.11: The red circle shows the location of ramp for CT slice thickness
measurement.
5.2 Overview of the universal phantom user’s manual and data analysis
software
A complete user’s manual is presented in Appendix A. The manual discusses the
operation and use of the phantom and software, analysis of the results and contains
result recording example pages. The manual includes general information about the
universal image quality assurance phantom and the manual, its intended use and
safety information for using the phantom. The manual aims to simplify the image
quality assurance process, explaining data analysis software installation, phantom set-
up, exposure and image quality evaluation in a step-by-step manner. It also includes
recommendations of actions required when obtained results are out of tolerance. The
manual is divided into sub sections for general x-rays and fluoroscopy imaging,
mammography imaging and CT scanning. In each section the visual and data analysis
software tests and the recording of results are described. It also contains the complete
technical specifications of the phantom and instructions for cleaning, preventative
maintenance and disposing of the phantom. Sample result data recording sheets are
included for all the imaging modalities.
The data analysis software is a Microsoft .NET application written in C# by Ernst Uys
and is licensed to the developer. The software provides a simple interface, that is
Chapter 5 – The universal phantom as image quality assurance solution Chapter 5 – The universal phantom as image quality assurance solution Chapter 5 – The universal phantom as image quality assurance solution
Stellenbosch University https://scholar.sun.ac.za

124
easy to understand and use, in accordance with the aim of the study. The software is
described in Appendix B. The source code can be obtained from the developer.
The user’s manual and data analysis software are included with the universal image
quality assurance phantom to form a complete user friendly image quality assurance
package.
Chapter 5 – The universal phantom as image quality assurance solution
Stellenbosch University https://scholar.sun.ac.za

125
Chapter 6
Reproducibility testing of the universal phantom
To be scientifically useful, the results obtained with the universal image quality
assurance phantom and data analysis software must be reproducible and accurate.
This means that consistent results are obtained using the same equipment and
exposure parameters. To test this, ten exposures of the phantom were made using
the same general x-ray, fluoroscopy and mammography unit and CT scanner, with
exposure technique factors as tabulated in Tables 6.1, 6.4, 6.7 and 6.10. For each
exposure the set-up of the phantom was repeated, i.e. the phantom was completely
repositioned for every exposure. Variability in x-ray output between identical
exposures exist, inherent to the equipment used, and could account for some of the
variation seen in the results. This was mentioned in Chapter 2. In an attempt to
minimise this, all exposures were acquired on the same day, directly after each other.
6.1 General x-ray reproducibility testing
The exposure parameters used for general x-ray imaging are included in Table 6.1
with the obtained results in Tables 6.2 and 6.3 and Figures 6.1 to 6.9.
Table 6.1: Reproducibility testing exposure technique
factors for general x-ray imaging.
Modality General x-rays
Unit Siemens Ysio
kV 40
mAs 2
FFD 100 cm
Slice thickness -
Other Outside bucky
Stellenbosch University https://scholar.sun.ac.za

126
Table 6.2: General x-ray reproducibility testing visual inspection results. (Appendix
A, A.2.3.4)
Table 6.3: General x-ray reproducibility testing data analysis
software results. (Appendix A, A.2.3.5)
Image
number
Sensitometry values as measured with software (arb. units)
Air Lung Supawood
Mean Std dev Mean Std dev Mean Std dev
1 1606.4 36.5 1674.4 43.1 1742.8 38.8
2 1640.7 36.5 1701.5 43.6 1764.8 38.4
3 1646.5 36.5 1710.4 42.6 1773.5 38.4
4 1611.3 36.5 1676.3 42.4 1729.3 36.8
5 1625.9 36.7 1693.5 45.2 1752.8 38.6
6 1623.4 36.9 1687.0 43.0 1743.5 38.2
7 1620.2 37.4 1690.5 42.8 1746.3 38.3
8 1620.3 36.0 1684.2 42.7 1741.4 38.7
9 1616.0 36.1 1681.6 43.4 1736.8 39.0
10 1611.5 36.5 1674.8 43.6 1733.3 37.8
Average
calculated 1622.2 ± 12.2 1687.4 ± 11.3 1746.5 ± 13.1
Image
number
Low contrast
detectability Positioning and alignment Artefacts
Image quality
visual inspection
1 2 X-ray field too small None Acceptable
2 3 X-ray field too large None Acceptable
3 2 X-ray field too small None Acceptable
4 3 X-ray field too large None Acceptable
5 3 X-ray field too large None Acceptable
6 3 X-ray field too large None Acceptable
7 3 X-ray field too large None Acceptable
8 3 X-ray field too large None Acceptable
9 3 X-ray field too large None Acceptable
10 3 X-ray field too large None Acceptable
Chapter 6 – Reproducibility testing of the universal phantom Chapter 6 – Reproducibility testing of the universal phantom
Stellenbosch University https://scholar.sun.ac.za

127
Image
number
Sensitometry values as measured with software (arb. units)
Bone Teflon RGD240
Mean Std dev Mean Std dev Mean Std dev
1 2492.4 80.0 2007.9 50.0 1768.2 39.9
2 2499.0 77.2 2039.9 52.7 1796.4 40.3
3 2515.2 79.0 2046.7 51.7 1802.6 40.2
4 2465.2 77.0 2000.3 50.3 1764.1 39.1
5 2483.5 80.5 2021.7 52.6 1780.4 39.7
6 2491.9 80.8 2020.5 52.2 1776.3 39.2
7 2484.3 79.7 2014.8 52.6 1775.9 40.2
8 2458.9 76.8 2008.7 51.0 1769.8 39.7
9 2476.2 79.5 2007.9 51.8 1772.0 40.3
10 2474.0 79.4 2007.8 53.0 1767.6 39.9
Average
calculated 2484.1 ± 15.7 2017.6 ± 14.3 1777.3 ± 12.1
Image
number
Uniformity
(arb.
units)
Limiting
resolution
(cycles/cm)
Image noise
(arb. units)
Geometry and measurement
tools (mm)
Standard
signal (arb.
units)
SNR CNR Horizontal
value
Vertical
value Mean
Std
dev
1 31.9 11.1 44.5 2.1 20.3 20.0 1687.1 36.1
2 34.7 11.1 45.4 2.1 19.6 19.9 1716.2 35.7
3 35.3 11.1 44.6 2.1 19.9 19.6 1723.9 36.4
4 37.1 11.1 44.7 2.1 19.9 19.9 1687.8 35.9
5 34.1 11.2 45.2 2.2 19.9 19.6 1703.6 37.1
6 36.1 11.2 44.1 2.4 20.3 19.6 1703.3 36.8
7 33.3 11.2 44.9 2.0 19.9 19.9 1697.4 37.3
8 31.3 11.1 45.5 2.0 19.9 19.5 1706.2 38.8
9 32.7 11.2 43.9 2.1 19.9 19.9 1694.1 37.7
10 37.2 11.1 43.4 2.2 19.9 20.3 1691.3 36.5
Average
calculated 34.4±2.0 11.1±0.1 44.6±0.6 2.1±0.1 20.0±0.2 20.0±0.2 1701.1±11.5
Stellenbosch University https://scholar.sun.ac.za

128
Figure 6.1: General x-ray reproducibility images.
Figure 6.2: General x-rays data analysis software reproducibility results for
sensitometry for bone and Teflon with tolerance limits of ± 2 %.
1950.0
2050.0
2150.0
2250.0
2350.0
2450.0
2550.0
1 2 3 4 5 6 7 8 9 10
MEA
SUR
ED V
ALU
E (A
RB
. UN
ITS)
IMAGE NUMBER
SENSITOMETRY
Bone Teflon
Note: Bone mean 2484.1 ± 15.7 Teflon mean 2017.6 ± 14.3Lines show accepted limit range
Chapter 6 – Reproducibility testing of the universal phantom Chapter 6 – Reproducibility testing of the universal phantom Chapter 6 – Reproducibility testing of the universal phantom
Stellenbosch University https://scholar.sun.ac.za

129
Figure 6.3: General x-rays data analysis software reproducibility results. for
sensitometry for lung and RGD240 with tolerance limits of ± 2 %.
1600.0
1700.0
1800.0
1900.0
1 2 3 4 5 6 7 8 9 10
MEA
SUR
ED V
ALU
E (A
RB
. UN
ITS)
IMAGE NUMBER
SENSITOMETRY
Lung RGD240
Note: Lung mean 1687.4 ± 11.3RGD240 mean 1777.3 ± 12.1 Lines show accepted limit range
Chapter 6 – Reproducibility testing of the universal phantom
Stellenbosch University https://scholar.sun.ac.za

130
Figure 6.4: General x-rays data analysis software reproducibility results for
sensitometry for air and Supawood with tolerance limits of ± 2 %.
1550.0
1650.0
1750.0
1850.0
1 2 3 4 5 6 7 8 9 10
MEA
SUR
ED V
ALU
E (A
RB
. UN
ITS)
IMAGE NUMBER
SENSITOMETRY
Air Supawood
Note:Air mean 1622.2 ± 12.2Supawood mean 1746.5 ± 13.1Lines show accepted limit range
Chapter 6 – Reproducibility testing of the universal phantom Chapter 6 – Reproducibility testing of the universal phantom
Stellenbosch University https://scholar.sun.ac.za
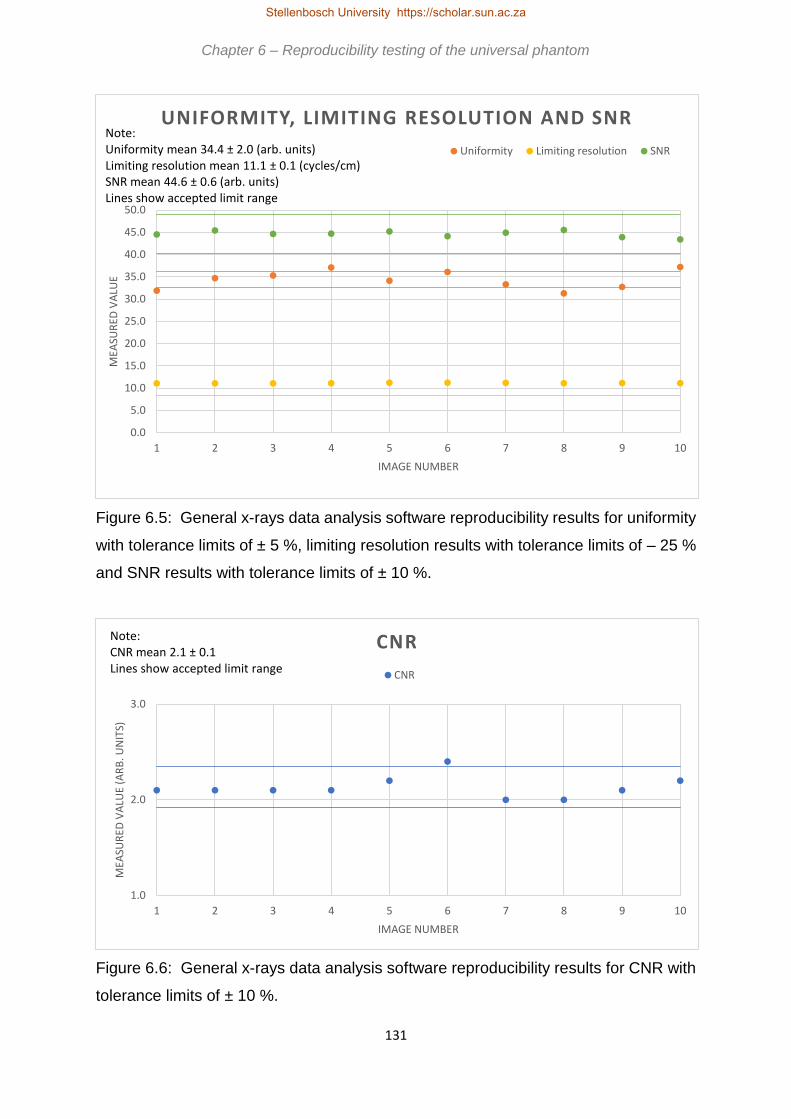
131
Figure 6.5: General x-rays data analysis software reproducibility results for uniformity
with tolerance limits of ± 5 %, limiting resolution results with tolerance limits of – 25 %
and SNR results with tolerance limits of ± 10 %.
Figure 6.6: General x-rays data analysis software reproducibility results for CNR with
tolerance limits of ± 10 %.
0.0
5.0
10.0
15.0
20.0
25.0
30.0
35.0
40.0
45.0
50.0
1 2 3 4 5 6 7 8 9 10
MEA
SUR
ED V
ALU
E
IMAGE NUMBER
UNIFORMITY, LIMITING RESOLUTION AND SNR
Uniformity Limiting resolution SNR
Note:Uniformity mean 34.4 ± 2.0 (arb. units)Limiting resolution mean 11.1 ± 0.1 (cycles/cm)SNR mean 44.6 ± 0.6 (arb. units)Lines show accepted limit range
1.0
2.0
3.0
1 2 3 4 5 6 7 8 9 10
MEA
SUR
ED V
ALU
E (A
RB
. UN
ITS)
IMAGE NUMBER
CNR
CNR
Note:CNR mean 2.1 ± 0.1Lines show accepted limit range
Chapter 6 – Reproducibility testing of the universal phantom Chapter 6 – Reproducibility testing of the universal phantom Chapter 6 – Reproducibility testing of the universal phantom
Stellenbosch University https://scholar.sun.ac.za

132
Figure 6.7: General x-rays data analysis software reproducibility results for geometry
and measurement tools for horizontal measurement with tolerance limits of ± 5 mm.
Figure 6.8: General x-rays data analysis software reproducibility results for geometry
and measurement tools for vertical measurement with tolerance limits of ± 5 mm.
14.0
16.0
18.0
20.0
22.0
24.0
26.0
1 2 3 4 5 6 7 8 9 10
MEA
SUR
ED V
ALU
E (M
M)
IMAGE NUMBER
GEOMETRY AND MEASUREMENET TOOLS
Geometry horizontal
Note:Geometry horizontal mean 20.0 ± 0.2Lines show accepted limit range
14.0
16.0
18.0
20.0
22.0
24.0
26.0
1 2 3 4 5 6 7 8 9 10
MEA
SUR
ED V
ALU
E (M
M)
IMAGE NUMBER
GEOMETRY AND MEASUREMENT TOOLS
Geometry vertical
Note:Geometry vertical mean 19.8 ± 0.2Lines show accepted limit range
Chapter 6 – Reproducibility testing of the universal phantom Chapter 6 – Reproducibility testing of the universal phantom Chapter 6 – Reproducibility testing of the universal phantom
Stellenbosch University https://scholar.sun.ac.za

133
Figure 6.9: General x-rays data analysis software reproducibility results for standard
signal with tolerance limits of ± 2 %.
Table 6.2 for the visual inspection of the obtained images refers. For low contrast
detectability the tolerance from DoH is baseline ± 1 insert size. From Table 6.2 the
baseline value would be 3, thus all results are within limits. A variation of ± 1 cm at
100 cm SID is accepted for positioning and alignment. With collimation of the light
field to phantom edges, the phantom was cut off in images 1 and 3, so the x-ray field
was smaller than the light field. The collimation was adjusted to extend beyond the
phantom edges to have the whole phantom in the image, which resulted in the x-ray
field being large enough to include the entire phantom. The inconsistency in the field
size was attributed to the fact that the phantom was repositioned, with collimation
readjusted, for every exposure. The set up was thus slightly different each time. There
should not be any visible artefacts in images according to DoH recommendations, and
none of the images contained any artefacts. Overall, the visual image quality should
remain reproducible over time, and this was the case for images 1 to 10.
For sensitometry and standard signal the recommended tolerance from DoH is
baseline grey scale ± 0.2. However, as a densitometer is not used to measure the
1600.0
1650.0
1700.0
1750.0
1800.0
1 2 3 4 5 6 7 8 9 10
MEA
SUR
ED V
ALU
E (A
RB
. UN
ITS)
IMAGE NUMBER
STANDARD SIGNAL
Standard signal
Note:Standard signal mean 1701.1 ± 11.5Lines show accepted limit range
Chapter 6 – Reproducibility testing of the universal phantom Chapter 6 – Reproducibility testing of the universal phantom Chapter 6 – Reproducibility testing of the universal phantom Chapter 6 – Reproducibility testing of the universal phantom
Stellenbosch University https://scholar.sun.ac.za

134
actual grey scale value, a tolerance of ± 2 % is suggested for the universal image
quality assurance phantom and data analysis software. From Figures 6.2 to 6.4 for
sensitometry and Figure 6.9 for standard signal, the obtained values are reproducible
within this range. For uniformity, a tolerance of mean value ± 10 % is recommended
for film/screen and CR systems and a mean value ± 5 % for DR. As a DR unit was
used for the reproducibility exposures, the ± 5 % tolerance was applied to the mean
value from the ten exposures. Except for images 4,8 and 10, with results within ± 10
%, all values fall within this range as seen in Figure 6.5. The limiting resolution should
not vary by more than – 25 % according to the DoH accepted limits. Figure 6.5 shows
the largest deviation being for image 6 of 0.9 %. For image noise, i.e. SNR and CNR,
the limit is baseline ± 10 %. Figure 6.5 shows all results for SNR are within these
limits, with image 8 having the largest deviation of 2.0 %. For CNR in Figure 6.6 image
6 has a deviation of 13.2%. This is outside of tolerance, and would require the test to
be repeated, and for images 7 to 10 the results were within tolerance. The quoted
tolerance for geometry and measurement tools are ± 0.5 cm or ± 2 %. Figures 6.7
and 6.8 shows all results within the ± 0.5 cm limit.
From Tables 6.2 and 6.3 and Figures 6.1 to 6.9 it is concluded that the results from
the universal image quality assurance phantom and data analysis software are indeed
reproducible and hence acceptable for routine image QC consistency testing in
general x-ray imaging.
6.2 Fluoroscopy reproducibility testing
For fluoroscopy the results for the reproducibility testing are included in Tables 6.5 and
6.6 and in Figures 6.10 to 6.19. The exposure technique factors are shown in Table
6.4. For each exposure the phantom was repositioned completely.
Chapter 6 – Reproducibility testing of the universal phantom
Stellenbosch University https://scholar.sun.ac.za

135
Table 6.4: Reproducibility testing
exposure technique factors for
fluoroscopy imaging.
Figure 6.10: Fluoroscopy reproducibility images.
Modality Fluoroscopy
Unit Siemens Axiom
Luminos DRF
kV AEC (hand protocol)
mAs AEC (hand protocol)
FFD 115 cm
Slice thickness -
Other Outside bucky
Chapter 6 – Reproducibility testing of the universal phantom
Stellenbosch University https://scholar.sun.ac.za

136
Table 6.5: Fluoroscopy x-ray reproducibility testing visual inspection results.
(Appendix A, A.2.3.4)
Image
number
Low contrast
detectability
Positioning
and alignment Artefacts Image quality visual inspection
1 8 Correct None Grainy low contrast, other projection
radiography inserts not visible
2 8 Correct None Grainy low contrast, other projection
radiography inserts not visible
3 10 Correct None Grainy low contrast, other projection
radiography inserts not visible
4 10 Correct None Grainy low contrast, other projection
radiography inserts not visible
5 20 Correct None Noisy, only 20 mm insert and central
bead visible
6 8 Correct None Grainy low contrast, other projection
radiography inserts not visible
7 8 Correct None Grainy low contrast, other projection
radiography inserts not visible
8 8 Correct None Grainy low contrast, other projection
radiography inserts not visible
9 10 Correct None Grainy low contrast, other projection
radiography inserts not visible
10 10 Correct None Grainy low contrast, other projection
radiography inserts not visible
Chapter 6 – Reproducibility testing of the universal phantom
Stellenbosch University https://scholar.sun.ac.za

137
Table 6.6: Fluoroscopy x-ray reproducibility testing data analysis
software results. (Appendix A, A.2.3.5)
Image
number
Sensitometry values as measured with software (arb. units)
Air Lung Supawood
Mean Std dev Mean Std dev Mean Std dev
1 2816.5 54.2 2857.5 50.9 2928.1 57.4
2 2809.9 54.2 2857.2 63.3 2925.5 60.7
3 2816.1 57.6 2860.5 54.5 2926.6 62.1
4 2755.4 119.4 2813.2 131.2 2890.1 143.2
5 2798.8 118.6 2844.9 124.8 2924.4 137.1
6 2796.1 59.0 2845.8 59.6 2913.2 62.5
7 2802.0 55.6 2855.9 56.3 2926.6 59.7
8 2802.4 58.2 2847.6 59.5 2919.1 63.6
9 2790.5 56.1 2842.9 57.6 2911.8 60.8
10 2791.9 55.6 2842.5 56.7 2910.1 59.7
Average
calculated 2798.0 ± 16.6 2846.8 ± 12.9 2917.6 ± 11.2
Image
number
Sensitometry values as measured with software (arb. units)
Bone Teflon RGD240
Mean Std dev Mean Std dev Mean Std dev
1 3380.5 77.7 3150.3 64.5 3009.5 64.2
2 3384.4 88.7 3153.4 70.2 3011.8 65.8
3 3385.1 74.5 3148.0 65.1 3015.1 63.0
4 3409.4 197.2 3129.5 164.8 2976.1 135.3
5 3441.0 196.3 3170.6 164.7 3001.7 129.9
6 3380.3 83.5 3140.2 72.4 3001.3 67.6
7 3379.2 81.0 3148.9 68.9 3012.1 63.4
8 3384.2 77.1 3143.3 73.0 3005.1 64.5
9 3373.2 83.2 3139.1 69.1 3001.0 65.7
10 3377.6 82.3 3139.1 69.4 3004.3 66.2
Average
calculated 3389.5 ± 19.5 3146.2 ± 10.5 3003.8 ± 10.4
Uniformity
Chapter 6 – Reproducibility testing of the universal phantom
Stellenbosch University https://scholar.sun.ac.za

138
Image
number
Limiting
resolution
(cycles/cm)
Image noise
(arb. units)
Geometry and measurement
tools (mm)
Standard
signal (arb.
units)
SNR CNR Horizontal
value
Vertical
value Mean
Std
dev
1 22.9 4.9 47.5 0.7 20.9 20.4 2966.4 61.9
2 23.3 4.9 46.0 0.6 19.5 20.9 2966.7 63.3
3 25.5 4.4 48.3 0.7 20.0 20.9 2967.9 62.0
4 22.4 4.7 42.1 0.6 20.0 20.0 2931.3 147.3
5 29.9 4.9 42.4 0.3 18.6 18.2 2968.0 139.2
6 28.7 4.3 45.1 0.6 20.8 20.5 2959.4 64.6
7 28.7 4.6 47.9 0.7 20.4 20.9 2964.8 60.3
8 22.0 4.3 46.6 0.7 20.0 20.4 2960.9 61.4
9 29.7 4.3 46.0 0.7 20.0 20.4 2957.5 63.6
10 22.1 4.3 46.5 0.7 19.3 20.3 2956.8 62.4
Average
calculated 25.5±3.2 4.6±0.3 45.8±2.0 0.6±0.1 20.0±0.7 20.3±0.8 2960.0±10.4
The limits from DoH for fluoroscopy and general x-rays are the same. Low contrast
detectability baseline from Table 6.5 was 8 mm. A tolerance of +1 insert size is
allowed, thus image 5 is out of tolerance. When results are out of tolerance, the
recommendation, according to Figure A.2 in Appendix A, is to repeat the test. For
images 6 to 10 the result was in tolerance. For positioning and alignment, a tolerance
of ± 1 cm at 100 cm SID is allowed according to DoH regulations. The SID used was
115 cm and the agreement between the set light field (set to edges of phantom) and
the obtained x-ray image was within tolerance. No artefacts were seen in the images,
as is recommended by DoH. However, the overall visual image quality of the images
was poor. All images were of low contrast, as is seen from Figure 6.10 with very small
CNR, and most other planar imaging inserts were very unclear or not visible. The
recommendation for visual image quality inspection from DoH is that the results must
be reproducible, and although the image quality was poor, it was reproducible over the
ten images.
Chapter 6 – Reproducibility testing of the universal phantom Chapter 6 – Reproducibility testing of the universal phantom
Stellenbosch University https://scholar.sun.ac.za

139
Figure 6.11: Fluoroscopy data analysis software reproducibility results for
sensitometry for air, bone, Teflon and RGD240 with tolerance limits of ± 2 %.
Figure 6.12: Fluoroscopy data analysis software reproducibility results for
sensitometry for lung with tolerance limits of ± 2 %.
2700.0
2900.0
3100.0
3300.0
3500.0
1 2 3 4 5 6 7 8 9 10
MEA
SUR
ED V
ALU
E (A
RB
. UN
ITS)
IMAGE NUMBER
SENSITOMETRY
Air Bone Teflon RGD240
Note:Air mean 2798.0 ± 16.6Bone mean 3389.5 ± 19.5Teflo mean 3146.2 ± 10.5RGD240 mean 3003.8 ± 10.4Lines show accepted limit range
2700.0
2800.0
2900.0
3000.0
1 2 3 4 5 6 7 8 9 10
MEA
SUR
ED V
ALU
E (A
RB
. UN
ITS)
IMAGE NUMBER
SENSITOMETRY
Lung
Note:Lung mean 2846.8 ± 12.9Lines show accepted limit range
Chapter 6 – Reproducibility testing of the universal phantom
Stellenbosch University https://scholar.sun.ac.za

140
Figure 6.13: Fluoroscopy data analysis software reproducibility results for
sensitometry for supawood with tolerance limits of ± 2 %.
Figure 6.14: Fluoroscopy data analysis software reproducibility results for uniformity
and SNR with tolerance limits of ± 10 %.
2800.0
2900.0
3000.0
1 2 3 4 5 6 7 8 9 10
MEA
SUR
ED V
ALU
E (A
RB
. UN
ITS)
IMAGE NUMBER
SENSITOMETRY
Supawood
Note:Supawood mean 2917.6 ± 11.2Lines show accepted limit range
10.0
20.0
30.0
40.0
50.0
60.0
1 2 3 4 5 6 7 8 9 10
MEA
SUR
ED V
ALU
E (A
RB
. UN
ITS)
IMAGE NUMBER
UNIFORMITY AND SNR
Uniformity SNR
Note:Uniformity mean 25.4 ± 13.3SNR mean 45.8 ± 2.0Lines show accepted limit range
Chapter 6 – Reproducibility testing of the universal phantom
Stellenbosch University https://scholar.sun.ac.za

141
Figure 6.15: Fluoroscopy data analysis software reproducibility results for limiting
resolution results with tolerance limits of – 25 %.
Figure 6.16: Fluoroscopy data analysis software reproducibility results for CNR with
tolerance limits of ± 10 %.
2.00
4.00
6.00
8.00
1 2 3 4 5 6 7 8 9 10
MEA
SUR
ED V
ALU
E (C
YCLE
S/C
M)
IMAGE NUMBER
LIMITING RESOLUTION
Limiting resolution
Note:Limiting resolution mean 4.6 ± 0.3Lines show accepted limit range
0.0
1.0
1 2 3 4 5 6 7 8 9 10
MEA
SUR
ED V
ALU
E (A
RB
. UN
ITS)
IMAGE NUMBER
CNR
CNR
Note:CNR mean 0.6 ± 0.1Lines show accepted limit range
Chapter 6 – Reproducibility testing of the universal phantom
Stellenbosch University https://scholar.sun.ac.za

142
Figure 6.17: Fluoroscopy data analysis software reproducibility results for geometry
and measurement tools results for horizontal measurement with tolerance limits of ± 5
mm.
Figure 6.18: Fluoroscopy data analysis software reproducibility results for geometry
and measurement tools for vertical measurement with tolerance limits of ± 5 mm.
14.0
17.0
20.0
23.0
26.0
1 2 3 4 5 6 7 8 9 10
MEA
SUR
ED V
ALU
E (M
M)
IMAGE NUMBER
GEOMETRY AND MEASUREMENT TOOLS
Geometry horizontal
Note:Geometry horizontal mean 20.0 ± 0.7Lines show accepted limit range
14.0
17.0
20.0
23.0
26.0
1 2 3 4 5 6 7 8 9 10
MEA
SUR
ED V
ALU
E (M
M)
IMAGE NUMBER
GEOMETRY AND MEASUREMENT TOOLS
Geometry vertical
Note:Geometry vertical mean 20.3 ± 0.8Lines show accepted limit range
Chapter 6 – Reproducibility testing of the universal phantom
Stellenbosch University https://scholar.sun.ac.za

143
Figure 6.19: Fluoroscopy data analysis software reproducibility results for standard
signal results with tolerance limits of ± 2 %.
For sensitometry and standard signal the recommended tolerance from DoH is
baseline grey scale ± 0.2. As discussed in section 6.1, as a densitometer is not used
to measure the actual grey scale value, a tolerance of ± 2 % is suggested for the
universal image quality assurance phantom and data analysis software. From Figures
6.11 to 6.13 for sensitometry and Figure 6.19 for standard signal, it is clear that the
obtained values are reproducible within this range. Figure 6.14 shows the results for
uniformity and SNR, both with a DoH recommended tolerance of ± 10 %. All SNR
results were within tolerance. The uniformity of image 5 is 17.7 % above the mean
value, the largest deviation seen in the ten obtained images. However, from Table 6.5
it is seen that the image quality of image 5 was the poorest, with a noisy and grainy
image. Such a deviation is therefore expected. Repetition of the test produced images
with better image quality and results within tolerance. A similar trend is seen with the
CNR results in Figure 6.16. The percentage difference for image 5 is 50 %, however
as the CNR values are such small values, a small change will reflect a large
percentage variation. The limiting resolution should not vary by more than – 25 %
according to the DoH accepted limits. Figure 6.15 shows the values for images 1, 2
and 5 to be better than the mean value. For this calculation the MTF balls, as marked
in Figure 5.4 were not used. In some images the balls were not visible. In those
2850.0
2900.0
2950.0
3000.0
3050.0
1 2 3 4 5 6 7 8 9 10
MEA
SUR
ED V
ALU
E (A
RB
. UN
ITS)
IMAGE NUMBER
STANDARD SIGNAL
Standard signal
Note:Standard signal mean 2960.0 ± 10.4Lines show accepted limit range
Chapter 6 – Reproducibility testing of the universal phantom Chapter 6 – Reproducibility testing of the universal phantom
Stellenbosch University https://scholar.sun.ac.za

144
images where the largest of the three balls, i.e. 1 mm diameter, was visible, the data
analysis software could not produce an acceptable MTF using the ball, due to the
graininess of the images. The limiting resolution calculations for fluoroscopy were thus
done using the central 2 mm diameter ball. The quoted tolerance for geometry and
measurement tools are ± 0.5 cm or ± 2 %. Figure 6.17 for horizontal and Figure 6.18
for vertical shows the geometry and measurement tools results. The accepted
tolerance is ± 0.5 cm. For the horizontal measurements, images 1, 6 and 5 measured
values higher than the average value from the ten images, with image 5 having the
largest deviation of 7.0 %. Image 5 also measured 10.3 % lower than the average
horizontal value. As the PMMA cylinder, shown in Figure 5.7 was very unclear in the
fluoroscopy images, and almost invisible in image 5 with the poor image quality as
from Table 6.5, these differences were expected.
The results in Tables 6.5 and 6.6 and Figures 6.10 to 6.19 show that the universal
image quality assurance phantom and data analysis software can be used
reproducibly in routine fluoroscopy image quality control.
6.3 Mammography reproducibility testing
Reproducibility tests with the universal image quality assurance phantom and data
analysis software was also done for mammography, with exposure technique factors
as shown in Table 6.7. The results are tabulated in Tables 6.8 and 6.9 and shown in
Figures 6.20 to 6.27.
Figure 6.20: Mammography reproducibility images.
Chapter 6 – Reproducibility testing of the universal phantom Chapter 6 – Reproducibility testing of the universal phantom
Stellenbosch University https://scholar.sun.ac.za
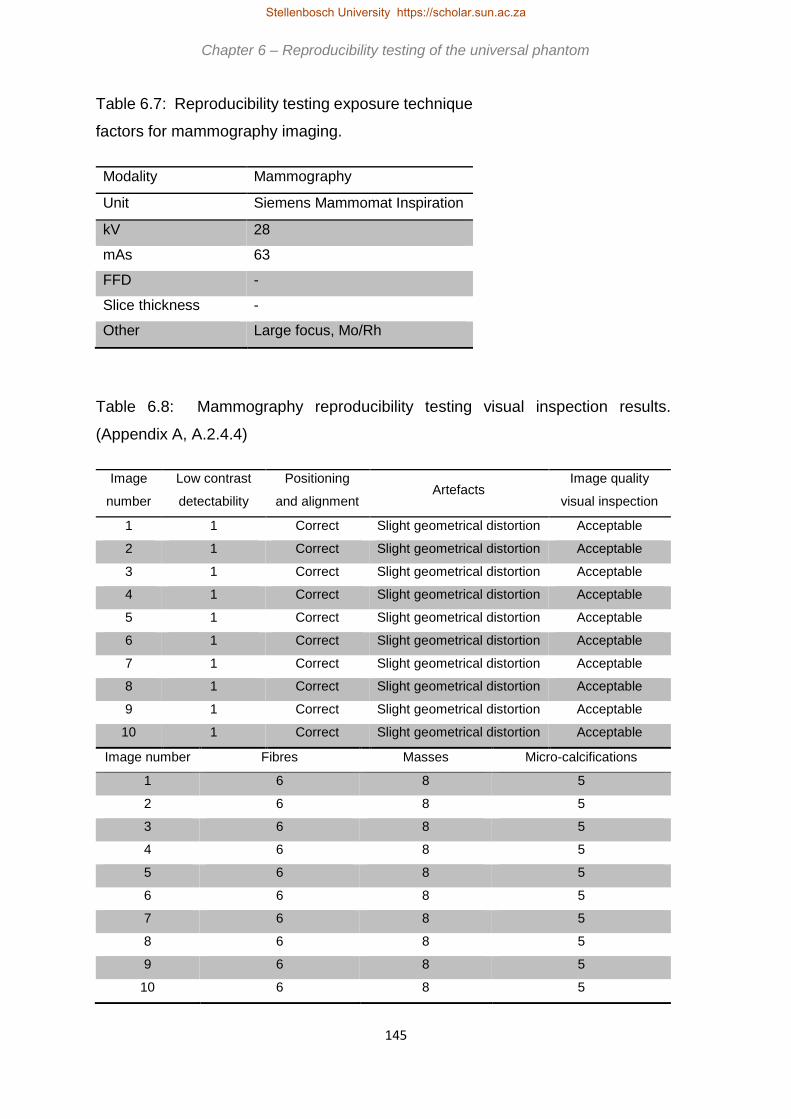
145
Table 6.7: Reproducibility testing exposure technique
factors for mammography imaging.
Table 6.8: Mammography reproducibility testing visual inspection results.
(Appendix A, A.2.4.4)
Modality Mammography
Unit Siemens Mammomat Inspiration
kV 28
mAs 63
FFD -
Slice thickness -
Other Large focus, Mo/Rh
Image
number
Low contrast
detectability
Positioning
and alignment Artefacts
Image quality
visual inspection
1 1 Correct Slight geometrical distortion Acceptable
2 1 Correct Slight geometrical distortion Acceptable
3 1 Correct Slight geometrical distortion Acceptable
4 1 Correct Slight geometrical distortion Acceptable
5 1 Correct Slight geometrical distortion Acceptable
6 1 Correct Slight geometrical distortion Acceptable
7 1 Correct Slight geometrical distortion Acceptable
8 1 Correct Slight geometrical distortion Acceptable
9 1 Correct Slight geometrical distortion Acceptable
10 1 Correct Slight geometrical distortion Acceptable
Image number Fibres Masses Micro-calcifications
1 6 8 5
2 6 8 5
3 6 8 5
4 6 8 5
5 6 8 5
6 6 8 5
7 6 8 5
8 6 8 5
9 6 8 5
10 6 8 5
Chapter 6 – Reproducibility testing of the universal phantom
Stellenbosch University https://scholar.sun.ac.za
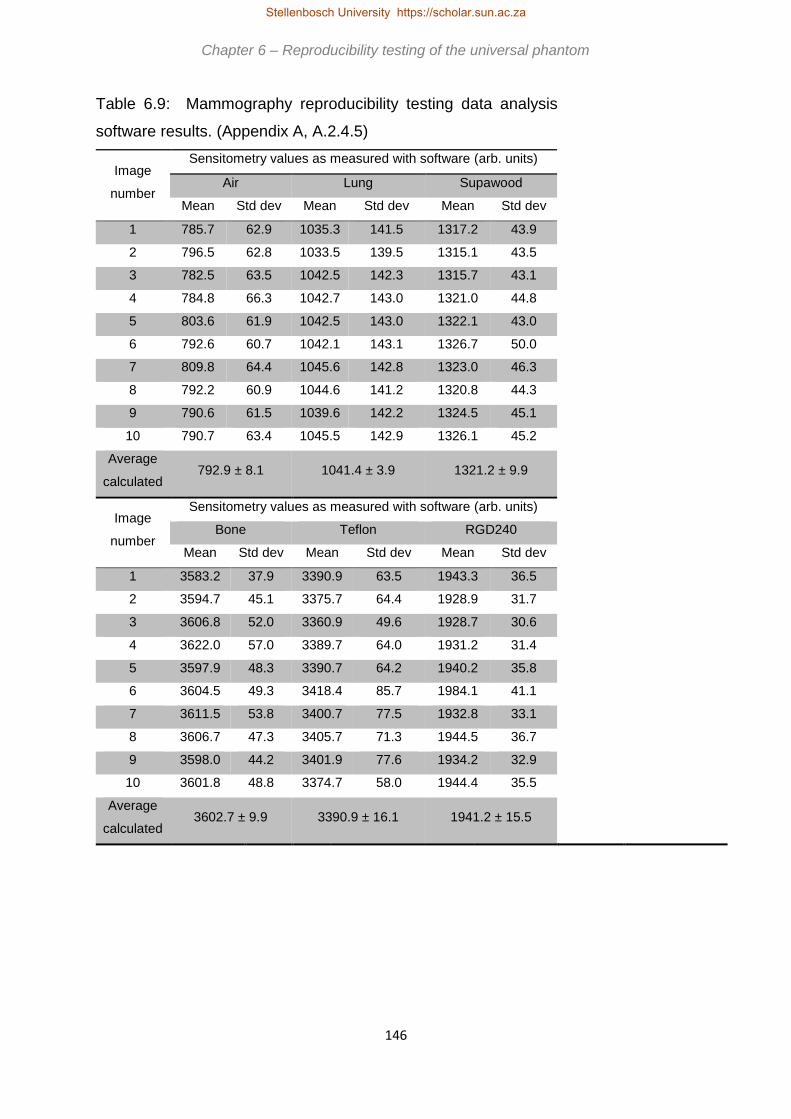
146
Table 6.9: Mammography reproducibility testing data analysis
software results. (Appendix A, A.2.4.5)
Image
number
Sensitometry values as measured with software (arb. units)
Air Lung Supawood
Mean Std dev Mean Std dev Mean Std dev
1 785.7 62.9 1035.3 141.5 1317.2 43.9
2 796.5 62.8 1033.5 139.5 1315.1 43.5
3 782.5 63.5 1042.5 142.3 1315.7 43.1
4 784.8 66.3 1042.7 143.0 1321.0 44.8
5 803.6 61.9 1042.5 143.0 1322.1 43.0
6 792.6 60.7 1042.1 143.1 1326.7 50.0
7 809.8 64.4 1045.6 142.8 1323.0 46.3
8 792.2 60.9 1044.6 141.2 1320.8 44.3
9 790.6 61.5 1039.6 142.2 1324.5 45.1
10 790.7 63.4 1045.5 142.9 1326.1 45.2
Average
calculated 792.9 ± 8.1 1041.4 ± 3.9 1321.2 ± 9.9
Image
number
Sensitometry values as measured with software (arb. units)
Bone Teflon RGD240
Mean Std dev Mean Std dev Mean Std dev
1 3583.2 37.9 3390.9 63.5 1943.3 36.5
2 3594.7 45.1 3375.7 64.4 1928.9 31.7
3 3606.8 52.0 3360.9 49.6 1928.7 30.6
4 3622.0 57.0 3389.7 64.0 1931.2 31.4
5 3597.9 48.3 3390.7 64.2 1940.2 35.8
6 3604.5 49.3 3418.4 85.7 1984.1 41.1
7 3611.5 53.8 3400.7 77.5 1932.8 33.1
8 3606.7 47.3 3405.7 71.3 1944.5 36.7
9 3598.0 44.2 3401.9 77.6 1934.2 32.9
10 3601.8 48.8 3374.7 58.0 1944.4 35.5
Average
calculated 3602.7 ± 9.9 3390.9 ± 16.1 1941.2 ± 15.5
Chapter 6 – Reproducibility testing of the universal phantom
Stellenbosch University https://scholar.sun.ac.za

147
Image
number
Uniformity
(arb.
units)
Limiting
resolution
(cycles/cm)
Image noise
(arb. units)
Geometry and
measurement tools
(mm)
Standard
signal (arb.
units)
SNR CNR Horizontal
value
Vertical
value Mean
Std
dev
1 10.7 17.9 49.4 27.9 20.1 20.1 1379.3 20.2
2 11.7 18.1 52.5 27.6 20.1 20.3 1378.1 20.2
3 10.1 17.9 54.3 27.7 19.6 20.3 1379.8 20.0
4 11.6 17.9 56.5 27.8 20.1 20.1 1380.7 20.1
5 11.9 18.1 58.1 26.8 19.6 20.1 1382.7 20.2
6 13.5 18.0 52.7 27.5 20.1 20.1 1380.8 20.8
7 13.8 18.1 58.4 25.7 20.1 20.1 1382.0 20.3
8 14.5 18.1 57.9 25.8 19.6 20.1 1381.0 20.3
9 14.1 18.0 51.6 26.2 20.1 19.7 1382.1 20.3
10 15.4 17.9 57.1 26.3 19.6 20.1 1383.5 20.7
Average
calculated 12.7±1.7 18.0±0.1 54.9±3.0 26.9±0.8 19.9±0.2 20.1±0.2 1381.0±1.6
According to the DoH recommendations, all low contrast detectability, masses, fibres
and micro-calcifications should be visible. From Table 6.8 above this was the case for
the ten reproducibility images. The flat side of the phantom was aligned with the chest
wall side of the bucky, and the alignment was correct and within the specified ± 2 %
of SID. According to DoH no artefacts should be visible in the image. However, slight
geometric distortion, as discussed in section 4.3.3, was still evident. This however
remained reproducible over the ten acquired images and did not interfere with further
image quality assessment. It is therefore recommended that for the universal image
quality assurance phantom and data analysis software, such geometric distortion will
be accepted as normal and that only artefacts other than this should be noted. The
image quality should remain reproducible with visual inspection test, and this was
confirmed in Table 6.8.
Chapter 6 – Reproducibility testing of the universal phantom
Stellenbosch University https://scholar.sun.ac.za

148
Figure 6.21: Mammography data analysis software reproducibility results for
sensitometry for bone and Teflon with tolerance limits of ± 2 %.
3000.0
3200.0
3400.0
3600.0
3800.0
4000.0
1 2 3 4 5 6 7 8 9 1 0
MEA
SUR
ED V
ALU
E (A
RB
. UN
ITS)
IMAGE NUMBER
SENSITOMETRY
Bone Teflon
Note:Bone mean 3602.7 ± 9.9Teflon mean 3390.9 ± 16.1Lines show accepted limit range
Chapter 6 – Reproducibility testing of the universal phantom
Stellenbosch University https://scholar.sun.ac.za

149
Figure 6.22: Mammography data analysis software reproducibility results for
sensitometry results for air, lung, Supawood and RGD240 with tolerance limits of ± 2
%.
600.0
800.0
1000.0
1200.0
1400.0
1600.0
1800.0
2000.0
2200.0
1 2 3 4 5 6 7 8 9 1 0
MEA
SUR
ED V
ALU
E (A
RB
. UN
ITS)
IMAGE NUMBER
SENSITOMETRY
Air Lung Supawood RGD240
Note:Air mean 792.9 ± 8.1Lung mean 1041.4 ± 3.9Supawood mean 1321.2 ± 3.9RGD240 mean 1941.2 ± 15.5 Lines show accepted limit range
Chapter 6 – Reproducibility testing of the universal phantom Chapter 6 – Reproducibility testing of the universal phantom
Stellenbosch University https://scholar.sun.ac.za
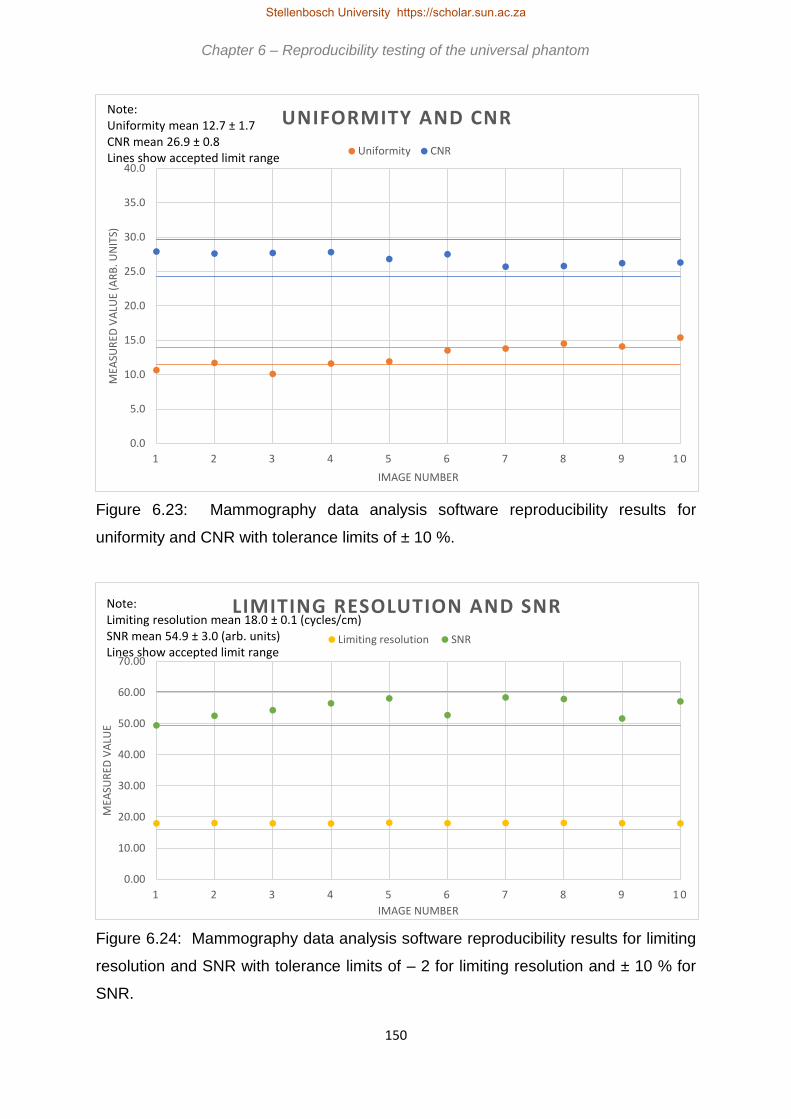
150
Figure 6.23: Mammography data analysis software reproducibility results for
uniformity and CNR with tolerance limits of ± 10 %.
Figure 6.24: Mammography data analysis software reproducibility results for limiting
resolution and SNR with tolerance limits of – 2 for limiting resolution and ± 10 % for
SNR.
0.0
5.0
10.0
15.0
20.0
25.0
30.0
35.0
40.0
1 2 3 4 5 6 7 8 9 1 0
MEA
SUR
ED V
ALU
E (A
RB
. UN
ITS)
IMAGE NUMBER
UNIFORMITY AND CNR
Uniformity CNR
Note:Uniformity mean 12.7 ± 1.7CNR mean 26.9 ± 0.8Lines show accepted limit range
0.00
10.00
20.00
30.00
40.00
50.00
60.00
70.00
1 2 3 4 5 6 7 8 9 1 0
MEA
SUR
ED V
ALU
E
IMAGE NUMBER
LIMITING RESOLUTION AND SNR
Limiting resolution SNR
Note:Limiting resolution mean 18.0 ± 0.1 (cycles/cm)SNR mean 54.9 ± 3.0 (arb. units)Lines show accepted limit range
Chapter 6 – Reproducibility testing of the universal phantom Chapter 6 – Reproducibility testing of the universal phantom Chapter 6 – Reproducibility testing of the universal phantom
Stellenbosch University https://scholar.sun.ac.za

151
Figure 6.25: Mammography data analysis software reproducibility results for geometry
and measurement tools results for horizontal measurement with tolerance limits of ± 2
%.
Figure 6.26: Mammography data analysis software reproducibility results for geometry
and measurement tools for vertical measurement with tolerance limits of ± 2 %.
19.0
19.4
19.8
20.2
20.6
21.0
1 2 3 4 5 6 7 8 9 1 0
MEA
SUR
ED V
ALU
E (M
M)
IMAGE NUMBER
GEOMETRY AND MEASUREMENT TOOLS
Geometry horizontal
Note:Geometry horizontal mean 19.9 ± 0.2Lines show accepted limit range
19.0
19.4
19.8
20.2
20.6
21.0
1 2 3 4 5 6 7 8 9 1 0
MEA
SUR
ED V
ALU
E (M
M)
IMAGE NUMBER
GEOMETRY AND MEASUREMENT TOOLS
Geometry vertical
Note:Geometry vertical mean 20.1 ± 0.2Lines show accepted limit range
Chapter 6 – Reproducibility testing of the universal phantom Chapter 6 – Reproducibility testing of the universal phantom Chapter 6 – Reproducibility testing of the universal phantom
Stellenbosch University https://scholar.sun.ac.za

152
Figure 6.27: Mammography data analysis software reproducibility results for standard
signal with tolerance limits of ± 2 %.
For sensitometry and standard signal the recommended tolerance from DoH is
baseline grey scale ± 0.2. Again, a tolerance of ± 2 % is suggested for the universal
image quality assurance phantom and data analysis software as previously discussed.
From Figures 6.21 and 6.22 for sensitometry and Figure 6.27 for standard signal, it is
clear that the obtained values are reproducible within this range. Figure 6.23 shows
the results for uniformity and CNR, with a DoH recommended tolerance of ± 10 %.
With uniformity, image 1 was 15.7 % below average and image 10 21.3 % above the
average value for the ten images. According to the user’s manual in Appendix A,
Figure A.2, in the event of a value being out of tolerance the test should be repeated.
For the other eight images the results were in tolerance. The results for CNR were
within limits. The limiting resolution is quoted as 11 – 13 lp/mm by DoH, i.e. a variation
of 2. In Figure 6.24 tolerance limits of – 2 were used and the obtained results were
within, i.e. above, this limit. SNR also has an accepted ± 10 % limit by DoH, and the
obtained results were within this limit in Figure 6.24. In mammography, the limit for
geometry and measurement tools is ± 0.5 cm or ± 2 %. As ± 2 % resulted in a smaller
actual value, this was used as the limit in Figures 6.25 and 6.26. All results were within
these limits.
1300.0
1350.0
1400.0
1450.0
1 2 3 4 5 6 7 8 9 1 0
MEA
SUR
ED V
ALU
E(A
RB
. UN
ITS)
IMAGE NUMBER
STANDARD SIGNAL
Standard signal
Note:Standard signal mean 1381.0 ± 1.6Lines show accepted limit range
Chapter 6 – Reproducibility testing of the universal phantom Chapter 6 – Reproducibility testing of the universal phantom
Stellenbosch University https://scholar.sun.ac.za

153
The universal image quality assurance phantom and the data analysis software are
acceptable routine QC tools in mammography also, giving reproducible results as
deduced from Figures 6.20 to 6.27 and Tables 6.8 and 6.9.
6.4 CT scanning reproducibility testing
Reproducibility testing was also done for CT scanning with exposure parameters as
shown in Table 6.10. The results are recorded in Tables 6.11 and 6.12 and in Figures
6.28 to 6.36.
Table 6.10: Reproducibility testing exposure technique
factors for CT scanning.
Figure 6.28: CT scanning reproducibility images.
Modality CT scanning
Unit Siemens Somatom Definition Edge
kV 120
mAs 385
FFD -
Slice thickness 5 mm
Other 190 cm FOV, CareDose 4D, Pitch 0.8
Chapter 6 – Reproducibility testing of the universal phantom
Stellenbosch University https://scholar.sun.ac.za

154
Table 6.11: CT scanning reproducibility testing visual inspection results.
(Appendix A, A.2.5.4)
The recommendation from DoH is that the low contrast detectability should not vary
by more than + 1 insert size from baseline value. Table 6.11 shows the baseline value
for the CT scanner used is 1 mm3 insert, and the same result was obtained for all ten
images. For positioning and alignment, the central bead should appear on the central
slice, i.e. the slice assigned the zero-position after set-up with lasers and scribe lines.
The accepted tolerance is ± 0.2 cm, however all ten reproducibility images were at the
zero-position. DoH recommends that no artefacts should be visible. However, with
the universal image quality assurance phantom, streak artefact from the central bead
will always exist. This could be lessened if a smaller ball was used. This was not
possible, as explained in section 4.4.1. Streak artefacts from the central bead will
therefore be accepted as normal with the universal image quality assurance phantom.
For image quality visual inspection, the results should remain reproducible. This was
achieved with the ten images.
Image
number
Low contrast
detectability
Positioning
and alignment Artefacts
Image quality visual
inspection
1 1 Correct Streaks from central bead Acceptable
2 1 Correct Streaks from central bead Acceptable
3 1 Correct Streaks from central bead Acceptable
4 1 Correct Streaks from central bead Acceptable
5 1 Correct Streaks from central bead Acceptable
6 1 Correct Streaks from central bead Acceptable
7 1 Correct Streaks from central bead Acceptable
8 1 Correct Streaks from central bead Acceptable
9 1 Correct Streaks from central bead Acceptable
10 1 Correct Streaks from central bead Acceptable
Chapter 6 – Reproducibility testing of the universal phantom
Stellenbosch University https://scholar.sun.ac.za
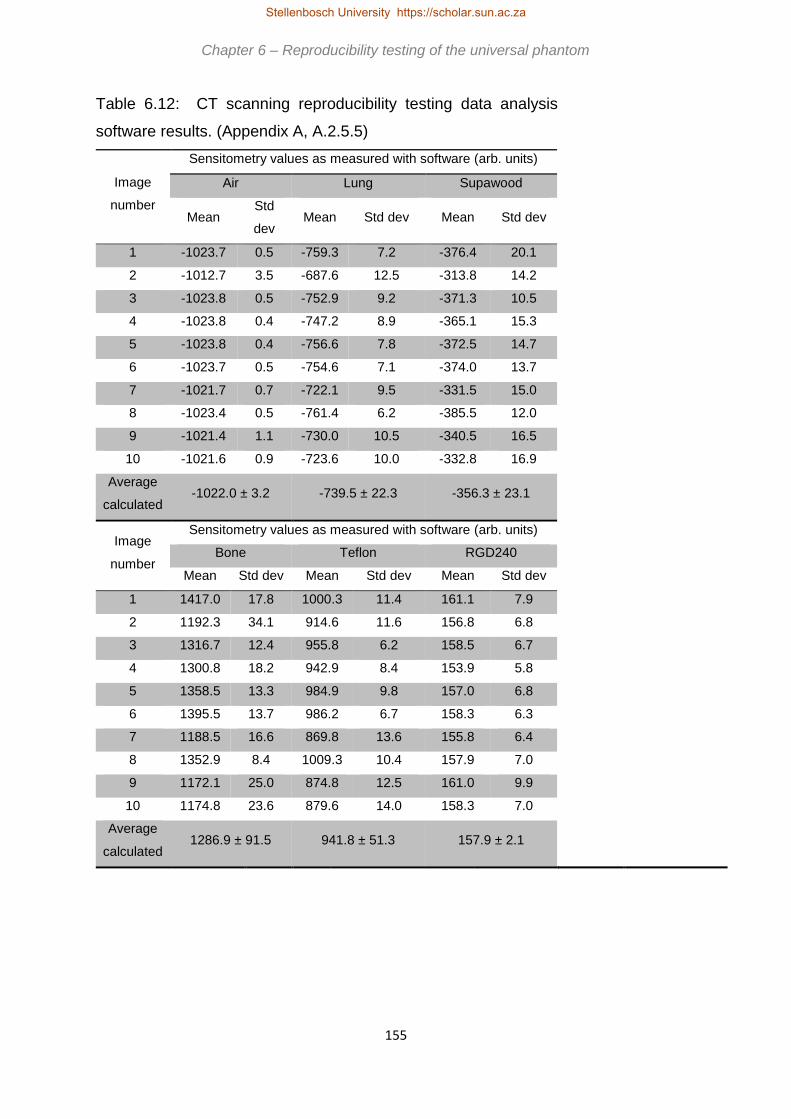
155
Table 6.12: CT scanning reproducibility testing data analysis
software results. (Appendix A, A.2.5.5)
Image
number
Sensitometry values as measured with software (arb. units)
Air Lung Supawood
Mean Std
dev Mean Std dev Mean Std dev
1 -1023.7 0.5 -759.3 7.2 -376.4 20.1
2 -1012.7 3.5 -687.6 12.5 -313.8 14.2
3 -1023.8 0.5 -752.9 9.2 -371.3 10.5
4 -1023.8 0.4 -747.2 8.9 -365.1 15.3
5 -1023.8 0.4 -756.6 7.8 -372.5 14.7
6 -1023.7 0.5 -754.6 7.1 -374.0 13.7
7 -1021.7 0.7 -722.1 9.5 -331.5 15.0
8 -1023.4 0.5 -761.4 6.2 -385.5 12.0
9 -1021.4 1.1 -730.0 10.5 -340.5 16.5
10 -1021.6 0.9 -723.6 10.0 -332.8 16.9
Average
calculated -1022.0 ± 3.2 -739.5 ± 22.3 -356.3 ± 23.1
Image
number
Sensitometry values as measured with software (arb. units)
Bone Teflon RGD240
Mean Std dev Mean Std dev Mean Std dev
1 1417.0 17.8 1000.3 11.4 161.1 7.9
2 1192.3 34.1 914.6 11.6 156.8 6.8
3 1316.7 12.4 955.8 6.2 158.5 6.7
4 1300.8 18.2 942.9 8.4 153.9 5.8
5 1358.5 13.3 984.9 9.8 157.0 6.8
6 1395.5 13.7 986.2 6.7 158.3 6.3
7 1188.5 16.6 869.8 13.6 155.8 6.4
8 1352.9 8.4 1009.3 10.4 157.9 7.0
9 1172.1 25.0 874.8 12.5 161.0 9.9
10 1174.8 23.6 879.6 14.0 158.3 7.0
Average
calculated 1286.9 ± 91.5 941.8 ± 51.3 157.9 ± 2.1
Chapter 6 – Reproducibility testing of the universal phantom
Stellenbosch University https://scholar.sun.ac.za

156
Image
number
Uniformity
(arb.
units)
Limiting
resolution
(cycles/cm)
Image noise
(arb. units)
Geometry and
measurement tools
(mm)
Standard
signal
(arb. units)
SNR CNR Horizontal
value
Vertical
value Mean
Std
dev
1 28.3 3.3 22.8 67.8 20.0 20.0 -71.2 3.8
2 28.3 4.8 22.6 69.1 19.7 20.0 -68.1 3.9
3 27.3 4.8 25.3 59.6 20.4 20.0 -74.2 4.7
4 24.8 4.9 21.2 63.9 20.0 20.4 -69.7 4.4
5 26.8 4.6 23.0 57.1 20.0 20.4 -70.2 4.3
6 29.6 4.6 24.8 66.2 20.4 20.0 -75.9 4.5
7 26.0 4.8 26.6 59.1 19.7 19.7 -70.5 3.7
8 26.8 5.0 26.8 54.5 20.0 20.4 -75.0 4.9
9 27.7 4.8 22.0 61.9 19.7 20.4 -69.0 3.7
10 25.2 5.0 22.7 63.5 19.7 19.7 -67.4 3.6
Average
calculated 27.1±1.4 4.7±0.5 23.8±1.9 62.3±4.5 20.0±0.3 20.1±0.3 -71.1±2.8
Image
number Slice thickness (mm)
1 5.3
2 5.3
3 4.8
4 4.8
5 5.2
6 5.2
7 5.2
8 5.0
9 5.2
10 5.2
Average
calculated 5.1±0.2
Chapter 6 – Reproducibility testing of the universal phantom
Stellenbosch University https://scholar.sun.ac.za

157
Figure 6.29: CT scanning data analysis software reproducibility results for
sensitometry results for bone, Teflon and RGD240 with tolerance limits of ± 10 %.
Figure 6.30: CT scanning data analysis software reproducibility results for
sensitometry for air, lung and supawood with tolerance limits of ± 10 %.
-1300.0
-1100.0
-900.0
-700.0
-500.0
-300.0
-100.0 1 2 3 4 5 6 7 8 9 1 0
MEA
SUR
ED V
ALU
E (A
RB
. UN
ITS)
IMAGE NUMBER
SENSITOMETRY
Air Lung Supawood
Note:Air mean -1022.0 ± 3.2Lung mean -739.5 ± 22.3Supawood mean -356.3 ± 23.1Lines show accepted limit range
0.0
300.0
600.0
900.0
1200.0
1500.0
MEA
SUR
ED V
ALU
E (A
RB
. UN
ITS)
IMAGE NUMBER
SENSITOMETRY
Bone Teflon RGD240
Note: Bone mean 1286.9 ± 91.5 Teflon mean 941.8 ± 51.3 RGD240 mean 157.9 ± 2.1 Lines show accepted limit range
Chapter 6 – Reproducibility testing of the universal phantom
Stellenbosch University https://scholar.sun.ac.za

158
Figure 6.31: CT scanning data analysis software reproducibility results for uniformity
and CNR results with tolerance limits of ± 10 %.
Figure 6.32: CT scanning data analysis software reproducibility results for limiting
resolution with tolerance limits of – 25 % and SNR results with tolerance limits of ± 10
%.
20.0
30.0
40.0
50.0
60.0
70.0
80.0
1 2 3 4 5 6 7 8 9 1 0
MEA
SUR
ED V
ALU
E (A
RB
. UN
ITS)
IMAGE NUMBER
UNIFORMITY AND CNR
Uniformity CNR
Note:Uniformity mean 27.1 ± 1.4CNR mean 62.3 ± 4.5Lines show accepted limit range
0.00
5.00
10.00
15.00
20.00
25.00
30.00
1 2 3 4 5 6 7 8 9 1 0
MEA
SUR
ED V
ALU
E
IMAGE NUMBER
LIMITING RESOLUTION AND SNR
Limiting resolution SNR
Note:Limiting resolution mean 4.7 ± 0.5 (cycles/cm)SNR mean 23.8 ± 1.9 (arb. units)Lines show accepted limit range
Chapter 6 – Reproducibility testing of the universal phantom
Stellenbosch University https://scholar.sun.ac.za

159
Figure 6.33: CT scanning data analysis software reproducibility results for geometry
and measurement tools for horizontal measurement with tolerance limits of ± 5 mm.
Figure 6.34: CT scanning data analysis software reproducibility results for geometry
and measurement tools for vertical measurement with tolerance limits of ± 5 mm.
14.0
17.0
20.0
23.0
26.0
1 2 3 4 5 6 7 8 9 1 0
MEA
SUR
ED V
ALU
E (M
M)
IMAGE NUMBER
GEOMETRY AND MEASUREMENT TOOLS
Geometry horizontal
Note:Geometry horizontal mean 20.0 ± 0.3Lines show accepted limit range
14.0
17.0
20.0
23.0
26.0
1 2 3 4 5 6 7 8 9 1 0
MEA
SUR
ED V
ALU
E (M
M)
IMAGE NUMBER
GEOMETRY AND MEASUREMENT TOOLS
Geometry vertical
Note:Geometry vertical mean 20.1 ± 0.3Lines show accepted limit range
Chapter 6 – Reproducibility testing of the universal phantom
Stellenbosch University https://scholar.sun.ac.za

160
Figure 6.35: CT scanning data analysis software reproducibility results for standard
signal with tolerance limits of ± 10 %.
Figure 6.36: CT scanning data analysis software reproducibility results for slice
thickness with tolerance limits of ± 10 %.
-80.0
-75.0
-70.0
-65.0
-60.0
1 2 3 4 5 6 7 8 9 1 0
MEA
SUR
ED V
ALU
E (A
RB
. UN
ITS)
IMAGE NUMBER
STANDARD SIGNAL
Standard signal
Note:Standard signal mean -71.1 ± 2.8Lines show accepted limit range
3.0
3.5
4.0
4.5
5.0
5.5
6.0
6.5
7.0
1 2 3 4 5 6 7 8 9 1 0
MEA
SUR
ED V
ALU
E (M
M)
IMAGE NUMBER
SLICE THICKNESS
Slice thickness
Note:Slice thickness mean 5.1 ± 0.2Lines show accepted limit range
Chapter 6 – Reproducibility testing of the universal phantom Chapter 6 – Reproducibility testing of the universal phantom
Stellenbosch University https://scholar.sun.ac.za

161
With reference to Figures 6.29 and 6.30 all the sensitometry (or HU linearity) results
were within the ± 10 % limit. A limit of ± 10 % is suggested, although DoH recommends
± 10 HU, as the data analysis software does not measure actual Hounsfield units but
only relative image grey scale values. Figure 6.31 shows that the uniformity results
were reproducible in the allowed ± 10 % limits. For image 8 the CNR was 12.5 % low.
Again, this would mean repetition of the test, according to Figure A.2 in the user’s
manual, and for images 9 and 10 the results were within limits. The limiting resolution
should not decrease by more than 25 % according to DoH. In Figure 6.32 for image
1 the variation was 29.8 %. However the results for all the subsequent images were
within tolerance. For SNR images 4, 7 and 8 fell outside the recommended ± 10 %
limits, with the greatest deviation 12.6 % for image 8. The results for all ten images
were within the accepted limits for geometry and measurement tools for both
horizontal and vertical measurements, as seen in Figures 6.33 and 6.34. For standard
signal, Figure 6.35 and slice thickness, Figure 6.36, the results were within ± 10 % of
the average value, although the accepted tolerance for slice thickness is baseline
value ± 20 %.
From Tables 6.11 and 6.12 and Figures 6.28 to 6.36 it was concluded that the
universal image quality assurance phantom and the data analysis software produced
reproducible results for CT scanning. This implied that the phantom is suitable for
routine CT image quality control.
Chapter 6 – Reproducibility testing of the universal phantom
Stellenbosch University https://scholar.sun.ac.za

162
Chapter 7
Independent validation of the universal phantom package
The universal image quality assurance phantom, user’s manual and data
analysis software were made available to independent medical physicists to evaluate.
The participating institutions were Groote Schuur Hospital (GSH) (Cape Town, South
Africa), Inkosi Albert Luthuli Central Hospital (IALCH) (Durban, South Africa) and
Charlotte Maxeke Johannesburg Academic Hospital (CMJAH) (Johannesburg, South
Africa). Three phantoms were manufactured and CT scanned by the primary
investigator to compare their similarity. As the evaluation of image quality is primarily
dependent on insert density, and the same materials from the same manufacturers
and slabs of plastic as for the primary phantom was used, the phantoms were
sufficiently similar. This was done to save time as a six week period was given to each
institution to work with the package and complete the evaluation sheets. This was
done in addition to their routine work as a favour to the primary investigator. The
participating institutions were completely independent of the primary investigator, and
the medical physicists that performed the analysis and evaluation were unknown. No
bias is therefore expected in the results.
Evaluation was done as per the criteria in Figure 7.2 in general x-rays, fluoroscopy,
mammography and CT scanning. The results from this validation are discussed in this
chapter. Figure 7.1 shows the package that was send to the participating institutions.
Stellenbosch University https://scholar.sun.ac.za

163
Figure 7.1: The universal image quality assurance phantom
package, including the phantom, additional attenuator plates, printed
user’s manual, data analysis software on compact disk and a stand
for set-up at CT scanning, packed into a durable aluminium case.
Figure 7.2 shows examples of the evaluation forms that the independent evaluators
were asked to complete. These compared the universal phantom to the phantoms
routinely used in these institutions. The evaluators were instructed to be honest in
their responses, even if the comments were negative. The phantom, manual and
software were individually scored and the package as a whole was also evaluated. A
simple scoring system of 1 – 5 were used, where 1 indicated that the evaluator strongly
disagreed with the statement and 5 indicated strong agreement with the statement.
This simple scoring technique is often used in comparative evaluations and as it is
easy to follow it also contributes to the aim of the study of making image quality
assurance more accessible, easier and quicker in resource limited institutions. In
addition, participants were asked to include comments and recommendations.
Sections 7.1 to 7.4 discusses the results for general x-rays, fluoroscopy,
mammography and CT scanning and section 7.5 the overall evaluation of the complete
package.
Chapter 7 – Independent validation of the universal phantom package
Stellenbosch University https://scholar.sun.ac.za
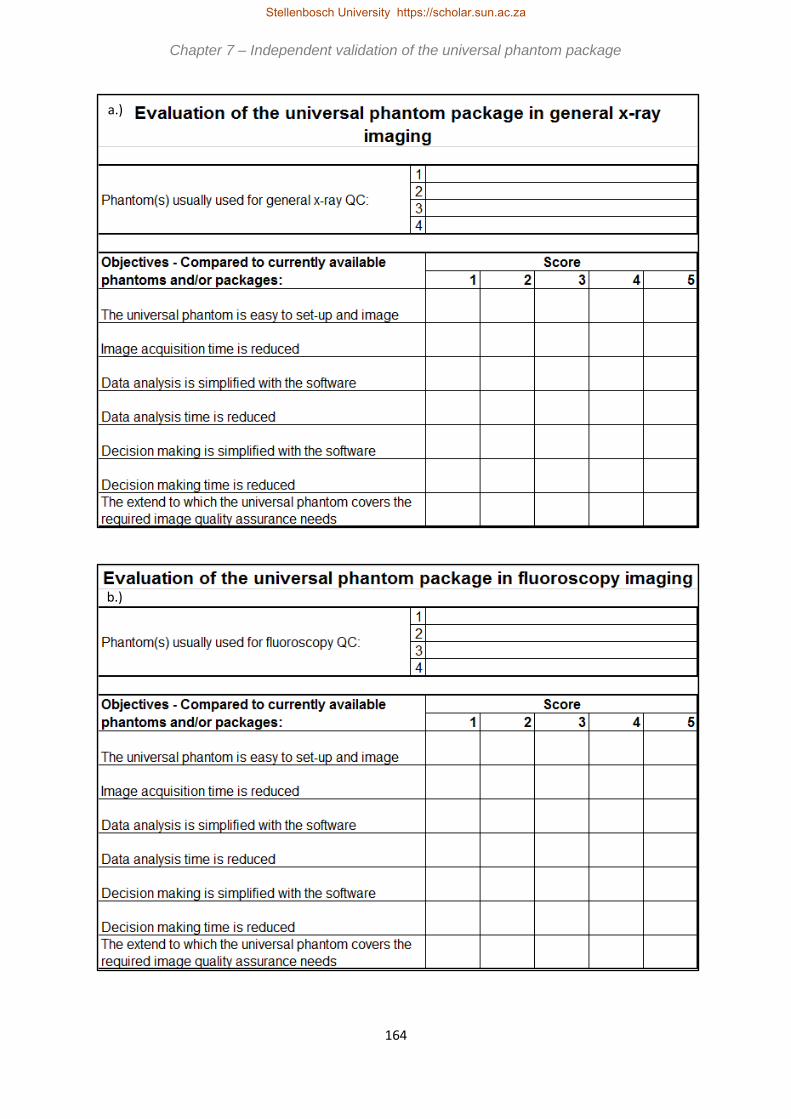
164
a.)
b.)
Chapter 7 – Independent validation of the universal phantom package
Stellenbosch University https://scholar.sun.ac.za

165
c.)
d.)
Chapter 7 – Independent validation of the universal phantom package
Stellenbosch University https://scholar.sun.ac.za

166
Figure 7.2: Evaluation sheets used by the independent evaluators to assess the
universal image quality assurance phantom package and compare it to commercially
available options. a.) Evaluation of the package for general x-ray imaging. b.)
Evaluation of the package for fluoroscopy imaging. c.) Evaluation of the package for
mammography imaging. d.) Evaluation of the package for CT scanning. e.) Overall
evaluation of the package.
e.)
Chapter 7 – Independent validation of the universal phantom package
Stellenbosch University https://scholar.sun.ac.za

167
In Chapter 1 it was indicated that problems identified in resource limited institutions
were cost, man power and expertise and time constraints. For the phantom to be
successfully filling an identified gap in the existing commercial market, it had to
address these problems. The evaluation criteria in Figure 7.2 a.) to d.) were based on
these identified problems. The limitation of cost is addressed by the last criterion,
evaluating the extent to which the phantom covers the QC required in each imaging
modality, i.e. whether the universal image quality assurance phantom was sufficient
as a single phantom solution for comprehensive image QC in each imaging modality.
The criteria addressing ease of phantom set-up, data analysis and decision making
simplification addressed the problem of man power and expertise. The universal
image quality assurance phantom must be easy and simple enough to be successfully
used by equipment operators, like radiographers, in institutions where medical
physicists are not available. For time constraints, the criteria of ease of phantom set-
up, acquisition, data analysis and decision making time reduction and simplification of
data analysis and decision making were included. In addition, allowance was made
for comparison of the universal image quality assurance phantom to the commercially
available phantoms routinely used by the investigators.
To enable overall evaluation of the total package, i.e. the universal image quality
assurance phantom, data analysis software and user’s manual, the criteria in Figure
7.2 e.) were also based on the limitations identified in Chapter 1. The criteria of easy
transport, light to handle, compact and cost effective solution address the cost
limitation. If the phantom package, as shown in Figure 7.1, was robust enough, it
means that one package can be acquired and shared with cheap transport (as it is
compact and lightweight) between different institutions, further reducing costs for
resource limited institutions. For the problem of limited man power and expertise, the
criteria of simple to use, versatile, easy to follow user’s manual, easy to install and
user friendly data analysis software, reliable, reproducible and accurate results and a
direct question on the required level of competence needed to use the phantom were
included. Phantom package versatility and saving of time on data analysis and
decision making were the criteria included to determine if the phantom package
addressed the problem of time constraints.
Chapter 7 – Independent validation of the universal phantom package
Stellenbosch University https://scholar.sun.ac.za

168
1
2
3
4
1 2 3 4 5
Objectives - Compared to currently available
phantoms and/or packages:
The universal phantom is easy to set-up and image
Phantom(s) usually used for general x-ray QC:
Score
Normi 13 Phantom
x
Data analysis is simplified with the software
The extend to which the universal phantom covers the
required image quality assurance needs
Data analysis time is reduced
Decision making is simplified with the software
Decision making time is reduced
Image acquisition time is reduced x
x
Evaluation of the universal phantom package in general x-ray
imaging
x
x
x
x
7.1 General x-ray imaging validation
In general x-ray imaging the universal image quality assurance phantom was
compared to the NORMI 13 and RMI phantoms.
7.1.1 Response from CMJAH
The universal image quality assurance phantom was compared to the Normi 13
phantom by CMJAH for general x-ray imaging, as shown in Figure 7.3.
Figure 7.3: Independent evaluation results from CMJAH for general x-ray imaging.
From Figure 7.3 it is seen that the universal phantom reduces the image acquisition
time, simplifies data analysis and covers all the required image quality assurance tests
needed for general x-rays, as shown by the 5 scores at these criteria. The evaluator
still agreed with the other statements, scoring them at 4. Here a total score of 31 out
of possible 35 indicates that the phantom package is a suitable solution for general x-
ray image quality control.
Chapter 7 – Independent validation of the universal phantom package Chapter 7 – Independent validation of the universal phantom package Chapter 7 – Independent validation of the universal phantom package
Stellenbosch University https://scholar.sun.ac.za

169
7.1.2 Response from GSH
The results from GSH are shown in Figure 7.4, where the RMI phantom was used for
comparison. Compared to the RMI phantom, the universal phantom package was still
scored 29 out of 35, although a poorer score than with the Normi 13 phantom in Figure
7.3 above, it is still a suitable image quality assurance solution. This evaluator found
the phantom very easy to set up compared to the CMJAH evaluator.
Figure 7.4: Independent evaluation results from GSH for general x-ray imaging.
7.1.3 Response from IALCH
The results from IALCH are shown in Figure 7.5. The evaluator compared the
universal phantom to the Normi 13 phantom for general x-ray imaging. A total score
of 31 out of possible 35 was given. The evaluator strongly agrees that the phantom is
easy to set up, that data analysis is simplified with the software and that the package
covers all the image QC required for general x-rays. It is also agreed that time is
reduced, for image acquisition, data analysis and decision making and that the
1
2
3
4
1 2 3 4 5
Evaluation of the universal phantom package in general x-ray
imaging
4
4
4
4
4
Image acquisition time is reduced 4
Data analysis is simplified with the software
The extend to which the universal phantom covers the
required image quality assurance needs
Data analysis time is reduced
Decision making is simplified with the software
Decision making time is reduced
Objectives - Compared to currently available
phantoms and/or packages:
The universal phantom is easy to set-up and image
Phantom(s) usually used for general x-ray QC:
Score
RMI phantom
5
Chapter 7 – Independent validation of the universal phantom package
Stellenbosch University https://scholar.sun.ac.za

170
decision making process is simplified. From this it is determined that the phantom
package is a suitable image QC solution for general x-ray imaging.
Figure 7.5: Independent evaluation results from IALCH for general x-ray imaging.
From the three sets of results two evaluators strongly agreed that the phantom is easy
to set up, the software simplified data analysis and that the package covered all the
required QC for general x-ray imaging. One also strongly agreed that image
acquisition time was reduced. All other criteria were scored 4 by the evaluators,
implying that they still agreed with the criteria statements. It is thus clear that the
universal image quality assurance phantom, user’s manual and data analysis software
is an acceptable, easy to use, cost effective and time saving QC solution for general
x-ray image QC according to the limited evaluation sample.
7.2 Fluoroscopy imaging validation
In fluoroscopy, the universal image quality assurance phantom was compared to the
NORMI 13 and NORMI 4 FLU phantoms by the evaluators.
1
2
3
4
1 2 3 4 5
Objectives - Compared to currently available
phantoms and/or packages:
The universal phantom is easy to set-up and image
Phantom(s) usually used for general x-ray QC:
Score
Normi 13 Phantom
x
Data analysis is simplified with the software
The extend to which the universal phantom covers the
required image quality assurance needs
Data analysis time is reduced
Decision making is simplified with the software
Decision making time is reduced
Image acquisition time is reduced x
x
Evaluation of the universal phantom package in general x-ray
imaging
x
x
x
x
Chapter 7 – Independent validation of the universal phantom package
Stellenbosch University https://scholar.sun.ac.za

171
7.2.1 Response from CMJAH
Figure 7.6 shows the results from CMJAH for fluoroscopy, comparing the universal
image quality assurance phantom to the Normi 13 phantom for fluoroscopy. A total
score of 32 out of 35 was allocated, with the phantom being easy to set up and data
analysis and decision making time simplified and reduced. The evaluator again felt
that the package was a suitable solution for image quality control in fluoroscopy.
Figure 7.6: Independent evaluation results from CMJAH for fluoroscopy imaging.
7.2.2 Response from GSH
In comparison with the Normi 4 Flu phantom in GSH, the universal image quality
assurance package scored lower that at CMJAH. The results are included in Figure
7.7. The evaluator felt that the phantom was not easier to set up and that image
acquisition time was not significantly influenced using the universal phantom
compared to the Normi 4 Flu phantom, scoring 3 (i.e. not agreeing and not disagreeing
with the statements). The total score here was 27 out of 35. As with general x-rays
in Figure 7.4, a score of 4 was given to the last statement, implying that the evaluator
1
2
3
4
1 2 3 4 5
x
Decision making time is reduced x
The extend to which the universal phantom covers the
required image quality assurance needs
Data analysis time is reduced x
Decision making is simplified with the software x
x
Image acquisition time is reduced x
Data analysis is simplified with the software
Objectives - Compared to currently available
phantoms and/or packages:
Score
The universal phantom is easy to set-up and image x
Evaluation of the universal phantom package in fluoroscopy imaging
Phantom(s) usually used for fluoroscopy QC:
Normi 13 Phantom
Chapter 7 – Independent validation of the universal phantom package
Stellenbosch University https://scholar.sun.ac.za

172
still thinks that the phantom does cover the image quality assurance needs, but that
improvements are needed.
Figure 7.7: Independent evaluation results from GSH for fluoroscopy imaging.
7.2.3 Response from IALCH
At IALCH the universal phantom package was compared to the Normi 13 phantom for
fluoroscopy imaging. The results shown in Figure 6.8 are exactly the same as those
in Figure 7.5 for general x-ray imaging. The evaluator agreed with all the criteria, with
a total score of 31 out of 35. The evaluator feels that the phantom is easy to set up,
saves time and simplifies the QC process.
1
2
3
4
1 2 3 4 5
Evaluation of the universal phantom package in fluoroscopy imaging
Phantom(s) usually used for fluoroscopy QC:
Normi 4 FLU Phantom
Objectives - Compared to currently available
phantoms and/or packages:
Score
The universal phantom is easy to set-up and image 3
Image acquisition time is reduced 3
Data analysis is simplified with the software 4
5
Data analysis time is reduced 4
Decision making is simplified with the software
Decision making time is reduced 4
The extend to which the universal phantom covers the
required image quality assurance needs 4
Chapter 7 – Independent validation of the universal phantom package
Stellenbosch University https://scholar.sun.ac.za

173
Figure 7.8: Independent evaluation results from IALCH for fluoroscopy imaging.
Two of the three evaluators strongly agreed that the phantom is easy to set up, the
software simplifies data analysis and that the package covers all the required QC for
fluoroscopy imaging. The third evaluator scored these criteria 4, which means they
still agreed with the statements. One also strongly agreed that decision making is
simplified with the software and that it saves decision making time also. As scores of
4 were given to these criteria by the other evaluators, also with these statements all
the evaluators agreed. All the evaluators agreed with all the other statements, except
for the GSH evaluator who scored 3 for phantom set-up and image acquisition time,
in contrast to the overall scores from the evaluator of 5 for the criteria that the phantom
is easy to use and saves time with data acquisition. According to these results the
universal image quality assurance phantom package is suitable for image QC in
fluoroscopy as it is user friendly and cost and time effective.
7.3 Mammography imaging validation
In mammography, the ACR and SIB phantoms were routinely used by the evaluators
and they compared the universal image quality assurance phantom to these. Due to
1
2
3
4
1 2 3 4 5
x
Decision making time is reduced x
The extend to which the universal phantom covers the
required image quality assurance needs
Data analysis time is reduced x
Decision making is simplified with the software x
x
Image acquisition time is reduced x
Data analysis is simplified with the software
Objectives - Compared to currently available
phantoms and/or packages:
Score
The universal phantom is easy to set-up and image x
Evaluation of the universal phantom package in fluoroscopy imaging
Phantom(s) usually used for fluoroscopy QC:
Normi 13 Phantom
Chapter 7 – Independent validation of the universal phantom package
Stellenbosch University https://scholar.sun.ac.za

174
logistical reasons IALCH was unable to evaluate the phantom package in
mammography. The evaluator could not get access to a mammography unit.
7.3.1 Response from CMJAH
For mammography, CMJAH compared the universal phantom package to the ACR
and SIB phantoms, as shown in Figure 7.9. A total score of 33 out of 35 was allocated
by the evaluator, with the areas of improvement being the saving of time and
simplification of the result analysis with the data analysis software. In section 7.5,
Figure 7.15, it is seen that drawing accurate same sized ROIs is the reason for this.
The universal phantom is however still a definite image quality solution for
mammography.
Figure 7.9: Independent evaluation results from CMJAH for mammography imaging.
1
2
3
4
1 2 3 4 5
x
Decision making time is reduced x
The extend to which the universal phantom covers the
required image quality assurance needs
x
Data analysis time is reduced x
Decision making is simplified with the software
Image acquisition time is reduced x
Data analysis is simplified with the software x
Evaluation of the universal phantom package in mammography
imaging
Objectives - Compared to currently available
phantoms and/or packages:
Score
The universal phantom is easy to set-up and image x
Phantom(s) usually used for mammography QC:
ACR Phantom
SIB Phantom
Chapter 7 – Independent validation of the universal phantom package Chapter 7 – Independent validation of the universal phantom package
Stellenbosch University https://scholar.sun.ac.za

175
7.3.2 Response from GSH
At GSH the universal phantom package was also compared to the ACR phantom,
however this evaluator scored the phantom lower overall, a total of 26 out of 35. The
evaluator does not agree or disagree with the statement that the phantom is easy to
set up and that image acquisition time is reduced, i.e. a score of 3. Even though not
strongly, the evaluator does agree that data analysis and decision making is simplified
and that data analysis time is reduced, and again that some improvements can make
the phantom an even better solution to cover the required image quality assurance
tests. The results are included in Figure 7.10.
Figure 7.10: Independent evaluation results from GSH for mammography imaging.
Both GSH and CMJAH evaluators agreed that the software simplified data analysis
and decision making and reduced data analysis and decision making time. They also
felt that the phantom package covered all the required tests for mammography image
QC. The GSH evaluator scored ease of phantom set up and image acquisition time
reduction at 3, in contradiction to the overall scores for the whole phantom package
1
2
3
4
1 2 3 4 5
Evaluation of the universal phantom package in mammography
imaging
Objectives - Compared to currently available
phantoms and/or packages:
Score
The universal phantom is easy to set-up and image 3
Phantom(s) usually used for mammography QC:
ACR Mammography accreditation phantom
Image acquisition time is reduced 3
Data analysis is simplified with the software 4
Data analysis time is reduced 4
Decision making is simplified with the software 4
Decision making time is reduced 4
The extend to which the universal phantom covers the
required image quality assurance needs4
Chapter 7 – Independent validation of the universal phantom package Chapter 7 – Independent validation of the universal phantom package
Stellenbosch University https://scholar.sun.ac.za

176
where these criteria were scored 5, however the CMJAH evaluator scored them 5.
This was a contradiction in results from this evaluator. It was derived that the universal
image quality assurance phantom, user’s manual and data analysis software form a
complete mammography image QC solution which is cheaper, easier and quicker than
existing commercial phantom QC packages.
7.4 Computed Tomography scanning validation
In CT scanning the universal image quality assurance phantom was compared to the
GE, Phillips and Catphan phantoms.
7.4.1 Response from CMJAH
Figure 7.11 shows the results from CMJAH. The comparative phantoms were the GE
and Phillips phantoms. With a total score of 34 out of 35, it can be concluded that the
universal image quality assurance phantom is a suitable solution for routine image QC
in CT scanning, making set-up, data analysis and decision making easier. Image
acquisition time might be slightly reduced, as the evaluator scored this criterion 4.
Chapter 7 – Independent validation of the universal phantom package
Stellenbosch University https://scholar.sun.ac.za
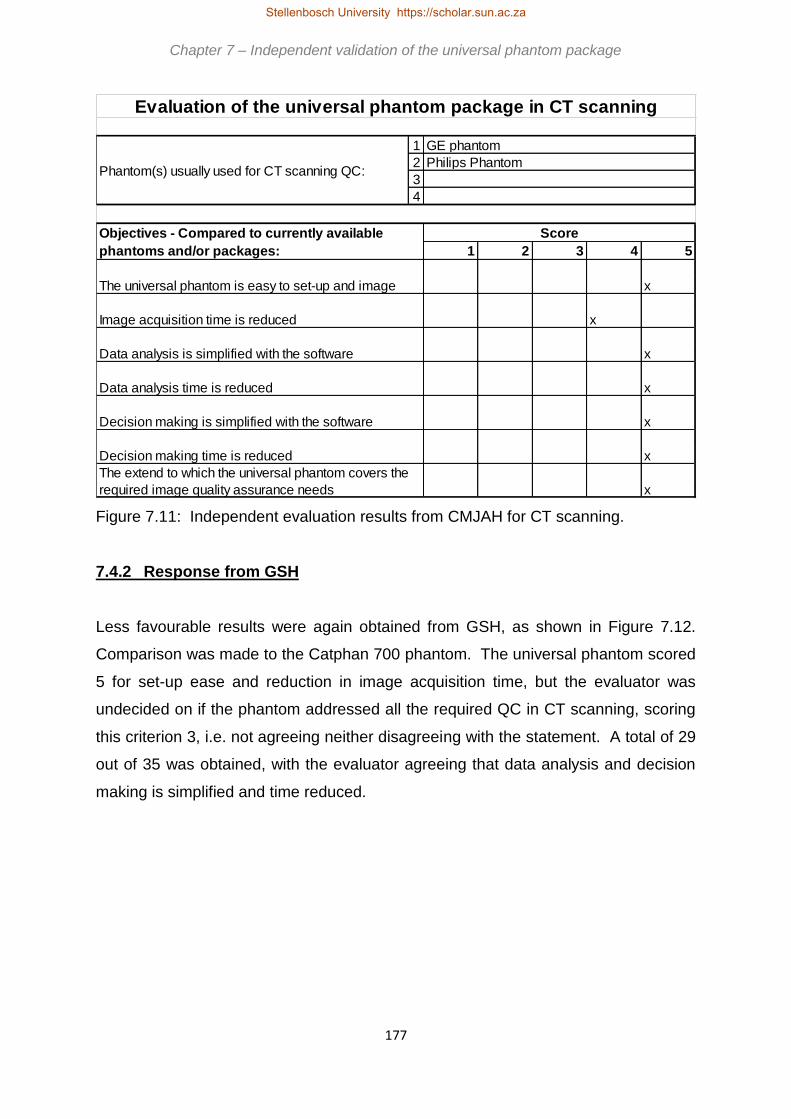
177
Figure 7.11: Independent evaluation results from CMJAH for CT scanning.
7.4.2 Response from GSH
Less favourable results were again obtained from GSH, as shown in Figure 7.12.
Comparison was made to the Catphan 700 phantom. The universal phantom scored
5 for set-up ease and reduction in image acquisition time, but the evaluator was
undecided on if the phantom addressed all the required QC in CT scanning, scoring
this criterion 3, i.e. not agreeing neither disagreeing with the statement. A total of 29
out of 35 was obtained, with the evaluator agreeing that data analysis and decision
making is simplified and time reduced.
1
2
3
4
1 2 3 4 5
x
Decision making time is reduced x
The extend to which the universal phantom covers the
required image quality assurance needs
x
Data analysis time is reduced x
Decision making is simplified with the software
x
Image acquisition time is reduced x
Data analysis is simplified with the software
Objectives - Compared to currently available
phantoms and/or packages:
Score
The universal phantom is easy to set-up and image x
Evaluation of the universal phantom package in CT scanning
Phantom(s) usually used for CT scanning QC:
GE phantom
Philips Phantom
Chapter 7 – Independent validation of the universal phantom package
Stellenbosch University https://scholar.sun.ac.za

178
Figure 7.12: Independent evaluation results from GSH for CT scanning.
7.4.3 Response from IALCH
At IALCH comparison was made to the Catphan phantom, as shown in Figure 6.13.
As with general x-rays and fluoroscopy, the evaluator strongly agreed that the
phantom was easy to set up, the software simplifies data analysis and that the
phantoms covered all the required image QC tests required for CT scanning. The
evaluator also felt that data analysis and decision making time was reduced using the
phantom and that the decision making process was simplified. A score of 3 was given
to the criterion that image acquisition time is reduced, which meant the evaluator
neither agrees nor disagrees with this statement. A total score of 30 out of 35 was
allocated. From this it was clear that the universal image quality assurance package
would be suitable for routine image QC in CT scanning.
1
2
3
4
1 2 3 4 5
Evaluation of the universal phantom package in CT scanning
Phantom(s) usually used for CT scanning QC:
Catphan 700 phantom
Objectives - Compared to currently available
phantoms and/or packages:
Score
The universal phantom is easy to set-up and image 5
Image acquisition time is reduced 5
Data analysis is simplified with the software 4
Data analysis time is reduced 4
Decision making is simplified with the software 4
Decision making time is reduced 4
The extend to which the universal phantom covers the
required image quality assurance needs 3
Chapter 7 – Independent validation of the universal phantom package Chapter 7 – Independent validation of the universal phantom package
Stellenbosch University https://scholar.sun.ac.za

179
Figure 7.13: Independent evaluation results from IALCH for CT scanning.
According to the CMJAH evaluator the universal image quality assurance phantom
package is a great solution for CT image QC, as all criteria were strongly agreed with,
except reduction in acquisition time, with which the evaluator still agreed. The GSH
evaluator strongly agreed that image acquisition time was reduced, but the IALCH
evaluator scored this criterion only 3. All evaluators felt the phantom was easy to set
up, that data analysis and decision making time was reduced and these processes
were simplified using the software. From these results it was expected that for CT
scanning the universal image quality assurance phantom package would be a
comprehensive image QC solution, saving time and cost and being easy to use.
7.5 Evaluation of the complete package
The independent evaluators were also asked to evaluate the complete package, as
seen in Figure 7.2 e.), adding their comments and recommendations for improvements
here.
1
2
3
4
1 2 3 4 5
x
Decision making time is reduced x
The extend to which the universal phantom covers the
required image quality assurance needs
Data analysis time is reduced x
Decision making is simplified with the software x
x
Image acquisition time is reduced x
Data analysis is simplified with the software
Objectives - Compared to currently available
phantoms and/or packages:
Score
The universal phantom is easy to set-up and image x
Evaluation of the universal phantom package in CT scanning
Phantom(s) usually used for CT scanning QC:
Catphan Phantom
Chapter 7 – Independent validation of the universal phantom package
Stellenbosch University https://scholar.sun.ac.za

180
7.5.1 Response from CMJAH
Figure 7.14 shows the results received from CMJAH. The evaluator strongly agreed
that the phantom was easy to transport, simple to use and versatile, that the user’s
manual was easy to understand and follow and that the software was easy to install
and user friendly. The evaluator also agreed with the statements that the phantom
was light and compact and that time was saved, for image acquisition and for data
analysis and decision making. The results obtained were reproducible and the
package was a cost-effective image quality control solution. A score of 3 was allocated
to the level of competence needed to perform the QC, however in the comments the
evaluator does mention that radiographers will be able to successfully use the
phantom package. No score was allocated to whether the results from the phantom
are reliable or accurate. This could be attributed to the fact that the evaluator had very
little time for the evaluation and hence limited experience with the phantom package.
A total score of 57 out of possible 75 was obtained, with two criteria not evaluated.
This implies that the three identified problems from Chapter 1 are addressed by the
phantom package according to this evaluator, i.e. it is cost effective, it saves time and
radiographers can perform the QC in institutions that do not have medical physicists
on staff.
The evaluator also recommended improvements in the software. Indicating the size
of a drawn ROI will ensure same sized ROIs are used in evaluation, giving better and
more reproducible results. Mention of displaying ROI size is also made by the GSH
evaluator, as seen in Figure 7.15. A guide can also be included for drawing the slice
thickness line, as recommended in Figure 7.14. These recommendations will be
incorporated in the final version of the software.
Chapter 7 – Independent validation of the universal phantom package
Stellenbosch University https://scholar.sun.ac.za

181
Figure 7.14: Independent evaluation results from CMJAH for overall evaluation of the
package.
7.5.2 Response from GSH
Figure 7.15 shows the results received from GSH. The evaluator strongly agreed with
the statements that the phantom was easy to transport, light, compact and the
1 2 3 4 5
The universal phantom is easy to transport x
The universal phantom is light to handle x
The universal phantom is compact x
The universal phantom is simple to use x
The universal phantom is versatile x
The user's manual is easy to follow and understand x
The data analysis software is easy to install x
The data analysis software is easy to use x
Using the universal phantom saves time in data acquisition x
Using the software saves time in data analysis and decision making x
Results form the universal phantom package are reliable
Results form the universal phantom package are accurate
Results form the universal phantom package are reproducible x
The level of competence required to use the phantom x
The universal phantom package is a cost effective solution x
Both the softwear and the Phantom are quite user friendly I believe that even radiographers can be able to perform the Qc
successfully.
Limitations of the universal phantom package (please comment below)
The following limitations were noted when using the universal phantom package
The universal image quality assurance phantom:
The universal image quality assurance phantom user's manual:
The universal image quality assurance phantom data analysis software: The softwear doesn’t show the size of the ROIs, so it is
pretty easy to draw ROIs of different sizes and obtain inconsistant values.
When measuring slice thickness, drawing a straight line across the ramp is quite a subjective procedure. when two people
measuring the slice thickness of the same image tend to get different values.
Other comments or recommendations (please comment below)
Objectives - Compared to currently available phantoms and/or packages:
Score
General evaluation of the universal phantom package
Chapter 7 – Independent validation of the universal phantom package
Stellenbosch University https://scholar.sun.ac.za

182
phantom and software were simple to use. Scores of 5 were also given to the criteria
that time was saved on data acquisition. This was in contradiction with the scores of
4 for general x-rays and 3 for fluoroscopy and mammography as seen in Figures 7.4,
7.7 and 7.10. All the other criteria were scored 4 by this evaluator. A total of 66 out of
75 was allocated to the complete package. From these results it is concluded that
according to the GSH evaluator, the universal image quality assurance phantom
package is a compact, versatile, user friendly, cost effective option which does not
require a high level of expertise for successful use, i.e. the aims of the study set in
Chapter 1 were met.
Chapter 7 – Independent validation of the universal phantom package
Stellenbosch University https://scholar.sun.ac.za

183
Figure 7.15: Independent evaluation results from GSH for overall evaluation of the
package.
1 2 3 4 5
The universal phantom is easy to transport 5
The universal phantom is light to handle 5
The universal phantom is compact 5
The universal phantom is simple to use 5
The universal phantom is versatile 4
The user's manual is easy to follow and understand 4
The data analysis software is easy to install 4
The data analysis software is easy to use 5
Using the universal phantom saves time in data acquisition 5
Using the software saves time in data analysis and decision making 4
Results form the universal phantom package are reliable 4
Results form the universal phantom package are accurate 4
Results form the universal phantom package are reproducible 4
The level of competence required to use the phantom 4
The universal phantom package is a cost effective solution 4
Limitations of the universal phantom package (please comment below)
The following limitations were noted when using the universal phantom package
None
The universal image quality assurance phantom user's manual:
None
The universal image quality assurance phantom data analysis software:
The software doesn't display the size/ area of the ROI. If the area can be displayed; I think it would be easy to get similarly sized
ROI when determining the mean and standard deviation of which this will allow some form of reproducibility/repeatability of the
results.
Other comments or recommendations (please comment below)
Objectives - Compared to currently available phantoms and/or packages:
Score
General evaluation of the universal phantom package
Chapter 7 – Independent validation of the universal phantom package
Stellenbosch University https://scholar.sun.ac.za

184
7.5.3 Response from IALCH
Figure 7.16 shows the overall evaluation results received from IALCH. Strong
agreement was found with the criteria that the phantom was easy to transport, versatile
and the software was easy to install. The evaluator also agreed that the phantom was
light to handle, compact, simple to use, the user’s manual and software were easy to
use, decision making and acquisition time was reduced and the package was a cost
effective image QC solution. This was in contrast with the score of 3 given to the
criterion of saving on acquisition time with CT scanning in Figure 7.13. A score of 3
was given to the criteria that the results were reproducible and the level of competence
required to use the phantom package. The criteria of reliable results and accuracy of
results were not scored, as the evaluator had no experience with the phantom package
and did not know what typical results are. These would be established with baseline
testing for each x-ray unit evaluated, and this was not part of the independent
validation request. The comments for improvements in the user’s manual have all
been added to the manual. As with the evaluators from GSH and CMJAH the IALCH
evaluator recommended that ROI size should be displayed in the software. This was
added in the final version of the software. The IALCH evaluator also mentioned, as
the evaluator from CMJAH, that the slice thickness measurement was difficult to
perform objectively. This was also addressed in the final version of the data analysis
software. Unfortunately the concern that the phantom was slippery to the touch cannot
be changed, as this is the texture of the HDPE housing material, which, as explained
in Chapter 4, was the most suitable material for manufacturing the phantom housing.
Chapter 7 – Independent validation of the universal phantom package
Stellenbosch University https://scholar.sun.ac.za

185
Figure 7.16: Independent evaluation results from IALCH for overall evaluation of the
package.
1 2 3 4 5
The universal phantom is easy to transport x
The universal phantom is light to handle x
The universal phantom is compact x
The universal phantom is simple to use x
The universal phantom is versatile x
The user's manual is easy to follow and understand x
The data analysis software is easy to install x
The data analysis software is easy to use x
Using the universal phantom saves time in data acquisition x
Using the software saves time in data analysis and decision making x
Results form the universal phantom package are reliable
Results form the universal phantom package are accurate
Results form the universal phantom package are reproducible x
The level of competence required to use the phantom x
The universal phantom package is a cost effective solution x
Objectives - Compared to currently available phantoms and/or packages:
Score
General evaluation of the universal phantom package
Limitations of the universal phantom package (please comment below)
The following limitations were noted when using the universal phantom package
The universal image quality assurance phantom: Slippery to the touch when taking out of housing
The universal image quality assurance phantom user's manual: Is not clear on some instructions:1. Page 5…Fig A.1b The numbers are labelled 1-20 but 14 seems to have been omitted
2. Page 7…If baseline values are set every major service/repair w ill that not cause a deterioration in the QA results in the case w here the values deviate from commissioning/acceptance
values?
3. Page 14…A2.3.2.h…says a total of 4 exposures…but 0, 2 &4cm is a total of 3 exposures…then another 3 for f louro so it w asn’t clear w here the 4 came from
4. Page 15 (and all other parts w here corrective action is called for)…no corrective action w as taken since not sure if the phantom is patented to have its values used as a reference for
correction
5. Page 16…Fig A10.b..
6. Page 52..typo…it should be CT not Mammo on item A2.5.3.a
7. Page 53..A2.5.4..w hich 4 images for CT?
8. Results spreadsheet..Geometry and measurement tools(distance/accuracy/scaling) expects results for a square but there are no instructions on w hich square to be used…so it w as
assumed the one next to the cylinder.
The software doesn’t specify the size of the ROIs; different sizes give different values.
When measuring slice thickness, drawing a straight line across the ramp is quite a subjective procedure. when two people
measuring the slice thickness of the same image tend to get different values.
Other comments or recommendations (please comment below)
Chapter 7 – Independent validation of the universal phantom package
Stellenbosch University https://scholar.sun.ac.za

186
With the overall evaluation of the entire universal phantom package, two of the
evaluators did not score the criteria stating that the results are accurate. One did not
score the reproducible results criterion and one did not score the reliable results
criterion. The IALCH evaluator scored the reproducible results 3. This was due to the
evaluators using the phantom package for the first time, with no experience on what
results to expect and without any baseline results set for the universal phantom for the
units they evaluated. However, with reference to the reproducibility testing of the
phantom as discussed in Chapter 5, it can be stated with certainty that the results from
the phantom are reproducible within the DoH prescribed tolerance levels.
Overall scores of 3 were given by two observers to the level of competence required
to use the phantom package, however the CMJAH then comments that the phantom
package can be successfully used by radiographers as well, in contradiction to the
score. All other criteria were scored 4 or 5 by the three evaluators, i.e. agreement or
strong agreement with the statements. All evaluators recommended ROI size to be
displayed in the software, and this was added to the final version of the software. Two
of the evaluators also reported the subjective drawing of the line for CT slice thickness,
which was also simplified in the final software version. All recommended user’s
manual comments were incorporated as well.
7.6 Conclusions from independent validation
Further corrections, modifications and improvements to the phantom package were
identified from the major concerns highlighted by the evaluators. The software was
updated to display ROI size as it is drawn, to ensure more accurate results. It would
also assist with drawing the line for slice thickness, which was subjective according to
the evaluators. The recommended improvements were incorporated in the final
version of the user’s manual, included as Appendix A.
The universal image quality assurance phantom, the user’s manual and data analysis
software were independently validated for comprehensive routine image QC in general
x-rays, fluoroscopy, mammography and CT scanning. Although the evaluation sample
size was small, due to logistic, time and financial limitations, which are the identified
problems in resource limited institutions, certain expectations can be made from these
Chapter 7 – Independent validation of the universal phantom package
Stellenbosch University https://scholar.sun.ac.za

187
results. It was expected that the universal image quality assurance phantom, user’s
manual and data analysis software addressed the three problems identified in
resource limited institutions, as discussed in Chapter 1. The phantom thus:
1. Reduces costs as it is versatile and universal, i.e. not modality specific.
2. Addresses time constraints as image acquisition, data analysis and decision
making times are reduced.
3. In response to the man power and expertise constraints the universal image
quality assurance phantom package may be successfully used in institutions
where medical physicists are not available by personnel operating the imaging
equipment. This can be achieved with limited training, by using the step-by-
step user’s manual and intuitive data analysis software. Obtained results may
be send to remote medical physicists or technicians for analysis, especially if
results were out of limits, as recommended in Figure A.2. Also with proper
training, it is hoped that radiographers would find this tool sufficiently user
friendly so that it can be implemented more widely.
It is recommended that a larger evaluation population should be nominated to draw
concrete conclusions from these expectations, and that this population should include
radiographers. The phantom package is currently (September 2017) being evaluated
by South African National Accreditation System (SANAS) accredited inspection bodies
(IBs), i.e. by Siemens and East Cape X-Ray IBs. These institutions will report to DoH
on the applicability, cost effectiveness and universal nature of the phantom for routine
image QC in South Africa, making it a commercially viable option, recognised by DoH,
for resource limited institutions.
Chapter 7 – Independent validation of the universal phantom package
Stellenbosch University https://scholar.sun.ac.za

188
Chapter 8
Conclusion
In diagnostic radiology, image quality must be maintained at clinically
acceptable levels to prevent repeated examinations, misdiagnosis and oversights. To
ensure this, routine image quality control is performed. This aids in the identification
of faulty equipment and identifies image quality degradation before patient care is
affected. Image quality is quantified using suitable phantoms. However commercially
available phantoms could in some cases be expensive, complicated and time
consuming to use. These are the problems that were identified in this study, i.e.
inadequate funds, manpower and expertise and time constraints, especially
considering the number of different phantoms that might be required to cover the
needs of a radiology department. These problems are especially amplified in resource
limited institutions and countries, such as many in Africa and including South Africa.
The aim of the study was to simplify routine image quality control by developing a
universal image quality assurance phantom that is cheap to manufacture, easy to use
and not modality specific. This phantom would enable the operator to do
comprehensive routine constancy check image quality control in general x-rays,
fluoroscopy and mammography imaging and computed tomography (CT) scanning,
with acceptable accuracy using a single phantom. A user’s manual and data analysis
software would assist the operator to setup the phantom and analyse results. This
research was privately funded by the principal investigator and through a Harry
Crossley bursary awarded to the principal investigator by Stellenbosch University.
A literature review on the physics of image formation was done in Chapter 2. The
different interaction mechanisms of x-rays with materials and their influence on image
quality were discussed. Image quality was defined in terms of contrast, resolution and
noise and the equations needed to calculate these were included. The South African
situation was highlighted in Chapter 2, showing the lack of medical physicists
employed in diagnostic radiology both in private and in government institutions,
Stellenbosch University https://scholar.sun.ac.za

189
emphasizing the importance of this research. The Department of Health (DoH)
requirements for image quality control (QC) in South Africa were summarized and
these were used for reproducibility testing tolerance levels in Chapter 5.
The physics involved in the formation of x-ray produced images was considered for
the imaging modalities investigated and the image quality assurance parameters that
should be assessed for each imaging modality were determined. An in-depth literature
review was done into current* image quality assurance phantoms commercially
available. The advantages, disadvantages and design of these phantoms were
considered. This knowledge, together with the physics of x-ray interactions in the
diagnostic radiology energy range, was used to design a prototype phantom.
A prototype phantom design, based on conclusions from literature, was practically
discussed with an engineer, machining limitations were identified and the design had
to be adapted. For example, spherical inserts which would take advantage of
spherical symmetry in different set up orientations of the phantom for planar imaging
and CT scanning, could not be used. Spheres would be difficult and very expensive
to manufacture and would also need to be large due to differences in attenuation of
the incident x-ray beam through the sphere. These limitations were considered and a
prototype phantom was manufactured, as described in Chapter 4. The prototype was
validated by comparing it to commercially available phantoms.
The shortcomings of the prototype were addressed and a redesigned universal image
quality assurance phantom was developed. This phantom was smaller than the
prototype and contained smaller inserts for mammography fibres, micro-calcifications
and masses, low contrast detectability and thinner sensitometry inserts, to minimise
geometrical distortion in mammography. It also had a flat side to aid in phantom
orientation during set up and for easy set up on a flat stand for CT scanning.
Data analysis software was written by a software programmer and the principal
investigator compiled a complete step-by-step user’s manual for analysing the images
obtained with this phantom.
* This is implied as at the time of writing in 2016.
Chapter 8 – Conclusion
Stellenbosch University https://scholar.sun.ac.za

190
The phantom passed rigorous reproducibility testing in all imaging modalities and it
was concluded that the results from the phantom were reproducible to within the limits
stipulated by DoH, as discussed in Chapter 6. In Chapter 7 the phantom package
(phantom, software and manual) was validated by three independent evaluators. They
compared the universal image quality assurance phantom package to commercially
available phantom options. All agreed that the phantom package was easy to
transport, simple to use, compact and light, versatile and a cost-effective image quality
control solution. It also saves time in image acquisition, data analysis and decision
making. It was also mentioned that it can be successfully used by radiographers in
institutions where medical physicists are not employed. The limitations mentioned by
the evaluators included improving the data analysis software to display region of
interest (ROI) size, to minimise bias when drawing the slice thickness ramp and
updating the user’s manual. These changes have already been made.
According to the results from the independent evaluators, although a small sample
size for evaluation, it was expected that the universal phantom, user’s manual and
data analysis software offered an acceptable solution for comprehensive routine
image QC for diagnostic radiology x-ray imaging modalities, especially for consistency
purposes. It was simple to use and implement, with clear instructions, ensuring
suitability for the full spectrum of diagnostic radiology practices and clinics, including
those with maximum workload using CT, mammography, general x-rays (including
mobile x-ray units) and fluoroscopy, to small clinics using a single or only a few imaging
units with fewer patients. The phantom was compact, robust, easy to use and cheaper
to manufacture, addressing the above mentioned problems and answering the aims
of the study.
The limitations of the universal image quality assurance phantom are:
a.) Encountered machining limitations. The method of manufacturing the phantom
is human based, as the inserts are placed in the machined phantom housing by hand.
This introduces some inaccuracies in placement and dimensions of the inserts. As
the manufacturing equipment at Gebratech Advanced Engineering is not designed for
optimal use at the small scales encountered in phantom manufacturing, the accuracy
of the manufacturing of the phantom inserts can be improved, at an increased cost.
However, it is important to note the image quality evaluation that the universal
Chapter 8 – Conclusion
Stellenbosch University https://scholar.sun.ac.za

191
phantom is intended for, i.e. consistency testing, depends primarily on the densities of
the housing material and different inserts. As the same materials are used in each
phantom, the variation between different phantoms will be minimal. It is advised that
baseline values should be set for every individual phantom and that only that phantom
should be used routinely, i.e. cross population of results is not recommended. As
region of interest analysis is used in most image QC tests, small variations in insert
size and position will not affect obtained results and are not a major concern. Most
importantly, the density of the different materials should not vary noticeably. With cost
one of the identified problems in resource limited institutions, improved accuracy and
smaller machining tolerances must be weighed up against increased manufacturing
costs to achieve these. For routine image QC, comparing the results from a certain
phantom to its set baseline results, improving the manufacturing will increase the
costs, contradicting one of the aims of the study, with no real gain in obtained results.
However, for acceptance testing this does not apply.
b.) Another limitation is that the universal image quality assurance phantom is not
suitable for acceptance testing, where accurate results are required to ensure
equipment conforms to specifications, but it is a good tool for routine image QC
consistency testing, comparing routine results to baseline values set at
commissioning.
c.) The phantom can also not measure Hounsfield unit (HU) linearity in CT
scanning, rather just an indication of CT number consistency for different inserts, as
the linear attenuation coefficients of the insert materials are not known.
d.) As discussed in Chapter 4, the slice thickness in only applicable for 5 mm slice
thickness or larger. A correction for the thickness dimension, i.e. 3 mm, of the ramp
is needed, as well as a correction of the angle at which it is placed in the phantom, i.e.
38o. These two corrections, in this setting, cancel out, which means the projected
image is the actual slice thickness and can be measured. The ramp would not be able
to assess slice thicknesses smaller than its thickness. More accurate results can be
obtained, as discussed in Chapter 4, but again at a significant cost increase, and as
the current design is quite suitable for routine image QC consistency testing, such
increased expensed would defy the cost reduction purpose of the phantom.
e.) There is a limitation on the imageable area that can be assessed for non-
uniformities due to the limited dimension, i.e. 170 mm of the phantom. Image quality
is assessed only within this dimension. With tests like uniformity or the presence of
Chapter 8 – Conclusion
Stellenbosch University https://scholar.sun.ac.za

192
artefacts for example, errors could exist outside the phantom dimensions and these
would be missed.
f.) The results from the phantom are not yet recognised by the DoH in South Africa,
proving that it is an acceptable routine QC solution in our country, and with South
African Bureau of Standards (SABS) endorsement the phantom package could
address the problems in resource limited institutions internationally.
It is important to note that the phantom package does not substitute medical physics
knowledge, and when problems in routine image QC are encountered a medical
physicist and/or equipment technician should still be contacted. The phantom
package is only intended to simplify routine image QC and to make QC available in
institutions affected by the identified problems. Further improvements include refining
of the phantom packaging case, to be even more compact with better internal design
for holding the different components.
The universal image quality assurance phantom, user’s manual and data analysis
software will make comprehensive routine consistency checking x-ray image quality
control in diagnostic radiology easier, quicker, cheaper (with a manufacturing cost of
the phantom package of less than R 15 000 per unit) and available to resource limited
institutions. It will fill an identified gap in the existing market, as an additional option
to the current* commercially available phantoms, protected under the PCT
International Patent Application No. PCT/IB2016/051165.
* This is implied as at the time of writing in 2016.
Chapter 8 – Conclusion
Stellenbosch University https://scholar.sun.ac.za

193
Bibliography
1. Dance, D.R., Christofides, S., Maidment, A.D.A., et al. 2014. Diagnostic
radiology physics - a handbook for teachers and students. 1st ed. Ch 1. Austria:
IAEA.
2. Dance, D.R., Christofides, S., Maidment, A.D.A., et al. 2014. Diagnostic
radiology physics - a handbook for teachers and students. 1st ed. Ch 19.
Austria: IAEA.
3. Reis, C., Pascoal, A., Sakellaris, T., Koutalonis M. 2013. Quality assurance and
quality control in mammography: a review of available guidance worldwide.
Insights Imaging, 4, p.539-553.
4. Task group no 7 - diagnostic x-ray imaging. 1990. Equipment requirements and
quality control for mammography. AAPM Report No 29, p.32-69.
5. Diagnostic radiology committee task force on quality assurance protocol. 1977.
Basic quality control in diagnostic radiology. AAPM Report No 4, p.1-51.
6. Report task group no 12 – diagnostic x-ray imaging committee. 2002. Quality
control in diagnostic radiology. AAPM Report No 74, p.1-56.
7. Department of Health, directorate radiation control. 2014. Requirements for
licence holders with respect to quality control tests for diagnostic radiology x-
ray imaging systems. Code: Diagnostic QC, 8, p.4-26.
8. Dance, D.R., Christofides, S., Maidment, A.D.A., et al. 2014. Diagnostic
radiology physics - a handbook for teachers and students. 1st ed. Ch 7. Austria:
IAEA.
9. Bushberg, J.T., Deibert, J.A., Leidholdt, E.M., Boone, J.M. 2012. The essential
physics of medical imaging. 3rd ed. Ch 1. Philadelphia: Lippincott Williams &
Wilkens.
10. Bushberg, J.T., Deibert, J.A., Leidholdt, E.M., Boone, J.M. 2012. The essential
physics of medical imaging. 3rd ed. Ch 6. Philadelphia: Lippincott Williams &
Wilkens.
Stellenbosch University https://scholar.sun.ac.za

194
11. Dance, D.R., Christofides, S., Maidment, A.D.A., et al. 2014. Diagnostic
radiology physics - a handbook for teachers and students. 1st ed. Ch 2. Austria:
IAEA.
12. Bushberg, J.T., Deibert, J.A., Leidholdt, E.M., Boone, J.M. 2012. The essential
physics of medical imaging. 3rd ed. Ch 3. Philadelphia: Lippincott Williams &
Wilkens.
13. Dance, D.R., Christofides, S., Maidment, A.D.A., et al. 2014. Diagnostic
radiology physics - a handbook for teachers and students. 1st ed. Ch 11.
Austria: IAEA.
14. Bushberg, J.T., Deibert, J.A., Leidholdt, E.M., Boone, J.M. 2012. The essential
physics of medical imaging. 3rd ed. Ch 4. Philadelphia: Lippincott Williams &
Wilkens.
15. Dance, D.R., Christofides, S., Maidment, A.D.A., et al. 2014. Diagnostic
radiology physics - a handbook for teachers and students. 1st ed. Ch 4. Austria:
IAEA.
16. Bushberg, J.T., Deibert, J.A., Leidholdt, E.M., Boone, J.M. 2012. The essential
physics of medical imaging. 3rd ed. Ch 6. Philadelphia: Lippincott Williams &
Wilkens.
17. Bushberg, J.T., Deibert, J.A., Leidholdt, E.M., Boone, J.M. 2012. The essential
physics of medical imaging. 3rd ed. Ch 10. Philadelphia: Lippincott Williams &
Wilkens.
18. Bushberg, J.T., Deibert, J.A., Leidholdt, E.M., Boone, J.M. 2012. The essential
physics of medical imaging. 3rd ed. App G4. Philadelphia: Lippincott Williams &
Wilkens.
19. Department of Health, directorate radiation control. ECRI codes and X-ray
totals per ECRI. [Email]. (Personal communication with Mr E Smit from
Radiation Control, 17 March 2016) Available at: [email protected]
20. South African Association of Physicists in Medicine and Biology. SAAPMB
members. [Email]. (Personal communication with Ms T du Plessis, secretary of
SAAPMB, 15 February 2016) Available at: Tamarisk Du Plessis
21. Bushberg, J.T., Deibert, J.A., Leidholdt, E.M., Boone, J.M. 2012. The essential
physics of medical imaging. 3rd ed. Ch 11. Philadelphia: Lippincott Williams &
Wilkens.
Bibliography
Stellenbosch University https://scholar.sun.ac.za

195
22. Guidelines and standards committee - medical physics. 2011. ACR technical
standard for diagnostic medical physics performance monitoring of radiographic
and fluoroscopic equipment. ACR technical standard resolution 4, p.1-4.
23. Committee on quality assurance in diagnostic x-ray. 2001. Quality control
recommendations for diagnostic radiography volume 3: radiographic or
fluoroscopy machines. Conference of Radiation Control Program Directors, Inc.
p.1-61.
24. Leeds test objects. TOR CDR. 2017. [online]. Available at:
http://www.leedstestobjects.com/index.php/phantom/tor-cdr/ [accessed 25
September 2013]
25. User manual Normi® 13. PTW Freiburg. Available from:
[email protected] [accessed 2 November 2015]
26. Dance, D.R., Christofides, S., Maidment, A.D.A., et al. 2014. Diagnostic
radiology physics - a handbook for teachers and students. 1st ed. Ch 8. Austria:
IAEA.
27. Bushberg, J.T., Deibert, J.A., Leidholdt, E.M., Boone, J.M. 2012. The essential
physics of medical imaging. 3rd ed. Ch 9. Philadelphia: Lippincott Williams &
Wilkens.
28. Leeds test objects. TOR 18FG. 2017. [online]. Available at:
http://www.leedstestobjects.com/index.php/phantom/tor-18fg/ [accessed 25
September 2013]
29. CIRS tissue simulation & phantom technology. RD/FL contrast resolution test
phantom. 2013. [online]. Available at: http://www.meditron.ch/industrial-and-
research/downloads/L647_DS_120913.pdf [accessed 25 September 2013]
30. Universal Medical. CIRS L600 fluoroscopic alignment device. 2017. [online].
Available at: http://www.hnamedical.com/product/radiology/phantoms-
cirs/fluoroscopic-alignment-device/ [accessed 25 September 2013]
31. JRT Associates. Pro-RF HighRes. 2015. [online]. Available at:
http://jrtassociates.com/pro-rfhighres.aspx [accessed 2 February 2016]
32. JRT Associates. Fluoro-test resolution tool. 2015. [online]. Available at:
http://jrtassociates.com/fluoro-testresolutiontool.aspx [accessed 26 March
2014]
33. Fluke Biomedical. Fluoro-test tool. 1995. [online]. Available at:
http://www.flukebiomedical.com/biomedical/usen/diagnostic-imaging-
Bibliography
Stellenbosch University https://scholar.sun.ac.za

196
qa/radiography-fluoroscopy/07-645-fluoro-test-tool.htm?pid=54332 [accessed
26 March 2014]
34. Fluke Biomedical. CDRH fluoroscopic phantom. 1995. [online]. Available at:
http://www.flukebiomedical.com/biomedical/usen/diagnostic-imaging-
qa/radiography-fluoroscopy/07-649-cdrh-fluoroscopic-phantom.htm?pid=54334
[accessed 26 March 2014]
35. Radcal. SFS set. 2011. [online]. Available at: http://www.el-se.com/wp-
content/uploads/2016/02/SFS-SET-product-specifications.pdf [accessed 26
March 2014]
36. JRT Associates. R/F QC phantom. [online]. Available at:
http://jrtassociates.com/pdfs/07-647.pdf [accessed 25 September 2013]
37. Medical Device Depot Inc. Radiography fluoroscopy AQ phantom. 2015.
[online]. Available at: http://www.medicaldevicedepot.com/Radiography-
Fluoroscopy-QA-Phantom-p/903.htm [accessed 25 September 2013]
38. JRT Associates. Gammex radiographic/fluoroscopic kit. [online]. Available at:
http://jrtassociates.com/pdfs/184d.pdf [accessed 26 March 2014]
39. Fluke Biomedical. Fluoroscopic imaging test phantom. 1995. [online]. Available
at: http://www.flukebiomedical.com/biomedical/usen/diagnostic-imaging-
qa/radiography-fluoroscopy/07-653-fluoroscopic-imaging-test-
phantom.htm?pid=54337 [accessed 26 March 2014]
40. Rauch, P. Fluoroscopic imaging equipment guidelines for detector input dose
settings and image optimization. Henry Ford Health Systems. 2009. [online].
Available at: http://www.aapm.org/meetings/amos2/pdf/42-11966-85041-
390.pdf [accessed 25 September 2013]
41. PTW Freiburg. Normi® Rad/Flu. 2012. [online]. Available at:
http://www.ptw.de/normi_rad-flu_test_object0.html?&cId=4194 [accessed 1
November 2015]
42. PTW Freiburg. Normi® Rad/Flu. 2012. [online]. Available at:
http://ptw.de/2856.html [accessed 4 February 2016]
43. User manual Normi® 3 + 4. PTW Freiburg. 1987. Available from:
[email protected] [accessed 2 November 2015]
44. Dance, D.R., Christofides, S., Maidment, A.D.A., et al. 2014. Diagnostic
radiology physics - a handbook for teachers and students. 1st ed. Ch 9. Austria:
IAEA.
Bibliography
Stellenbosch University https://scholar.sun.ac.za

197
45. Task group no 7 - diagnostic x-ray imaging. 1990. Equipment requirements and
quality control for mammography. AAPM Report No 29, p.1-31.
46. Bushberg, J.T., Deibert, J.A., Leidholdt, E.M., Boone, J.M. 2012. The essential
physics of medical imaging. 3rd ed. Ch 8. Philadelphia: Lippincott Williams &
Wilkens.
47. De las Heras, H., Schöfer, F., Tiller, B. et al. 2013. A phantom using titanium
and Landolt rings for image quality evaluation in mammography. Physics in
Medicine and Biology, 58, p.L17-L30.
48. JRT Associates. Mammographic accreditation phantom Gammex 156. 2015
[online]. Available at:
http://jrtassociates.com/mammographicaccreditationphantom.aspx [accessed
25 September 2013]
49. JRT Associates. Stereotactic mammographic accreditation phantom Gammex
156D. [online]. Available at: http://jrtassociates.com/pdfs/156d.pdf [accessed 25
September 2013]
50. JRT Associates. Tissue equivalent phantom for mammography. [online].
Available at: http://jrtassociates.com/pdfs/011a.pdf [accessed 25 September
2013]
51. JRT Associates. Routine mammographic QC kit. [online]. Available at:
http://jrtassociates.com/pdfs/183.pdf [accessed 25 September 2013]
52. JRT Associates. Mammography QA package. [online]. Available at:
http://jrtassociates.com/pdfs/c_mammo_kit.pdf [accessed 25 September 2013]
53. JRT Associates. Special high contrast resolution phantom. [online]. Available
at: http://jrtassociates.com/pdfs/c_016b.pdf [accessed 25 September 2013]
54. JRT Associates. Single exposure high contrast resolution phantom. 2011.
[online]. Available at: http://jrtassociates.com/pdfs/016a.pdf [accessed 25
September 2013]
55. JRT Associates. Artifact identification phantom. 2015. [online]. Available at:
http://jrtassociates.com/artifactidentificationphantom.aspx [accessed 25
September 2013]
56. JRT Associates. Contrast detail phantom for mammography. [online]. Available
at: http://jrtassociates.com/pdfs/18-252.pdf [accessed 25 September 2013]
57. JRT Associates. Mammography BR3D phantom. [online]. Available at:
http://jrtassociates.com/pdfs/c_020.pdf [accessed 25 September 2013]
Bibliography
Stellenbosch University https://scholar.sun.ac.za

198
58. JRT Associates. Mammography BR3D phantom. [online]. Available at:
http://jrtassociates.com/pdfs/c_017_018.pdf [accessed 25 September 2013]
59. User manual Normi® PAS. PTW Freiburg. 2013. Available from:
[email protected] [accessed 2 November 2015]
60. Smith, S.W. 1997. The scientist and engineer’s guide to digital signal
processing. [e-book]. 1st ed. DSP: San Diego. Available at:
http://www.dspguide.com/ [accessed 11 January 2016]
61. Diagnostic radiology committee task force on CT scanner phantoms. 1977.
Phantoms for performance evaluation and quality assurance of CT scanners.
AAPM Report No 1, p.1-23.
62. McCollough, C.H., Bruesewitz, M.R., McNitt-Gray, M.F. et al. 2004. The
phantom portion of the American College of Radiology (ACR) Computed
Tomography (CT) accreditation program: practica tips, artifact examples, and
pitfalls to avoid. Medical Physics, 31 (9), p.2423-2442.
63. McCollough, C.H. CT accreditation program: image quality and dose
measurements. 2003. [online]. Available at:
https://www.aapm.org/meetings/03AM/pdf/9785-27333.pdf [accessed 11
January 2016]
64. Gammex. ACR CT accreditation phantom. 2015. [online]. Available at:
https://www.sunnuclear.com/documents/datasheets/gammex/ct_acr_464_phant
om.pdf [accessed 17 December 2013]
65. Gammex. Head/body CT phantom. 2017. [online]. Available at:
http://test.gammex.netphoria.com/n-
portfolio/productpage.asp?id=321&category=Diagnostic+Radiology&name=He
ad%2FBody+CT+Phantom%2C+Gammex+461A [accessed 17 December
2013]
66. CIRS tissue simulation & phantom technology. AAPM CT performance
phantom. 2017. [online]. Available at:
http://www.cirsinc.com/products/all/31/aapm-ct-performance-phantom/
[accessed 17 December 2013]
67. JRT Associates. Mammography BR3D phantom. [online]. Available at:
http://jrtassociates.com/pdfs/c_610.pdf [accessed 17 December 2013]
Bibliography
Stellenbosch University https://scholar.sun.ac.za

199
68. Universal Medical. Spiral/Helical CT phantom. 2012. [online]. Available at:
http://cspmedical.com/content/110-1063_061_spiral_ct_phantom.pdf [accessed
25 September 2013]
69. The phantom laboratory. Catphan® 600 CT phantom. [online]. Available at:
https://www.phantomlab.com/catphan-600 [accessed 17 December 2013]
70. JRT Associates. Catphan® 500/600. [online]. Available at:
http://jrtassociates.com/pdfs/Catphan.pdf [accessed 17 December 2013]
71. Chiarot, C.B., Siewerdsen, J.H., Haycocks, T. et al. 2005. An innovative
phantom for quantitative and qualitative investigation of advanced x-ray
imaging technologies. Physics in Medicine and Biology, 50, p.N287-N297.
72. Groenewald, A., Groenewald, WA. 2014. In-house development of a neonatal
chest simulation phantom. Journal of Applied Clinical Medical Physics, 15 (3),
p.282-296.
73. Groenewald, A., Groenewald, W.A. 2014. Cancer Induction to Neonates
Receiving Anterior-Posterior Chest X-Rays. Global Journal of Science Frontier
Research, 14 (3), p.32-39.
74. Gartech Engineering Plastics. Density of plastics. [Email]. (Personal
communication with Mr C Vine-Soanes from Gartech Engineering Plastics, 18
March 2015) Available at: http://www.gartech.co.za / [email protected]
75. Goodfellow Catalogue., 2012. Polyamide/imide sheet and Polyethylene – High
density, [online]. Available at: http://www.goodfellowusa.com/A/Polyethylene-
High-density.html [accessed 22 March 2012]
76. Protolink3D. Density specifications for ABS, PLA and Hips. [Email]. (Personal
communication with local representative, Mr M Havinga from Protolink3D, 6
November 2014) Available at: http://www.prolink3d.co.za /
77. Gammex RMI©. Specifications Gammex 457, 450, 452, 453, 454, 455, 456.
[Email]. (Personal communication with local Gammex representative, Mr G
Corazza from CM Nuclear Systems c.c., 8 December 2010)
78. The phantom laboratory. Catphan® 500 and 600 manual. 2006. [online].
Available at:
http://www.uio.no/studier/emner/matnat/fys/FYS4760/v13/obligatorisk-oppgave-
ct/catphan500-600manual.pdf [accessed 2 November 2015]
Bibliography Bibliography
Stellenbosch University https://scholar.sun.ac.za

Ai
Appendix A Universal image quality assurance phantom user’s manual
This manual forms part of the research presented in partial fulfilment of the
requirements for the degree of PhD (Medical Physics) in the Faculty of Medicine and
Health Sciences at Stellenbosch University. The research proposal is the intellectual
property of Stellenbosch University under the PCT International Patent Application No.
PCT/IB2016/051165.
Stellenbosch University https://scholar.sun.ac.za

Aii
Table of contents
Heading Page
A.1 General information A1
A.1.1 Intended use A1
A.1.2 Safety information A2
A.2 Operating manual A3
A.2.1 Acceptance testing versus routine QC A7
A.2.2 Installing the data analysis software on your computer A8
A.2.3 General x-ray and fluoroscopy imaging A11
A.2.3.1 Phantom set-up A12
A.2.3.2 Phantom exposure A13
A.2.3.3 Load images into data analysis software A14
A.2.3.4 Visual inspection of the obtained images A15
a.) Low contrast detectability A15
b.) Positioning and alignment (x-ray/light beam centring) A15
c.) Artefacts A16
d.) Image quality visual inspection A16
A.2.3.5 Data analysis software evaluation of the obtained images A17
a.) Sensitometry and grey scale linearity (optical density consistency) A17
b.) Uniformity A18
c.) Resolution A20
d.) Image noise A22
e.) Geometry & measurement tools (distance accuracy/scaling errors) A23
f.) Standard signal A25
A.2.3.6 Automatic exposure control (AEC) results A26
a.) AEC performance A26
b.) AEC repeatability A26
A.2.3.7 Saving and printing the results A27
A.2.4 Mammography imaging A30
A.2.4.1 Phantom set-up A32
A.2.4.2 Phantom exposure A32
A.2.4.3 Load images into data analysis software A34
A.2.4.4 Visual inspection of the obtained images A35
a.) Low contrast detectability A35
b.) Positioning and alignment (x-ray/light beam centring) A35
c.) Artefacts A35
d.) Image quality visual inspection A35
e.) Fibres A36
Appendix A – Universal image quality assurance phantom user’s manual Appendix A – Universal image quality assurance phantom user’s manual
Stellenbosch University https://scholar.sun.ac.za

Aiii
f.) Masses A36
g.) Micro-calcifications A36
A.2.4.5 Data analysis software evaluation of the obtained images A36
a.) Sensitometry and grey scale linearity (optical density consistency) A36
b.) Uniformity A38
c.) Resolution A40
d.) Image noise A41
e.) Geometry & measurement tools (distance accuracy/scaling errors) A43
f.) Standard signal A43
A.2.4.6 Automatic exposure control (AEC) results A45
a.) AEC performance A45
b.) AEC repeatability A46
A.2.4.7 Saving and printing the results A46
A.2.5 Computed tomography scanning A49
A.2.5.1 Phantom set-up A50
A.2.5.2 Phantom exposure A51
A.2.5.3 Load images into data analysis software A52
A.2.5.4 Visual inspection of the obtained images A53
a.) Low contrast detectability A53
b.) Positioning and alignment (zero slice position/scan plane
localisation) A53
c.) Artefacts A53
d.) Image quality visual inspection A53
A.2.5.5 Data analysis software evaluation of the obtained images A54
a.) Sensitometry and grey scale linearity (CT number reproducibility) A54
b.) Uniformity A55
c.) Resolution A57
d.) Image noise A58
e.) Geometry & measurement tools (distance accuracy/scaling errors) A60
f.) Standard signal A61
g.) Slice thickness A63
A.2.5.6 Saving and printing the results A68
A.3 Technical specifications A71
A.4 Service manual A73
A.4.1 Cleaning A73
A.4.2 Preventative maintenance A73
A.4.3 Disposal A73
A.5 Quality control records A74
Appendix A – Universal image quality assurance phantom user’s manual
Stellenbosch University https://scholar.sun.ac.za

Aiv
This page is intentionally left blank.
Appendix A – Universal image quality assurance phantom user’s manual
Stellenbosch University https://scholar.sun.ac.za

A1
A.1 General information
The purpose of this document is to provide guidance on the design and
implementation of a quality assurance program in a diagnostic radiology division for x-
ray generating equipment using the universal image quality phantom and
accompanying data analysis software. The phantom, user’s manual and data analysis
software can be used in any department, operating at any level of business. The
user’s manual describes the construction of the phantom, its set-up for exposure in
the different imaging modalities and explains the image acquisition and result analysis
process, with reference to the data analysis software. The figures included in the
manual are for guidance only and do not necessarily represent desired or expected
results.
In the general requirements for diagnostic radiology equipment licence holders, the
Department of Health (DoH), states that the licence holder must obtain Quality Control
(QC) manuals or develop in-house protocols, describing step by step the procedure
for correctly performing QC tests. DoH also states that results have to be recorded
and stored and must include the measurements, test date, results summary,
identification of equipment tested, phantoms used and person performing the tests.
The universal phantom’s user’s manual and example data collection sheets complies
to this. In addition, the universal phantom assesses all the tests specified by DoH.
The universal image quality assurance phantom aims to simplify routine image quality
control, reducing costs and giving resource limited institutions access to
comprehensive routine image quality control with easy to follow user’s manual and
data analysis software. The phantom is intended for constancy testing, comparing
routine results obtained with the phantom to those base line values set with the
phantom.
A.1.1 Intended use
The universal image quality assurance phantom, user’s manual and data analysis
software are designed for image quality constancy testing of x-ray generating
equipment in diagnostic radiology. This includes general x-ray machines, both fixed
and mobile units, fluoroscopy devices, mammography units and computed
tomography (CT) scanners.
Using the universal phantom fulfils the requirements from the South African regulatory
body, the Directorate Radiation Control of the South African Department of Health, for
comprehensive routine image quality control.
Appendix A – Universal image quality assurance phantom user’s manual
Stellenbosch University https://scholar.sun.ac.za

A2
A.1.2 Safety information
• Do not handle the phantom hard-handedly. Impact can cause the phantom halves
to separate and inserts to shift or fall out.
• Do not open the phantom. Small parts are contained, which can get lost and are
a choking hazard.
• Store the phantom in a cool place (room temperature of maximum 28oC). The
phantom and insert plastics are heat sensitive.
Appendix A – Universal image quality assurance phantom user’s manual
Stellenbosch University https://scholar.sun.ac.za

A3
A.2 Operating manual
This section explains the procedures for set-up and imaging of the phantom
and analysis of the obtained images. The frequency of conducting the tests is based
on the recommendations from the South African Department of Health and according
to recommendations from literature.
The tests can be conducted by a radiographer, medical physicist, technician or any
other suitably qualified personnel who is adequately trained on the operation of the
different imaging units. The test frequency in Tables A.2 to A.4 is the recommended
minimum standard and frequency of tests can be increased for best practice level,
according to the man power and time constraints of each individual department.
The objective of image quality control by consistency testing in x-ray imaging is to
ensure image quality is maintained at clinically acceptable levels to prevent
misdiagnosis and oversights. It also decreases patient radiation exposure as retake
exposures can be reduced if equipment failure is identified early, thus adhering to the
As Low As Reasonably Achievable (ALARA) principle.
A schematic representation of the phantom is included in Figure A.1 a.) with a photo
of the phantom bottom half in Figure A.1 b.). The densities of the different insert
materials are included in Table A.1.
Table A.1: Phantom insert materials.
Insert Material Density (gcm-3)
Housing High density polyethylene (HDPE) 0.95
Sensitometry Objet RGD240 1.17
Contrast resolution Teflon 2.20
Gammex SB3 bone 1.82
Supawood 0.74
Gammex LN300 lung 0.30
Air 0.00
Fibres Rubber 1.26
Slice thickness ramp Gammex SB3 bone 1.82
Circular geometry cylinder Polymethyl methacrylate (PMMA) 1.18
Micro-calcifications Metal Not known
MTF beads Metal Not known
Appendix A – Universal image quality assurance phantom user’s manual
Stellenbosch University https://scholar.sun.ac.za

A4
a.)
Appendix A – Universal image quality assurance phantom user’s manual
Stellenbosch University https://scholar.sun.ac.za

A5
Figure A.1: a.) Schematic representation of the sizes and materials of the different
inserts of the universal image quality assurance phantom. b.) A photo of the phantom
showing the layout of the inserts in the phantom bottom half. The numbers in the
figure are used in Tables A.2 to A.4.
Should the results be out of tolerance, i.e. the stated limits in Tables A.2 to A.4 are
exceeded, the recommended corrective action procedure is shown in Figure A.2.
14
b.)
1
2
3
4
8
7
6 5
12
11
10
9
13
15
16
17
19
18
20
21
Appendix A – Universal image quality assurance phantom user’s manual
Stellenbosch University https://scholar.sun.ac.za

A6
Figure A.2: Corrective action procedure for out of tolerance test results.
Appendix A – Universal image quality assurance phantom user’s manual
Stellenbosch University https://scholar.sun.ac.za

A7
A.2.1 Acceptance testing
versus routine QC
Acceptance testing is performed when equipment is first installed. It ensures that
equipment specifications are met. For this very accurate results and values are
required, which cannot be delivered by the current version of the universal image
quality assurance phantom.
At commissioning, baseline values are set. The universal image quality assurance
phantom can be used for this application. The baseline values, i.e. the initial
performance of the equipment, are used for future comparison to routine QC results
obtained with the universal image quality assurance phantom. Where baseline results
are out of tolerance, the necessary steps have to be taken to correct these before the
results are accepted as baseline. Routine QC results are then compared to these
initial results to ensure equipment performance is maintained.
After major services or repairs, the commissioning tests should be repeated and new
baseline values set.
The phantom is intended for constancy testing, comparing routine results obtained to
those base line values set with the phantom during commissioning. As the universal
image quality assurance phantom is unique, its results cannot be directly compared to
those obtained with other commercially available phantoms, i.e. routine image QC
results from the universal phantom should be compared to universal phantom set
baseline values.
Appendix A – Universal image quality assurance phantom user’s manual
Stellenbosch University https://scholar.sun.ac.za

A8
A.2.2 Installing the data
analysis software on your
computer
Data analysis software forms part of the universal image quality assurance phantom
package and is included on a compact disk (CD).
To install the software on a computer that will be used for data analysis, the following
system requirements are needed:
• At least Windows 7 Service Pack 1 (Apple is not supported)
• Minimum screen resolution of 1024 x 768
• CD drive
• 2 GB RAM memory
To install the software:
• Insert the CD into the CD drive.
• When prompted by the AutoPlay message, select Open folder to view files.
This is shown in Figure A.3.
Figure A.3: AutoPlay prompt to open the CD.
• Under Files Currently on the Disk a Phantom Scan Data Analysis Software
folder is available. Right click on the folder and select Copy. This is shown in
Figure A.4.
Appendix A – Universal image quality assurance phantom user’s manual
Stellenbosch University https://scholar.sun.ac.za

A9
Figure A.4: Copying the software folder.
• Choose a location where the software will be stored, e.g. Desktop. At this
location, right click and select Paste, as shown in Figure A.5. The Phantom
Scan Data Analysis Software folder is now available at this location on your
computer.
Figure A.5: Pasting the software folder.
• Double left click on the folder. A window showing the files in Figure A.6 will
open.
Appendix A – Universal image quality assurance phantom user’s manual
Stellenbosch University https://scholar.sun.ac.za

A10
Figure A.6: Files in the Phantom Scan Data Analysis Software folder.
• Double left click on the PhantomScan Application file, as highlighted in Figure
A.6.
• The Phantom Scan application opens and is ready for use. This is shown in
Figure A.7.
Figure A.7: Phantom Scan application open and ready for use.
Appendix A – Universal image quality assurance phantom user’s manual
Stellenbosch University https://scholar.sun.ac.za

A11
A.2.3 General x-ray and
fluoroscopy imaging
These tests are performed for both fixed and mobile x-ray units and for fluoroscopy
devices. Table A.2 shows the tests required for comprehensive image quality
assurance in general x-ray and fluoroscopy imaging.
Table A.2: Tests required for comprehensive general x-ray and fluoroscopy image
quality assurance. (Insert numbers in table refer to Figure A.1 b.))
Test Objective Method Frequency Limits
Sensitometry
& grey scale
linearity
(optical
density
consistency)
Maintain grey
scale value for
different object
densities
ROI analysis with
data analysis
software using
inserts 1, 9-13
Acceptance, 3
monthly
Baseline grey
scale value ±
0.20
For universal
phantom
baseline grey
scale value ±
2 %
Low contrast
detectability
Distinguish objects
of density similar
to background as
they become
progressively
smaller
Visual inspection
of inserts 1-8 to
determine
smallest visible
insert
Acceptance, 3
monthly
Baseline value
+ 1 insert size
Uniformity Ensure grey scale
values across the
image remain
constant for the
same material
ROI analysis with
data analysis
software using
phantom housing
15
Acceptance, 3
monthly
Mean value ±
10 %
Mean value ±
5 % for DR
Resolution Consistently
distinguish objects
as they become
smaller and closer
together
MTF analysis and
plot with data
analysis software
using insert group
21
Acceptance, 3
monthly
Baseline value
minus 25 %
Image noise Quantum mottle is
sufficiently low as
to not degrade
image quality
unacceptably
ROI analysis with
data analysis
software using
phantom housing
15 and Equations
A.1 and A.2
Acceptance, 3
monthly
Baseline value
± 10 %
Positioning &
alignment (X-
ray / light
beam
centring)
Checks the
coincidence of the
light and x-ray
fields
Visually check that
the entire phantom
is captured in the
image
Acceptance, 3
monthly
Obtained
value ± 1 cm
for imaging at
100 cm SID
Appendix A – Universal image quality assurance phantom user’s manual
Stellenbosch University https://scholar.sun.ac.za
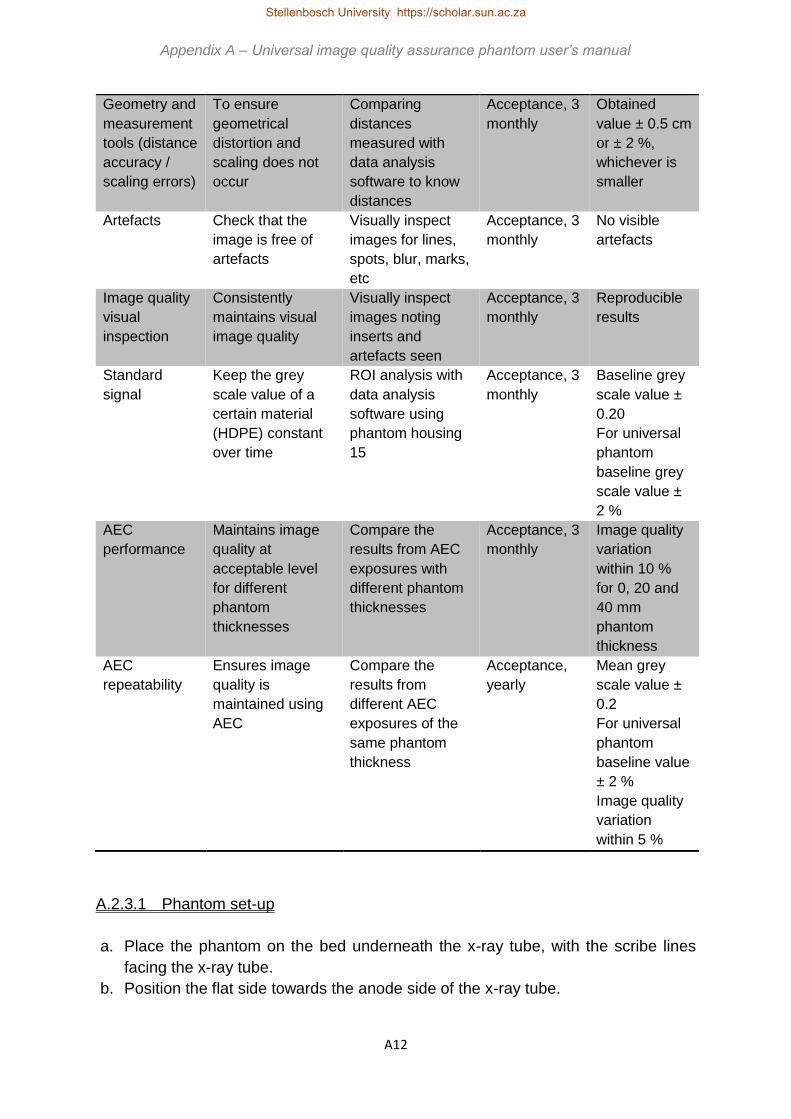
A12
Geometry and
measurement
tools (distance
accuracy /
scaling errors)
To ensure
geometrical
distortion and
scaling does not
occur
Comparing
distances
measured with
data analysis
software to know
distances
Acceptance, 3
monthly
Obtained
value ± 0.5 cm
or ± 2 %,
whichever is
smaller
Artefacts Check that the
image is free of
artefacts
Visually inspect
images for lines,
spots, blur, marks,
etc
Acceptance, 3
monthly
No visible
artefacts
Image quality
visual
inspection
Consistently
maintains visual
image quality
Visually inspect
images noting
inserts and
artefacts seen
Acceptance, 3
monthly
Reproducible
results
Standard
signal
Keep the grey
scale value of a
certain material
(HDPE) constant
over time
ROI analysis with
data analysis
software using
phantom housing
15
Acceptance, 3
monthly
Baseline grey
scale value ±
0.20
For universal
phantom
baseline grey
scale value ±
2 %
AEC
performance
Maintains image
quality at
acceptable level
for different
phantom
thicknesses
Compare the
results from AEC
exposures with
different phantom
thicknesses
Acceptance, 3
monthly
Image quality
variation
within 10 %
for 0, 20 and
40 mm
phantom
thickness
AEC
repeatability
Ensures image
quality is
maintained using
AEC
Compare the
results from
different AEC
exposures of the
same phantom
thickness
Acceptance,
yearly
Mean grey
scale value ±
0.2
For universal
phantom
baseline value
± 2 %
Image quality
variation
within 5 %
A.2.3.1 Phantom set-up
a. Place the phantom on the bed underneath the x-ray tube, with the scribe lines
facing the x-ray tube.
b. Position the flat side towards the anode side of the x-ray tube.
Appendix A – Universal image quality assurance phantom user’s manual
Stellenbosch University https://scholar.sun.ac.za
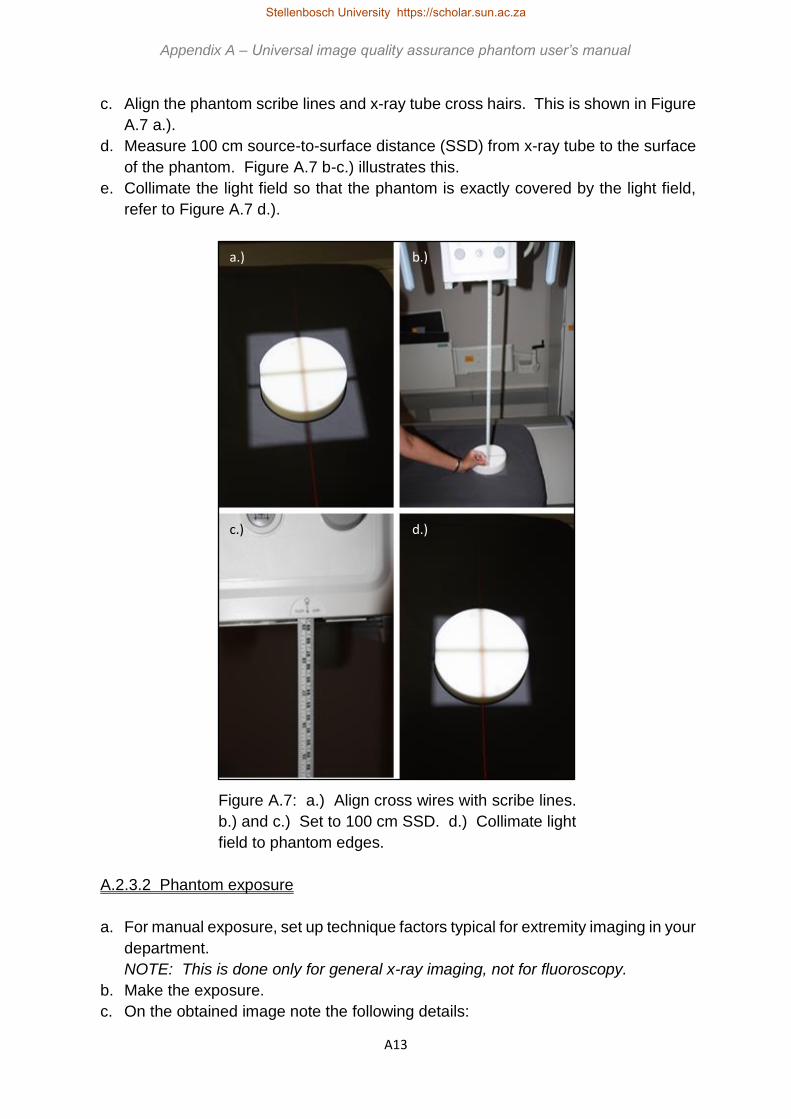
A13
c. Align the phantom scribe lines and x-ray tube cross hairs. This is shown in Figure
A.7 a.).
d. Measure 100 cm source-to-surface distance (SSD) from x-ray tube to the surface
of the phantom. Figure A.7 b-c.) illustrates this.
e. Collimate the light field so that the phantom is exactly covered by the light field,
refer to Figure A.7 d.).
Figure A.7: a.) Align cross wires with scribe lines.
b.) and c.) Set to 100 cm SSD. d.) Collimate light
field to phantom edges.
A.2.3.2 Phantom exposure
a. For manual exposure, set up technique factors typical for extremity imaging in your
department.
NOTE: This is done only for general x-ray imaging, not for fluoroscopy.
b. Make the exposure.
c. On the obtained image note the following details:
a.) b.)
c.) d.)
Appendix A – Universal image quality assurance phantom user’s manual
Stellenbosch University https://scholar.sun.ac.za

A14
i. Unit name
ii. Test date
iii. Technique factors used
iv. Additional attenuator plates added
v. Operator
d. For automatic exposure control (AEC), make an exposure with the AEC option
selected.
NOTE: Only AEC exposures are used for fluoroscopy.
e. On the obtained image note the following details:
i. Unit name
ii. Test date
iii. Technique factors used
iv. Additional attenuator plates added (0 cm in this example)
v. Operator
f. Now add 2 cm additional attenuator plates on top of the phantom and repeat points
d – e. (refer to Figure A.26 a.) in Mammography section A.2.4 for illustration)
g. Add a total of 4 cm additional attenuator plates and repeat points d – e. (refer to
Figure A.26 b.) in Mammography section A.2.4 for illustration)
h. A total of 3 exposures are therefore made.
A.2.3.3 Load images into data analysis software
a. Export the raw obtained images from the x-ray unit control console or computed
tomography (CR) reader control computer in Digital Imaging and Communications
in Medicine (DICOM) format. Contact a technician or medical physicist to write a
standing operating procedure (SOP) for doing this for your unit or department.
b. In the Phantom Scan application, click on File and select Open Image as shown
in Figure A.8.
Figure A.8: Opening an image for analysis.
c. Select the image you wish to evaluate and click on Open. The image will now be
displayed in the application, as shown in Figure A.9.
Appendix A – Universal image quality assurance phantom user’s manual
Stellenbosch University https://scholar.sun.ac.za

A15
Figure A.9: Image opened in the application and ready for evaluation.
A.2.3.4 Visual inspection of the obtained images
Load the obtained images one by one into the data analysis software as explained in
section A.2.3.3 above. In the software, view the loaded images and visually inspect
each of the 4 obtained images to determine:
a. Low contrast detectability
• Visually determine the smallest low contrast detectability insert that can be
seen. Refer to Figure A.1 for the location of these blocks, labelled 1-8 in
Figure A.1 b.).
• Record the size of the smallest visible block in the QC result page (at the end
of the manual).
• If the result is out of tolerance, i.e. the limit in Table A.2 is exceeded, follow
the steps in Figure A.2 for taking corrective action.
b. Positioning and alignment (x-ray / light beam centring)
• For x-ray to light field coincidence, visually check that the entire phantom is
captured in the image. The light field is collimated to the edges of the
phantom. If the phantom is cut-off, the x-ray field is smaller than the light field.
Appendix A – Universal image quality assurance phantom user’s manual
Stellenbosch University https://scholar.sun.ac.za

A16
If the image is larger than the phantom, then the light field is greater than the
x-ray field. This is indicated in Figure A.10.
• Record the results in the QC result page (at the end of the manual) and note
the direction in which the deviation was observed.
• If the result fails, i.e. the limit in Table A.2 is exceeded, follow the steps in
Figure A.2 for taking corrective action.
Figure A.10: a.) Correct x-ray to light field coincidence. b.) The light
field is smaller than the x-ray field to the left and bottom.
c. Artefacts
• Visually inspect the image for the presence of any artefacts, for example ghost
images, lines, streaks, marks, spots, blur or any other unexpected
appearance.
• Record the artefact seen and where in the image it occurred in the QC result
page (at the end of the manual).
• If the result is out of tolerance, i.e. the limit in Table A.2 is exceeded, follow
the steps in Figure A.2 for taking corrective action.
d. Image quality visual inspection
• Visually inspect the image and note any visual obstructions, grey scale
inversions, distortions or unexpected occurrences in the image.
• Record the manifestation seen and where in the image it occurred in the QC
result page (at the end of the manual).
• If the result is out of tolerance, i.e. the limit in Table A.2 is exceeded, follow
the steps in Figure A.2 for taking corrective action.
Appendix A – Universal image quality assurance phantom user’s manual
Stellenbosch University https://scholar.sun.ac.za

A17
A.2.3.5 Data analysis software evaluation of the obtained images
Load the obtained images one by one into the data analysis software as explained in
section A.2.3.3 above. Record the results obtained for the following tests.
a. Sensitometry and grey scale linearity (optical density consistency)
• In the Sensitometry tab in the application, click on the Region 1 button and
draw a region of interest (ROI) in the insert numbered 9, i.e. air, of diameter
approximately half the size of the insert, in Figure A.1 b.). The ROI should not
extend beyond the insert or be close to insert edges.
• Click on the Region 2 button and draw a circular ROI, of diameter
approximately half the size of the insert, in the insert numbered 10, i.e. lung,
in Figure A.1 b.). The ROI should not extend beyond the insert or be close to
insert edges.
• Repeat this for the Regions 3, 4, 5 and 6 buttons drawing ROIs in the inserts
numbered 11, 12, 13 and 1 in Figure A.1 b.), i.e. supa wood, bone, Teflon and
RGD. This is shown in Figure A.11.
Note: First click on the Region button and then draw the ROI.
Figure A.11: Drawing the sensitometry ROIs.
• Click on the Results button.
Appendix A – Universal image quality assurance phantom user’s manual
Stellenbosch University https://scholar.sun.ac.za

A18
• The mean and standard deviation in each ROI is measured and displayed as
shown in Figure A.12.
Figure A.12: Results for the sensitometry test.
• Record the results in the QC result page (at the end of the manual).
• If the result fails, i.e. the limit in Table A.2 is exceeded, follow the steps in
Figure A.2 for taking corrective action.
b. Uniformity
• In the Uniformity tab in the application, click on the Region 1 button and draw
a region of interest (ROI) in the HDPE housing material in a location that does
not contain any other inserts.
• Click on the Region 2, 3 and 4 buttons and draw ROIs of similar size than in
the first step in the remaining quadrants at locations with no other inserts. This
is illustrated in Figure A.13.
Appendix A – Universal image quality assurance phantom user’s manual
Stellenbosch University https://scholar.sun.ac.za

A19
Figure A.13: Locations for ROIs for uniformity evaluation.
• Click on the Results button. The mean and standard deviation in each ROI is
measured as shown in Figure A.14.
• Calculate the largest difference in the mean value and record the result in the
QC result page (at the end of the manual).
• If the result fails, i.e. the limit in Table A.2 is exceeded, follow the steps in
Figure A.2 for taking corrective action.
Appendix A – Universal image quality assurance phantom user’s manual
Stellenbosch University https://scholar.sun.ac.za

A20
Figure A.14: Results for the uniformity test.
c. Resolution
• Determine the smallest ball visible from the inserts labelled number 21 in
Figure A.1 b.).
• Click on the Point 1 button and draw a region of interest (ROI) around the ball.
This is shown in Figure A.15.
• Click on the Results button. The data analysis software calculates the
modulation transfer function (MTF) from the point spread function (PSF) of the
ball. A MTF graph and the limiting spatial resolution are displayed. The
limiting spatial resolution is the frequency where the MTF is at 10 %. This is
indicated in Figure A.16.
• Record the results in the QC result page (at the end of the manual).
• If the result fails, i.e. the limit in Table A.2 is exceeded, follow the steps in
Figure A.2 for taking corrective action.
• NOTE: For fluoroscopy use the central bead.
Appendix A – Universal image quality assurance phantom user’s manual
Stellenbosch University https://scholar.sun.ac.za

A21
Figure A.15: Drawing a ROI around the smallest ball for resolution calculation.
Figure A.16: Results for the resolution test.
Appendix A – Universal image quality assurance phantom user’s manual
Stellenbosch University https://scholar.sun.ac.za

A22
d. Image noise
• In the Noise tab in the application, click on the Region 1 button and draw a
region of interest (ROI) in the insert numbered 1 in Figure A.1 b.). The ROI
should be of diameter approximately half the size of the insert and should not
extend beyond the insert or be close to insert edges.
• Click on the Region 2 (background) button and draw a ROI of similar size to
that of Region 1 next to the insert. This is shown in Figure A.17.
• Click on the Results button. The data analysis software shows the mean and
standard deviations obtained in the ROIs and calculates the signal-to-noise
ratio (SNR) and contrast-to-noise ratio (CNR) with Equations A.1 and A.2.
𝑆𝑁𝑅 =𝑚𝑒𝑎𝑛
𝑠𝑡𝑎𝑛𝑑𝑎𝑟𝑑 𝑑𝑒𝑣𝑖𝑎𝑡𝑖𝑜𝑛 [Equation A.1]
𝐶𝑁𝑅 =𝑚𝑒𝑎𝑛(𝑎)−𝑚𝑒𝑎𝑛(𝑏)
𝑠𝑡𝑎𝑛𝑑𝑎𝑟𝑑 𝑑𝑒𝑣𝑖𝑎𝑡𝑖𝑜𝑛(𝑏) [Equation A.2]
• Record the results, as shown in Figure A.18, in the QC result page (at the end
of the manual).
• If the result fails, i.e. the limit in Table A.2 is exceeded, follow the steps in
Figure A.2 for taking corrective action.
Figure A.17: Drawing ROIs for image noise analysis.
Appendix A – Universal image quality assurance phantom user’s manual
Stellenbosch University https://scholar.sun.ac.za

A23
Figure A.18: Results for the noise test.
e. Geometry and measurement tools (distance accuracy / scaling errors)
• In the Geometry tab in the application, click on the Line 1 button and draw a
vertical line from edge to edge in the insert numbered 17 in Figure A.1 b.).
• Click on the Line 2 button and draw a horizontal line from edge to edge in the
same insert. This is shown in Figure A.19.
• Click on the Results button. The data analysis software measures the length
of the drawn lines as indicated in Figure A.20.
• The actual size of the insert is 20 mm diameter. Compare the actual size of the
insert to that measured with the software and calculate the difference.
• Record the results in the QC result page (at the end of the manual).
• If the result fails, i.e. the limit in Table A.2 is exceeded, follow the steps in Figure
A.2 for taking corrective action.
Appendix A – Universal image quality assurance phantom user’s manual
Stellenbosch University https://scholar.sun.ac.za

A24
Figure A.19: Geometry measurement lines.
Figure A.20: Results for the geometry test.
Appendix A – Universal image quality assurance phantom user’s manual
Stellenbosch University https://scholar.sun.ac.za

A25
f. Standard signal
• In the Standard Signal tab in the application, click on the Region 1 button and
draw a region of interest (ROI) in the HDPE housing material at the location
labelled 15 in Figure A.1 b.). This is shown in Figure A.21.
Figure A.21: Drawing a ROI for standard signal evaluation.
• Click on the Results button. The software measures and displays the mean
and standard deviation in the ROI as shown in Figure A.22.
• Record the results in the QC result page (at the end of the manual).
• If the result fails, i.e. the limit in Table A.2 is exceeded, follow the steps in Figure
A.2 for taking corrective action.
Appendix A – Universal image quality assurance phantom user’s manual
Stellenbosch University https://scholar.sun.ac.za

A26
Figure A.22: Results for the standard signal test.
A.2.3.6 Automatic exposure control (AEC) results
a. AEC performance
• Repeat section A.2.3.4 a, c and d and A2.3.5 a, b, d and f for images obtained
with AEC with 2 and 4 cm additional HDPE attenuator added.
• Compare the results for the different images.
• Record the results in the QC result page (at the end of the manual).
• If the result fails, i.e. the limit in Table A.2 is exceeded, follow the steps in Figure
A.2 for taking corrective action.
b. AEC repeatability
• Repeat section A.2.3.4 a-d and A.2.3.5 a-f for three images obtained with AEC
with the same thickness of additional HDPE attenuator added, e.g. perform 3
AEC exposures of the phantom only (0cm additional attenuator).
• Compare the results for the different images.
• Record the results in the QC result page (at the end of the manual).
• If the result fails, i.e. the limit in Table A.2 is exceeded, follow the steps in Figure
A.2 for taking corrective action.
Appendix A – Universal image quality assurance phantom user’s manual
Stellenbosch University https://scholar.sun.ac.za

A27
A.2.3.7 Saving and printing the results
• Click on File and select Save Results as shown in Figure A.23 a.).
• Enter a file name and choose the location where you want to save the results,
as indicated in Figure A.23 b.).
• To print the results in hard copy, go to the selected save location, select the
file name to be printed and double left click to open the file in Notepad.
• In Notepad, click on File and select Print. This is shown in Figure A.24 a.).
• Select the printer you want to use and click on Print, as shown in Figure A.24
b.).
• Sign and file the hard copy results.
Appendix A – Universal image quality assurance phantom user’s manual
Stellenbosch University https://scholar.sun.ac.za

A28
Figure A.23: Saving the obtained results. a.) Selecting the save option in the
application. b.) Choosing the location to save to.
a.)
b.)
Appendix A – Universal image quality assurance phantom user’s manual
Stellenbosch University https://scholar.sun.ac.za

A29
Figure A.24: Printing the results from Notepad. a.) Selecting the print option. b.)
Selecting the printer.
a.)
b.)
Appendix A – Universal image quality assurance phantom user’s manual
Stellenbosch University https://scholar.sun.ac.za

A30
A.2.4 Mammography imaging
These tests are performed for mammography units. Table A.3 shows the tests
required for comprehensive image quality assurance in mammography imaging.
Table A.3: Tests required for comprehensive mammography image quality assurance.
(Insert numbers in table refer to Figure A.1 b.))
Test Objective Method Frequency Limits
Sensitometry
& grey scale
linearity
(optical
density
consistency)
Maintain grey
scale value for
different object
densities
ROI analysis with
data analysis
software using
inserts 1, 9-13
Acceptance,
daily
Baseline grey
scale value ±
0.20
For universal
phantom
baseline grey
scale value ±
2 %
Low contrast
detectability
Distinguish objects
of density similar
to background as
they become
progressively
smaller
Visual inspection
of inserts 1-8 to
determine
smallest visible
insert
Acceptance,
daily
All inserts are
visible
Uniformity Ensure grey scale
values across the
image remain
constant for the
same material
ROI analysis with
data analysis
software using
phantom housing
15
Acceptance,
weekly
Mean value ±
10 %
Mean value ±
5 % for DR
Resolution Consistently
distinguish objects
as they become
smaller and closer
together
MTF analysis and
plot with data
analysis software
using insert group
21
Acceptance,
yearly
11 - 13 lp/mm
For universal
phantom
baseline
limiting
resolution
value ± 2
Image noise Quantum mottle is
sufficiently low as
to not degrade
image quality
unacceptably
ROI analysis with
data analysis
software using
phantom housing
15 and Equations
1 and 2
Acceptance,
weekly
Baseline value
± 10 %
Positioning &
alignment (X-
ray / light
beam
centring)
Checks the
coincidence of the
light and x-ray
fields
Visually check that
the entire phantom
is captured in the
image
Acceptance,
12 monthly
Obtained
value ± 2 % of
SID value
Appendix A – Universal image quality assurance phantom user’s manual
Stellenbosch University https://scholar.sun.ac.za

A31
Geometry and
measurement
tools (distance
accuracy /
scaling errors)
To ensure
geometrical
distortion and
scaling does not
occur
Comparing
distances
measured with
data analysis
software to know
distances
Acceptance,
daily
Obtained
value ± 0.5 cm
or ± 2 %,
whichever is
smaller
Artefacts Check that the
image is free of
artefacts
Visually inspect
images for lines,
spots, blur, marks,
etc
Acceptance,
daily
No visible
artefacts or
distortion
For universal
phantom
geometric
distortion will
be present, no
other artefacts
or distortions
to be visible
Image quality
visual
inspection
Consistently
maintains visual
image quality
Visually inspect
images noting
inserts and
artefacts seen
Acceptance, 3
monthly
Reproducible
results
Standard
signal
Keep the grey
scale value of a
certain material
(HDPE) constant
over time
ROI analysis with
data analysis
software using
phantom housing
15
Acceptance, 3
monthly
Baseline grey
scale value ±
0.2
For universal
phantom
baseline grey
scale value ±
2 %
AEC
performance
Maintains image
quality at
acceptable level
for different
phantom
thicknesses
Compare the
results from AEC
exposures with
different phantom
thicknesses
Acceptance, 3
monthly
Image quality
variation
within 10 %
for 0, 20 and
40 mm
phantom
thickness
AEC
repeatability
Ensures image
quality is
maintained using
AEC
Compare the
results from
different AEC
exposures of the
same phantom
thickness
Acceptance,
yearly
Mean grey
scale value ±
0.15
For universal
phantom
baseline vaue
± 2 %
Image quality
variation
within 5 %.
Stellenbosch University https://scholar.sun.ac.za

A32
Fibres Evaluates
mammography
specific image
quality assurance
parameters
Visually determine
the smallest fibre,
from insert group
19, that is visible
Acceptance,
weekly
All fibres
arevisible
Masses Evaluates
mammography
specific image
quality assurance
parameters
Visually determine
the smallest mass,
from inserts 1-8,
that is visible
Acceptance,
weekly
All masses
are visible
Micro-
calcifications
Evaluates
mammography
specific image
quality assurance
parameters
Visually determine
the smallest
calcification group,
from insert group
18, that is visible
Acceptance,
weekly
All micro-
calcification
groups are
visible
A.2.4.1 Phantom set-up
a. Place the phantom on the bucky underneath the x-ray tube, with the scribe lines
facing the x-ray tube.
b. Position the flat side towards the chest wall side as in Figure A.25.
c. Align the phantom scribe lines and x-ray tube cross hairs. This is shown in Figure
A.25 a.).
d. Use the largest compression paddle, as shown in Figure A.25 b.).
Figure A.25: a.) With phantom positioned flat side towards chest wall side, align
cross hairs with scribe lines. b.) Use a large compression paddle.
a.) b.)
Appendix A – Universal image quality assurance phantom user’s manual Appendix A – Universal image quality assurance phantom user’s manual
Stellenbosch University https://scholar.sun.ac.za

A33
A.2.4.2 Phantom exposure
a. For manual exposure, set up technique factors typical for craniocaudal (CC)
mammogram imaging in your department.
b. Make the exposure.
c. On the obtained image note the following details:
i. Unit name
ii. Test date
iii. Technique factors used
iv. Additional attenuator plates added
v. Operator
d. For AEC, make an exposure with the AEC option selected.
e. On the obtained image note the following details:
i. Unit name
ii. Test date
iii. Technique factors used
iv. Additional attenuator plates added (0 cm in this example)
v. Operator
f. Now add 2 cm additional attenuator plates on top of the phantom and repeat points
d – e. This is shown in Figure A.26 a.).
g. Add a total of 4 cm additional attenuator plates, as shown in Figure A.26 b.), and
repeat points d – e.
h. A total of 3 exposures are therefore made.
Appendix A – Universal image quality assurance phantom user’s manual
Stellenbosch University https://scholar.sun.ac.za

A34
Figure A.26: a.) Phantom with 2 cm additional
attenuator added on top of the phantom. b.) Phantom
with 4 cm additional attenuator added on top of the
phantom.
A.2.4.3 Load images into data analysis software
a. Export the raw obtained images from the mammography unit control console in
Digital Imaging and Communications in Medicine (DICOM) format. Contact a
technician or medical physicist to write a standing operating procedure (SOP) for
doing this for your unit or department.
b. In the Phantom Scan application, click on File and select Open Image as shown
in Figure A.27.
Appendix A – Universal image quality assurance phantom user’s manual
Stellenbosch University https://scholar.sun.ac.za

A35
Figure A.27: Opening an image for analysis.
c. Select the image you wish to evaluate and click on Open. The image will now be
displayed in the application, as shown in Figure A.28.
Figure A.28: Image opened in the application and ready for evaluation.
A.2.4.4 Visual inspection of the obtained images
Load the obtained images one by one into the data analysis software as explained in
section A.2.4.3 above. In the software, view the loaded images and visually inspect
each of the 4 obtained images to determine:
a. Low contrast detectability
• Visually determine the smallest low contrast detectability insert that can be
seen. Refer to Figure A.1 for the location of these blocks, labelled 1-8 in
Figure A.1 b.).
Appendix A – Universal image quality assurance phantom user’s manual
Stellenbosch University https://scholar.sun.ac.za

A36
• Record the size of the smallest visible block in the QC result page (at the end
of the manual).
• If the result is out of tolerance, i.e. the limit in Table A.3 is exceeded, follow
the steps in Figure A.2 for taking corrective action.
b. Positioning and alignment (x-ray / light beam centring)
• For x-ray to light field coincidence, visually check that the entire phantom is
captured in the image. The flat side of the phantom is placed at the edge of
the bucky chest wall side. This is indicated in Figure A.25.
• Record the results in the QC result page (at the end of the manual) and note
the direction in which the deviation was observed.
• If the result fails, i.e. the limit in Table A.3 is exceeded, follow the steps in
Figure A.2 for taking corrective action.
c. Artefacts
• Visually inspect the image for the presence of any artefacts, for example ghost
images, lines, streaks, marks, spots, blur or any other unexpected
appearance.
• Record the artefact seen and where in the image it occurred in the QC result
page (at the end of the manual).
• If the result is out of tolerance, i.e. the limit in Table A.3 is exceeded, follow
the steps in Figure A.2 for taking corrective action.
d. Image quality visual inspection
• Visually inspect the image and note any visual obstructions, grey scale
inversions, distortions or unexpected occurrences in the image.
• Record the manifestation seen and where in the image it occurred in the QC
result page (at the end of the manual).
• If the result is out of tolerance, i.e. the limit in Table A.3 is exceeded, follow
the steps in Figure A.2 for taking corrective action.
e. Fibres
• Visually inspect the image and note the fibre inserts labelled number 19 in
Figure A.1 b.).
• Record the number of fibres seen in the QC result page (at the end of the
manual).
• If the result is out of tolerance, i.e. the limit in Table A.3 is exceeded, follow
the steps in Figure A.2 for taking corrective action.
f. Masses
• Visually inspect the image and note the masses inserts labelled 1-8 in Figure
A.1 b.).
Appendix A – Universal image quality assurance phantom user’s manual
Stellenbosch University https://scholar.sun.ac.za

A37
• Record the number of masses seen in the QC result page (at the end of the
manual).
• If the result is out of tolerance, i.e. the limit in Table A.3 is exceeded, follow
the steps in Figure A.2 for taking corrective action.
g. Micro-calcifications
• Visually inspect the image and note the micro-calcification groups labelled 18
in Figure A.1 b.).
• Record the number of groups seen in the QC result page (at the end of the
manual).
• If the result is out of tolerance, i.e. the limit in Table A.3 is exceeded, follow
the steps in Figure A.2 for taking corrective action.
A.2.4.5 Data analysis software evaluation of the obtained images
Load the obtained images one by one into the data analysis software as explained in
section A.2.4.3 above. Record the results obtained for the following tests.
a. Sensitometry & grey scale linearity (optical density consistency)
• In the Sensitometry tab in the application, click on the Region 1 button and
draw a region of interest (ROI) in the insert numbered 9, i.e. air, in Figure A.1
b.). The ROI should be of diameter approximately half the size of the insert,
should not extend beyond the insert or touch the insert edges.
• Click on the Region 2 button and draw a ROI in the insert numbered 10, i.e.
lung, in Figure A.1 b.). The ROI should be of diameter approximately half the
size of the insert, should not extend beyond the insert or touch the insert
edges.
• Repeat this for the Regions 3, 4, 5 and 6 buttons drawing ROIs in the inserts
numbered 11, 12, 13 and 1 in Figure A.1 b.), i.e. supa wood, bone, Teflon and
RGD. This is shown in Figure A.29.
Note: First click on the Region button and then draw the ROI.
• Click on the Results button.
• The mean and standard deviation in each ROI is measured and displayed as
shown in Figure A.30.
Appendix A – Universal image quality assurance phantom user’s manual
Stellenbosch University https://scholar.sun.ac.za

A38
Figure A.29: Drawing the sensitometry ROIs.
Figure A.30: Results for the sensitometry test.
Stellenbosch University https://scholar.sun.ac.za

A39
• Record the results in the QC result page (at the end of the manual).
• If the result fails, i.e. the limit in Table A.3 is exceeded, follow the steps in
Figure A.2 for taking corrective action.
b. Uniformity
• In the Uniformity tab in the application, click on the Region 1 button and draw
a region of interest (ROI) in the HDPE housing material in a location that does
not contain any other inserts.
• Click on the Region 2, 3 and 4 buttons and draw ROIs of similar size than in
the first step in the remaining quadrants at locations with no other inserts. This
is illustrated in Figure A.31.
• Click on the Results button. The mean and standard deviation in each ROI is
measured as shown in Figure A.32.
• Calculate the largest difference in the mean value and record the result in the
QC result page (at the end of the manual).
• If the result fails, i.e. the limit in Table A.3 is exceeded, follow the steps in
Figure A.2 for taking corrective action.
Figure A.31: Locations for ROIs for uniformity evaluation.
Appendix A – Universal image quality assurance phantom user’s manual
Stellenbosch University https://scholar.sun.ac.za

A40
Figure A.32: Results for the uniformity test.
c. Resolution
• Determine the smallest ball visible from the inserts labelled number 21 in
Figure A.1 b.).
• Click on the Point 1 button and draw a region of interest (ROI) around the ball.
This is shown in Figure A.33.
• Click on the Results button. The data analysis software calculates the
modulation transfer function (MTF) from the point spread function (PSF) of the
ball. A MTF graph and the limiting spatial resolution are displayed. The
limiting spatial resolution is the frequency where the MTF is at 10 %. This is
indicated in Figure A.34.
• Record the results in the QC result page (at the end of the manual).
• If the result fails, i.e. the limit in Table A.3 is exceeded, follow the steps in
Figure A.2 for taking corrective action.
Appendix A – Universal image quality assurance phantom user’s manual
Stellenbosch University https://scholar.sun.ac.za
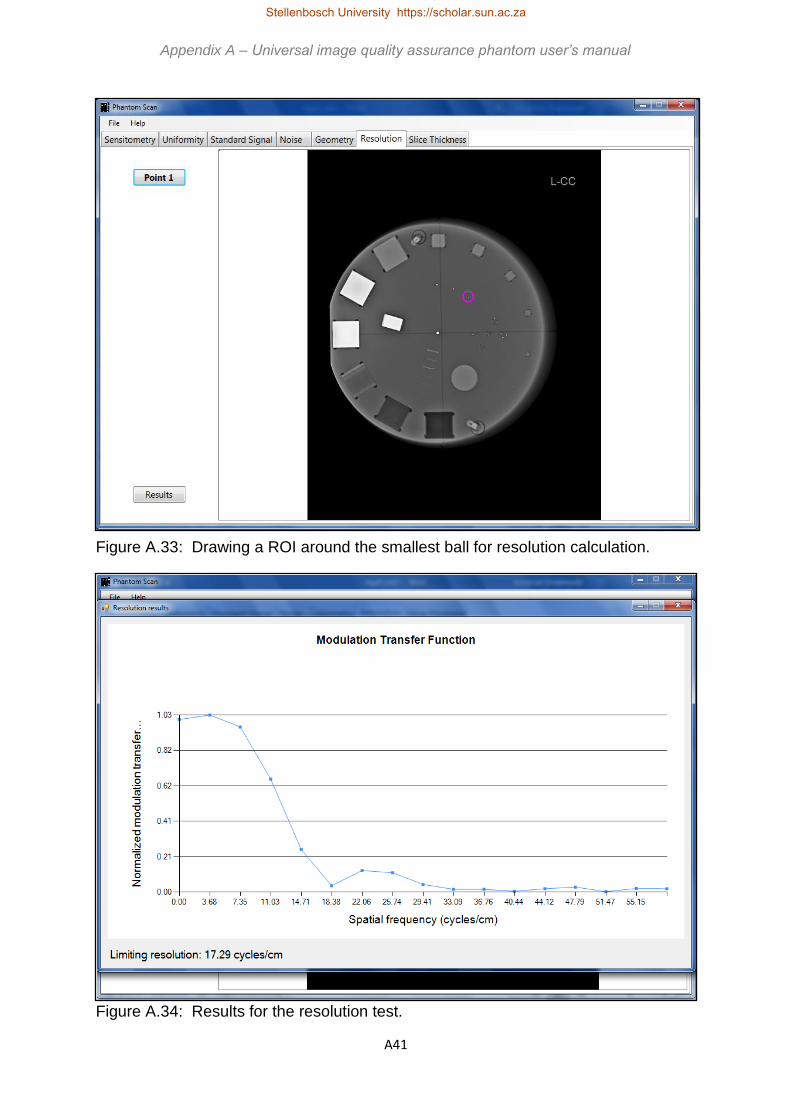
A41
Figure A.33: Drawing a ROI around the smallest ball for resolution calculation.
Figure A.34: Results for the resolution test.
Appendix A – Universal image quality assurance phantom user’s manual
Stellenbosch University https://scholar.sun.ac.za

A42
d. Image noise
• In the Noise tab in the application, click on the Region 1 button and draw a
region of interest (ROI) in the insert numbered 1 in Figure A.1 b.). The ROI
should be of diameter approximately half the size of the insert, should not
extend beyond the insert or touch the insert edges.
• Click on the Region 2 (background) button and draw a ROI of similar size to
that of Region 1 next to the insert. This is shown in Figure A.35.
• Click on the Results button. The data analysis software shows the mean and
standard deviations obtained in the ROIs and calculates the signal-to-noise
ratio (SNR) and contrast-to-noise ratio (CNR) with Equations A.1 and A.2.
𝑆𝑁𝑅 =𝑚𝑒𝑎𝑛
𝑠𝑡𝑎𝑛𝑑𝑎𝑟𝑑 𝑑𝑒𝑣𝑖𝑎𝑡𝑖𝑜𝑛 [Equation A.1]
𝐶𝑁𝑅 =𝑚𝑒𝑎𝑛(𝑎)−𝑚𝑒𝑎𝑛(𝑏)
𝑠𝑡𝑎𝑛𝑑𝑎𝑟𝑑 𝑑𝑒𝑣𝑖𝑎𝑡𝑖𝑜𝑛(𝑏) [Equation A.2]
• Record the results, as shown in Figure A.36, in the QC result page (at the end
of the manual).
• If the result fails, i.e. the limit in Table A.3 is exceeded, follow the steps in
Figure A.2 for taking corrective action.
Figure A.35: Drawing ROIs for image noise analysis.
Appendix A – Universal image quality assurance phantom user’s manual
Stellenbosch University https://scholar.sun.ac.za

A43
Figure A.36: Results for the noise test.
e. Geometry and measurement tools (distance accuracy / scaling errors)
• In the Geometry tab in the application, click on the Line 1 button and draw a
vertical line from edge to edge in the insert numbered 17 in Figure A.1 b.).
• Click on the Line 2 button and draw a horizontal line from edge to edge in the
same insert. This is shown in Figure A.37.
• Click on the Results button. The data analysis software measures the length
of the drawn lines as indicated in Figure A.38.
• The actual size of the insert is 20 mm diameter. Compare the actual size of the
insert to that measured with the software and calculate the difference.
• Record the results in the QC result page (at the end of the manual).
• If the result fails, i.e. the limit in Table A.3 is exceeded, follow the steps in Figure
A.2 for taking corrective action.
Appendix A – Universal image quality assurance phantom user’s manual
Stellenbosch University https://scholar.sun.ac.za
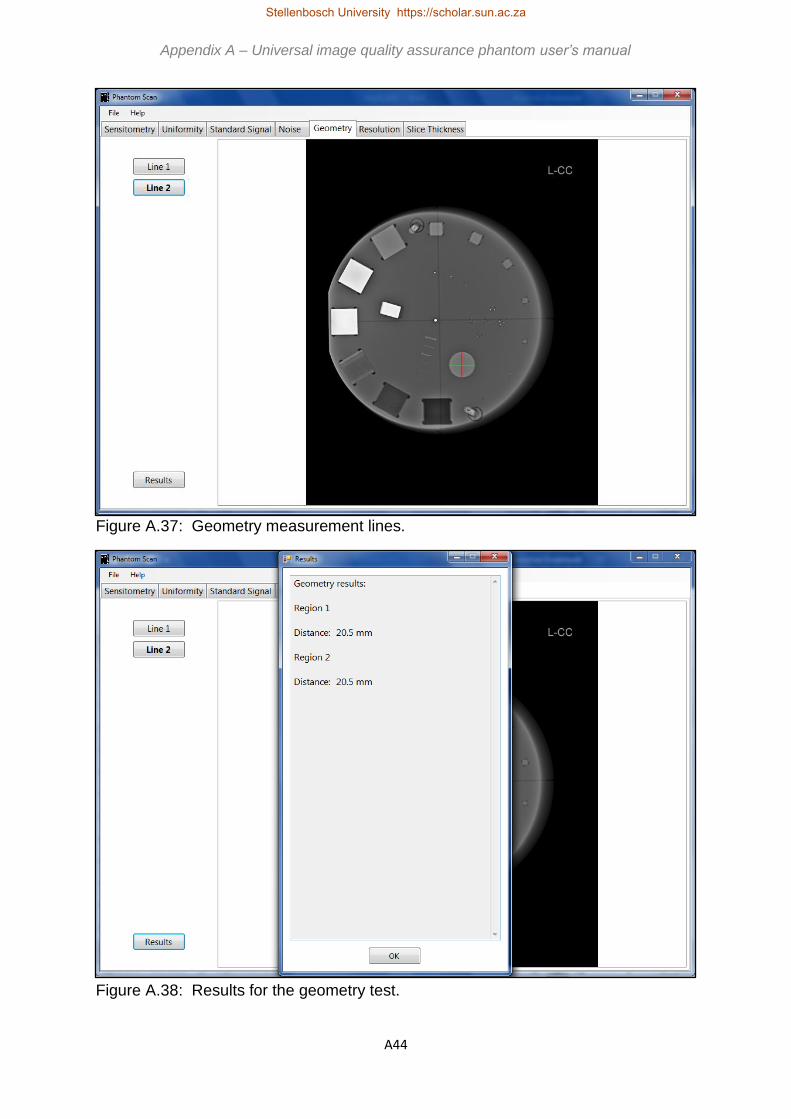
A44
Figure A.37: Geometry measurement lines.
Figure A.38: Results for the geometry test.
Appendix A – Universal image quality assurance phantom user’s manual Appendix A – Universal image quality assurance phantom user’s manual
Stellenbosch University https://scholar.sun.ac.za

A45
Figure A.39: Drawing a ROI for standard signal evaluation.
f. Standard signal
• In the Standard Signal tab in the application, click on the Region 1 button and
draw a region of interest (ROI) in the HDPE housing material at the location
labelled 15 in Figure A.1 b.). This is shown in Figure A.39.
• Click on the Results button. The software measures and displays the mean
and standard deviation in the ROI as shown in Figure A.40.
• Record the results in the QC result page (at the end of the manual).
• If the result fails, i.e. the limit in Table A.2 is exceeded, follow the steps in Figure
A.2 for taking corrective action.
Appendix A – Universal image quality assurance phantom user’s manual
Stellenbosch University https://scholar.sun.ac.za

A46
Figure A.40: Results for the standard signal test.
A.2.4.6 Automatic exposure control (AEC) results
a. AEC performance
• Repeat section A.2.4.4 a, c and d and A2.4.5 a, b, d and f for images obtained
with AEC with 2 and 4 cm additional HDPE attenuator added.
• Compare the results for the different images.
• Record the results in the QC result page (at the end of the manual).
• If the result fails, i.e. the limit in Table A.3 is exceeded, follow the steps in Figure
A.2 for taking corrective action.
b. AEC repeatability
• Repeat section A.2.4.4 a-d and A.4.3.5 a-f for three images obtained with AEC
with the same thickness of additional HDPE attenuator added, e.g. perform 3
AEC exposures of the phantom only (0cm additional attenuator).
• Compare the results for the different images.
• Record the results in the QC result page (at the end of the manual).
• If the result fails, i.e. the limit in Table A.3 is exceeded, follow the steps in Figure
A.2 for taking corrective action.
Appendix A – Universal image quality assurance phantom user’s manual
Stellenbosch University https://scholar.sun.ac.za

A47
A.2.4.7 Saving and printing the results
• Click on File and select Save Results as shown in Figure A.41 a.).
• Enter a file name and choose the location where you want to save the results,
as indicated in Figure A.41 b.).
• To print the results in hard copy, go to the selected save location, select the
file name to be printed and double left click to open the file in Notepad.
• In Notepad, click on File and select Print. This is shown in Figure A.42 a.).
• Select the printer you want to use and click on Print, as shown in Figure A.42
b.).
• Sign and file the hard copy results.
Appendix A – Universal image quality assurance phantom user’s manual
Stellenbosch University https://scholar.sun.ac.za
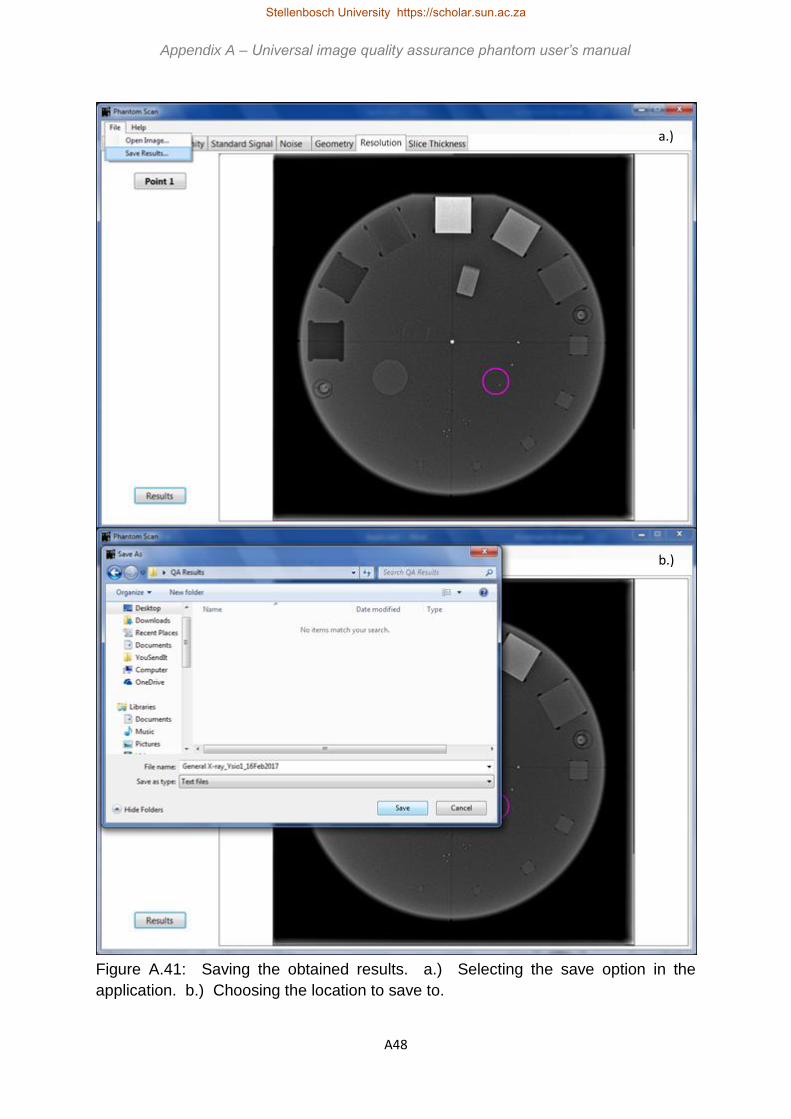
A48
Figure A.41: Saving the obtained results. a.) Selecting the save option in the
application. b.) Choosing the location to save to.
a.)
b.)
Appendix A – Universal image quality assurance phantom user’s manual
Stellenbosch University https://scholar.sun.ac.za

A49
Figure A.42: Printing the results from Notepad. a.) Selecting the print option. b.)
Selecting the printer.
a.)
b.)
Appendix A – Universal image quality assurance phantom user’s manual
Stellenbosch University https://scholar.sun.ac.za

A50
A.2.5 Computed tomography
scanning
These tests are performed for CT scanners. Table A.4 shows the tests required for
comprehensive image quality assurance in CT scanning.
Table A.4: Tests required for comprehensive CT scanning image quality assurance.
(Insert numbers in table refer to Figure A.1 b.))
Test Objective Method Frequency Limits
Sensitometry
& grey scale
linearity (HU /
CT number
linearity)
Maintain grey
scale value for
different object
densities
ROI analysis with
data analysis
software using
inserts 1, 9-13
Acceptance,
daily
Baseline value
± 10 HU
For universal
phantom
baseline value
± 10 %
Low contrast
detectability
Distinguish objects
of density similar
to background as
they become
progressively
smaller
Visual inspection
of inserts 1-8 to
determine
smallest visible
insert
Acceptance, 3
monthly
Baseline value
+1 insert size
Uniformity Ensure grey scale
values across the
image remain
constant for the
same material
ROI analysis with
data analysis
software using
phantom housing
15
Acceptance, 3
monthly
Mean value ±
10 %
Resolution Consistently
distinguish objects
as they become
smaller and closer
together
MTF analysis and
plot with data
analysis software
using insert group
21
Acceptance, 3
monthly
Baseline value
minus 25 %
Image noise Quantum mottle is
sufficiently low as
to not degrade
image quality
unacceptably
ROI analysis with
data analysis
software using
phantom housing
15 and Equations
1 and 2
Acceptance, 3
monthly
Baseline value
± 10 %
Positioning &
alignment
(zero slice
position / scan
plane
localisation)
Checks that the
slice the scan is
zeroed on is at co-
ordinates x=0,
y=0, z=0
Visually check the
coordinates of the
slice with the
central ball
Acceptance, 3
monthly
Zero ± 0.2 cm
Appendix A – Universal image quality assurance phantom user’s manual
Stellenbosch University https://scholar.sun.ac.za

A51
Geometry and
measurement
tools (distance
accuracy /
scaling errors)
To ensure
geometrical
distortion and
scaling does not
occur
Comparing
distances
measured with
data analysis
software to know
distances
Acceptance, 3
monthly
Obtained
value ± 0.5 cm
or ± 2 %,
whichever is
smaller
Artefacts Check that the
image is free of
artefacts
Visually inspect
images for lines,
spots, blur, marks,
etc
Acceptance, 3
monthly
No visible
artefacts
For universal
phantom
streak from
central bead
will be
present, no
other artefacts
to be seen
Image quality
visual
inspection
Consistently
maintains visual
image quality
Visually inspect
images noting
inserts and
artefacts seen
Acceptance, 3
monthly
Reproducible
results
Standard
signal
Keep the grey
scale value of a
certain material
(HDPE) constant
over time
ROI analysis with
data analysis
software using
phantom housing
15
Acceptance, 3
monthly
Baseline grey
scale value ±
10 HU
CT slice
thickness
Determine if the
set slice thickness
is actually
scanned
Data analysis
software
measures the slice
thickness from the
ramp labelled 20
Acceptance,
yearly
Baseline value
± 20 % or ±
0.1 cm,
whichever is
smaller
A.2.5.1 Phantom set-up
a. Place the phantom on the provided stand with the scribe lines facing away from
the gantry, as shown in Figure A.43 a.).
b. Align the phantom scribe lines with the CT scanner lasers. This is shown in Figure
A.43 b.).
c. Zero the scan position.
Appendix A – Universal image quality assurance phantom user’s manual
Stellenbosch University https://scholar.sun.ac.za

A52
Figure A.43: a.) Phantom positioned on stand on CT
scanner couch. a.) and b.) Phantom scribe lines aligned
with lasers.
A.2.5.2 Phantom exposure
a. Use a head or brain scanning protocol with 5 mm slice thickness.
b. Perform the scan.
c. On the obtained image note the following details:
i. Unit name
ii. Test date
iii. Technique factors used
iv. Operator
Appendix A – Universal image quality assurance phantom user’s manual
Stellenbosch University https://scholar.sun.ac.za

A53
A.2.5.3 Load images into data analysis software
a. Export the raw obtained images from the CT unit control console in Digital Imaging
and Communications in Medicine (DICOM) format. Contact a technician or
medical physicist to write a standing operating procedure (SOP) for doing this for
your unit or department.
b. In the Phantom Scan application, click on File and select Open Image as shown
in Figure A.44.
Figure A.44: Opening an image for analysis.
c. Select the zero-slice or central image from the CT data set and click on Open. The
image will now be displayed in the application, as shown in Figure A.45.
Figure A.45: Image opened in the application and ready for evaluation.
Appendix A – Universal image quality assurance phantom user’s manual
Stellenbosch University https://scholar.sun.ac.za

A54
A.2.5.4 Visual inspection of the obtained images
Load the central or zero slice image into the data analysis software as explained in
section A.2.5.3 above. In the software, view the loaded image and visually inspect the
image to determine:
a. Low contrast detectability
• Visually determine the smallest low contrast detectability insert that can be
seen. Refer to Figure A.1 for the location of these blocks, labelled 1-8 in
Figure A.1 b.).
• Record the size of the smallest visible block in the QC result page (at the end
of the manual).
• If the result is out of tolerance, i.e. the limit in Table A.4 is exceeded, follow
the steps in Figure A.2 for taking corrective action.
b. Positioning and alignment (zero slice position / scan plane localisation)
• Visually check that the central ball appears on the slice located at co-ordinates
x=0, y=0, z=0.
• Record the results in the QC result page (at the end of the manual) and note
the direction in which the deviation was observed.
• If the result fails, i.e. the limit in Table A.4 is exceeded, follow the steps in
Figure A.2 for taking corrective action.
c. Artefacts
• Visually inspect the image for the presence of any artefacts, for example ghost
images, lines, streaks, marks, spots, blur or any other unexpected
appearance.
• Record the artefact seen and where in the image it occurred in the QC result
page (at the end of the manual).
• If the result is out of tolerance, i.e. the limit in Table A.4 is exceeded, follow
the steps in Figure A.2 for taking corrective action.
d. Image quality visual inspection
• Visually inspect the image and note any visual obstructions, grey scale
inversions, distortions or unexpected occurrences in the image.
• Record the manifestation seen and where in the image it occurred in the QC
result page (at the end of the manual).
• If the result is out of tolerance, i.e. the limit in Table A.4 is exceeded, follow
the steps in Figure A.2 for taking corrective action.
Appendix A – Universal image quality assurance phantom user’s manual
Stellenbosch University https://scholar.sun.ac.za

A55
A.2.5.5 Data analysis software evaluation of the obtained images
Load the obtained zero slice image into the data analysis software as explained in
section A.2.5.3 above. Record the results obtained for the following tests.
a. Sensitometry & grey scale linearity (CT number reproducibility)
• In the Sensitometry tab in the application, click on the Region 1 button and
draw a region of interest (ROI) in the insert numbered 9, i.e. air, in Figure A.1
b.). The ROI should be of diameter approximately half the size of the insert,
should not extend beyond the insert or touch the insert edges.
• Click on the Region 2 button and draw a ROI in the insert numbered 10, i.e.
lung, in Figure A.1 b.). The ROI should be of diameter approximately half the
size of the insert, should not extend beyond the insert or touch the insert
edges.
• Repeat this for the Regions 3, 4, 5 and 6 buttons drawing ROIs in the inserts
numbered 11, 12, 13 and 1 in Figure A.1 b.), i.e. supawood, bone, Teflon and
RGD. This is shown in Figure A.46.
Note: First click on the Region button and then draw the ROI.
Figure A.46: Drawing the sensitometry ROIs.
Appendix A – Universal image quality assurance phantom user’s manual
Stellenbosch University https://scholar.sun.ac.za
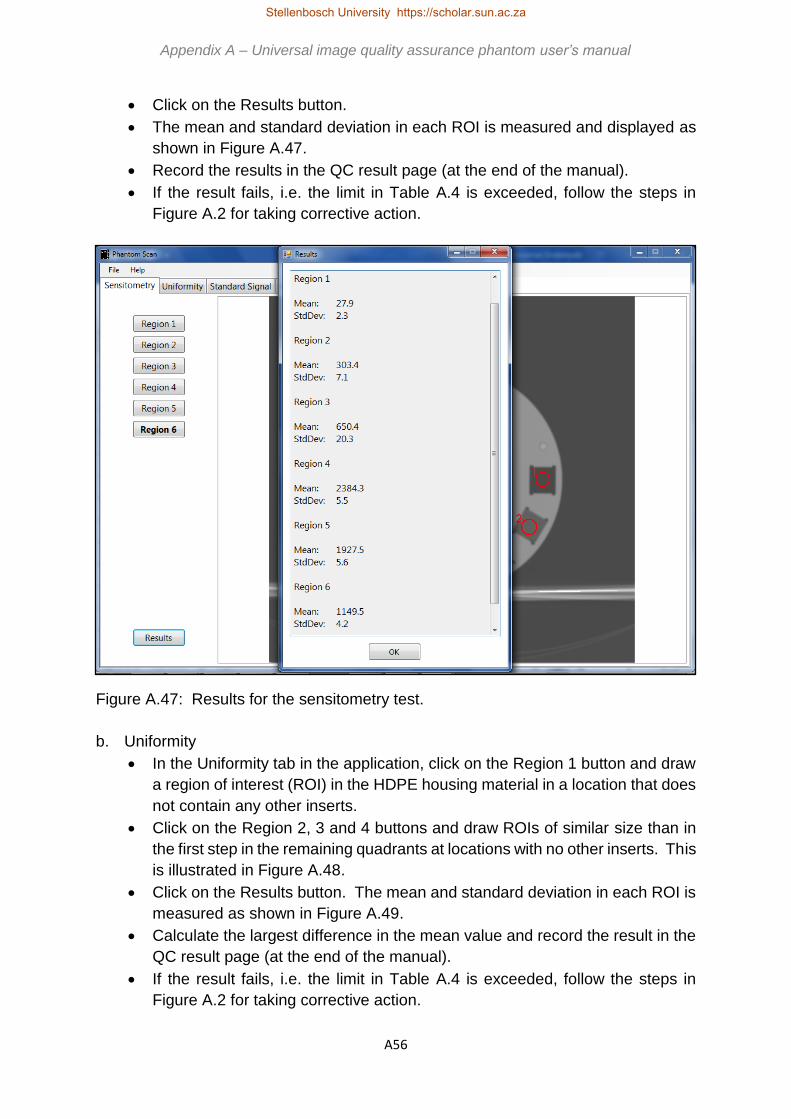
A56
• Click on the Results button.
• The mean and standard deviation in each ROI is measured and displayed as
shown in Figure A.47.
• Record the results in the QC result page (at the end of the manual).
• If the result fails, i.e. the limit in Table A.4 is exceeded, follow the steps in
Figure A.2 for taking corrective action.
Figure A.47: Results for the sensitometry test.
b. Uniformity
• In the Uniformity tab in the application, click on the Region 1 button and draw
a region of interest (ROI) in the HDPE housing material in a location that does
not contain any other inserts.
• Click on the Region 2, 3 and 4 buttons and draw ROIs of similar size than in
the first step in the remaining quadrants at locations with no other inserts. This
is illustrated in Figure A.48.
• Click on the Results button. The mean and standard deviation in each ROI is
measured as shown in Figure A.49.
• Calculate the largest difference in the mean value and record the result in the
QC result page (at the end of the manual).
• If the result fails, i.e. the limit in Table A.4 is exceeded, follow the steps in
Figure A.2 for taking corrective action.
Appendix A – Universal image quality assurance phantom user’s manual
Stellenbosch University https://scholar.sun.ac.za

A57
Figure A.48: Locations for ROIs for uniformity evaluation.
Figure A.49: Results for the uniformity test.
Appendix A – Universal image quality assurance phantom user’s manual
Stellenbosch University https://scholar.sun.ac.za
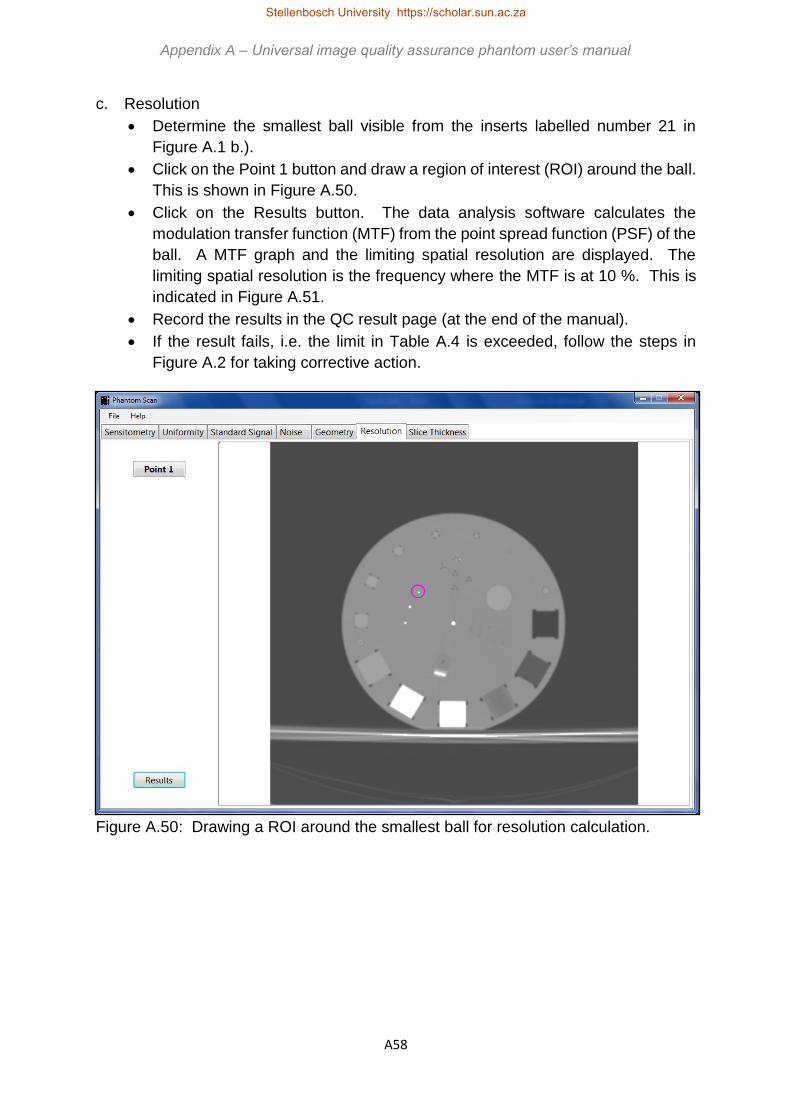
A58
c. Resolution
• Determine the smallest ball visible from the inserts labelled number 21 in
Figure A.1 b.).
• Click on the Point 1 button and draw a region of interest (ROI) around the ball.
This is shown in Figure A.50.
• Click on the Results button. The data analysis software calculates the
modulation transfer function (MTF) from the point spread function (PSF) of the
ball. A MTF graph and the limiting spatial resolution are displayed. The
limiting spatial resolution is the frequency where the MTF is at 10 %. This is
indicated in Figure A.51.
• Record the results in the QC result page (at the end of the manual).
• If the result fails, i.e. the limit in Table A.4 is exceeded, follow the steps in
Figure A.2 for taking corrective action.
Figure A.50: Drawing a ROI around the smallest ball for resolution calculation.
Appendix A – Universal image quality assurance phantom user’s manual Appendix A – Universal image quality assurance phantom user’s manual
Stellenbosch University https://scholar.sun.ac.za

A59
Figure A.51: Results for the resolution test.
d. Image noise
• In the Noise tab in the application, click on the Region 1 button and draw a
region of interest (ROI) in the insert numbered 1 in Figure A.1 b.). The ROI
should be of diameter approximately half the size of the insert, should not
extend beyond the insert or touch the insert edges.
• Click on the Region 2 (background) button and draw a ROI of similar size to
that of Region 1 next to the insert. This is shown in Figure A.52.
• Click on the Results button. The data analysis software shows the mean and
standard deviations obtained in the ROIs and calculates the signal-to-noise
ratio (SNR) and contrast-to-noise ratio (CNR) with Equations A.1 and A.2.
𝑆𝑁𝑅 =𝑚𝑒𝑎𝑛
𝑠𝑡𝑎𝑛𝑑𝑎𝑟𝑑 𝑑𝑒𝑣𝑖𝑎𝑡𝑖𝑜𝑛 [Equation A.1]
𝐶𝑁𝑅 =𝑚𝑒𝑎𝑛(𝑎)−𝑚𝑒𝑎𝑛(𝑏)
𝑠𝑡𝑎𝑛𝑑𝑎𝑟𝑑 𝑑𝑒𝑣𝑖𝑎𝑡𝑖𝑜𝑛(𝑏) [Equation A.2]
• Record the results, as shown in Figure A.53, in the QC result page (at the end
of the manual).
• If the result fails, i.e. the limit in Table A.4 is exceeded, follow the steps in
Figure A.2 for taking corrective action.
Appendix A – Universal image quality assurance phantom user’s manual
Stellenbosch University https://scholar.sun.ac.za

A60
Figure A.52: Drawing ROIs for image noise analysis.
Figure A.53: Results for the noise test.
Appendix A – Universal image quality assurance phantom user’s manual Appendix A – Universal image quality assurance phantom user’s manual
Stellenbosch University https://scholar.sun.ac.za

A61
e. Geometry and measurement tools (distance accuracy / scaling errors)
• In the Geometry tab in the application, click on the Line 1 button and draw a
vertical line from edge to edge in the insert numbered 17 in Figure A.1 b.).
• Click on the Line 2 button and draw a horizontal line from edge to edge in the
same insert. This is shown in Figure A.54.
• Click on the Results button. The data analysis software measures the length
of the drawn lines as indicated in Figure A.55.
• The actual size of the insert is 20 mm diameter. Compare the actual size of the
insert to that measured with the software and calculate the difference.
• Record the results in the QC result page (at the end of the manual).
• If the result fails, i.e. the limit in Table A.4 is exceeded, follow the steps in Figure
A.2 for taking corrective action.
Figure A.54: Geometry measurement lines.
Appendix A – Universal image quality assurance phantom user’s manual
Stellenbosch University https://scholar.sun.ac.za

A62
Figure A.55: Results for the geometry test.
f. Standard signal
• In the Standard Signal tab in the application, click on the Region 1 button and
draw a region of interest (ROI) in the HDPE housing material at the location
labelled 15 in Figure A.1 b.). This is shown in Figure A.56.
• Click on the Results button. The software measures and displays the mean
and standard deviation in the ROI as shown in Figure A.57.
• Record the results in the QC result page (at the end of the manual).
• If the result fails, i.e. the limit in Table A.4 is exceeded, follow the steps in Figure
A.2 for taking corrective action.
Appendix A – Universal image quality assurance phantom user’s manual
Stellenbosch University https://scholar.sun.ac.za

A63
Figure A.56: Drawing a ROI for standard signal evaluation.
Figure A.57: Results for the standard signal test.
Appendix A – Universal image quality assurance phantom user’s manual Appendix A – Universal image quality assurance phantom user’s manual
Stellenbosch University https://scholar.sun.ac.za

A64
g. Slice thickness
• In the Slice Thickness tab in the application, click on the Select background
button and draw a region of interest (ROI) next to the slice thickness ramp,
labelled as number 20 in Figure A.1 b.). This is shown in Figure A.58.
Figure A.58: Location of the background ROI.
• Click on the Adjust Window Level button. The image will become white as
shown in Figure A.59.
Appendix A – Universal image quality assurance phantom user’s manual
Stellenbosch University https://scholar.sun.ac.za

A65
Figure A.59: White image after clicking on the Adjust Window Level button.
• Use the slider below the Adjust Window Level button and slide to the right until
the slice thickness ramp, displayed as white, just disappears completely. This
is illustrated in Figure A.60.
Appendix A – Universal image quality assurance phantom user’s manual
Stellenbosch University https://scholar.sun.ac.za

A66
a.)
b.)
Appendix A – Universal image quality assurance phantom user’s manual
Stellenbosch University https://scholar.sun.ac.za

A67
Figure A.60: Adjusting the window level using the slider. a.) Slice thickness ramp still
large. b.) Slice thickness ramp becoming less visible. c.) Slice thickness ramp just
disappeared.
• Click on the Measure button. The image will adjust to show the slice thickness
ramp as shown in Figure A.61.
• Use the Zoom In and Zoom Out buttons and the vertical slider to zoom in on
the ramp, as illustrated in Figure A.62.
• Draw a straight line across the displayed ramp as shown in Figure A.62.
• Click on the Results button. The measured slice thickness is displayed as
shown in Figure A.63.
• Record the results in the QC result page (at the end of the manual).
• If the result fails, i.e. the limit in Table A.4 is exceeded, follow the steps in Figure
A.2 for taking corrective action.
c.)
Appendix A – Universal image quality assurance phantom user’s manual
Stellenbosch University https://scholar.sun.ac.za

A68
Figure A.61: Image corrected for slice thickness measurement.
Figure A.62: Using the Zoom In function to visualise the slice thickness ramp and
drawing the line (green) for measurement.
Appendix A – Universal image quality assurance phantom user’s manual
Stellenbosch University https://scholar.sun.ac.za

A69
Figure A.63: Results for the slice thickness test.
A.2.5.6 Saving and printing the results
• Click on File and select Save Results as shown in Figure A.64 a.).
• Enter a file name and choose the location where you want to save the results,
as indicated in Figure A.64 b.).
• To print the results in hard copy, go to the selected save location, select the
file name to be printed and double left click to open the file in Notepad.
• In Notepad, click on File and select Print. This is shown in Figure A.24 a.).
• Select the printer you want to use and click on Print, as shown in Figure A.24
b.).
• Sign and file the hard copy results.
Appendix A – Universal image quality assurance phantom user’s manual
Stellenbosch University https://scholar.sun.ac.za

A70
Figure A.64: Saving the obtained results. a.) Selecting the save option in the
application. b.) Choosing the location to save to.
Appendix A – Universal image quality assurance phantom user’s manual Appendix A – Universal image quality assurance phantom user’s manual
Stellenbosch University https://scholar.sun.ac.za

A71
Figure A.24: Printing the results from Notepad. a.) Selecting the print option. b.)
Selecting the printer.
a.)
b.)
Appendix A – Universal image quality assurance phantom user’s manual
Stellenbosch University https://scholar.sun.ac.za
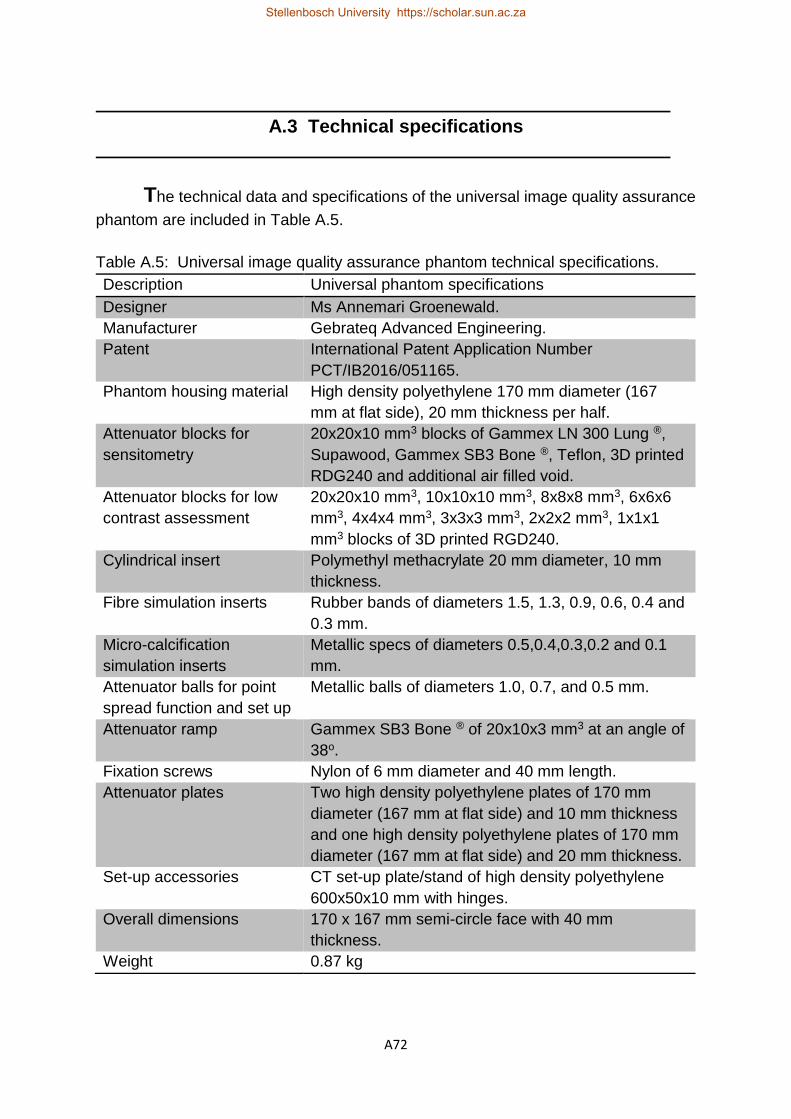
A72
A.3 Technical specifications
The technical data and specifications of the universal image quality assurance
phantom are included in Table A.5.
Table A.5: Universal image quality assurance phantom technical specifications.
Description Universal phantom specifications
Designer Ms Annemari Groenewald.
Manufacturer Gebrateq Advanced Engineering.
Patent International Patent Application Number
PCT/IB2016/051165.
Phantom housing material High density polyethylene 170 mm diameter (167
mm at flat side), 20 mm thickness per half.
Attenuator blocks for
sensitometry
20x20x10 mm3 blocks of Gammex LN 300 Lung ®,
Supawood, Gammex SB3 Bone ®, Teflon, 3D printed
RDG240 and additional air filled void.
Attenuator blocks for low
contrast assessment
20x20x10 mm3, 10x10x10 mm3, 8x8x8 mm3, 6x6x6
mm3, 4x4x4 mm3, 3x3x3 mm3, 2x2x2 mm3, 1x1x1
mm3 blocks of 3D printed RGD240.
Cylindrical insert Polymethyl methacrylate 20 mm diameter, 10 mm
thickness.
Fibre simulation inserts Rubber bands of diameters 1.5, 1.3, 0.9, 0.6, 0.4 and
0.3 mm.
Micro-calcification
simulation inserts
Metallic specs of diameters 0.5,0.4,0.3,0.2 and 0.1
mm.
Attenuator balls for point
spread function and set up
Metallic balls of diameters 1.0, 0.7, and 0.5 mm.
Attenuator ramp Gammex SB3 Bone ® of 20x10x3 mm3 at an angle of
38o.
Fixation screws Nylon of 6 mm diameter and 40 mm length.
Attenuator plates Two high density polyethylene plates of 170 mm
diameter (167 mm at flat side) and 10 mm thickness
and one high density polyethylene plates of 170 mm
diameter (167 mm at flat side) and 20 mm thickness.
Set-up accessories CT set-up plate/stand of high density polyethylene
600x50x10 mm with hinges.
Overall dimensions 170 x 167 mm semi-circle face with 40 mm
thickness.
Weight 0.87 kg
Stellenbosch University https://scholar.sun.ac.za

A73
The data analysis software is a Microsoft .NET application written in C# by Ernst Uys
and is licensed to the developer as shown under About in the Help menu in the
application. This is included in Figure A.65.
Figure A.65: Phantom Scan data analysis software licence.
Appendix A – Universal image quality assurance phantom user’s manual
Stellenbosch University https://scholar.sun.ac.za

A74
A.4 Service manual
Caring for the universal image quality assurance phantom is explained in this
section.
A.4.1 Cleaning
• The phantom housing can be cleaned by wiping it down with a water damp soft
cloth.
• The phantom may not be immersed in water or another liquid.
• A mild soapy solution or common disinfectant can be used.
• No alcohol, corrosives or solvents may be used on the phantom.
A.4.2 Preventative maintenance
• Check the phantom housing for signs of mechanical damage prior to each use.
• If damages are noted, contact the manufacturer for repairs.
• Under normal conditions of use, the universal image quality assurance phantom
is robust and therefore requires no preventative maintenance.
• Results from the data analysis program must be saved, backed up, printed and/or
stored. This is the responsibility of the user.
A.4.3 Disposal
• The universal image quality assurance phantom contains no biohazardous
substances.
• The materials of the universal image quality phantom are non-biodegradable.
• Most materials are plastic and can be re-cycled.
Appendix A – Universal image quality assurance phantom user’s manual
Stellenbosch University https://scholar.sun.ac.za

A75
A.5 Quality Control Records
Example quality control (QC) record sheets are included. It is recommended
that users copy these sheets, creating a record file for each of the different x-ray units
in the department. The operator should also include as much detail about the
exposure and obtained results as possible, with detailed comments. This assists in
future evaluation and comparison of results, for a specific unit and for comparison
between different units. It also aids technicians and medical physicists in fault finding
when results are out of tolerance.
Appendix A – Universal image quality assurance phantom user’s manual
Stellenbosch University https://scholar.sun.ac.za

A76
Appendix A – Universal image quality assurance phantom user’s manual Appendix A – Universal image quality assurance phantom user’s manual
Stellenbosch University https://scholar.sun.ac.za
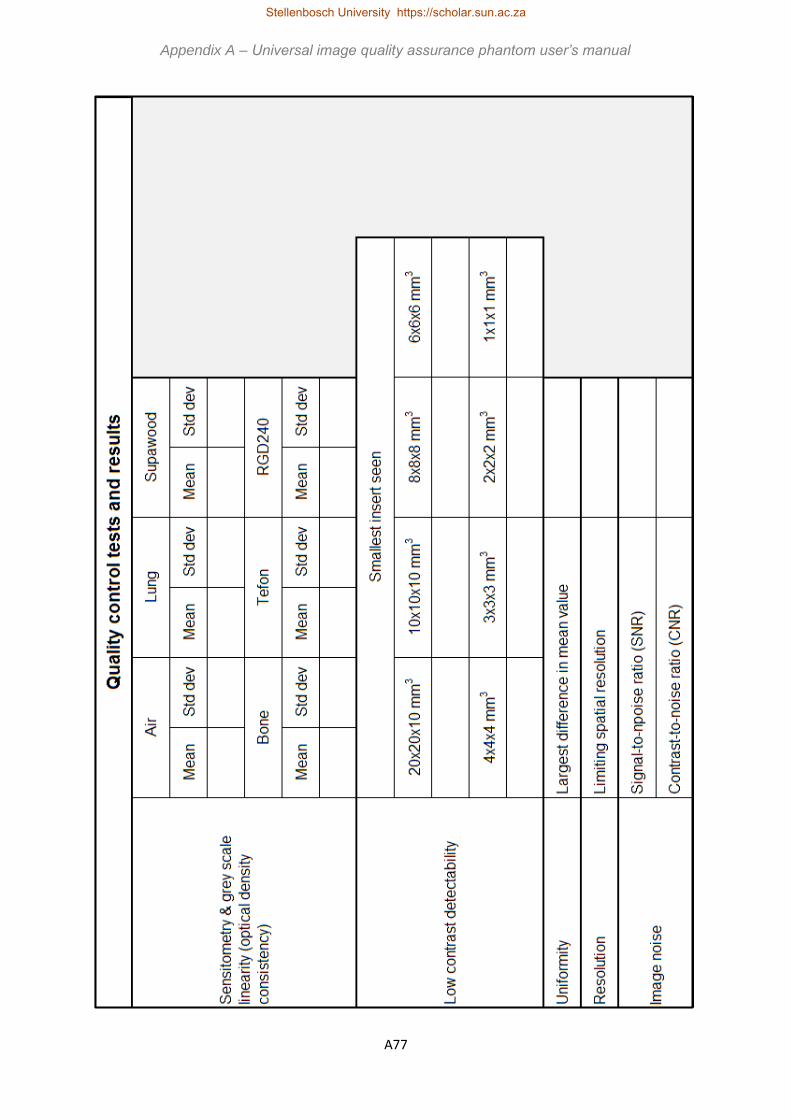
A77
Appendix A – Universal image quality assurance phantom user’s manual
Stellenbosch University https://scholar.sun.ac.za

A78
Appendix A – Universal image quality assurance phantom user’s manual
Stellenbosch University https://scholar.sun.ac.za

A79
Appendix A – Universal image quality assurance phantom user’s manual
Stellenbosch University https://scholar.sun.ac.za

A80
Appendix A – Universal image quality assurance phantom user’s manual
Stellenbosch University https://scholar.sun.ac.za

A81
Appendix A – Universal image quality assurance phantom user’s manual
Stellenbosch University https://scholar.sun.ac.za

A82
Appendix A – Universal image quality assurance phantom user’s manual
Stellenbosch University https://scholar.sun.ac.za

A83
Appendix A – Universal image quality assurance phantom user’s manual
Stellenbosch University https://scholar.sun.ac.za

A84
Appendix A – Universal image quality assurance phantom user’s manual
Stellenbosch University https://scholar.sun.ac.za

A85
Appendix A – Universal image quality assurance phantom user’s manual
Stellenbosch University https://scholar.sun.ac.za
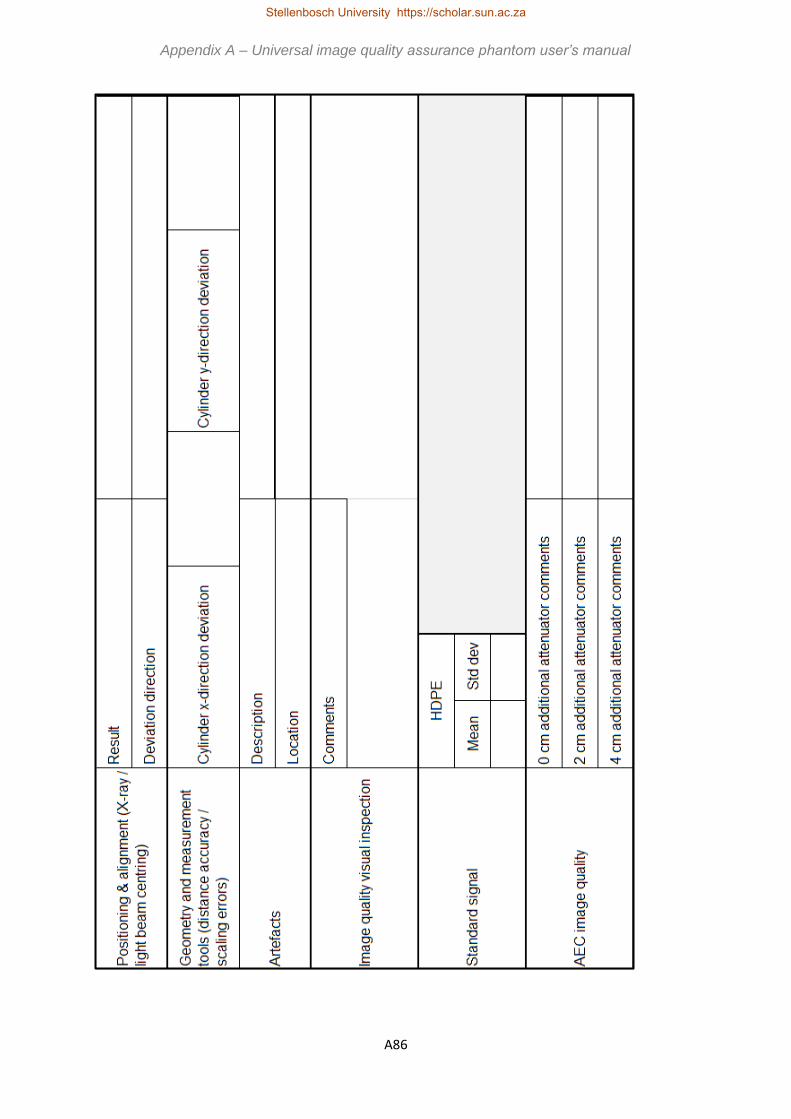
A86
Appendix A – Universal image quality assurance phantom user’s manual
Stellenbosch University https://scholar.sun.ac.za

A87
Appendix A – Universal image quality assurance phantom user’s manual
Stellenbosch University https://scholar.sun.ac.za
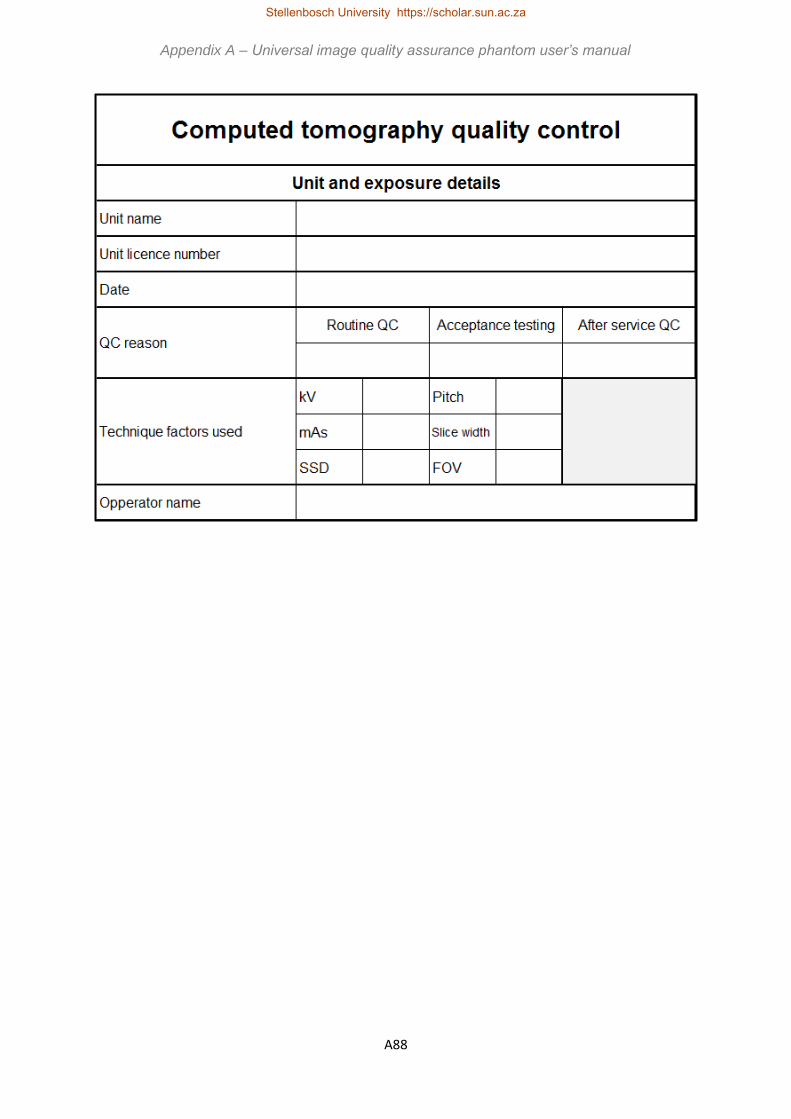
A88
Appendix A – Universal image quality assurance phantom user’s manual
Stellenbosch University https://scholar.sun.ac.za
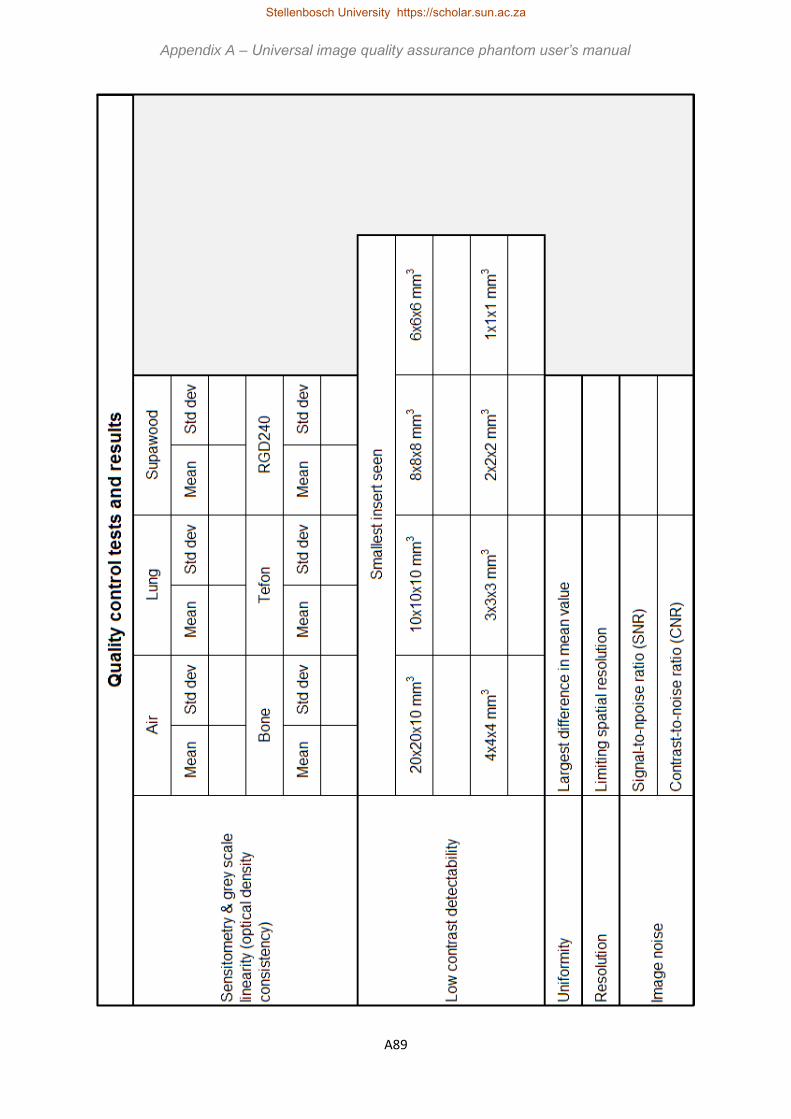
A89
Appendix A – Universal image quality assurance phantom user’s manual
Stellenbosch University https://scholar.sun.ac.za

A90
Appendix A – Universal image quality assurance phantom user’s manual
Stellenbosch University https://scholar.sun.ac.za

B1
Appendix B
Data analysis software
The data analysis software was developed by Ernst Uys, protected under copy right
as in Figure B.1.
Figure B.1: Data analysis software copy right notice.
The application runs on Microsoft Windows (version 7 and higher) and is written in C#
7.0 (https://docs.microsoft.com/en-us/dotnet/articles/csharp), using .NET Framework
4.6.1 (https://www.microsoft.com/net). DICOM image parsing is done using the Fellow
Oak DICOM library (https://github.com/fo-dicom/fo-dicom), which is licensed under the
open source Microsoft Public License (https://opensource.org/licenses/MS-PL). The
Math.NET Numerics library (https://numerics.mathdotnet.com/) is used for numerical
computations and is licensed under the open source MIT/X11 license
(https://numerics.mathdotnet.com/License.html).
Each high-level function, i.e. sensitometry, uniformity, standard signal, noise,
geometry, resolution and slice thickness, is implemented in a separate module, as is
DICOM image parsing and pre-processing. DICOM image pre-processing involves
catering for the most common DICOM image modalities, including general x-rays,
fluoroscopy, mammography and CT scanning, and rendering the DICOM image for
Stellenbosch University https://scholar.sun.ac.za

B2
display, since the dynamic range of most DICOM images exceeds that of typical
consumer-level monitors.
For sensitometry, uniformity and standard signal, ROIs are drawn specific inserts or
locations in the phantom, as described in the user’s manual in Appendix A. The
software determines the mean and standard deviation in each of these ROIs. The
results are displayed to one decimal place.
For noise analysis, ROIs are again used and SNR and CNR are calculated with
Equations B.1 and B.2.
𝑆𝑁𝑅 =𝑚𝑒𝑎𝑛
𝑠𝑡𝑎𝑛𝑑𝑎𝑟𝑑 𝑑𝑒𝑣𝑖𝑎𝑡𝑖𝑜𝑛 [Equation B.1]
𝐶𝑁𝑅 =𝑚𝑒𝑎𝑛(𝑜𝑏𝑗𝑒𝑐𝑡)−𝑚𝑒𝑎𝑛(𝑏𝑎𝑐𝑘𝑔𝑟𝑜𝑢𝑛𝑑)
𝑠𝑡𝑎𝑛𝑑𝑎𝑟𝑑 𝑑𝑒𝑣𝑖𝑎𝑡𝑖𝑜𝑛(𝑏𝑎𝑐𝑘𝑔𝑟𝑜𝑢𝑛𝑑) [Equation B.2]
The mean and standard deviation values are displayed for the ROIs, together with the
SNR and CNR, to one decimal place.
For the geometry module lines are drawn in the cylindrical insert and the length of the
line is measured with the software and reported to one decimal place in mm.
Resolution is reported as a MTF plot showing the limiting spatial resolution as the
cycles/cm value at 10 % MTF, to two decimal places. The software calculates the
MTF from a PSF of a metallic bead, smaller than a pixel in size. By selecting a region
around the specified bead, as described in Appendix A, the software creates a matrix
of the obtained PSF. Background is measured in a ROI and this is subtracted from
each matrix element to form a new matrix. The sum of the columns of this matrix is
the LSF, which is plotted by giving each value a relative position. The Fourier
transform of each LSF value is calculated in imaginary format. This is converted to
real numbers by taking the absolute value. The absolute values are normalised by
dividing by the maximum value to give the MTF values. The cycles/cm are calculated
Appendix B – Data analysis software
Stellenbosch University https://scholar.sun.ac.za

B3
as half of the size of the matrix used for imaging divided by the field of view. The MTF
values are plotted against the cycles/cm values for the resultant graph.
For CT slice thickness the FWHM is determined. A background ROI is drawn next to
the slice thickness ramp and the software measures the mean CT number in this ROI.
The WW is then automatically adjusted to the minimum achievable by the software.
The WL is then adjusted by the user to where the ramp just completely disappears
from the image. This is the peak CT number. When the user now clicks the measure
button, the software then calculates the net CT number as the peak CT number minus
the background CT number. It then calculates 50 % of this net CT number and adds
the background CT number to this result to obtain the FWHM value. It automatically
adjusts the image to the FWHM value and the user can draw a line across the seen
ramp. The software measures the length of this ramp and displays the result to one
decimal place in mm. Here the software also provides a zoom in and zoom out
functionality, so that the user can draw the line more accurately on a zoomed in image.
The image as displayed in the software is also visually inspected for low contrast
detectability, artefacts, positioning and alignment, image quality visual inspection and
masses, fibres and micro-calcifications in mammography.
Appendix B – Data analysis software
Stellenbosch University https://scholar.sun.ac.za

C1
Appendix C
Density calculations
C.1 Calculation of density of gasket rubber o-rings used for mammography
fibre simulation
O-rings, used in watch manufacturing, were used to simulate mammography fibres in
the phantom. Five o-ring were weighed on a Sartorius scale and were cut and the
lengths and diameters measured with a Vernier calliper. The results are shown in
Table C.1. The volume, 𝑉, of a cylinder is calculated with Equation C.1. Here 𝜋 is
the mathematical constant pie, 𝑟 is the radius and ℎ the height of the cylinder.
Equation C.2, where 𝜌 is the desnity, 𝑀 is the mass and 𝑉 is the volume, was used
to calculate the density.
𝑉 = 𝜋𝑟2ℎ [Equation C.1]
𝜌 =𝑀
𝑉 [Equation C.2]
Table C.1: Rubber o-ring density calculation values.
Description Value
Average mass (g) 0.0796
Average diameter (cm) 0.0900
Average length (cm) 9.9500
Volume (cm3) 0.0633
Density (gcm-3) 1.2575
Stellenbosch University https://scholar.sun.ac.za

C2
C.2 Calculation of density of supawood used for sensitometry insert
The dimensions of the supawood block were measured with a Vernier calliper and its
mass was weighed on a Sartorius scale. The obtained values are included in Table
C.2. Equation C.2 as above was used to calculate the density, with the volume, 𝑉,
calculated with Equation C.3, where 𝑙 is the length, 𝑤 the width and ℎ the height of
the block.
𝑉 = 𝑙 × 𝑤 × ℎ
[Equation C.3]
Table C.2: Supawood density calculation values.
Description Value
Mass (g) 5.982
Length (cm) 2.005
Width (cm) 2.009
Height (cm) 2.007
Volume (cm3) 8.084
Density (gcm-3) 0.740
Appendix C – Density calculations
Stellenbosch University https://scholar.sun.ac.za

C3
C.3 Calculation of density of Objet RGD240 3-D printing material used for low
contrast detectability inserts
A Vernier calliper was used to measure the dimensions of one of the 3-D printed
blocks. It was weighed on a Sartorius scale. Equations C.2 and C.3 as above were
used and the density of the material was calculated with the values tabulated in Table
C.3.
Table C.3: RGD240 density calculation values.
Description Value
Mass (g) 4.761
Length (cm) 2.008
Width (cm) 2.010
Height (cm) 1.005
Volume (cm3) 4.056
Density (gcm-3) 1.174
Appendix C – Density calculations
Stellenbosch University https://scholar.sun.ac.za

D1
Appendix D
Publication and presentation
D.1 Publication
JOURNAL OF APPLIED CLINICAL MEDICAL PHYSICS, VOLUME 17, NUMBER 6, 2016
Development of a universal medical X-ray imaging phantom prototype
Annemari Groenewald1a and Willem A. Groenewald2 Equra Health,1 Vergelegen Oncology Unit, 1 Arun Place, Sir Lowry’s Pass Road, Somerset West, South Africa; Department of Medical Imaging and Clinical Oncology,2 Stellenbosch University and
Tygerberg Academic Hospital, Cape Town, South Africa [email protected]
Received 3 March, 2016; accepted 6 July, 2016
Diagnostic X-ray imaging depends on the maintenance of image quality that allows for proper
diagnosis of medical conditions. Maintenance of image quality requires quality assurance
programs on the various X-ray modalities, which consist of projection radiography (including
mobile X-ray units), fluoroscopy, mammography, and computed tomography (CT) scanning.
Currently a variety of modality-specific phantoms are used to perform quality assurance (QA)
tests. These phantoms are not only expensive, but suitably trained personnel are needed to
successfully use them and interpret the results. The question arose as to whether a single
universal phantom could be designed and applied to all of the X-ray imaging modalities. A
universal phantom would reduce initial procurement cost, possibly reduce the time spent on
QA procedures and simplify training of staff on the single device. The aim of the study was to
design and manufacture a prototype of a universal phantom, suitable for image quality
assurance in general X-rays, fluoroscopy, mammography, and CT scanning. The universal
phantom should be easy to use and would enable automatic data analysis, pass/fail reporting,
and corrective action recommendation. In addition, a universal phantom would especially be
of value in low-income countries where finances and human resources are limited. The design
process included a thorough investigation of commercially available phantoms. Image quality
parameters necessary for image quality assurance in the different X-ray imaging modalities
were determined. Based on information obtained from the above-mentioned investigations,
a prototype of a universal phantom was developed, keeping ease of use and reduced cost in
mind. A variety of possible phantom housing and insert materials were investigated,
considering physical properties, machinability, and cost. A three-dimensional computer model
of the first phantom prototype was used to manufacture the prototype housing and inserts.
Some of the inserts were 3D-printed, others were machined from different materials. The
different components were assembled to form the first prototype of the universal X-ray
Stellenbosch University https://scholar.sun.ac.za

D2
imaging phantom. The resulting prototype of the universal phantom conformed to the aims of
a single phantom for multiple imaging modalities, which would be easy to use and
manufacture at a reduced cost. A PCT International Patent Application No. PCT/IB2016/051165
has been filed for this technology.
PACS number(s): 87.57.C, 87.59.-e
Key words: image quality assurance, phantom, diagnostic radiology, X-ray imaging, prototype a Corresponding author: Annemari Groenewald, Vergelegen Oncology Unit, 1 Arun Place, Sir Lowry’s Pass Road, Somerset
West, South Africa 7130; phone: (0027) 21 851 2255; fax: (0027) 21 852 3089; email: [email protected]
356 356
I. INTRODUCTION Different imaging modalities are used in diagnostic radiology to diagnose and follow up a variety of
disease conditions. In order to ensure that the images are of acceptable quality for accurate clinical
diagnosis, image quality has to be evaluated and maintained. Image quality is a subjective concept
that requires certain measures in order to be quantified; by using a phantom, for example. Currently
modality-specific phantoms are used for image quality assurance in each of these imaging modalities.
The commercially available phantoms for mammography include the American College of Radiology
(ACR) mammography phantom that contains fibres (1.56, 1.12, 0.89, 0.75, 0.54, and 0.40 mm in
diameter) and simulates tumorous masses with 2.00, 1.00, 0.75, 0.50, and 0.25 mm diameter
hemispheres, as well as micro-calcifications with 0.54, 0.40, 0.32, 0.24, and 0.16 mm speck groups.(1)
The ACR mammography phantom is 4.2 cm thick and consists of 3.5 cm Lucite and a 0.7 cm thick
paraffin insert, which contains the image quality indicators.(2) The NORMI PAS phantom (PTW-Freiburg
GmbH, Freiburg, Germany) is used for image quality assurance on digital mammography units. The
base plate of the phantom is semicircular to simulate breast shape. Two rows of balls are used at chest-
wall side to investigate image alignment. An aluminium step-wedge can be placed in a cutout in the
base plate. The stepwedge consists of 14 steps 0–5.2 mm in thickness for sensitometry evaluation.
Alternatively, a polymethyl methacrylate (PMMA) step-wedge with 14 steps of 0–39 mm thickness can
be inserted in the cutout. Different test elements can be fitted into the cutout in the structure layer.
The PMMA test element is used to assess optical density in a region of interest (ROI). The signal-
difference-to-noise ratio (SDNR) is calculated from the SDNR test element, which is used to measure
average pixel values for the calculation. The ACR test element contains fibres, microcalcifications, and
tumorous masses for visual image quality evaluation. Fibres have diameters of 1.5, 1.1, 0.9, 0.7, 0.55,
and 0.4 mm. Masses have thicknesses of 2.0, 1.0, 0.75, 0.5, and 0.25 mm. The speck groups used to
simulate microcalcifications are 0.5, 0.4, 0.3, 0.2, and 0.12 mm in diameter. A dose detector can also
be fitted in the phantom.(3)
For CT scanning the Catphan CT phantom (The Phantom Laboratory, Greenwich, NY) has two low-
contrast modules. The supra-slice region has three groups of inserts, each with nine circular objects
with diameters between 2 and 15 mm and contrast of 0.3%, 0.5%, and 1.0%. In the subslice module
three groups of four inserts each are contained. Diameters range between 3 and 9 mm and contrast
is fixed at 1.0%.(4) The Gammex ACR CT phantom (Gammex RMI, Middleton, WI) is made from Solid
Water and has a 20 cm diameter and 16 cm length. It contains water-equivalent, bone-equivalent,
acrylic, air, and polyethylene inserts for CT-number linearity assessment. A 0.011 mm diameter
Appendix D – Publication and presentation
Stellenbosch University https://scholar.sun.ac.za

D3
tungsten carbide bead is used for modulation transfer function (MTF) calculation. Aluminium and
polystyrene line pair material is used for resolution assessment with bar phantoms 4, 5, 6, 7, 8, 9, 10,
and 12 line pairs per centimetre (lp/cm). Steel balls of 1 mm diameter are used for positioning and
alignment checks and 0.28 mm ball bearings for distance measurements on an axial slice. A low-
contrast rod module is used for low-contrast resolution with 6, 5, 4, 3, and 2 mm diameter cylinders
at a contrast 0.6% different from background. Four cylinders of each diameter are included. CT-
number uniformity is assessed with ROI analysis. Slice thickness is checked with two wire ramps
evident in 0.5 mm z-axis increments.(5)
The CIRS Model 903 phantom (Radcal Corporation, Monrovia, CA) is used in radiography. It has low-
contrast evaluation holes in an aluminium disk at 9.5 mm diameter and 1.73, 1.24, 0.89, 0.64, 0.46,
0.32, 0.23, 0.16, and 0.10 mm depths. High contrast is assessed with a mesh of 0.47, 0.63, 0.79, 0.94,
1.18, 1.57, 1.97, 2.36, and 3.15 line pairs per millimetre (lp/mm) and also contains a contrast detail
insert.(6) The NORMI 13 phantom (PTW-Freiburg GmbH) is designed for acceptance and constancy
tests for digital projection radiography. The phantom tests signal standardization by measuring the
brightness of an image at a central area. It has seven dynamic steps, consisting of different thickness
copper plates from 0.0 mm to 2.3 mm, for evaluation of contrast resolution. The steps should be
separately identifiable. For low-contrast evaluation, six disks with contrasts of 0.8% to 5.6% are visually
inspected at an image window setting where all seven dynamic steps are depicted differently. For
homogeneity the optical density or luminance is measured in five different areas, at the center and at
the four corners of the image. A lead foil test pattern is used to evaluate spatial resolution, using a
magnifying glass. Image geometry is assessed by measuring the distances between different lines.
These lines are also used to assess scaling and are checked for distortions. The variation between the
light field and X-ray field is investigated using the different field size radiopaque field edge marker
lines. The image is also evaluated for the presence of artifacts. An additional copper plate is supplied
for use with higher kV setting (e.g., 100 kV). The phantom can also evaluate delivered radiation dose
by establishing a dose indicator versus image brightness relationship at acceptance testing.(7)
The TOR CDRH Fluoroscopic phantom (Leeds Test Objects, Broughbridge, UK) has eight low-contrast
test holes of the same diameter, 9.5 mm, and depths ranging between 0.16 to 1.73 mm.(8) The NORMI
Rad/Flu phantom (PTW-Freiburg GmbH) is used for acceptance and constancy testing in fluoroscopy.
It incorporates a copper step-wedge for sensitometry assessment, a resolution test pattern, a grid
plate, and eight low-contrast detection inserts.(9) The resolution is assessed visually by reading the
lp/mm resolved from the lead-foil roster. Resolutions from 0.6 to 5.0 lp/mm are included. Contrast is
visually evaluated with a copper step-wedge, with 17 steps of thickness 0.00 to 3.48 mm at depths of
13 mm and 5 mm.(10) The readings and difference between the gray-scale values of two specified steps
is recorded for signal standardization and contrast calculation. Contrast detail inserts are visually
inspected for visibility.(11) Eight inserts of 10 mm diameter and depth of 0.4 to 4.0 mm are used as well
as 16 inserts, one in each step-wedge step, of 4 mm diameter at 2.5 mm depth.(10) For position
verification the distance between the mid-marks on the test object and the center of the radiation
limiting field is measured. The diameter of the object is also measured.(11) All of these commercially
available phantoms described are X-ray imaging modality specific. In addition, several exposures are
needed for comprehensive image quality control with some of these phantoms (e.g., NORMI Rad/Flu
and NORMI PAS), which have loose inserts for assessing different image quality parameters. Loose
inserts can be lost or damaged. The Catphan is a modular phantom and hence several different slices
Appendix D – Publication and presentation
Stellenbosch University https://scholar.sun.ac.za

D4
are needed for image quality control in CT scanning. A single modality nonspecific phantom, all-
inclusive nonmodular phantom, requiring single exposure and single slice analysis, is not currently
commercially available.
Image quality is defined in terms of three parameters: contrast, spatial resolution, and noise. Image
contrast is the difference in the gray scales of adjoining regions in an image. It is affected by subject,
detector, and display contrast. Subject contrast is differences in signal before it is registered as part of
the image. Detector contrast describes how the detector converts the signal into output and digital
image. Post-acquisition image processing affects display contrast.(12) Spatial resolution describes an
imaging system’s capability to distinguish two closely adjoining structures as separate as they become
smaller and closer together (i.e., the amount of detail in the image). It is described by a point-spread-
function (PSF), line-spread-function (LSF) or edge-spread-function (ESF) and these are used to
calculate the MTF, which shows the percentage of an object’s contrast as a function of its size.(12) Noise
is a random “grainy” appearance in an image. Quantum noise is determined by the number of signals
used to form the image and it influences the ability to detect low-contrast objects.(12) The image-quality
parameters that have to be assessed with X-ray producing equipment in the diagnostic radiology
environment include image reproducibility, circular symmetry, spatial linearity, high-contrast
resolution, low-contrast detectability, image uniformity, spatial resolution, scaling, magnification,
blurring, contrast-detail relationships, and the presence of artifacts.(13,14) Misdiagnosis due to poor
image quality is possible, causing details such as small lesions and abnormalities to be missed. Image
blurring, artifacts, high levels of image noise, and poor low-contrast detectability are examples of
image-quality degradation contributory factors.
X-ray imaging modalities, including general X-rays, fluoroscopy, mammography, and CT scanning,
employ X-rays for image formation. X-rays penetrate the body and interact with tissues in order to
obtain useful information about the internal anatomy, as illustrated by the produced image.(15) Clinical
performance of imaging systems may be assessed systemically with a good QA program. Routine
image quality control (QC) compares results obtained at regular test intervals to the results obtained
at acceptance testing of the equipment or to the determined baseline values. Deviations from the
acceptance test or baseline values are indicative of changes in image quality. Routine QC provides a
framework for continuous improvement through routine feedback and assists in identification of
deviations from ideal performance (i.e., producing images with clinically relevant and diagnostically
acceptable image quality). This could positively impact patient care.(16)
Three main problems are identified in the field of image quality assurance in resource-limited
institutions. The biggest concern is cost. The commercially available image quality assurance phantoms
are expensive. Each imaging modality currently uses dedicated phantoms, hence several different
phantoms are needed for comprehensive image quality assurance. Secondly, human resource
deficiency, including manpower and expertise, is a limiting factor. Many institutions do not employ
sufficiently trained personnel (e.g., medical physicists) to work with and analyze data from
complicated commercially available phantoms. The third problem is time constraints. Image quality
assurance result analyses, and decisions on needed corrective action, take time. The lack of available
data analysis time is amplified by the human resource deficiency problem in resource-limited
institutions.
Appendix D – Publication and presentation
Stellenbosch University https://scholar.sun.ac.za

D5
These limitations can be addressed by a universal phantom that would enable the required image
quality assurance tests for all existing X-ray modalities to be done. A universal image quality assurance
phantom that is user-friendly, robust, cheaper, compact, and allows for semiautomatic result analysis
and recommendation of corrective action, with accompanying data analysis software, is needed. The
universal image quality assurance package would include data analysis software and a user’s manual
explaining test objectives, phantom setup, procedures, and result analysis, as well as setting of
baseline values for use in all the X-ray imaging modalities. The aim of this research is the design,
development, and manufacturing of such a phantom, of which the prototype is described here.
II. MATERIALS AND METHODS The image quality assurance parameters that were focused on included low-contrast detectability,
high-contrast resolution, signal-to-noise ratios (SNR), contrast-to-noise rations (CNR), image
uniformity, sensitometry for planar imaging (like general X-rays, fluoroscopy and mammography),
Hounsfield unit (HU) or CT number linearity for CT scanning and the presence of artifacts. For CT
scanning, zero-slice position and slice thickness should also be evaluated. In mammography
microcalcifications, masses and fibres were assessed. The proposed phantom had to evaluate all these
parameters without being a combination of the existing commercially available phantoms (i.e., it
should be unique).
Routine QC compares obtained results to set baseline or acceptance testing values and the objective
is identifying deviations from these initial values. Figure 1 shows the three-dimensional design of the
first phantom prototype. The cubic inserts were arranged perpendicular to the X-ray beam central axis
in the CT scanning (upright) and planar (flat) imaging orientations, along the periphery of the phantom.
Cubes made from the same material but with different sizes were used for low-contrast detectability
and mammography masses. The density of these cubes was selected to be slightly higher than that of
the surrounding housing material. Cubes of the same size but made from different materials were
used for HU linearity and sensitometry. Planar imaging sensitometry check assesses changes in the
displayed gray scale for different materials, compared to set baseline or acceptance testing values. CT
slice thickness was determined
Fig. 1. First phantom prototype 3D illustration.
with a ramp placed in the phantom at a known angle. By using trigonometry, the slice thickness could
be calculated. Mammography microcalcifications were simulated with metallic granules in different-
sized clusters and rubber bands of different diameters were used to simulate mammography fibres. A
cylinder was added to assess circular geometry using on-screen measuring tools available at X-ray
imaging units. These were also used to determine distance accuracy by measuring the distance
between different inserts and comparing it to the actual known distance.
Appendix D – Publication Appendix D – Publication and presentation
Stellenbosch University https://scholar.sun.ac.za

D6
Data analysis software would employ ROI analysis to calculate SNR, CNR, image uniformity, and the
MTF from the PSF of a bead or point source that was smaller than the size of a pixel. The software
would require the user to input the obtained image, which is extracted from the imaging system using
a step-by-step written standard operating procedure developed by a suitably trained person (e.g.,
application specialist or computer assistant). Images would be visually inspected by the observer for
the presence of artifacts; for example, streaks, ghost images, and blurring. Additional 4 cm attenuator
plates, made from the same material as the phantom, will be supplied to simulate patient attenuation
and evaluate automatic exposure control (AEC). The first phantom prototype would therefore
measure all the image quality assessment parameters, as recommended in literature.
The development of the initial phantom concept into the first prototype resulted in the construction
of the prototype. The sizes and materials of the different phantom inserts selected for the first
phantom prototype are shown in Fig. 2.
The phantom housing was made from high-density polyethylene (HDPE) with a diameter of 200 mm
and a density of 0.95 g/cm3. This material was selected as it was affordable, easy to machine, and had
a density suitably different from that of the low-contrast detectability cubes. The chosen diameter was
sufficient to fit the inserts without interference. As the X-ray tube circularly rotates around the
phantom in CT scanning, it was designed round. The cubes for low-contrast detectability and
mammography masses were 3D printed from PMMA (density of 1.18 g/cm3), in sizes of 2, 3, 4, 6, 8,
10, and 20 mm3. The density of PMMA was 24.2 % higher than that of the HDPE housing material. HU
linearity and sensitometry cubes included the 20 mm3 PMMA cube. Additional 20 mm3 cubes of Teflon
(density of 2.20 g/cm3), Gammex SB3 bone-equivalent plastic (density of 1.82 g/cm3), Supawood
(density of 0.74 g/cm3) (Supawood Architectural Lining Systems, Robin Hill, Australia), Gammex LN300
lung-equivalent plastic (density of 0.30 g/cm3) and air were incorporated. This gave six inserts ranging
in density from air to bone for sensitometry assessment. Mammography fibres were simulated with
20 mm rubber bands, of density 1.26 g/cm3, in diameters of 0.4, 0.6, 0.9, 1.2, and 1.5 mm. The CT slice
thickness ramp was a 20 × 10 × 2 mm3 slab of Gammex SB3 bone-equivalent plastic, placed in the
phantom at 37°. The mammography microcalcifications were simulated with granules cut from
metallic wires of diameter 0.2, 0.3, 0.4, and 0.5 mm. For MTF calculation from PSF, three metallic balls
of diameters 0.35, 0.50, and 1.00 mm were included. The calculation would be done with the planned
data analysis software. A 2.27 mm diameter ball bearing was included as central bead for cross-wire
centering and zero-slice position evaluation. This ball was located exactly at the phantom center in 3D.
Circular geometry was determined from a Perspex cylinder of 20 mm diameter, 20 mm length.
Figure 3 shows the construction drawings of the first phantom prototype, as drawn in SolidWorks
2015 Premium CAD 3-D design software (SOLIDWORKS Corp., Waltham, MA). Each of the halves was
250 mm thick. The cubic inserts, central bead, and cylinder were placed exactly on the middle plane
between the two halves. The CT slice thickness ramp, mammography microcalcifications, and fibers
and MTF beads were sunken into the bottom half of the first phantom prototype. In Fig. 2, semicircular
cutouts are seen at the corners of the cubic inserts, due to round cutters being used to machine square
voids. In the first prototype these cutouts were kept as air-filled voids, but it could be filled with wax,
with a density of 0.93 g/cm3, if necessary, due to image artifacts.
Appendix D – Publication and presentation
Stellenbosch University https://scholar.sun.ac.za

D7
Fig. 2. Inserts of the first phantom prototype.
Fig. 3. Construction drawings of first prototype: (a) bottom half, (b) top half.
Voids were machined from a slab of phantom HDPE housing material, using a MultiCam 3000 series
router (MultiCam Inc., Dallas, TX) for CNC routing. Cutting was done layer-bylayer and at a slow enough
speed to prevent breaking of the cutters. However, cutting could not be done too slowly or else the
HDPE would melt. This was done for the bottom and top halves of the phantom. Once all voids were
in place, the circular phantom housing was cut from the HDPE slabs. The inserts were then fitted and
the two halves were secured together using nylon screws. The process is illustrated in Fig. 4. Figure 5
shows the finished first prototype.
Fig. 4. The construction process: (a) machining voids from a 250 mm slab of HDPE, (b) cutting the round first prototype phantom housing from the slab of HDPE, (c) placing the inserts in the bottom half of the first prototype phantom housing.
Appendix D – Publication and presentation
Stellenbosch University https://scholar.sun.ac.za

D8
Fig. 5. Completed first phantom prototype.
III. RESULTS AND DISCUSSION The prototype was imaged for initial testing. Figure 6 shows the original images acquired with the first
prototype. Figure 6(a) is an axial CT scan slice obtained with a Siemens Somatom Definition Edge CT
(Siemens Healthcare GmbH, Erlagen, Germany) using a brain-imaging protocol; that is to say, 120 kV,
298 mA, 3.66 s, 235 cm field of view, pitch of 0.8, and 5 mm slices, and reconstruction with a medium
smooth filter. A Siemens Ysio unit, at 40 kV, 2 mAs, 100 cm source-to-image distance, large focus, and
with the cassette outside bucky, was used to produce the general X-ray image of the first phantom
prototype, illustrated in Fig. 6(b). A Siemens Axiom Luminos DRF unit was used to produce the
fluoroscopic image in Fig. 6(c), with technique factors of 62.3 kV, 10.2 mA, and 0.01 ms. The
mammogram in Fig. 6(d) was obtained with a Siemens Mammomat Inspiration unit at 28 kV and 62.1
mAs, using automatic exposure control. Table 1 shows visual inspection results from the images in Fig.
6. All other results, including SNR, CNR, MTF, and uniformity calculations, as well as sensitometry,
geometry, and slice thickness measurements, will be done with the data analysis software, which will
only form part of the final phantom package.
Appendix D – Publication and presentation
Stellenbosch University https://scholar.sun.ac.za
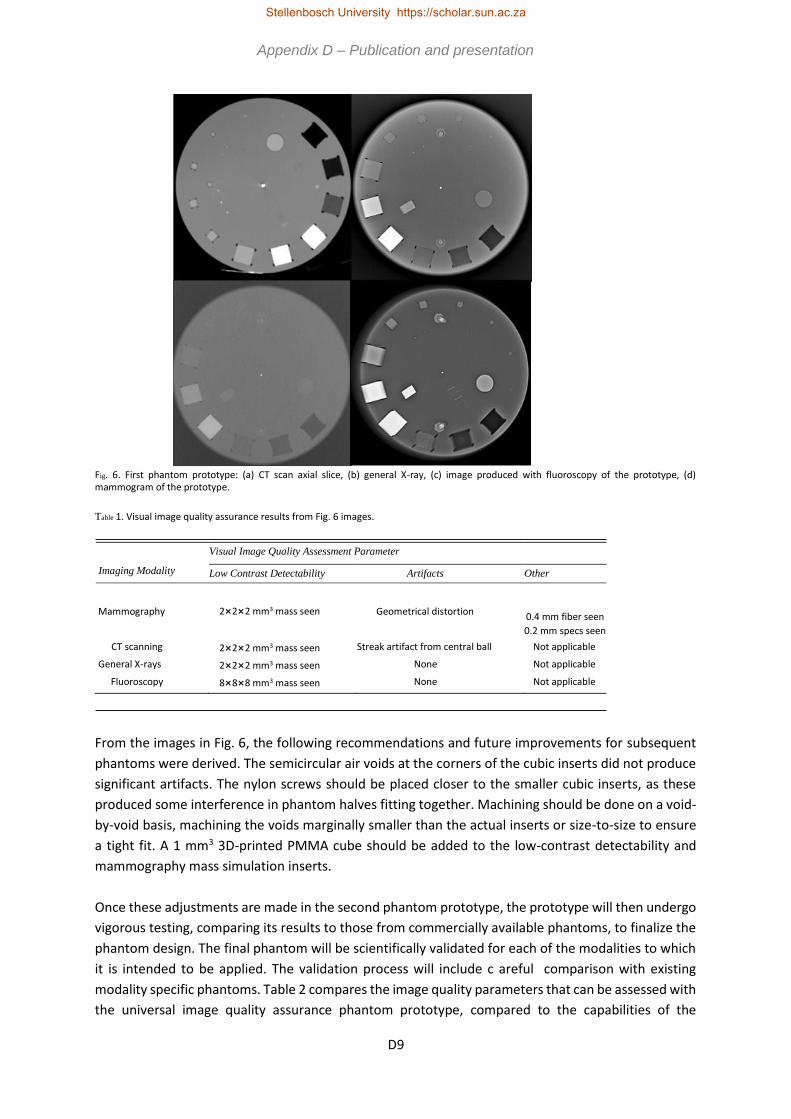
D9
Fig. 6. First phantom prototype: (a) CT scan axial slice, (b) general X-ray, (c) image produced with fluoroscopy of the prototype, (d) mammogram of the prototype.
Table 1. Visual image quality assurance results from Fig. 6 images.
Imaging Modality
Visual Image Quality Assessment Parameter Low Contrast Detectability Artifacts Other
Mammography
2×2×2 mm3 mass seen
Geometrical distortion
0.4 mm fiber seen 0.2 mm specs seen
CT scanning 2×2×2 mm3 mass seen Streak artifact from central ball Not applicable General X-rays 2×2×2 mm3 mass seen None Not applicable Fluoroscopy 8×8×8 mm3 mass seen None Not applicable
From the images in Fig. 6, the following recommendations and future improvements for subsequent
phantoms were derived. The semicircular air voids at the corners of the cubic inserts did not produce
significant artifacts. The nylon screws should be placed closer to the smaller cubic inserts, as these
produced some interference in phantom halves fitting together. Machining should be done on a void-
by-void basis, machining the voids marginally smaller than the actual inserts or size-to-size to ensure
a tight fit. A 1 mm3 3D-printed PMMA cube should be added to the low-contrast detectability and
mammography mass simulation inserts.
Once these adjustments are made in the second phantom prototype, the prototype will then undergo
vigorous testing, comparing its results to those from commercially available phantoms, to finalize the
phantom design. The final phantom will be scientifically validated for each of the modalities to which
it is intended to be applied. The validation process will include c areful comparison with existing
modality specific phantoms. Table 2 compares the image quality parameters that can be assessed with
the universal image quality assurance phantom prototype, compared to the capabilities of the
Appendix D – Publication Appendix D – Publication and presentation
Stellenbosch University https://scholar.sun.ac.za

D10
discussed commercially available phantoms. From this table it is clear that the universal image quality
assurance phantom prototype is indeed an all-in-one image quality assurance phantom for general X-
rays, fluoroscopy, mammography, and CT scanning.
Table 2. Summary of commercially available modality specific phantoms compared to the universal image quality assurance phantom prototype. X indicates the parameter the phantom can assess.
Image Quality Low Contrast Parameter Sensitometry Detectability Uniformity Resolution
ACR Mammo X NORMI PAS X X X
Gammex ACR CT X X X X Catphan X X X X CIRS 903 X-ray X X
NORMI 13 X X X
CDRH Fluoro X X
NORMI Rad/Flu X X X
Universal phantom X X X X
Image Quality Positioning and Geometry and Parameter Noise Alignment Measurement Tools Artifacts
ACR Mammo X X NORMI PAS X X X
Gammex ACR CT X X Catphan X X X CIRS 903 X-ray X NORMI 13 X X
CDRH Fluoro
NORMI Rad/Flu
X
X
Universal phantom X X X X
Image Quality High Contrast Parameter Field Size Standard Signal Resolution Other
ACR Mammo X X X (Fibers) NORMI PAS X X X X (Fibers) Gammex ACR CT X (Slice thickness)
Catphan X (Slice thickness)
CIRS 903 X-ray NORMI 13
X
X
X
CDRH Fluoro
NORMI Rad/Flu
X
X
Universal phantom
X
X
X
X (Fibers and
slice thickness)
IV. CONCLUSION Diagnostic radiology X-ray images should be clinically acceptable for disease follow-up and diagnosis.
Routine image quality assurance, with a suitable phantom, ensures this. A universal phantom suitable
to do quality assurance on the complete spectrum of X-ray imaging modalities was designed and a
Appendix D – Publication and presentation
Stellenbosch University https://scholar.sun.ac.za

D11
prototype manufactured from the design. The initial images acquired with the prototype were
satisfactory and showed that only small adjustments were needed to develop the prototype into a
user-friendly universal phantom. The phantom prototype described above could be seen as the
leading step towards developing a universal phantom, which will fill a gap in the existing market, with
special emphasis on resource-limited institutions.
ACKNOWLEDGMENTS The authors acknowledge Johan Braasch, of Gebrateq Advanced Engineering, who contributed
substantially to the design and development of the first phantom prototype, and wish to thank
Winelands Radiology in Vergelegen Medi Clinic for imaging of the first phantom prototype. This
research is presented in partial fulfilment of the requirements for the degree of PhD (Medical Physics)
in the Faculty of Medicine and Health Sciences at Stellenbosch University. The research proposal is the
intellectual property of Stellenbosch University under the PCT International Patent Application No.
PCT/IB2016/051165.
COPYRIGHT This work is licensed under a Creative Commons Attribution 3.0 Unported License.
REFERENCES 1. ACR Mammographic accreditation phantom model 156. Middleton, WI: Gammex RMI Inc; 2013. Available from:
http://www.sunnuclear.com/solutions/diagnostic/mammography. Accessed 14 October 2013. 2. Argo WP, Hintelang K, Hintelang DE. A tissue-equivalent phantom series for mammography dosimetry. J Appl Clin Med Phys.
2004;5(4):112–19. 3. PTW. NORMI PAS user manual. Freiburg, Germany: PTW-Freiburg. Available from: http://www.ptw.de/ home_start.html?&no_cache=1.
Accessed 11 February 2016. 4. Hernandez-Giron I, Geleijns J, Calzado A, Veldkamp WJ. Automated assessment of low contrast sensitivity for CT systems using a model
observer. Med Phys. 2011;38 (Suppl 1):S25. 5. McCollough CH. CT accreditation program: image quality and dose measurements. The American Association of Physicists in Medicine.
Available from: https://www.aapm.org/meetings/03AM/pdf/9785-27333.pdf 6. Computerized Imaging Reference Systems Inc. Radiography fluoroscopy QA phantom: Model 903. Ellicott City, MD: Medical Device
Depot Inc.; 2014. 7. PTW. NORMI 13 user manual. Freiburg, Germany: PTW-Freiburg. Available from: http://www.ptw.de/normi_130. html. Accessed 11
February 2016. 8. CDRH Fluoroscopic phantom. Everett, WA: Fluke Biomedical; 2013 Available from:
http://www.flukebiomedical.com/biomedical/usen/Diagnostic-Imaging-QUALITY%20ASSURANCE/Radiography/Fluoroscopy/07-649. htm?PID=54334. Accessed 4 September 2013.
9. PTW. NORMI Rad/Flu X-ray test object. Freiburg, Germany: PTW-Freiburg; 2015. Available from: http://www. ptw.de/typo3conf/ext/naw_securedl/securephp?u=0&file=ZmlsZWFkbWluL2ludGVybmFscy9kZ25fcmFkL05 PUk1JX1JBRF9GTFVfQnJvX2VuXzg1NzIxOTAwXzAzLnBkZg==&t=1458023697&hash=2ee6c62828d03c c3d958184fceca483e. Accessed 4 September 2013.
10. PTW. NORMI Rad/Flu. Freiburg, Germany: PTW-Freiburg; 2013. Available from: http://www.ptw.de/2856.html. Accessed 4 February 2016.
11. PTW. NORMI 4 Flu instruction manual. Freiburg, Germany: PTW-Freiburg. http://www.ptw.de/home_start. html?&no_cache=1. Accessed 11 February 2016.
12. Bushberg JT, Seibert JA, Leidholdt EM, Boone JM. The essential physics of medical imaging, third edition. Chapter 4. Philadelphia, PA: Lippincott Williams & Wilkins; 2012.
13. Suliman II, van Soldt RTM, Zoetelief J. Digital fluoroscopy quality control measurements. IFMBE Proc. 2007;14(3):1470–74. 14. Tsai MH, Chung CT, Wang CW, Chan YK, Shen CC. An automatic contrast-detail phantom image quality figure evaluator in digital
radiography. Int J Innov Comput I. 2012;8(2):1063–75. 15. Dance DR, Christofides S, Maidment ADA, McLean ID, Ng KH. Fundamentals of atomic and nuclear physics, Chapter 1. In: Diagnostic
radiology physics — a handbook for teachers and students, first edition. Vienna: IAEA; 2014. p.7. 16. Reis C, Pascoal A, Sakellaris T, Koutalonis M. Quality assurance and quality control in mammography: a review of available guidance
worldwide. Insights Imaging. 2013;4(5):539–53.
Appendix D – Publication and presentation
Stellenbosch University https://scholar.sun.ac.za
D12
D.2 Presentation
The prototype was presented at the 2016 South African Association of Physicists in
Medicine and Biology (SAAPMB) congress and was awarded the Meditech prize for
the person or group that develops new technology, including information technology,
devices, or computer programmes in a research project. The accepted abstract is
included below.
Design of a universal phantom for quality assurance in diagnostic radiology x-ray imaging – the prototype
Annemari Groenewalda, Willem A Groenewaldb a MScMedSc (Medical Physics), Equra Health, Vergelegen Oncology Unit, Somerset West b PhD (Medical Physics), Radiodiagnosis Division, Faculty of Medicine and Health Sciences, University of Stellenbosch
Introduction: In diagnostic radiology projection radiography, fluoroscopy, mammography and computed tomography (CT) are used in the diagnosis and follow-up of a variety of disease conditions. Diagnostically acceptable image quality is needed for proper diagnosis. A quality assurance (QA) programme enables the detection of image quality degradation, before clinically significant image defects occur. Currently expensive modality specific image quality assessment phantoms are available. Resource limited institutions are faced with time, man power and expertise and financial constraints. The aim of this study was to design a universal phantom, that could be used for x-ray image QA, which is robust, easy to use and affordable. The prototype of this phantom is presented here. Materials and Methods: Commercially available phantoms were investigated, for example the Catphan in CT scanning, ACR mammo-phantom in mammography and the NORMI 13 and NORMI Rad/Flu phantoms in general x-rays and fluoroscopy. The image quality parameters necessary for image quality assurance were determined. The universal phantom concept was developed based on this knowledge, keeping ease of use and reduced cost in mind. Different possible phantom housing and insert materials were investigated, considering physical properties, machinability and cost. The prototype was drawn to scale three dimensionally. Results: The three dimensional model of the prototype was used to manufacture the phantom housing and inserts. Some of the inserts were 3-D printed, others were machined from suitable materials. The first prototype of the universal x-ray imaging phantom was assembled. Imaging of the prototype provided satisfactory results. Conclusion: The universal phantom prototype conformed to the aim of a single phantom for multiple imaging modalities. It addressed the identified constraints by significantly reducing manufacturing costs and being easy and quick to use.
Appendix D – Publication and presentation
Stellenbosch University https://scholar.sun.ac.za

D13
International Patent Application No. PCT/IB2016/051165 has been filed for this technology. Keywords: Image quality assurance, Phantom, Diagnostic radiology, X-ray imaging, Prototype 289 words PLEASE DO NOT PUBLISH THIS ABSTRACT! Already submitted for publication in another journal.
The completed project will be presented at the 2017 SAAPMB congress, with the
accepted abstract included below.
Introduction
Diagnostic radiology x-ray imaging requires image quality to be maintained at clinically
acceptable levels for accurate disease diagnosis. This is achieved with routine image
quality control (QC) using phantoms. Commercially available phantoms are imaging
modality specific, expensive and often complicated to use. In resource limited
institutions cost, man power and expertise and time constraints are identified as
problems in image QC. A gap exists in the market for a cost and time saving, user
friendly single universal image quality assurance (U-QA) phantom, capable of doing
all required image QC tests for projection radiography, fluoroscopy, mammography
and Computed Tomography (CT) scanning.
Aim
To design, manufacture and validate a compact, unique, universal and cost-effective
U-QA phantom for diagnostic radiology x-ray imaging.
Materials and methods
The U-QA phantom was manufactured to include several inserts to asses
sensitometry, uniformity, resolution, noise, geometry, standard signal, low contrast
detectability, alignment, artefacts, visual image quality inspection, CT slice thickness
and mammography masses, fibres and micro-calcifications. Data analysis software
and a step-by-step user’s manual was prepared. Reproducibility testing and
independent validation of the phantom, software and manual was done.
Results
The U-QA phantom and data analysis software produced reproducible results
complying with Department of Health tolerance levels for all imaging modalities.
Independent validation confirmed that the phantom package was indeed compact,
user friendly, versatile and cost effective.
Appendix D – Publication and presentation
Stellenbosch University https://scholar.sun.ac.za

D14
Discussion and conclusion
The U-QA phantom, data analysis software and user’s manual, offers an acceptable
single phantom solution for medical x-ray imaging. It is a cost and time saver and fills
a gap in the existing market.
This research was performed in partial fulfilment of the requirements for the degree of
PhD (Medical Physics) at Stellenbosch University under patent PCT/IB2016/051165.
Appendix D – Publication and presentation
Stellenbosch University https://scholar.sun.ac.za