Embed Size (px)
Citation preview
DESIGN OF A STATEWIDE GROUNDWATER MONITORING NETWORK FOR ILLINOIS
Document No. 85/02
Printed by the Authority of the State of Illinois
Illinois Department of Energy and Natural Resources
James R. Thompson, Governor Don Etchison, Director
ENR Doc. Mo. 85/02 SWS Contract Report 354
DESIGN OF A STATEWIDE GROUND-WATER MONITORING NETWORK FOR ILLINOIS1)
by
Michael O'Hearn
and
Susan C. Schock
James R. Thompson, Governor Don Etchison, Director State of Illinois Department of Energy and
Natural Resources
1) Prepared under contract with the Illinois Department of Energy and Natural Resources by the State Water Survey Division - Ground Water Section, Champaign, Illinois
PRINTED BY THE AUTHORITY OF THE STATE OF ILLINOIS
Date Printed: March 1985
Quantity Printed: 300
One of a series of research publications published since 1975. This series includes the following categories and are color coded as follows:
Prior to After July, 1982 July, 1982
Air Quality - Green Green Water - Blue Blue Environmental Health - White Grey Solid and Hazardous Waste - White Olive Economic Impact Study - Buff Brown Noise Management - Buff Orange Energy - Cherry Red Information Services - Canary Yellow
Illinois Department of Energy and Natural Resources Energy and Environmental Affairs Division
325 W. Adams Street Springfield, Illinois 62706
(217) 785-2800
CONTENTS
Page
List of Figures iii
List of Tables iv
Abstract v
Executive Summary vii
Abbreviations ix
Introduction 1
Need for Monitoring 1
Purpose and Scope 2
Acknowledgments 4
Review of Ground-Water Monitoring Programs of Selected States 7
Information and Data Needs 11
Network Design 15
Objectives of the Network 15
Areas to Monitor 17
Well Selection 23
Monitoring Strategy 45
Network Evaluation 50
Statistical Analysis for Routine Monitoring 51
Estimated Costs 55
Conclusions 61
Recommendations 63
References 67
Selected Bibliography 73
i
LIST OF FIGURES
Page
Figure 1. Principal aquifers in Illinois 19
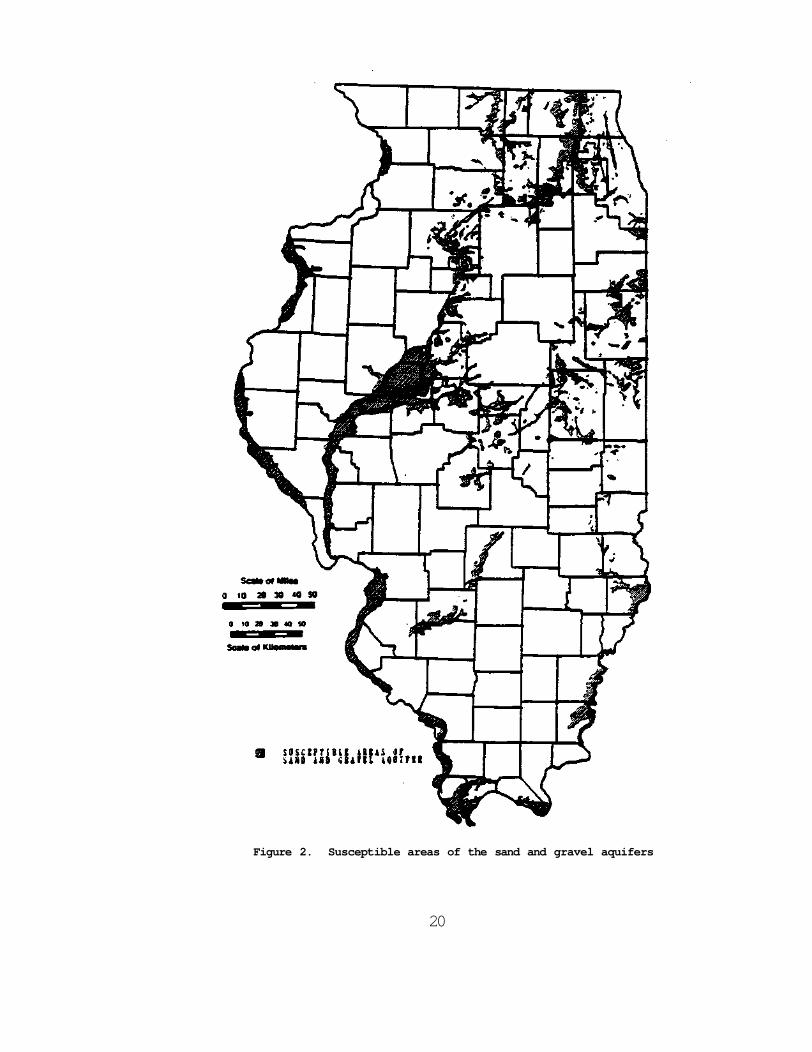
Figure 2. Susceptible areas of the sand and gravel aquifer 20
Figure 3. Susceptible areas of the shallow bedrock aquifer 22
Figure 4. Distribution of public water supply wells by county in Illinois 24
Figure 5. Selection process for ground-water monitoring network wells 26
Figure 6. Depth distribution of primary network wells by aquifer category 27
Figure 7. Number of primary network wells by aquifer type and priority 30
Figure 8. Locations of sand and gravel network wells 31
Figure 9. Locations of shallow bedrock network wells 32
Figure 10. Locations of deep bedrock network wells 33
Figure 11. Number of samples for network wells and for all PWS wells 35
Figure 12. Growth of the historical ground-water quality data for network wells 36
Figure 13. Number of samples per number of parameters 38
Figure 14. Frequency distribution of parameters measured for PWS well samples 41
Figure 15. Estimated cost for the proposed ground-water monitoring program 58
iii
LIST OF TABLES
Page
Table 1. Comparison of Monitoring Programs from Selected States 8
Table 2. Information Needed for the Comprehensive Management of Ground Water in Illinois 12
Table 3. Distribution of Monitoring Network Wells within Aquifer Types and Priority Levels 29
Table 4. Parameters Stored in the Historical Ground-Water Quality Data Base 42
Table 5. Parameters to be Determined in Monitoring Level One 47
Table 6. Priority Pollutants 48
iv
ABSTRACT
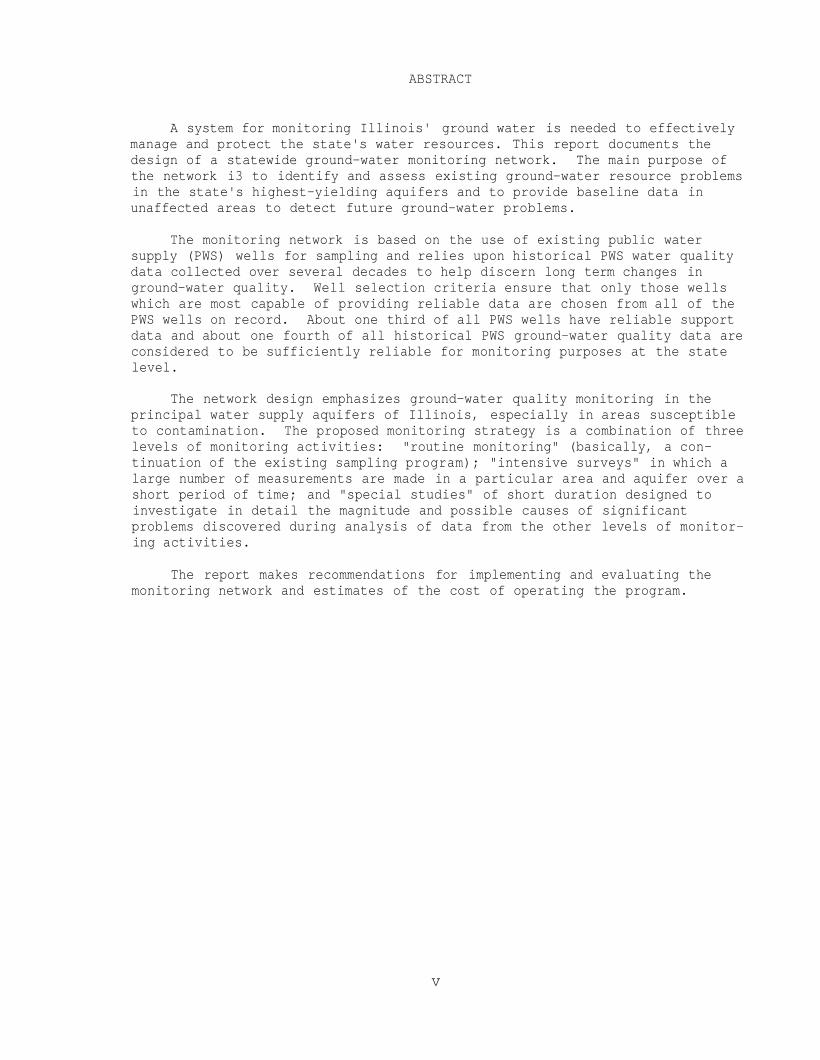
A system for monitoring Illinois' ground water is needed to effectively manage and protect the state's water resources. This report documents the design of a statewide ground-water monitoring network. The main purpose of the network i3 to identify and assess existing ground-water resource problems in the state's highest-yielding aquifers and to provide baseline data in unaffected areas to detect future ground-water problems.
The monitoring network is based on the use of existing public water supply (PWS) wells for sampling and relies upon historical PWS water quality data collected over several decades to help discern long term changes in ground-water quality. Well selection criteria ensure that only those wells which are most capable of providing reliable data are chosen from all of the PWS wells on record. About one third of all PWS wells have reliable support data and about one fourth of all historical PWS ground-water quality data are considered to be sufficiently reliable for monitoring purposes at the state level.
The network design emphasizes ground-water quality monitoring in the principal water supply aquifers of Illinois, especially in areas susceptible to contamination. The proposed monitoring strategy is a combination of three levels of monitoring activities: "routine monitoring" (basically, a continuation of the existing sampling program); "intensive surveys" in which a large number of measurements are made in a particular area and aquifer over a short period of time; and "special studies" of short duration designed to investigate in detail the magnitude and possible causes of significant problems discovered during analysis of data from the other levels of monitoring activities.
The report makes recommendations for implementing and evaluating the monitoring network and estimates of the cost of operating the program.
v
EXECUTIVE SUMMARY
A statewide ground-water monitoring network has been designed to provide reliable information for use by water resource managers, environmental researchers, and the public. The general goals of this large scale surveillance network are to provide an overview of ground-water conditions in the major aquifers of Illinois and to document significant changes in these conditions over time. Operation of the monitoring network will help to detect existing and emerging ground-water quality and quantity problems and to develop plans for mitigating damage to the state's most important aquifers.
A review of programs in other states revealed that Illinois is near the "middle of the pack" with regard to progress toward implementation of a statewide ground-water monitoring plan. It was noted in this review that, despite the significant geographic differences among states, many of the problems are the same. Generally, the available historical data are not sufficiently reliable and complete to satisfy current and future ground-water information needs. Inadequate funding of data collection and information management activities, and a lack of recognition of the importance of these efforts to water resource management, are usually limiting factors. Given the same level of funding, smaller states are able to more easily monitor important ground-water areas within their borders to a greater degree of detail. In larger states, a realistic set of priorities and a willingness to compromise are required for monitoring programs to be economically reasonable.
The network design presented in this report is based upon the sampling of existing public water supply (PWS) wells and incorporates a prioritization scheme to determine the degree to which aquifers should be monitored. This approach maximizes the ability of the proposed monitoring network to document changes in ground-water conditions and minimizes the fiscal requirements. The use of existing wells is not only less costly than installing wells specifically designed for monitoring, but also facilitates the detection of long-term ground-water degradation by yielding data which can be compared with historic records of ground-water quality analyses compiled over decades.
Detailed evaluation of the Illinois State Water Survey's (ISWS) groundwater quality data base for PWS wells shows that the entire data base contains records of over 21,000 well-water samples and about 420,000 analytical determinations. Data-screening procedures (for reliability and completeness) combined with stringent well-selection criteria resulted in the retention of about 25 percent of these data for use in the network. The selected data comprise over 100,000 analytical determinations for nearly 5000 water samples collected from network wells. Projections indicate that this small subset of the PWS well data may double in volume between 1980 and 1990. Nevertheless, these data will not be sufficient to satisfy current and anticipated information needs.
The major ground-water supply areas of the state were identified, and zones within these areas which are most susceptible to contamination were delineated. These areas were used in the determination of priorities for collection of additional ground-water data. About 58 percent (32,200 square
vii
miles) of the state is underlain by principal aquifers. Excluding the deep bedrock aquifers which are not directly susceptible to contamination from near-surface human activities, major shallow ground-water supply areas cover about 33 percent (18,500 square miles) of the state with areas directly susceptible to contamination accounting for nearly half of this total.
Approximately 1300 PWS wells were selected for the monitoring network from approximately 5000 for which records were available. The selected network wells were divided into three levels of priority based on aquifer type and location. The highest priority was assigned to 204 wells which tap principal aquifers in areas designated as most susceptible to contamination. The 427 wells identified as medium priority for monitoring tap major aquifers in areas somewhat less susceptible to contamination. The lowest priority was reserved for 331 wells capable of yielding useful information but located outside of the boundaries of the principal aquifers.
Alternate wells exist for 264 of the primary wells. These alternates were selected in case field checking reveal that any of the primary wells cannot be sampled or should be dropped from the network for another reason. A well-numbering code was instituted to provide a consistent and reliable method of identifying the primary wells in the monitoring network.
The monitoring strategy developed in this study calls for concentrating monitoring efforts where perceived information needs are greatest while minimizing the collection of detailed data until a definite need has been demonstrated. Such a prioritization scheme is essential to the efficient allocation of limited monetary and human resources and, ultimately, to the overall success of the monitoring program.
The monitoring strategy is composed of three interdependent levels of monitoring activity, each intended to satisfy certain objectives: 1) continued fixed-station monitoring of all primary wells (presently conducted under the Safe Drinking Water Act at three- to five-year intervals); 2) intensive surveys in the "principal aquifer" areas of the state at two- to five-year intervals, depending on aquifer type; and, 3) special studies as needed to address apparent problems discovered during analysis of data from monitoring levels one and two. Because of their interdependence, the deletion, substantial alteration, or neglect of any one of the three levels of monitoring activity would seriously compromise the value of the information derived from the network and would negate the validity of the prioritization 3cheme upon which the network design is based.
The estimated average cost of operating the proposed ground-water monitoring network is about $690,000 per year in addition to current expenditures on PWS sampling under the Safe Drinking Water Act (SWDA). Actual costs will vary substantially from year to year because of differences in the number of wells sampled, the parameters determined, and the sampling frequencies for each aquifer type. The requirements of this ground-water monitoring network are relatively modest compared with: a) the importance of ground water to the personal, economic, and environmental well-being of Illinois citizens; and b) the resources devoted to monitoring surface water in Illinois which is often dominated by ground-water inflow.
viii
ABBREVIATIONS
CPU = central processing unit DENR = Department of Energy and Natural Resources GC = gas chromatograph GPD = gallons per day ICAP = inductively-coupled argon plasma analyzer IDOT = Illinois Department of Transportation IDPH = Illinois Department of Public Health IEPA = Illinois Environmental Protection Agency ISGS = Illinois State Geological Survey ISWS = Illinois State Water Survey GDNR = Georgia Department of Natural Resources MDPH = Michigan Department of Public Health MDNR = Michigan Department of Natural Resources MGD = million gallons per day MG/L = milligrams per liter MS = mass spectrometer NJSGS = New Jersey State Geological Survey NVOC = non-volatile organic carbon PWS = public water supply SAS = Statistical Analysis System SDWA = Safe Drinking Water Act SQ MI = square mile STORET = Storage and Retrieval System SWPTF = State Water Plan Task Force TDPH = Texas Department of Public Health TDS = total dissolved solids TWRB = Texas Water Resources Board TOC = total organic carbon USEPA = United States Environmental Protection Agency USGS = United States Geological Survey VOC = volatile organic carbon
ix
INTRODUCTION
The State of Illinois i3 heavily dependent upon ground water for direct uses and as a major contributor to streamflow. In 1980, ground-water withdrawals in Illinois amounted to nearly one billion gallons per day, 86 gallons per day for every person in the state (Kirk and others, 1982). Over 5.5 million Illinpisans (48 percent of the state's population) obtain their household water supplies from more than 4,000 public water supply (PWS) wells and a number of private domestic wells many times greater. The vast majority of the state's ground water is pumped from relatively shallow aquifers which are more prone to rapid contamination than deeper ground-water reservoirs.
The ground-water issue also indirectly affects those citizens who benefit from industry and agriculture, but whose water is supplied by lakes and streams. In fact, ground water is a major contributor to streamflow in Illinois, accounting for an estimated 60 percent of total annual flow in 3ome areas (0'Hearn and Williams, 1982). Where ground water has been polluted, efforts to improve stream water quality may be impeded by the continual seepage of contaminants through the streambed in the form of contaminated baseflow. Clearly, the health of Illinois citizens, its economy, and its aquatic environment depend upon abundant supplies of high quality ground water.
Despite the fact that Illinois is considered a "water-rich" state, the Illinois Department of Transportation (ID0T) estimates that, by the year 2000, over one million Illinoisans may be directly affected by deficiencies of raw water source, delivery capacity, treatment capacity, or storage capacity. Nearly 700 public water systems may experience water quality or water quantity problems (Illinois Department of Transportation, 1982).
Meed for Monitoring
In recognition of the importance of ground water to the health and well-being of its citizens, water-resource management agencies in Illinois are beginning to address the need for coherent policies and comprehensive strategies for managing ground-water quality and quantity (Illinois State Water Plan Task Force, 1984). However, the importance of an adequate information base to the successful management of ground water is often overlooked. Even in today's atmosphere of heightened awareness, ground-water issues are often added as an afterthought to most water management plans. The fact is, "...data and its corresponding information are the backbone of a water-quality management program..." (Ward and Freeman, 1973). The National Academy of Sciences (1977) reports that "...Information from monitoring is essential to the formulation, implementation, and evaluation of environmental management policies to protect human health and well-being at an acceptable cost."
Although much of Illinois is fortunate to have abundant supplies of good quality ground water, instances of overdevelopment and contamination illustrate the need for a comprehensive, statewide ground-water management plan. An important, but often overlooked, component in the "...establishment of an effective statewide ground-water management plan" is "the ability of a state
-1-
to develop and maintain an adequate information base" (Geise, 1983). Sgambat and others (1978) summarized the importance of a ground-water monitoring program quite succinctly: "...there is...significant need for developing methods to accurately determine existing water quality as well as long-term trends in extensive aquifers...Such aquifers may be affected by numerous and varied sources of contamination which together can slowly but radically change the overall availability of high quality ground water. Data from such regional monitoring programs are vital to cost effective decisions concerning future land use." Evidence of contamination from years ago may continue to be discovered for years to come since time lags of decades typically characterize ground-water contamination (Roberts et al., 1982).
The Illinois Environmental Protection Agency (IEPA) has acknowledged that "better management of ground water is needed" because of the "large number of Illinois communities which depend on ground water as a water supply" and "the numerous sources of contamination (which) threaten this inadequately protected resource" (Illinois State Water Plan, 1983).
Although contamination of ground water has received considerable attention in the news media and the government (National Research Council, 1984; Meyer, 1973; Siebel, 1982), ground-water quantity issues also present serious problems for water resource management agencies. The State of Illinois has had its own problems with ground-water flooding of major highways in the southwest part of the state for many years (Sanderson and others, 1984). Many thousands of dollars have been spent and will continue to be spent to cope with the result of drastically reduced ground-water withdrawals in the American Bottoms area (Ritchey, 1983). Ground-water withdrawals from shallow aquifers have had a severe impact on water levels in the northeastern part of the state, and major portions of the aquifer system have been partially dewatered. The balance between potential yield and demand must be maintained as part of a water management program (Sasman et al., 1982).
Finally, as evidence of the need for comprehensive and reliable groundwater information, the ISWS is requested to supply information on the status of ground-water quality in Illinois to other government agencies or private individuals on a daily basis. Many of these requests cannot be answered specifically or with a high level of confidence due to the inadequacy of the current ground-water sampling program. This is especially true with respect to data on the presence of synthetic organic contaminants and other potentially harmful "priority pollutant" compounds which are not routinely analyzed as part of the present data collection program.
Purpose and Scope
The purpose of this one-year effort was to design a statewide groundwater monitoring network for the support and guidance of ground-water management activities in Illinois. The goals of this monitoring or surveillance network are to provide an overview of ground-water conditions in the major aquifers of the state and to document significant changes in those conditions over time. In addition, operation of the network will help to detect existing and emerging ground-water problems and to aid in the development of plans for mitigating damage to the state's ground-water resources.
-2-
To maximize the value of the monitoring network for documenting groundwater conditions and to minimize the fiscal requirements, the network design is based on the sampling of existing public water supply (PWS) wells and incorporates a prioritization scheme to determine the necessary degree to which areas/aquifers are to be monitored. The use of existing PWS wells is not only less costly than Installing wells specifically designed for monitoring, but it also facilitates the detection of long-term ground-water degradation by making use of historic ground-water quality data compiled by the ISWS over decades. This approach is similar to that of the State of Florida in the development of their statewide ground-water monitoring network (Silverman and Spangler, 1983).
The process of network design for this report incorporated the following tasks:
(1) definition of monitoring network objectives;
(2) outline of anticipated ground-water data needs;
(3) evaluation of the adequacy of current data collection efforts and the suitability of the existing ground-water quality data for statewide monitoring purposes;
(4) delineation of principal aquifers in Illinois;
(5) selection of PWS wells to be included in the network;
(6) development of an appropriate monitoring strategy addressing high priority areas and aquifers to be monitored, ground-water parameters to be measured, and suggested sampling frequencies;
(7) estimation of the average annual costs of operating the proposed monitoring network on a long term basis.
In addition, water resources management agencies in other states were contacted to discuss their approaches to the problem of statewide ground-water monitoring and to draw upon their experiences in designing a monitoring system appropriate to conditions in Illinois.
This study was not intended to address the details of sample collection, handling, preservation, and analysis. Many references are available which thoroughly describe these procedures (USEPA, 1977; USEPA, 1982; Gibb and others, 1981; Bennett, 1982; USGS, 1977; Barcelona and others, 1983). Coincidentally, the IEPA and USGS, with assistance from the ISWS and the ISGS, are currently conducting a "pilot program" for ground-water monitoring using PWS wells. The IEPA/USGS project shares the same basic goals and objectives as the monitoring network developed in this project. The design described in this report addresses the need for a comprehensive monitoring plan, while the IEPA/USGS pilot study is intended to establish a detailed protocol for sample collection, data handling, and information dissemination. The pilot program is also concerned with the need for coordination among the various agencies involved in the sampling effort. The data generated by the pilot sampling program will provide valuable input concerning the types and levels of contaminants present in Illinois ground water, but the data are not based on wells with complete information. The pilot 3tudy does not offer
-3-
representative geographic coverage of the aquifers, nor was it intended to do so. An evaluation of the USEPA's monitoring programs led the National Academy of Sciences (1977) to conclude, "After networks are designed, prototypes and other techniques should be developed for efficiently putting them into operation." The pilot program instituted by the IEPA/USGS serves such a purpose. Conversely, the network design project described in this report has great potential for contributing to future sampling efforts by delineating areas and aquifers of the highest priority for monitoring and by identifying PWS wells capable of yielding the most useful and reliable information.
An inventory of potential sources of ground-water contamination in Illinois was outside the scope of this project but is an important ingredient for designing a long term monitoring program. A general understanding of the sources and contaminants which may be present was an integral part of this project. Previous studies (O'Hearn and Williams, 1982; Gibb and O'Hearn, 1980) have shown that major urban/industrial areas within Illinois are most likely to be affected by ground-water contamination and deserve priority for monitoring. As might be expected, these areas have the greatest density of potential contamination sources and often coincide with areas of highest ground-water development. The monitoring of PWS wells, therefore, provides an initial program for monitoring the state's ground-water resources 3ince most PWS wells are located in the areas of greatest urban and industrial development.
Although the historical ground-water chemistry data for PWS wells on file at the ISWS was evaluated for completeness and correctness with respect to sample identification information, no attempt was made to ascertain the reliability or validity of the reported chemical concentration values stored in the computer data base. In some cases, general inferences of the value of this information are made within the context of this report. In other instances, the information required to verify the individual parameter values is irretrievably lost due to the lack of adequate documentation (e.g., sample collection and handling procedures).
Finally, a detailed description of hydrogeologic conditions in the state was not included in this report 3ince adequate descriptions can be found in numerous previous publications by the ISWS (Zeizel and others, 1962; Visocky and others, 1969; Walker and others, 1965), the ISGS (Bergstrom and others, 1955; Willman and others, 1975), and other agencies (State of Illinois, 1967; Piskin and others, 1981).
Acknowledgments
The authors are grateful for the tireless efforts of many individuals whose contributions made thi3 project a success. Timothy Warren of the Department of Energy and Natural Resources was a source of encouragement and support. Anna L. Zahn wrote many of the programs used in the storage, retrieval, and evaluation of the historical data base. Marsha D. Conover and Lynn E. Wiess performed the file searches and data tabulations necessary for selecting wells for the monitoring network from the thousands on record. Mark Collins generated the maps showing Principal Aquifers of Illinois and susceptible areas using ARC/INFO software and computer equipment available
-4-
through the Lands Unsuitable for Mining Program. James R. Kirk and Dorothy Woller provided up-to-date information on the public water supply wells in the state. Johnny Blair and Raymond Oldakowski of the Survey Research Lab (University of Illinois) provided technical guidance in the consideration of statistical concepts in the design and (future) evaluation of the monitoring network.
The authors also extend their sincere appreciation to the agencies and individuals from other states who responded with generosity to our inquiries about their respective ground-water monitoring programs and plans, especially: the Georgia Geological Survey (Nancy L. Barber) and the Georgia District of the USGS (Robert Pierce); the Michigan Geological Survey (Richard Bissell); the Mew Jersey Department of Environmental Protection, Division of Water Resources (Gail P. Carter); and the Texas Departments of Water Resources (Gerald H. 3aum) and Public Health (Charles R. Maddox).
The manuscript for this report was typed by Pamela S. Lovett and Kathleen J. Brown. The graphics for the final report were produced by John Brother, Linda Riggin, and Bud Motherway. Loreena Ivens edited the final report. James P. Gibb assisted in obtaining the funding for this study and reviewed the final report. Mechanical reproduction of the final report was performed by Gloria Marsh.
-5-
REVIEW OF GROUND-WATER MONITORING PROGRAMS OF SELECTED STATES
A preliminary review of ground-water monitoring programs and plana in selected states was undertaken to determine where the State of Illinois stands with respect to their programs and to benefit from their experiences in designing and operating statewide monitoring programs. Letters were sent to water-resource management agencies in twenty-six states known to have programs or plans for programs, in all areas of the country, asking the recipients to briefly describe their existing or proposed statewide groundwater monitoring programs. All but four states responded to this initial inquiry. Four states were selected for further discussion, because at the time of the inquiry their respective programs or plans appeared to be more advanced than those in Illinois. Although this evaluation was necessarily subjective, it helped put the problem in perspective and suggested some possible solutions which were extremely useful in the design of the monitoring network described in this report.
Table 1 is a brief comparison of some of the features of the groundwater monitoring programs of the states visited during the review process. All entries have been listed in rough order of importance to the specific program.
The program in Georgia is the best example of a cooperative effort with the USGS, and of a one-agency organization for all water resources. The Mighican program is in its early stages and striving to be an organized effort beneficial to all involved. The Texas program is probably the most sophisticated and best developed in terms of data reporting and management. The New Jersey program is unique in that it is being planned and initiated as one cohesive organization rather than being a combination of several existing programs. New Jersey is emphatically interested in contamination problems. In general, the efforts of the State of Illinois appear to be about average compared with the progress toward statewide monitoring programs in other states. Further discussions took place during on-site visits with representatives of water-resource agencies in the states of Georgia, Michigan, New Jersey, and Texas.
As a result, the following general observations are offered:
1) Statewide ground-water monitoring programs are often developed in response to a legislative mandate.
2) Programs are often developed as only one component of an overall ground-water management plan (for example, to provide information in support of the well drilling permitting process).
3) Programs are often operated by the "information" arm of the state with the resulting information most often used by the "regulatory" arm.
4) Most state programs are operated in cooperation with the USGS on a cost-sharing basis.
-7-
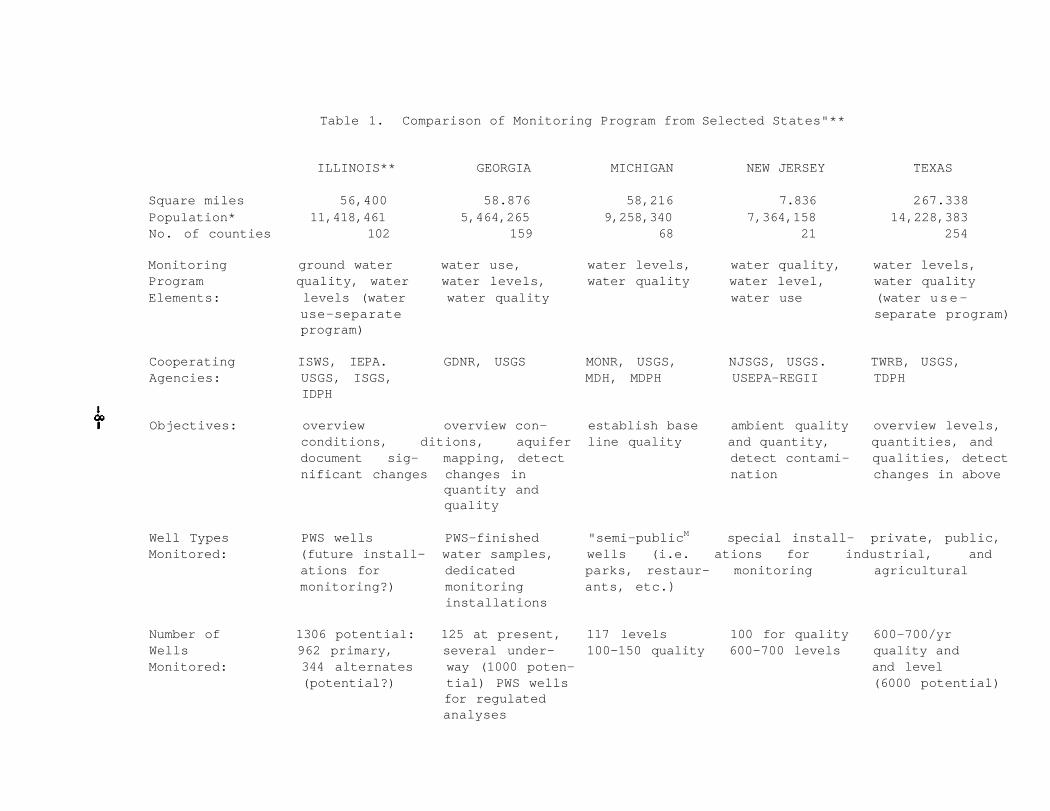
ILLINOIS** GEORGIA MICHIGAN NEW JERSEY TEXAS
Square miles 56,400 58.876 58,216 7.836 267.338 Population* 11,418,461 5,464,265 9,258,340 7,364,158 14,228,383 No. of counties 102 159 68 21 254
Monitoring ground water water use, water levels, water quality, water levels, Program quality, water water levels, water quality water level, water quality Elements: levels (water water quality water use (water use—
use—separate separate program) program)
Cooperating ISWS, IEPA. GDNR, USGS MONR, USGS, NJSGS, USGS. TWRB, USGS, Agencies: USGS, ISGS, MDH, MDPH USEPA-REGII TDPH
IDPH
Objectives: overview overview con- establish base ambient quality overview levels, conditions, ditions, aquifer line quality and quantity, quantities, and document sig- mapping, detect detect contami- qualities, detect nificant changes changes in nation changes in above
quantity and quality
Well Types PWS wells PWS-finished "semi-publicM special install- private, public, Monitored: (future install- water samples, wells (i.e. ations for industrial, and
ations for dedicated parks, restaur- monitoring agricultural monitoring?) monitoring ants, etc.)
installations
Number of 1306 potential: 125 at present, 117 levels 100 for quality 600-700/yr Wells 962 primary, several under- 100-150 quality 600-700 levels quality and Monitored: 344 alternates way (1000 poten- and level
(potential?) tial) PWS wells (6000 potential) for regulated analyses
Table 1. Comparison of Monitoring Program from Selected States"**
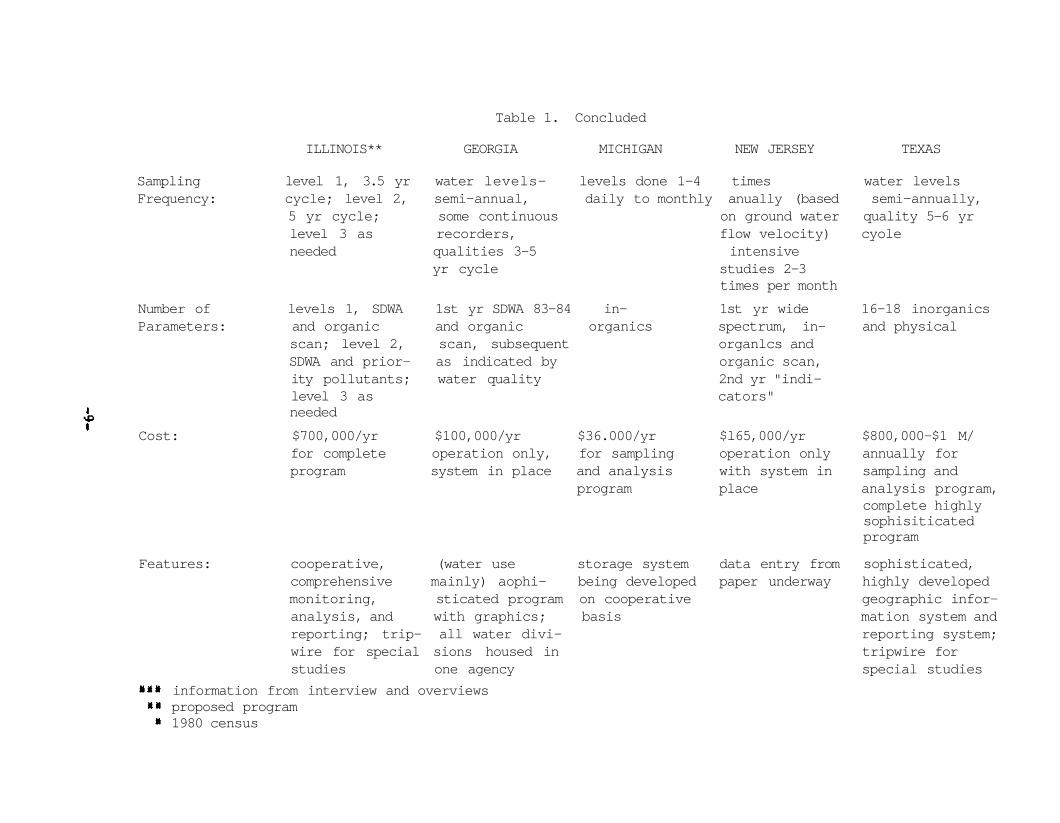
Table 1. Concluded
ILLINOIS** GEORGIA MICHIGAN NEW JERSEY TEXAS
Sampling level 1, 3.5 yr water levels— levels done 1-4 times water levels Frequency: cycle; level 2, semi-annual, daily to monthly anually (based semi-annually,
5 yr cycle; some continuous on ground water quality 5-6 yr level 3 as recorders, flow velocity) cyole needed qualities 3-5 intensive
yr cycle studies 2-3 times per month
Number of levels 1, SDWA 1st yr SDWA 83-84 in- 1st yr wide 16-18 inorganics Parameters: and organic and organic organics spectrum, in- and physical
scan; level 2, scan, subsequent organlcs and SDWA and prior- as indicated by organic scan, ity pollutants; water quality 2nd yr "indi-level 3 as cators" needed
Cost: $700,000/yr $100,000/yr $36.000/yr $l65,000/yr $800,000-$1 M/ for complete operation only, for sampling operation only annually for program system in place and analysis with system in sampling and
program place analysis program, complete highly sophisiticated program
Features: cooperative, (water use storage system data entry from sophisticated, comprehensive mainly) aophi- being developed paper underway highly developed monitoring, sticated program on cooperative geographic infor-analysis, and with graphics; basis mation system and reporting; trip- all water divi- reporting system; wire for special sions housed in tripwire for studies one agency special studies
information from interview and overviews proposed program 1980 census
5) Most programs share the same basic objectives: characterizing ground-water conditions in time and space and detecting significant changes in these conditions in support of resource-management activities.
6) Statistical concepts are not usually a major factor in the design of the monitoring network. Instead, a balance is struck between what is ideal and what is practically attainable given each state's resources and individual situation.
7) Priority areas are usually determined on the basis of existing or potential use for water supply and general aquifer susceptibility.
8) An assessment of existing data is often performed to identify information gaps and to help set priorities for monitoring.
9) Identification of historical data which are most reliable and useful for monitoring purposes is seen as an important component of monitoring network design.
10) The available historical data (especially older data and data from private wells) are usually incomplete and of questionable reliability which greatly reduces its value for statewide monitoring purposes.
11) Many existing programs are limited to the occasional sampling of public water well3 under the SDWA or to site-specific monitoring of potential point sources under the Resource Conservation and Recovery Act (RCRA).
12) Some programs emphasize the collection of baseline data in unaffected areas (as a standard against which to measure future changes), while others target areas at high risk because of the presence of known potential contamination sources.
13) The storage of potentially valuable data in paper files limits the states' ability to apply these data to large-scale monitoring objectives. Carefully planned data entry programs are a necessary first step.
14) The size of the area requiring monitoring determines, to a large extent, the degree of detail to which the area can be monitored. Given the same level of funding, smaller states (e.g., Mew Jersey) are able to obtain more detailed information than larger states (e.g., Texas). This requires larger states to place greater emphasis on the setting of priorities for data collection.
15) Program evaluation is usually incorporated in the network design so the program is responsive to changing needs or monitoring objectives.
16) The skill and dedication of the personnel responsible for the monitoring program are critical factors in the successful operation of a high quality monitoring program.
-10-
INFORMATION AND DATA NEEDS
There is a need for a clearly defined means of accounting for inputs to, outputs from, and changes in the major ground-water systems of the state. Attempting to manage statewide ground-water resources without this information would be similar to managing a bank account without keeping a record of deposits, withdrawals, or a running balance. Table 2 lists some of the information required for comprehensive management of ground water in Illinois. The aquifer characteristics information helps to define the factors which influence the water quality and changes in that quality which are natural and not determined by man in the undisturbed environment. An understanding of these factors in combination with general characteristics of the current environment which have been imposed by man make it possible to estimate what impact the man-imposed influences are having or may have in the future. Well characteristics, when added to the other two categories of information, should explain the water quality and quantity in the area near that well. Changes in quality and quantity can be more clearly understood if the factors are known.
Illinois is fortunate in that a great deal of the information needed has already been collected. For example, the geology of the state and the identification of highly susceptible areas within the state's borders has been substantially completed through the efforts of the Illinois State Geological Survey (ISGS). Aquifer characteristics in many areas have been determined from studies conducted by the ISWS. For example, transmissivity and estimated potential yield data are available for many locations across the state. Water-withdrawal information is currently collected by the ISWS in cooperation with the USGS. Unfortunately, much of the available information is not sufficiently reliable, comprehensive, detailed, or accessible for application to statewide ground-water management.
Due to the variety of ways in which the land is used, there are many potential sources of ground-water contamination. The potential effects of various types of contaminant sources on ground water are discussed by O'Hearn and Williams (1982). Some potential sources relevant to Illinois are:
- land disposal of wastes in landfills, open dumps, infiltration/evaporation pits, etc.;
- surface impoundments for the treatment and(or) storage of liquid wastes;
- household and commercial septic tanks (on-site disposal systems); - buried fuel storage tanks; - agricultural chemicals; - pipelines; - application of deicing compounds to highways; - open stockpiles (road salt, scrap metal3, raw materials, industrial
products, etc.); - brine disposal from oil and gas production; - improperly abandoned wells and test borings; - induced recharge of polluted surface waters; - upwelling of saline water as a result of overpumpage; - land application of wastewater;
-11-
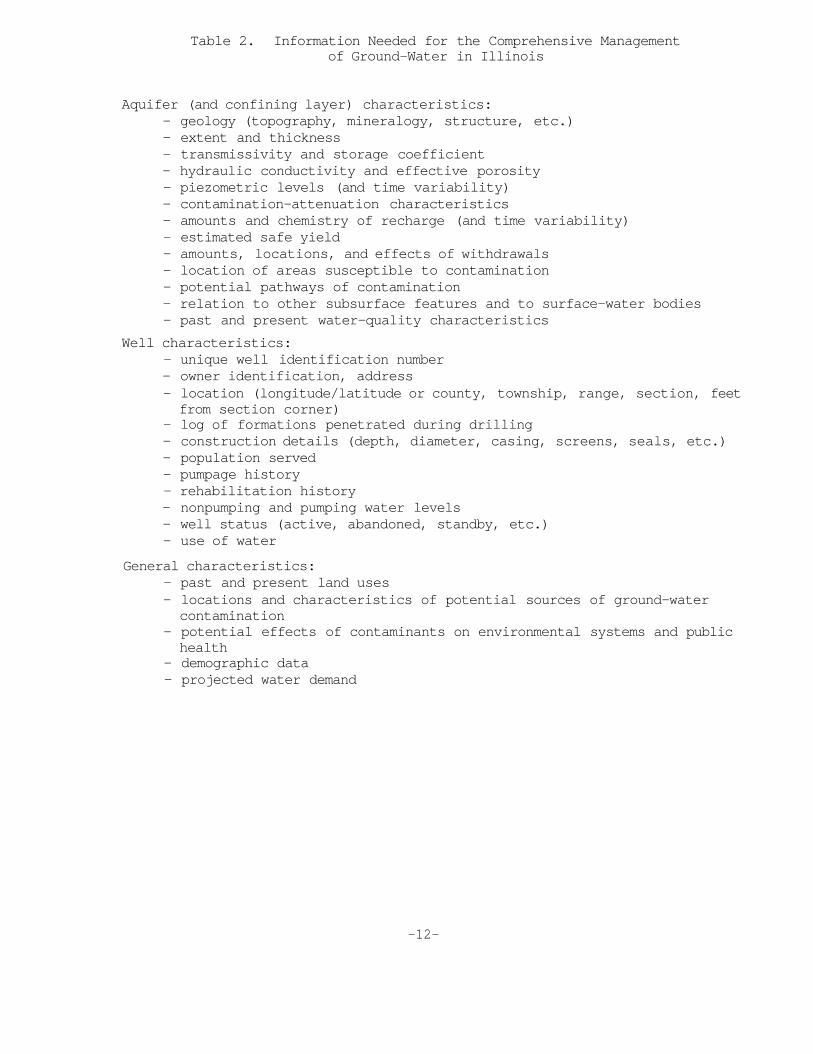
Table 2. Information Needed for the Comprehensive Management of Ground-Water in Illinois
Aquifer (and confining layer) characteristics: - geology (topography, mineralogy, structure, etc.) - extent and thickness - transmissivity and storage coefficient - hydraulic conductivity and effective porosity - piezometric levels (and time variability) - contamination-attenuation characteristics - amounts and chemistry of recharge (and time variability) - estimated safe yield - amounts, locations, and effects of withdrawals - location of areas susceptible to contamination - potential pathways of contamination - relation to other subsurface features and to surface-water bodies - past and present water-quality characteristics
Well characteristics: - unique well identification number - owner identification, address - location (longitude/latitude or county, township, range, section, feet from section corner)
- log of formations penetrated during drilling - construction details (depth, diameter, casing, screens, seals, etc.) - population served - pumpage history - rehabilitation history - nonpumping and pumping water levels - well status (active, abandoned, standby, etc.) - use of water
General characteristics: - past and present land uses - locations and characteristics of potential sources of ground-water contamination
- potential effects of contaminants on environmental systems and public health
- demographic data - projected water demand
-12-
- unintended releases as a result of transportation accidents or disasters such as explosions, fires, tornadoes, etc.;
- improper or illegal 3torage and disposal of industrial wastes.
As an example of the significance of accidents as a potential cause of contamination, the USEPA reports that about 10,000 accidental releases of toxic substances occur each year in the U.S., not including incidents which go unreported (Purdue University, 1984). The IEPA (1983) has documented a ten-fold increase in incidents reported to their Emergency Response Unit between 1976 and 1982. In all, nearly one million gallons of liquid hydrocarbons were reportedly spilled in 1982.
The potential contaminants which may be released to ground water from these sources range from relatively harmless inorganic chlorides to possibly harmful pesticides and organic solvents. In Illinois, pollutants are likely to take the form of petroleum products, agricultural chemicals, industrial/ commercial solvents, leachates, and heavy metals.
Of primary concern i3 the possibility of ground-water contamination by organic contaminants and "priority pollutants" identified by the USEPA (Federal Register, 1979). A list of the priority pollutants appears in a later section. These compounds may be especially troublesome with respect to ground-water management for many reasons (Roberts and others, 1982). Although some are known to be potentially toxic to human beings, the health effects of many remain unknown, especially in terms of long-term exposure to very small concentrations. In addition, there exists little or no historical data on the past levels of these compounds in ground water before they were recognized as a potentially serious and widespread problem. There is a very small but growing body of data on these pollutants now, mainly resulting from regulatory activity around landfills, but still no overview of their general occurrence throughout the ground-water environment. The techniques for their detection are relatively new and to quantify them, not just identify their existence, is expensive. For these reasons, it is of the utmost importance to the long-term management of ground water in Illinois to collect data on current level3 of these contaminants. These data will serve to identify areas and aquifers that are already contaminated, and for areas not yet affected by contamination, will provide documentation of baseline concentrations of these contaminants as a standard for comparison with future measurements.
-13-
NETWORK DESIGN
There is a great deal of literature pertaining to the design of surface-water monitoring networks (Adrian and others, 1980; Casey and others, 1983; Everett and Schmidt, 1978; Harmeson and Barcelona, 1981; Loftis and Ward, 1979; Loftis and Ward, 1980; Sanders and others, 1983; Tlnlin, 1976; Ward, 1978; Ward and Loftis, 1983; Ward and others, 1979) and to the design of small-scale monitoring networks for detecting ground-water contamination from identifiable point sources (Carriere and Canter, 1980; USEPA, 1977; Nelson and Ward, 1981). The design concepts presented in these discussions are frequently not transferable to large-scale ground-water monitoring networks.
By comparison, there is relatively little available literature on the design of large-scale networks for monitoring ground water, although this is an area of research which ha3 recently gained attention. Most of the available information is limited to the description of existing or proposed statewide ground-water monitoring networks designed to address the needs of individual states (Clark, 1983; Georgia Department of Natural Resources, 1984; Hult, 1979; Marie, 1976; Mulica and Beck, 1983; Parker, 1982; Peek and Laymon, 1975; Roy and Drake, 1983; Sophocleous, 1983). While these studies sometimes present useful concepts, they are often not directly applicable to other states because of the unique combination of ground-water information needs, geohydrologic characteristics, and capabilities that must be considered. Monitoring network design may incorporate general concepts but, in the end, must be tailored to the unique circumstances of each state.
The process of network design necessarily begins with a statement of the goal3 and objectives of the monitoring program (Moore, 1983; NAS, 1977; Ward, 1981; Sanders and others, 1983). The primary goal of this statewide monitoring network is to collect, manage, and disseminate reliable information on regional ground-water conditions in the principal aquifers of the state and to do so as economically as possible. The information is intended for use by natural resources managers, environmental researchers, and the general public for assisting and directing ground-water management, research, and development activities in the state.
Objectives of the Network
The basic objectives of the proposed Illinois statewide monitoring network are:
1) to identify long-term, regional trends in ground-water quality and quantity in the principal aquifers of Illinois with the greatest detail in areas and aquifers subject to stress by contamination or withdrawals;
2) to use the ground-water quality data base presently maintained by the ISWS to the maximum practical extent for estimating historical ground-water quality conditions and identifying significant trends;
-15-
3) to establish a baseline of information in areas and aquifers not yet affected by ground-water degradation or depletion;
4) to document current levels of synthetic organic contaminants and other "priority pollutants" as an historical basis for comparison with future measurements;
5) to detect existing and developing ground-water quality or quantity problems; and,
6) to act as a triggering mechanism for the conduct of special investigations and remedial actions in areas exhibiting significant real or potential ground-water problems.
The statewide monitoring network is not designed to detect small-scale contamination incidents, although it may do so occasionally. It is not a substitute for local-scale monitoring of known or suspected point sources of ground-water contamination. Nor is it intended to define short-term (e.g., seasonal) variations in ground-water quality. It is a large-scale monitoring system primarily intended to support statewide ground-water management activities.
It is important to recognize that a sampling program which successfully satisfies certain monitoring objectives may not necessarily be adequate for a different purpose. For example, the IEPA currently samples PWS wells to estimate the raw water quality of treatment plant, the effectiveness of the water treatment methods, or the quality of the water pumped into the water distribution system in cases where little or no treatment is needed. Thi3 information is extremely important to the well owner and water user. However, without a reliable well log and detailed well construction features (e.g., accurate depth, screened or open elevations, etc.), it is virtually impossible to relate the results of these sample analyses to the quality of the ground water within a particular water-bearing formation at that location (Silverman and Spangler, 1983). Thus, while it is desirable to sample all wells in the state to determine the quality of the water which is being consumed, sampling unreliably documented wells will not provide useful, complete information about the ground-water resources of the state.
Another example of conflicting objectives is the controversy among some ground-water monitoring experts over the use of water production wells as opposed to low-capacity monitoring wells for sampling ground water in a particular aquifer and location. It is generally true that water samples from high-capacity wells are integrated or composite samples representing the "average" water quality over a potentially large volume of the aquifer, not point specific or local quality. For some monitoring purposes this is not only acceptable but preferable to data from only a small volume of the geologic formation.
This monitoring network is not intended to define in situ ground-water quality. Because of state of the art limitations in monitoring techniques, this goal cannot currently be achieved. The focus of this program is to monitor the quality of the ground water as it is produced by wells for water 3upply purposes.
-16-
Areas to Monitor
Because it is not practical to monitor ground water beneath all areas and within all water-bearing formations of the state to the same level of detail, it is necessary to identify areas which have the greatest probability of contamination (i.e.. highly susceptible areas) and for which the potential long-term consequences of contamination would be most severe (i.e., major water-supply areas) (LeGrand, 1968; Carriere and Canter, 1980).
The approach used to determine statewide monitoring priorities in this study is basically that suggested by O'Hearn and Williams (1982). As that report describes, priorities for monitoring are related to the following general aquifer characteristics: current use of the aquifer for water supply, potential for future water supply use (potential yield), aquifer susceptibility to contamination, numbers and types of potential sources of contamination, and evidence of existing contamination.
The regions of the state with the most urban/industrial development and therefore, the greatest number and variety of potential contaminant sources (O'Hearn and Williams, 1982) generally coincide with areas having the greatest ground-water resource development. Fortunately, these areas also have the greatest number of PWS wells and most historical water quality data available for use in a statewide ground-water monitoring network. For example, it is generally true that the counties which generate the greatest amounts of hazardous wastes in Illinois also have the greatest number of PWS wells (Barcelona and others, 1983).
Although using existing PWS wells for monitoring purposes automatically places emphasis on areas and aquifers with the greatest current ground-water development, long-term ground-water management strategies should also protect potential future water-supply areas and aquifers.
Evidence of existing contamination as a criterion for setting monitoring priorities is discussed in a subsequent section of this report, Monitoring Strategy. Thus, of the five criteria listed earlier, two remain for consideration. These are the potential yield of the aquifer and susceptibility of the aquifer to contamination.
The definition of areas for monitoring was accomplished by: 1) identifying the principal ground-water supply areas and aquifers of Illinois based on estimated potential yield; and 2) utilizing the "aquifer susceptibility" maps developed by the ISGS to delineate areas within these principal aquifers which are at greatest risk to direct and rapid contamination based on hydro-geologic characteristics and setting.
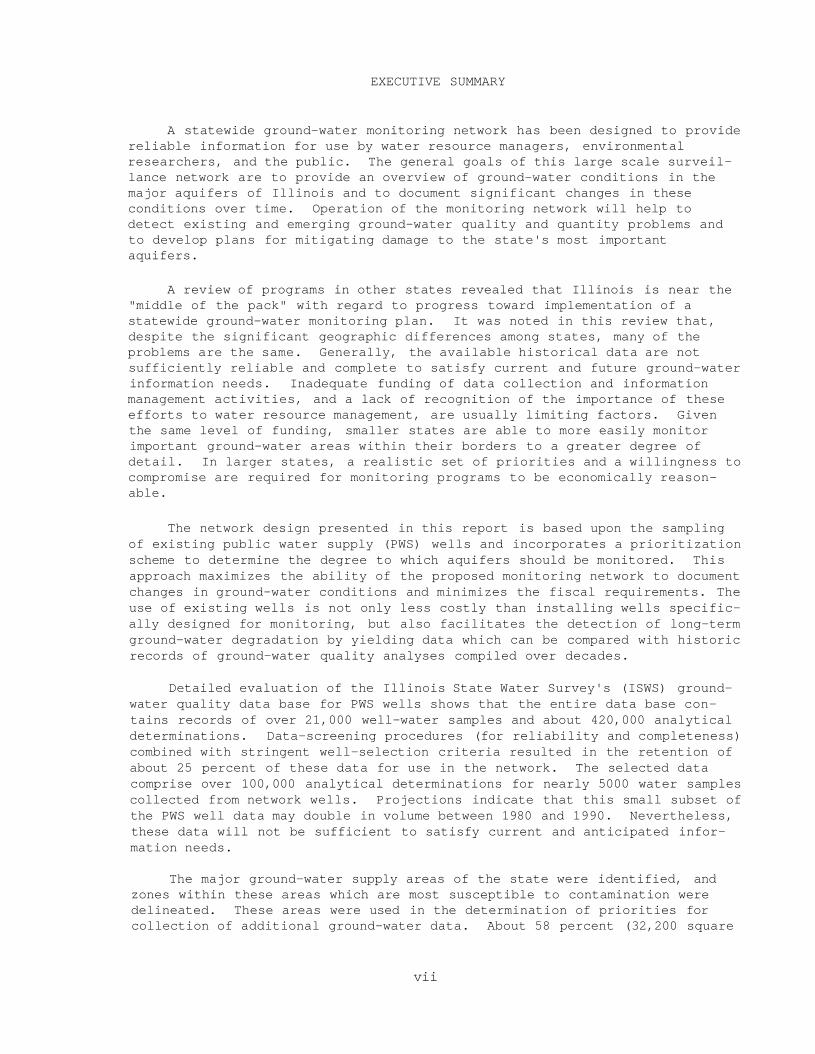
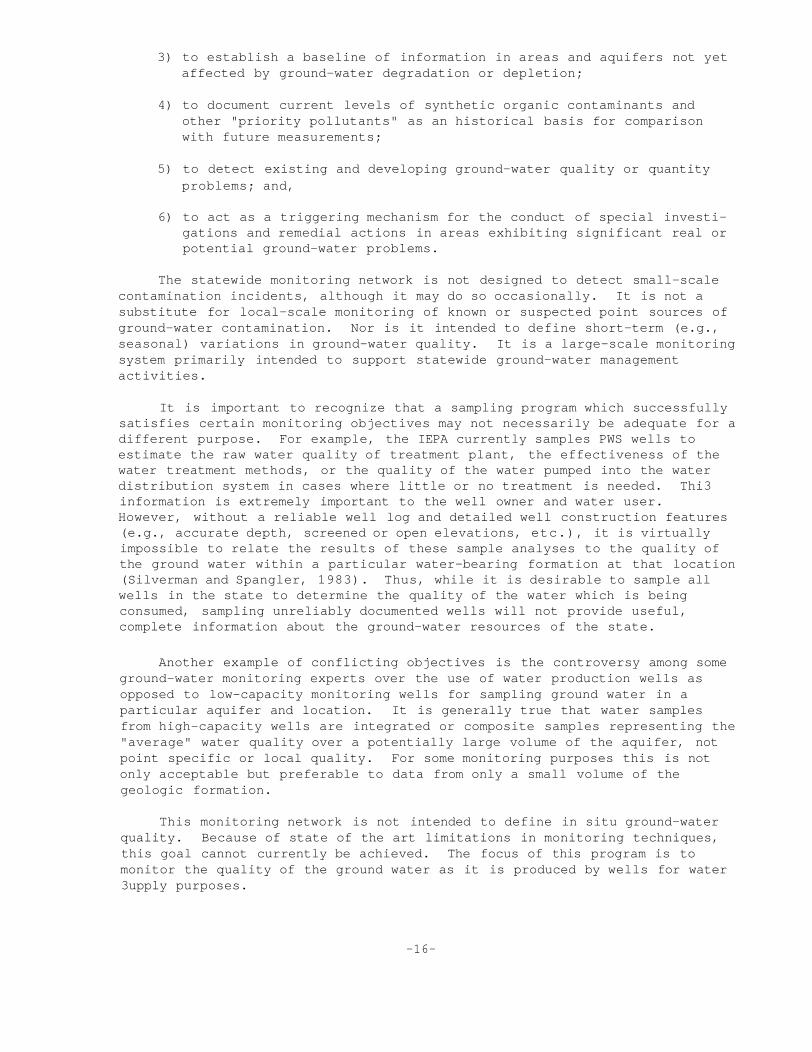
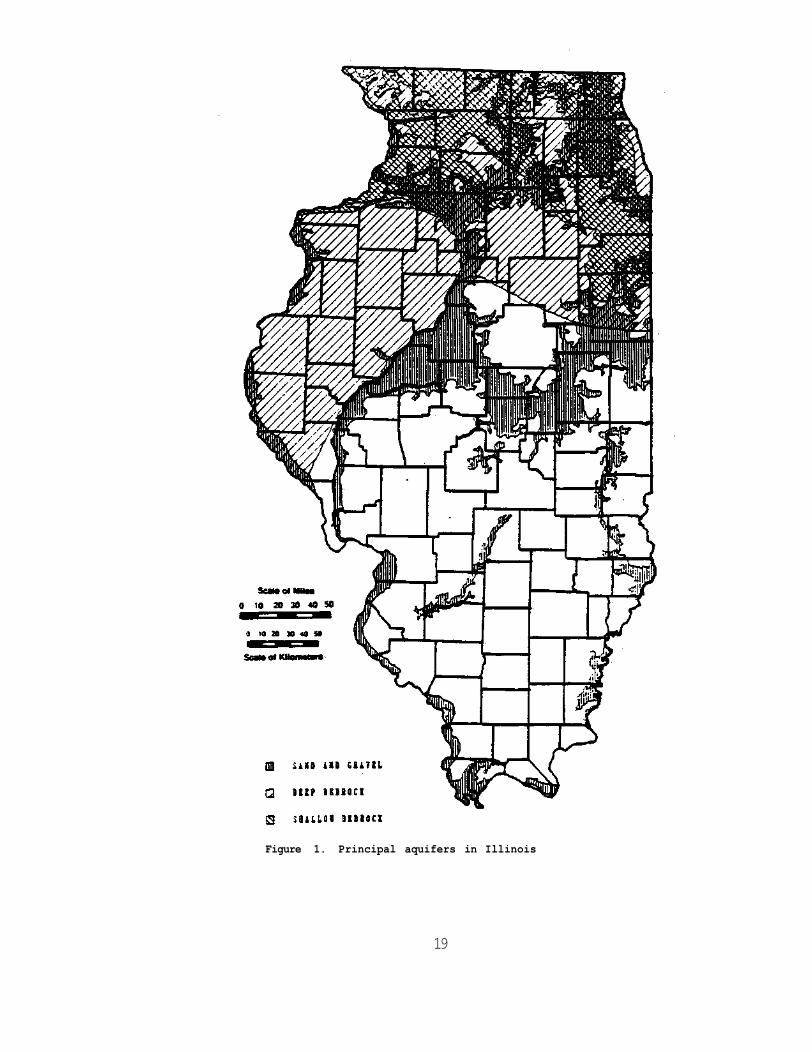
"Principal aquifers" (see figure 1) are defined relative to statewide conditions as: aquifers with a potential yield of at least 100,000 gallons per day per square mile and having an area of at least 50 square miles. The designation of principal aquifers based on estimated potential yield and total area is not unique to this study. This general method has also been used to delineate major and minor aquifers in the State of Texas (Muller and Price, 1979). Potential aquifer yield values and areas were obtained from maps developed for the original State Water Plan (State of Illinois, 1967).
-17-
Potential yield values were available for sand/gravel, shallow bedrock, and deep bedrock aquifers.
The designation of principal aquifers does not mean that locally significant water supply areas do not exist elsewhere in the state. In setting priorities, the state must consider the significance of a particular aquifer in relation to the state as a whole. Aquifers that have local importance but are relatively less extensive or productive are best addressed in small-scale management plans developed by local government agencies. In fact, refined delineation and estimates of potential yield may reveal areas of potentially significant ground-water supplies which are not currently determined. Areas such as these should be added to the monitoring system only if they meet the guidelines used in this study.
While the deep bedrock (Cambrian-Ordovician) aquifer system in Illinois has an estimated potential yield of less than 100,000 gallons per day per square mile, its land area (approximately 23,900 square miles or about 43 percent of the state) and its importance for water supply in the northern part of the state (33 percent of all ground-water withdrawn) warrant special consideration. Therefore, it was included as a principal aquifer on the basis of total potential yield (which may be as much as 500 million gallons per day). The aquifer is assumed to be bounded on the south by the 10,000 milligram-per-liter total dissolved solids contour line which represents the limits of potable or usable water (Illinois State Water Plan, 1967).
Within the principal aquifers of the state, a distinction is made between areas which may be more quickly contaminated by near-surface activities, such as waste disposal, and areas in which contamination would probably occur more slowly or indirectly. Although areas "highly susceptible to contamination" may be considered "critical recharge areas," there are few areas in Illinois where recharge does not occur in appreciable amounts. However, in some areas, recharge is more rapid due to the presence of more permeable deposits near the land surface. These areas have been located by the ISGS with the use of "stack unit" mapping.
The ISGS aquifer susceptibility maps are based upon the relative speed with which leachate from non-hazardous waste sources (e.g., household septic tanks, domestic waste landfills, etc.) could reach the saturated zone. These maps are Limited in their applicability to other potential contamination sources and pathways. Important assumptions have been made in making the translation from stratigraphic definition to the associated degree of threat. One inherent limitation of the maps is that only the uppermost 50 feet of the subsurface is considered. It would be erroneous to conclude that deeper formations, or those rated "less susceptible," are immune to contamination. In fact, contamination of deeper formations can occur more slowly, less directly, or by the inflow of contaminated recharge from adjacent deposits.
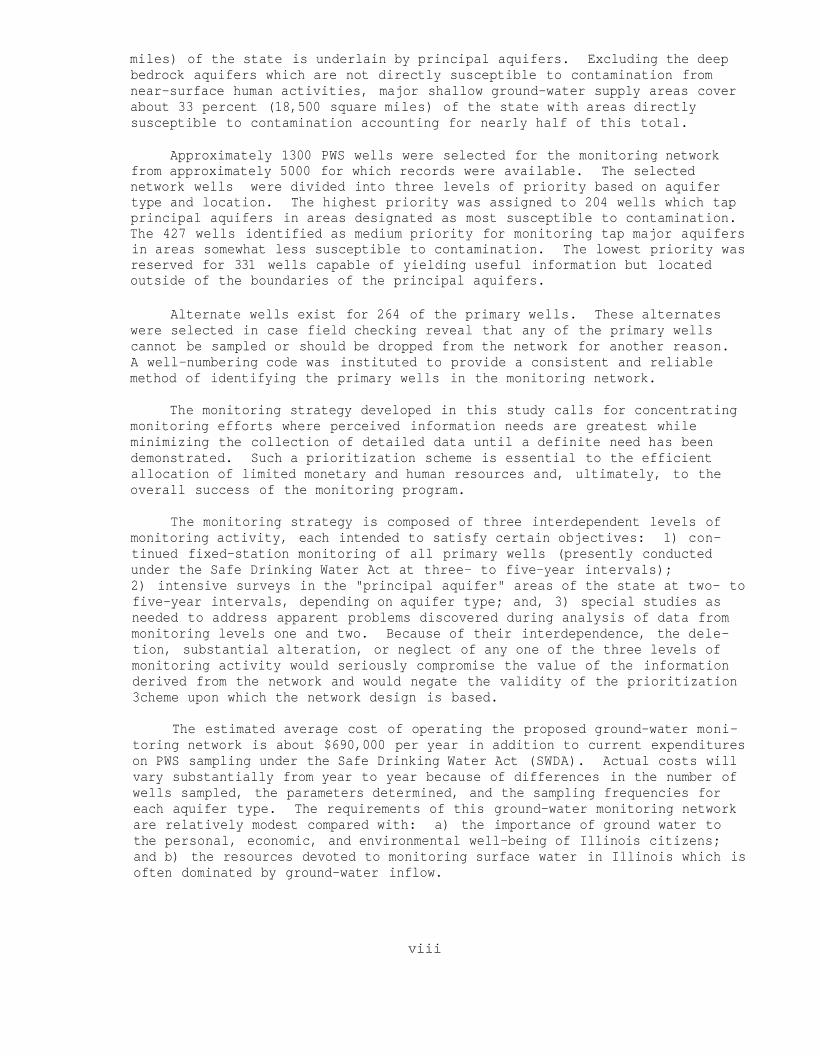
The principal aquifers of Illinois (figure 1) can be divided into three basic categories: sand and gravel, shallow bedrock, and deep bedrock. Principal sand and gravel aquifers occupy 11,800 square miles or about 21 percent of the state. Approximately half of this area, 5,900 square miles, has been designated as "highly susceptible to contamination" (see figure 2). Principal shallow bedrock aquifers underlie about 8,600 square miles (15 percent) of the state. About 28 percent (2,400 square miles) of the principal shallow
-18-
19
Figure 1. Principal aquifers in Illinois
20
Figure 2. Susceptible areas of the sand and gravel aquifers
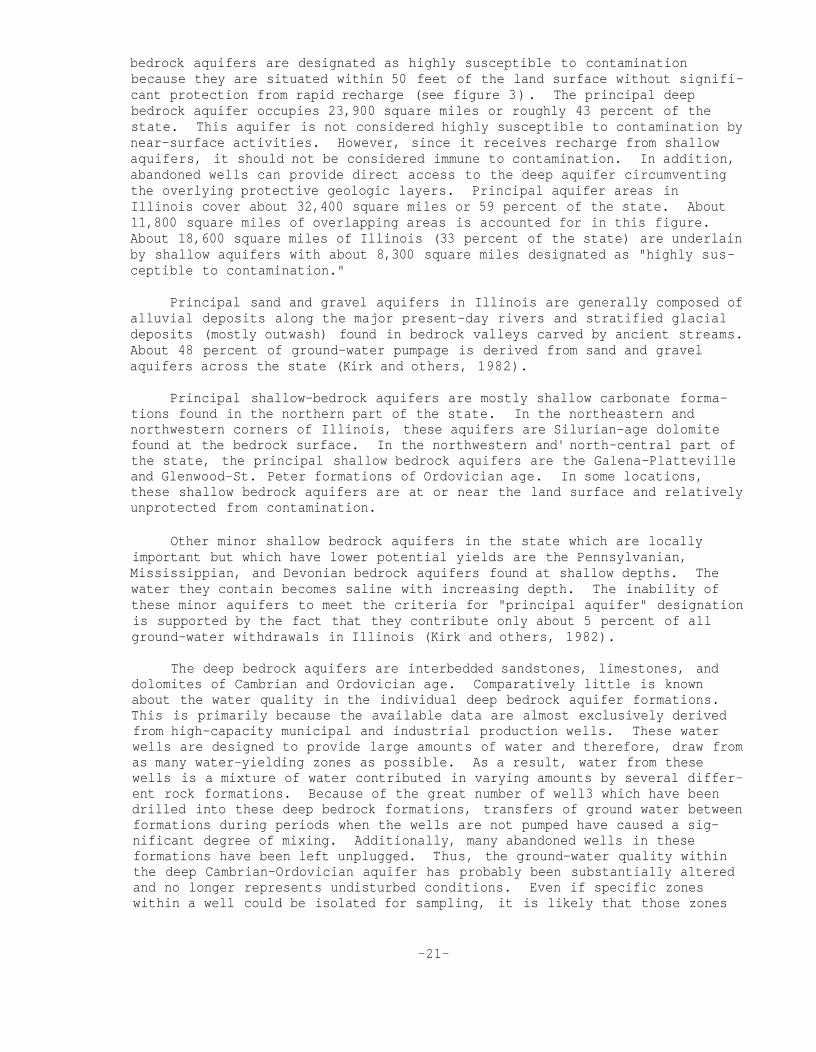
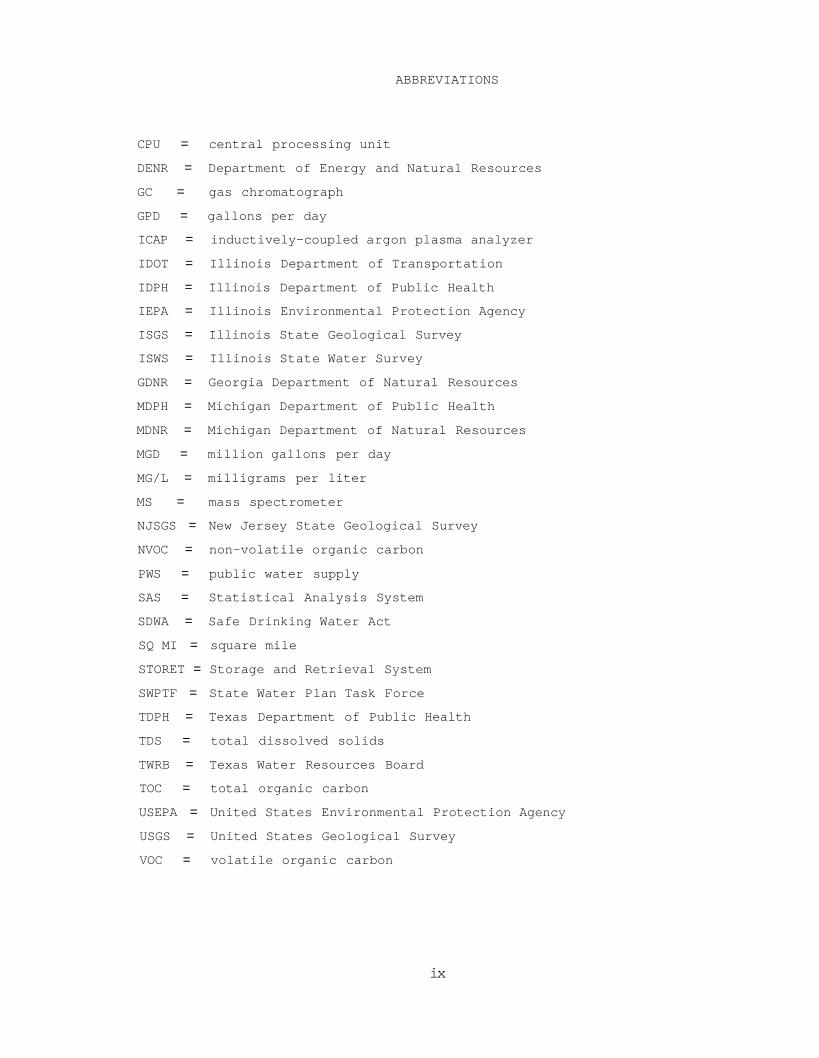
bedrock aquifers are designated as highly susceptible to contamination because they are situated within 50 feet of the land surface without significant protection from rapid recharge (see figure 3). The principal deep bedrock aquifer occupies 23,900 square miles or roughly 43 percent of the state. This aquifer is not considered highly susceptible to contamination by near-surface activities. However, since it receives recharge from shallow aquifers, it should not be considered immune to contamination. In addition, abandoned wells can provide direct access to the deep aquifer circumventing the overlying protective geologic layers. Principal aquifer areas in Illinois cover about 32,400 square miles or 59 percent of the state. About 11,800 square miles of overlapping areas is accounted for in this figure. About 18,600 square miles of Illinois (33 percent of the state) are underlain by shallow aquifers with about 8,300 square miles designated as "highly susceptible to contamination."
Principal sand and gravel aquifers in Illinois are generally composed of alluvial deposits along the major present-day rivers and stratified glacial deposits (mostly outwash) found in bedrock valleys carved by ancient streams. About 48 percent of ground-water pumpage is derived from sand and gravel aquifers across the state (Kirk and others, 1982).
Principal shallow-bedrock aquifers are mostly shallow carbonate formations found in the northern part of the state. In the northeastern and northwestern corners of Illinois, these aquifers are Silurian-age dolomite found at the bedrock surface. In the northwestern and' north-central part of the state, the principal shallow bedrock aquifers are the Galena-Platteville and Glenwood-St. Peter formations of Ordovician age. In some locations, these shallow bedrock aquifers are at or near the land surface and relatively unprotected from contamination.
Other minor shallow bedrock aquifers in the state which are locally important but which have lower potential yields are the Pennsylvanian, Mississippian, and Devonian bedrock aquifers found at shallow depths. The water they contain becomes saline with increasing depth. The inability of these minor aquifers to meet the criteria for "principal aquifer" designation is supported by the fact that they contribute only about 5 percent of all ground-water withdrawals in Illinois (Kirk and others, 1982).
The deep bedrock aquifers are interbedded sandstones, limestones, and dolomites of Cambrian and Ordovician age. Comparatively little is known about the water quality in the individual deep bedrock aquifer formations. This is primarily because the available data are almost exclusively derived from high-capacity municipal and industrial production wells. These water wells are designed to provide large amounts of water and therefore, draw from as many water-yielding zones as possible. As a result, water from these wells is a mixture of water contributed in varying amounts by several different rock formations. Because of the great number of well3 which have been drilled into these deep bedrock formations, transfers of ground water between formations during periods when the wells are not pumped have caused a significant degree of mixing. Additionally, many abandoned wells in these formations have been left unplugged. Thus, the ground-water quality within the deep Cambrian-Ordovician aquifer has probably been substantially altered and no longer represents undisturbed conditions. Even if specific zones within a well could be isolated for sampling, it is likely that those zones
-21-
Figure 3. Susceptible areas of shallow bedrock aquifer
22
which have received water from units with greater pressure heads will yield water foreign to those units for an uncertain period of time.
All PWS wells finished in the deep bedrock aquifer at depths greater than 650 feet are considered as one sampling stratum for purposes of this monitoring network. Analysis of data collected from this group of wells will indicate the validity of the assumption that the data are representative of the same population regardless of the individual formations open to the well. If no significant difference in data from proximal wells is found, this assumption will be borne out. If significant differences are found, sub-setting of the deep bedrock wells can be done. In short, separation of deep bedrock wells into groups on the basis of individual formations open to the well is assumed unnecessary pending analysis of the first "round" of sampling results.
Well Selection
The collection of reliable ground-water monitoring data begins with the selection of sampling stations which are capable of yielding the best quality information. Poorly-chosen sampling points may yield data of little or no value. Proper selection of sampling points is necessary to ensure the quality of the monitoring program's results.
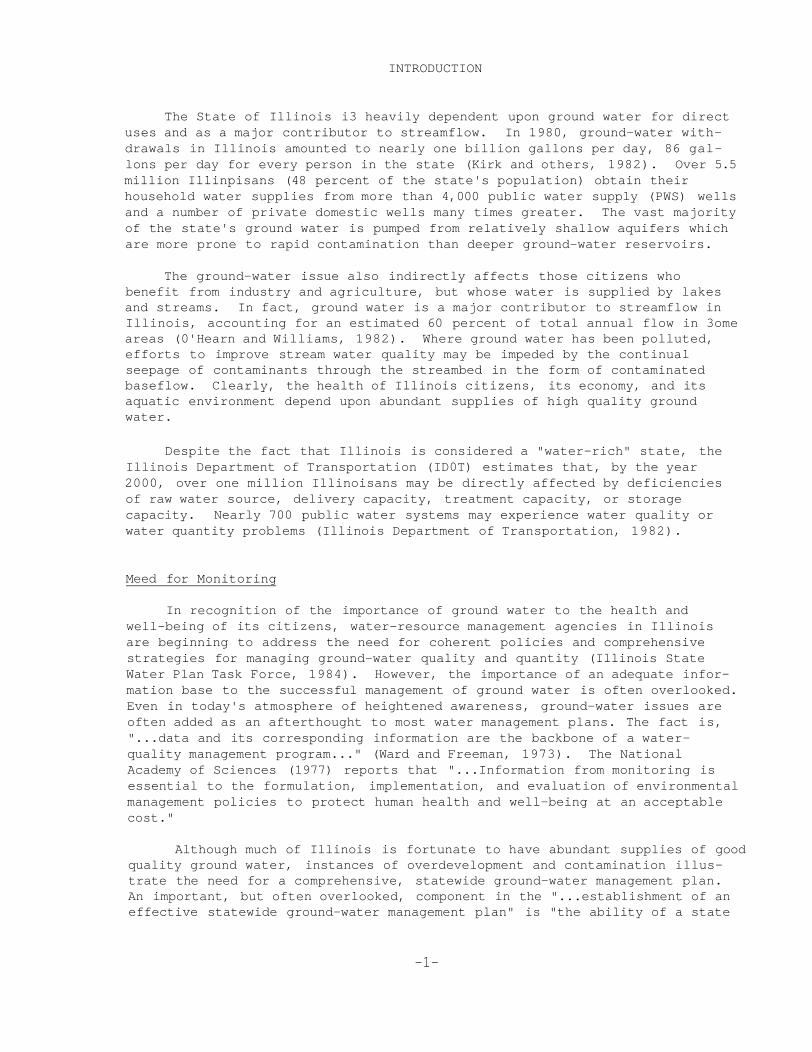
The areal distribution of PWS wells, and thus potential monitoring points, is heavily weighted toward the six-county area of northeastern Illinois (see figure 4). Thirty percent of all PWS wells (and one-third of all of the PWS water quality data stored in the SWS data base) are located in this six-county region. Half of all PWS wells (and sample data) are found in 14 counties which represent just over 18 percent of the land area of the state. DuPage County has the greatest density of PWS wells of all Illinois counties with almost 90 PWS wells per 100 3quare miles.
All of the nearly 5,000 PWS wells in the state for which records exist at the ISWS were considered for inclusion in the monitoring network. Through a process of elimination, wells which met certain criteria were selected from the complete list. The criteria used ensured that data from those wells could provide useful information for statewide monitoring of ground-water resources. Similar to the approach used by the State of Florida (Silverman and Spangler, 1983), these criteria provided for preliminary verification of: 1) the determination of the geologic formation(s) penetrated by the borehole and those contributing water to the well; 2) the sampleability of the well;• and, 3) the accurate identification of the well's location, owner, and historical water quality record.
Four sources of information were used to determine well characteristics: 1) the ISWS Bulletin 60 series of publications summarizing PWS's for selected counties; 2) the PWS well information used in support of the Illinois Water Inventory Program; 3) the computer file used to automatically verify and(or) assign the well number, depth, location, and other 3ample support information during the entry of ground-water sample analysis data into the ISWS groundwater quality data base; and 4) the PWS "basic data" files stored on paper at the ISWS. The following data were tabulated for all recorded PWS wells: owner name, ISWS municipal owner number, local well number and(or) name, well
-23-
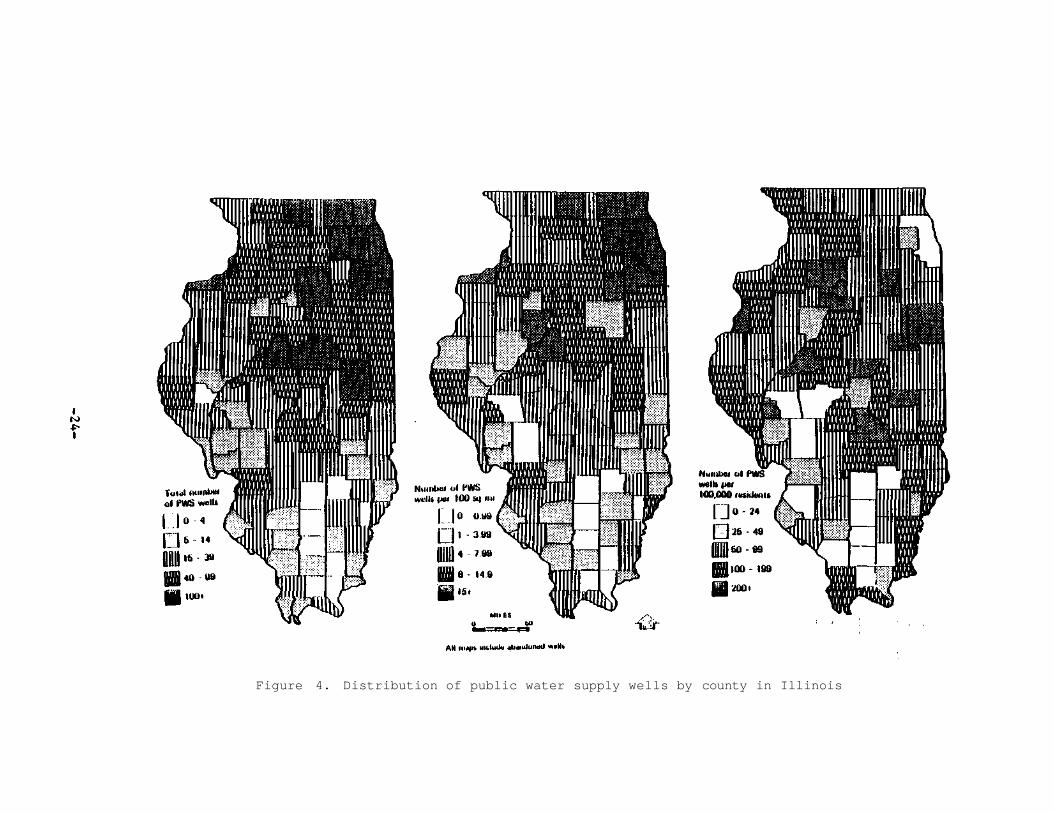
Figure 4. Distribution of public water supply wells by county in Illinois
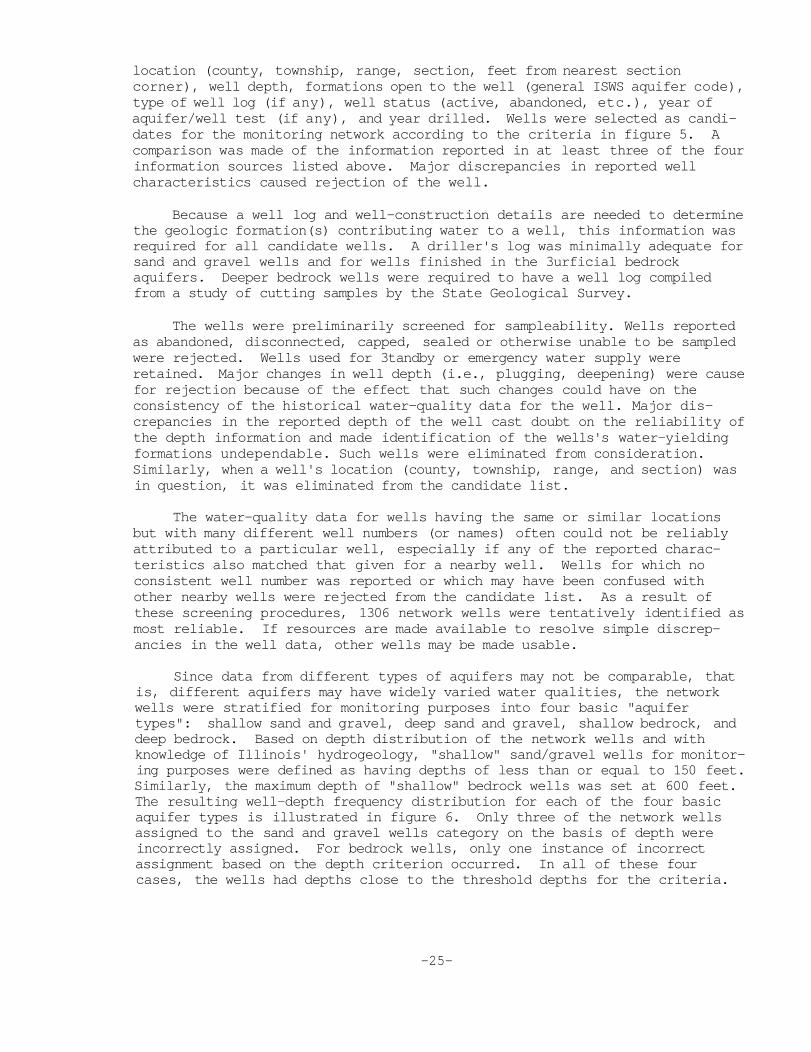
location (county, township, range, section, feet from nearest section corner), well depth, formations open to the well (general ISWS aquifer code), type of well log (if any), well status (active, abandoned, etc.), year of aquifer/well test (if any), and year drilled. Wells were selected as candidates for the monitoring network according to the criteria in figure 5. A comparison was made of the information reported in at least three of the four information sources listed above. Major discrepancies in reported well characteristics caused rejection of the well.
Because a well log and well-construction details are needed to determine the geologic formation(s) contributing water to a well, this information was required for all candidate wells. A driller's log was minimally adequate for sand and gravel wells and for wells finished in the 3urficial bedrock aquifers. Deeper bedrock wells were required to have a well log compiled from a study of cutting samples by the State Geological Survey.
The wells were preliminarily screened for sampleability. Wells reported as abandoned, disconnected, capped, sealed or otherwise unable to be sampled were rejected. Wells used for 3tandby or emergency water supply were retained. Major changes in well depth (i.e., plugging, deepening) were cause for rejection because of the effect that such changes could have on the consistency of the historical water-quality data for the well. Major discrepancies in the reported depth of the well cast doubt on the reliability of the depth information and made identification of the wells's water-yielding formations undependable. Such wells were eliminated from consideration. Similarly, when a well's location (county, township, range, and section) was in question, it was eliminated from the candidate list.
The water-quality data for wells having the same or similar locations but with many different well numbers (or names) often could not be reliably attributed to a particular well, especially if any of the reported characteristics also matched that given for a nearby well. Wells for which no consistent well number was reported or which may have been confused with other nearby wells were rejected from the candidate list. As a result of these screening procedures, 1306 network wells were tentatively identified as most reliable. If resources are made available to resolve simple discrepancies in the well data, other wells may be made usable.
Since data from different types of aquifers may not be comparable, that is, different aquifers may have widely varied water qualities, the network wells were stratified for monitoring purposes into four basic "aquifer types": shallow sand and gravel, deep sand and gravel, shallow bedrock, and deep bedrock. Based on depth distribution of the network wells and with knowledge of Illinois' hydrogeology, "shallow" sand/gravel wells for monitoring purposes were defined as having depths of less than or equal to 150 feet. Similarly, the maximum depth of "shallow" bedrock wells was set at 600 feet. The resulting well-depth frequency distribution for each of the four basic aquifer types is illustrated in figure 6. Only three of the network wells assigned to the sand and gravel wells category on the basis of depth were incorrectly assigned. For bedrock wells, only one instance of incorrect assignment based on the depth criterion occurred. In all of these four cases, the wells had depths close to the threshold depths for the criteria.
-25-
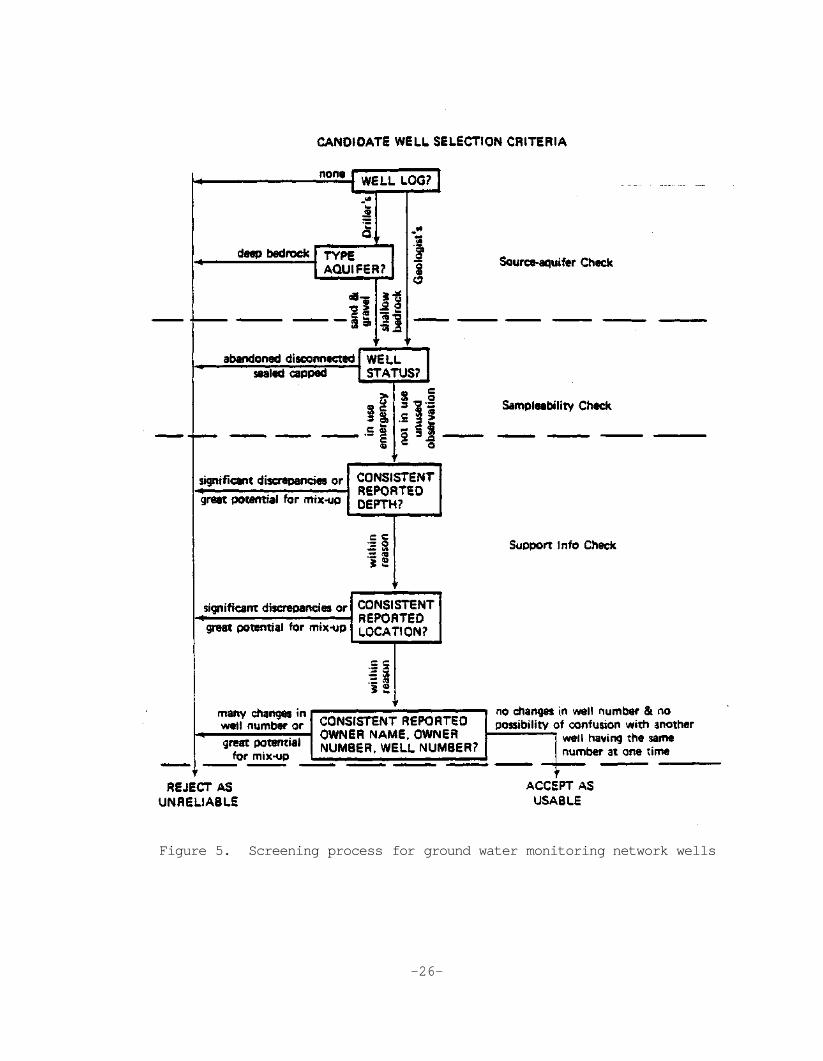
Figure 5. Screening process for ground water monitoring network wells
-26-
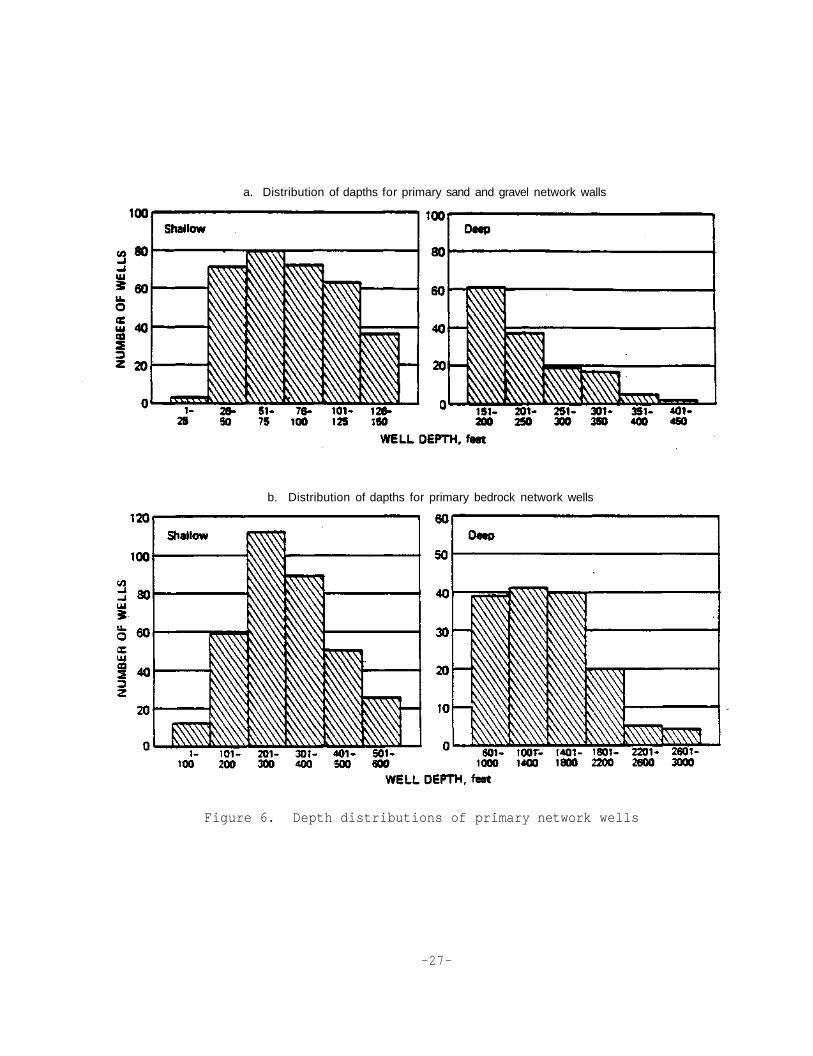
a. Distribution of dapths for primary sand and gravel network walls
b. Distribution of dapths for primary bedrock network wells
Figure 6. Depth distributions of primary network wells
-27-
In many instances, selected network wells of the same aquifer type were located in close proximity to each other. To avoid oversampling and to conserve funds, a practical limit of one well per geographic section per aquifer type was set. Where more than one well of a given aquifer type was located in a section, one of the wells was chosen to be the "primary'' network well and the others were listed (in order of preference) as "alternate" wells. The overall quality and consistency of the recorded well data and the length of the well's historical water-quality record were major factors in this ordering process. Preference was given to wells with a greater number of historical water-quality samples on file; wells with a longer historical water-quality record, especially wells sampled prior to 1960; wells with a ISGS sample-study log (as opposed to a driller's log); wells with a pump test on record; wells included in the IEPA/USGS pilot program for statewide monitoring; wells that are publicly owned; and shallower wells since they were considered to be more susceptible to contamination.
In the final analysis, 962 primary sampling network wells were designated and 344 alternate network wells were listed for possible replacement of primary wells. It was outside the scope of this preliminary study to field verify the information found in the ISWS's files; it is likely that some of the selected primary wells will be dropped from the network because they are not sampleable. The designation of alternate wells for some primary wells allows rapid replacement of such wells with other comparable wells. Fifty-one of the network wells are among the 100 or so wells chosen by the IEPA/USGS for their pilot program. Forty-five of the IEPA/USGS wells are primary network wells.
After selection of the network wells, monitoring priority levels were assigned to the wells, primarily on the basis of aquifer and location. The highest priority wells are located within principal aquifers and in areas which are highly susceptible to contamination. Medium-priority wells are those wells located within principal aquifers but not in areas designated as highly susceptible to contamination. Network wells which are located outside of principal aquifer areas are assigned the lowest monitoring priority. These priority-level designations are significant considerations in the development of the overall monitoring strategy discussed in the next section of this report.
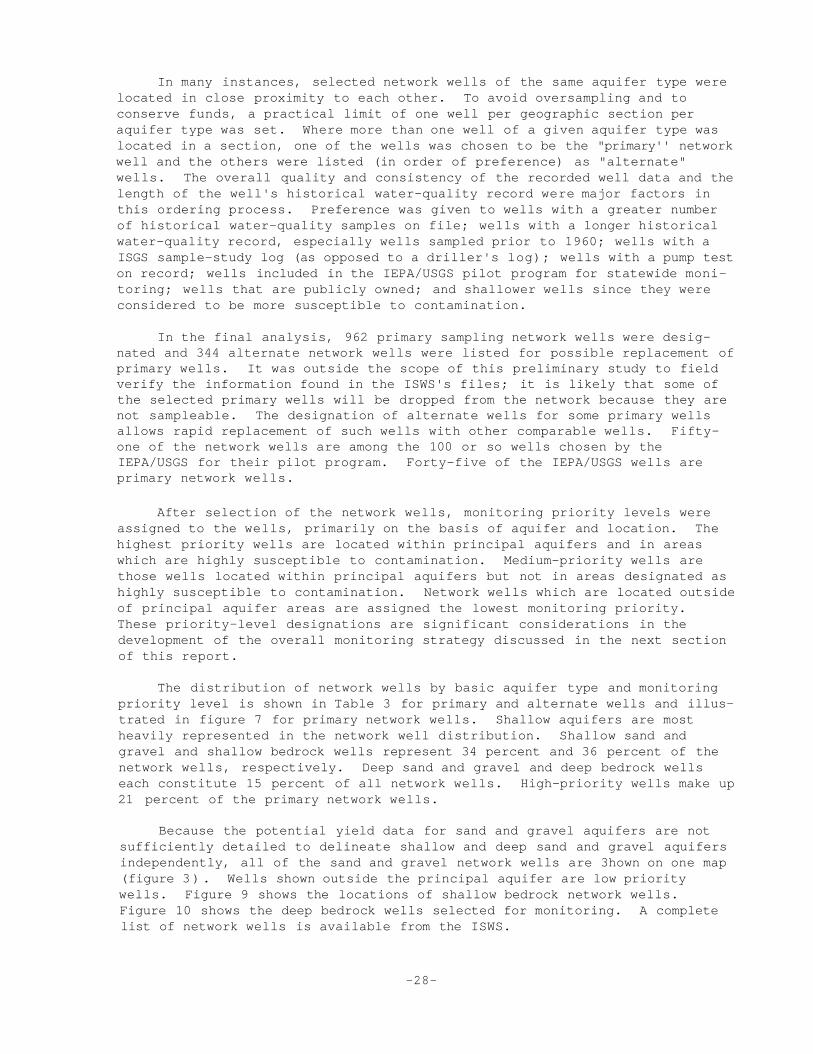
The distribution of network wells by basic aquifer type and monitoring priority level is shown in Table 3 for primary and alternate wells and illustrated in figure 7 for primary network wells. Shallow aquifers are most heavily represented in the network well distribution. Shallow sand and gravel and shallow bedrock wells represent 34 percent and 36 percent of the network wells, respectively. Deep sand and gravel and deep bedrock wells each constitute 15 percent of all network wells. High-priority wells make up 21 percent of the primary network wells.
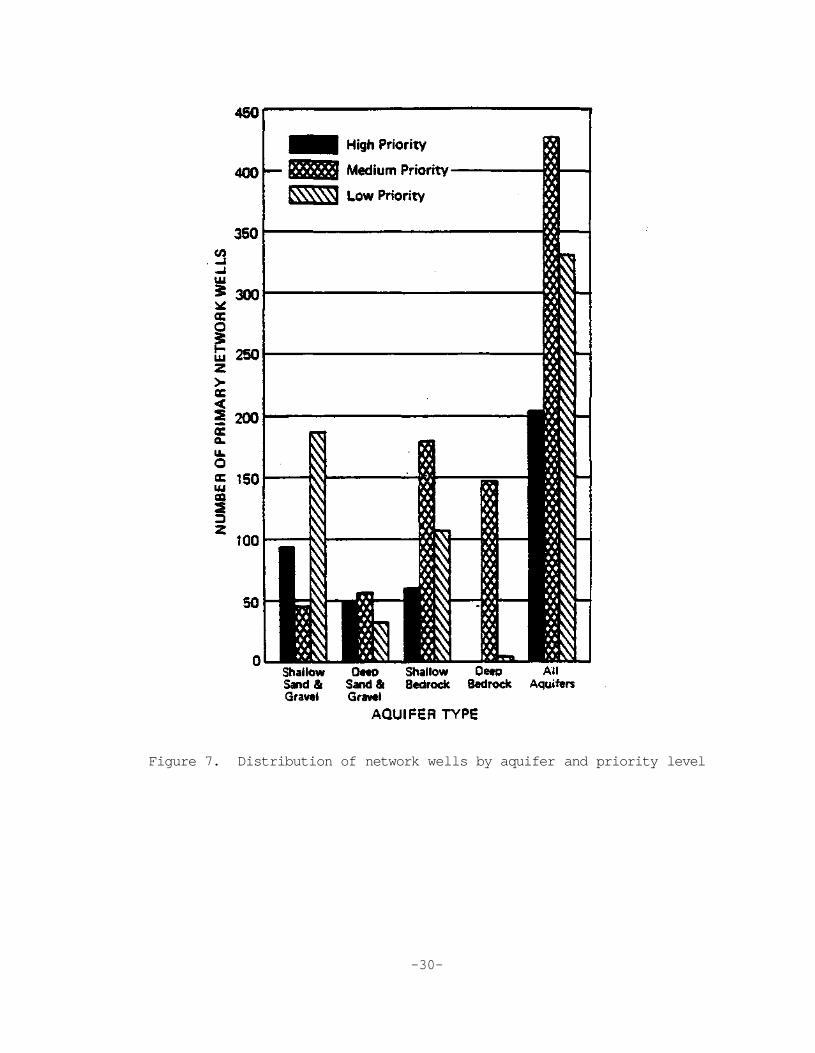
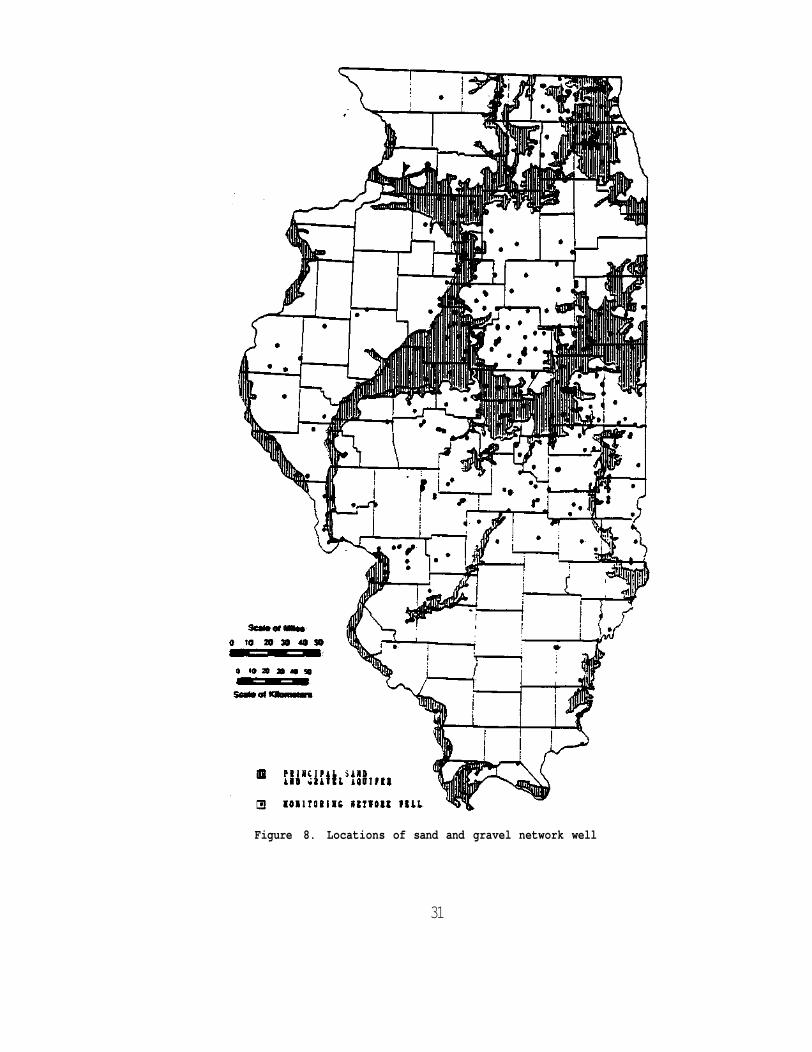
Because the potential yield data for sand and gravel aquifers are not sufficiently detailed to delineate shallow and deep sand and gravel aquifers independently, all of the sand and gravel network wells are 3hown on one map (figure 3). Wells shown outside the principal aquifer are low priority wells. Figure 9 shows the locations of shallow bedrock network wells. Figure 10 shows the deep bedrock wells selected for monitoring. A complete list of network wells is available from the ISWS.
-28-
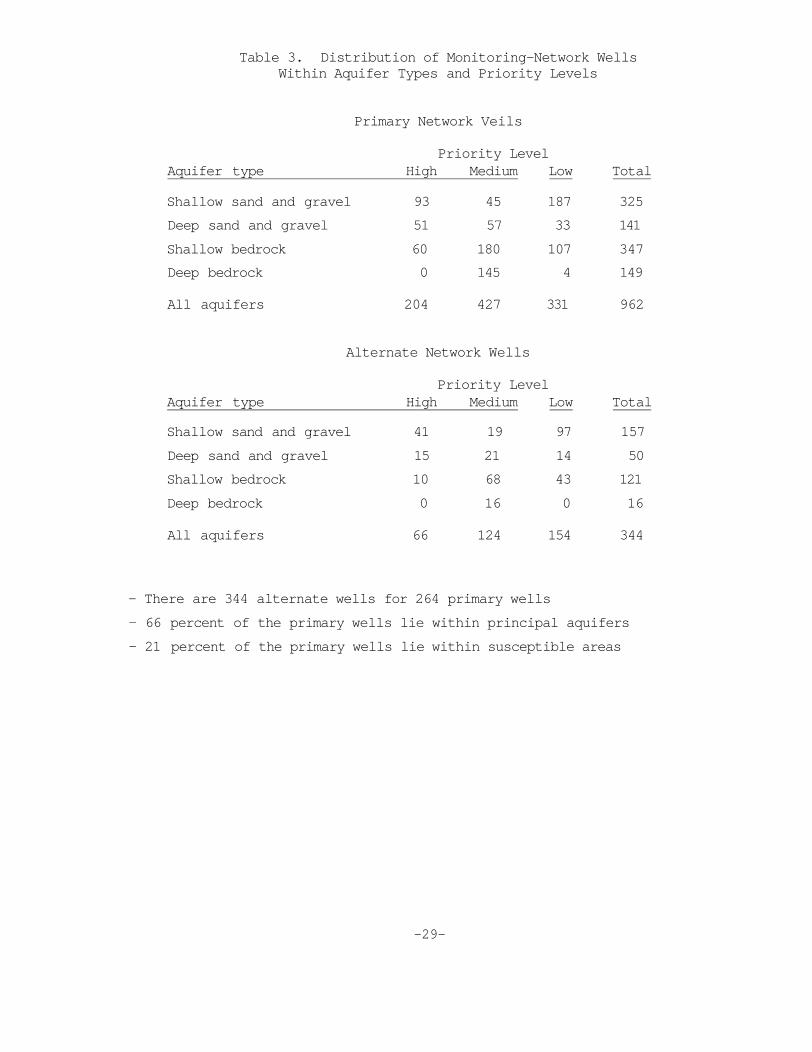
Table 3. Distribution of Monitoring-Network Wells Within Aquifer Types and Priority Levels
Primary Network Veils
- There are 344 alternate wells for 264 primary wells - 66 percent of the primary wells lie within principal aquifers - 21 percent of the primary wells lie within susceptible areas
-29-
Priority Level Aquifer type High Medium Low Total
Shallow sand and gravel 93 45 187 325 Deep sand and gravel 51 57 33 141 Shallow bedrock 60 180 107 347 Deep bedrock 0 145 4 149
All aquifers 204 427 331 962
Alternate Network Wells
Priority Level Aquifer type High Medium Low Total Shallow sand and gravel 41 19 97 157 Deep sand and gravel 15 21 14 50 Shallow bedrock 10 68 43 121 Deep bedrock 0 16 0 16
All aquifers 66 124 154 344
-30-
Figure 7. Distribution of network wells by aquifer and priority level
31
Figure 8. Locations of sand and gravel network well
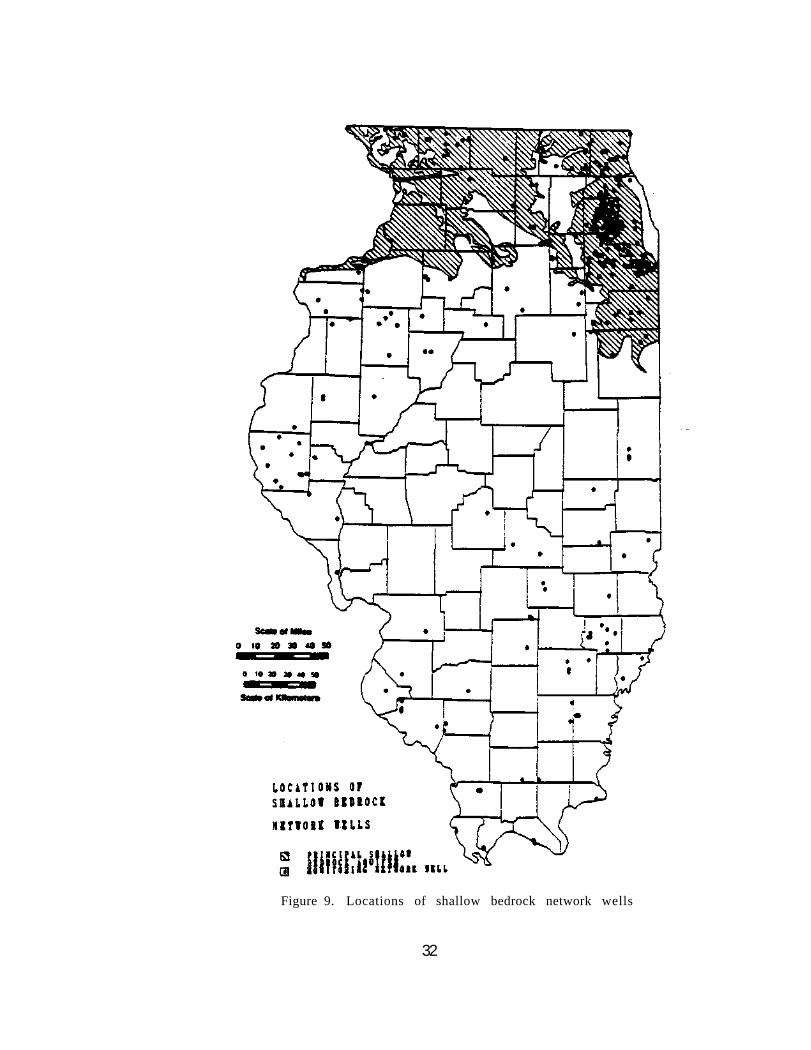
Figure 9. Locations of shallow bedrock network wells
32
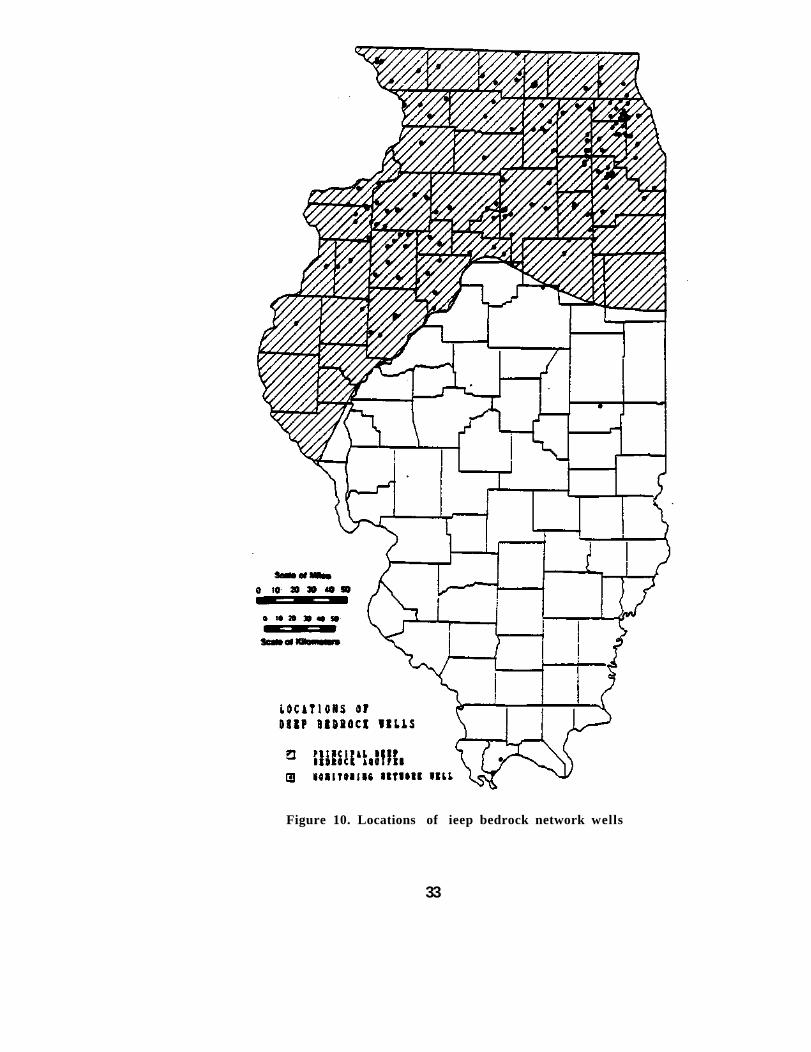
Figure 10. Locations of ieep bedrock network wells
33
Because the aquifer susceptibility maps used in this study consider only the uppermost 50 feet of the subsurface, none of the deep bedrock aquifers are considered highly susceptible to contamination. As a result, there are no high-priority deep bedrock network wells.
The spatial density of network wells by aquifer type and priority level are as follows:
highly-susceptible principal sand and gravel - 26 network wells aquifers per 1000 sq mi
less-susceptible principal sand and gravel - 17 network wells aquifers per 1000 sq mi
non-principal sand and gravel aquifers - 5 network wells per 1000 sq mi
highly-susceptible principal shallow - 26 network wells bedrock aquifers per 1000 sq mi
less-susceptible principal shallow - 29 network wells bedrock aquifers per 1000 sq mi
principal deep bedrock aquifers - 6 network wells per 1000 sq mi
non-principal deep bedrock aquifers - less than 1 network well per 1000 sq mi
After the network wells were selected, historical water-quality data for these wells were retrieved from the data base. These data were separated from the less reliable data to be the base-line for a data system for the monitoring network wells.
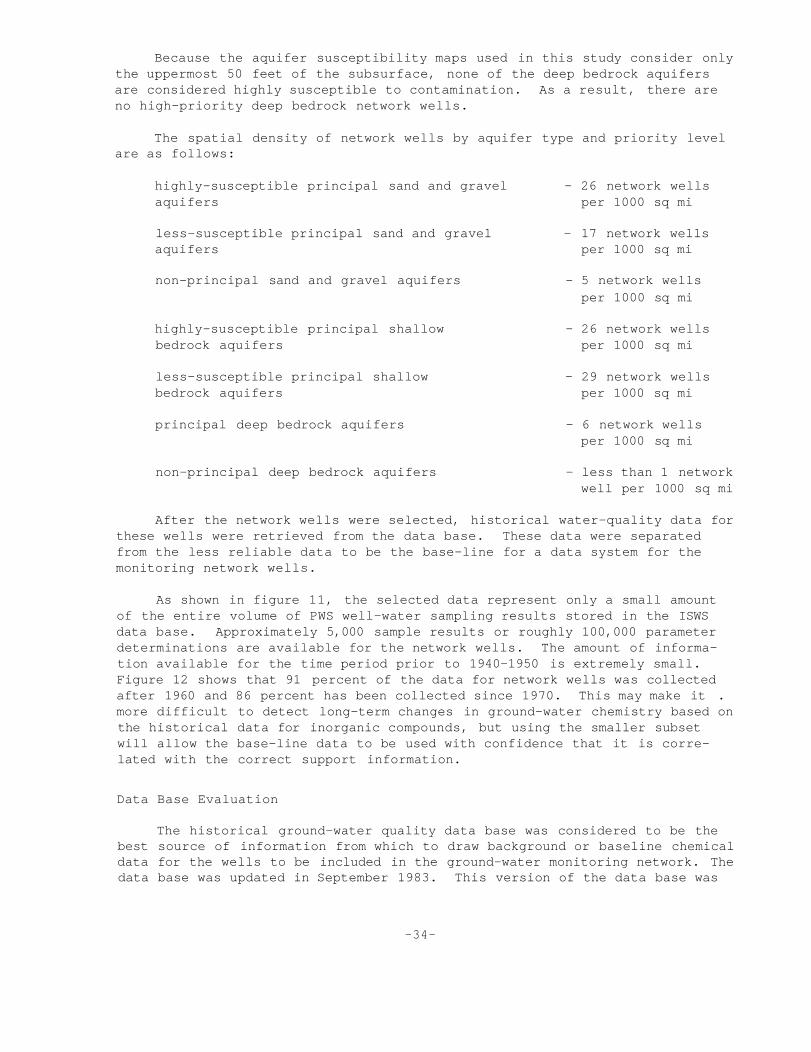
As shown in figure 11, the selected data represent only a small amount of the entire volume of PWS well-water sampling results stored in the ISWS data base. Approximately 5,000 sample results or roughly 100,000 parameter determinations are available for the network wells. The amount of information available for the time period prior to 1940-1950 is extremely small. Figure 12 shows that 91 percent of the data for network wells was collected after 1960 and 86 percent has been collected since 1970. This may make it . more difficult to detect long-term changes in ground-water chemistry based on the historical data for inorganic compounds, but using the smaller subset will allow the base-line data to be used with confidence that it is correlated with the correct support information.
Data Base Evaluation
The historical ground-water quality data base was considered to be the best source of information from which to draw background or baseline chemical data for the wells to be included in the ground-water monitoring network. The data base was updated in September 1983. This version of the data base was
-34-
Figure 11. Number of samples for network wells and for all PWS wells
-35-
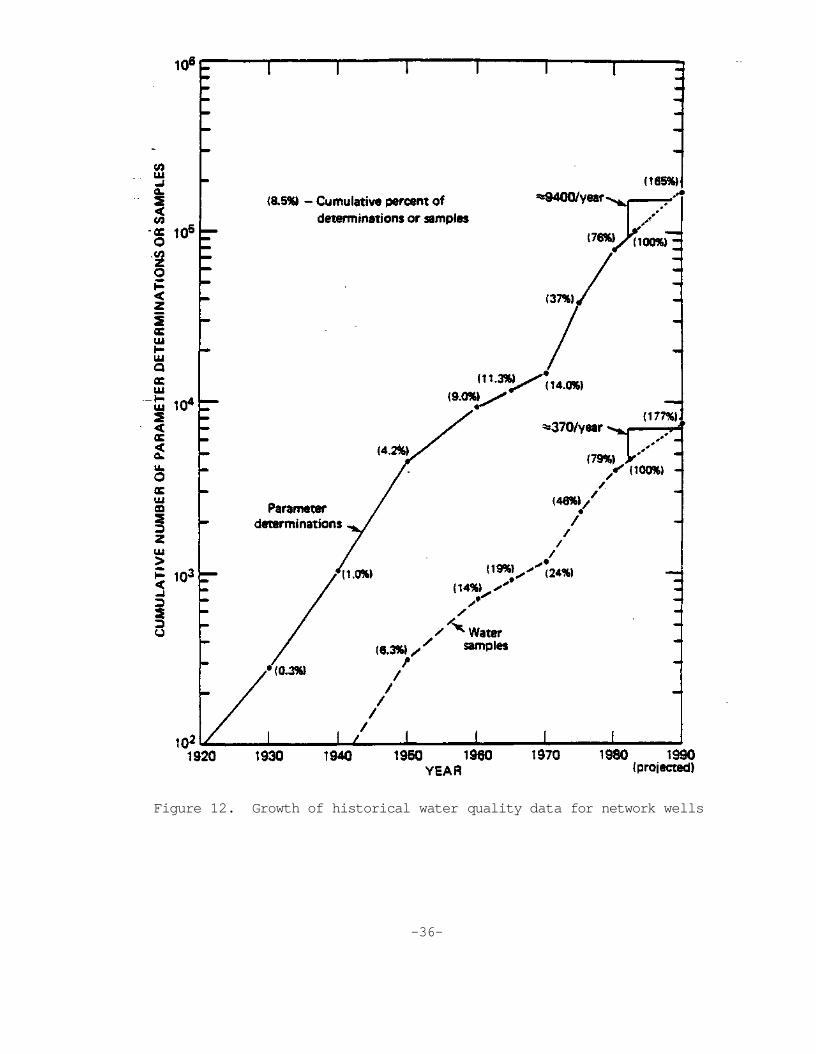
Figure 12. Growth of historical water quality data for network wells
-36-
used for evaluation in this study. Subsequent data will be added to the base at the end of this project and at 3 to 6 month intervals thereafter. The evaluation procedures and programs are documented so the process can be repeated at 2 to 5 year intervals, or as the volume of new data warrant. Water quality data for the network wells will be flagged and added to the network well data base as well as to the general PWS ground-water quality data base.
The importance of using only the most reliable historical data for monitoring purposes has been recognized as essential to the basic integrity of ground-water monitoring programs (MAS, 1977; Pennino, 1984; Carter, 1983; Silverman and Spangler, 1983).
As the mandated "central repository for water data in Illinois," the ISWS has accumulated a large volume of PWS ground-water quality data. Most of the data were generated through the IEPA's program of routine PWS well sampling conducted under the SDWA. Some data were derived from the analysis of water samples submitted to the ISWS'a analytical laboratory by well drillers, well owners, and researchers. These data-collection activities were intended to satisfy objectives which did not include the regional characterization of ground-water conditions.
Past data collection protocols and management of 10, 20, or more years ago could not meet the needs of the present. As the state of the art changed, newer, better methods were employed. As a result, the historical data are neither consistent nor comprehensive. Analytical detection limits and quality assurance information were not and still are not carried with data. The number of chemical analyses for a particular water sample is often small (see figure 13). Necessary "support" information, such as well location, well depth, and well identification number, is often inaccurate or not reported, making positive identification of the sample's source impossible. Of critical importance to this discussion is the fact that past data collection and management activities were originally intended to satisfy very limited objectives.
A report by the National Academy of Sciences (1977) delineated some of the problems in national environmental monitoring programs:
1) a failure to apply scientific principles (including statistical analysis) to the design of monitoring programs and to the analysis of resulting data;
2) inadequate coordination within and among the various agencies collecting and managing environmental data;
3) fragmentation of responsibilities for monitoring activities among agencies;
4) a proliferation of uncoordinated and inefficient monitoring efforts that collect data of poor or unknown quality and reliability;
-37-
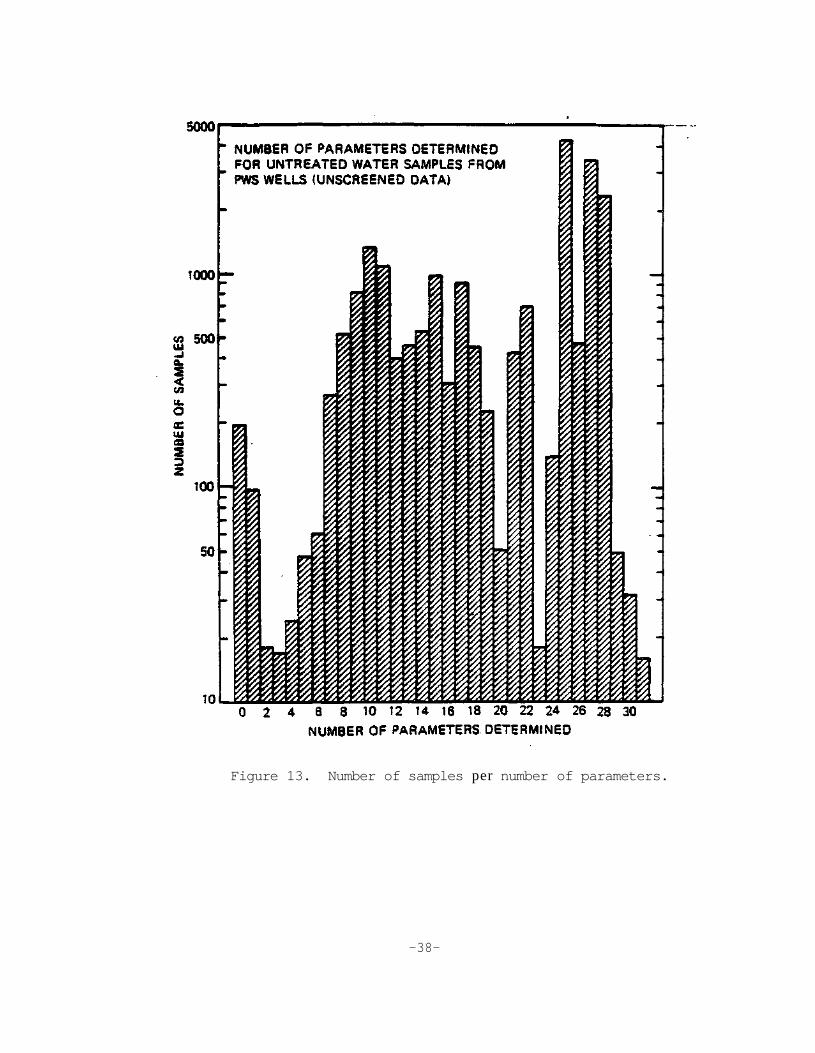
Figure 13. Number of samples per number of parameters.
-38-
5) an inability to recognize the value and importance of reliable environmental data and a concomitant failure to allocate adequate resources (i.e.. staff, equipment, funds) to the management of the data being collected;
6) a lack of procedures for the routine evaluation of the program's objectives, methods, and output;
7) a tendency toward a hasty development of data collection and handling programs which does not allow the prior determination of clearly defined objectives, priorities, and criteria;
8) an undue emphasis on short-term objectives with little attention to long-term monitoring objectives;
9) a lack of consideration of the quality of the data collected and the uses to which the data will be put;
10) an inordinate length of time between sample collection and information dissemination and use; and
11) a lack of understanding of the importance of reliable data from a sound monitoring program to the management of the resource in question.
Understandably Illinois' ground-water data and management procedures demonstrate many of these same problems.
The current ISWS ground-water quality data base was first computerized in the early 1970's. The absence of input from potential data users resulted in a lack of appreciation for the importance of controlling the quality of the data entered. At the time that the computer file was created, the data for PWS wells amounted to about 7000 samples. In the ten years since then, the total number of PWS samples has more than tripled to over 21,000 (see figure 11). The quantity of data to be managed mushroomed, while the resources for managing it diminished.
3ecause most of the data for PWS wells were generated by the IEPA under the SDWA, about two-thirds of all PWS ground-water samples were collected after 1970 (about the time that the IEPA was created). As 3hown in figure 11, about 75 percent of all. PWS well samples were collected after 1960 and 90 percent since 1940. This temporal distribution of samples makes it difficult to ascertain ground-water quality conditions prior to the manifestation of trends. Some studies (Gibb and O'Hearn, 1980; 0'Hearn, unpublished) have shown that trends often become apparent in the data around 1960-1965.
Another factor which tends to limit the value of the historical data for estimating baseline ground-water quality conditions is the small number of parameters determined for some samples, particularly those collected prior to 1970. While 24 percent of all PWS well samples were collected prior to 1960, this represents only about 16 percent of all individual parameter determinations on record. This represents a shift in sampling objectives from simply
-39-
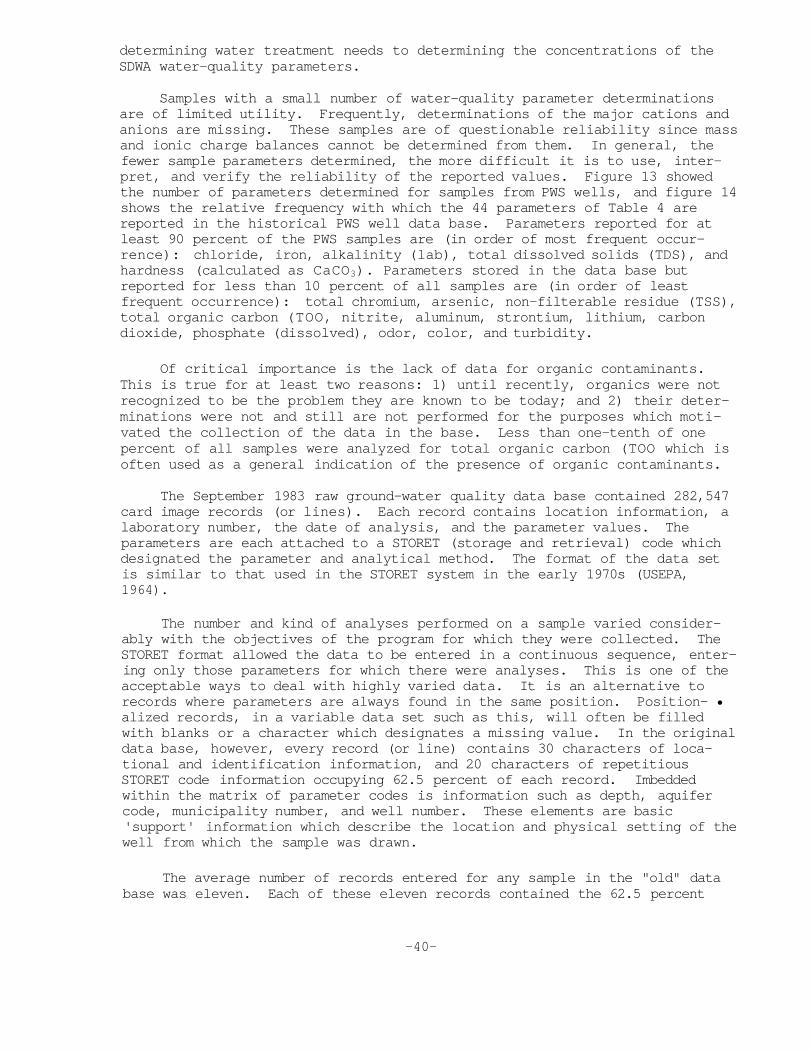
determining water treatment needs to determining the concentrations of the SDWA water-quality parameters.
Samples with a small number of water-quality parameter determinations are of limited utility. Frequently, determinations of the major cations and anions are missing. These samples are of questionable reliability since mass and ionic charge balances cannot be determined from them. In general, the fewer sample parameters determined, the more difficult it is to use, interpret, and verify the reliability of the reported values. Figure 13 showed the number of parameters determined for samples from PWS wells, and figure 14 shows the relative frequency with which the 44 parameters of Table 4 are reported in the historical PWS well data base. Parameters reported for at least 90 percent of the PWS samples are (in order of most frequent occurrence): chloride, iron, alkalinity (lab), total dissolved solids (TDS), and hardness (calculated as CaCO3). Parameters stored in the data base but reported for less than 10 percent of all samples are (in order of least frequent occurrence): total chromium, arsenic, non-filterable residue (TSS), total organic carbon (TOO, nitrite, aluminum, strontium, lithium, carbon dioxide, phosphate (dissolved), odor, color, and turbidity.
Of critical importance is the lack of data for organic contaminants. This is true for at least two reasons: 1) until recently, organics were not recognized to be the problem they are known to be today; and 2) their determinations were not and still are not performed for the purposes which motivated the collection of the data in the base. Less than one-tenth of one percent of all samples were analyzed for total organic carbon (TOO which is often used as a general indication of the presence of organic contaminants.
The September 1983 raw ground-water quality data base contained 282,547 card image records (or lines). Each record contains location information, a laboratory number, the date of analysis, and the parameter values. The parameters are each attached to a STORET (storage and retrieval) code which designated the parameter and analytical method. The format of the data set is similar to that used in the STORET system in the early 1970s (USEPA, 1964).
The number and kind of analyses performed on a sample varied considerably with the objectives of the program for which they were collected. The STORET format allowed the data to be entered in a continuous sequence, entering only those parameters for which there were analyses. This is one of the acceptable ways to deal with highly varied data. It is an alternative to records where parameters are always found in the same position. Position- • alized records, in a variable data set such as this, will often be filled with blanks or a character which designates a missing value. In the original data base, however, every record (or line) contains 30 characters of loca-tional and identification information, and 20 characters of repetitious STORET code information occupying 62.5 percent of each record. Imbedded within the matrix of parameter codes is information such as depth, aquifer code, municipality number, and well number. These elements are basic 'support' information which describe the location and physical setting of the well from which the sample was drawn.
The average number of records entered for any sample in the "old" data base was eleven. Each of these eleven records contained the 62.5 percent
-40-
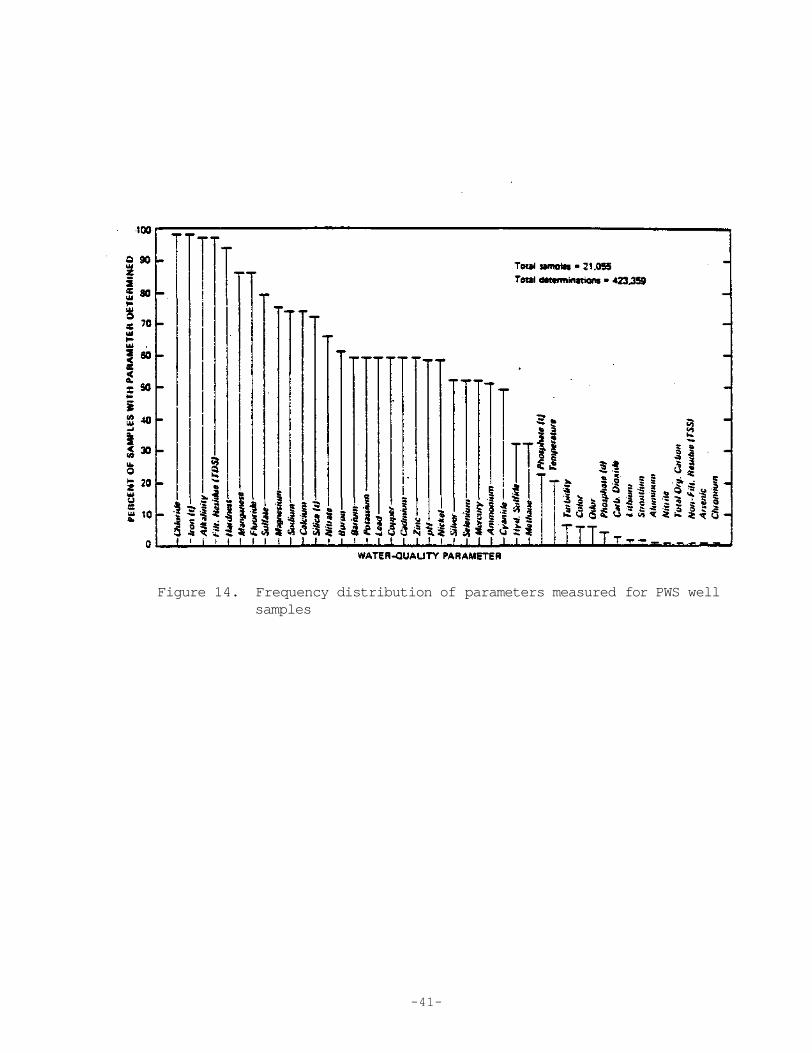
Figure 14. Frequency distribution of parameters measured for PWS well samples
-41-
Table 4. Parameters Stored in the Historical Ground-Water Quality Data Base
Residue Potassium Residue (nonfilterable) Aluminum Ammonium Silver Alkalinity Barium Sodium Chloride Boron Strontium Cyanide Cadmium TOC Fluoride Calcium Zinc Hardness Chromium Color Nitrate Copper Odor Nitrite Iron pH Lead Phosphate (filtered) Temperature Phosphate (unfiltered) Lithium Turbidity Silica Magnesium Free CO2 Sulfate Manganese Methane Arsenic Mercury Hydrogen sulfide Selenium Nickel
-42-
repetitious identification information and 37 percent chemical information. Retrieval of data from this data base for multiple locations or dates, or even several parameters, was complex.
To make the data base more usable, a positionalized data file was created. The new file has verified unconflicting locational and identifier information only once for each sample. The support information is located on the first line for each sample. Data for each chemical parameter occupies a predetermined field. A distinct character string is used to designate 'missing' values. The size of the resulting new file is only 45 percent as large as the old file. At the time when the data were positionalized, the "private-domestic" data were separated from the public water supply data. The classification of "private-domestic" in terms of the ISWS base means that the sample came from an irrigation well, an agricultural well, a private individual's well or an industrial well. The unique problems associated with the data from these wells rendered them useless for the purposes of this study and of little or no value for monitoring purposes.
In addition to the reduced size of the data base, the positional structure of the file offers several other advantages. The data can be easily accessed (i.e., searched) by many combinations of support information. The CPU time required to process the positional data is considerably less than that for the matrix data. The feasibility of making the data base more easily accessible and user friendly is greatly increased with positionalized data storage.
Four data elements are critical for the accurate identification of a water sample from a given well. These are the county number, municipality number, location to the section, and well number. Well depth is desirable though not critical if all other data elements are correct. Also, since well depth is one of the less reliable elements in the data base, it should not be depended upon for identification any more than is absolutely necessary. After the data were positionalized, they were checked to ensure that a value appeared in each of the support fields. In addition, each entry had to have a laboratory number, and month and year of analysis. Duplicate entries were also removed from the data base at this time. There were about 3 to 5 percent duplicates in the original raw data base.
The positionalized data were reviewed to determine how many samples survived the first screen for missing values in the critical support fields.
The screened data were counted to determine how many samples were on record for each county and how many analytical values were contained in the data. These efforts provided information on the distribution of ground-water quality data for all PWS wells, spatially and temporarily.
Problems with Structure and Maintenance of the Ground Hater Quality Data Base
The total number of values in the base 3till does not necessarily reflect the value of the data. For example, zeroes were often entered for analyzed values. In some cases the value reported should have been the
-43-
detection limit of the analysis method used. The detection limits are no longer known for most of these values. It is not clear why the detection limits were not entered in these cases. Entry of a negative number is the most appropriate method to represent a concentration below detection limit for a parameter. A negative value indicates that for this sample on this date the value noted was the detection limit. This approach allows the data user to decide whether to use the detection limit value, half the value, not to use it, or any other option.
Some zero values were entered because the analysis report actually indicated a zero value. Other zeroes were entered to indicate that no value was reported. These inconsistencies make use of zero values very speculative.
For the 21,055 samples that passed the first screening, there were 423,359 parameter values including 113,297 zeroes. That suggests that 26.7 percent of the parameter values are of questionable utility. Although it is possible to indicate a detection limit value in a specified comment field, no comments were included for 82,608 of the zero values. Reasons for their inclusion in the data are purely speculative.
Other problems in the data base arise from a lack of coordination among the agencies involved. The IEPA laboratories recycle their assigned laboratory numbers every few years. Therefore, a search of the data base by lab number must be accompanied by the sample date. Municipalities and companies which acquire wells once owned by other parties frequently renumber them to fit into their own well numbering sequence.
If such changes are reported to the ISWS, the changes are made to the information used in the automated data entry programs for the data base. There are two problems with this procedure. If the reported change in information is a true change, the support file is modified but no record of the old information is retained. If the change is simply a correction of an error, the change is made only to the data entered to the base from that date forward and not retroactively. As a result, the old data will be in conflict with the support information. Since retroactive changes are not made and no record of the change maintained, 3ome data may be overlooked during retrieval. If a 3earch is conducted based on the current support information, only the newest data will be retrieved. If a retrieval is done for all wells in a specified area, the data retrieved may not be clearly attributable to a specific well.
To avoid these serious problems, a record of changes in the support information associated with a well must be kept. This record 3hould contain the municipality number, the county of the owner, the county of location (these may not always be the same), the assigned well number, and the depth of the well, as well as the specific location. If any of these pieces of information is changed, a record should be entered into the file to reflect the change and the effective date. If a change in support information is a correction of an error, the change in the support information must be accompanied by a change in the affected data already in the base. A change should NEVER be made that is not verified, documented, and made universally.
-44-
Well depth is another element of the sample support Information which should be carefully tracked. It is both a valuable piece of information and a source of frequent confusion. Reported depth helps to identify a well, but more importantly, it helps to determine the geologic formations that the well penetrates and those that yield water to the well. The depth of a well may be changed if the well is redrilled to a greater depth or filled to a shallower depth. These changes should be made to the support information file with a new record and effective dates. However, the reported depths accompanying a sample or chemical analysis report are not always accurate. Sometimes the depth to water or the depth at which the pump is set is erroneously reported as the actual depth of the well. Often the reported depth is merely a rough approximation. Upon receipt by the ISWS, the depth is checked against the current data in the support information file. To minimize confusion resulting from the above data handling problems, data verification and conflict resolution procedures must be established. Only the data base manager should be authorized to make changes to the base. Visits to other states confirmed that well defined and well documented procedures for data handling are essential to the effective use of monitoring information.
Following the selection of PWS wells to be included in the monitoring network (described in a later section of this report), the historical groundwater quality data which could be attributed to these wells with confidence on the basis of complete and accurate support information were retrieved from the data base and used to create a reconditioned data base subset. These data comprise about 25 percent of the data collected for all PWS wells and represent the best data available for- application to statewide monitoring objectives.
The growth of data for network wells over time is illustrated in figure 11. The reliability of the data for the network wells is generally greater than that from all PWS wells as a whole. However, data are sparse for early time periods. This may make trend analysis difficult. Only 14 percent of the ground-water samples and 9 percent of the historical parameter determinations were collected prior to 1960, while 76 percent of the samples and 86 percent of the parameters were added since 1970.
Nevertheless, the nearly 5,000 samples and more than 100,000 analytical determinations contained in this network well data base should prove to be extremely useful for indicating changes in the concentrations of some inorganic parameters over time. These data are expected to have their greatest value in the assessment of apparent water-quality problems for individual network wells as opposed to large areas or whole aquifers.
Monitoring Strategy
The monitoring strategy developed in this study results in concentrating the monitoring efforts where perceived needs are the greatest while minimizing the collection of data until a specific need has been demonstrated. The monitoring plan consists of three interdependent levels of monitoring activity, each intended to satisfy different objectives. The deletion, substantial alteration or neglect of any one of the three monitoring activities would result in a ground-water monitoring program which is seriously flawed,
-45-
would reduce the value of the information derived from the network, and would invalidate the rationale upon which the monitoring strategy is based.
Level one monitoring refers to a continuation of the fixed-station monitoring program currently conducted by the IEPA under the SDWA. Under this program, raw (untreated) water samples are collected at various times from active PWS wells at an average rate of once every three and one half years. The approximately 960 primary network wells will be sampled at this level. These samples are analyzed for the parameters for which mandatory and recommended standards have been set, including the major cations and anions, plus selected trace metals which are easily determined using the ICAP analyzer (see table 5). In addition to these parameters, level one monitor-* ing calls for the determination of VOC and NVOC, two general indicators of organic contamination. Separate determination of each of these organic carbon fractions is preferable to an overall measurement of TOC. This will indicate the presence of organic contaminants, if any, in the sample. Level one sampling may be conducted for each network well at different times of the year and at varying intervals without reducing the value of the data.
Level two monitoring refers to "intensive surveys" in which measurements are made in a large number of wells over a relatively short period of time. This monitoring activity involves only high and medium priority network wells located within the principal aquifers. These measurements are intended to characterize ground-water quality in the principal aquifers at the same time of the year and at equally spaced time intervals. The proposed frequencies of intensive surveys are based upon relative rates of ground-water movement and rates of change in ground-water quality conditions which can be expected for each basic aquifer type. Intensive surveys are to be conducted: at two year intervals for the highly fractured carbonate shallow bedrock wells; at three year intervals for principal sand and gravel aquifers; and at five year intervals for the deep bedrock aquifer system.
Parameters to be determined in level two monitoring include the parameters in table 5, and more detailed analyses for organic contaminants. Each sample in level two will be scanned for the EPA "priority pollutants." Table 6 is a list of the priority pollutants (Federal Register, 1979). Any priority pollutants detected at excessive levels in the medium priority network wells will be quantified by GC/MS. Priority pollutants found in samples from the high priority wells in any detectable amounts will be quantified. These procedures will establish base-line levels of these contaminants in the principal aquifers of the 3tate for future determination of significant changes in water quality.
Level three monitoring refers to "special studies." These are investigations of apparent problems indicated from the interpreted results of the data collected in monitoring levels one and two. Special studies are studies of short duration and narrowly defined purpose and scope conducted to assess the magnitude and causes of specific ground-water problems at a level of detail greater than that possible with the regional scale approach represented by monitoring levels one and two. This level of monitoring is designed to provide critical details needed to define and solve specific ground-water problems. Special studies may involve wells from any or all three levels of monitoring priority.
-46-
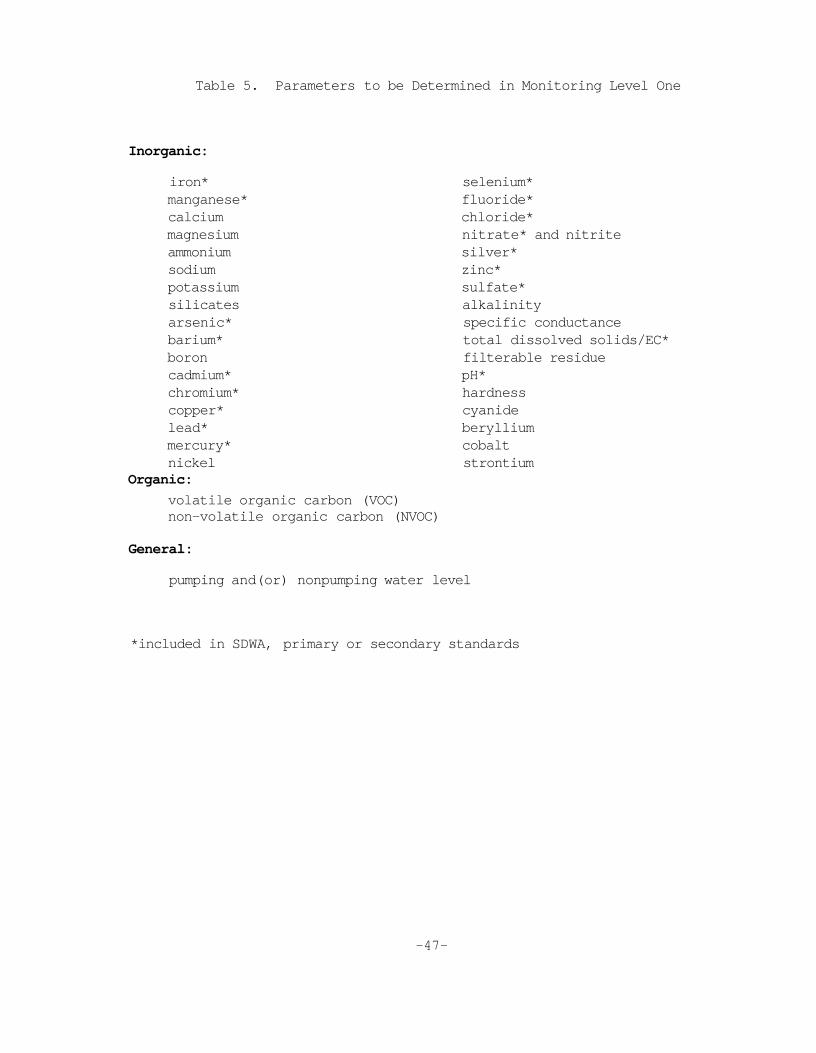
Table 5. Parameters to be Determined in Monitoring Level One
Inorganic:
iron* selenium* manganese* fluoride* calcium chloride* magnesium nitrate* and nitrite ammonium silver* sodium zinc* potassium sulfate* silicates alkalinity arsenic* specific conductance barium* total dissolved solids/EC* boron filterable residue cadmium* pH* chromium* hardness copper* cyanide lead* beryllium mercury* cobalt nickel strontium
Organic: volatile organic carbon (VOC) non-volatile organic carbon (NVOC)
General:
pumping and(or) nonpumping water level
*included in SDWA, primary or secondary standards
-47-
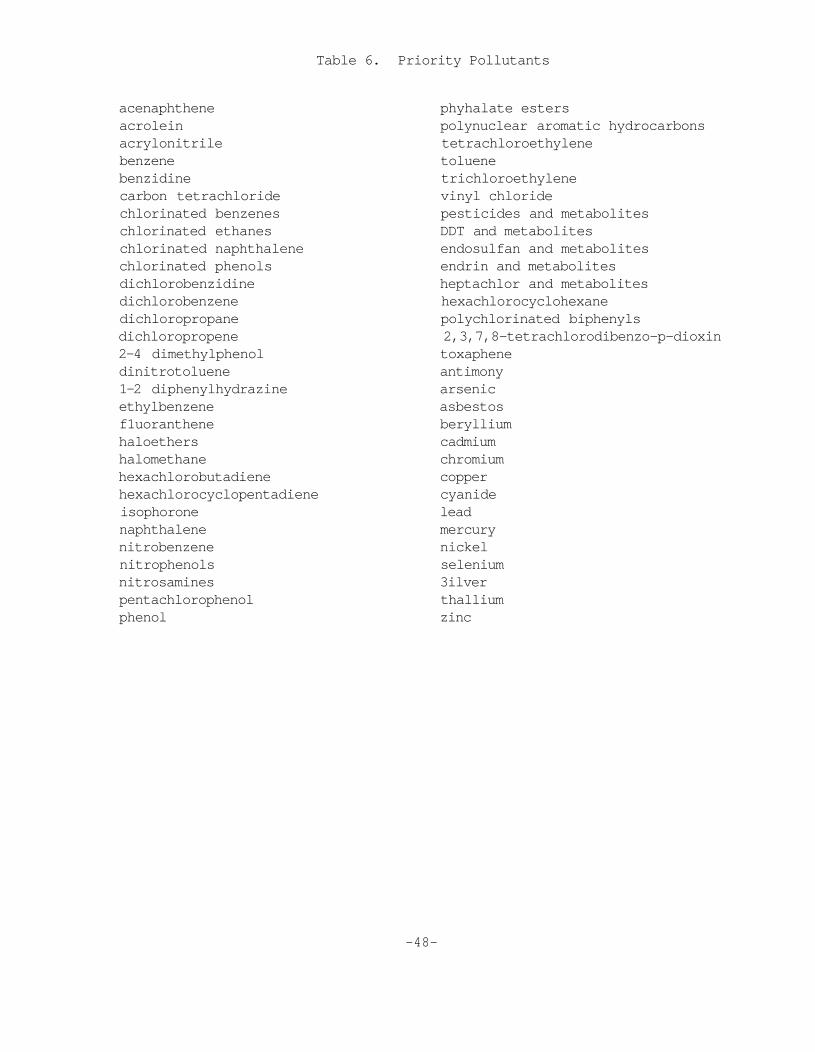
Table 6. Priority Pollutants
acenaphthene phyhalate esters acrolein polynuclear aromatic hydrocarbons acrylonitrile tetrachloroethylene benzene toluene benzidine trichloroethylene carbon tetrachloride vinyl chloride chlorinated benzenes pesticides and metabolites chlorinated ethanes DDT and metabolites chlorinated naphthalene endosulfan and metabolites chlorinated phenols endrin and metabolites dichlorobenzidine heptachlor and metabolites dichlorobenzene hexachlorocyclohexane dichloropropane polychlorinated biphenyls dichloropropene 2,3,7,8-tetrachlorodibenzo-p-dioxin 2-4 dimethylphenol toxaphene dinitrotoluene antimony 1-2 diphenylhydrazine arsenic ethylbenzene asbestos f1uoranthene beryllium haloethers cadmium halomethane chromium hexachlorobutadiene copper hexachlorocyclopentadiene cyanide isophorone lead naphthalene mercury nitrobenzene nickel nitrophenols selenium nitrosamines 3ilver pentachlorophenol thallium phenol zinc
-48-
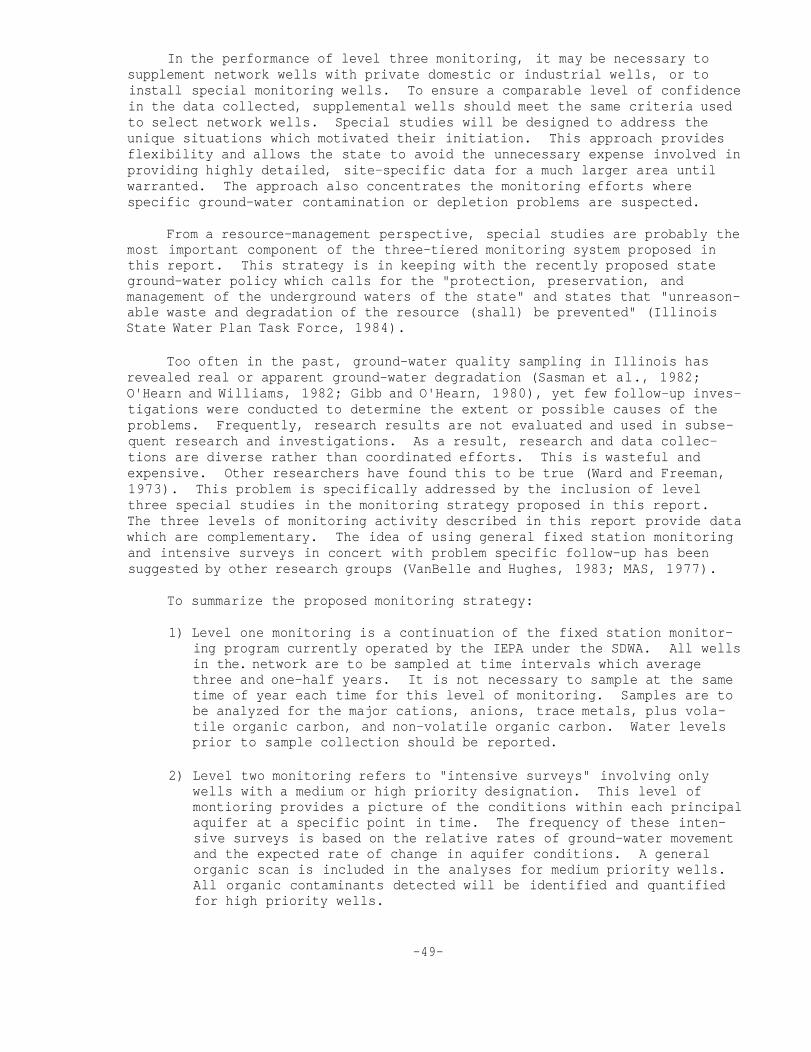
In the performance of level three monitoring, it may be necessary to supplement network wells with private domestic or industrial wells, or to install special monitoring wells. To ensure a comparable level of confidence in the data collected, supplemental wells should meet the same criteria used to select network wells. Special studies will be designed to address the unique situations which motivated their initiation. This approach provides flexibility and allows the state to avoid the unnecessary expense involved in providing highly detailed, site-specific data for a much larger area until warranted. The approach also concentrates the monitoring efforts where specific ground-water contamination or depletion problems are suspected.
From a resource-management perspective, special studies are probably the most important component of the three-tiered monitoring system proposed in this report. This strategy is in keeping with the recently proposed state ground-water policy which calls for the "protection, preservation, and management of the underground waters of the state" and states that "unreasonable waste and degradation of the resource (shall) be prevented" (Illinois State Water Plan Task Force, 1984).
Too often in the past, ground-water quality sampling in Illinois has revealed real or apparent ground-water degradation (Sasman et al., 1982; O'Hearn and Williams, 1982; Gibb and O'Hearn, 1980), yet few follow-up investigations were conducted to determine the extent or possible causes of the problems. Frequently, research results are not evaluated and used in subsequent research and investigations. As a result, research and data collections are diverse rather than coordinated efforts. This is wasteful and expensive. Other researchers have found this to be true (Ward and Freeman, 1973). This problem is specifically addressed by the inclusion of level three special studies in the monitoring strategy proposed in this report. The three levels of monitoring activity described in this report provide data which are complementary. The idea of using general fixed station monitoring and intensive surveys in concert with problem specific follow-up has been suggested by other research groups (VanBelle and Hughes, 1983; MAS, 1977).
To summarize the proposed monitoring strategy:
1) Level one monitoring is a continuation of the fixed station monitoring program currently operated by the IEPA under the SDWA. All wells in the. network are to be sampled at time intervals which average three and one-half years. It is not necessary to sample at the same time of year each time for this level of monitoring. Samples are to be analyzed for the major cations, anions, trace metals, plus volatile organic carbon, and non-volatile organic carbon. Water levels prior to sample collection should be reported.
2) Level two monitoring refers to "intensive surveys" involving only wells with a medium or high priority designation. This level of montioring provides a picture of the conditions within each principal aquifer at a specific point in time. The frequency of these intensive surveys is based on the relative rates of ground-water movement and the expected rate of change in aquifer conditions. A general organic scan is included in the analyses for medium priority wells. All organic contaminants detected will be identified and quantified for high priority wells.
-49-
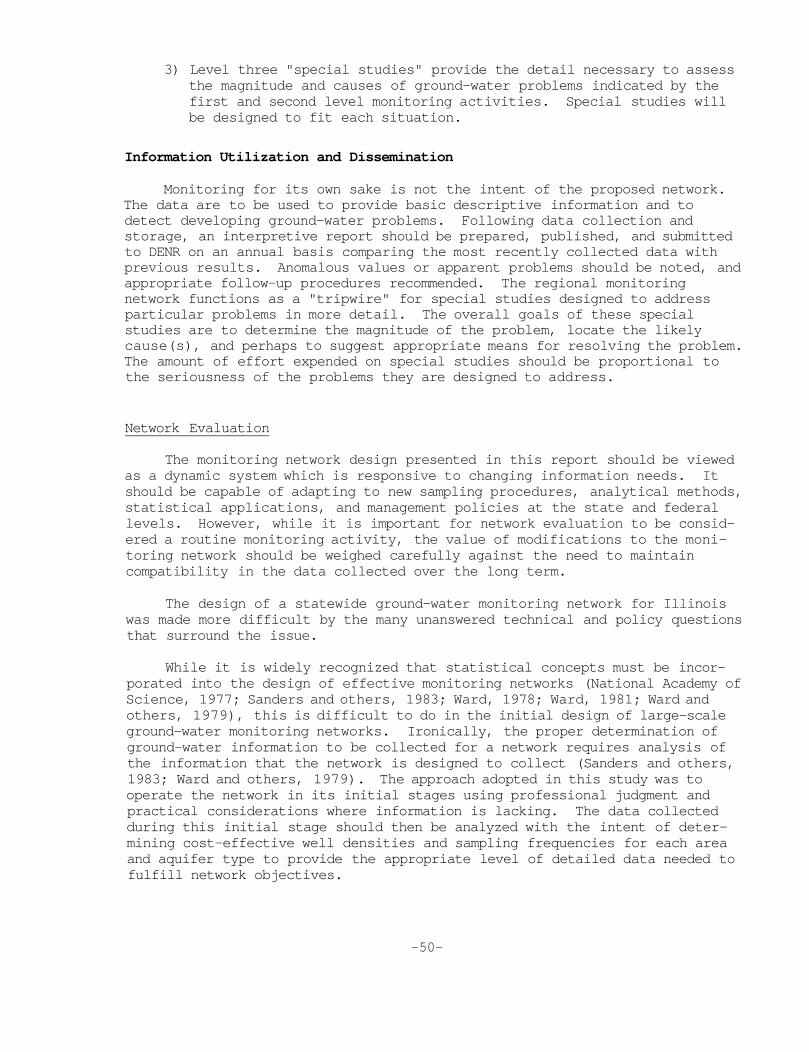
3) Level three "special studies" provide the detail necessary to assess the magnitude and causes of ground-water problems indicated by the first and second level monitoring activities. Special studies will be designed to fit each situation.
Information Utilization and Dissemination
Monitoring for its own sake is not the intent of the proposed network. The data are to be used to provide basic descriptive information and to detect developing ground-water problems. Following data collection and storage, an interpretive report should be prepared, published, and submitted to DENR on an annual basis comparing the most recently collected data with previous results. Anomalous values or apparent problems should be noted, and appropriate follow-up procedures recommended. The regional monitoring network functions as a "tripwire" for special studies designed to address particular problems in more detail. The overall goals of these special studies are to determine the magnitude of the problem, locate the likely cause(s), and perhaps to suggest appropriate means for resolving the problem. The amount of effort expended on special studies should be proportional to the seriousness of the problems they are designed to address.
Network Evaluation
The monitoring network design presented in this report should be viewed as a dynamic system which is responsive to changing information needs. It should be capable of adapting to new sampling procedures, analytical methods, statistical applications, and management policies at the state and federal levels. However, while it is important for network evaluation to be considered a routine monitoring activity, the value of modifications to the monitoring network should be weighed carefully against the need to maintain compatibility in the data collected over the long term.
The design of a statewide ground-water monitoring network for Illinois was made more difficult by the many unanswered technical and policy questions that surround the issue.
While it is widely recognized that statistical concepts must be incorporated into the design of effective monitoring networks (National Academy of Science, 1977; Sanders and others, 1983; Ward, 1978; Ward, 1981; Ward and others, 1979), this is difficult to do in the initial design of large-scale ground-water monitoring networks. Ironically, the proper determination of ground-water information to be collected for a network requires analysis of the information that the network is designed to collect (Sanders and others, 1983; Ward and others, 1979). The approach adopted in this study was to operate the network in its initial stages using professional judgment and practical considerations where information is lacking. The data collected during this initial stage should then be analyzed with the intent of determining cost-effective well densities and sampling frequencies for each area and aquifer type to provide the appropriate level of detailed data needed to fulfill network objectives.
-50-
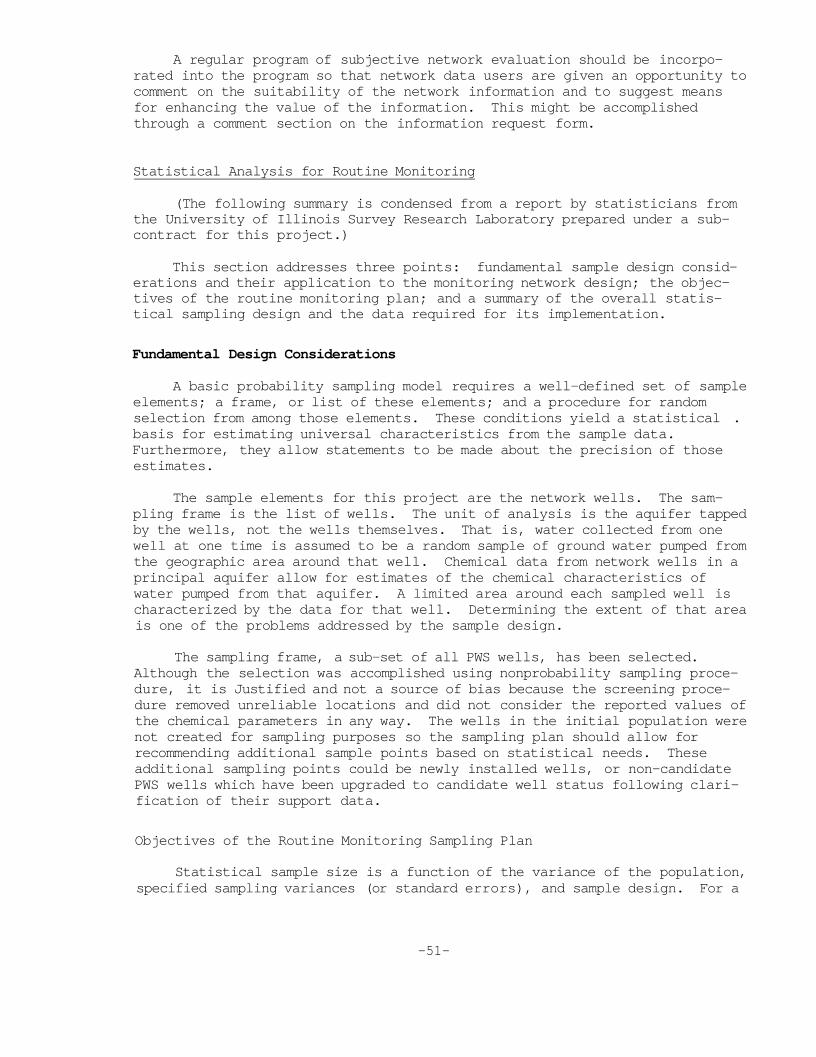
A regular program of subjective network evaluation should be incorporated into the program so that network data users are given an opportunity to comment on the suitability of the network information and to suggest means for enhancing the value of the information. This might be accomplished through a comment section on the information request form.
Statistical Analysis for Routine Monitoring
(The following summary is condensed from a report by statisticians from the University of Illinois Survey Research Laboratory prepared under a subcontract for this project.)
This section addresses three points: fundamental sample design considerations and their application to the monitoring network design; the objectives of the routine monitoring plan; and a summary of the overall statistical sampling design and the data required for its implementation.
Fundamental Design Considerations
A basic probability sampling model requires a well-defined set of sample elements; a frame, or list of these elements; and a procedure for random selection from among those elements. These conditions yield a statistical . basis for estimating universal characteristics from the sample data. Furthermore, they allow statements to be made about the precision of those estimates.
The sample elements for this project are the network wells. The sampling frame is the list of wells. The unit of analysis is the aquifer tapped by the wells, not the wells themselves. That is, water collected from one well at one time is assumed to be a random sample of ground water pumped from the geographic area around that well. Chemical data from network wells in a principal aquifer allow for estimates of the chemical characteristics of water pumped from that aquifer. A limited area around each sampled well is characterized by the data for that well. Determining the extent of that area is one of the problems addressed by the sample design.
The sampling frame, a sub-set of all PWS wells, has been selected. Although the selection was accomplished using nonprobability sampling procedure, it is Justified and not a source of bias because the screening procedure removed unreliable locations and did not consider the reported values of the chemical parameters in any way. The wells in the initial population were not created for sampling purposes so the sampling plan should allow for recommending additional sample points based on statistical needs. These additional sampling points could be newly installed wells, or non-candidate PWS wells which have been upgraded to candidate well status following clarification of their support data.
Objectives of the Routine Monitoring Sampling Plan
Statistical sample size is a function of the variance of the population, specified sampling variances (or standard errors), and sample design. For a
-51-
monitoring network, sample size is the product of the number of wells and the frequency with which water samples are collected for chemical analysis.
The sample design for routine ground-water monitoring must provide both base line data and detection of significant, long term changes in chemical composition over time for the specified aquifer. The sample size is determined by the more demanding of these two objectives, detecting changes over time. Measurements of error and real, random, or cyclical (e.g., seasonal) fluctuations must be considered as well as the ground-water flow rate of the aquifer and the time necessary for a significant, long term quality or quantity change to become measurable. The sample size estimate should also consider whether the well is located in a low or high risk area and whether such factors as land use are changing rapidly.
In the suggested sampling plan, wells are stratified into two general groupings for the baseline survey: 1) three major geographic regions, and 2)- the four aquifer types: the shallow sand and gravel, the deep sand and gravel, the shallow bedrock, and the deep bedrock. The three regions are the highly susceptible principal aquifers, the less susceptible principal aquifers, and the minor aquifers. These are partitioned into an initial grid with candidate wells labelled to link each to its aquifer. The initial grid provides cells of equal size. Using cluster analysis to examine the chemical parameter values for wells in contiguous cells, some cells can be combined within an aquifer. This serves to both set up a more statistically useful grid for sampling and to minimize the number of wells to be sampled, since one well should be representative of those within the cell.
Candidate wells which cluster on the basis of the criterion variables (for example, total dissolved solids and/or chloride) should also cluster with respect to spatial location. This is desirable for two reasons: a spatial clustering of wells is more cost efficient; and, since most geographic variables demonstrate spatial patterns, a lack of spatial autocorrelation might signify discrepancies or errors in the data. If spatial autocorrelation exists, the space variable can be used as a "backup" criterion for instances when classification techniques yield ambiguous results. Therefore, two techniques, spatial autocorrelation and cluster analysis, will be used to confirm that wells grouped together are correlative, to adjust 3ample groups and to determine when trends are developing.
After collection of monitoring data, a cluster analysis of total dissolved solids (TDS) and other specific contaminants should be used to evaluate the chosen wells. Cluster analysis is used here to confirm that wells have been placed into groups consistent with the data, such that wells in a given cluster tend to be similar to each other, and wells in different clusters tend to be dissimilar. The procedure permits selection of a well from a cluster, with confidence that it is representative of the other wells in the cluster.
The clustering algorithm recommended for use is the least complex method, based upon euclidean distance. The algorithm is part of the Statistical Analysis System (SAS) package. Cluster analysis can accommodate any number of variables. Basically, the procedure places all cases on a horizontal line representing the scale of the criterion variable. When more than one criterion variable is used, values are normally standardized. Weighting
-52-
schemes can be implemented to reflect the importance of criterion variables. Cluster analysis then searches for the two closest values and combines them to form a cluster. This procedure is repeated until the desired number of clusters is obtained. This number is usually determined by the sample size needed. Summary statistics are printed at each clustering stage. This enables one to monitor changes in cluster variance, so that a desired "tightness" of clusters can be maintained.
When wells in a cluster represent a primary well and its alternates, rotation of samples among the wells in a cluster would afford continuous rechecking of the accuracy of the classification at no added cost. The data needed to implement sample design are:
1) Identification of principal aquifers 2) Identification of minor aquifers 3) Identification of susceptible areas and their degree of
susceptibility 4) Number and location of all candidate wells 5) Required precision of estimates for differences between two measures 6) Critical analytical variable measurements for each candidate well Statistical analysis of the data should be performed routinely not only
to characterize the data but to refine the network's configuration for increased effectiveness and efficiency. Minimally, analyses should determine significant temporal and spatial differences between data sets and attempt to identify trends in time and space (Hampton, 1976; Lachance and Bobee, 1982; LeGrand, 1968; The National Academy of Science, 1977). Graphical presentations of the data are preferrable to tabulations of raw data, an approach adopted by other data-reporting agencies with great success (Pierce and Barber, 1983; Bowley and Roy, 1983).
Raw data from the monitoring network should be made available to interested users at cost. The documentation which accompanies the data should be sufficient to allow data users to confidently manipulate the results to meet their needs. Direct access to the data base by users should be avoided with the exception of a small number of data management personnel. Written requests for data should be made to the Program Manager and filled as quickly as possible (Texas, 1972).
-53-
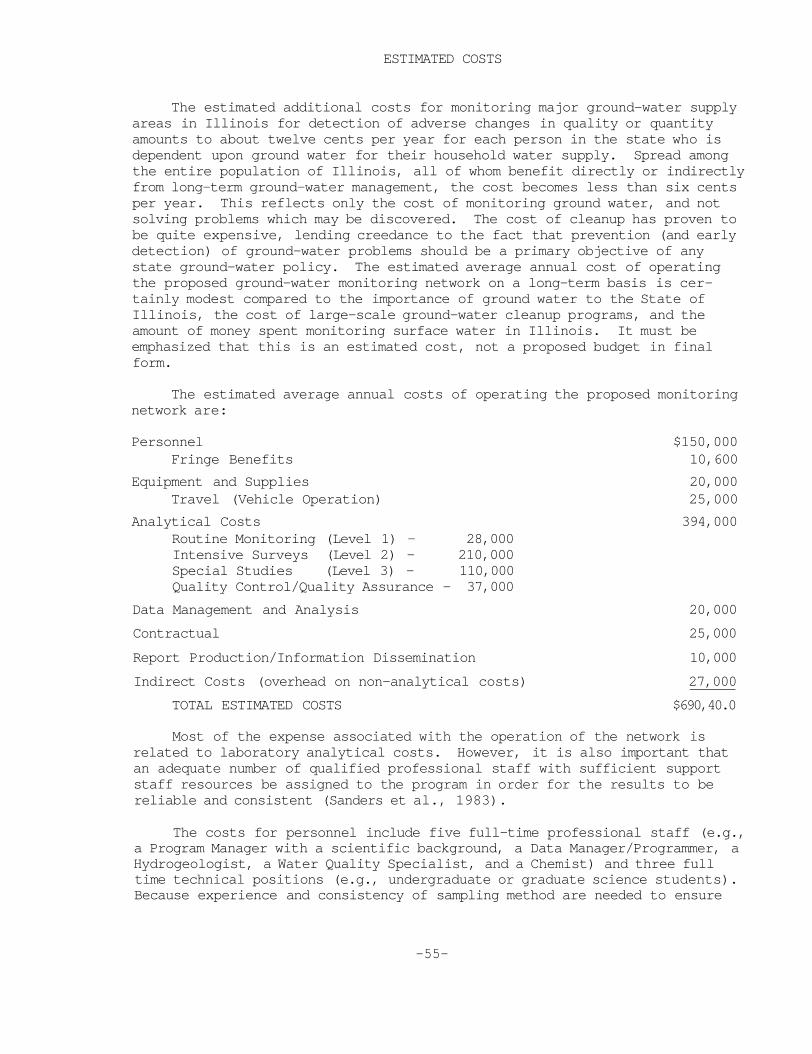
ESTIMATED COSTS
The estimated additional costs for monitoring major ground-water supply areas in Illinois for detection of adverse changes in quality or quantity amounts to about twelve cents per year for each person in the state who is dependent upon ground water for their household water supply. Spread among the entire population of Illinois, all of whom benefit directly or indirectly from long-term ground-water management, the cost becomes less than six cents per year. This reflects only the cost of monitoring ground water, and not solving problems which may be discovered. The cost of cleanup has proven to be quite expensive, lending creedance to the fact that prevention (and early detection) of ground-water problems should be a primary objective of any state ground-water policy. The estimated average annual cost of operating the proposed ground-water monitoring network on a long-term basis is certainly modest compared to the importance of ground water to the State of Illinois, the cost of large-scale ground-water cleanup programs, and the amount of money spent monitoring surface water in Illinois. It must be emphasized that this is an estimated cost, not a proposed budget in final form.
The estimated average annual costs of operating the proposed monitoring network are:
Personnel $150,000 Fringe Benefits 10,600
Equipment and Supplies 20,000 Travel (Vehicle Operation) 25,000
Analytical Costs 394,000 Routine Monitoring (Level 1) - 28,000 Intensive Surveys (Level 2) - 210,000 Special Studies (Level 3) - 110,000 Quality Control/Quality Assurance - 37,000
Data Management and Analysis 20,000 Contractual 25,000 Report Production/Information Dissemination 10,000 Indirect Costs (overhead on non-analytical costs) 27,000
TOTAL ESTIMATED COSTS $690,40.0
Most of the expense associated with the operation of the network is related to laboratory analytical costs. However, it is also important that an adequate number of qualified professional staff with sufficient support staff resources be assigned to the program in order for the results to be reliable and consistent (Sanders et al., 1983).
The costs for personnel include five full-time professional staff (e.g., a Program Manager with a scientific background, a Data Manager/Programmer, a Hydrogeologist, a Water Quality Specialist, and a Chemist) and three full time technical positions (e.g., undergraduate or graduate science students). Because experience and consistency of sampling method are needed to ensure
-55-
the collection of representative samples, it is envisioned that workers would divide into three teams with two employees each during the performance of the intensive surveys. Pairing a full-time permanent professional with a technician would assure the needed expertise and consistency. It is estimated that each team could collect and deliver water samples from two PWS wells per day.
At an average of two samples per team per day, the intensive-survey samples could be collected in an average of about 12 weeks. This short time span is a highly desirable feature of the monitoring strategy because long delays in the execution of the intensive surveys may allow significant time related changes in ground-water conditions to distort the results. In addition, the short time span of the intensive surveys helps to dampen the effects of seasonal water-quality variations because samples will always be collected in the same season. It is not necessary for routine monitoring (level 1) sampling to always be done at the same time of year. In fact, it is desirable for these samples to be collected at many times of the year to provide information on the probable magnitude of seasonal fluctuations in the data.
The inclusion of the two organic-contamination indicators, VOC and NVOC, to the parameters determined by the existing routine PUS sampling program will add about $100 per sample or about $27,000 per year for level one sampling. The suggested sampling frequencies for the various aquifer types combined with the number of high- and medium-priority wells of each type results in an average of 230 intensive-survey samples per year. The total estimated cost includes $210,000 for the analysis of the samples collected during intensive surveys from high- and medium-priority network wells. An average (high-volume discounted) cost of $800 per sample analysis has been allocated for the screening and (if necessary) the quantification of priority pollutants.
Because level-three special studies are designed to address specific ground-water problems yet to be discovered by routine monitoring (level one) or intensive surveys (level two), it is not possible to accurately determine the additional costs to the monitoring program as a result of these activities. A 50 percent increase in the sampling budget has been included in the estimated analytical costs to account for these activities. It is reasonable to assume that a greater number of special studies will be required in the first several years of network operation and that these requirements will gradually taper off as the existing problems are discovered and addressed. Ten percent has been added to the total estimated analytical costs to provide for the analysis of blank, spiked, and duplicate samples as a regular feature of the sampling protocol.
It is important to the effectiveness of the monitoring program that the analysis of water samples take place soon after their collection and that analytical results be made available in a timely manner (NAS, 1977). At the present time, and for the foreseeable future, state-owned laboratories are operating at full capacity with respect to the analysis of organic contaminants. Rather than compromising the value of the sampling program by adding to the work load of the already overburdened state labs, the cost estimates presented here are based upon the use of commercial laboratory facilities for the analysis of intensive-survey and special-study samples for the priority pollutants. It is essential that stringent quality control/quality assurance
-56-
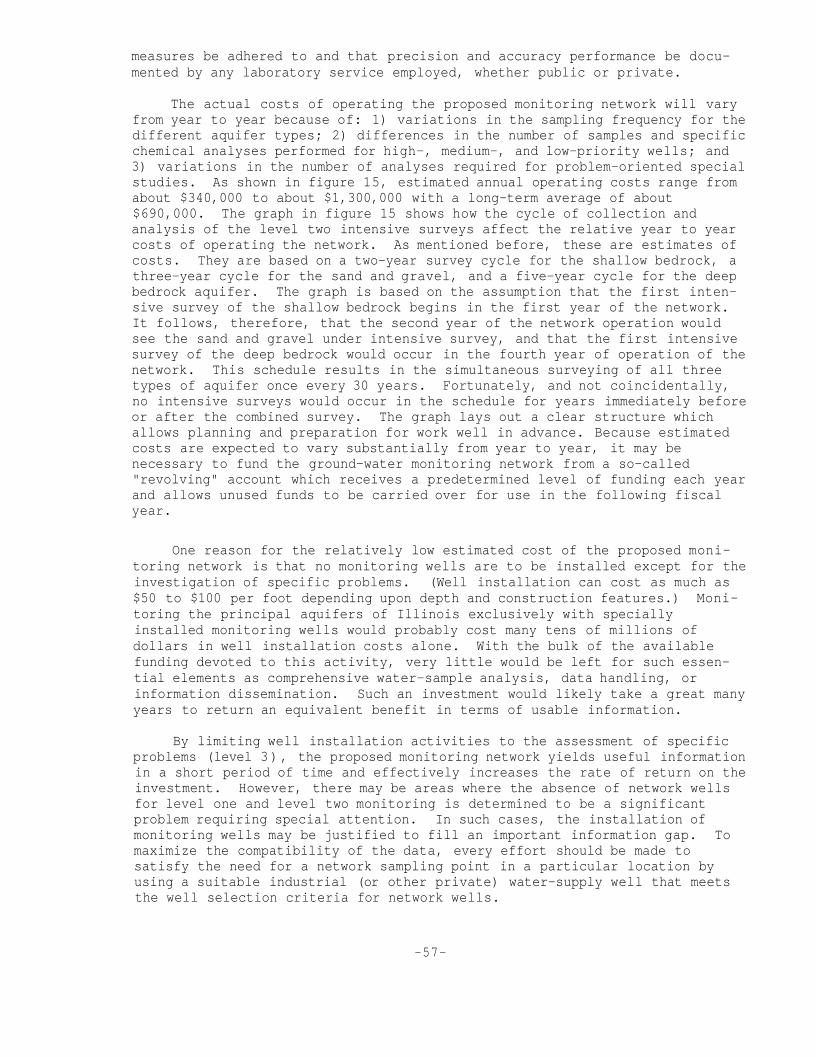
measures be adhered to and that precision and accuracy performance be documented by any laboratory service employed, whether public or private.
The actual costs of operating the proposed monitoring network will vary from year to year because of: 1) variations in the sampling frequency for the different aquifer types; 2) differences in the number of samples and specific chemical analyses performed for high-, medium-, and low-priority wells; and 3) variations in the number of analyses required for problem-oriented special studies. As shown in figure 15, estimated annual operating costs range from about $340,000 to about $1,300,000 with a long-term average of about $690,000. The graph in figure 15 shows how the cycle of collection and analysis of the level two intensive surveys affect the relative year to year costs of operating the network. As mentioned before, these are estimates of costs. They are based on a two-year survey cycle for the shallow bedrock, a three-year cycle for the sand and gravel, and a five-year cycle for the deep bedrock aquifer. The graph is based on the assumption that the first intensive survey of the shallow bedrock begins in the first year of the network. It follows, therefore, that the second year of the network operation would see the sand and gravel under intensive survey, and that the first intensive survey of the deep bedrock would occur in the fourth year of operation of the network. This schedule results in the simultaneous surveying of all three types of aquifer once every 30 years. Fortunately, and not coincidentally, no intensive surveys would occur in the schedule for years immediately before or after the combined survey. The graph lays out a clear structure which allows planning and preparation for work well in advance. Because estimated costs are expected to vary substantially from year to year, it may be necessary to fund the ground-water monitoring network from a so-called "revolving" account which receives a predetermined level of funding each year and allows unused funds to be carried over for use in the following fiscal year.
One reason for the relatively low estimated cost of the proposed monitoring network is that no monitoring wells are to be installed except for the investigation of specific problems. (Well installation can cost as much as $50 to $100 per foot depending upon depth and construction features.) Monitoring the principal aquifers of Illinois exclusively with specially installed monitoring wells would probably cost many tens of millions of dollars in well installation costs alone. With the bulk of the available funding devoted to this activity, very little would be left for such essential elements as comprehensive water-sample analysis, data handling, or information dissemination. Such an investment would likely take a great many years to return an equivalent benefit in terms of usable information.
By limiting well installation activities to the assessment of specific problems (level 3), the proposed monitoring network yields useful information in a short period of time and effectively increases the rate of return on the investment. However, there may be areas where the absence of network wells for level one and level two monitoring is determined to be a significant problem requiring special attention. In such cases, the installation of monitoring wells may be justified to fill an important information gap. To maximize the compatibility of the data, every effort should be made to satisfy the need for a network sampling point in a particular location by using a suitable industrial (or other private) water-supply well that meets the well selection criteria for network wells.
-57-
Figure 15. Estimated coat of monitoring network operation for 30 years
-58-

Although the special studies of level three of the proposed program are a major factor in estimating the total cost, it is not possible to accurately predict the costs associated with this part of the program. The reason is that many or few studies may be indicated, and the costs therefore would fluctuate accordingly. As the program is carried on, experience may help to predict the costs involved with level three.
-59-
CONCLUSIONS
Principal aquifers in Illinois identified in this study underlie about 58 percent of the state's land area, an area larger than twelve of the northeastern states. Relatively shallow principal aquifers, which are generally more likely to show the first effects of contamination, underlie about 33 percent of the state with about half of this area being directly susceptible to contamination by waste disposal and other activities at or near the land surface.
Because of the large land area requiring monitoring in the State of Illinois, priorities must be set concerning the degree of monitoring which is necessary and that can be reasonably funded. The state must concentrate its ground-water monitoring efforts and funds in areas 1) where the probability of contamination is greatest (i.e., shallow aquifers in areas highly susceptible to contamination located near major urban/industrial centers); 2) where the potential consequences of contamination appear to be the most serious (i.e., in the major current or future ground-water supply areas); and 3) where a known or suspected ground-water contamination or depletion problem exists.
While a great deal of attention has been paid to the proper management of the deep bedrock aquifers in the northeastern part of the state, most ground water in Illinois is derived from relatively shallow aquifers which are much more susceptible to contamination. About 47 percent of all PWS wells in the state tap sand and gravel aquifers, and about 48 percent of the ground water withdrawn for all purposes is derived from these deposits (Kirk et al., 1982).
Ground-water monitoring efforts should emphasize the state's shallow aquifers because 1) shallow aquifers are likely to be first to show the effects of contamination by human activities, 2) these aquifers eventually recharge deeper aquifers in most areas of the state (especially where deeper aquifers are heavily developed for water supply), and 3) shallow aquifers contribute potentially large amounts of water to Illinois lakes and streams. Shallow aquifers generally require more intensive monitoring because their hydrogeologic characteristics cause their water quality to be more variable, spatially and temporally, than that of deeper aquifers. Thus a larger number of monitoring wells i3 necessary to obtain adequate information.
Ground water in the major aquifers of Illinois can be adequately monitored with existing water wells if the strategy presented within the report is adopted. This strategy combines the best elements of "routine" fixed-station sampling at random intervals with "intensive surveys" at equally spaced time intervals to detect existing and developing ground-water problem areas. Rather than attempting to provide the 3ame level of detail for all aquifers and areas in the state, the strategy introduces a third component referred to herein as "special studies." These are short-term smaller-scale investigations designed to address specific problems detected from the analysis of data from routine monitoring and(or) intensive surveys. It is at this third level of monitoring that the need for detail can be efficiently and effectively addressed. Special studies may range from simply resampling one well to confirm an anomalous result to a full-scale investigation of a
-61-
regional ground-water problem. This approach permits the most efficient operation of the monitoring network by focusing the greatest effort in areas of suspected problems and avoiding the collection of needlessly detailed (and expensive) data in areas where no problems are indicated from the other two levels of monitoring.
Illinois is fortunate to have a great deal of hydrogeologic information available for application to environmental management and research. Some information, such as geologic conditions across the state, can be readily applied. However, some potentially valuable information is in a form that limits its utility. In certain instances, this is the result of the data having been collected for different purposes and its resulting inadequacy to satisfy today's need for comprehensive, reliable Information. In other cases, the information required is available but is not computerized which effectively eliminates the possibility of large-scale manipulation and application to problems. For example, no computer file currently exists which contains the locations of all of the water wells in the state.
Of about 4300 active and inactive PWS wells on record at the ISWS, about 1300 may provide reliable information about the ground-water resources of the state. About 26 percent of these wells are designated as alternate choices because they are located in close proximity to one of the primary network wells that tap the same aquifer. Priorities for monitoring are assigned to all network wells based upon their locations with respect to principal aquifers and their relative susceptibility to contamination. Most information is to be collected from 204 high-prlority wells which are located in highly susceptible areas of major aquifers. The 427 medium-priority wells, which are within major water-supply aquifers but less susceptible to contamination, will be monitored to a slightly lower level of detail. The only change from current monitoring practices recommended for 331 low-priority wells, which are located outside the principal aquifers of the state, is the addition of two gross indicators of organic contamination to the list of water-quality parameters to be determined in the laboratory.
Of over 420,000 analytical determinations for over 21,000 PWS well-water samples on file at the ISWS, about 100,000 determinations for about 5,000 PWS well samples were chosen for use in the monitoring program. These selected data for network wells met stringent data-screening and well-selection criteria chosen to ensure the reliability of the historical information. These data are intended to provide an estimate of baseline ground-water characteristics for comparison with future measurements to detect significant changes.
If the organic contaminant scans become part of a routine analysis performed on PWS wells, there will be some baseline data for future research.
-62-
RECOMMENDATIONS
1. A clear and comprehensive ground-water management policy and plan must be developed at the state level. Detection of existing problems and prevention of further degradation should be among the basic goals of such a ground-water management plan. While progress is being made in this endeavor, greater resources should be devoted to obtaining and managing the information that is required to support these management activities. Existing data collection and management programs are not adequate to fulfill this need. Therefore, implementation of this permanent large-scale ground-water surveillance network is recommended to enable effective ground-water management in Illinois.
2. It has been widely recognized that a statewide ground-water monitoring and management program requires a coordinated effort involving affected agencies to be successful (National Academy of Science, 1977; Carter, 1983; Fairchild, 1983; Moffett, 1983a). Therefore, operation of the proposed monitoring network should entail coordination among the major water-resource agencies in the state. By virtue of its legislative mandate, DENR (through the Water Survey Division) should be predominantly responsible for the handling, interpretation and reporting of the data collected from the network. This mandate identifies the ISWS as the "central repository for water data in Illinois." In addition, it states that "the Department shall investigate and study the natural resources of the State and prepare printed reports and furnish information fundamental to the conservation and development of natural resources . . . shall obtain, store, and process relevant data . . . collect facts and data concerning the volumes and flow of underground waters for the State and determine the mineral qualities of water from different geological formations for the various sections of the State . . . [and] shall investigate practical problems, implement studies, conduct research, and provide assistance, information and data relating to the technology and administration of environmental protection . . . " (Illinois State Water Plan Task Force, 1982).
It is recommended that the ISWS summarize and interpret the network data on an annual basis, recommend special studies, and report these results and recommendations to all member agencies of the State Water Plan Task Force and the interested public. In view of the IEPA's jurisdiction over public water supplies, as well as its capabilities, it is recommended that the IEPA be responsible for the collection and analysis (whether performed via private or public facilities) of all water samples, in cooperation with the USGS. Financial support for the program may be possible through the USEPA. This is in general agreement with IEPA that the ISWS, ISGS, IEPA, and USGS should monitor ground water in areas of high usage.
3. Since much of the data on ground water in Illinois are (and probably will continue to be) derived from individual studies, better control and planning should be incorporated into the associated data-collection efforts to maximize the value of the collected data beyond the narrowly defined objectives of individual studies. Agencies involved in ground-water data collection should establish a review panel whereby proposed data collection and analysis methods are scrutinized.
-63-
This coordination prior to data collection will allow others outside the project team to suggest reasonable modifications which may enhance the value of the data, and the project, to the scientific community. Examples are: the measurement of additional environmental parameters not normally of importance to the project but important to another scientist's work (within reason); alteration of the frequency of a measurement to enhance the (statistical) information contained therein; etc.
Pre-project review will reduce the fragmentation which currently exists in the collection of environmental data while enhancing the value of the information obtained and increasing the possibilities for multi-disciplinary research.
4. The need for improved methods of obtaining, recording, and communicating information relevant to Illinois' ground-water resources cannot be overstated. A detailed system of reliably accounting for this valuable asset is required if efforts to manage it are to succeed. Examples of significant improvements which can be made are:
- issuance of unique, state-assigned water well identification numbers for all water wells in the state, and if possible attachment of that number to the well housing in a readily visible place on a metal plate or tag;
- collection and verification of well support information for all wells including: location, depth, construction features, pumpage, rehabilitation history, status, intended use of the water, geologic formations open to the well, etc.;
- indexing of all ground-water data currently available within state agencies (e.g., well logs, aquifer tests, chemical analyses, etc.) to make the available information more useful in management activities;
- entry of data currently stored in paper files into computer-accessible files, thus facilitating efficient large-scale utilization;
- development of a routinely-updated, comprehensive listing of all major potential sources of ground-water contamination in the state, their nature, and their locations;
- compilation of an annotated bibliography for all previous studies related to ground-water resources in Illinois with cross-referencing by subject, location, aquifer(s), etc.
5. The owners of all PWS wells nominated for inclusion in the statewide ground-water monitoring network should receive a letter requesting their participation and cooperation in the program. The letter should explain the monitoring network and its objectives and what participation in the network will entail. The letter should point out the benefits of participation in the network to the State and to the well owner. Well owners should be notified (in writing) of the results of sampling as soon as the results are available from the laboratory.
-64-
6. A concerted effort should be made to verify the information currently on file for network wells (through field visits, if necessary). This verification should address not only the well's support information but also the available historical water quality data.
7. Computer models are becoming an increasingly important water-resource management tool. Consideration should be given to the development of ground-water models for principal aquifer systems in Illinois with emphasis placed on areas of greatest utilization of ground water. The application of models would increase our understanding of the effects of development or degradation on hydrogeologIc systems, enable predictions of the system's responses to variations in recharge or withdrawals, and facilitate ground-water planning and management in Illinois.
8. In order to rapidly obtain information on the presence and quantities of synthetic organic contaminants affecting Illinois ground-water supplies, the state should offer to sample any and all active water supply wells upon request by the well's owner. Although the costs of such a sampling program would be quite high, it is one means of locating serious ground-water quality problems which are affecting existing potable water supplies. It may be possible to arrange for analytical costs to be shared between the state and the well owners. The complete results of these organic analyses and those from the GC/MS scan of the network wells should be archived for use at a later time. Interpretive techniques for organics are improving at a rapid rate, and information collected today could be very valuable in the future.
9. The state should encourage local governments to develop groundwater management strategies (including small-scale monitoring networks) at the local level by providing technical assistance and information to interested parties.
10. It is inadvisable to combine data from the statewide monitoring network with monitoring data collected from small-diameter wells designed and installed for detecting contaminants released from potential point sources of ground-water pollution (e.g., wells required for monitoring landfills under RCRA). Wells designed for small-scale monitoring provide data representative of a very small area around the well's intake, whereas high-capacity production wells draw water from a much larger volume of the aquifer and yield integrated values of the parameters monitored. Data from the two types of wells may be incompatible and produce misleading results and erroneous conclusions. Although the utilization of small-diameter monitoring wells may occasionally be required for level three monitoring to be effective, data from such wells should not be aggregated with the data from statewide network wells and should be limited in application to the study of smaller-scale problems.
11. Some means of financing the proposed monitoring network are: an increase in fees paid for water-well permits; increased fees for registration of water-well drilling rigs; voluntary donations via a "check-off" box on State income tax returns; increased tax on water bills; or, shared costs with the well owners. Given the opportunity, the authors believe that most people in Illinois would willingly pay the small per capita cost of such a comprehensive sampling effort if shown the value of the information.
-65-
12. It was not feasible to statistically determine the density of network wells required to provide a specified level of confidence in monitoring results, because this determination requires some of the same information that the monitoring network is designed to collect. Therefore, data derived from the first intensive survey (level 2 monitoring) performed for each aquifer type should be statistically evaluated (utilizing techniques such as cluster analysis) to refine the preliminary network configuration suggested in this report. This initial evaluation will help to determine areas in which greater detail or more wells are needed. It will also locate network wells that are not providing additional information and therefore can be dropped from the network.
13. Routine statistical analysis and graphical presentation of data should be done to both characterize the data and to "adjust" the network for efficiency and effectiveness.
14. Documented raw data from the monitoring network should be available to users at cost through a system of written requests.
15. In areas where the use of water supply wells is seriously in question, the state could consider the gradual replacement of the proposed monitoring network PWS wells with wells specifically designed for monitoring ground-water quality and piezometric pressures within individual geologic formations. Monitoring systems are available which are capable of providing water samples and pressure measurements at many elevations within a single borehole. These systems have many advantages over existing production wells for monitoring purposes. The primary advantages are in the absolute control over the quality of the data. Such wells are expensive and installation would require many years of effort. Installation could begin in areas where serious regional ground-water problems are known to exist (e.g., northeastern Illinois). In this scheme, the use of existing PWS wells is an interim measure which allows us to conduct monitoring until a network of monitoring wells is in place.
-66-
REFERENCES
Adrian, D. D., C. E. Willis, C. E. Carver, J. W. Male, C. C. Clarkson, F. S. Tirsch, K. Moore and D. R. Ryan. 1980. Coat-Effective Stream and Effluent Monitoring. Water Resources Research Center. Amherst, Massachusetts. 77 p.
Barcelona, M. J., J. P. Gibb and R. A. Miller. 1983. A Guide to the Selection of Materials for Monitoring Well Construction and Ground-Water Sampling. Contract Report 327. Illinois State Water Survey. Champaign, Illinois. 78 p.
Bennett, D. L., ed. 1982. Sample Collector's Handbook. Illinois Environmental Protection Agency, Division of Public Water Supplies. Springfield, Illinois. 118 p.
Bergatrom, R. E., W. J. Foster, L. F. Selkregg and W. A. Pryor. 1955. Groundwater Possibilities in Northeastern Illinois. Illinois State Geological Survey. Urbana, Illinois. 23 p.
Bowley, D. R. and S. P. Roy. 1983. "Development and Use of Map Overlays in Ground-Water Protection." State, County, Regional and Municipal Jurisdiction of Ground-Water Protection. National Water Well Association. Worthington, Ohio. pp. 237-242.
Carriere, G. D. and L. W. Canter. 1980. Planning for Ground Water Quality Monitoring. Report No. NCGWR 80-22. National Center for Ground Water Research. Norman, Oklahoma. 88 p.
Carter, G. P. 1983. The Integrated Ground Water Monitoring Strategy Evaluation Document; Existing Ground Water Monitoring Programs. New Jersey Department of Environmental Protection, Division of Water Resources. Unpaged.
Casey, D., P. N. Nemetz and D. H. Uyeno. 1983. "Sampling Frequency for Water Quality Monitoring: Measures of Effectiveness." Water Resources Research. v. 19, n. 5. American Geophysical Union. Washington, DC. pp. 1107-1110.
Clark, T. P. and D. J. Trippler. 1983. "Design and Operation of an Ambient Ground-Water Quality Monitoring Program for Minnesota." State, County, Regional, and Municipal Jurisdiction of Ground-Water Protection. National Water Well Association. Worthington, Ohio. pp. 158-167.
Everett, L. G. and K. D. Schmidt, eds. 1978. Establishment of Water Quality Monitoring Programs. In Proceedings of American Water Resources Association. Minneapolis, Minnesota.
Fairchild, D. M. 1983. "Ground-Water Monitoring and Data Management in the Southea31." State, County, Regional and Municipal Jurisdiction of Ground-Water Protection. National Water Well Association. Worthington, Ohio. pp. 301-311.
-67-
Federal Register. 1979. "Guidelines Establishing Test Procedures for the Analysis of Pollutants." Proposed Regulations, Part II.
Georgia Department of Natural Resources. 1984. A Ground Water Management Plan for Georgia. Environmental Protection Division. 24 p. plus tables and appendices.
Gibb, J. P., and M. O'Hearn, 1980. Illinois Groundwater Quality Data Summary. Contract Report 230 Illinois State Water Survey. Champaign, Illinois. 60 p.
Gibb, J. P., R. M. Schuller, and R. A. Griffin. 1981. Procedures for the Collection of Representative Water Quality Data from Monitoring Wells. Cooperative Groundwater Report 7. Illinois State Water Survey and Illinois State Geological Survey. Champaign, Illinois. 61 p.
Giese, R. G. 1983. "A State Ground-Water Management Program." State, County, Regional, and Municipal Jurisdiction of Ground-Water Protection. National Water Well Association. Worthington, Ohio. pp. 16-21.
Harmeson, R. H. and M. J. Barcelona. 1981. Sampling Frequency for Water Quality Monitoring. Contract Report 279. Illinois State Water Survey. Champaign, Illinois. 88 p.
Hult, M. F. 1979. Design of a Network for Monitoring Ground-Water Quality in Minnesota. U.S. Geological Survey Open-File Report 79-1164. St. Paul, Minnesota. 44 p.
Illinois Department of Transportation. 1982. Inventory of Public Groundwater System Deficiencies. Division of Water Resources. Springfield, Illinois. 56 p.
Illinois Environmental Protection Agency. 1983. IEPA Emergency Response. IEPA/ENV/83-001. Springfield, Illinois.
Illinois State Water Plan Task Force. 1982. Illinois State Water Plan 1981 Progress Report. Illinois Department of Transportation. Springfield, Illinois. 194 p.
Illinois State Water Plan Task Force. 1983. Illinois State Water Plan: Emerging Issues - 1982 Progress Report. Illinois Department of Transportation. Springfield, Illinois. 116 p.
Kirk, J. R., J. Jarboe, E. W. Sanderson, R. T. Sasman and C. Lonnquist. quist. 1982. Water Withdrawals in Illinois, 1980. Circular 152. Illinois State Water Survey in cooperation with the U.S. Geological Survey. Champaign, Illinois. 47 p.
Lachance, M. and B. Bobee. 1982. "Methodology for the Characterization of Water Quality: Analysis of Time-Dependent Variability." Journal of Hydrology, v. 59, n. 1. Elsevier Scientific Publishing Company. Amsterdam, The Netherlands. pp. 275-291.
-68-
LeGrand, H. E. 1968. "Monitoring of Changes in Quality of Ground Water." Ground Water, v. 6, n. 3. pp. 14—18.
Loftis, J. C. and R. C. Ward. 1979. Regulatory Water Quality Monitoring Networks - Statistical and Economic Considerations. EPA-600/4-79-055. Colorado State University. Fort Collins, Colorado. 89 p.
Loftis, J. C. and R. C. Ward. 1980. "Water Quality Monitoring - Some Practical Sampling Frequency Considerations." Environmental Management, v. 4, n. 6. Springer-Verlag. Hew York, Mew York. pp. 521-526.
Marie, J. R. 1976. Preliminary Evaluation of the Ground-Water Data Network in Indiana. USGS/WRI 76-24. U.S. Geological Survey. Indianapolis, Indiana. 44 p.
Moffett, T. B. 1983(a). "Defining the Roles of Water-Related Agencies in Alabama." State. County, Regional, and Municipal Jurisdiction of Ground-Water Protection. National Water Well Association. Worthington, Ohio. pp. 182-192.
Moore, R. E. 1983. "Defining the Basic Objectives of a Ground-Water Program." State, County, Regional and Municipal Jurisdiction of Ground-Water Protection. National Water Well Association. Worthington, Ohio. pp. 13-15.
Mulica, W. S. and M. A. Beck. 1983. "Municipal Ground-Water Supply Protection and Management Techniques in Massachusetts." State, County, Regional and Municipal Jurisdiction of Ground-Water Protection. National Water Well Association. Worthington, Ohio. pp. 291-300.
Muller, Daniel, and Robert D. Price. 1979. "Ground-Water Availability in Texas." Texas Department of Water Resources Report 238. 77 p.
National Academy of Sciences. 1977. Analytical Studies for the USEPA, Volume IV, Environmental Monitoring. Washington, DC. 181 p.
National Research Council. 1984. Groundwater Contamination. National Academy Press. Washington, DC. 179 p.
Nelson, J. D. and R. C. Ward. 1981. "Statistical Considerations and Sampling Techniques for Ground-Water Quality Monitoring." Ground Water, v. 19, n. 6. National Water Well Association. Worthington, Ohio. pp. 617-625.
Parker, C. E. 1982. Water Quality Inventory and Monitoring Program for the Commonwealth of Virginia; State-of-the-Art. Virginia Water Resources Research Center. Blacksburg, Virginia. 44 p.
Peek, H. M. and L. L. Laymon. 1975. Groundwater Quality Management and Monitoring Program for North Carolina. Circular No. 16. Division of Resource Planning and Evaluation and Department of Natural and Economic Resources. Raleigh, North Carolina. 16 p.
-69-
Pennino J. D. 1984. "Ground Water Quality in the Aquifer of the Upper Mad River Valley 1940 to 1983." Ground Water Monitoring Review, v. 4, n. 3. Water Well Journal Publishing Company. Worthington, Ohio. pp. 27-29.
Pierce, R. R. and N. L. Barber. 1983. "Organizing Georgia's Water Use Data for Effective Management." State, County, Regional, and Municipal Jurisdiction of Ground-Water Protection. National Water Well Asso- _.. ciation. Worthington, Ohio. pp. 127-130.
Plskin, R., J. 0. Student, L. J. Withers and J. Dickman. 1981. Groundwater Withdrawals from Aquifers in Illinois with Emphasis on PWS Wells. .... Illinois Environmental Protection Agency, Division of Land/Noise Pollution Control. Springfield, Illinois. 127 p.
Purdue University. 1984. Environmental Engineering News, v. 41, n. 8 (John M. Bell, ed.), Department of Civil Engineering. Lafayette, Indiana.
Ritchey, J. D., and R. J. Schicht. 1983. "Ground-Water Mangement in the American Bottoms, Illinois." State, County, Regional, and Municipal Jurisdiction of Ground-Water Protection. National Water Well Association. Worthington, Ohio. pp. 279-286.
Roberts, P. V., M. Reinhard and A. J. Valocchi. 1982. "Movement of Organic Contaminants in Groundwater: Implications for Water Supply." Journal AWWA, V. 74, n. 8. American Water Works Association. pp. 408-413.
Roy, S. P. and J. T. Drake. 1983. "Development of the Massachusetts Ground-Water Monitoring Program." State, County, Regional, and Municipal Jurisdiction of Ground-Water Protection. National Water Well Association. Worthington, Ohio. pp. 145-149.
Sanders, T. G., R. C. Ward, J. C. Loftis, T. D. Steele, D. D. Adrian and V. Yevjevich. 1983. Design of Networks for Monitoring Water Quality. Water Resources Publications. Littleton, Colorado. 328 p.
Sasman, R. T., C. R. Benson, R. S. Ludwigs and T. L. Williams. 1982. Water-Level Trends, Pumpage, and Chemical Quality in the Cambrian-Ordovician Aquifer in Illinois, 1971-1980. Circular 154. Illinois State Water Survey. Champaign, IL. 64 p.
Sgambat, J. P., K. S. Porter and D. W. Miller. 1978. Regional Ground Water Quality Monitoring. In Proceedings on Establishment of Water Quality Monitoring Programs. American Water Resources Association. Minneapolis, Minnesota. pp. 182-195.
Siebel, E. P. 1982. Groundwater Contamination in Illinois. Illinois State Water Survey. Champaign, Illinois. 12 p.
Silverman, M. and D. P. Spangler. 1983. "Methodology of Inventorying Ground-Water Quality From Public Drinking Water Supplies." State, County, Regional and Municipal Jurisdiction of Ground-Water Protection. National Water Well Association. Worthington, Ohio. pp. 312-318.
-70-
Sophocleoua, M. 1983. "Groundwater Observation Network Design for the Kansas Groundwater Management Districts, U.S.A." Journal of Hydrology, v. 61. Elsevier Scientific Publishing Company. Amsterdam, The Netherlands. pp. 371-389.
State of Illinois. 1967. Water for Illinois; A Plan for Action. Technical Advisory Committee on Water Resources. Springfield, Illinois. 452 p.
Texas Natural Resources Information System. 1984. Progress Report for the Period September 1, 1983 through February 29, 1984. Texas Natural Resources Information System. Austin, Texas. 42 p.
Texas Water Development Board. 1972. Texas Water Oriented Data Bank, Ground Water Quality Retrieval System. Report WD-5105-02. 57 p.
Tinlin, R. M. 1981. "A Methodology for Monitoring Ground-Water Quality Degradation." Ground Water Monitoring Review, v. 1, n. 2, pp.. 27-32.
U.S. Environmental Protection Agency. 1977(a). Procedures for Ground-Water Monitoring at Solid Waste Disposal Facilities. SW-611. Office of Water and Waste Management. Washington, DC. 269 p.
U.S. Environmental Protection Agency. 1977(b). Waste Disposal Practices and Their Effects on Ground Water. EPA-570/9-77-001. U.S. Environmental Protection Agency. Washington, DC. 512 p.
U.S. Environmental Protection Agency. 1982. Handbook for Sampling and Sample Preservation of Water and Wastewater. Office of Research and Development,. Environmental Monitoring Support Laboratory. Cincinnati, Ohio. 402 p.
U.S. Environmental Protection Agency STORET Water Quality File. 1964. Public Health Services, Cincinnati, Ohio.
U.S. Geological Survey. 1977. National Handbook of Recommended Methods for Water-Data Acquisition. Chapter 2. Office of Water Data Coordination. Reston, Virginia.
Van Belle, G. and J. P. Hughes. 1983. "Monitoring for Water Quality: Fixed Stations Versus Intensive Surveys." Journal Water Pollution Control Federation, v. 55, n. 3. pp. 400-404.
Visocky, A. P. and R. J. Schicht. 1969. Groundwater Resources of the Buried Mahomet Bedrock Valley. Report of Investigation 62. Illinois State Water Survey. Urbana, Illinois. 52 p.
Walker, W. H., R. E. Bergstrom and W. C. Walton. 1965. Preliminary Report on the Ground-Water Resources of the Havana Region in West-Central Illinois. Cooperative Ground-Water Report 3. Illinois State Water Survey and State Geological Survey. Urbana, Illinois. 61 p.
-71-
Ward, R. C. 1978. Regulatory Water Quality Monitoring - A Systems Perspective.' EPA-600/7-78-228. U.S. Environmental Protection Agency Office of Research and Development, Environmental Monitoring and Support Laboratory. Las Vegas, Nevada. 23 p.
Ward, R. C. 1981. "Ground-Water Quality Monitoring - What Information is to be Obtained?" Ground Water, v. 19, n. 2. pp. 130-132.
Ward, R. C, J. C. Loftis, K. S. Nielsen and R. D. Anderson. 1979. "Statistical Evaluation of Sampling Frequencies in Monitoring Networks." Journal Water Pollution Control Federation, v. 51, n. 9. pp. 2292-2300.
Ward, R. C. and J. C. Loftis. 1983. "Incorporating the Stochastic Nature of Water Quality into Management." Journal WPCF, v. 55, n. 4. Colorado State University. Fort Collins, Colorado. pp. 408-414.
Ward,- R. C. and L. R. Freeman. 1973. "Data Requirements of a Water Quality Management Program." Water Resources Bulletin. v. 9, n. 6. American Water Resources Association. pp. 1234-1248.
Willman, H. B., E. Atherton, T. C. Buschbach, C. Collinson, J. C. Frye, M. E. Hopkins, J. A. Lineback and J. A. Simon. 1975. Handbook of Illinois Stratigraphy. Illinois State Geological Survey. Urbana, Illinois. 261 p7
Zeizel, A. J., W. C. Walton, R. T. Sasman and T. A. Prickett. 1962. Ground-Water Resources of DuPage County, Illinois. Cooperative Ground-Water Report 2. Illinois State Water Survey and State Geological Survey. Urbana, Illinois. 103 p.
-72-
SELECTED BIBLIOGRAPHY
Adolphson, D. G., J. F. Ruhl and R. J. Wolf. 1981. Designation of Principal Water-Supply Aquifers in Minnesota. USGS/WRI 81-51. U.S. Geological Survey. St. Paul, Minnesota. 19 p.
Arora, R., S. S. McFadden and P. D. Perriello. 1983. "Ground-Water Monitoring Program in Georgia's Coastal Plain Aquifers." State, County, Regional, and Municipal Jurisdiction of Ground-Water Protection. National Water Well Association. Worthington, Ohio. pp. 150-157.
Briggs, P. C. 1983. "Coordination of Ground-Water Quality and Quantity Management." State, County, Regional, and Municipal Jurisdiction of Ground-Water Protection. National Water Well Association. Worthington, Ohio. pp. 22-26.
Carter, G. P. 1982. An Evaluation of Two Approaches to Ground Water Resources Protection. New Jersey Department of Environmental Protection, Division of Water Resources. Unpaged.
Carter, G. P. 1983. "Developing an Intetgrated Federal, State and County Ground-Water Monitoring Program." State, County, Regional, and Municipal Jurisdiction of Ground-Water Protection. National Water Well Association. Worthington, Ohio. pp. 168-171.
Csallany, S. 1966. Yields of Wells in Pennsylvanian and Mississippian Rocks in Illinois. Report of Investigation 55. Illinois State Water Survey. Urbana, Illinois. 42 p.
Curry, L. L. 1983. Consumer Attitudes Toward Public Water Supply Quality: Dissatisfaction and Alternative Water Sources. Circular 158. Illinois State Water Survey. Champaign, Illinois. 30 p.
Hampton, N. F". 1976. Monitoring Groundwater Quality: Data Management. EPA-600/4-76-019. TEMPO General Electric Company Center for Advanced Studies. Santa Barbara, California. 62 p.
Holt, C. L. R., Jr. and E. L. Skinner. 1973. Ground-Water Quality in Wisconsin Through 1972. Information Circular No. 22. U.S. Geological Survey and Wisconsin Geological and Natural History Surveys. 148 p.
Horsley, S. W. 1983. "Beyond Zoning: Municipal Ordinances to Protect Ground Water." State, County, Regional, and Municipal Jurisdiction of Ground-Water Protection. National Water Well Association. Worthington, Ohio. pp. 73-82.
Huffman, G. C. 1983. Ground-Water Data for Michigan 1982. Open-File Report 83-753. U.S. Geological Survey. Prepared in cooperation with the Michigan Department of Natural Resources. Lansing, Michigan. 54 p.
-73-
Illinois Department of Energy and Natural Resources. -1984. Draft—Five Year Environmental Research Agenda. Illinois Department of Energy and Natural Resources. Springfield, Illinois. 91 p.
Illinois Economic and Fiscal Commission. 1974. Water Resources Management in Illinois. Illinois Economic and Fiscal Commission. Springfield, Illinois. 133 p. plus appendices.
Illinois State Water Plan Task Force. 1984. Illinois State Water Plant Critical Issues, Cross-Cutting Topics, Operating Issues. Illinois Department of Transportation. Springfield, Illinois. 59 p.
Keith, Larry H., and William Telliard. 1979. "Priority Pollutants; I. A Perspective View." Environmental Science and Technology, v. 13, n. 4, pp. 416-423.
Kerr, H. A. 1983. "Basic Ground-Water Data in Alberta, Canada — Its Collection, Storage and Dissemination." State, County, Regional, and Municipal Jurisdiction of Ground-Water Protection. National Water Well Association. Worthington, Ohio. pp. 109-115.
Krohe, J., Jr. 1983. "INRIC; Transforming Data to Knowledge." Illinois Issues, v. 9, n. 7. Sangamon State University. Springfield, Illinois. pp. 17-19.
Larson, T. E. 1963. Mineral Content of Public Ground-Water Supplies in Illinois. Circular 90. Illinois State Water Survey. Urbana, Illinois. 28 p.
Loucks, D. P. and J. R. Stedinger. 1983. Interactive Modeling and Data Management for Predicting Surface and Groundwater Quality and Quantity. Cornell University. Ithaca, New York. 21 p.
Meyer, C. F., ed. 1973. Polluted Groundwater; Some Causes, Effects, Controls, and Monitoring. EPA-600/4-73-001b. TEMPO, General Electric Company Center for Advanced Studies. Santa Barbara, California. 282 p.
Miller, D. W., F. A. Deluca, and T. L. Tessier. 1974. Ground Water Contamination in the Northeast States. EPA-660/2-74-056. USEPA, Office of Research and Development. Washington, DC. 325 p.
Miller, David W. 1981. "Guidelines for Developing a State-Wide Ground-Water Monitoring Program." Ground Water Monitoring Review. Spring 1981. pp. 32-33.
Moffett, T. B. 1983(b). "Where Have All the Ground-Water Data Gone —Into the Files, Never to Return?" State, County, Regional, and Municipal Jurisdiction of Ground-Water Protection. National Water Well Association. Worthington, Ohio. pp. 116-126.
-74-
Nightingale, H. I. and V. C. Bianchi. 1979. "Influence of Well Water Quality Variability on Sampling Decisions and Monitoring." Water Resources Bulletin, v. 15, n. 5. American Water Resources Association. City, State. pp. 1394-1407.
O'Hearn, M. and T. L. Williams. 1982. A Summary of Information Related to the Comprehensive Management of Groundwater and Surface Water Resources in the Sangamon River Basin, Illinois. Contract Report 299. Illinois State Water Survey. Champaign, Illinois. 145 p.
Ripley, B. D. 1981. Spatial Statistics. Wiley and Sons. Mew York. 252 p.
Sanderson, E. W., A. P. Visocky, M. A. Collins, R. 0. Olson, and C. H. Neff. 1984. Dewatering Well Assessment for the Highway Drainage System at Four Sites in the East St. Louis Area, Illinois (Phase I). Contract Report 341. Illinois State Water Survey, Champaign, Illinois. 48 p.
Sasman, R. T. 1981. Verification of the Potential Yield and Chemical Quality of the Shallow Dolomite Aquifer in DuPage County, Illinois. Circular 149-81. Illinois State Water Survey, Champaign, Illinois.
Sheaffer, J. R. and A. J. Zeizel. 1966. The Water Resource in Northeastern Illinois: Planning Its Use. Technical Report No. 4. Northeastern Illinois Planning Commission. Chicago, Illinois. 182 p.
Shirley, P. A. 1983. "Use of STORET as a Data Base for Ground-Water Quality Management." State, County, Regional, and Municipal Jurisdiction of Ground-Water Protection. National Water Well Association. Worthington, Ohio. pp. 131-141.
Soule, D. C. 1983. "The Nashua, New Hampshire Area Aquifer Delineation Study." State, County, Regional and Municipal Jurisdiction of Ground-Water Protection. National Water Well Association. Worthington, Ohio. pp. 267-269.
Stallman, R. W. 1968. "Ground-Water Data — Too Much or Too Little?" Proceedings of the National Symposium on the Analysis of Water Resources Systems. American Water Well Association. Worthington, Ohio. pp. 126-132.
State of Illinois. 1983. Final Water Pollution Control Program Plan. Illinois Environmental. Protection Agency. Springfield, Illinois. 54 p. plus appendices.
Stone, P. A. and R. L. Knox. 1983. "Initial Assessment of Suspected Recharge Areas for Two Major Aquifer Systems in South Carolina." State, County, Regional and Municipal Jurisdiction of Ground-Water Protection. National Water Well Association. Worthington, Ohio. pp. 243-257.
- 7 5 -
Suter, M., R. E. Bergstrom, H. F. Smith, G. H. Emrich, W. C. Walton and T. E. Larson. 1959. Preliminary Report on Ground-Water Resources of the Chicago Region, Illinois. Cooperative Ground-Water Report 1. Illinois State Water Survey and Illinois State Geological Survey. Urbana, Illinois. 89 p.
Tanenbaum, E. G. 1983. "Hydrogeologic Zoning on Long Island." State, County, Regional, and Municipal Jurisdiction of Ground-Water Protection. National Water Well Association. Worthington, Ohio. pp. 57-67. "
Tlnlin, R. M., ed. 1976. Monitoring Groundwater Quality: Illustrative Examples. EPA 600/4-76-036. TEMPO General Electric Company Center for Advanced Studies. Santa Barbara, California. 81 p.
Toler, L. G. 1982. Proceedings of Illinois Water-Data-Users Meeting. Open-File Report 82-1001. U.S. Geological Survey. Lakewood, Colorado. 90 p.
Tolman, A. L., D. H. Tepper and G. C. Prescott, Jr. 1983. "Hydrogeologic Assessment of Significant Sand and Gravel Aquifers in Maine." State, County, Regional and Municipal Jurisdiction of Ground-Water Protection. National Water Well Association. Worthington, Ohio. pp. 258-266.
Tripp, J. T. 8., Esq. 1983. "Local Measures to Control Ground-Water Pollution: Innovative Strategies and Legal Problems." State, County, Regional, and Municipal Jurisdiction of Ground-Water Protection. National Water Well Association. Worthington, Ohio. pp. 51-56.
Tung, Y. and L. W. Mays. 1981. "Reducing Hydrologic Parameter Uncertainty." Journal of the Water Resources Planning and Management Division. ASCE. pp. 245-262.
U.S. Congress, Office of Technology Assessment. 1982. Use of Models for Water Resources Management, Planning and Policy. Washington, DC. 242 p.
U.S. Environmental Protection Agency. 1975. Model State Water Monitoring Program. Office of Water and Hazardous Materials, Monitoring and Data Support Division. Washington, DC. 55 p.
U.S. Water Resources Council. 1980. Essentials of Ground-Water Hydrology Pertinent to Water-Resources Planning. Bulletin #16 Revised. PB81-234437. Hydrology Committee. Washington, DC. 38 p.
Viessman, W., Jr. 1980. Assessing the Nation's Water Resources; Issues and Options. Serial No. 96-19. Senior Specialist Division Congressional Research Service. Washington, DC. 65 p.
Ward, R. C. and D. H. Vanderholm. "Cost-Effectiveness Methodologies for Data Acquisition in Water Quality Management." Water Resources Research. v. 9, n. 3. 1973. American Geophysical Union. Washington, DC. pp. 536-545.
-76-
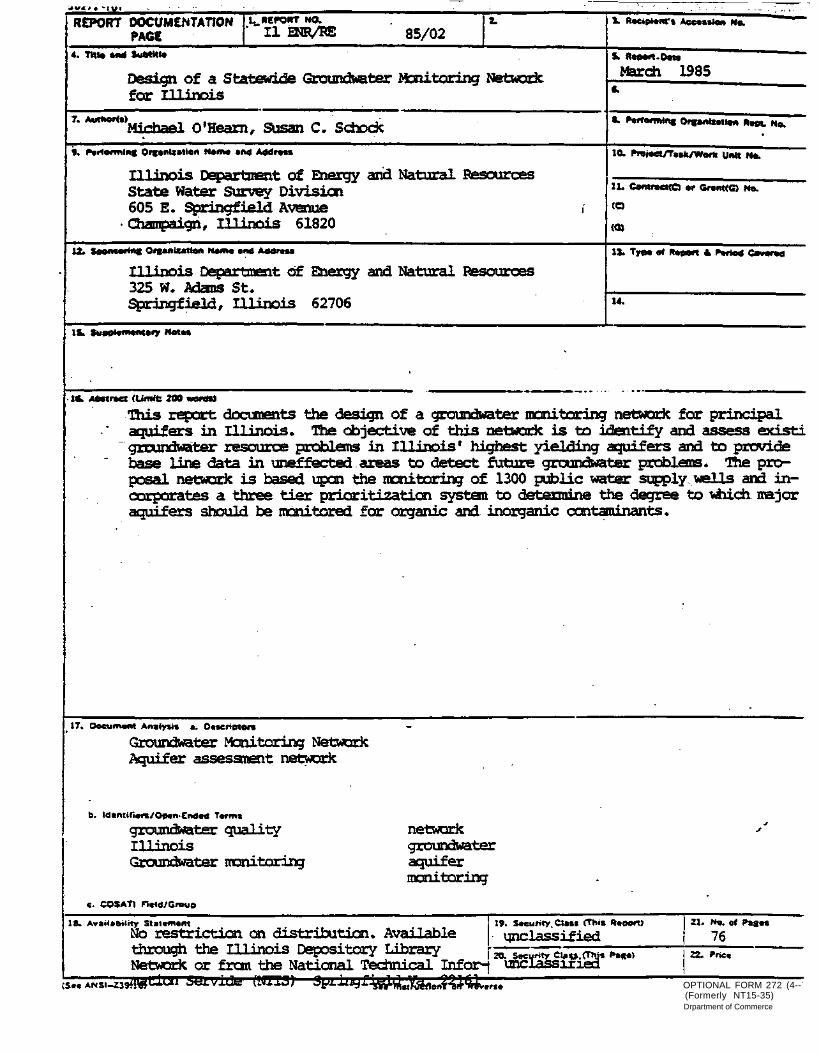
OPTIONAL FORM 272 (4--(Formerly NT15-35) Drpartment of Commerce