Embed Size (px)
Citation preview

DESIGN OF A SPECIAL PROTECTION SCHEME AND
SUPPLEMENTARY CONTROLS REGARDING HVDC BACK TO BACK
INTERCONNECTION BETWEEN TURKEY AND GEORGIA
A THESIS SUBMITTED TO
THE GRADUATE SCHOOL OF NATURAL AND APPLIED SCIENCES
OF
MIDDLE EAST TECHNICAL UNIVERSITY
BY
ÖZGÜR TANIDIR
IN PARTIAL FULFILLMENT OF THE REQUIREMENTS
FOR
THE DEGREE OF MASTER OF SCIENCE
IN
ELECTRICAL AND ELECTRONICS ENGINEERING
FEBRUARY 2014

ii

iii
Approval of the thesis:
DESIGN OF A SPECIAL PROTECTION SCHEME AND
SUPPLEMENTARY CONTROLS REGARDING HVDC
INTERCONNECTION BETWEEN TURKEY AND GEORGIA
submitted by ÖZGÜR TANIDIR in partial fulfillment of the requirements for the
degree of Master of Science in Electrical and Electronics Engineering
Department, Middle East Technical University by,
Prof. Dr. Canan Özgen ______________
Dean, Graduate School of Natural and Applied Sciences
Prof. Dr. Gönül Sayan ______________
Head of Department, Electrical and Electronics Engineering
Prof. Dr. Ali Nezih Güven ______________
Supervisor, Electrical and Electronics Engineering Dept., METU
Dr. Osman Bülent TÖR ______________
Co-Supervisor, EPRA
Examining Committee Members:
Prof. Dr. Nevzat Özay ______________
Electrical and Electronics Engineering Dept., METU
Prof. Dr. Ali Nezih Güven ______________
Electrical and Electronics Engineering Dept., METU
Dr. Osman Bülent Tör ______________
EPRA
Prof. Dr. Muammer Ermiş ______________
Electrical and Electronics Engineering Dept., METU
M.Sc. Erkut Cebeci ______________
Tübitak MAM Energy Institute
Date: ______________

iv
I hereby declare that all information in this document has been obtained and
presented in accordance with academic rules and ethical conduct. I also declare
that, as required by these rules and conduct, I have fully cited and referenced
all material and results that are not original to this work.
Name, Last name: Özgür Tanıdır
Signature:

v
ABSTRACT
DESIGN OF A SPECIAL PROTECTION SCHEME AND
SUPPLEMENTARY CONTROLS REGARDING HVDC BACK TO BACK
INTERCONNECTION BETWEEN TURKEY AND GEORGIA
Tanıdır, Özgür
MS, Department of Electrical and Electronics Engineering
Supervisor : Prof. Dr. Ali Nezih Güven
Co-Supervisor : Dr. Osman Bülent Tör
February 2014, 120 pages
HVDC Back-to-Back interconnection between Turkey and Georgia is operational
since November 2013. Previous feasibility analysis regarding to this project has
shown that depending on the amount of power transfer between parties and loading
conditions, there might be transmission bottlenecks and problems observed in
Turkish Power System. In this respect, special protection coordination is required to
maintain reliable and sustainable operation. In this thesis, design of a special
protection scheme that coordinates outages in the region along with some
countermeasures is introduced. The design study starts with analyzing critical
scenarios and instabilities endangering the normal operation of Turkish Power
System in order to define requirements of the special protection scheme. In this
regard, static and dynamic analyses are carried out to identify instability patterns and
solution spaces for critical instability conditions. The results have shown that
regional system is highly vulnerable to the contingencies and may face regional
collapse even without interconnection. Hence, several scenarios and several loading
conditions have been analyzed in detail in order to give insight to special protection

vi
logic design and calculate countermeasures required for critical instability
conditions.
As a result of these studies, requirements for stable and sustainable operation of the
region are specifically determined and a wide area measurement based special
protection scheme is designed. In addition, modelling of the designed scheme in a
power system simulation environment and simulation results of the proposed scheme
are presented. Finally, coordination and compliance between existing protection
measures with the proposed protection scheme are also investigated.
Keywords: Special Protection Scheme, Remedial Action Scheme, Wide Area
Measurements, Power System Stability, Power System Interconnection

vii
ÖZ
TÜRKİYE VE GÜRCİSTAN ARASINDAKİ HVDC BACK TO BACK
ENTERKONNEKSİYONUNA İLİŞKİN KORUMA SİSTEMİNİN TASARIMI
VE BAĞLANTI FONKSİYONLARININ GELİŞTİRİLMESİ
Tanıdır, Özgür
Yüksek Lisans, Elektrik ve Elektronik Mühendisliği Bölümü
Tez Yöneticisi : Prof. Dr. Ali Nezih Güven
Ortak Tez Yöneticisi : Dr. Osman Bülent Tör
Şubat 2014, 120 pages
Türkiye ve Gürcistan elektrik sistemleri arasındaki HVDC enterkonneksiyon, 2013
yılı Kasım ayı itibariyle gerçekleşmiştir. Bu bağlantı kapsamında daha önce yapılan
fizibilite çalışmaları, ülkeler arası elektrik transferinin seviyesine ve sistem
yüklenmesine bağlı olarak, Türkiye elektrik iletim sisteminde kısıtlar ve problemler
yaşanabileceğini göstermektedir. Bu bağlamda, Türkiye elektrik sistemi işletmesinin
kesintisiz ve güvenli olması amacıyla, bağlantı bölgesi ve çevresini kapsayan bir özel
koruma sisteminin tasarlanması ve uygulanması gerekliliği ortaya çıkmaktadır. Bu
tez çalışmasında, bölgesel şebekedeki anormal durumları gözlemleyen ve karşı
önlemlerle olası bölgesel çökmelerin önüne geçen bir özel koruma sistemi tasarımı
anlatılmaktadır. Özel koruma uygulanacak sistemin anlaşılması ve koruma sisteminin
tasarımı için gerekli kriterlerin belirlenmesi amacıyla, bölgesel şebeke için kritik
senaryolar, statik ve dinamik kararlılık analizleri ile incelenmiştir.
Yapılan çalışmalarda, bölgesel elektrik şebekesinde yüklenme seviyesine bağlı
olarak bölgesel sistemin oturması problemi ile karşı karşıya kalınabileceği, sistemin
bu duruma karşı savunmasız olduğu ve sistem kararsızlığının Gürcistan ile elektrik

viii
ticareti olmasa dahi oluşabileceği gözlemlenmiştir. Bu nedenle çalışmada, farklı
senaryolar ve yüklenme koşullarında yaşanılabilecek olası şebeke çökmelerinin
analizi yapılmıştır. Bu analizlerin sonuçları, özel koruma sistemi dizaynında ve karşı
önlemlerin oluşturulmasında kullanılmıştır.
Yapılan çalışmaların sonucunda, bölgeye tesis edilmesi planlanan özel koruma
sistemi için gereksinimler belirlenmiş ve geniş alan ölçümlerine dayanan bir özel
koruma sistemi tasarımı gerçekleştirilmiştir. Bu çalışmada, bahse konu koruma
sisteminin tasarımı, öngörülen sistemin güç sistemleri analiz programında
modellenmesi ve sistemin çalışmasına dair simülasyon sonuçları anlatılmıştır. Ayrıca
tasarlanan sistemin, mevcut koruma düzeni ile koordinasyonu ve uyumluluğu
incelenmiştir.
Anahtar kelimeler: Özel Koruma Sistemi, Acil Eylem Şeması, Geniş Alan Ölçümleri,
Güç Sistemi Kararlılığı, Güç Sistemleri Enterkonneksiyonu

ix
To My Parents
My Sister
And My Cutie

x

xi
ACKNOWLEDGEMENTS
First of all, I would like to express my deepest gratitude to my supervisor Prof. Dr.
Ali Nezih Güven and co-supervisor Dr. Osman Bülent Tör for their guidance, advice,
encouragement and support throughout the research.
I also would like to thank the talented researchers of Power Systems Department of
TÜBİTAK-MAM Energy Institute for their support, intimate friendship and for
creating an excellent working environment. Especially, I owe a debt of gratitude to
Mahmut Erkut Cebeci for his endless guidance and support whenever I need, and
suggestions throughout the M.S. study.
Finally, my special gratitude goes to my family for their unconditional support, love
and encouragement throughout my life.

xii

xiii
TABLE OF CONTENTS
ABSTRACT ................................................................................................................. v
ÖZ ............................................................................................................................ vii
ACKNOWLEDGEMENTS ........................................................................................ xi
TABLE OF CONTENTS .......................................................................................... xiii
LIST OF TABLES ................................................................................................... xvii
LIST OF FIGURES .................................................................................................. xix
CHAPTERS
1. INTRODUCTION ............................................................................................... 1
2. SPECIAL PROTECTION DEMAND IN NORTHEASTERN REGION OF
TURKISH POWER SYSTEM ..................................................................................... 5
2.1. HVDC Interconnection between Turkey and Georgia .................................. 5
2.2. Utility Requirements, Expectations and Need for SPS Application ........... 11
2.3. SPS Applications around the World and State of Art in SPS Installations . 15
2.4. Thesis Contribution ..................................................................................... 18
3. FUNCTIONAL REQUIREMENT ANALYSIS AND DESIGN OF WIDE
AREA MEASUREMENT BASED SPS .................................................................... 21
3.1. Analysis Scenarios and System Modelling ................................................. 21
3.1.1. Scenario Determination ........................................................................ 21
3.1.2. Modelling Environment ....................................................................... 24
3.1.3. Turkish Regional Grid Model .............................................................. 24
3.1.4. Georgian Grid Model ........................................................................... 28

xiv
3.2. Static Security Analysis ............................................................................... 29
3.2.1. Base Case and Contingency (n-1) Analysis ......................................... 29
3.2.2. Summer Scenario Results ..................................................................... 37
3.2.3. Spring Scenario Results ....................................................................... 40
3.3. Power Quality Analysis ............................................................................... 42
3.3.1. HVDC Converter Station Configuration .............................................. 42
3.3.2. ESCR Calculation ................................................................................ 45
3.4. Transient Stability Analysis......................................................................... 47
3.4.1. Introduction .......................................................................................... 47
3.4.2. Regional Grid Dynamical Model ......................................................... 52
3.4.3. Grid Protection Model .......................................................................... 57
3.4.4. Dynamical model of HVDC B2B ........................................................ 59
3.4.5. Transient Stability Assessment of Regional Model ............................. 64
3.5. SPS Design Studies ..................................................................................... 73
3.5.1. Requirement Summary ......................................................................... 74
3.5.2. Solution Space ...................................................................................... 75
3.5.3. Monitoring Location Determination .................................................... 76
3.5.4. Instability Pattern ................................................................................. 77
3.5.5. Development of SPS Logic .................................................................. 82
4. SIMULATION RESULTS AND DISCUSSION .............................................. 89
4.1. Implementation of Designed Logic on Simulation Environment ................ 89
4.2. Transient Stability Results for Summer Scenario under SPS Supervision .. 91
4.3. Transient Stability Results for Spring Scenario under SPS Supervision ..... 98
5. CONCLUSION ................................................................................................ 105
6. REFERENCES ................................................................................................. 111

xv
APPENDICES
A. SINGLE LINE DIAGRAM OF THE REGION .............................................. 115
B. HARMONIC ANALYSIS REGARDING HVDC B2B INTERCONNECTION .
.......................................................................................................................... 117

xvi

xvii
LIST OF TABLES
TABLES
Table 2-1. Results of the Contingency Analysis for 2013 [1].................................... 14
Table 2-2. SPS survey studies .................................................................................... 16
Table 3-1. Generation dispatch schemes considered in the analyses ......................... 23
Table 3-2. Utilization factor of regional generators ................................................... 27
Table 3-3. Total foreseen small hydraulic generation capacity in the region [17] .... 27
Table 3-4. Key planned transmission system investments [7] .................................. 28
Table 3-5. Set of predefined solutions ....................................................................... 33
Table 3-6. Example static security assessment table (contingency and predefined
solutions) .................................................................................................................... 35
Table 3-7. Example static security assessment table (line overloading) .................... 36
Table 3-8. Transmission line overloading and predefined solution results for summer
scenario ...................................................................................................................... 39
Table 3-9. Transmission line overloading and predefined solution results for spring
scenario ...................................................................................................................... 41
Table 3-10. SCMVA calculations for possible grid topologies for each scenario ..... 47
Table 3-11. Transient stability results table for summer scenario ............................. 71
Table 3-12. Transient stability results table for spring scenario ................................ 73
Table 4-1. Transient stability results for summer scenario under the SPS supervision
.................................................................................................................................... 97
Table 4-2. The amount of generation shed order given by SPS for all simulated cases
in summer scenario .................................................................................................... 98
Table 4-3. Transient stability results table for spring scenario under the SPS
supervision ............................................................................................................... 104

xviii
Table 4-4. The amount of generation shed order given by SPS for all simulated cases
in spring scenario ..................................................................................................... 104
Table B-1: The comparison of the voltage harmonics related to the B2B converter
and Turkish grid code requirements ......................................................................... 120
xix
LIST OF FIGURES
FIGURES
Figure 2-1. Power system planning chart [3]. .............................................................. 6
Figure 2-2: The basic transmission routes (blue line: Muratli – Batumi line
representation; dark red line: Borçka – Akhaltsikhe line representation, light red line:
Y. Tortum-Akhaltsikhe line representation). ............................................................... 8
Figure 2-3. System problems and respective solutions utilized in SPS algorithms [2]
.................................................................................................................................... 18
Figure 2-4. General structure of a special protection scheme [2] .............................. 18
Figure 3-1. Electrification map of regional model used in design studies ................. 25
Figure 3-2: The basic transmission routes related to Georgia Interconnection (blue
line: Muratli – Batumi line representation; red line: Borçka – Akhaltsikhe line
representation, black lines: expected transmission highways in 2013, red circles:
major generating facilities, yellow circles: major load centers). ............................... 26
Figure 3-3. Transmission line loadability curve [19] ................................................. 31
Figure 3-4. Kayabaşı – Altınkaya - Çarşamba 400 kV triangle ................................. 31
Figure 3-5: The topology of a 12 pulse B2B Substation ............................................ 43
Figure 3-6. Filter scheme in the substation ................................................................ 44
Figure 3-7. Mechanical and electrical torques on the turbine shaft ........................... 48
Figure 3-8. Power angle curve illustrating transient stability [21] ............................ 49
Figure 3-9. Transient stability phenomenon [19] ....................................................... 51
Figure 3-10. Power system model for transient stability analysis [19] ...................... 53
Figure 3-11. IEEE Type ST1A excitation system model [24] ................................... 57
Figure 3-12. Time-current characteristic of applied protection setting ...................... 59
Figure 3-13. Operating curves of B2B convertor stations [1] .................................... 60
Figure 3-14. Transient response of the simulated generic HVDC model .................. 62
Figure 3-15. Behaviour of the HVDC B2B model during transient .......................... 62

xx
Figure 3-16. Transient behavior of constant power load model ................................ 63
Figure 3-17. Example transient stability assessment interface on MATLAB ............ 65
Figure 3-18. Transiently unstable condition without Georgia interconnection ......... 67
Figure 3-19. Kayabaşı - Çarşamba transmission line loading problem in case of loss
of Altınkaya – Çarşamba line (case with 350 MW import from Georgia) ................ 68
Figure 3-20. Kayabaşı - Çarşamba transmission line loading problem in case of loss
of Altınkaya – Kayabaşı line (case without import from Georgia) ............................ 68
Figure 3-21. Transient instability as a result of cascaded 154 kV line opening (case
with 350 MW import) ................................................................................................ 69
Figure 3-22. Transient instability as a result of cascaded 154 kV line opening (case
with 700 MW import) ................................................................................................ 70
Figure 3-23. Instability pattern for faults on Borçka – Erzurum transmission corridor
(summer scenario) ...................................................................................................... 79
Figure 3-24. Instability pattern for faults on Borçka – Erzurum transmission corridor
(spring scenario) ......................................................................................................... 80
Figure 3-25. Instability pattern for faults on Borçka – Çarşamba transmission
corridor (summer scenario) ........................................................................................ 81
Figure 3-26. Instability pattern for faults on Borçka – Çarşamba transmission
corridor (spring scenario) ........................................................................................... 82
Figure 3-27. Fault location detection logic ................................................................ 84
Figure 3-28. SPS logic flowchart ............................................................................... 87
Figure 4-1. SPS implementation in Digsilent software .............................................. 90
Figure 4-2. Effect of SPS during loss of the line between Çarşamba and Samsun
(summer scenario) ...................................................................................................... 92
Figure 4-3. Effect of SPS in case of cascaded line openings (summer scenario) ...... 93
Figure 4-4. Effect of SPS in case of degraded transmission lines (summer scenario)
.................................................................................................................................... 94
Figure 4-5. Effect of SPS in case where no action needed (summer scenario) .......... 95
Figure 4-6. Effect of SPS in case of voltage collapse (summer scenario) ................. 96
Figure 4-7. Effect of SPS during loss of the line between Çarşamba and Samsun
(spring scenario) ......................................................................................................... 99

xxi
Figure 4-8. Effect of SPS during loss of the line between Ordu and Tirebolu (spring
scenario) ................................................................................................................... 100
Figure 4-9. Effect of SPS during loss of the line between Tirebolu and Kalkandere
(spring scenario) ....................................................................................................... 101
Figure 4-10. Effect of SPS during loss of the line between Kalkandere and Borçka
(spring scenario) ....................................................................................................... 101
Figure 4-11. Effect of SPS in case where no action needed (spring scenario) ........ 102
Figure 4-12. Effect of SPS during loss of the line between Erzurum and Özlüce
(spring scenario) ....................................................................................................... 103
Figure A-1. Single Line Diagram of the Region ...................................................... 116
Figure B-1. Time domain transient switching results of the B2B converter ........... 118
Figure B-2. The harmonic spectrum of inverter current .......................................... 118
Figure B-3. The harmonic spectrum of the current at the receiving end (Borçka
substation) of the transmission line .......................................................................... 119
Figure B-4. The harmonic spectrum of the voltage at Borçka substation ................ 120

xxii

1
CHAPTER 1
INTRODUCTION
As being one of the most significant energy type, electricity is todays driving source
in all around the world. Exponential development in technology forces electricity to
be supplied in higher amounts and increased quality. Consequently, electric power
systems should be improved constantly to maintain secure and continuous operation.
This requires a reasonable demand forecast and cost effective grid planning.
However, grid planning is a complex problem as it includes several important
concerns such as environmental issues, economical issues, technological issues, etc.
In that respect, grid plans aim the maximization of both utilization of existing system
infrastructure and marginal benefit from grid investments while satisfying certain
degree of quality with a continuous service. This will force grids to operate closer to
their loadability limits. In that case, system security and integrity become a
significant concern for grid operation which requires a special attention.
In addition to the technical electricity quality issues, the electricity service should be
provided in a reasonable price in order to satisfy both producers and customers.
Therefore electricity grid should also be planned in a way that it provides a
competitive environment for producers and customers. In today’s vertically
unbundled systems, generation expansion is handled by non-utility companies,
however; transmission plan should aim to increase the number of players in
electricity market such that the competition among players is increased. One example
way of doing it is the interconnection of power networks. Along with the increase in
competition, interconnection of power networks provides several benefits for
countries such as reserve sharing, reliability enhancement, etc. Today most of the
2
power networks become interconnected to utilize benefits introduced by
interconnection.
Being already connected to ENTSO\E (European Network of Transmission System
Operators for Electricity), Turkey is now planning to interconnect with Georgia via
asynchronous HVDC Back-to-back link (B2B) from northeastern region of Turkey.
According to the information obtained from TEİAŞ (Turkish TSO), the
interconnection has been planned to be realized in 2013 with 350 MW capacity and
will be increased to 1050 MW until 2017. The previous feasibility study regarding to
this interconnection has shown that, due to the transmission bottlenecks in the region,
even 350 MWs of power import is infeasible especially in the spring season [1].
According to that study, significant hydraulic potential in the region is expected to
create transmission bottlenecks in the spring season due to the water regime.
Consequently, power import from Georgia will be limited in magnitude in order to
preserve secure operation of Turkish grid.
This limitation creates an economic burden not only for the investors of this
interconnection but also reduces the economic benefits for countries planning to
enjoy this interconnection. Hence, additional transmission investments are required
in Turkish grid to increase efficiency of this interconnection. However, geographical
difficulties in the region are delaying the transmission investments. Under these
circumstances, a technical solution based on special protection scheme (SPS) is
sought in order to coordinate the outages around the region; hence, reducing the risk
of regional brown-out.
Special protection schemes are designed to detect abnormal system conditions and to
initiate preplanned corrective actions to mitigate consequences of abnormal system
conditions [2]. As the existing transmission system infrastructure is challenged to
support loads beyond original design limits, SPS applications are required to
maintain power system security and reliability. Hence, in this study, an SPS that is
required to resolve transmission bottlenecks in the region is designed.

3
As a special application for the network, SPS requires to be tailored according to the
grid requirements. Therefore, starting point should be the analysis and understanding
of weak points in the grid. Nevertheless, this study requires detailed grid modelling
in terms of static and dynamic models. As the model under investigation is a
relatively larger one, several engineering assumptions are required to ease the
modeling process.
As indicated, SPS design requires several grid analysis studies that include static
security, power quality, transient stability, etc. All of the analysis have critical
importance in the design process and are utilized to form correct scheme for the
region. Starting from static security analysis which monitors system weak points in
detail, studies continue with examining transitions between system states via
transient stability analysis. In addition, continuous operation of HVDC link is
checked utilizing power quality analysis conducted for the region.
Similar to any protective device, SPS should also be highly reliable and dependable
as it ensures the stability and security of the network. This task necessitates
investigation of several scenarios and grid loading conditions. Hence, in this study, 2
main scenarios namely, summer scenario and spring scenario are utilized. In
addition, several generation dispatch alternatives are simulated in both analysis and
design verification process.
Taking the requirements defined for SPS into consideration, design study is
conducted utilizing a step-by-step development approach. Starting from the
determination of grid condition, every state of the grid is detected and required
actions are determined in the SPS design.
In order to model and analyze the Turkish grid in detail, two power system analysis
programs, namely Digsilent PF and PSS/E, are utilized. These simulation programs
provide a wide range of power system analysis functions and proven their
reliabilities; hence, they are commonly used by most of the power system analysis
studies. In addition, for evaluation of the results, MATLAB is also utilized as it

4
offers more flexible and easy environment for combining and arranging several
analysis results.
This thesis is organized as follows. In the second chapter, results of the previous
feasibility study regarding the interconnection between Georgia and Turkey is
introduced. The SPS requirement and implementation examples are also given in this
chapter. Third chapter mainly focuses on grid analyses that are required to design
SPS to the regional network. This chapter starts with grid modelling and scenario
building for analysis. Later, analyses conducted for defining SPS requirements are
given. In addition, step by step SPS design is explained in this chapter. In the fourth
chapter, simulation results for proposed SPS for the region are introduced.
Additionally design evaluation is included in this chapter. Finally this study ends
with conclusive remarks which are given in fifth chapter.
5
CHAPTER 2
SPECIAL PROTECTION DEMAND IN
NORTHEASTERN REGION OF TURKISH POWER
SYSTEM
In this chapter, brief information regarding the HVDC interconnection between
Turkey and Georgia is introduced. The importance of this interconnection project
among Caucasus region countries is explained. In addition, results of the previous
study which is conducted for analyzing the feasibility of this interconnection are
given along with the interconnection requirements. Previous study has shown that the
energy trade between the countries should be limited especially during spring season
due to the transmission bottlenecks existing in Turkish Power System [1]. It is
emphasized that due to insecure transmission conditions exist under some
circumstances, a special protection system should be installed in the region against
the risk of a regional system collapse. Hence, this chapter focuses on necessities and
expectations regarding to the special protection scheme implementation. In addition,
several SPS practices around the world are also presented for a better understanding
of SPS applications.
2.1. HVDC Interconnection between Turkey and Georgia
Electric power utilities are responsible for ensuring continuity and reliability of
supply which is indeed a difficult job in today’s developing world. As the need for
the electric energy is constantly increasing, operation and planning of grid is
becoming even harder. Cost effective grid planning is the key for the success. From
short term unit dispatch problem to long term capacity expansion problem, power

6
system planning should aim to minimize the cost of delivering energy while
satisfying the reliability criteria. Therefore, power utilities should pay highest
attention to the planning issue in order to ensure secure operation of their current and
future grids.
On the other hand, power system planning task includes several complex problems
that needs to be solved simultaneously. This fact also indicates the importance of the
planning issue. The overall picture illustrated in Figure 2-1 shows the interactions
and related time horizons of these problems.
Figure 2-1. Power system planning chart [3].
On the top of the grid planning issues, transmission and generation expansion
problem holds crucial importance. Since this problem constitutes the first level in the
planning process, it directly affects whole grid plan. Capacity expansion decisions
are dependent on many subjects such as environmental and social effects,

7
government policies, technological developments, electricity demand growth rate,
costs etc. However, as the traditional way, most important considerations are demand
growth rate, i.e. supply-demand balance, and costs. In vertically unbundled power
systems, these considerations can further be narrowed to transmission investment
problem as generation investments are not handled by transmission companies. Then
the question becomes `What is the most valuable and cost effective investment to
fulfill continuity and reliability of supply objectives? `.
Power system interconnection is one of the most promising answer to this question.
Today, most of the electric utilities decide to interconnect power systems as it
introduces economical and technical benefits such as;
Reliability enhancement
Reserve sharing
Peak load sharing
Electricity cost reduction.
As a result, huge interconnected networks (ENTSO/E, IPS/UPS (Unified power
system of CIS countries)) are formed to enjoy these benefits. As being an associate
member of ENTSO/E, Turkey also benefits from the interconnection and working on
other interconnection projects with its neighbors as well.
One of the ongoing projects is the connection of Turkish and Georgian power
systems via HVDC link. As agreed by both Turkish and Georgian parties,
asynchronous interconnection between Georgia and Turkey is planned to be
established via line commutated back to back (B2B) HVDC Substations (SS) located
in Akhaltsikhe and Batumi regions of Georgia. Details of these substations are:
3x350 MW HVDC B2B converters are planned to be installed at Akhaltsikhe
SS by the Georgian party until 2017.
o This interconnection between Akhaltsikhe region of Georgia and
Borçka region of Turkey is planned to be established between
Akhaltsikhe (in Georgia) and Borçka (in Turkey) (see Figure 2-2).

8
o The second line in that region is planned to be between Akhaltsikhe
and Tortum which is under investment planning program of Turkey
(see Figure 2-2).
2x175 MW HVDC B2B converters are planned to be installed at the Batumi
region by the Georgian party until 2015.
o The interconnection between Batumi region of Georgia will be
between Batumi and Muratli in Turkey (see Figure 2-2).
The realization of B2B installations is as follows;
2013: 2x350 MW Akhaltsikhe
2015: 2x350 MW Akhaltsikhe; 2x175 MW Batumi
2017: 3x350 MW Akhaltsikhe; 2x175 MW Batumi
Figure 2-2: The basic transmission routes (blue line: Muratli – Batumi line representation; dark
red line: Borçka – Akhaltsikhe line representation, light red line: Y. Tortum-Akhaltsikhe line
representation).

9
This interconnection project introduces a power bridge between not only Turkish and
Georgian parties but also includes power trade opportunities between Azerbaijan,
Georgia, Russia, Turkey and ENTSO\E.
The benefits are much clear when countries among the Caucasus region are
examined. Brief outlook to Georgian Power System has shown that [4];
Installed capacity is around 3300 MW which is composed of hydro and
thermal power plants.
Electricity demand is highly seasonal in Georgia, with peak demand in winter
and lower demand in summer. This is the inverse of the seasonal hydropower
generation pattern: hydropower generators tend to produce at their peak
during summer months and at their lowest levels during winter. This situation
enables Georgia to export energy during the summer, but also requires
hydropower generators to spill large amounts of water.
While Georgia has interconnections with Russia, Turkey, Azerbaijan and
Armenia, the vast majority of its trade is with the first two countries. Trade
with these countries comprises imports in winter to meet Georgian demand
with exports in summer months when Georgia has excess hydro output.
Electricity price is around 1.25 $cent/kWh during spring season while ~5.6
$cent/kWh during other months [5].
On the other hand, brief outlook to the Azerbaijan Power System has shown that [6];
Installed capacity is around 6500 MW where majority of electric power is
produced by thermal power plants as a result of rich natural gas resources in
Azerbaijan.
Peak demand of the country occurs in winter season and is about 5000 MW at
2013.
Due to new generation investments, Azerbaijan is expecting excess energy
which is planned to be exported over the interconnections through Georgia
and Russia.
Electricity price is around 7.5 $cent/kWh.

10
Finally, consideration of Turkish System will lead to following conclusions [7] [8];
Installed capacity of Turkish Power system is around 60000 MW and the
primary source of the generation is almost equally distributed between coal,
hydraulic and natural gas sourced plants.
Peak demand of the country occurs in the summer season and corresponds to
~38000 MW in 2013.
Average price for electricity is around 15 $cent/KWh. However, as the
natural gas combined cycle power plants (NGCCPP) has a significant share in
the electricity generation, prices can go up to 30 $cent/KWh ,especially when
system loading reaches to winter peak loading conditions, due to the
shortages in natural gas supply.
Electricity demand forecasts have reported that about 7% increase in
electricity demand per year is expected. Therefore, electricity sector in
Turkey is attractive for players who are willing to invest on generation.
Consideration of Caucasus region power networks essentially shows that the
interconnection project is a win-win situation for all power utilities around the
region. On the economical bases, high electricity prices in Turkey provide a rock
solid reason for this interconnection investment. Furthermore, as having high hydro
potential, Georgia expects to import electric power not only to Turkey but also to
other Balkan countries via utilizing Turkey’s ENTSO/E interconnection. Same
reasoning can be applied for the case of Azerbaijan due to the natural gas supplies in
the country. On the technical bases, security and reliability of supply clearly increase
in the region with the implementation of this project. Both Georgian and Azerbaijani
power systems are small and relatively weak compared to Turkish one. In case of a
major disturbance, Turkey can be utilized as a hot reserve in order to ensure
continuity of supply. Here, it should be noted that the type of interconnection is
asynchronous which means that no stability enhancement should be expected by this
interconnection project unless auxiliary controls are embedded and tuned in HVDC
controls for this typical situation. However, if such controls are implemented, there
will be other technical benefits, such as reserve sharing and oscillation damping, can

11
also be utilized. As the HVDC technology is capable of increasing and decreasing
power exchange in milliseconds, it can be utilized for such oscillation damping
purposes in case of any need in the power system.
In conclusion, both technical and economic considerations indicate that the
interconnection based on a HVDC B2B scheme between Georgia and Turkey is
beneficial and valuable for Southern Caucasus countries. This project is now in the
realization phase and expected to serve as a power bridge between Caucasus
countries in the following years.
2.2. Utility Requirements, Expectations and Need for SPS
Application
As being one of the most significant energy source, electricity is todays driving
source in all around the world. Exponential development in technology forces
electricity to be supplied in higher amounts and increased quality. In order to
compete with this challenge, electricity grids should be improved to achieve constant
supply quality. As being one of the developing countries, Turkish electricity system
has been improved significantly during last decades. Average annual increase rate in
the electricity demand in Turkey is 7% which means that the need for electricity is
expected to be doubled in a 10 years period. However, it is not easy to maintain both
security of supply and quality of service as expected. Since demand and generation
centers have substantial distance due to primary power source location, grids have to
face with several challenges in maintaining the service. These challenges such as
right of way, geographical conditions, economics, etc. introduce complex problems
which require optimal solutions.
An example of this situation exists in Northeastern region of Turkey. As indicated in
Section 2.1, electricity import is planned via HVDC Interconnection between
Georgia and Turkey through one of the most congested transmission corridors in
Turkey. A brief outlook to the region has shown that;

12
North Black Sea and Eastern Anatolian region are among the power exporter
regions in Turkey with a net consumption of 2490 MW whereas installed
generation capacity is 7721 MW [9].
Even by a deductive approach, there are two basic transmission routes
connecting the generation in the region of interest to the load centers in
Turkey, as illustrated in single line diagram given in Appendix A. The total
thermal capacity of those two transmission paths is about 3000 MW, whereas
the generating capacity (installed capacity, planned for 2013) in the region is
7721 MW.
Almost all the generators around the region are hydraulic type (many are run-
of-river type). Although dispatch of the generating units in Turkey is
subjected to system security and electricity market conditions, it is reasonable
to assume that a considerable amount of generation is to be dispatched from
that region, particularly during spring and initial summer periods, given the
hydrological conditions and competitiveness of those generating units.
Considering these facts, it is essential that the planned HVDC B2B interconnection
between Turkey and Georgia should be carefully investigated in order to ensure
secure operation of the power system. In order to determine secure transfer limits
rather than physical capacities of these B2Bs, a detailed feasibility study is conducted
to analyze the effects of different levels of power import from Georgia to Turkey on
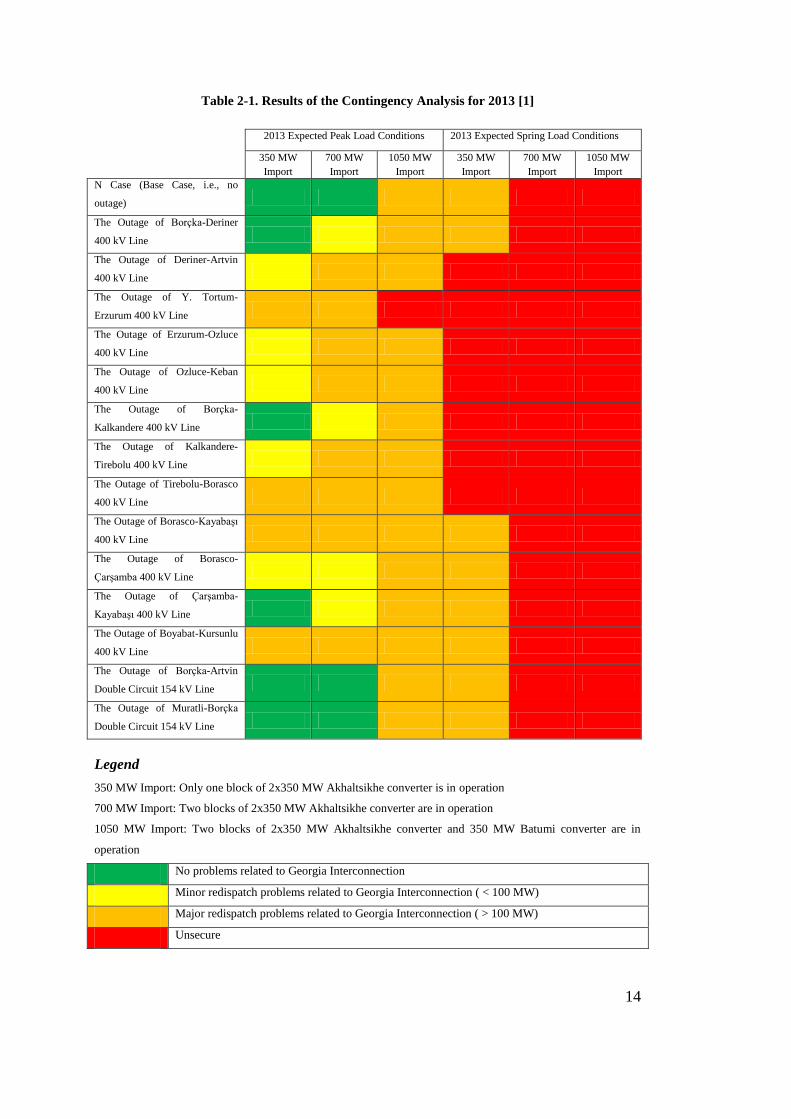
the possible transmission bottlenecks in Turkish network [1]. Results of this study
are presented in Table 2-1 where color coding in the table indicates the effect of
contingencies on electricity transmission system security in the region. In this
presentation, examined cases are classified as follows;
Cases colored with minor re-dispatch mark indicate situations where
generation rearrangements smaller than 100 MW are required to maintain
safe operation.
Cases colored with major re-dispatch mark indicate situations where
generation rearrangements larger than 100 MW are required to maintain safe
operation.

13
Cases colored with unsecure mark indicate situations where base case itself
requires generation rearrangements larger than 100 MW and further
consideration in the grid is required to manage such level of import.
Results of this study clearly indicate that even 350 MW of import from Georgia to
Turkey is insecure for the year 2013. Hence, this report suggests that the initial
power export should not exceed 350 MW even under best transmission system
conditions and re-dispatching might be necessary in this region as a short term
measure to resolve the transmission bottleneck.
Results also imply that the net transfer capacity (NTC) between Georgia and Turkey
is zero during the spring season and it may be the case for other seasons due to n-1
security criterion in NTC calculation. From an economical point of view, zero
exchange for certain months will be a huge burden for both investors and electricity
traders who desire to benefit from this investment. Considering the price difference
between Georgian and Turkish electricity markets, zero exchange is the worst
scenario for both countries as well.
14
Table 2-1. Results of the Contingency Analysis for 2013 [1]
2013 Expected Peak Load Conditions 2013 Expected Spring Load Conditions
350 MW
Import
700 MW
Import
1050 MW
Import
350 MW
Import
700 MW
Import
1050 MW
Import
N Case (Base Case, i.e., no
outage)
The Outage of Borçka-Deriner
400 kV Line
The Outage of Deriner-Artvin
400 kV Line
The Outage of Y. Tortum-
Erzurum 400 kV Line
The Outage of Erzurum-Ozluce
400 kV Line
The Outage of Ozluce-Keban
400 kV Line
The Outage of Borçka-
Kalkandere 400 kV Line
The Outage of Kalkandere-
Tirebolu 400 kV Line
The Outage of Tirebolu-Borasco
400 kV Line
The Outage of Borasco-Kayabaşı
400 kV Line
The Outage of Borasco-
Çarşamba 400 kV Line
The Outage of Çarşamba-
Kayabaşı 400 kV Line
The Outage of Boyabat-Kursunlu
400 kV Line
The Outage of Borçka-Artvin
Double Circuit 154 kV Line
The Outage of Muratli-Borçka
Double Circuit 154 kV Line
Legend
350 MW Import: Only one block of 2x350 MW Akhaltsikhe converter is in operation
700 MW Import: Two blocks of 2x350 MW Akhaltsikhe converter are in operation
1050 MW Import: Two blocks of 2x350 MW Akhaltsikhe converter and 350 MW Batumi converter are in
operation
No problems related to Georgia Interconnection
Minor redispatch problems related to Georgia Interconnection ( < 100 MW)
Major redispatch problems related to Georgia Interconnection ( > 100 MW)
Unsecure
15
Surely, in order to resolve these issues, new transmission system investments (i.e.,
third 400 kV transmission corridor in the region) are required. However, according to
the master plan of Turkish power system [7], third transmission corridor connecting
Borçka SS to Keban SS, where some of the high capacity transmission lines
connecting Southern Anatolian region to load centers around İstanbul originates, will
be realized in 2016. Until then, the transmission bottleneck will exist and get worse
as new HVDC B2B blocks and regional generation investments will be realized
during upcoming years.
Considering these facts and future developments in the region, expansion in the
transmission capacity of the current infrastructure by using an intelligent protective
system seems to be the only viable solution. These systems are called special
protection schemes (SPS) which are designed to ensure power system security during
abnormal conditions and contingencies. The main purpose of SPS is to mitigate the
consequence of abnormal conditions via initiating a series of pre-planned corrective
actions. The need for such a system has also been emphasized in [1]. Furthermore,
the utilization of SPS in the region will enable to monitor system conditions in n and
n-1 conditions, hence will provide prevention from cascaded outages that may result
in a regional system blackout. As a result, transmission capacity of the system which
is dependent to the n-1 security can be increased in a controlled manner.
2.3. SPS Applications around the World and State of Art in
SPS Installations
As the existing transmission system infrastructure is challenged to support loads
beyond original design limits, SPS applications are required to maintain power
system security and reliability. Today, many transmission utilities prefer SPS
deployment in order to resolve complex network problems and enhance system
integrity. SPS survey studies [10] [11] [12] have shown that the implementation of
these schemes has grown significantly as given in Table 2-2.

16
Table 2-2. SPS survey studies
1989 Survey 1996 Survey 2009 Survey
Respondents Schemes Respondents Schemes Respondents Schemes
18 93 49 111 110 958
SPSs are generally tailored for specific needs of utilities. In Hydro Quebec, remote
load shedding system (RLSS) is a decent example. The main aim of this SPS is to
preserve system frequency stability. The RLSS is triggered by extreme contingencies
detection system which is responsible for monitoring 735 kV grid constantly. In case
of a disturbance, amount of load shedding required to ensure system stability is
calculated automatically and shed order sent to available distribution substations
[13].
Bonneville Power Administration utilizes SPS in order to keep up system integrity in
Pacific NW and California. This scheme works based on trip matrix approach in
which pre-determined transfer trip signal is sent to substations and plants, namely
load shedding, based on the place of the contingency. Moreover, it is supported with
wide area measurements from PMU’s in several locations. Hence, combination of
response based and event based SPS system is implemented [14].
In BC Hydro, SPS deployment improves the system reliability and expands
transmission infrastructure limits. In this scheme, transient stability assessment is
performed in systematic intervals and suitable control actions such as load/generation
shedding, line tripping etc. are orchestrated by SPS controller. This automatic system
improves grid security and reliability significantly as it ensures system security in
transient, voltage and frequency stability issues [15] [16].
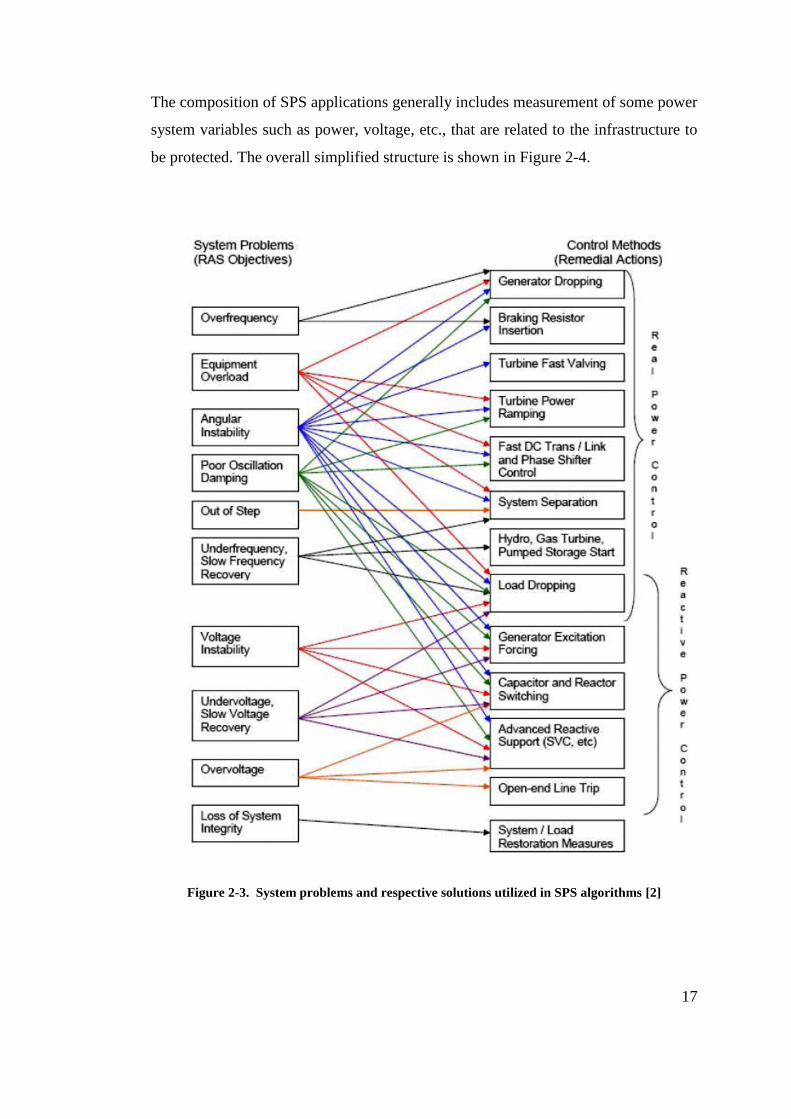
There are several other utilities using SPS for problems ranging from single
contingency protection to complete network stability assessment and protection.
Figure 2-3 shows the system problems that can be addressed effectively and
economically using SPS, and corresponding countermeasure to relief the system
stress.
17
The composition of SPS applications generally includes measurement of some power
system variables such as power, voltage, etc., that are related to the infrastructure to
be protected. The overall simplified structure is shown in Figure 2-4.
Figure 2-3. System problems and respective solutions utilized in SPS algorithms [2]

18
Figure 2-4. General structure of a special protection scheme [2]
2.4. Thesis Contribution
As defined in earlier chapters, requirements for intelligent protective devices to
enhance power transmission capacity constitute the main motivation of this thesis
study. Today, many power utilities successfully implemented these protection
schemes in their grids both for capacity and security enhancement. As being a
developing country, substantial growth in electricity demand may also lead other
SPS installations in Turkish power system considering the slow pace of transmission
investment realizations in Turkey.
The requirement for SPS stems from complex transmission problems; hence the
design should be specifically tailored to fulfill these requirements. In other words,
there is no on the shelf product that exists for SPS. Therefore, detailed engineering
work is required to design such systems. One of the outcomes of this thesis is the
development of such a new protection scheme in order to enhance security of
Turkish electricity grid, thereby reduce the risk of black/brown out in congested
areas via increasing the transmission capacity.

19
This study will also aim to develop valuable know-how in a relatively new subject
for Turkish power system considering the current and future developments in the
grid.
The design process involves several power system analyses that deeply investigate
and examine the need for SPS in Turkish power system. In order to perform these
studies, detailed regional grid model that includes static, dynamic and protection
models of existing power system elements is formed. Analysis studies are then
performed and requirements along with constraints are obtained.
In this perspective, a wide area measurement based special protection scheme is
developed. The proposed scheme continuously monitors system variables and detects
anomalies in the power system. In case of necessity, especially during abnormal
conditions, the proposed scheme provides efficient countermeasures in order to
prevent system security.
The scheme is based on synchronous regional system wide measurements via phase
measurement units (PMU). Today, many modern power networks intend to
implement PMU’s in order to enhance observability in their grids. Such
measurements clearly assist power utilities to understand the needs of their grids,
hence increase power quality supplied to the customers. Therefore the proposed SPS
is designed to utilize such PMU’s in order to increase benefits. In addition, TEİAŞ
has already developed and implemented a number of PMU’s during National Power
Quality Project. Utilization of such a domestic product is also a preferred choice in
the SPS development which mutually increases the value of these products.
Furthermore, considering the availability of such products and qualified engineering,
it is evident that more advanced and sophisticated products can be developed. Hence,
this study is thought to be a flat start for national EMS and desired to be improved in
this manner.

20

21
CHAPTER 3
FUNCTIONAL REQUIREMENT ANALYSIS AND
DESIGN OF WIDE AREA MEASUREMENT BASED
SPS
In this chapter, grid modelling and scenario building is given for several power
system analysis. After, static security analyses are conducted in order to investigate
both weak points of the grid and related solutions regarding to this weak points.
Further, power quality analyses are performed to identify whether HVDC operation
is maintained under all grid conditions or not. This chapter also includes transient
stability analysis of the network without SPS implementation which is the core of the
design study. Transient stability studies indicate that the regional grid has the risk of
instability even without any power import from Georgia. Finally, according to the
analysis conducted, requirements of SPS are defined and step by step design process
is introduced.
3.1. Analysis Scenarios and System Modelling
3.1.1. Scenario Determination
Almost every power system analysis study requires a certain degree of mathematical
modelling process. Degree of the modelling is determined based on analysis
requirements and application range in order to optimize the engineering work and
time. Unfortunately, power system models require lots of engineering work and time
since they are highly complex and considerably huge models. In SPS design

22
study such an approach is utilized during the modelling and analysis process. In
Turkey, grid planning scenarios are generally based on summer peak, winter peak
and spring minimum loading conditions. Given the hydraulic conditions in the region
during the spring and occurrence of recent Turkish annual peak loading in summer,
the most important scenarios for Turkey in the sense of secure energy import form
Georgia are envisaged to be determined by summer peak and spring minimum
loading conditions. Depending on the network conditions as well as transmission line
and substation investments, the analysis results of those two scenarios are assumed to
provide upper and lower limits of secure power transfer from Georgia to Turkey.
Given the expected in service time of the HVDC blocks is 2013 summer, the summer
scenario is produced based on Summer 2013 loading conditions and the spring
scenario is produced based on Spring 2014 loading conditions.
On the other hand, although generation dispatch schemes in these two scenarios are
different due to the seasonal effects on water regime and loading conditions, further
proliferation in generation dispatch schemes is required in order to examine all
possible grid conditions that may be faced during grid operation. However, as the
region includes more than 250 generators, generation dispatch schemes should be
reduced to reasonable number in order to facilitate evaluation of results. Considering
the effects of generation dispatch scheme in the sense of dynamic and static analyses,
generation level is obviously the most important variable. In this perspective, it is
wise to limit generation dispatch possibilities to the ones formed utilizing large scale
generation facilities which are relatively higher effect in the analyses. This
assumption reduces generation dispatch possibilities to the several combinations of
generation levels for;
HVDC B2B ( 2 x 350MW )
Borçka HPP ( 2 x 150 MW )
Deriner HPP ( 4x 167.5 MW)
Samsun OMV NGCCPP (870 MW on two blocks)

23
Moreover, generation dispatch schemes can be further narrowed considering the
dependency of hydraulic plants to the water regime which is affected by seasons.
When the historical records for utilization factor of the regional hydraulic plants are
investigated (which will be presented in Section 3.1.3.2 in detail), it is discovered
that almost 60 - 70 % of large scale hydraulic power plants are dispatched during
spring and summer loading conditions respectively. However, in order to be on the
safe side, generation levels for Borçka and Deriner HPPs are set according the levels
shown in Table 3-1. In the meantime, generation dispatch possibilities for Samsun
NGCCPP are determined according to the summer and spring loading conditions. As
given in Table 3-1, generation dispatch possibilities for Samsun NGCCPP in summer
scenario are reduced to either fully dispatched or partially dispatched considering the
high demand due to peak conditions. On the other hand, in spring scenarios, due to
the low demand and the substantial hydraulic potential, it is assumed that Samsun
NGCCPP is either partially dispatched or not dispatched. Finally, 3 power import
scheme possibility for the HVDC is investigated considering the 2 block structure of
the HVDC substation. As a result, total number of scenarios investigated in analysis
is reduced to 12.
Table 3-1. Generation dispatch schemes considered in the analyses
Plant\Scenario Summer Scenario Spring Scenario
Borçka HPP 2 units (300 MW) 2 units (300 MW)
Deriner HPP 3 units (502 MW) 4 units (670 MW)
Samsun NGCCPP 1/2 blocks (435/870 MW) 0/1 blocks (0/435MW)
HVDC B2B 0/1/2 blocks (0/350/700 MW) 0/1/2 blocks (0/350/700 MW)
In the lights of the scenarios and generation dispatch schemes, the following naming
convention is demonstrated in analysis results in order to ease the understanding.
Sum – G2 S1
Number of units in Samsun NGCCPP (range 0-2)
Number of blocks in HVDC (range 0-2)
Loading Scenario (Summer\Winter)

24
3.1.2. Modelling Environment
Computer aided simulation and modelling tools are inevitable parts of the power
system studies. These programs significantly reduce time and cost of the studies
while offering great variety of analysis functions. There are 2 simulation programs
used for modeling, namely;
PSS\E, power system simulator program used for static load flow and
SCMVA calculations
Digsilent PF, power system simulator program used for dynamical studies
and SPS modelling and analysis process.
There exist several advantages and disadvantages between these two simulation
programs in terms calculation and modeling capabilities, hence study benefit from
utilizing two power system simulation programs.
Benefits of these tools can further be increased with the utilization of automatization
codes. Using this computational power, required calculations can be conducted
utilizing for loops which enable to study several scenarios within reasonable time
and effort. For example, calculation of the transient stability for all branches in the
region for several scenarios requires hundreds of calculations which requires
considerable time and effort; however, it is important to analyze all possible
conditions in SPS design analysis. Therefore automatization codes of these
simulation programs, namely Python and DPL, are utilized in analysis studies.
3.1.3. Turkish Regional Grid Model
3.1.3.1. Region under Consideration
Through the analysis, the focus is given to the Black Sea and Eastern Anatolian
Region of the Turkish grid given that the location of the connection is near Borçka
SS. In other words, Northeastern part of the Turkish network is reduced from 400 kV
Kurşunlu, Kayabaşı and Keban substations as shown in Figure 3-1. The single line
diagram regarding the reduced region can also be found in Appendix A.

25
Figure 3-1. Electrification map of regional model used in design studies

26
3.1.3.2. Generation Profile in the Region
In Figure 3-2, the generating facilities (red circles) either in operation or construction
or planned, together with the main load centers (yellow circles) and the expected
main transmission routes in 2013 (black lines) related to the Georgia Interconnection,
are illustrated. Given considerable amount of generation with respect to consumption
of the region itself, it is essential that there is (and will be) a unidirectional power
flow from the Black Sea Region to the load centers located in the Southeastern
Anatolian Region, Ankara Region and the Marmara Region (Istanbul, Adapazari).
Figure 3-2: The basic transmission routes related to Georgia Interconnection (blue line: Muratli
– Batumi line representation; red line: Borçka – Akhaltsikhe line representation, black lines:
expected transmission highways in 2013, red circles: major generating facilities, yellow circles:
major load centers).
Almost all the generators around the region are hydraulic type (many are run-of-river
type), therefore, considering the water regime it is reasonable to assume that a
considerable amount of generation is to be dispatched particularly during spring and
initial summer periods, although dispatch of the generating units in Turkey is

27
subjected to system security and electricity market conditions in Turkey. This
assumption is further supported by historical records of generation among the region
which is presented in TEİAŞ grid master plan generation scenarios report [17].
According to this report, the seasonal loading conditions of the generators in the
region are summarized in Table 3-2. In addition expected growth in total small scale
hydraulic electricity generation is given in Table 3-3.
Table 3-2. Utilization factor of regional generators
Summer Scenario Spring Scenario
Dam Type Hydraulic Generation (large
scale HPPs) 70 % 60 %
Run of River Type Hydraulic
Generation (small scale HPPs) 35 % 90 %
Other Generation Facilities 50 % 10 %
Table 3-3. Total foreseen small hydraulic generation capacity in the region [17]
Year Expected total small scale hydraulic electricity generation
(installed) capacity
2013 ~4125 MW
2015 ~5100 MW
2017 ~6300 MW
3.1.3.3. Key transmission line and Substation Investments
Key transmission line and substation projects which are assumed to be completed by
the corresponding years in sequence are summarized in Table 3-4. This table is based
on TEİAŞ grid master plan [7].

28
Table 3-4. Key planned transmission system investments [7]
Realization Year Investments
2013 Kalkandere 400 kV substation
2013 Borçka-Kalkandere 400 kV Tr. Line
2013 Kalkandere- Tirebolu Series Capacitor
2013 Borçka-Artvin and Artvin-Y. Tortum 154 kV double circuit Tr. Lines
2013 Agri-Van 400 kV Tr. Line
2014 Altınkaya-Boyabat 400 kV Tr. Line
2014 Arkun-Y. Tortum 400 kV Tr. lines
2014 Y. Tortum 400/154 kV. transformers
2014 Van-Siirt 400 kV Tr. Line
2014 Kayabaşı-Samsun NGCCPP 400 kV Tr. Line
Beyond these investments, interconnection project also includes AC transmission
line investment between Borçka to Akhaltsikhe in order to complete interconnection
between countries. The technical specifications regarding to this line are (see Figure
2-2);
Ubase = 400 kV
Type and cross-section of conductor : 3B Cardinal 954 MCM
Length = ~160 km effective length
Rated current (thermal limit) = 3144 A
Rated power (thermal limit) = 2178 MVA
Series resistance = 0.0208 Ω/km per phase
Series reactance = 0.266 Ω/km per phase (the line is assumed to be perfectly
transposed)
Charging susceptance = 4.31 µS/km per phase
3.1.4. Georgian Grid Model
Akhaltsikhe 500 kV SS and Batumi 220 kV SS are modeled as infinite buses to
model Georgian Grid in the analysis (i.e., the security analysis are only performed
for the Turkish transmission system). That is, both substations in Georgia are

29
assumed to have a sufficient SCMVA to provide a secure power transfer from
Georgian network to Turkey.
3.2. Static Security Analysis
In this chapter static security analysis results of regional Turkish grid model is
introduced. These analyses consist of base case and n-1 contingency calculations in
order to assess existing and expected constraints of regional grid. These calculations
identify not only the constraints of the region but also give idea about reasons that
cause element overloads and over/under voltages in region. In addition, solutions that
are relaxing grid constraints are investigated.
Contingency analysis is an important part of the SPS design studies as the main aim
of SPS is to maintain secure operation of the grid following a disturbance. For any
contingency, SPS must know whether grid can withstand the related contingency or
not in order to decide what action should be taken to prevent system from collapse.
In addition analysis should show whether grid has any overloads or any critical
voltage, angle values in case of such conditions. For this purpose contingency
analysis should answer the effects and causes of any contingency in the system of
interest.
3.2.1. Base Case and Contingency (n-1) Analysis
According to the Turkish grid regulations [18], Turkish power system must be
designed to comply with the n-1 criterion, that is under normal operating conditions,
any element of the grid should not be overloaded and grid should maintain secure
operation in case of any contingency in the system. However, due to the undesired
delays in transmission investments, element overloads can be observed in Turkish
grid. These problems are solved in real time grid operation by re-dispatching of
generating units. However, in this design study any possible constraint should be
identified in order to design SPS system which ensures static security of the grid in
all possible conditions.

30
Although element overloads have top priority and are most important indices in the
assessment of static security, their evaluation is not sufficient to say that system is
secure and stable. Especially in the case of long transmission lines, the angle
difference between adjacent busbars is also an important and required index to
evaluate static security. Where the transmission line length is above 320 km, which is
the case for Turkish regional grid, transmission line limitation is due to small signal
stability limit rather than its thermal limit as shown in Figure 3-3. Considering the
substantial distance between Borçka and Keban (about 500 km), angle difference
between these substations is also calculated in contingency analysis. Here, one may
claim that these substations are not adjacent; nevertheless, busbars between these
substations either are not connected or cannot capable of controlling voltage. Hence
this angle difference is of importance in static security assessments.
There are also reported transmission line capacity degradation that exist in lines
between Altınkaya, Kayabaşı and Çarşamba. This triangle is located in the end of the
Borçka - Çarşamba 400 kV transmission corridor as shown in Figure 3-4. According
to the information taken from TEİAŞ, transmission line capacity between Kayabaşı
and Çarşamba is limited to 1100 MW (thermal limit is 1524 MW) due to the
protection element constraints on that line. Hence the power flow on that line is also
privately considered in calculations.

31
Figure 3-3. Transmission line loadability curve [19]
Figure 3-4. Kayabaşı – Altınkaya - Çarşamba 400 kV triangle

32
Under these considerations, n-1 analysis is performed for the grid model with the
following assumptions;
Dispatch of generating units in the region are adjusted according to TEİAŞ
Master Plan [7].
All existing and planned transmission lines for year 2103 are assumed to be
in service.
Since the grid model has more than 250 lines and 250 generators,
contingencies are limited to 400 kV transmission line level which is 20 in
total in the reduced model. The main problem of the region is the lack of
sufficient transmission capacity, hence, generator outages are not considered
as the loss of a generating unit relieves the system constraints.
Although contingencies are limited to 400 kV transmission line level, 154 kV
line loadings as a result of these contingencies are also considered since
cascaded line opening possibility exists in 154 kV transmission lines.
In addition to the contingencies, 12 predefined solutions which are presented in
Table 3-5 are also calculated for every contingency case in order to seek candidate
solutions that may relive the overloading problems in the region that are originated
by the related contingency. Utilization of this approach both illuminates the solutions
that mitigate regional constraints and helps to envisage countermeasure alternatives
which will be utilized in SPS design. Therefore, in the analysis, effects of the
contingencies and predefined solutions are investigated in the same time following a
defined check list type manner in order to obtain statistical results. As the number of
contingencies is quiet high for manual calculation, an automated python code is
developed to conduct contingency analysis. With this utilization;
Calculation time is reduced.
Results are shown in a compact way.
Pre and post contingency values of selected elements can be seen easily.
20 contingencies and 12 predefined solutions for each scenario and each
generation dispatch scheme are automatically calculated.

33
Table 3-5. Set of predefined solutions
Generation Drop From
Sol. Number Sol. Name Altınkaya HPP Borçka HPP Deriner HPP Samsun NGCCPP HVDC
0 Contigency - - - - -
1 Sol. d1 - - 1 unit (167 MW) - -
2 Sol. g1 - - - - 1 block (350 MW)
3 Sol. g1d1 - - 1 unit (167 MW) - 1 block (350 MW)
4
Sol.
g1d1b1 - 1 unit (150 MW) 1 unit (167 MW) - 1 block (350 MW)
5 Sol. g2 - - - - 1 blocks (700 MW)
6 Sol. g2d1 - - 1 unit (167 MW) - 1 blocks (700 MW)
7
Sol.
g2d1b1 - 1 unit (150 MW) 1 unit (167 MW) - 1 blocks (700 MW)
8 Sol. s1 - - - 1 block (435 MW) -
9 Sol. s1a2 2 units (350 MW) - - 1 block (435 MW) -
10 Sol. s1g1 - - - 1 block (435 MW) 1 block (350 MW)
11 Sol. s1g1a2 2 units (350 MW) - - 1 block (435 MW) 1 block (350 MW)
12 Sol. s1g2 - - - 1 block (435 MW) 1 blocks (700 MW)
The results of the python code for an example contingency condition are shown in
Table 3-6. In this example case, transmission line between Borçka and Kalkandere is
opened during 700 MW of power import from Georgia to Turkey. When the base
case and contingency results are compared, it is clearly seen that power flow is
directed to Borçka - Erzurum 400 kV corridor as the other corridor is assumed to be
open. Although no overloads are observed in important 400 kV transmission lines,
angle difference between Borçka to Keban is increased to 60 degrees which shows
that this case is practically unacceptable. In addition, overloads in the 154 kV
network are shown in Table 3-7. This table identifies that under contingency
situations there are critical 154 kV transmission line overloads which may result in
opening the line by overload protection relays.
The effects of the predefined solutions are also presented in Table 3-6. These
calculations clearly show which predefined solution alternative is most likely to
mitigate overloading problem in the regional grid after the contingency situation. As
explained, these predefined solutions are developed in parallel with possible SPS

34
countermeasures in order to give insight to SPS design. For the example case given,
third solution (highlighted in green rectangle), which is dropping of a block from
HVDC, is seem to resolve both angle difference and overload problems after the
contingency that can be considered as stable in steady state sense; hence, this
solution is accepted as possible countermeasure alternative for SPS in case of the
corresponding contingency case. Utilizing this approach, the contingencies for
different import conditions are examined and summarized in following sections.

35
Table 3-6. Example static security assessment table (contingency and predefined solutions)
Case
ID 721111_723010_2 Borçka-Kalkandere
Georgia HVDC Power Transfer 700 MW
Load Flow and Contingency Analysis Results
Predefined Solutions >>
0 1 2 3 4 5 6 7 8
Base Case Contingency Contingency
+ Solution d1
Contingency
+ Solution g1
Contingency +
Solution g1d1
Contingency +
Solution g1d1b1
Contingency +
Solution g2d1
Contingency +
Solution g2d1b1
Contingency +
Solution s
Contingency +
Solution sa2
Branch
Flows (MW)
Borçka - Kalkandere 595.7 0.0 0.0 0.0 0.0 0.0 0.0 0.0 0.0 0.0
Kalkandere - Tirebolu 559.4 220.2 189.9 155.8 125.7 97.8 90.5 60.2 31.9 254.1
Tirebolu - Samsun 595.0 342.0 309.9 273.7 241.6 211.9 204.2 171.7 141.4 396.6
Samsun - Çarşamba 1336.0 1088.3 1056.7 1021.0 989.3 959.9 952.3 920.1 890.0 632.5
Çarşamba - Altınkaya 486.3 388.8 374.9 359.3 345.3 332.4 329.1 314.9 301.7 223.2
Çarşamba - Kayabaşı 1004.3 871.2 852.3 830.9 811.9 794.1 789.6 770.1 751.9 644.8
Altınkaya - Kayabaşı 896.5 800.0 786.3 770.8 757.0 744.2 741.0 726.9 713.8 639.6
Borçka - Deriner 332.5 669.7 722.2 440.6 489.5 386.2 200.4 246.7 141.6 645.8
Tortum - Erzurum 821.4 1148.3 1038.3 926.8 812.2 711.2 692.1 574.2 470.6 1125.4
Erzurum - Agri 242.8 277.6 265.4 253.3 240.7 229.8 227.8 214.9 203.5 274.0
Erzurum - Ozluce 561.1 764.8 686.2 603.6 519.9 444.6 429.2 341.7 263.5 732.8
Ozluce - Keban 618.6 782.4 720.2 653.9 585.6 523.5 510.8 437.8 372.0 758.3
Angles
(degree)
Borçka 71.2 88.4 80.5 71.7 64.0 56.9 55.1 47.5 40.4 80.1
Samsun 50.2 45.7 43.5 41.1 38.8 36.7 36.2 33.8 31.6 33.0
Çarşamba 47.1 43.2 41.1 38.8 36.5 34.5 34.0 31.7 29.5 31.5
Deriner 70.4 86.7 78.7 70.6 62.8 56.0 54.6 46.8 40.0 78.5
Erzurum 53.7 62.3 57.0 51.6 46.4 41.7 40.8 35.5 30.7 54.7
Ozluce 41.7 44.8 41.8 38.5 35.3 32.4 31.7 28.3 25.3 38.2
Keban 32.6 33.0 31.0 28.9 26.7 24.7 24.3 22.0 19.9 26.8
Angle Dif. Borçka - Keban 38.6 55.3 49.5 42.8 37.3 32.2 30.8 25.5 20.5 53.3

36
Table 3-7. Example static security assessment table (line overloading)
Overloads Exist in Contingency Case
From Bus Name kV Area To Bus Name kV Area Ckt ID loading (MW) Rating Loading (%) Solution
712421 ADILCEVAZ 154.00* 71 713021 TATVAN 154 71 1 149,2 110 135,6 0
720021 ARDESEN 154.00* 72 720821 RIZE 154 72 1 217,7 153 142,3 0
720021 ARDESEN 154.00* 72 721421 CAYELI 154 72 1 199,6 153 130,4 0
720021 ARDESEN 154 72 724521 CAMLICA 154.00* 72 1 225,5 153 147,4 0
720021 ARDESEN 154 72 724521 CAMLICA 154.00* 72 2 225,5 153 147,4 0
720621 HOPA 154 72 721021 MURATLI 154.00* 72 1 247,9 206 120,4 0
720621 HOPA 154 72 721021 MURATLI 154.00* 72 3 247,9 206 120,4 0
720621 HOPA 154.00* 72 724521 CAMLICA 154 72 1 207 153 135,3 0
720621 HOPA 154.00* 72 724521 CAMLICA 154 72 2 207 153 135,3 0
720821 RIZE 154.00* 72 721221 IYIDERE 154 72 1 178,9 110 162,6 0
721110 4BORÇKA 380.00* 72 721121 BORÇKA 154 72 1 389,1 300 129,7 0
721221 IYIDERE 154 72 721421 CAYELI 154.00* 72 1 185,7 153 121,4 0
712421 ADILCEVAZ 154.00* 71 713021 TATVAN 154 71 1 138,9 110 126,2 1
720021 ARDESEN 154.00* 72 720821 RIZE 154 72 1 193,7 153 126,6 1
720021 ARDESEN 154.00* 72 721421 CAYELI 154 72 1 175,9 153 115 1
720021 ARDESEN 154 72 724521 CAMLICA 154.00* 72 1 201,6 153 131,7 1
720021 ARDESEN 154 72 724521 CAMLICA 154.00* 72 2 201,6 153 131,7 1
720621 HOPA 154.00* 72 724521 CAMLICA 154 72 1 183,8 153 120,1 1
720621 HOPA 154.00* 72 724521 CAMLICA 154 72 2 183,8 153 120,1 1
720821 RIZE 154.00* 72 721221 IYIDERE 154 72 1 153,8 110 139,8 1
721110 4BORÇKA 380.00* 72 721121 BORÇKA 154 72 1 334,1 300 111,4 1
712421 ADILCEVAZ 154.00* 71 713021 TATVAN 154 71 1 128,5 110 116,8 2
720021 ARDESEN 154 72 724521 CAMLICA 154.00* 72 1 176,1 153 115,1 2
720021 ARDESEN 154 72 724521 CAMLICA 154.00* 72 2 176,1 153 115,1 2
720821 RIZE 154.00* 72 721221 IYIDERE 154 72 1 127,9 110 116,3 2
712421 ADILCEVAZ 154.00* 71 713021 TATVAN 154 71 1 145,3 110 132,1 6
720021 ARDESEN 154.00* 72 720821 RIZE 154 72 1 227,7 153 148,8 6
720021 ARDESEN 154.00* 72 721421 CAYELI 154 72 1 213,2 153 139,4 6
720021 ARDESEN 154 72 724521 CAMLICA 154.00* 72 1 237,4 153 155,2 6

37
3.2.2. Summer Scenario Results
Static security assessment regarding summer scenario is given in Table 3-8. In the table,
effects of contingencies for several generation dispatch schemes in summer scenario are
colored in order to ease evaluation process. In this presentation examined cases are
classified according to the effect of contingency on electricity transmission system security
in the region. Color coding regarding to this examination is defined as follows;
Cases marked with no convergence (red) indicate situations where solution for
base case in this generation dispatch scheme can not be found. This does not
mean that solution does not exists rather means that large generation re-dispatch
is required.
Cases marked with major 154 kV and 380 kV overloading (pink) indicate
situations where lines operating in both voltage levels are overloaded more than
120 %.
Cases marked with major 154 kV and minor 380 kV overloading (orange)
indicate situations where lines operating in 154 kV voltage level are overloaded
more than 120 % while lines operating in 380 kV voltage level are overloaded in
the range of 100 - 120 %.
Cases marked with major 154 kV overloading (yellow) indicate situations where
lines operating in 154 kV voltage level are overloaded more than 120 %.
Cases marked with major 154 kV overloading (green) indicate situations where
lines operating in 154 kV voltage level are overloaded in the range of 100 – 120
%.
In addition to the color coding scheme, predefined solutions which are likely to mitigate
the effect of the contingency are also presented. These solutions are based on predefined
solution set which are indicated in earlier chapters (see Table 3-5). It is important to
mention that solutions presented here is not optimized to any contingency and not
necessarily mitigate the effect of particular contingency totally. These predefined

38
solutions are based on possible countermeasures that may be utilized in SPS design.
Therefore, investigating the comparative effects of presented solutions rather than their
quantities is a much correct approach. It is also seen that in some cases, predefined
solution effect is not applicable which are identified by ‘NA’. This mark does not mean
that solution does not exist for this particular contingency case, rather this means
predefined solutions is not effective for the particular contingency.
Results for summer scenario have shown that;
There are element overloads exist even in the base case which should be resolved
by new transmission investments.
In case of any line loss in Altınkaya - Çarşamba - Kayabaşı 400 kV triangle, the
load on the remaining lines in the triangle increases. In addition, overloading
condition cannot be solved by generation shedding from Borçka region.
Therefore, local solutions such as generation shedding from Altınkaya or Samsun
NGCCPP should be considered. It is an important observation for the SPS design
as the SPS countermeasure logic should include Çarşamba region generators.
Most critical contingency in that scenario is the loss of line between Çarşamba
and Samsun NGCCPP substations. In such a case power flow from Borçka-
Çarşamba corridor is reversed. Hence, 154 kV grid close to Samsun NGCCPP is
highly overloaded. As a result, predefined solution with higher generation
shedding is observed.
Loss of any line on Borçka - Erzurum corridor leads to overloading in both 154
kV grid in north to south plane. In order to resolve this problem predefined
solution with higher generation shedding is observed. In addition, as can be seen
from the color representation, remaining transmission corridors get much more
overloaded parallel to the amount of import from Georgia.
The effect of losing lines on Borçka - Çarşamba corridor is negligible. Similar
conclusion can be made for contingencies after Erzurum substation.

39
Legend
No Convergence
Major 154 kV and Major 400 kV Overloading
Major 154 kV and Minor 400 kV Overloading
Major 154 kV Overloading
Minor 154 kV Overloading
Table 3-8. Transmission line overloading and predefined solution results for summer scenario
Case\Generation Dispatch Scheme G0_S1 G1_S1 G2_S1 G0_S2 G1_S2 G2_S2
Altınkaya-Çarşamba 0 1 3 8 8 10
Altınkaya-Kayabaşı 8 9 11 9 NA NA
Kayabaşı-Çarşamba 8 9 9 9 9 11
Çarşamba-Samsun NGCCPP 1 7 7 8 12 NA
Çarşamba-H.Uğurlu 0 0 0 0 0 1
Ordu-Tirebolu 0 0 2 0 0 2
Ordu-Samsun NGCCPP 0 0 2 0 0 2
Tirebolu- Tirebolu Series Cap. 0 0 2 0 0 1
Tirebolu Series Cap.-Kalkandere 0 0 2 0 0 1
Borçka-Kalkandere 0 0 1 0 0 1
Bocka-Deriner 0 0 0 0 0 2
Deriner-Artvin 0 4 4 1 6 6
Artvin-Yusufeli 0 4 4 1 6 6
Yusufeli-Tortum 0 4 4 1 6 6
Erzurum-Tortum 0 4 4 1 6 6
Erzurum-Özlüce 0 4 4 1 4 4
Erzurum-Horasan 0 0 0 0 0 1
Ağrı-Horasan 0 0 0 0 0 1
Ağrı-Van 0 0 0 0 0 1
Van-Başkale 0 0 0 0 0 1

40
3.2.3. Spring Scenario Results
Static security assessment regarding spring scenario is presented in Table 3-9. Results
have shown that;
The overall picture based on colored representation shows that the grid
conditions get tougher in spring compared to summer.
There are element overloads exist even in the base case which should be resolved
by new transmission investments.
In case of any line loss in Altınkaya – Çarşamba - Kayabaşı 400 kV triangle, the
load on the remaining lines in the triangle increases. In addition, overloading
condition cannot be solved by generation shedding from Borçka region.
Therefore, local solutions such as generation shedding from Altınkaya or Samsun
NGCCPP should be considered. It is an important observation for the SPS design
as the SPS countermeasure logic should include Çarşamba region generators.
Most critical contingency in that scenario is the loss of the line between
Çarşamba and Samsun NGCCPP substations. As can be seen from the table, load
flow solution cannot be attained for several loading conditions. For this
contingency, power flow from Borçka - Çarşamba corridor is reversed. Hence,
154 kV grid close to Samsun NGCCPP is highly overloaded. No predefined
solution seems to mitigate the effects of this contingency.
Loss of any line on Borçka –Erzurum corridor leads to overloading in both 154
kV grid in north to south plane similar to the summer case.
As the generation is higher in spring due to water regime in the region, 154 kV
grid parallel to Borçka - Çarşamba corridor gets overloaded in case of losing any
line on that corridor.
Due to weak 154 kV network around Ağrı area, interruption of power flow from
Erzurum to Van leads to overloading of lines in that area. The solution to this
problem should be local as predefined solution proposals seem to be ineffective.

41
700 MW import from Georgia seems to infeasible as almost all contingency
cases leads to major overloads in Turkish grid.
Legend
No Convergence
Major 154 kV and Major 400 kV Overloading
Major 154 kV and Minor 400 kV Overloading
Major 154 kV Overloading
Minor 154 kV Overloading
Table 3-9. Transmission line overloading and predefined solution results for spring scenario
Case\Generation Dispatch Scheme G0_S0 G1_S0 G2_S0 G0_S1 G1_S1 G2_S1
Altınkaya-Çarşamba 8 12 12 NA NA NA
Altınkaya-Kayabaşı 8 9 11 NA NA NA
Kayabaşı-Çarşamba 7 7 9 8 9 11
Çarşamba-Samsun NGCCPP NA NA NA NA NA NA
Çarşamba-H.Uğurlu 0 0 0 0 4 4
Ordu-Tirebolu 7 7 7 7 7 7
Ordu-Samsun NGCCPP 7 7 7 7 7 7
Tirebolu- Tirebolu Series Cap. 0 0 2 0 0 2
Tirebolu Series Cap.-Kalkandere 0 0 2 0 0 2
Borçka-Kalkandere 0 0 1 0 0 1
Bocka-Deriner 0 0 1 0 5 5
Deriner-Artvin 0 3 4 7 7 7
Artvin-Yusufeli 0 3 4 7 7 7
Yusufeli-Tortum 0 3 4 7 7 7
Erzurum-Tortum NA NA NA NA NA NA
Erzurum-Özlüce 0 0 3 7 7 7
Erzurum-Horasan NA NA NA NA NA NA
Ağrı-Horasan NA NA NA NA NA NA
Ağrı-Van NA NA NA NA NA NA
Van-Başkale NA NA NA NA NA NA
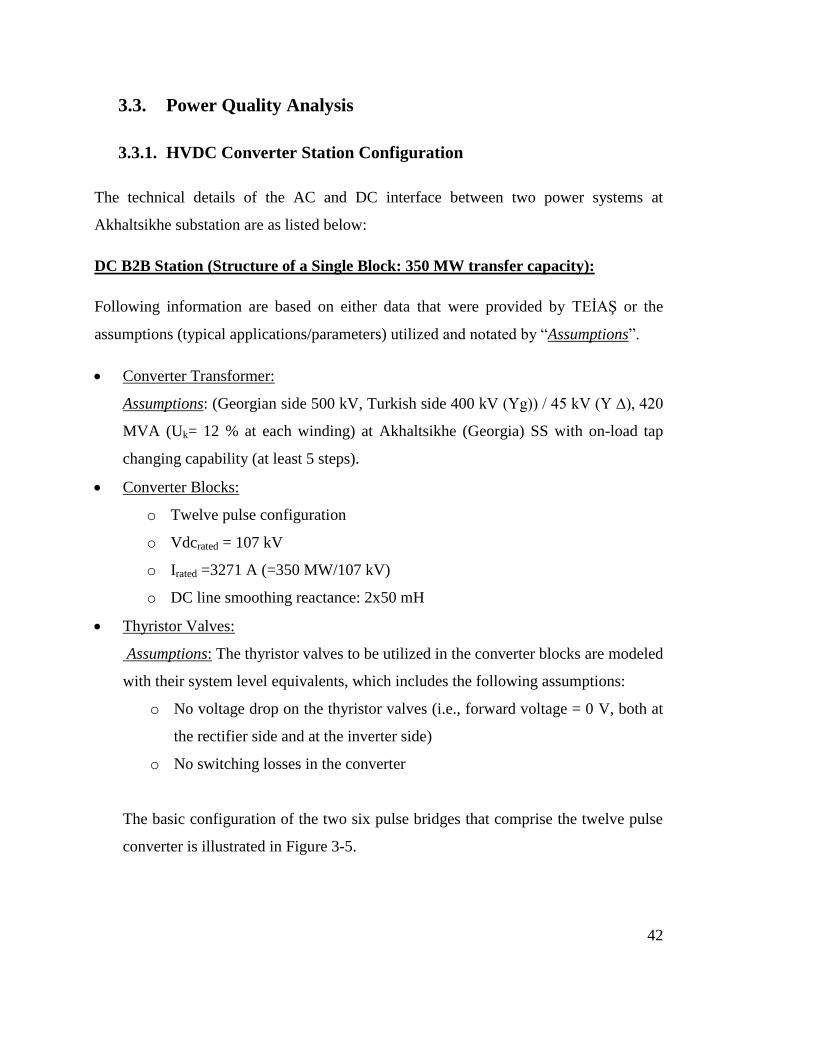
42
3.3. Power Quality Analysis
3.3.1. HVDC Converter Station Configuration
The technical details of the AC and DC interface between two power systems at
Akhaltsikhe substation are as listed below:
DC B2B Station (Structure of a Single Block: 350 MW transfer capacity):
Following information are based on either data that were provided by TEİAŞ or the
assumptions (typical applications/parameters) utilized and notated by “Assumptions”.
Converter Transformer:
Assumptions: (Georgian side 500 kV, Turkish side 400 kV (Yg)) / 45 kV (Y ∆), 420
MVA (Uk= 12 % at each winding) at Akhaltsikhe (Georgia) SS with on-load tap
changing capability (at least 5 steps).
Converter Blocks:
o Twelve pulse configuration
o Vdcrated = 107 kV
o Irated =3271 A (=350 MW/107 kV)
o DC line smoothing reactance: 2x50 mH
Thyristor Valves:
Assumptions: The thyristor valves to be utilized in the converter blocks are modeled
with their system level equivalents, which includes the following assumptions:
o No voltage drop on the thyristor valves (i.e., forward voltage = 0 V, both at
the rectifier side and at the inverter side)
o No switching losses in the converter
The basic configuration of the two six pulse bridges that comprise the twelve pulse
converter is illustrated in Figure 3-5.
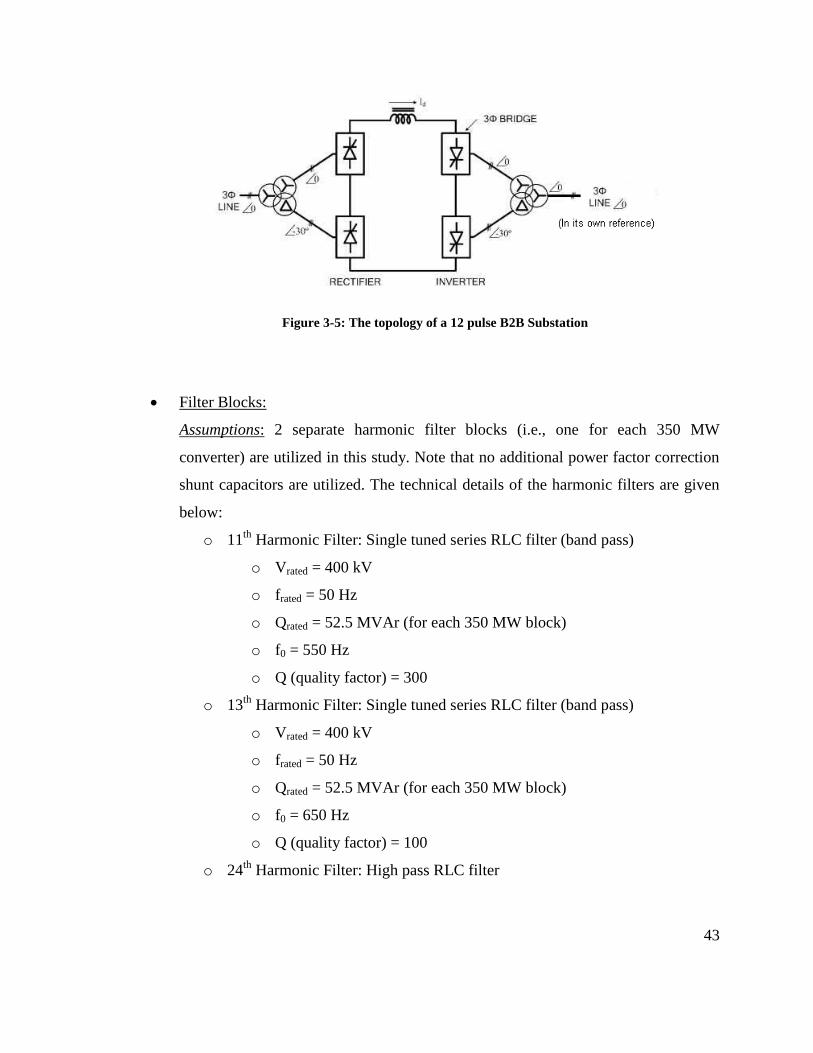
43
Figure 3-5: The topology of a 12 pulse B2B Substation
Filter Blocks:
Assumptions: 2 separate harmonic filter blocks (i.e., one for each 350 MW
converter) are utilized in this study. Note that no additional power factor correction
shunt capacitors are utilized. The technical details of the harmonic filters are given
below:
o 11th
Harmonic Filter: Single tuned series RLC filter (band pass)
o Vrated = 400 kV
o frated = 50 Hz
o Qrated = 52.5 MVAr (for each 350 MW block)
o f0 = 550 Hz
o Q (quality factor) = 300
o 13th
Harmonic Filter: Single tuned series RLC filter (band pass)
o Vrated = 400 kV
o frated = 50 Hz
o Qrated = 52.5 MVAr (for each 350 MW block)
o f0 = 650 Hz
o Q (quality factor) = 100
o 24th
Harmonic Filter: High pass RLC filter

44
o Vrated = 400 kV
o frated = 50 Hz
o Qrated = 52.5 MVAr (for each 350 MW block)
o f0 = 1200 Hz
o Q (quality factor) = 3
The overall filter scheme for the harmonics is illustrated in Figure 3-6. For the
sake of completeness, the determination of these filters are explained in
harmonic analysis which is presented in Appendix - B.
It has also been informed that that 3x60 MVA synchronous condensers are
planned for installation in the 400 kV Akhaltsikhe swithchyard (Turkish Side).
This information is approved by Georgian party although the corresponding
details regarding synchronous condensers have not been provided.
11th harmonic filter
Band pass
52.5 MVar(cap)
Q=300
13th harmonic filter
Band pass
52.5 MVar(cap)
Q=100
24th harmonic filter
High pass
52.5 MVar(cap)
Q=3
Figure 3-6. Filter scheme in the substation

45
Although the B2B converter enables bilateral transfer of power between both sides,
since it is expected that Turkish side will generally be the importing side, the inverter
side of the B2B station is assumed to be Turkey, whereas the rectifier side is assumed to
be Georgia throughout the analysis.
The most crucial parameter that determines the capability of the grid to handle
conventional line frequency commutated B2B stations is the strength of the AC system,
which is related to the equivalent Thevenin impedance of the grid. HVDC interfaces at
the weak points of AC systems may result in problems such as harmonic resonance,
instability and frequent commutation failures [20].
Effective Short Circuit Ratio (ESCR) is an index for evaluating some of the complex
and variable interactions between AC and DC systems, which is calculated according to
the below formula:
A figure of merit for the healthy operation of conventional line frequency commuted
HVDC interfaces is ESCR ≥ 2.5 [20]. Hence, in the following section, the feasibility of
power transfer via HVDC B2B substation located at Akhaltsikhe will be analyzed for
different grid topologies for the Turkish grid based on this criterion will be discussed.
3.3.2. ESCR Calculation
The maximum value of SCMVA at Borçka is expected to be 7590 MVA (in case of all
expected generating units are in operation, without the synchronous condensers at
Akhaltsikhe). Therefore, considering also the transmission line between Borçka and
Akhaltsikhe, the maximum value of SCMVA at Akhaltsikhe end of the line is reduced to

46
2338 MVA due to 160 km single circuit overhead line between Borçka and Akhaltsikhe
and the effect of short circuit location. However, the synchronous condensers increase
the SCMVA by 610 MVA.
In addition, the harmonic filters generally produce a total reactive power at an amount of
60% of the rated DC power, which means:
11th
harmonic filters = 2x52.5 MVAr
13th
harmonic filters = 2x52.5 MVAr
24th
harmonic filters = 2x52.5 MVAr
Therefore, the amount of safe power transfer which will avoid dynamical over voltages
(DOV) and frequent commutation failures is calculated as:
In addition, possible grid topologies in both summer and spring scenarios that affect the
SCMVA at Akhaltsikhe busbar are also considered in ESCR calculations. For this
purpose, worst grid topologies that may be encountered during grid operation in the
sense of influence on SCMVA at Akhaltsikhe busbar are checked. According to the
results, minimum safe power transfer is found as 795 MW which is higher than HVDC
capacity which 700 MW. Therefore, it is concluded that required SCMVA power for
secure operation of HVDC is supplied in all conditions. As a result, no commutation
failure is expected in HVDC operation.
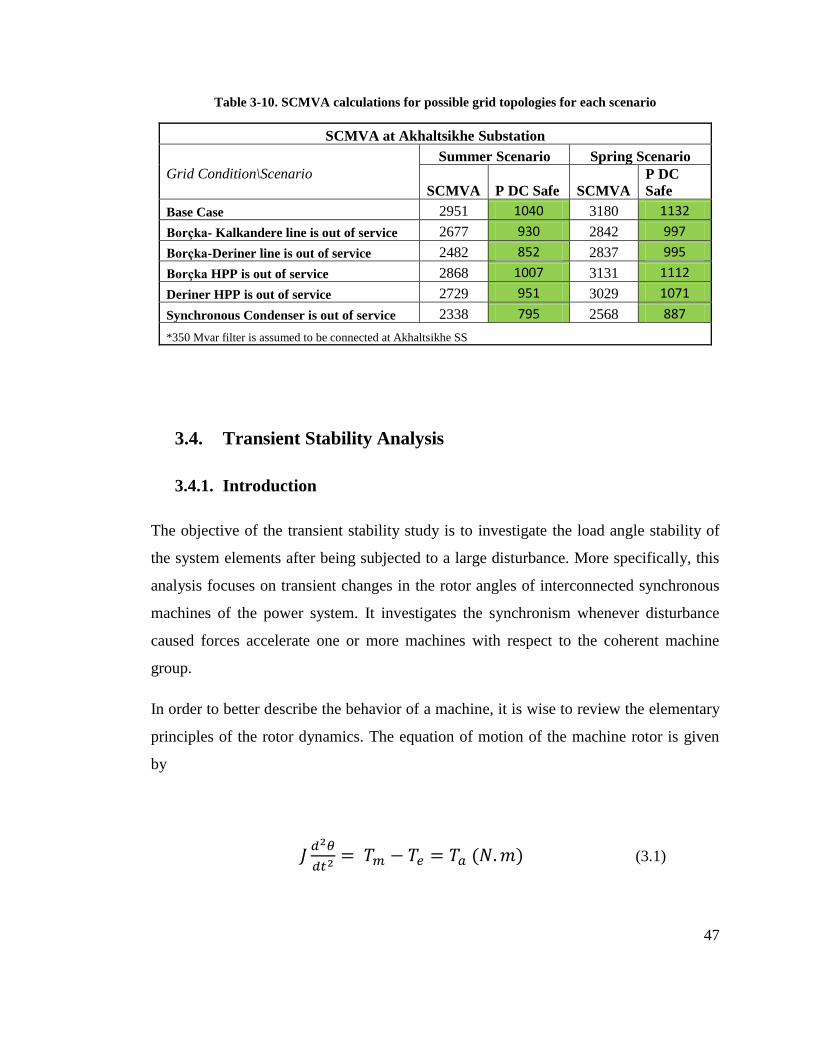
47
Table 3-10. SCMVA calculations for possible grid topologies for each scenario
SCMVA at Akhaltsikhe Substation
Grid Condition\Scenario
Summer Scenario Spring Scenario
SCMVA P DC Safe SCMVA
P DC
Safe
Base Case 2951 1040 3180 1132
Borçka- Kalkandere line is out of service 2677 930 2842 997
Borçka-Deriner line is out of service 2482 852 2837 995
Borçka HPP is out of service 2868 1007 3131 1112
Deriner HPP is out of service 2729 951 3029 1071
Synchronous Condenser is out of service 2338 795 2568 887
*350 Mvar filter is assumed to be connected at Akhaltsikhe SS
3.4. Transient Stability Analysis
3.4.1. Introduction
The objective of the transient stability study is to investigate the load angle stability of
the system elements after being subjected to a large disturbance. More specifically, this
analysis focuses on transient changes in the rotor angles of interconnected synchronous
machines of the power system. It investigates the synchronism whenever disturbance
caused forces accelerate one or more machines with respect to the coherent machine
group.
In order to better describe the behavior of a machine, it is wise to review the elementary
principles of the rotor dynamics. The equation of motion of the machine rotor is given
by
(3.1)

48
where
J = total moment of inertia of the rotor mass in kgm2
θ = angular position of rotor in rad
Tm = mechanical torque supplied by the prime mover in N-m
Te = electrical torque output of the alternator in N-m
Ta = net accelerating torque on rotor in N-m
Under steady state operation, Tm and Te are equal; hence, there is no accelerating torque
which increases or decreases the rotor mass. Under this condition, speed of the generator
rotor is constant and equal to the synchronous speed of the system.
Figure 3-7. Mechanical and electrical torques on the turbine shaft
When angular position of the rotor is represented in the synchronously rotating frame
and the power-torque relation is used, Equation 3.1 can further be manipulated to the
well-known Swing equation (3.2), which is the fundamental differential equation used in
stability analysis.
(3.2)
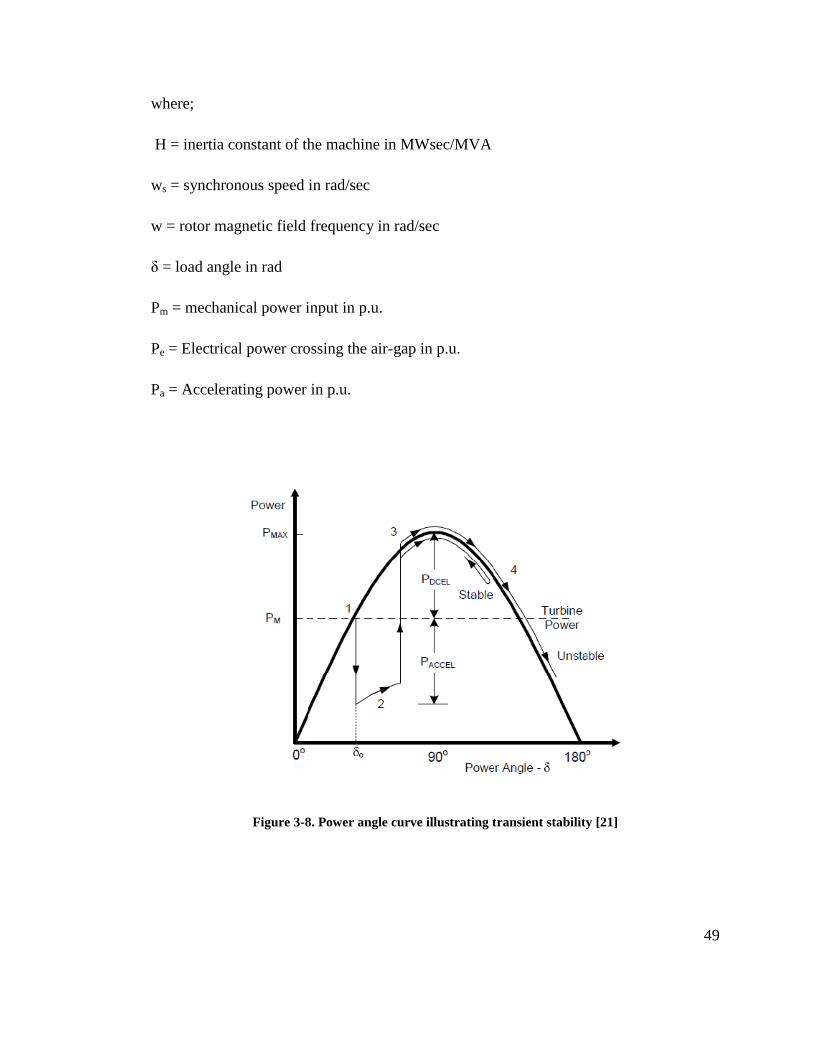
49
where;
H = inertia constant of the machine in MWsec/MVA
ws = synchronous speed in rad/sec
w = rotor magnetic field frequency in rad/sec
δ = load angle in rad
Pm = mechanical power input in p.u.
Pe = Electrical power crossing the air-gap in p.u.
Pa = Accelerating power in p.u.
Figure 3-8. Power angle curve illustrating transient stability [21]

50
The behavior of the machine following a disturbance is depicted by the thin line in
Figure 3-8. Initially, machine is operating in steady state where its mechanical power is
equal to the electrical power and the corresponding machine angle is δ0. As the fault
occurs, operating point suddenly changes from 1 to 2 due to the change in electrical
power output of the machine. However, due to the machine inertia, mechanical power,
hence the load angle, does not change instantly. Therefore, the difference between
mechanical and electrical power is stored as the kinetic energy in the machine which
results in acceleration of the rotor. Due to the acceleration, the load angle starts to
increase until fault clearance. When fault is cleared, the electrical power is restored and
operating point suddenly jumps to the point 3 assuming that the system reactance is not
changed during disturbance. In other words, system returns to its initial power-angle
characteristics after the fault clearance. Nevertheless, restored electrical power is larger
than the mechanical power which reverses the acceleration to deceleration. Although
rotor starts to decelerate, rotor speed is still greater than the system speed. Therefore,
load angle continues to increase until stored kinetic energy transferred to the system
which is shown as movement through point 3 to 4. If sufficient retarding torque (i.e., Pm-
Pe) exists, load angle decreases and the machine eventually returns to its initial operating
point. In that case, machine is assessed as transiently stable.
Generally, power-angle curve of the machine changes according to the change in system
reactance after a severe disturbance. Therefore, equal area criterion is utilized to assess
the transient stability. This criterion is based on energy transfer between the machine
and the system during acceleration and deceleration. The energy can be calculated as;
∫
(3.3)
∫
(3.4)
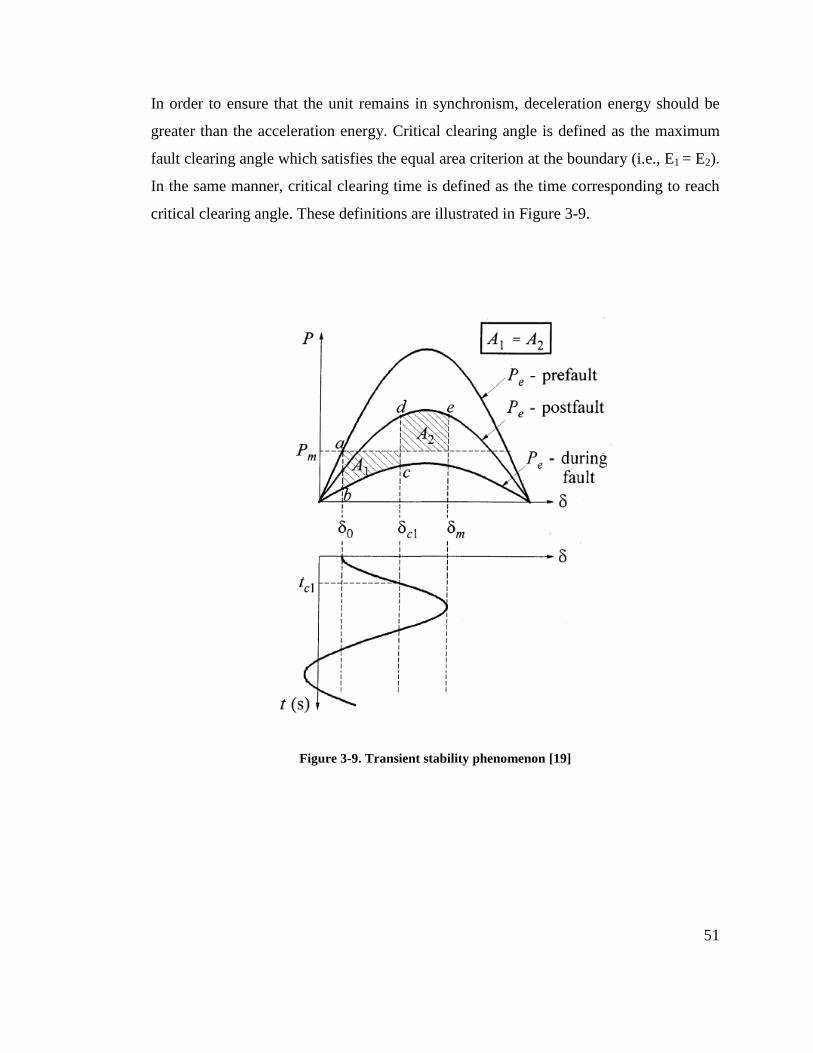
51
In order to ensure that the unit remains in synchronism, deceleration energy should be
greater than the acceleration energy. Critical clearing angle is defined as the maximum
fault clearing angle which satisfies the equal area criterion at the boundary (i.e., E1 = E2).
In the same manner, critical clearing time is defined as the time corresponding to reach
critical clearing angle. These definitions are illustrated in Figure 3-9.
Figure 3-9. Transient stability phenomenon [19]

52
As SPSs are designed to secure system operation in case of a fault, transient stability
studies constitute the core of the SPS design. In order to design such a protection system,
the designer should be aware of;
Under which conditions should the system operate?
What is the maximum operation time?
How to determine countermeasures?
What will be the resultant system after SPS operation?
The answers regarding to these questions are all revealed after the transient stability
analysis. Therefore, detailed transient stability studies with correct modelling approach
and reasonable number of analysis cases are required. These subjects are all covered in
the following sections.
3.4.2. Regional Grid Dynamical Model
Transient stability analysis requires computation of large set of differential and algebraic
equations in order to represent nonlinear dynamic behavior of the power system
elements. As the severe disturbances are of interest, linearization is not possible and
detailed representation of the power system elements is necessary. Figure 3-10 shows
the overall picture of required models for transient stability analysis.

53
Figure 3-10. Power system model for transient stability analysis [19]
3.4.2.1. Synchronous Machine Models
Rotor dynamics and electrical circuits have significant effect on the synchronous
machine behavior in the transient stability. Hence, dynamic models of the generators
utilized in this analysis are capable to represent subtransient, transient and steady state
behavior of the synchronous machines. The equations regarding to the synchronous
machines can be derived for all states utilizing the dq model with reasonable
assumptions.
During the steady state operation, field winding and damper winding currents are
constant which effectively means that the dq axis voltages are solely dependent to the
direct and quadrature axis reactances. The governing equations can be written as
(3.5)
(3.6)

54
In the transient state, as the damper winding currents have decayed, effect of damper
windings can be neglected. However, opposing currents are induced on the field winding
which can be modeled by short circuiting field winding and setting its resistance to zero.
This effectively represents the current changes occurring in the field winding in order to
maintain flux linkage of this winding constant [22]. Synchronous inductances and
impedances in the transient state are given in (3.7) - (3.12)
⁄ (3.7)
(3.8)
(3.9)
⁄ (3.10)
(3.12)
Moreover, related time constants that represent the decay of induced currents are
⁄ (3.13)
(3.14)
In this regard, voltage equations governing the transient behavior can be written as

55
(3.15)
(3.16)
(3.17)
(3.18)
During the subtransient state, opposing currents are induced in damper windings while
no current is induced in the field winding during this small time period. However, due to
small time constants of damper windings, subtransient currents quickly decay. The
equations governing the subtransient state are as given in (3.19) - (3.21)
(3.19)
(3.20)
where
((
) (
) ) (3.21)

56
Further manipulation of equations (3.5) - (3.21) and addition of the swing equation will
lead to a 6th
order machine model which is utilized in this study. This model is
commonly utilized in the transient stability analysis due to its accuracy to represent
actual synchronous machine dynamics. Hence, 6th
order machine models are used in
large scale generation facilities in the regional model.
In addition, 2nd
order classical machine model is also utilized for relatively small sized
power plants in the region in order to simplify both data preparation and analysis for
transient stability analysis. 2nd
order machine models are commonly used for generators
far from area of interest [22]. In a similar manner, due to their negligible effects in the
analysis, small sized power plants are modeled in reduced order. Governing equations
regarding classical generator model is given in (3.22) - (3.24).
(3.22)
(3.23)
(3.24)
3.4.2.2. Excitation System Models
Representation of field dynamics and excitation system is another essential topic in
transient stability analysis [23]. Excitation systems are aiding the transient stability of
the machine by boosting the machine voltage during transients. This action exerts a
restraining torque on the rotor; hence, decreases initial rotor angle swing.
Although there are different excitation systems that exist in practice, most of the modern
excitation systems are static exciters. Hence, models of this type of exciters are utilized

57
in transient stability studies. Similar to machine modeling approach, excitation system
modeling is limited to large scale power plants in the region, considering quality and
simplicity of analysis. For this purpose, dynamical models of the regional plants are
obtained from TEİAŞ. An example excitation model used is given in Figure 3-11.
Figure 3-11. IEEE Type ST1A excitation system model [24]
3.4.3. Grid Protection Model
Being one of the essential part of the power systems, protection systems ensure secure
and continuous operation of the grid. The devices under protection system continuously
monitor system variables such as current, voltage, etc. in order to detect any abnormal
condition in the power system. In case of an abnormal condition such as a fault, these
devices disconnect problematic elements from the rest of the power system in order to
preserve both malfunctioning element and the rest of the power grid.
There are several protection equipment exist in a power system depending on protected
element and protection purpose. For example transmission lines are protected via

58
overcurrent and distance relays while generators are protected via more than ten
different types of relays.
Modelling the protection system in transient stability analysis is not a common practice;
however, due to lack of n-1 security in the region, even transiently stable conditions may
end up with overloads in grid elements that may lead to cascaded operation of protection
elements. As a result, transiently stable condition may undergo instability which should
also be taken into consideration in SPS design. Possibility of such situation is especially
higher in 154 kV network due to weak transmission lines in the region. In order to
examine secure operation of grid, overcurrent protection relays in 154 kV transmission
lines are modeled in this study.
This approach is beyond the time frame of interest of transient stability analysis.
Nonetheless, any possibility of instability should be investigated in SPS design as these
systems are responsible for securing power system operation at all conditions.
In this regard, 154 kV overcurrent protection in transmission lines are implemented
based on actual protection device settings taken from TEİAŞ. However, as the regional
system under consideration is extremely large, abundant number of protective devices
exist in great variety. In order to ease protection modeling process, common overcurrent
relay model is utilized for whole 154 kV grid. Moreover, examination of protection
settings has shown that pickup current and time setting are very similar through the
region. Therefore, all protection relays in 154 kV network are adjusted to the same
setting, that is, relays are adjusted so as to open at 1.3 times of nominal capacity if
overloading observed for at least 5 seconds period. Inverse time protection setting is
shown in Figure 3-12. In addition, according to the information obtained from TEİAŞ,
all protection devices have power swing detection functionality which means that
undesired operation in power swings after fault clearance is not expected.

59
It should also be noted that similar to the actual case, this modeling is limited with 154
kV network since loadings in 400 kV network in the region are far from their respective
protection settings.
Figure 3-12. Time-current characteristic of applied protection setting
3.4.4. Dynamical model of HVDC B2B
The de facto control philosophy of HVDC B2B stations is as follows [1]:
The inverter side controls the DC bus voltage (on D-F line in Figure 3-13)
The rectifier side controls the DC bus current (on B-C line in Figure 3-13)
The normal operating point of HVDC B2B convertor is shown in point E in
Figure 3-13
Controller structures of the bridge convertors are of discrete PI type (together
with limiters and mode selection logic, etc.)
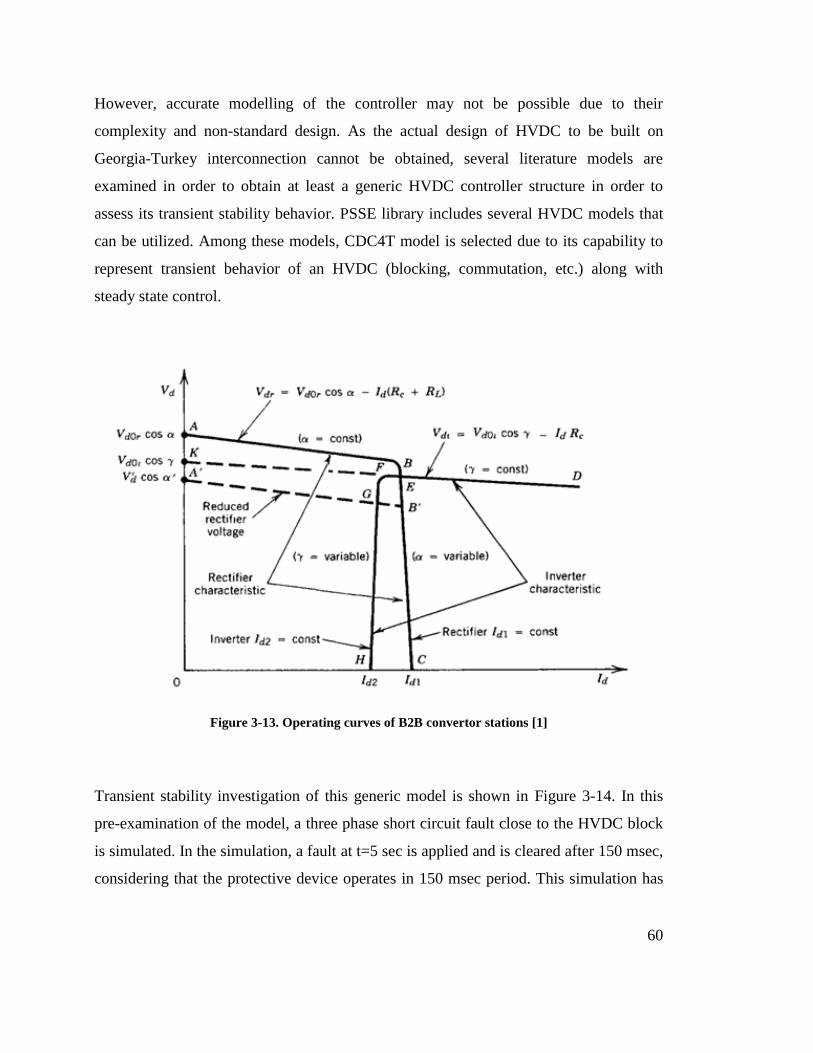
60
However, accurate modelling of the controller may not be possible due to their
complexity and non-standard design. As the actual design of HVDC to be built on
Georgia-Turkey interconnection cannot be obtained, several literature models are
examined in order to obtain at least a generic HVDC controller structure in order to
assess its transient stability behavior. PSSE library includes several HVDC models that
can be utilized. Among these models, CDC4T model is selected due to its capability to
represent transient behavior of an HVDC (blocking, commutation, etc.) along with
steady state control.
Figure 3-13. Operating curves of B2B convertor stations [1]
Transient stability investigation of this generic model is shown in Figure 3-14. In this
pre-examination of the model, a three phase short circuit fault close to the HVDC block
is simulated. In the simulation, a fault at t=5 sec is applied and is cleared after 150 msec,
considering that the protective device operates in 150 msec period. This simulation has

61
shown that, during short circuit, HVDC blocks power transfer (represented as red line in
figure) and return quickly to the service with a fast ramp rate when the fault is cleared.
The response obtained in this simulation is similar to the behavior of the HVDC control
during transient state which is explained in Figure 3-15 in detail.
As it is seen from both figures, transient response of HVDC is highly related to its
controller settings (blocking time, ramp rate etc.). Considering the lack of knowledge
regarding to the HVDC control scheme and dynamic model, it can be assumed that this
generic model can be utilized in studies. In addition, in order to be on the safe side,
blocking time is assumed to be equal to the fault clearing time and reestablishment of
power injection is assumed to be immediate (i.e., infinite ramp rate). That is, HVDC acts
as a constant power injection point. Under these circumstances, the transient behavior of
HVDC is very similar with the behavior of a constant power load whose behavior to the
same fault case simulation as in HVDC B2B is given in Figure 3-16.

62
Figure 3-14. Transient response of the simulated generic HVDC model
Figure 3-15. Behaviour of the HVDC B2B model during transient

63
Figure 3-16. Transient behavior of constant power load model
Comparison of Figure 3-14 and Figure 3-16 shows that the dynamic behavior of HVDC
can be approximated as a constant power load. Due to the lack of voltage control, small
oscillations after the fault clearance is observed in active power output of the constant
power load. However, these small oscillations can be neglected as the effect of these
oscillations in a regional system is negligible. In that respect, HVDC model can be
simplified as a negative constant power load through the analysis assuming that no
commutation failure occurs. As explained in the power quality section, adequate short
circuit MVA is supplied to HVDC in all conditions, therefore commutation failure risk
due to Turkish grid is not expected. Hence, negative constant power load modeling
approach is feasible and utilized through the transient stability analysis.

64
3.4.5. Transient Stability Assessment of Regional Model
3.4.5.1. Cases Considered
As explained, the backbone of the region consists of two main 400 kV transmission
corridors that are connecting regional electricity production to the demand centers.
These two 400 kV transmission corridors form a giant ring in the region which covers 21
busses at 400 kV level, some of which have 154 kV connections.
Considering the distributed small scale hydraulic generation in the region which are
connected through 154/400 kV substations, it is evaluated that the effect of disturbance
in different locations on the 400 kV ring definitely affects transient stability calculations.
Therefore, for the sake of completeness, transient stability analysis is conducted at each
line segment connecting these 400 kV substations. In other words, 20 contingency cases
are investigated in transient stability calculations. Considering also the 2 scenarios and 6
generation dispatch schemes for each scenario, total number of cases examined reaches
240. Such abundant number of transient stability cases is handled via utilization of
automatization codes. Digsilent PF, which is a powerful power system analysis software,
utilized in transient stability calculations, enables automatization through Digsilent
Programming Language (DPL) codes.
On the other hand, calculation of transient stability for every case is one side of the
story. Study also requires evaluation of huge number of results. In order to complete the
transient stability assessment, an interactive MATLAB code is developed. This interface
code takes the result of each case simulated as an input and presents some important
parameters that are specific for assessing regional grid stability, such that the user can
evaluate the stability condition in each case easily.
An example figure related to MATLAB interface is given in Figure 3-17. As illustrated,
this representation not only includes the transmission corridor flows and the busbar
angles but also shows the flows over reported degradated transmission lines on

65
Altınkaya, Kayabaşı and Çarşamba triangle, so that user can check different constraints
and assess transient stability in a case by case manner.
Figure 3-17. Example transient stability assessment interface on MATLAB
In the following sections, transient stability analysis results for spring and summer
scenarios are given. In all cases, a three phase fault at t=1 sec is applied at the middle of
the transmission line of interest. The fault clearing time, which is the sum of relay
pickup and CB interruption time, is selected as 120 msec considering that the fault
interruption time in high voltage transmission lines that is between 2-5 cycles.
Finally, it is important to note again that examined scenarios for summer and spring
differ for Samsun NGCCP generation. In the summer scenario, it is expected that all
generators are dispatched as much as possible due to the increase in the demand (i.e.,
peak season). Therefore, in generation dispatch schemes for the summer scenario,
Samsun NGCCPP is either fully dispatched or partially dispatched. On the other hand, in
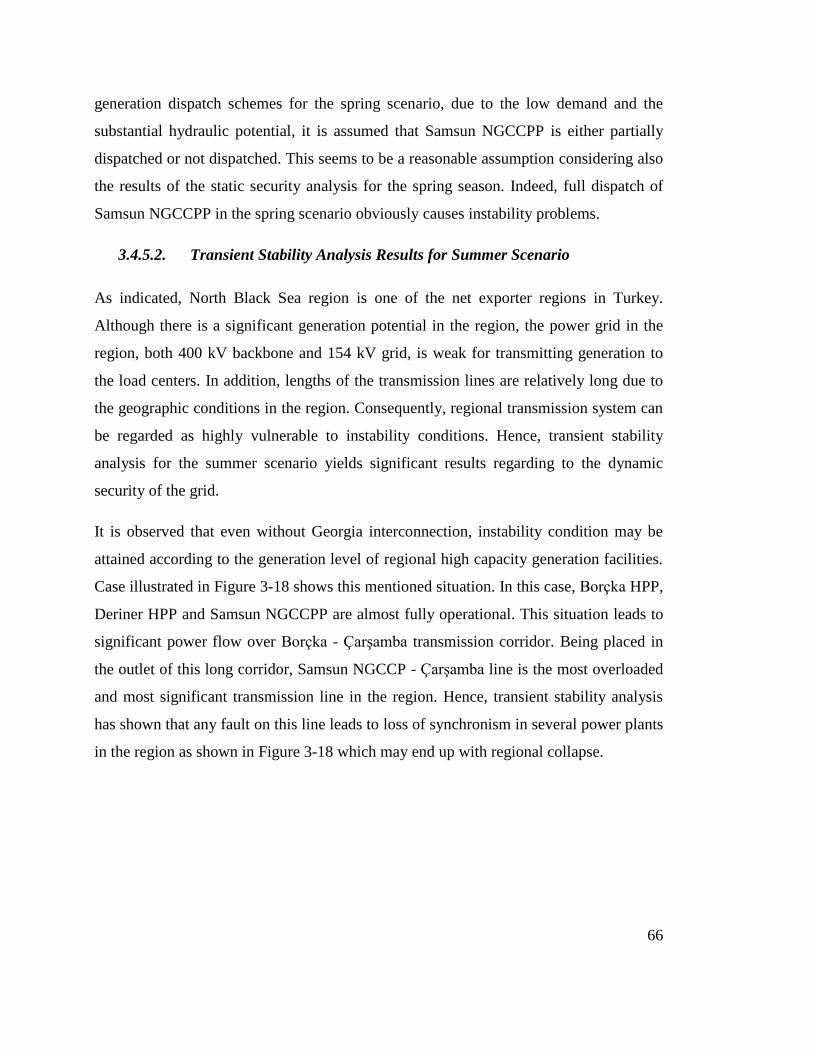
66
generation dispatch schemes for the spring scenario, due to the low demand and the
substantial hydraulic potential, it is assumed that Samsun NGCCPP is either partially
dispatched or not dispatched. This seems to be a reasonable assumption considering also
the results of the static security analysis for the spring season. Indeed, full dispatch of
Samsun NGCCPP in the spring scenario obviously causes instability problems.
3.4.5.2. Transient Stability Analysis Results for Summer Scenario
As indicated, North Black Sea region is one of the net exporter regions in Turkey.
Although there is a significant generation potential in the region, the power grid in the
region, both 400 kV backbone and 154 kV grid, is weak for transmitting generation to
the load centers. In addition, lengths of the transmission lines are relatively long due to
the geographic conditions in the region. Consequently, regional transmission system can
be regarded as highly vulnerable to instability conditions. Hence, transient stability
analysis for the summer scenario yields significant results regarding to the dynamic
security of the grid.
It is observed that even without Georgia interconnection, instability condition may be
attained according to the generation level of regional high capacity generation facilities.
Case illustrated in Figure 3-18 shows this mentioned situation. In this case, Borçka HPP,
Deriner HPP and Samsun NGCCPP are almost fully operational. This situation leads to
significant power flow over Borçka - Çarşamba transmission corridor. Being placed in
the outlet of this long corridor, Samsun NGCCP - Çarşamba line is the most overloaded
and most significant transmission line in the region. Hence, transient stability analysis
has shown that any fault on this line leads to loss of synchronism in several power plants
in the region as shown in Figure 3-18 which may end up with regional collapse.

67
Figure 3-18. Transiently unstable condition without Georgia interconnection
As indicated in previous sections, the capacity of the transmission line between
Çarşamba and Kayabaşı is limited, lower than its thermal capacity due to degraded
protection elements installed on this line. Transient stability analysis has shown that, in
most of the generation dispatch schemes, this transmission line is loaded more than its
allowed limit in case of loss of any transmission line in Kayabaşı – Çarşamba -
Altınkaya triangle. It should also be noted that this case is observed even energy import
from Georgia is zero. This special condition is taken into consideration in all cases
similar to the examples shown in Figure 3-19 and Figure 3-20.

68
Figure 3-19. Kayabaşı - Çarşamba transmission line loading problem in case of loss of Altınkaya –
Çarşamba line (case with 350 MW import from Georgia)
Figure 3-20. Kayabaşı - Çarşamba transmission line loading problem in case of loss of Altınkaya –
Kayabaşı line (case without import from Georgia)

69
When 350 MW energy import cases are investigated, it is observed that some
contingency cases over transmission corridor connecting Borçka to Erzurum will lead to
instability conditions as well as the Çarşamba-Samsun transmission line. In Figure 3-21,
transient stability results can be seen for a fault occurring on Deriner - Artvin
transmission line. Although the system seems to stay stable after the fault clearance as
seen from flow and angle graphs in Figure 3-21, overloading condition on 154 kV
transmission lines will lead to cascaded overcurrent relay operations which can be
observed in 9 sec. after the fault clearance in Figure 3-21. As a result, system becomes
unstable as seen in Figure 3-21. Similar to the cases with 350 MW import, same problem
is also expected and observed in cases with 700 MW import as well. The relevant graph
for the case with 700 MW import is given in Figure 3-22 in which the transmission line
connecting Yusufeli and Tortum is opened. Therefore, overloading problem in 154 kV
should also be closely examined during SPS design process.
Figure 3-21. Transient instability as a result of cascaded 154 kV line opening (case with 350 MW
import)

70
Figure 3-22. Transient instability as a result of cascaded 154 kV line opening (case with 700 MW
import)
In addition, cases including 700 MW import from Georgia are also investigated. Due to
increase in regional loading with the increase in the amount of import, the region
becomes even more vulnerable to instability condition as expected.
The overall evaluation of all simulated cases is given in Table 3-11. In the table, stable
cases are shown with green ticks while unstable cases are shown with red cross. In
addition, cases that should be considered in terms of degraded lines are identified with
yellow exclamation marks. Evaluation of several cases has shown that;
Transmission line between Çarşamba and Samsun NGCCPP is the most critical
line in the region and it is shown that there may be transient stability problems
even without any power import from Georgia.
Risk of instability increases with the amount of power import from Georgia as
expected.

71
Generation level of Samsun NGCCPP is also an important factor in transient
stability as it directly affects the Borçka – Çarşamba 400 kV transmission
corridor.
Loss of the transmission line between Çarşamba and Samsun NGCCPP reverses
the power flow direction in Borçka - Çarşamba 400 kV corridor. Hence power
flow shifts to 154 kV lines and that situation leads to significant overloading
problem among 154 kV regional transmission system.
Loss of the transmission corridor between Borçka and Erzurum clearly increases
the power flow on both remaining 400 kV corridor and 154 kV transmission in
north to south plane. Hence, cascaded operation of 154 kV lines due to
overcurrent protection is observed. This cascaded operation causes instability as
well.
Table 3-11. Transient stability results table for summer scenario
Case \ Generation Dispatch Scheme G0_S1 G0_S2 G1_S1 G1_S2 G2_S1 G2_S2
Altınkaya-Çarşamba
Altınkaya-Kayabaşı
Kayabaşı-Çarşamba
Çarşamba-Samsun NGCCPP
Çarşamba-H.Uğurlu
Ordu-Tirebolu
Ordu-Samsun NGCCPP
Tirebolu- Tirebolu Series Cap.
Tirebolu Series Cap.-Kalkandere
Borcka-Kalkandere
Bocka-Deriner
Deriner-Artvin
Artvin-Yusufeli
Yusufeli-Tortum
Erzurum-Tortum
Erzurum-Özlüce
Erzurum-Horasan
Ağrı-Horasan
Ağrı-Van
Van-Başkale

72
3.4.5.3. Transient Stability Analysis Results for Spring Scenario
As indicated, power generation in the region is dominated by hydraulic type power
plants. Due to the water regime in the spring season, generation level in the region
significantly increases. As a result, transmission lines in the region become even more
loaded compared to summer scenario. Hence, the risk of transient instability increases in
the region.
In addition, realization of Altınkaya - Boyabat 400 kV transmission line creates parallel
transmission way to load centers in west part of the Turkey. However, this also increases
loading over Borçka – Çarşamba corridor as the regional transmission merely depend on
this corridor.
The overall evaluations regarding to the simulated cases are given in Table 3-12. Again,
in the table, stable cases are shown with green ticks while unstable cases are shown with
red crosses. In addition, cases that should be considered in terms of degraded lines are
identified with yellow exclamation marks parallel to the representation shown in
summer scenario results. Evaluation of several cases in the spring scenario has shown
that;
As most of the small scale hydraulic generation is connected to the 400 kV
network over Borçka - Çarşamba transmission corridor, increase in power flow
on that line increases the transient instability risk in the spring season. Hence, the
number of unstable cases increases for disturbance over Borçka – Çarşamba
transmission corridor.
Transmission line between Çarşamba and Samsun NGCCPP is the most critical
line in the region and it is shown that there may be transient stability problems
even without any power import from Georgia.
Realization of Tortum 400/154 kV connections and new 154 kV transmission
investments relieves the Borçka - Erzurum 400 kV transmission corridor,
especially the Borçka - Tortum part, significantly. As a result, transient

73
instability problem significantly reduces for disturbances on Borçka – Tortum
part of the Borçka - Erzurum 400 kV transmission corridor. However, it should
be noted that the power flow on that corridor merely depends on Tortum -
Erzurum transmission line.
Table 3-12. Transient stability results table for spring scenario
3.5. SPS Design Studies
Previous sections have shown that energy import from Georgia via HVDC leads to
transmission overloading and instability problems in the Turkish grid. Therefore, an
intelligent protection scheme that monitors the system dynamics and coordinates the grid
after disturbances in the region via utilizing some countermeasures is definitely required.
In this section, a special protection scheme that is aimed to resolve the problems
identified in previous sections is introduced.
Case \ Generation Dispatch Scheme G0_S0 G0_S1 G1_S0 G1_S1 G2_S0 G2_S1
Altınkaya-Çarşamba
Altınkaya-Kayabaşı
Kayabaşı-Çarşamba
Çarşamba-Samsun NGCCPP
Çarşamba-H.Uğurlu
Ordu-Tirebolu
Ordu-Samsun NGCCPP
Tirebolu- Tirebolu Series Cap.
Tirebolu Series Cap.-Kalkandere
Borcka-Kalkandere
Bocka-Deriner
Deriner-Artvin
Artvin-Yusufeli
Yusufeli-Tortum
Erzurum-Tortum
Erzurum-Özlüce
Erzurum-Horasan
Ağrı-Horasan
Ağrı-Van
Van-Başkale

74
3.5.1. Requirement Summary
Any deficiency in SPS design may lead to catastrophic results for the region that SPS
developed for. Therefore, in order to design a protection scheme for the region,
requirements and expectations should be cautiously examined in detail. In the
perspective of studies conducted in previous sections, following conclusions can be
made;
Static load flow and contingency analyses have shown that almost every
contingency in the region leads to overloading problems especially during spring
season. Due to overcurrent protections, loading level of these lines should be
limited up to a certain degree. Hence, the designed SPS should eliminate the
overload in transmission lines in order not to evoke cascaded line openings.
The overloading problem in Altınkaya – Kayabaşı - Çarşamba transmission
triangle should be locally solved as the effect of countermeasures in Borçka
region to this triangle is minimum. Hence separate logic required for this area.
As identified by power quality studies, HVDC operation (i.e., commutation
schedule) is not effected by grid changes in Turkish side due to synchronous
condensers installed in Akhaltsikhe substation. Hence, countermeasures are
practically unlimited in terms of secure HVDC operation.
As the instability and overload problems stem from high generation, the primary
focus in countermeasures should be given to generation shedding.
Amount of generation drop is limited to maximum disturbance can the Turkish
grid withstand without losing synchronous operation with ENTSO\E.
Minimum operation time for SPS to interact disturbances is less than 700 msec.
according to the transient stability calculations.
In addition to the specific grid requirements, common design necessities should also be
considered in the SPS design. These are;
75
8760 hours of secure operation is aimed with the SPS utilization. Hence, SPS
should be successful for any loading condition. In other words, design should be
loading independent.
As the annual growth rate of Turkish grid is around 7 %, several grid investments
are realized in each year in order to meet the demand. Hence, grid topology is
changing year by year and this situation forces SPS design to be modular and
quickly adaptable to the changing grid environment.
SPS must be fully automated and should be operated without human interaction.
3.5.2. Solution Space
As indicated in the previous section, primary focus in countermeasure determination is
given to generation shedding, since the main problem stems from the high generation in
the region. The results of static security analysis have shown that solutions that relieve
the system following a disturbance can be classified into 3 main groups according to the
fault location.
Çarşamba - Kayabaşı countermeasure group
Since no alternative 400 kV transmission corridor connecting northeastern region
generation to main load centers exists, huge amounts of power flow occur on lines
connected to Kayabaşı substation. This situation leads to overloading on these lines even
without any contingency. Therefore, loss of any line in Kayabaşı – Çarşamba -
Altınkaya triangle leads to overloading and loading dependent instability problems. The
obvious candidate that resolves this problem is the generation shedding. However, static
security analysis identified that the generation shedding from Borçka area is not as
effective as local the generation shedding. In order to minimize the generation shedding
and to maximize the effect of risk mitigation, local candidates such as Altınkaya HPP,
H. Ugurlu HPP and Samsun NGCCPP should be preferred. Hence, this countermeasure
group includes generation shedding from Altınkaya and H. Uğurlu HPPs. As a result, in

76
case of any disturbance that is occurred on Kayabaşı - Altınkaya - Çarşamba 400 kV
triangle, primarily Çarşamba - Kayabaşı countermeasure group is utilized.
Borçka countermeasure group
This group is dedicated for disturbances that may occur in between Borçka - Samsun
NGCCP and Borçka - Erzurum substations. As the power flow on these lines are
primarily affected by regional generation, the effect of generation shedding from Borçka
area is significant. Hence, this countermeasure group includes generation shedding from
Borçka HPP, Deriner HPP and power import reduction from HVDC. Moreover,
disturbances on Erzurum - Keban corridor can also be compensated utilizing this
countermeasure group.
Samsun Countermeasure Group
This group is specific to possible disturbances that may occur on Samsun NGCCP -
Çarşamba line. In case of losing this line, the power flow reversal in Borçka - Çarşamba
corridor leads to several 154 kV related problems that may result in instability. Hence,
this specific countermeasure group is dedicated to Samsun NGCCPP - Çarşamba line
and is also operated in coordination with Borçka countermeasure group.
3.5.3. Monitoring Location Determination
In order to detect the changes in the power system, SPS can either observe on/off state of
breakers in the regional system or measure power system variables such as voltage
power etc. Considering the size of the region of interest, detection via breaker position
signal is not selected, as this type of implementation require lots of signals to be
transmitted to the deciding center. Such an approach reduces both modularity and
reliability of the design. Therefore, latter approach is preferred and the system is
monitored via PMU measurements. However, PMU based design rises an important
question regarding to the monitoring locations. Therefore, design studies started with
identifying monitoring locations that are sufficient for SPS design. In general, this

77
determination process is based on step-by-step optimization of cost and design
requirement. Considering the Turkish regional network, the initial point is trivial. As
Northeastern region of Turkey consists two intersecting 400 kV corridors, 3 PMU
measurements one at intersecting point and remaining two at the ends of the 400 kV
corridors are selected as initial starting point. In the design process, it turns out that this
selection is the minimum measurement requirement for SPS logic in order to determine
grid states in the region.
3.5.4. Instability Pattern
Like any protection element, SPS should operate correctly when needed and should not
intervene the system operation in cases where protection is not necessary. In order to
reveal these necessities, careful and detailed calculations are performed in SPS design
study.
In order to determine the variables that reveal a pattern for detecting instability
conditions, several simulations are conducted. As the main problem that affects regional
system stability is the loading of transmission lines, the analyses first focused on
detecting instability pattern based on active power flows. However, the meshed structure
of the regional system yield no clear pattern, especially due to the 154 kV network. In
addition, it is not possible to determine a single pattern on power flows for different
loading conditions. Therefore study proceeded on finding an instability pattern on
several power system variables.
It is known that the measured variables from PMU devices are limited to voltages and
currents. As a result, the PMU based SPS design should focus on these variables and
variables derived from PMU measurements. Literature survey study on wide area
measurement based SPS applications has shown that, positive sequence voltage angle
and variations based on angles are common variables that are used in SPS design.
Hence, SPS design study focused on determining an instability pattern based on busbar
angles, angle deviations and derived variables based busbar angles.

78
Considering the transmission structure in the region, it is obvious that any disturbance
on one of the two main transmission corridors results in significant power flow and
angle deviation in the remaining transmission corridor. In this regard, deviations in
angles and power flow in PMU measurement points located on remaining transmission
corridor are investigated.
Transient stability analysis results for the summer scenario have shown that angle
difference between Borçka and Çarşamba substatitions yields a clear instability pattern
for disturbances occurring on Borçka - Erzurum transmission corridor. When stable and
unstable cases following a disturbance are classified, it has been found out that, the
system stays in a stable state if the angle difference between Borçka and Çarşamba
substations is lower than 40 degrees as shown in Figure 3-23. Hence, for stable cases,
transient change in the angle difference after the fault should not exceed 40 degrees
limit. In a similar manner, it is also observed that angle difference between Borçka and
Çarşamba for the unstable cases, represented as green curves in Figure 3-23, exceed the
40 degree limit and increases boundlessly.
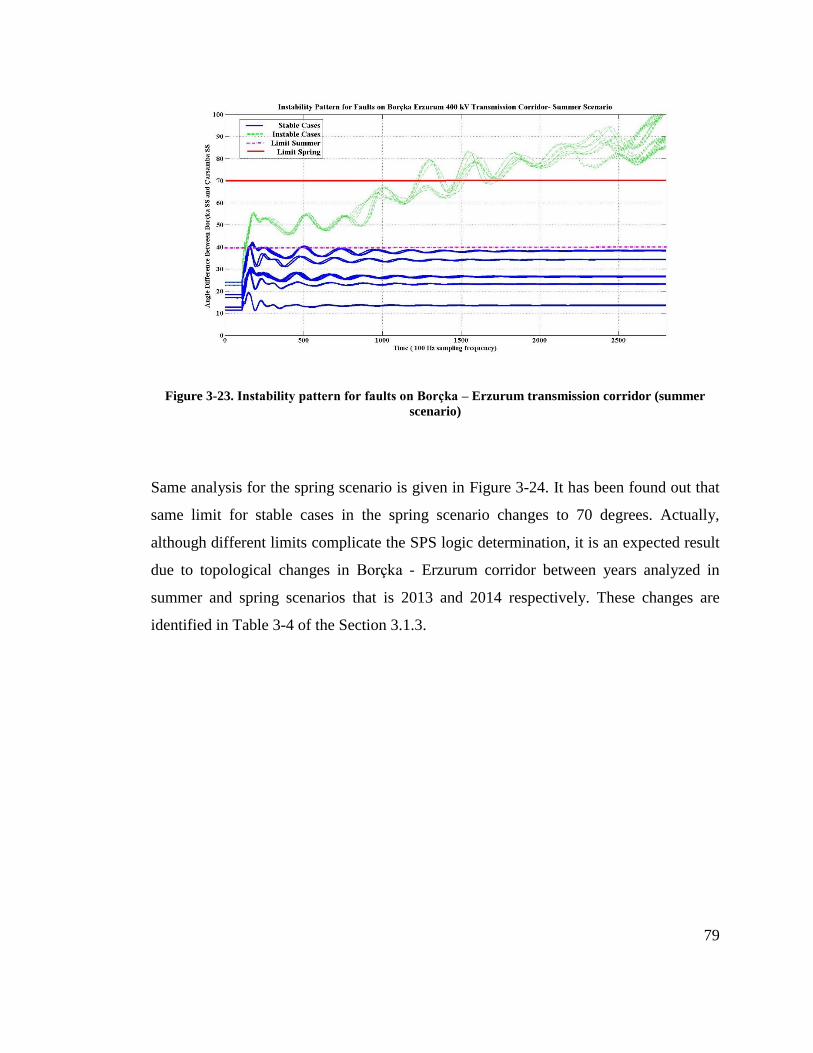
79
Figure 3-23. Instability pattern for faults on Borçka – Erzurum transmission corridor (summer
scenario)
Same analysis for the spring scenario is given in Figure 3-24. It has been found out that
same limit for stable cases in the spring scenario changes to 70 degrees. Actually,
although different limits complicate the SPS logic determination, it is an expected result
due to topological changes in Borçka - Erzurum corridor between years analyzed in
summer and spring scenarios that is 2013 and 2014 respectively. These changes are
identified in Table 3-4 of the Section 3.1.3.

80
Figure 3-24. Instability pattern for faults on Borçka – Erzurum transmission corridor (spring
scenario)
On the other hand, same calculations for faults on Borçka - Çarşamba corridor did not
give any clear pattern as in the other case due to the meshed structure of Borçka -
Çarşamba corridor with 154 kV regional network. Therefore angle difference pattern is
further processed with angle difference deviation. Angle difference deviation variable
shows nothing but how fast the angle difference changes according to the fault. With this
utilization, severity of disturbance is further taken into consideration. When stable and
unstable cases in transient stability analysis are investigated, it is discovered that created
combined parameter, which is angle difference multiplied with angle difference
deviation, yield a clear pattern for stability determination. Hence, combined parameter is
investigated utilizing transient stability analysis results for the summer scenario for the
cases having disturbance on Borçka – Çarşamba transmission corridor. Analysis of
mentioned combined parameter for summer scenario has shown that grid stay in stable
state if that combined parameter is lower than 40 degrees as shown in Figure 3-25.

81
Figure 3-25. Instability pattern for faults on Borçka – Çarşamba transmission corridor (summer
scenario)
Same analysis for the spring scenario also shows the mentioned 40 degree limit for
combined stability parameter. The regarding pattern for the spring is given in Figure
3-26. As Borçka - Çarşamba transmission corridor in summer and spring scenarios is
almost same for 2013 and 2014 in terms of grid topology, limit values are found same in
each case.
In addition, most severe disturbance in transient stability analysis (fault on Çarşamba-
Samsun NGCCPP line) is also shown in Figure 3-26 as black dotted line. Examination
of the behavior of that disturbance, revealed another important information regarding to
the SPS logic design that is maximum SPS intervention time. It is clear from the figure
that, in worst contingency, system loses synchronism 700 msec. after fault clearance.
Therefore it can be concluded that SPS should react within maximum 700 msec.
Actually, it should react much less than 700 msec. in order to create sufficient retarding
torque that forces machines to stay stable.

82
Figure 3-26. Instability pattern for faults on Borçka – Çarşamba transmission corridor (spring
scenario)
3.5.5. Development of SPS Logic
Results of numerous simulations, as presented in previous sections have answered some
basic questions like when, why and how to operate regarding to SPS design. Given the
requirements and design related analysis results, the only remaining part is the logic
interpretation. This is simply interpreting the behavior of the power system during
disturbances and the interaction of SPS. In this section several functions of SPS logic
are introduced.
3.5.5.1. Fault Related Detection Functions
When a severe disturbance such as a short circuit fault in a system, power flows on the
transmission lines show abrupt changes and voltages on busbars that are close to the
faulty element reduce significantly. Roughly, it can be said that the fault drives the
power system to a state where almost all variables in the power system show quick

83
deviations. This is the starting point of the SPS logic design as it should detect correct
time to activate.
In SPS logic, power flow deviations at measurement points are utilized in order to
determine the fault in the regional system. This is a preferable selection as any fault in
the region, surely changes power flow on the transmission lines which are constantly
observed by PMU’s placed. As a consequence, significant change in flow is detected at
least two out of three PMUs. Hence, for the fault detection, dP/dt values in each PMU
are constantly calculated based on measurements taken from PMUs.
During normal operation, at least 500 MW power flows are observed at the end points of
each the transmission corridor. Based on this observation, threshold level for fault
detection on power flow deviation is selected as 300 MW considering the parallel 154
kV power flows. In other words, if the power flow deviates more than 300 MWs in 3
consecutive measurement periods in any PMU, the SPS logic determines that a fault has
occurred in the region.
Measurements taken from PMUs during the fault condition are useless for the SPS due
to anomalies in variables. Hence, determination of the system stability based on these
variables is not preferred. Rather, change in system variables after the fault clearance is
waited in order to assess the effect of disturbance. As a result, fault clear determination
function is also implemented in the SPS logic. The implementation is based on voltage
levels measured from PMUs, considering the busbar voltages are significantly low
during the fault and rapidly increase after the fault clearance.
Furthermore, the location information regarding the fault also yields valuable
information for the SPS logic. As determined in static security and transient stability
chapters, the instability pattern changes according to the location of fault. For this
reason, fault location determination holds crucial importance.

84
In order to detect the fault location, both directions of power flow and angle values at
measurement points are constantly observed. In case of fault occurrence in the system,
mentioned angle and power flow variables before and after fault conditions are recorded.
Then the fault location determination logic decides the location of the fault via decision
tree shown in Figure 3-27.
Borçka-Kalkandere Line Flow
Borçka-Deriner Line Flow
Angle Borçka SS
Angle Çarşamba SS
Angle Erzurum SS
B-K flow Pre-faultB-K flow Post-faultB-D flow Pre-faultB-D flow Post-fault
Angles at Borcka and Erzurum change in the
same direction ?
Angles at Borcka and Carsamba change in the same
direction ?
Fault beyond Erzurum SS
Fault between Borçka SS and
Erzurum SS
Fault between Borçka SS and Çarşamba SS
Fault beyond Çarşamba SS
YESNO
NOYES
Positive Flow Deviation in pre and
post fault valuesB-C Corridor B-E Corridor
Fault Cleared?
YES
Figure 3-27. Fault location detection logic

85
3.5.5.2. Countermeasure Activation Logic
Candidate countermeasures that mitigate the effect of disturbance in the region
according to the location of the disturbance have already been defined in previous
sections. Therefore, given the effect and the location of disturbance, SPS logic already
knows which countermeasure group to activate. However, determination of the
magnitude of countermeasure that relieves the system after disturbance heavily depends
on the initial grid loading condition prior to the disturbance. So, it is difficult to design a
logic that exactly determines the required countermeasures online. Rather, the activation
of predetermined countermeasures in a step by step fashion till stability is ensured, is
preferred in this design.
Given that the instability pattern of the several contingencies, designed SPS logic
inherently has the information regarding stability limits. Hence, in case of a violation
exists in a contingency case, the logic should activate countermeasures step-by-step until
violation condition is averted. In order to realize this idea, 3 discrete countermeasure
activation steps that depend on different activation levels are created in the SPS logic.
As a result, activation of countermeasures is optimized so as to use minimum required
countermeasures.
In addition, for the disturbances that occur in Çarşamba - Kayabaşı - Altınkaya triangle,
where instability is not the only concern due to line capacity degradation, limitation on
line flows are applied. According to the information taken from TEİAŞ, transmission
lines between Çarşamba to Kayabaşı and Altınkaya to Kayabaşı can loaded up to 1100
MW. Hence, in case of losing any line in this triangle, countermeasures are activated
directly upon the violation of the mentioned limit value.
3.5.5.3. Available Countermeasure Search Logic
Up to this point, the implemented SPS functions have identified the existance fault and
activated the regarding countermeasures. In addition, the logic also indicates the

86
magnitude of countermeasure that is required rather than specifically determining the
exact action. It is a reasonable approach as the grid condition, especially the availability
of countermeasures, that is the countermeasure is online or offline during actual
operation, is unknown for the SPS. Therefore, countermeasure search algorithm is
implemented for the SPS design.
The search algorithm starts with determining online countermeasure candidates in the
grid. Then, discrete countermeasure steps are formed among these candidate groups
regarding to the unit size. This simple routine is calculated continuously in the logic
such that there is always a countermeasure in the system. As a result, the lack of
countermeasure or the wrong countermeasure selection is prevented and
countermeasures always stay armed during SPS operation.
3.5.5.4. Combined Logic Scheme
Combination of aforementioned logics and functions are formed in a controller block in
Digsilent software to test and simulate the SPS in several grid conditions. The
implemented SPS logic is shown in Figure 3-28. Simulation results regarding to the
operation of SPS logic are given in the next chapter.

87
Start
Acquire observations from defined
PMUs
Change in dP/dt > 300 MW in any
PMU
Record pre-fault values
Yes
No
Voltage at all PMU Substations >
0.8 p.u.
Yes
Record post-fault values
Detect faulty corridor based on
pre-post fault recordings
Fault on BC
corridorFault on CK
corridor
Fault on BE
corridorFault on EK
corridor
Yes
No
No
SPS error
Increase fault
time counterWarning 2
Fault time counter > 0.12 sec
No
No
Yes
No
No
Angles between
substations >
Threshould value
Warning 2
Yes
Angle difference
BC > Safety
Threshould
No
Increase BC
time counter
BC Counter > Time Thres. 1
and
Angle Diff. BC > Ang. Thres
BC1
Action
1
BC Counter > Time Thres. 2
and
Angle Diff. BC > Ang. Thres
BC2
Action
2
BC Counter > Time Thres. 3
and
Angle Diff. BC > Ang. Thres
BC3
Action
3
No
No
No
Yes
Yes
Yes
Flow on CK or
AK > Safety
Threshould
Flow on CK or AK > Flow Thres.
CK1
Action
1
Flow on CK or AK > Flow Thres.
CK2
Action
2
Flow on CK or AK > Flow Thres.
CK1
Action
3
No
No
Yes
Yes
Yes
Angle difference
BE > Safety
Threshould
Increase BE
time counter
BE Counter > Time Thres. 1
and
Angle Diff. BE > Ang. Thres
BE1
Action
1
BE Counter > Time Thres. 2
and
Angle Diff. BE > Ang. Thres
BE2
Action
2
BE Counter > Time Thres. 3
and
Angle Diff. BE > Ang. Thres
BE3
Action
3
No
No
Yes
Yes
Yes
Angle difference
EK > Safety
Threshould
Increase EK
time counter
EK Counter > Time Thres. 1
and
Angle Diff. EK > Ang. Thres
EK1
Action
1
EK Counter > Time Thres. 2
and
Angle Diff. EK > Ang. Thres
EK2
Action
2
EK Counter > Time Thres. 3
and
Angle Diff. EK > Ang. Thres
EK3
Action
3
No
No
Yes
Yes
Yes
No No No
Yes
Yes
Yes Yes
Increase
Steady
Counter
No
Increase
Steady
Counter
Increase
Steady
Counter
Increase
Steady
Counter
No No No
Steady Counter > 20 s
Yes
Figure 3-28. SPS logic flowchart

88

89
CHAPTER 4
SIMULATION RESULTS AND DISCUSSION
Up to this point, detailed analysis studies have been conducted in order to define
requirements for the design of SPS. As a result of these analyses, an algorithm that
monitors certain electrical variables in the system and assesses changes in the system
operating point by following the dynamics during post contingency period and
eventually decides on a preventive action is created. As a next step, implementation and
testing of designed algorithm on a simulation environment is required. Hence, in this
part of the study, implementation of the developed SPS logic on a simulation
environment and performance tests are presented.
Reliability is the most important title for a protective element. However, being a reliable
element requires several testing procedures that examine stability, accuracy,
dependability etc. SPSs are also classified as intelligent protective elements. Hence, the
SPS design must be reliable in order to be used in a power system. Therefore, detailed
testing is performed to complement the SPS design study. In this chapter, time domain
simulation (i.e. transient stability) results with SPS implementation are given.
4.1. Implementation of Designed Logic on Simulation
Environment
After being determining the logic of the SPS system, the structural requirements of the
design become much clearer. During the logic design process, it is concluded that 3

90
main PMU measurements are sufficient to observe the system dynamics in the sense of
SPS algorithm. In addition to this, SPS logic utilizes several countermeasures, which
are actually generators in the region. Hence information flow between SPS logic and
generators in counter measures is required. As a result, PMUs and generators in counter
measures are main peripherals that must be connected to the SPS logic.
After identifying the requirements and peripherals for the SPS implementation, SPS is
constructed as a custom controller on Digsilent software. The implementation of the SPS
logic and its peripherals are illustrated in Figure 4-1. As illustrated in implementation
figure, signals expected from PMU’s and dispatch information from power plants, which
are utilized as countermeasures, are gathered.
Figure 4-1. SPS implementation in Digsilent software

91
4.2. Transient Stability Results for Summer Scenario under SPS
Supervision
As indicated in the previous transient stability analysis section, regional power system is
suffering transient stability problems even without power import from Georgia. The
results illustrated in Figure 3-18 indicate the current situation, which clearly shows both
the importance and the requirement of SPS in the region. There are also several
contingency cases that have transient instability risk depending on the generation
dispatch scheme of the region.
The main aim of SPS is to decide on a preventive action that ensures regional system
stability and reliability in all possible grid conditions. Hence, the main expectation from
SPS is to eliminate mentioned instability conditions. In order to assess how successful
does the SPS in these tasks, studies conducted in transient stability section are performed
again with the supervision of the implemented SPS algorithm.
Figures between 4-2 to 4-5 show the effect of SPS on some of the instable cases in
transient stability study for summer scenario. In addition, transient stability results
before SPS implementation are also drawn on the same figure in order to ease the
understanding.
As indicated, fault occurring on Çarşamba - Samsun NGCCPP line is the worst
contingency in the region. This contingency causes instability in almost all generation
dispatch schemes regarding to both scenarios. However, transient stability calculation
under SPS supervision for this contingency has shown that, implemented SPS system
successfully eliminates the risk of instability for all grid conditions. In the case shown in
Figure 4-2, that is the generation dispatch scheme with lowest generation dispatch in
which worst contingency leads instability, SPS detects abnormal system conditions (i.e.,
line fault and disconnection of line) and reacts in a sufficient time period to eliminate
instability risk by dropping generation from Samsun NGCCPP. In that case,

92
approximately 400 MW generation is shed which relieves the system constraints. It is
clear from the figure that the power flows and angles in blue colored lines, that is the
case under SPS supervision, reached steady state condition after SPS intervention while
the case without SPS in red dashed lines is not.
Figure 4-2. Effect of SPS during loss of the line between Çarşamba and Samsun (summer scenario)
Another critical case that needs to be investigated is the case with cascaded operation of
overcurrent relays. In some of the cases, although system is transiently stable, cascaded
openings of 154 kV transmission lines due to the overcurrent protection cause instability
in the region. However, in the case of SPS supervision the risk is eliminated as SPS
detects and reacts to the abnormal system conditions quickly. In the case shown in
Figure 4-3, contingency that is occurring on Deriner - Artvin 400 kV line, triggers the
SPS such that it react and shed approximately ~650 MW of generation around the region
in order to preserve stability. This action also satisfies the special condition regarding
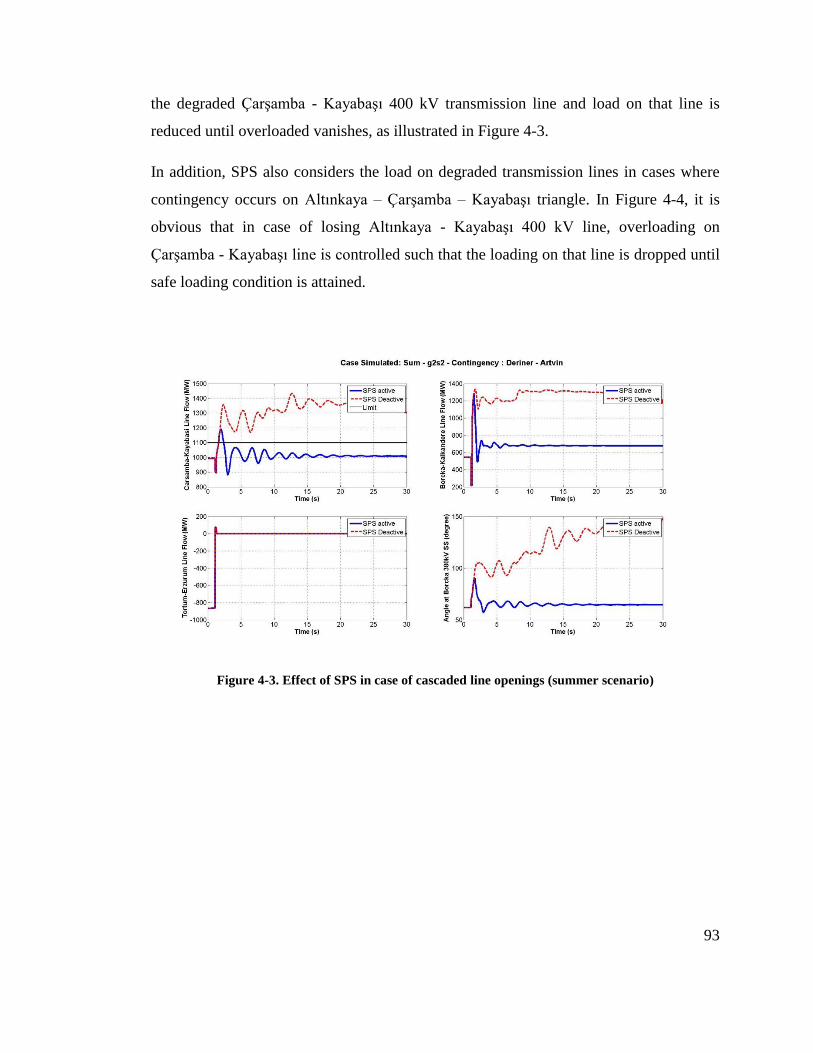
93
the degraded Çarşamba - Kayabaşı 400 kV transmission line and load on that line is
reduced until overloaded vanishes, as illustrated in Figure 4-3.
In addition, SPS also considers the load on degraded transmission lines in cases where
contingency occurs on Altınkaya – Çarşamba – Kayabaşı triangle. In Figure 4-4, it is
obvious that in case of losing Altınkaya - Kayabaşı 400 kV line, overloading on
Çarşamba - Kayabaşı line is controlled such that the loading on that line is dropped until
safe loading condition is attained.
Figure 4-3. Effect of SPS in case of cascaded line openings (summer scenario)

94
Figure 4-4. Effect of SPS in case of degraded transmission lines (summer scenario)
Like any protection equipment, SPS should not intervene the system operation where it
is not required. Such an example case for this condition is shown in Figure 4-5. This
figure clearly illustrates that the power system response is same for both SPS active and
inactive cases. There are lots of cases where SPS intervention is not needed. Therefore,
it is important to limit SPS action to the cases where necessary.
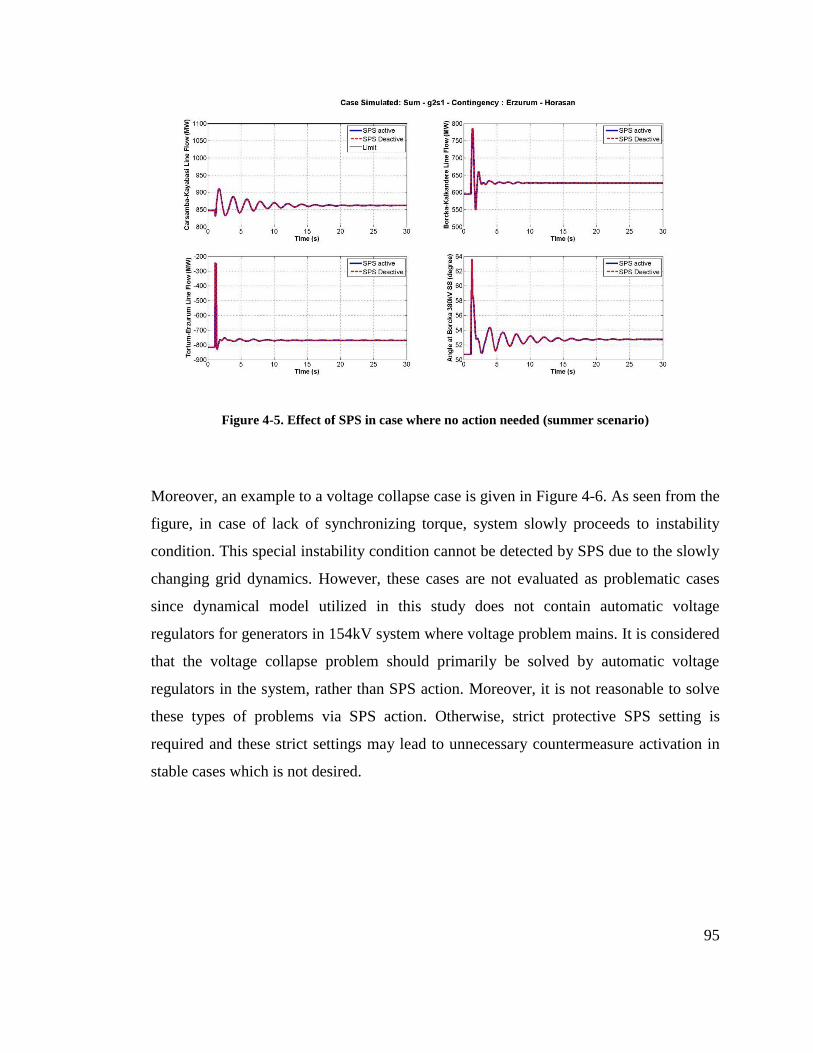
95
Figure 4-5. Effect of SPS in case where no action needed (summer scenario)
Moreover, an example to a voltage collapse case is given in Figure 4-6. As seen from the
figure, in case of lack of synchronizing torque, system slowly proceeds to instability
condition. This special instability condition cannot be detected by SPS due to the slowly
changing grid dynamics. However, these cases are not evaluated as problematic cases
since dynamical model utilized in this study does not contain automatic voltage
regulators for generators in 154kV system where voltage problem mains. It is considered
that the voltage collapse problem should primarily be solved by automatic voltage
regulators in the system, rather than SPS action. Moreover, it is not reasonable to solve
these types of problems via SPS action. Otherwise, strict protective SPS setting is
required and these strict settings may lead to unnecessary countermeasure activation in
stable cases which is not desired.
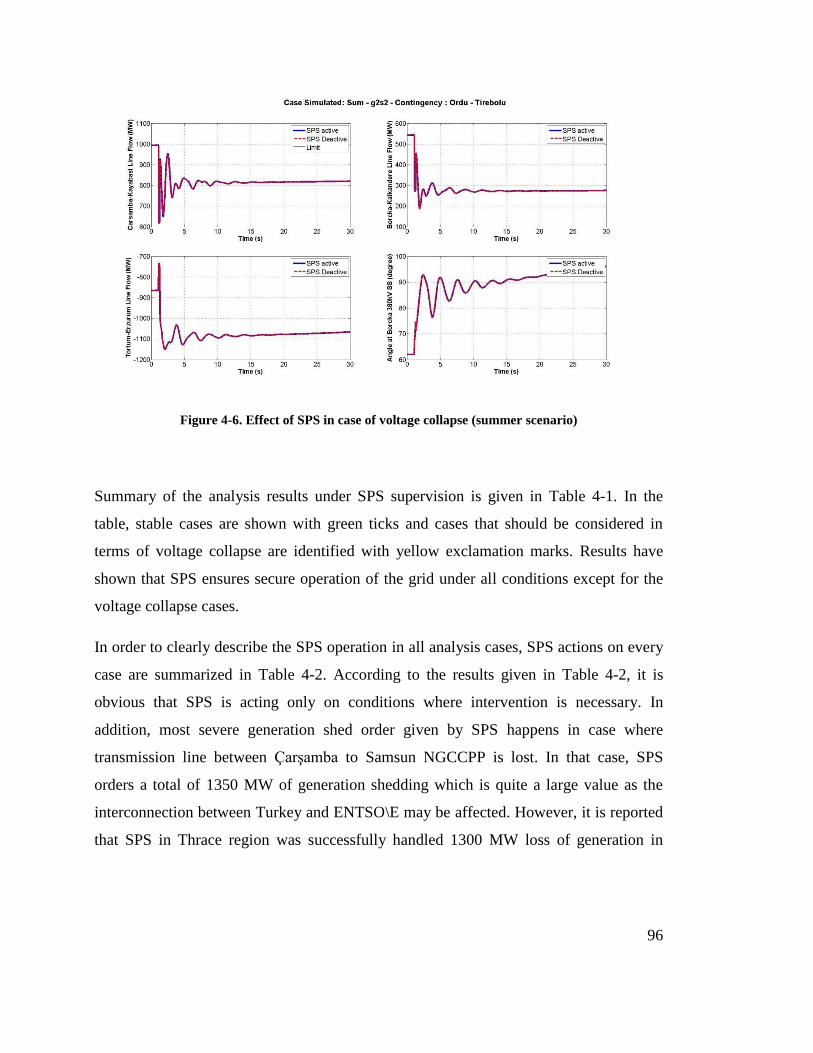
96
Figure 4-6. Effect of SPS in case of voltage collapse (summer scenario)
Summary of the analysis results under SPS supervision is given in Table 4-1. In the
table, stable cases are shown with green ticks and cases that should be considered in
terms of voltage collapse are identified with yellow exclamation marks. Results have
shown that SPS ensures secure operation of the grid under all conditions except for the
voltage collapse cases.
In order to clearly describe the SPS operation in all analysis cases, SPS actions on every
case are summarized in Table 4-2. According to the results given in Table 4-2, it is
obvious that SPS is acting only on conditions where intervention is necessary. In
addition, most severe generation shed order given by SPS happens in case where
transmission line between Çarşamba to Samsun NGCCPP is lost. In that case, SPS
orders a total of 1350 MW of generation shedding which is quite a large value as the
interconnection between Turkey and ENTSO\E may be affected. However, it is reported
that SPS in Thrace region was successfully handled 1300 MW loss of generation in

97
Istanbul region. Nevertheless, this case should be investigated in detail in order to ensure
safe operation of Turkish power system as a whole.
Table 4-1. Transient stability results for summer scenario under the SPS supervision
Case \ Generation Dispatch Scheme G0_S1 G0_S2 G1_S1 G1_S2 G2_S1 G2_S2
Altınkaya-Çarşamba
Altınkaya-Kayabaşı
Kayabaşı-Çarşamba
Çarşamba-Samsun NGCCPP
Çarşamba-H.Uğurlu
Ordu-Tirebolu
Ordu-Samsun NGCCPP
Tirebolu- Tirebolu Series Cap.
Tirebolu Series Cap.-Kalkandere
Borcka-Kalkandere
Bocka-Deriner
Deriner-Artvin
Artvin-Yusufeli
Yusufeli-Tortum
Erzurum-Tortum
Erzurum-Özlüce
Erzurum-Horasan
Ağrı-Horasan
Ağrı-Van
Van-Başkale
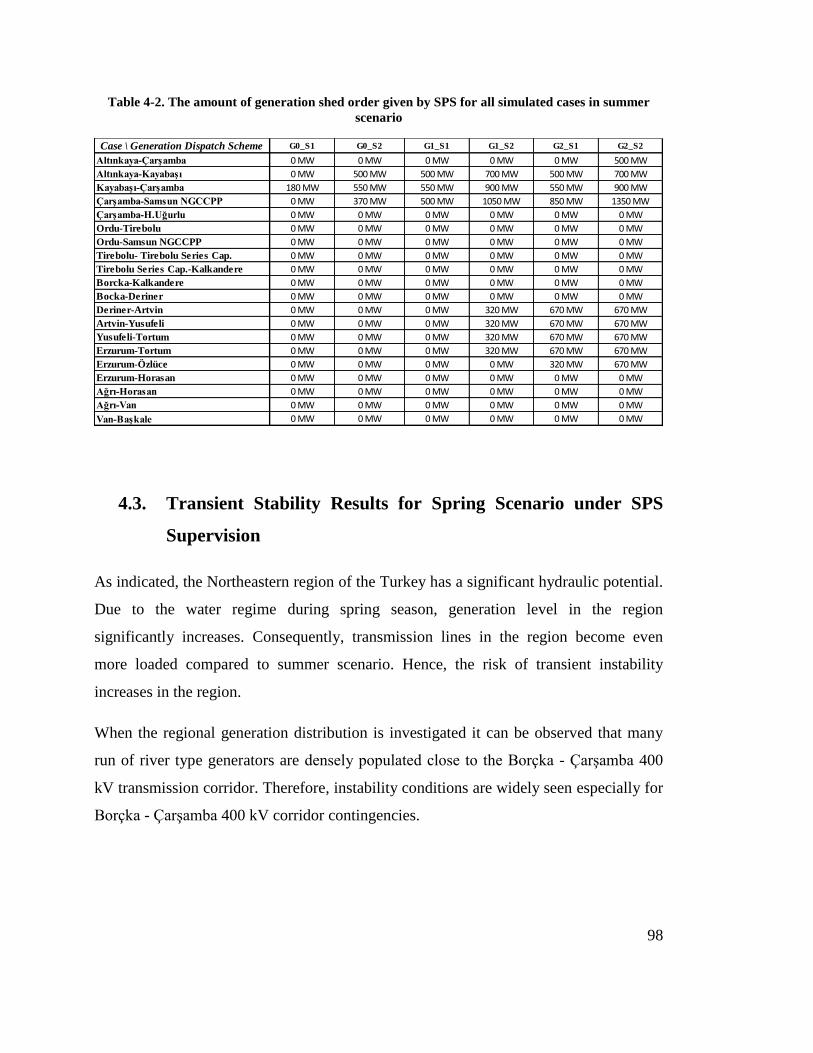
98
Table 4-2. The amount of generation shed order given by SPS for all simulated cases in summer
scenario
4.3. Transient Stability Results for Spring Scenario under SPS
Supervision
As indicated, the Northeastern region of the Turkey has a significant hydraulic potential.
Due to the water regime during spring season, generation level in the region
significantly increases. Consequently, transmission lines in the region become even
more loaded compared to summer scenario. Hence, the risk of transient instability
increases in the region.
When the regional generation distribution is investigated it can be observed that many
run of river type generators are densely populated close to the Borçka - Çarşamba 400
kV transmission corridor. Therefore, instability conditions are widely seen especially for
Borçka - Çarşamba 400 kV corridor contingencies.
Case \ Generation Dispatch Scheme G0_S1 G0_S2 G1_S1 G1_S2 G2_S1 G2_S2
Altınkaya-Çarşamba 0 MW 0 MW 0 MW 0 MW 0 MW 500 MW
Altınkaya-Kayabaşı 0 MW 500 MW 500 MW 700 MW 500 MW 700 MW
Kayabaşı-Çarşamba 180 MW 550 MW 550 MW 900 MW 550 MW 900 MW
Çarşamba-Samsun NGCCPP 0 MW 370 MW 500 MW 1050 MW 850 MW 1350 MW
Çarşamba-H.Uğurlu 0 MW 0 MW 0 MW 0 MW 0 MW 0 MW
Ordu-Tirebolu 0 MW 0 MW 0 MW 0 MW 0 MW 0 MW
Ordu-Samsun NGCCPP 0 MW 0 MW 0 MW 0 MW 0 MW 0 MW
Tirebolu- Tirebolu Series Cap. 0 MW 0 MW 0 MW 0 MW 0 MW 0 MW
Tirebolu Series Cap.-Kalkandere 0 MW 0 MW 0 MW 0 MW 0 MW 0 MW
Borcka-Kalkandere 0 MW 0 MW 0 MW 0 MW 0 MW 0 MW
Bocka-Deriner 0 MW 0 MW 0 MW 0 MW 0 MW 0 MW
Deriner-Artvin 0 MW 0 MW 0 MW 320 MW 670 MW 670 MW
Artvin-Yusufeli 0 MW 0 MW 0 MW 320 MW 670 MW 670 MW
Yusufeli-Tortum 0 MW 0 MW 0 MW 320 MW 670 MW 670 MW
Erzurum-Tortum 0 MW 0 MW 0 MW 320 MW 670 MW 670 MW
Erzurum-Özlüce 0 MW 0 MW 0 MW 0 MW 320 MW 670 MW
Erzurum-Horasan 0 MW 0 MW 0 MW 0 MW 0 MW 0 MW
Ağrı-Horasan 0 MW 0 MW 0 MW 0 MW 0 MW 0 MW
Ağrı-Van 0 MW 0 MW 0 MW 0 MW 0 MW 0 MW
Van-Başkale 0 MW 0 MW 0 MW 0 MW 0 MW 0 MW

99
In addition, transmission investments on Borçka - Erzurum corridor relive the loading
through this corridor. Hence, transient stability studies in the spring season mainly
focuses on Borçka - Çarşamba 400 kV transmission corridor.
Figures 4-7 to 4-12 show the effect of SPS on some of the instable cases in transient
stability studies for the spring scenario. In addition, transient stability results without
SPS implementation is also drawn on the same figure in order to ease the understanding.
Loss of transmission line between Çarşamba to Samsun NGCCPP again appears as the
worst contingency in the region. Similar to the summer scenario, this contingency causes
instability in almost all generation dispatch schemes. However, SPS implementation
resolves the problem in the region regarding to that contingency as illustrated in Figure
4-7.
Figure 4-7. Effect of SPS during loss of the line between Çarşamba and Samsun (spring scenario)
As indicated in the transient stability analysis section for the spring scenario, increase in
the power flow on Borçka - Çarşamba transmission corridor due to small hydraulic
generation connected to that line, increases the transient instability risk. Therefore SPS

100
undertakes an important duty especially in the spring season. However, SPS successfully
reacts and resolves the disturbances along this corridor and maintains the regional
system stability in all analyzed cases. The relevant cases which show the contingencies
on Borçka - Çarşamba transmission corridor are illustrated between Figures 4-8 to 4-10.
Figure 4-8. Effect of SPS during loss of the line between Ordu and Tirebolu (spring scenario)
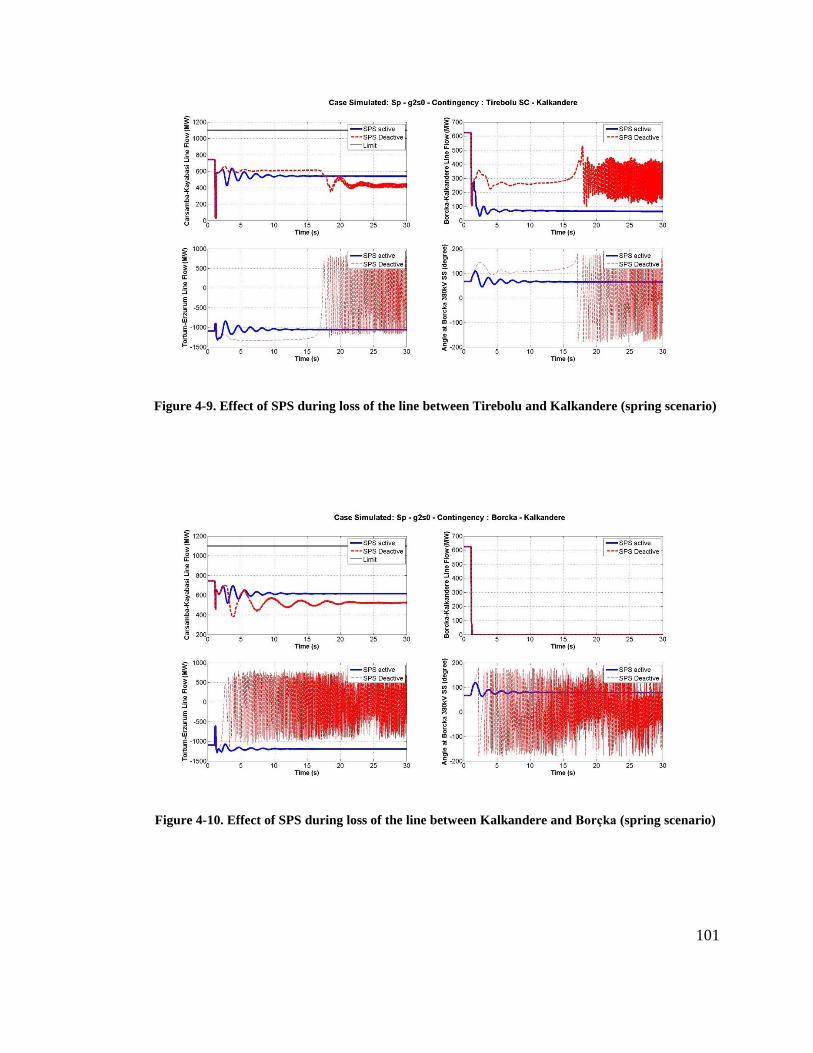
101
Figure 4-9. Effect of SPS during loss of the line between Tirebolu and Kalkandere (spring scenario)
Figure 4-10. Effect of SPS during loss of the line between Kalkandere and Borçka (spring scenario)

102
Similar to the summer scenario, SPS action in the spring scenario is limited to the cases
where SPS action is necessary as shown in Figure 4-11. In this figure, it is illustrated
that the system dynamics during the contingency is same in both SPS active and
deactive cases, which means that the SPS does not react to the contingency as it is not
required.
Figure 4-11. Effect of SPS in case where no action needed (spring scenario)
Finally, for the contingencies on Borçka – Erzurum transmission corridor, SPS
successfully maintains the system stability in cases where SPS action is necessary.
Transient stability results for the spring scenario revealed that transmission investments
along this corridor significantly reduce the instability risk. The only remaining
contingency that may lead to instability is the case in the which transmission line
between Erzurum and Özlüce is lost. However, the instability risk in this case is also
eliminated with SPS action as shown in Figure 4-12.

103
Figure 4-12. Effect of SPS during loss of the line between Erzurum and Özlüce (spring scenario)
Summary of the analysis results for spring scenario under SPS supervision is given in
Table 4-3. Results have shown that SPS ensures secure operation of the grid under all
conditions. In addition, SPS actions on every case are summarized in Table 4-4.
According to the results given in Table 4-4, it is obvious that SPS is acting only on
conditions where intervention is necessary.

104
Table 4-3. Transient stability results table for spring scenario under the SPS supervision
Table 4-4. The amount of generation shed order given by SPS for all simulated cases in spring
scenario
Case \ Generation Dispatch Scheme G0_S0 G0_S1 G1_S0 G1_S1 G2_S0 G2_S1
Altınkaya-Çarşamba
Altınkaya-Kayabaşı
Kayabaşı-Çarşamba
Çarşamba-Samsun NGCCPP
Çarşamba-H.Uğurlu
Ordu-Tirebolu
Ordu-Samsun NGCCPP
Tirebolu- Tirebolu Series Cap.
Tirebolu Series Cap.-Kalkandere
Borcka-Kalkandere
Bocka-Deriner
Deriner-Artvin
Artvin-Yusufeli
Yusufeli-Tortum
Erzurum-Tortum
Erzurum-Özlüce
Erzurum-Horasan
Ağrı-Horasan
Ağrı-Van
Van-Başkale
Case \ Generation Dispatch Scheme G0_S0 G0_S1 G1_S0 G1_S1 G2_S0 G2_S1
Altınkaya-Çarşamba 0 MW 0 MW 0 MW 200 MW 0 MW 200 MW
Altınkaya-Kayabaşı 0 MW 0 MW 0 MW 0 MW 0 MW 0 MW
Kayabaşı-Çarşamba 200 MW 440 MW 200 MW 440 MW 200 MW 440 MW
Çarşamba-Samsun NGCCPP 0 MW 320 MW 320 MW 670 MW 670 MW 1070 MW
Çarşamba-H.Uğurlu 0 MW 0 MW 0 MW 0 MW 0 MW 0 MW
Ordu-Tirebolu 0 MW 0 MW 320 MW 320 MW 1070 MW 1070 MW
Ordu-Samsun NGCCPP 0 MW 0 MW 320 MW 670 MW 670 MW 1070 MW
Tirebolu- Tirebolu Series Cap. 0 MW 0 MW 0 MW 0 MW 320 MW 320 MW
Tirebolu Series Cap.-Kalkandere 0 MW 0 MW 0 MW 0 MW 670 MW 670 MW
Borcka-Kalkandere 0 MW 0 MW 0 MW 0 MW 320 MW 320 MW
Bocka-Deriner 0 MW 0 MW 0 MW 0 MW 0 MW 0 MW
Deriner-Artvin 0 MW 0 MW 0 MW 0 MW 0 MW 0 MW
Artvin-Yusufeli 0 MW 0 MW 0 MW 0 MW 0 MW 0 MW
Yusufeli-Tortum 0 MW 0 MW 0 MW 0 MW 0 MW 0 MW
Erzurum-Tortum 0 MW 0 MW 0 MW 0 MW 1070 MW 1070 MW
Erzurum-Özlüce 0 MW 0 MW 0 MW 0 MW 0 MW 0 MW
Erzurum-Horasan 0 MW 0 MW 0 MW 0 MW 0 MW 0 MW
Ağrı-Horasan 0 MW 0 MW 0 MW 0 MW 0 MW 0 MW
Ağrı-Van 0 MW 0 MW 0 MW 0 MW 0 MW 0 MW
Van-Başkale 0 MW 0 MW 0 MW 0 MW 0 MW 0 MW

105
CHAPTER 5
CONCLUSION
Asynchronous interconnection between Georgia and Turkey via line commutated back
to back (B2B) HVDC through one of the most congested transmission corridors in
Turkey is operational since November 2013. Previous feasibility studies regarding to
this project have shown that depending on the amount of power transfer between parties
and loading conditions, there might be transmission bottlenecks and problems in Turkish
power system. This constitutes a serious problem as the net transfer capacity between
both parties is zero during the spring season and it may be the case for other seasons as
well due to n-1 security concerns. From economical point of view, zero exchange will be
a huge burden for both investors and electricity traders who desire to benefit from this
investment. In this regard, expansion in the transmission capacity of current
infrastructure by using intelligent protective system seems to be the only viable solution.
Hence, this study focused on the design of a special protection scheme that ensures
power system security and sustainability. The main idea behind SPS implementation is
to coordinate the outages in the Northeastern region of Turkish electricity system along
with some countermeasures. However, implementation of such protection scheme
requires detailed power system analyses including static and dynamic stability
calculations in order to understand the regional system requirements and weak points.
For this purpose, this study first deals with system modelling issues that accurately
represent the regional grid. As the region under consideration is significantly large,
several assumptions are made through modelling process. These assumptions enable to
reduce time required to model the area without losing the accuracy of calculations.

106
After completing the modelling study, static security analysis that investigates the
existing and expected constraints of the regional grid is performed for several scenarios
and loading conditions to identify not only the constraints of the region but also to give
idea about reasons that cause element overloads and over/under voltages in the region.
The following conclusions are drawn from static security studies;
Overloads in the regional grid exist even in the base case (i.e., no contingency)
both in summer and spring scenarios. These problems should be resolved by new
transmission investments. This result also reflects that the n-1 security criterion
is not satisfied for the region, hence, increases the vulnerability of the region to
the disturbances and line losses.
In case of loss of any line in Altınkaya - Çarşamba-Kayabaşı 400 kV triangle, the
loading level of the remaining lines in the triangle increases. The lines Altınkaya
- Kayabaşı and Çarşamba – Kayabaşı are reported as operated under their
nominal capacities due to degraded protection elements. Hence, overloading on
these lines should be controlled and decreased immediately in order to prevent
the line from being out of service.
Most critical contingency in all scenarios is the loss of line between Çarşamba
and Samsun NGCCPP substations. In this contingency, the direction of the
power flow from Borçka- Çarşamba corridor is reversed. Hence, 154 kV grid
close to Samsun NGCCPP becomes highly overloaded.
Loss of any line on Borçka – Erzurum corridor leads to overloading in 154 kV
grid from north to south plane for both summer and spring scenarios.
The effect of losing any line on Borçka - Çarşamba corridor has negligible effect
on stability in summer scenario. On the contrary, in spring scenario, 154 kV grid
parallel to Borçka-Çarşamba 400 kV corridor gets overloaded due to high
generation regime. It should be noted that hydraulic potential in the region is
significant and considerable amount of generation is expected in the spring
season as a result of water regime.

107
700 MW power import from Georgia seems to infeasible for the spring season as
almost all contingency cases lead to major overloads in Turkish grid.
Static security analyses have shown that the region itself has n-1 concerns even without
any power import from Georgia. It is clear from the results that constraints in the region
are mainly due to transmission inadequacy. Unfortunately, the issue cannot be resolved
until new transmission investments are realized. Hence, generation shedding seems to be
most promising solution where rapid mitigation of contingency effect is required.
Therefore, predefined solutions to the contingencies in the region are calculated in static
security analyses in order to understand and examine the place and the amount of
generation shedding that is required to resolve transmission overloading. This study also
illuminates the possible SPS countermeasures.
Following, power quality analyses are conducted to examine the adequacy of the grid to
support conventional line commutated HVDC operation. It should be noted that, line
commutated HVDC requires certain amount of reactive power and SCMVA during its
operation in order not to face with commutation failures. Hence, the HVDC operational
requirements are checked for possible grid topologies in both summer and spring
scenarios that affect the SCMVA. Results of power quality analyses have shown that
secure HVDC operation is maintained for all possible grid topologies. It is identified that
700 MW power import, which is the capacity of the HVDC, can be maintained without
interruption due to commutation failure. This assessment also implies that no constraint
exists on SPS countermeasure selection; in other words, generation drop in the region
does not cause any problem for HVDC operation.
Static security and power quality analyses have given important results for regional
system examination. However, their results cover information regarding to steady state
of the power system. In order to investigate stability regarding state transition of the
regional system, transient stability analyses have also been performed in this study.
Transient stability analyses, which are inevitable part of system examination in SPS

108
studies, definitely clarify grid dynamics and system stability. However, this study
requires the computation of large set of differential and algebraic equations which
necessitate detailed modelling. Hence, for high capacity generation facilities detailed
dynamical models are created while small sized plants are represented with simple
mechanical models. Moreover, due to the lack of n-1 criterion in the region, overcurrent
protection relays are added in 154 kV transmission lines in order to examine cascaded
transmission line opening threat in 154 kV network. Utilizing the mentioned grid
dynamic and protection model, transient stability analyses are performed for several
scenarios and contingencies. The analysis results can be summarized as;
Transmission line between Çarşamba and Samsun NGCCPP is the most critical
line in the region. Results have shown that, any fault occurring on that line may
lead to instability problems even without any power import from Georgia.
Risk of instability increases proportionally with the amount of power import
from Georgia, as expected.
Generation level of Samsun NGCCPP is also an important factor in transient
stability, as it directly affects the Borçka – Çarşamba 400 kV transmission
corridor.
In the summer scenario, it is observed that the regional system may become
unstable in case of losing any line that is connecting Deriner to Erzurum which
are the parts of Borçka-Erzurum 400 kV transmission corridor. Surely the
instability situation changes depending on loading level of the region and the risk
of instability proportional with loading level.
In the spring scenario, due to the generation regime in Black Sea region,
instability risk becomes evident in case of losing any line forming Borçka-
Çarşamba 400 kV transmission corridor. Again, the instability situation changes
depending on generation dispatch scheme of the region and the risk of instability
increases proportionally with generation level.

109
Transient stability analyses also identify the behavior of power system elements and
their related variables which are used to detect instability pattern in the region.
Specifically, angle differences and deviations are utilized for SPS logic design.
Based on the results of these three main analyses, a PMU based special protection
scheme is developed for the region. Considering the transmission structure in the region,
that includes a giant ring which consists of 2 main 400 kV transmission corridors
intersecting on the substation of interconnection, 3 PMU points are selected for system
observation. These PMUs are located on end points of main 400 kV transmission
corridors and on the intersection point (i.e., Borçka). With this placement, required
degree of system observation is obtained.
After determining the measurement points and variables that are required to form SPS
logic, design study is focused on logic interpretation. For this purpose, first, fault and
fault location detection functions are developed. These functions clarify the activation
point of the proposed SPS. Following the activation, SPS determines the magnitude of
required countermeasures that mitigate the effect of that contingency. In the
determination process, 3 different threshold levels and time dials are utilized in order to
optimize system preventive actions. Hence, a step- by-step countermeasure activation
approach is suggested for implementation. Additionally, due to the uncertainty in the
availability of countermeasures, which are actually generators in the region, available
online countermeasure detection function is included in the SPS.
Finally, the proposed scheme is formed in a simulation environment in order to examine
its reliability and dependability. All scenarios, loading conditions and contingencies
simulated in transiently stability analysis are repeated for testing and evaluation. Results
have shown that proposed special protection scheme successfully manages all possible
contingencies in the region and eliminates the risk of instability without endangering the
remaining Turkish power system.

110

111
REFERENCES
[1] C. Gençoğlu, O. Tanıdır and O. Tör, "Technical Feasibility Analysis for Georgia-
Turkey HVDC Interconnection," TÜBİTAK UZAY Power Systems Department,
Ankara, 2011.
[2] J. McCalley, "System Protection Schemes: Limitations, Risk, and Management
Final Project Report," PSERC Publication, 2010.
[3] A. Gomez-Exposito, A. J. Gomez and C. Canizares, Electric Energy Systems
Analysis and Operation, CRC Press, 2009.
[4] GSE JSC-International Projects & Reporting Dept., "Annual Report 2012," GSE,
Tblisi, 2012.
[5] "Electricity Prices," Georgia Electricity System Commercial Operator, November
2013. [Online]. Available: http://www.esco.ge. [Accessed 15 December 2013].
[6] Energy Charter Secretariat, "Energy Charter," 2013. [Online]. Available:
http://www.encharter.org/. [Accessed December 2013].
[7] S. Eren, H. Cetinay, A. Geren, O. Tanidir and M. Cebeci., "Türkiye İletim Sistemi
Master Plan Çalışmaları," TÜBİTAK MAM Energy Institute Power Systems
Analysis and Planning Technologies Group, Ankara, 2013.
112
[8] "TEİAŞ: Publications: Load Dispatch Reports," 2013. [Online]. Available:
www.teias.gov.tr. [Accessed December 2013].
[9] S. Eren, H. Çetinay, A. Geren, O. Tanıdır, M. E. Cebeci and O. B. Tör, "Türkiye
Elektrik Sistemi İçin Transformatör Merkezi (TM) Bazlı Bölgesel Talep (MW)
Projeksiyonu Çalışmaları," TÜBİTAK UZAY Power Systems Department, Ankara,
2012.
[10] B. LeReverend and W. Winter, "Operational performance of bulk electricity system
control aids," Electra, vol. N.123, March 1989.
[11] B. LeReverend and P. M. Anderson, "Industry experience with special protection
schemes, discussion," IEEE Transactions on Power Systems, vol. 11, pp. 1167-
1179, August 1996.
[12] M. Begovic et al., "Global Industry Experiences with System Integrity Protection
Schemes," IEEE PSRC Working Group, 2009.
[13] G. Trudel, S. Bernard and G. Scott, "Hydrı-Quebec's defence plan against extreme
contingencies," IEEE Transactions on Power Systems, vol. 14, pp. 958-966, 1999.
[14] C. W. Taylor, "BPA’s Wide-Area stability and voltage Control System (WACS),"
2006. [Online]. Available:
http://www3.imperial.ac.uk/pls/portallive/docs/1/4859962.PDF. [Accessed
December 2013].
[15] BC HYDRO Operations Support Department. [Online]. Available:
http://transmission.bchydro.com/nr/rdonlyres/f56489b9-f09a-452b-a0aa-
6100a8f13aaf/0/7t18.pdf. [Accessed December 2013].
[16] S. Pai, "BCTC’s experience towards a smarter grid - increasing limits and reliability

113
with centralized intelligence Remedial Action Schemes," in Electric Power
Conference, EPEC 2008. IEEE Canada, Vancouver, BC., 2008.
[17] S. Eren and M. E. Cebeci, "İletim Sistemi Master Plan Çalışması Üretim Tahmin
Raporu (2014-2023 Dönemi)," TÜBİTAK MAM Energy Institute Power Systems
Analysis and Planning Technologies Group, Ankara, 2013.
[18] "EMRA: Electricity Market: Legislation: Turkish Grid Code," [Online]. Available:
http://www.epdk.gov.tr/index.php/elektrik-piyasasi/mevzuat?id=89. [Accessed
December 2013].
[19] P. Kundur, Power System Stability and Control, McGraw-Hill, Inc., 1994.
[20] C.K. Kim, V. K. Sood, G.S. Jang, S.J. Lim and S.J. Lee, HVDC Transmission:
Power Conversion Applications in Power Systems, Singapore: Wiley, 2009.
[21] IEEE Tutorial Course, "Power System Stabilization via Excitation Control," in
IEEE Power Engineering Society General Meeting, 2007.
[22] J. Machovski, J. W. Bialek and J. R. Bumby, Power System Dynamics: Stability
and Control, New York: Wiley, 2008.
[23] IEEE Std. 1110-2002 , "IEEE Guide for Synchronous Generator Modeling
Practices and Applications in Power System Stability Analyses," 2002.
[24] IEEE Std. 421.5-2005, "IEEE Recommended Practice for Excitation System
Models for Power System Stability Studies".

114

115
APPENDIX - A
SINGLE LINE DIAGRAM OF THE REGION

116
Figure A-1. Single Line Diagram of the Region

117
APPENDIX – B
HARMONIC ANALYSIS REGARDING HVDC B2B
INTERCONNECTION
It is known that any nonlinear load is a harmonic current source and hence should be
sufficiently compensated in order not to overload the electrical equipment with
excessive reactive power that has no practical use. Since a group of customers are
interconnected to the power system at a specific node (Point of Common Coupling,
PCC), the transmission system operator is responsible from maintaining an acceptable
sinusoidal voltage wave shape for the quality of supply.
Any B2B converter is, similarly, a source of harmonic currents and hence should be
compensated adequately so as to maintain the power quality standards defined in the
Turkish Grid Code [18]. In order to analyze whether this standart is satisfied in Borçka
substation after connection with HVDC B2B substation or not, the worst case in the
sense of harmonics, that is 700 MW power transfer from Georgia, is analyzed
considering the inverter side of this interconnection is Turkey. The time domain
simulation results of the B2B converter is illustrated in Figure B-1.
One can immediately see the distortion on the voltage wave shape at Borçka substation,
due to the nonlinear nature of the inverter. The harmonic spectrum of the inverter current
is illustrated in Figure B-2.

118
Figure B-1. Time domain transient switching results of the B2B converter
Figure B-2. The harmonic spectrum of inverter current
1 1.01 1.02 1.03 1.04 1.05 1.06 1.07 1.08 1.09 1.1-1
-0.5
0
0.5
1Time Domain Transient Simulation Results
Vo
ltag
e
@ A
kh
alt
sik
he S
S
(pu
)
1 1.01 1.02 1.03 1.04 1.05 1.06 1.07 1.08 1.09 1.1-5
0
5
Invert
er
Cu
rren
t
(pu
)
1 1.01 1.02 1.03 1.04 1.05 1.06 1.07 1.08 1.09 1.1-1
-0.5
0
0.5
1
Vo
ltag
e
@ B
orc
ka S
S
(pu
)
1 1.01 1.02 1.03 1.04 1.05 1.06 1.07 1.08 1.09 1.1-10
-5
0
5
10
Time (sec)
Lin
e C
urr
en
t
(Filte
red
)
(pu
)
0 500 1000 1500 2000 2500 30000
0.5
1
1.5
2
2.5Amplitude Spectrum of Inverter Current
Frequency (Hz)
Am
plitu
de o
f V
olt
ag
e
(pu
)

119
As can be readily seen in Figure B-2, the most dominant harmonic of the inverter current
is the 11th
harmonic. This verifies the necessity of the harmonic filters that should be
tuned as mentioned in the Section 3.3 of this study. It should be noted that in most
applications, the 11th
and 13th
harmonic filters are tuned with a quality factor of 100.
The harmonic spectrum of line current at the receiving end of the transmission line (i.e.,
Borçka substation) is illustrated in Figure B-3. It can be observed that the problematic
harmonic components are eliminated by analyzing Figure B-1 and Figure B-3 together.
The harmonic spectrum of voltage at Borçka substation is illustrated in Figure B-4. The
comparison of the harmonic components of the voltage waveform illustrated in Figure
B-1 and Figure B-4 are listed in Table B-1. Table B-1 clearly expresses that all
requirements of the grid code are satisfied.
Figure B-3. The harmonic spectrum of the current at the receiving end (Borçka substation) of the
transmission line
0 500 1000 1500 2000 2500 30000
0.1
0.2
0.3
0.4
0.5
0.6
0.7
0.8
0.9
1Amplitude Spectrum of Filtered Current
Frequency (Hz)
Am
plitu
de o
f V
olt
ag
e
(pu
)

120
Figure B-4. The harmonic spectrum of the voltage at Borçka substation
Table B-1: The comparison of the voltage harmonics related to the B2B converter and Turkish grid
code requirements
Odd Harmonics (Non multiples of 3) Odd Harmonics (Multiples of 3) Even Harmonics
Harmonic
Number
Harmonic
Voltage (%)
Simulation
Results (%)
Harmonic
Number
Harmonic
Voltage (%)
Simulation
Results (%)
Harmonic
Number
Harmonic
Voltage (%)
Simulation
Results (%)
5 1.25 0.1468 3 1 0.5145 2 0.75 0.4
7 1 0.0391 9 0.4 0.0654 4 0.6 0.1543
11 0.7 0.6106 15 0.2 0.0594 6 0.4 0.0045
13 0.7 0.0348 21 0.2 0.023 8 0.4 0.0724
17 0.4 0.0873 >21 0.2 OK 10 0.4 0.0579
19 0.4 0.0109 12 0.2 0.1136
23 0.4 0.0399 >12 0.2 OK
25 0.4 0.0386
>25 0.2+0.2
(25/h) OK
THD < % 2
0 500 1000 1500 2000 2500 30000
0.1
0.2
0.3
0.4
0.5
0.6
0.7
0.8
0.9
1Amplitude Spectrum of Bus Voltage
Frequency (Hz)
Am
plitu
de o
f V
olt
ag
e
(pu
)