Embed Size (px)
Citation preview

THE PENNSYLVANIA STATE UNIVERSITY
SCHREYER HONORS COLLEGE
DEPARTMENT OF AEROSPACE ENGINEERING
DESIGN OF A SERIES OF AIRFOILS FOR THE PSU ZEPHYRUS
HUMAN-POWERED AIRCRAFT
Tony S. Tao
A thesis submitted in partial fulfillment of the requirements for a baccalaureate degree in
Aerospace Engineering with honors in Aerospace Engineering.
SPRING 2010
Reviewed and approved* by the following
Mark D. Maughmer
Professor of Aerospace Engineering
Thesis Supervisor
Robert G. Melton
Professor of Aerospace Engineering and Director of Undergraduate Studies
Honors Adviser
Barnes W. McCormick
Professor Emeritus of Aerospace Engineering
Faculty Reader
George A. Lesieutre
Professor and Head of Aerospace Engineering
Faculty Reader
*Signatures are on file in the Schreyer Honors College

i
ABSTRACT
The Flight Vehicle Design and Fabrication class at The Pennsylvania State University
(AERSP 204H/404H) is working on the design and construction of a human-powered aircraft
(HPA) which will compete for The Kremer International Sporting Aircraft Competition hosted by
the Royal Aeronautical Society. The aircraft design has matured over the last three years and the
prototype design is being finalized. In an attempt to improve the performance of the aircraft, a
series of airfoils for the major aerodynamic surfaces (wing, horizontal tail, and vertical tail) were
designed specifically-tailored to the aircraft’s operational envelope, structural requirements, and
desired handling qualities. The baseline planforms and structures of the aerodynamic surfaces are
not altered in the design process. To design the airfoils, the surfaces were first analyzed with a 3-
D lifting-panel method to determine the local lift coefficients corresponding to the HPA’s desired
cruise range. Airfoil minimum thickness requirements are derived from minimum construction
sizes for pre-preg carbon fiber and balsa wood. The handling characteristics were qualitatively
considered into the airfoil design. The analysis showed that the wing airfoil should operate with a
clmax of 1.6 at Reynolds number (Re) of 511000, a laminar drag bucket from cl=1.0 to cl=0.6
(within the range of Re=352000 to 716000) with a gentle exit at the higher corner of the bucket in
all conditions, and a t/cmin of 12.3%. For the purpose of not introducing a higher load on the tail
than previously designed, the pitching moment, cmac, of the wing airfoil should be no higher in
magnitude than the baseline airfoil, the E395. The horizontal tail airfoil should have a drag bucket
of cl=±0.3 in the Re range of 214000 to 385000 with a gentle exit on both sides, a clmax of 1.0 in
the same Re range to give good tail authority, and a t/cmin of 10.6% to allow for structure. The
vertical tail airfoil should be symmetrical and have low drag in at cl=0 while sloping off gently to
a clmax of no less than 1.0 at a Re of 443000 to match the stability and control sizing used for the
aircraft. Using these desired characteristics, pressure distributions are designed and, using the
PROFIL program created by Dr. Richard Eppler, a series of airfoils were iterated upon until these
requirements were met. The airfoils are analyzed in both PROFIL and XFOIL showing good
agreement and generally successful satisfaction of design requirements. Further 2-D and 3-D
analysis predict that these airfoils improve the performance of the aircraft at flight speeds from 10
m/s to 16 m/s while decreasing performance slightly at flight speeds below 10 m/s. Suggestions
are made for future work that should yield improvements in airfoil and aircraft performance.

ii
TABLE OF CONTENTS
ABSTRACT ....................................................................................................................... i
TABLE OF CONTENTS .................................................................................................... ii
LIST OF FIGURES ............................................................................................................ iv
LIST OF TABLES .............................................................................................................. vii
ACKNOWLEDGEMENTS ................................................................................................ viii
Nomenclature and Conventions Used .................................................................................. ix
Chapter 1 Project Background ............................................................................................. 1
The Kremer Sporting Aircraft Competition .................................................................. 2 Objectives and Scope of Work ..................................................................................... 3 Software Used ............................................................................................................. 4
Chapter 2 Low Reynolds Design Considerations ................................................................. 5
Chapter 3 Baseline Aircraft Design ..................................................................................... 8
Mission Path and Operational Range ........................................................................... 8 Wing ........................................................................................................................... 9 Horizontal Tail ............................................................................................................ 11 Vertical Tail ................................................................................................................ 12 Pilot Pod ..................................................................................................................... 13 Entire Aircraft ............................................................................................................. 14 Drag Buildup Analysis ................................................................................................ 15 Aircraft Power ............................................................................................................. 16
Chapter 4 Analysis of Aircraft Operating Range and Requirement Generation..................... 18
Structural considerations ............................................................................................. 18 Vertical Tail ................................................................................................................ 19 Horizontal Tail ............................................................................................................ 20 Wing ........................................................................................................................... 21
Chapter 5 Airfoil Design ..................................................................................................... 25
Foreword ..................................................................................................................... 25 The Eppler Airfoil Design Code PROFIL .................................................................... 26
Design Methodology ............................................................................................ 28 Designed Airfoils ........................................................................................................ 29
Vertical Tail Airfoil ............................................................................................. 29 Horizontal Tail ..................................................................................................... 35 Wing Airfoil ........................................................................................................ 40

iii
Chapter 6 Resulting Change in Aircraft Performance Characteristics ................................... 53
Drag Buildup ............................................................................................................... 53 Aircraft Power ............................................................................................................. 54
Chapter 7 Future Work........................................................................................................ 56
Airfoil Testing for clmax ................................................................................................ 56 Airfoil Refinement ...................................................................................................... 56 Wing Area Increase ..................................................................................................... 56
Chapter 8 Conclusion .......................................................................................................... 57
Works Cited ........................................................................................................................ 59
Appendix .................................................................................................................... 60 Coordinates of the V21 airfoil: .................................................................................... 60 PROFIL Code input for V21 ........................................................................................ 61 Coordinates of the H8 airfoil ....................................................................................... 62 PROFIL Code input for H8.......................................................................................... 63 Coordinates of the W13 airfoil ..................................................................................... 64 PROFIL Code input for W13 ....................................................................................... 65
iv
LIST OF FIGURES
Figure 1: The Gossamer Condor in flight ............................................................................ 2
Figure 2: Course Diagram for the Kremer Sporting Aircraft Competition ............................ 3
Figure 3: A laminar drag bucket .......................................................................................... 5
Figure 4: Illustration of a Laminar Separation Bubble ......................................................... 6
Figure 5: XFOIL results showing an LSB ............................................................................ 7
Figure 6: Mission Path visualization in MATLAB ............................................................... 8
Figure 7: The E395 HPA airfoil .......................................................................................... 9
Figure 8: Total wing drag to lift 220 lb vs flight speed ......................................................... 9
Figure 9: Baseline wing of the HPA .................................................................................... 10
Figure 10: Wing planform and spar tubes ............................................................................ 10
Figure 11: Rib section ......................................................................................................... 11
Figure 12: Planform of the horizontal tail ............................................................................ 11
Figure 13: The S9026 airfoil ............................................................................................... 12
Figure 14: Planform of the vertical tail ................................................................................ 12
Figure 15: Pod structure and pilot ........................................................................................ 13
Figure 16: Pod aerodynamic visualization ........................................................................... 13
Figure 17: 3-view of the PSU Zephyrus ............................................................................... 14
Figure 18: HPA Drag buildup (baseline) ............................................................................. 15
Figure 19: Aircraft power available and required ................................................................. 16
Figure 20: Power to climb vs airspeed ................................................................................. 17
Figure 21: Students manufacturing carbon fiber tube ........................................................... 18
Figure 22: Vertical tail airfoil structural envelope ................................................................ 19
v
Figure 23: Desired drag polar for VT .................................................................................. 20
Figure 24: Horizontal tail airfoil structural envelope ............................................................ 20
Figure 25: Desired drag polar for HT .................................................................................. 21
Figure 26: Wing airfoil structural envelope ......................................................................... 22
Figure 27: cl vs span and flight speed of HPA wing ............................................................. 22
Figure 28: cl and Re envelope for wing airfoil ..................................................................... 23
Figure 29: Desired drag polar for wing ................................................................................ 24
Figure 30: Eppler design lines ............................................................................................. 26
Figure 31: Circle plane and resulting airfoil shape ............................................................... 27
Figure 32: PROFIL program and human-in-loop iteration loop ............................................ 28
Figure 33: The V21 airfoil for the vertical tail ..................................................................... 29
Figure 34: Vertical tali airfoil compared against S9026 airfoil ............................................. 30
Figure 35: V21, S9026, NACA 9.28% compared Re=385k ................................................. 32
Figure 36: V21, S9026, NACA 9.28% compared Re=400k ................................................. 33
Figure 37: V21, S9026, NACA 9.28% compared Re=485k ................................................. 34
Figure 38: Horizontal tail airfoil H8 .................................................................................... 35
Figure 39: Horizontal tail airfoil (H8, or 1008) compared against scaled NACA airfoil ........ 36
Figure 40: H8 compared against NACA 10.6% at Re=274k................................................. 37
Figure 41: H8 compared against NACA 10.6% at Re=330k................................................. 38
Figure 42: H8 compared against NACA 10.6 at Re=385k .................................................... 39
Figure 43: The W13 (or 2013) airfoil .................................................................................. 40
Figure 44: PROFIl drag polars of E395 and 2013 compared ................................................ 41
Figure 45: XFOIL drag polar of W13 compared against E395, Re=293k ............................. 42
Figure 46: XFOIL results of W13 compared against E395, Re=293k ................................... 43
Figure 47: XFOIL drag polar of W13 compared against E395, Re=352k ............................. 44
vi
Figure 48: XFOIL results of W13 compared against E395, Re=352k ................................... 45
Figure 49: XFOIL drag polar of W13 compared against E395, Re=503k ............................. 46
Figure 50: XFOIL results of W13 compared against E395, Re=503k ................................... 47
Figure 51: XFOIL drag polar of W13 compared against E395, Re=622k ............................. 48
Figure 52: XFOIL results of W13 compared against E395, Re=622k ................................... 49
Figure 53: XFOIL drag polar of W13 compared against E395, Re=716k ............................. 50
Figure 54: XFOIL results of W13 compared against E395, Re=716k ................................... 51
Figure 55: Drag buildup of HPA with new airfoils .............................................................. 53
Figure 56: Aircraft power required curves using new and old airfoils .................................. 54
Figure 57: Power-to-Climb of old vs new airfoils for entire aircraft ..................................... 55
Figure 58: Wing drag polars required to lift 220 lb compared .............................................. 57

vii
LIST OF TABLES
Table 1: Cruise speed range of the HPA .............................................................................. 8
Table 2: Key HPA operational points (k=thousand) ............................................................. 17

viii
ACKNOWLEDGEMENTS
This work would not have been possible without contributions from my mentors,
colleagues, and the pioneers of airfoil design and analysis theory. Firstly, I would like to extend
my gratitude to Dr. Mark D. Maughmer of The Pennsylvania State University for his instruction
of the Flight Vehicle Design and Fabrication class, for his teaching of the AERSP 425 and 509
classes, and for his mentorship during this project. I would like to thank Bernardo Vieiera for his
advice and his willingness to share his documentation on the Eppler codes. I would also like to
thank the students in the AERSP 204H/404H class for their work in design and fabrication –
especially John F (Jack) Quindlen for his work on stability and control design for the HPA and
Benjamin Pipenberg for his help in HPA structural design and fabrication.
This project would also have been impossible without the airfoil theory and
computational work conducted by Dr. Richard Eppler for his development of the PROFIL
program and Mr. Dan Somers for his contribution on the same. Also, I would also like to thank
Dr. Mark Drela for his software, XFOIL, and Andre Depperois who develops the XFLR5/QFLR5
program which allows XFOIL to be applied to 3-dimensional aerodynamic surfaces via lifting-
line, vortex-lattice, and 3-D panel methods.
Lastly, I would like to extend thanks to the Royal Aeronautical Society for hosting the
Kremer prize competitions.
ix
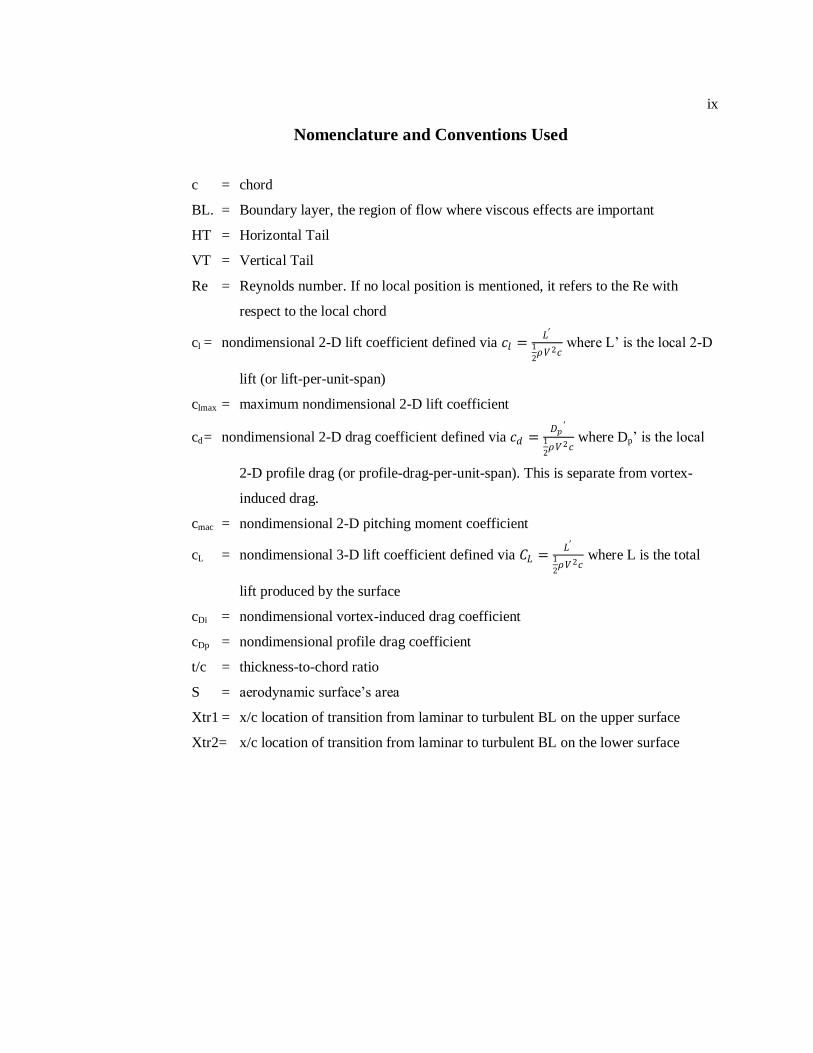
Nomenclature and Conventions Used
c = chord
BL. = Boundary layer, the region of flow where viscous effects are important
HT = Horizontal Tail
VT = Vertical Tail
Re = Reynolds number. If no local position is mentioned, it refers to the Re with
respect to the local chord
cl = nondimensional 2-D lift coefficient defined via 𝑐𝑙 =𝐿′
1
2𝜌𝑉2𝑐
where L’ is the local 2-D
lift (or lift-per-unit-span)
clmax = maximum nondimensional 2-D lift coefficient
cd = nondimensional 2-D drag coefficient defined via 𝑐𝑑 =𝐷𝑝
′
1
2𝜌𝑉2𝑐
where Dp’ is the local
2-D profile drag (or profile-drag-per-unit-span). This is separate from vortex-
induced drag.
cmac = nondimensional 2-D pitching moment coefficient
cL = nondimensional 3-D lift coefficient defined via 𝐶𝐿 =𝐿′
1
2𝜌𝑉2𝑐
where L is the total
lift produced by the surface
cDi = nondimensional vortex-induced drag coefficient
cDp = nondimensional profile drag coefficient
t/c = thickness-to-chord ratio
S = aerodynamic surface’s area
Xtr1 = x/c location of transition from laminar to turbulent BL on the upper surface
Xtr2= x/c location of transition from laminar to turbulent BL on the lower surface

1
Chapter 1
Project Background
The Flight Vehicle Design and Fabrication honors course at The Pennsylvania State
University (AERSP 204H/404H) was established in 1989 to provide a hands-on project-based
learning experience to students in aerospace engineering similar to the Akademische
Fliegergruppe of Germany. The class has two major components – general lecture and aircraft
project work. Lectures are scheduled in regular class time while students work in the laboratory
outside of class to design, build, and fly aircraft projects. One of the class’s strengths is its multi-
year format that allows students from freshmen to seniors to work together. This environment
promotes team skills are learned and knowledge is passed from upperclassmen to underclassmen
before the underclassmen would otherwise learn in class, giving them a head start in their studies.
For most of its history, the class has been focused on the design and construction of
sailplanes. In the spring of 2007, the class started on the design of a human-powered aircraft
(HPA) dubbed Zephyrus in response to the Kremer Sporting Aircraft competition, hosted by the
Royal Aeronautical Society of the United Kingdom. The first design iteration was completed in
2009 and a second iteration shall be concluded at the end of the academic year (spring 2010)
along with the initialization of prototype construction.
2
The Kremer Sporting Aircraft Competition
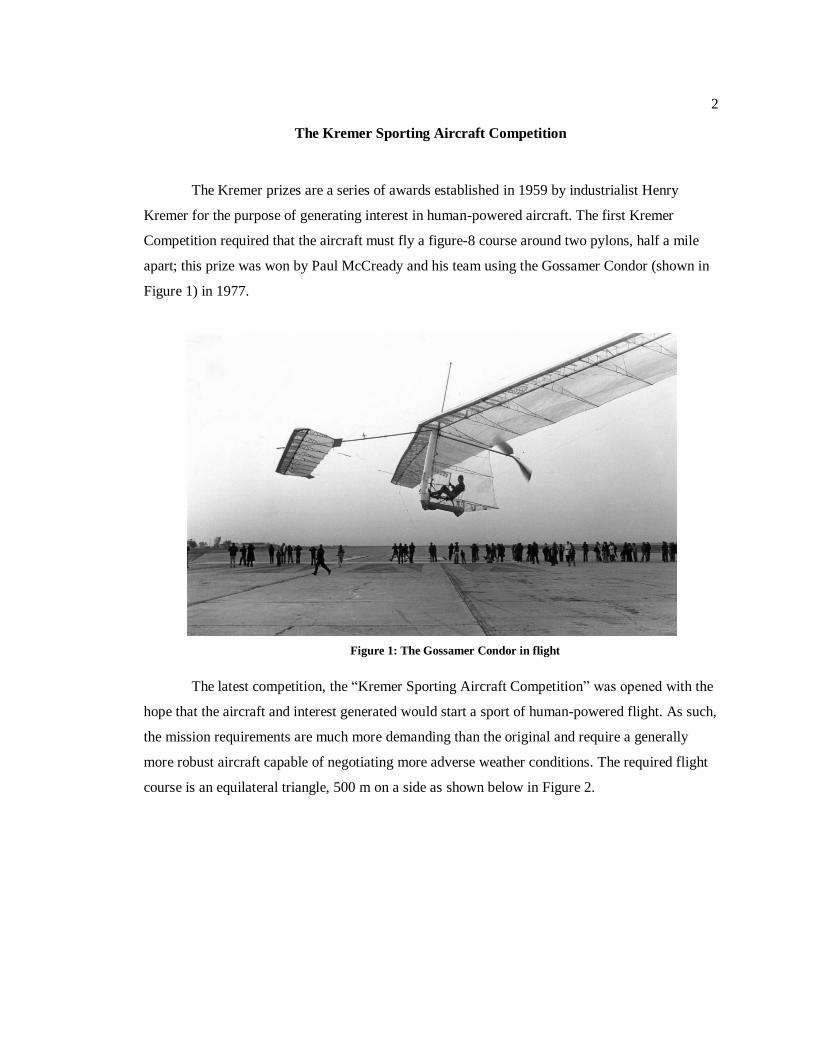
The Kremer prizes are a series of awards established in 1959 by industrialist Henry
Kremer for the purpose of generating interest in human-powered aircraft. The first Kremer
Competition required that the aircraft must fly a figure-8 course around two pylons, half a mile
apart; this prize was won by Paul McCready and his team using the Gossamer Condor (shown in
Figure 1) in 1977.
Figure 1: The Gossamer Condor in flight
The latest competition, the “Kremer Sporting Aircraft Competition” was opened with the
hope that the aircraft and interest generated would start a sport of human-powered flight. As such,
the mission requirements are much more demanding than the original and require a generally
more robust aircraft capable of negotiating more adverse weather conditions. The required flight
course is an equilateral triangle, 500 m on a side as shown below in Figure 2.

3
Figure 2: Course Diagram for the Kremer Sporting Aircraft Competition
The rules state that aircraft must complete two laps of the circuit (one clockwise and one
counterclockwise) with a total in-course flight time of no longer than 7 minutes. There is a
maximum of one hour in between flights in which the pilot may rest. The aircraft must fly at an
altitude of at least 5 meters when entering and exiting the course.
To ensure that the aircraft would be one that would be capable in non-ideal weather, the
rules state that, during a flight attempt, there must be a 5 m/s wind (measured at 10-m above
ground level) which must not fall below 5 m/s for more than 20 continuous seconds.
These required times and required wind speeds drive the aerodynamic performance and
stability and control design of the Zephyrus.
Objectives and Scope of Work
As the preliminary design of the HPA is closing and the production of a prototype is
underway, the scope of this project will be limited to designing one airfoil for each of the HPA’s
major aerodynamic surfaces (wing, horizontal tail, and vertical tail) such that net performance of
the aircraft is increased from the baseline design and its construction made feasible. These airfoils

4
should therefore be “swap-in” replacements for the airfoils originally chosen for the HPA and
should require minimum alteration of the existing design.
There is one notable omission from the wing airfoil design; whereas the real wing shall
have ailerons, the airfoils will not be designed for them because the turning aileron requirements
have not been fully defined.
Since these are the first airfoils designed by the author, and there are academic and
practical deadlines (as to not delay the construction of the prototype aircraft), one would expect,
naturally, that these airfoils will be imperfect and there will be much room for improvement in
future iterations. Possible areas of improvement for the airfoils are discussed in the Future Work
section.
Software Used
The primary tool used for airfoil design is the PROFIL program (2007 version)
developed by Dr. Richard Eppler (Eppler, Airfoil Design and Data, 1990). A description of its
operation is described in later sections.
XFOIL (ver 6.94) airfoil analysis program was also used to predict airfoil characteristics
and to generate data for the 3-D analysis. XFOIL was written by Dr. Mark Drela of MIT, released
under the public GNU public license.
3-Dimensional analysis of surfaces was conducted via modeling in XFLR5 (specifically,
QFLR5 version 0.04 beta) developed by Andre Deperrois, released under the public GNU public
license. The program works by running XFOIL to populate a data space of 2-D airfoil data which
is then used to calculate influence matrices over a wing which are solved and cross-checked with
the 2-D data to find wing drag and moment distributions (Deperrois).
Structural layout drawings were made in SolidWorks.
Drag-buildup analyses were conducted in Microsoft Excel using large tables.

5
Chapter 2
Low Reynolds Design Considerations
HPAs, remote-controlled aircraft, and sailplanes operate with relatively low Reynolds
numbers (below Re= 1,000,000). In this region, the viscous forces are in higher proportion to the
inertial forces than in larger, faster human transport aircraft (general aviation and commercial
transport). Aerodynamic coefficients are very sensitive to Re in this low-Re range. Therefore,
specific attention is paid to Re in the following analyses.
In this low-Re region, the flow is characterized by long runs of laminar boundary layers
and transition (usually) via laminar separation bubbles. The presence of long runs of laminar flow
has the advantage that the skin-friction drag component from a laminar boundary layer is much
lower than that of the turbulent boundary layer. An airfoil may be designed such that there are
long runs of laminar flow on both the upper and lower surfaces of the airfoil yielding lower drag
than at other points in its operating range. This range of low-drag due to a predominance of
laminar flow is called a “drag bucket.” A diagram showing the drag bucket and selected transition
points is shown below in Figure 3.
Figure 3: A laminar drag bucket
In the above figure, the bucket extends from point A to point C on the cl vs cd polar.
Example transition points on the airfoil are denoted by the black triangles on the right side of the

6
figure. At point B, both the upper surface and lower surface have long runs of laminar flow,
yielding lower drag. Between point A and C, as the angle of attack (and therefore cl) is increased,
the transition point moves forward on the upper surface, the transition point on the lower surface
moves back, yielding near-constant drag. At point A, as the airfoil moves to higher angle of
attack, the transition on the upper surface (denoted by the black triangle on the upper surface of
the airfoil) moves forward rapidly, yielding more turbulent flow and therefore increased skin
friction drag on the airfoil. At point C, as the airfoil moves to a lower angle of attack, the
transition point on the lower surface (denoted by the black triangle there) moves forward rapidly,
yielding a similar increase in drag.
While a laminar BL produces less drag than turbulent BL, a laminar BL is less able to
negotiate an adverse pressure gradient than a turbulent one. In the Re range the HPA shall be
operating, in a pressure-recovery area of the airfoil, transitions usually occur with a laminar
separation bubble (LSB); an illustration is shown in Figure 4.
Figure 4: Illustration of a Laminar Separation Bubble
LSBs arise when the laminar boundary layer runs out of momentum in an adverse
pressure gradient and leaves the surface of the airfoil. In the free stream, the free shear layer
transitions from laminar flow to turbulent flow and a low-pressure zone at the rear of the
separated region brings the BL back in contact with the airfoil surface. (If the airfoil surface is
sufficiently steep so that the flow is unable to reattach, the airfoil would be stalled laminarly.)
This reattached turbulent flow has flow mixing which brings higher-momentum fluid from the

7
upper (faster) air and energizes the lower layers, allowing it to better negotiate an adverse
pressure gradient. Thus, it is often beneficial to have the BL transition (via LSB or otherwise) at
the start of the pressure recovery region of the airfoil.
There is a drag penalty associated with the LSB. Both XFOIL and PROFIL are capable of
taking into account the effects of the LSB. Figure 5 below shows a large LSB predicted by
XFOIL for an NACA 4412 airfoil operating at a Re of 500,000.
Figure 5: XFOIL results showing an LSB
As can be seen in the above figure, the inviscid (dashed line) and viscous (solid line)
pressure distributions are the same (to first-order accuracy). The LSB from x/c of 0.45 to 0.55
causes the displacement thickness to grow larger and yields an increase in lift and drag.
All these flow features must be taken into account when designing airfoils for low-Re
applications. A properly-designed low-Re airfoil will take advantage of the laminar boundary
layer characteristics and negotiate the LSB carefully to reduce the drag caused by them.
8
Chapter 3
Baseline Aircraft Design
This section outlines the baseline design of the HPA as designed in the 2010 iteration.
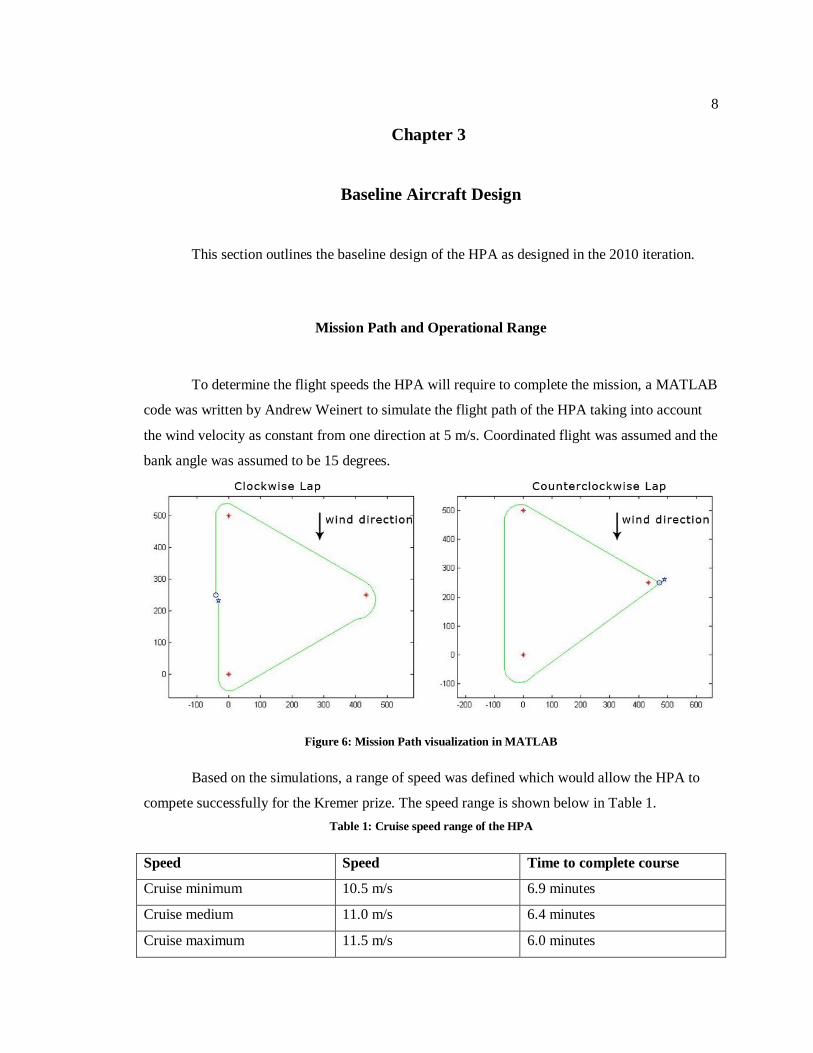
Mission Path and Operational Range
To determine the flight speeds the HPA will require to complete the mission, a MATLAB
code was written by Andrew Weinert to simulate the flight path of the HPA taking into account
the wind velocity as constant from one direction at 5 m/s. Coordinated flight was assumed and the
bank angle was assumed to be 15 degrees.
Figure 6: Mission Path visualization in MATLAB
Based on the simulations, a range of speed was defined which would allow the HPA to
compete successfully for the Kremer prize. The speed range is shown below in Table 1.
Table 1: Cruise speed range of the HPA
Speed Speed Time to complete course
Cruise minimum 10.5 m/s 6.9 minutes
Cruise medium 11.0 m/s 6.4 minutes
Cruise maximum 11.5 m/s 6.0 minutes

9
All components on the baseline aircraft were designed around these cruise speeds a take-
off gross weight estimate of 220 lb. A flying altitude of 6 meters was assumed to generate an
estimate for ground effect. This estimate should be conservative since the aircraft is allowed to
dip below 5 meters altitude for the majority of the flight, allowing for more reduction in drag due
to ground effect.
Wing
The baseline airfoil for the wing was the E395 airfoil designed for human-powered
aircraft by Eppler, which is shown in Figure 7.
Figure 7: The E395 HPA airfoil
Using this airfoil, the wing of the HPA was designed to minimize total drag at 11.5 m/s
so that the power required for the aircraft could be minimized for the maximum cruise speed. A
drag polar of the wing is shown in Figure 8.
Figure 8: Total wing drag to lift 220 lb vs flight speed

10
A top-view of the wing showing key dimensions is shown in Figure 9 (dimensions in
meters). When deflected, the span efficiency of the wing is calculated to be 99% using a 3-D
lifting panel method in QFLR5.
Figure 9: Baseline wing of the HPA
The main structure of the wing is planned to be comprised of a series of pre-preg carbon
fiber tubes, telescoping from a diameter of 3.5 inches to 1.5 inches at the tip as shown in Figure
10 (all dimensions in inches).
Figure 10: Wing planform and spar tubes
11
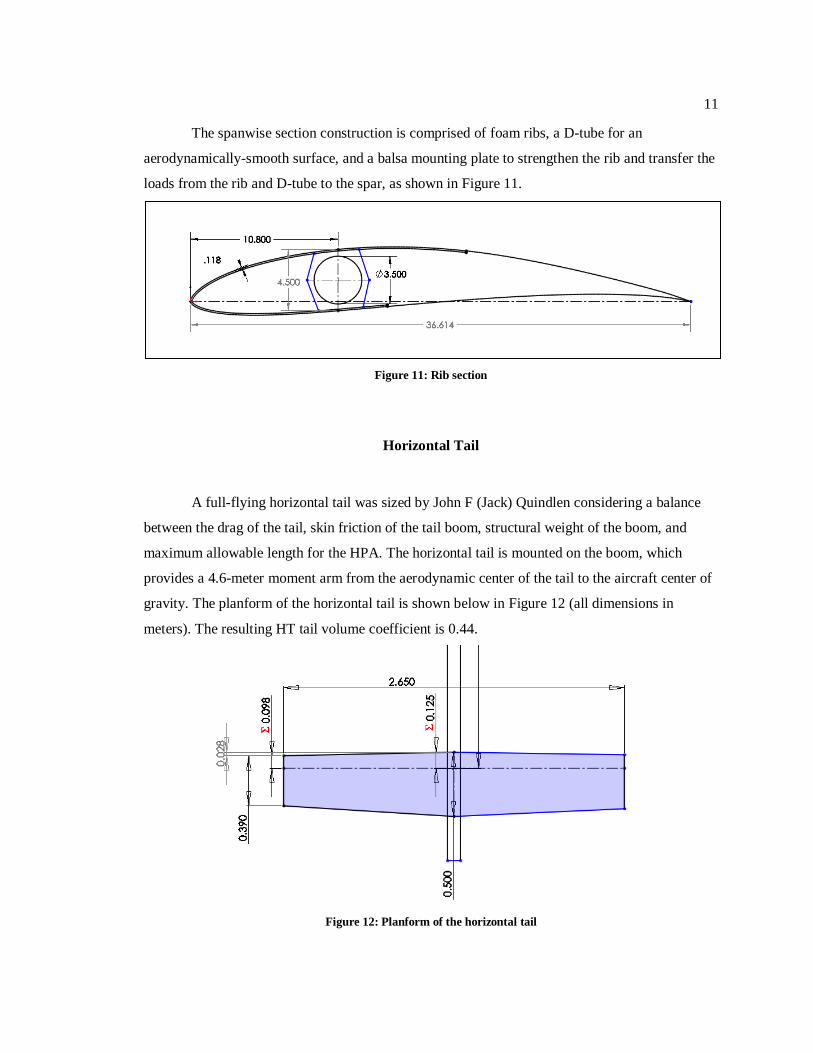
The spanwise section construction is comprised of foam ribs, a D-tube for an
aerodynamically-smooth surface, and a balsa mounting plate to strengthen the rib and transfer the
loads from the rib and D-tube to the spar, as shown in Figure 11.
Figure 11: Rib section
Horizontal Tail
A full-flying horizontal tail was sized by John F (Jack) Quindlen considering a balance
between the drag of the tail, skin friction of the tail boom, structural weight of the boom, and
maximum allowable length for the HPA. The horizontal tail is mounted on the boom, which
provides a 4.6-meter moment arm from the aerodynamic center of the tail to the aircraft center of
gravity. The planform of the horizontal tail is shown below in Figure 12 (all dimensions in
meters). The resulting HT tail volume coefficient is 0.44.
Figure 12: Planform of the horizontal tail

12
In the conceptual design phase, the S9026 airfoil created by Dr. Michael Selig of the
University of Illinois at Urbana-Champaign had been chosen for the HPA horizontal tailplane.
This airfoil (shown in Figure 13) is currently used on several remote-controlled sailplanes.
Figure 13: The S9026 airfoil
The construction method of the horizontal tail is planned to be the same as with the wing,
except using balsa instead of foam for the rib and the D-tube.
Vertical Tail
The full-flying vertical tail (planform shown in
Figure 14, dimensions in meters) was also sized by Quindlen and is sized for maneuverability.
The vertical tail was set to use the same airfoil and construction technique as the horizontal tail.
Figure 14: Planform of the vertical tail

13
Pilot Pod
While not part of the redesign work conducted for this project, it is important to
understand the pilot pod and its role in the aircraft as well as the drag it contributes. The pod’s
purpose is to house the pilot and the systems that must interface with him/her. The pedals,
controls, and landing gear are contained within it.
The pod surface is designed in such a way as to generate the minimum drag possible for
the contents within it. It is designed like a large vertical fin with airfoils that vary along the height
that match the maximum thickness of the airfoils to the maximum thickness of the pilot and
internal systems (pilot shoulders, controls near the hips, and pedals). A structural illustration of
the pod is shown in Figure 15.
Figure 15: Pod structure and pilot
The pod was analyzed as a wing in XFOIL and its results were used to populate a 3-D
panel method which was used to generate a drag estimate. A flow-visualization of the pod is
shown in Figure 16.
Figure 16: Pod aerodynamic visualization

14
Entire Aircraft
A 3-view of the entire aircraft is shown below in the following figure (rotated).
Figure 17: 3-view of the PSU Zephyrus

15
Drag Buildup Analysis
A comprehensive drag buildup (Figure 18) was created with the given design, yielding
the following drag buildup analysis. One point of adjustment must be noted. For reasons that will
be discussed in the Structural Requirements section, the designed planform for the horizontal tail
is incompatible with the S9026 airfoil (9.5% thick) and the available aluminum mandrels. The
minimum structure requires an airfoil at least 10.6% thick. Therefore, the XFOIL-predicted
performance characteristics NACA 0010 airfoil (scaled slightly to 10.6%) was used.
Figure 18: HPA Drag buildup (baseline)
In the above figure, “Di” for a particular surface is the vortex-induced drag as related to
span efficiency, not induced drag as related to Oswald’s efficiency.
16
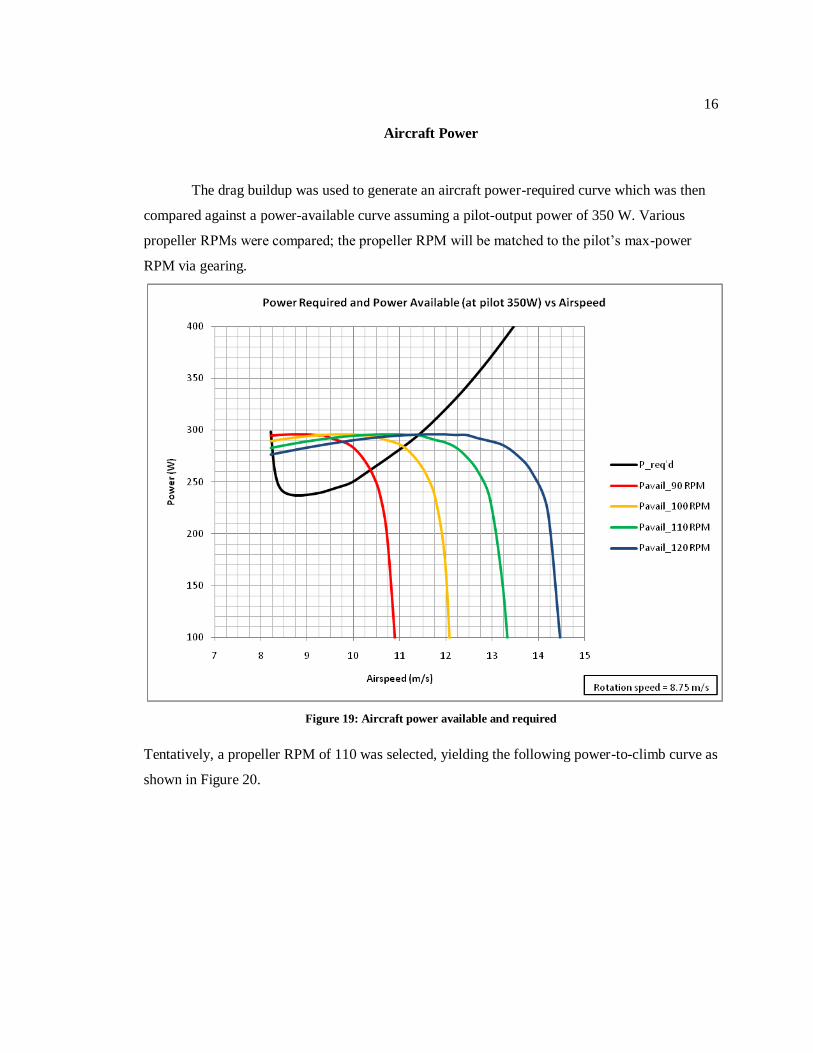
Aircraft Power
The drag buildup was used to generate an aircraft power-required curve which was then
compared against a power-available curve assuming a pilot-output power of 350 W. Various
propeller RPMs were compared; the propeller RPM will be matched to the pilot’s max-power
RPM via gearing.
Figure 19: Aircraft power available and required
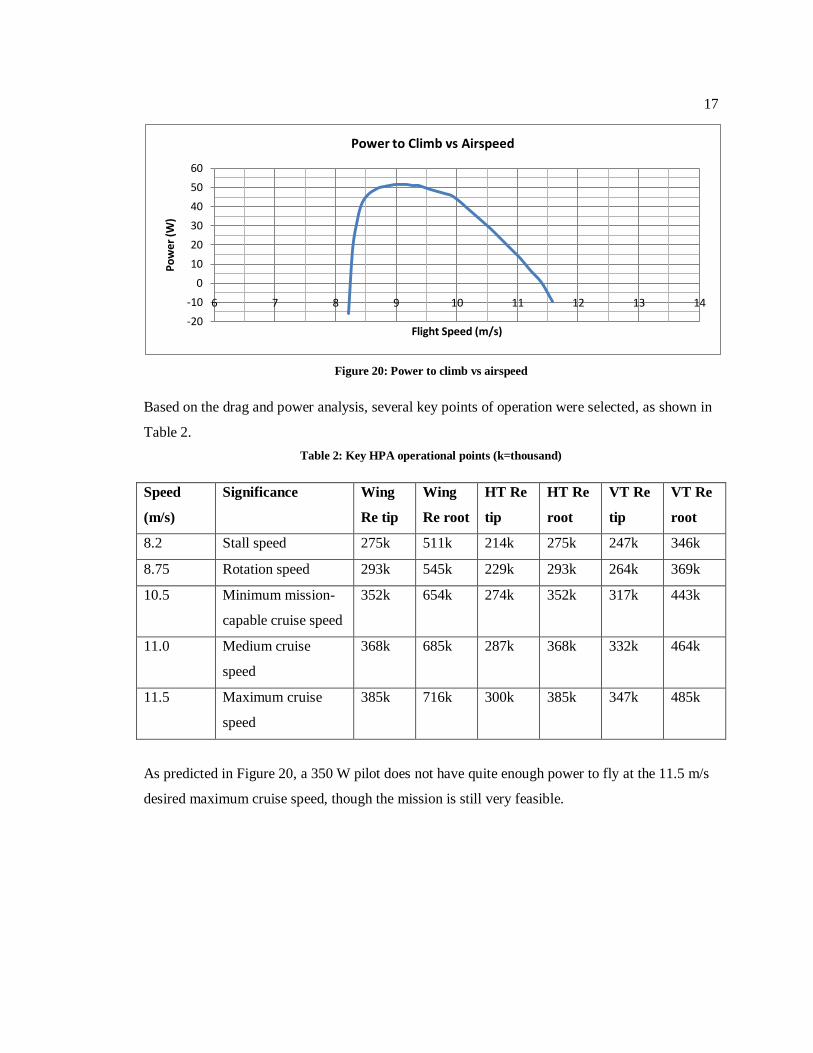
Tentatively, a propeller RPM of 110 was selected, yielding the following power-to-climb curve as
shown in Figure 20.
17
Figure 20: Power to climb vs airspeed
Based on the drag and power analysis, several key points of operation were selected, as shown in
Table 2.
Table 2: Key HPA operational points (k=thousand)
Speed
(m/s)
Significance Wing
Re tip
Wing
Re root
HT Re
tip
HT Re
root
VT Re
tip
VT Re
root
8.2 Stall speed 275k 511k 214k 275k 247k 346k
8.75 Rotation speed 293k 545k 229k 293k 264k 369k
10.5 Minimum mission-
capable cruise speed
352k 654k 274k 352k 317k 443k
11.0 Medium cruise
speed
368k 685k 287k 368k 332k 464k
11.5 Maximum cruise
speed
385k 716k 300k 385k 347k 485k
As predicted in Figure 20, a 350 W pilot does not have quite enough power to fly at the 11.5 m/s
desired maximum cruise speed, though the mission is still very feasible.
-20
-10
0
10
20
30
40
50
60
6 7 8 9 10 11 12 13 14
Po
wer
(W)
Flight Speed (m/s)
Power to Climb vs Airspeed

18
Chapter 4
Analysis of Aircraft Operating Range and Requirement Generation
To design airfoils for the HPA, the first step was to map out the design space in terms of
what cl ranges were required for any given point of operation as defined by Table 2. Structural
requirements for the aerodynamic surfaces are also quantified in this section.
Structural considerations
The structural design of the HPA calls for pre-preg carbon tubes which are currently
being built in the sailplane laboratory. Pre-preg carbon fiber is rolled onto polished aluminum
mandrels and baked in an electric oven for a few hours to cure the carbon. An image of students
working on the tube is shown in Figure 21.
Figure 21: Students manufacturing carbon fiber tube
The manufacturing process yields strong, lightweight, and easily-customizable tubes but
has a few drawbacks. The biggest drawback, which presents a challenge to airfoil design, is that
the mandrels only come in certain sizes. Therefore, there is a minimum spar thickness for which
the airfoils should be designed in order to use this manufacturing technique.

19
Vertical Tail
Structure
The smallest mandrel available is 1.125” in diameter. In order to have the spar extend all
the way to the wingtip and give room for balsa construction around the spar, the airfoil must be at
least 9.2% thick, as shown in Figure 22.
Figure 22: Vertical tail airfoil structural envelope
Aerodynamics
When the vertical tail planform was sized, it was assumed that the maximum cl for the
airfoil at any point in the operating envelope would be 1.0. It was also important to have an airfoil
that would be “docile” and “forgiving” so that the pilot would not be suddenly presented with
high drag during a turn. Therefore, it was determined that the VT airfoil should have a rounded
drag polar, as shown in Figure 23.

20
Figure 23: Desired drag polar for VT
Horizontal Tail
Structure
The same mandrel (1.125” in diameter) can be used for the horizontal tail. However,
because the horizontal tail tip chord is shorter than the vertical tail tip chord, the airfoil must be
thicker (10.6% thick), as shown in Figure 24.
Figure 24: Horizontal tail airfoil structural envelope
Due to this minimum thickness, the S9026 airfoil (9.5% thick) originally selected for the
horizontal tail was found to be unfeasible.

21
Aerodynamics
The aircraft is designed so that the trim drag at the cruise speed of 11 m/s is zero. With
the stability and control sizing conducted by Quindlen, trim calculations for the aircraft show that
it should cruise with a cL that ranges from 0.2 to -0.1 (+ meaning nose-down for the aircraft and –
meaning nose-up). Of course, given more realistic conditions and dynamic motion of the aircraft,
it is necessary to have an airfoil that performs in a wider range to provide ample tail authority.
A clmax of +/- 1.0 was chosen as target specifications for this airfoil with a laminar drag
bucket that extends from +0.3 to -0.3. The airfoil should exit the drag bucket softly. A desired
polar is shown below in Figure 25.
Figure 25: Desired drag polar for HT
Wing
Structure
The largest mandrel available is 3.5” in diameter. Given that changing to a smaller
mandrel will necessarily increase weight, it was decided that the wing airfoil should conform to
this size, yielding a minimum wing airfoil thickness of 12.3% as shown in Figure 26. The

22
thickness was sized at the wing root but the planform and spar tubes are designed so that the wing
never requires a thicker section than at the root.
Figure 26: Wing airfoil structural envelope
Aerodynamics
Because the wing’s effect on the drag of the aircraft is so large, special care was taken to
map out the Re and cls required for flight. A QFLR5 3-D panel method (with pressure data
populated by XFOIL) analysis was used to determine the cl vs span for various important points
of operation as defined by Table 2. A plot of cl vs span is shown in Figure 27.
Figure 27: cl vs span and flight speed of HPA wing

23
Because these operating points occur at different speeds and chords (and therefore Re),
the cl vs Re were also calculated and plotted (in Figure 28) to provide a more comprehensive look
at the operational range of the wing airfoil.
Figure 28: cl and Re envelope for wing airfoil
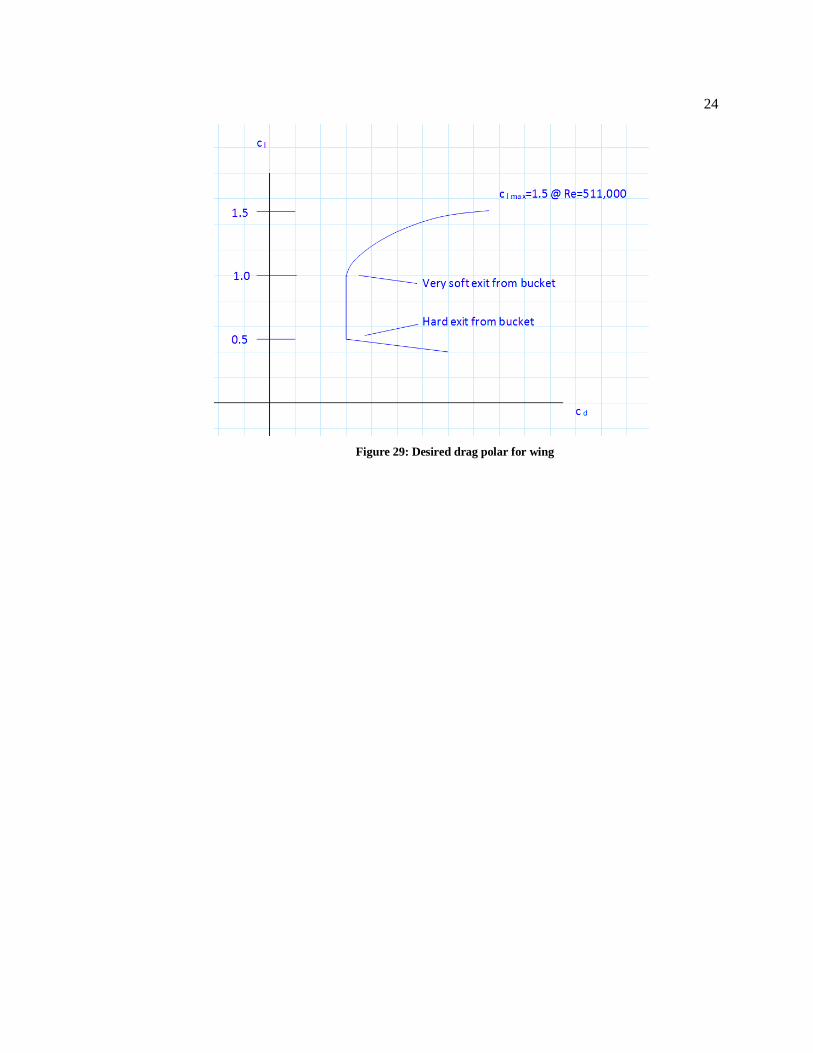
To make handling better for the pilot, it was decided that the drag bucket should be
rounded on the upper side so that the aircraft drag does not increase quickly as the pilot performs
low-speed maneuvers or when the pilot tries to land. The lower corner of the drag bucket was set
to be 0.5 or lower (to give a margin from the cl=0.6 necessary). The bottom of the bucket can be
exited sharply because the aircraft would never fly at those speeds and therefore would not need
the capability (to give the airfoil such a capability costs drag). A summary of the desired polar is
shown in Figure 29
24
Figure 29: Desired drag polar for wing

25
Chapter 5
Airfoil Design
The airfoils are designed based on the requirements for the wing, HT, and VT airfoils
generated in the previous section.
Foreword
The topic of airfoil design is a tricky one. Unlike other engineering disciplines (such as
computer coding) that follow a linear path from requirement to product, airfoil design is much
more (no pun intended) fluid because there are many interdependencies and nuances in the
flowfield for which one needs to account. No sufficiently intelligent, efficient, or comprehensive
automation exists for such a complex design space as this (Maughmer, AERSP 425 lecture,
2009).
To paraphrase Maughmer, one designs an airfoil like the way an artist creates a clay
sculpture. First, the main features are created (laminar flow region, recovery region, etc). Then,
the designer must make adjustments while considering the physics of the flow (How adverse of a
pressure gradient can exist before premature separation? How far can the airfoil be aft-loaded
before the pitching moment is too high? Etc.)
As in sculpture, the first lines drawn are only the rough starting point and are rarely kept
in the finalized version. Unlike sculpture, the change of one section of the airfoil will usually alter
the performance in another part of the operational range; leading to a situation akin to “squeezing
Jell-O” until a satisfactory solution is found.
While the design work is complex, several general rules of thumb are useful. First, a drag
bucket’s depth is inversely proportional to its width. Second, a drag bucket’s vertical location on
a drag polar is related directly to its camber; a highly-cambered airfoil will have a drag bucket
higher in cl than one with lower camber. Third, a thin airfoil will have less drag than a thicker
one. These rules break down in cases of extremely high camber or extremely thick airfoils.
26
The Eppler Airfoil Design Code PROFIL
The PROFIL program was created by Dr. Richard Eppler and has been developed over
the past 50 years. Version 2007 was used for the airfoil designs in this project. The Eppler code
works via a conformal mapping of a circle to an airfoil where various specified arcs of the circle
correspond to respective neutral pressure gradients at respective angles of attack from the zero-lift
angle of attack. Because the airfoil geometry does not change and the angles themselves define
how far away they are from the zero-lift angle, the system is fully defined and the actual values of
the pressure coefficients are not defined by the user. (Eppler, Airfoil Design and Data, 1990)
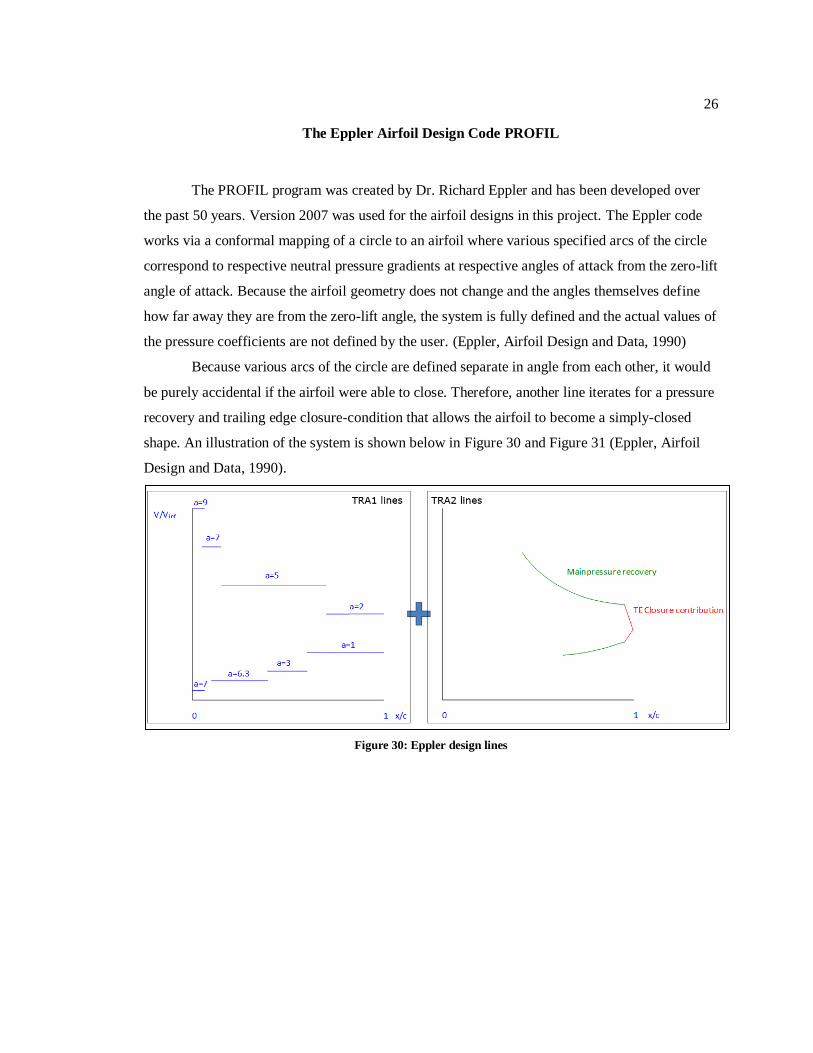
Because various arcs of the circle are defined separate in angle from each other, it would
be purely accidental if the airfoil were able to close. Therefore, another line iterates for a pressure
recovery and trailing edge closure-condition that allows the airfoil to become a simply-closed
shape. An illustration of the system is shown below in Figure 30 and Figure 31 (Eppler, Airfoil
Design and Data, 1990).
Figure 30: Eppler design lines

27
Figure 31: Circle plane and resulting airfoil shape
Other lines specify other features and functions such as transition ramps, flaps, cascades,
and analysis modes (Eppler, Airfoil Program System "PROFIL06" User's Guide, 2006).
28
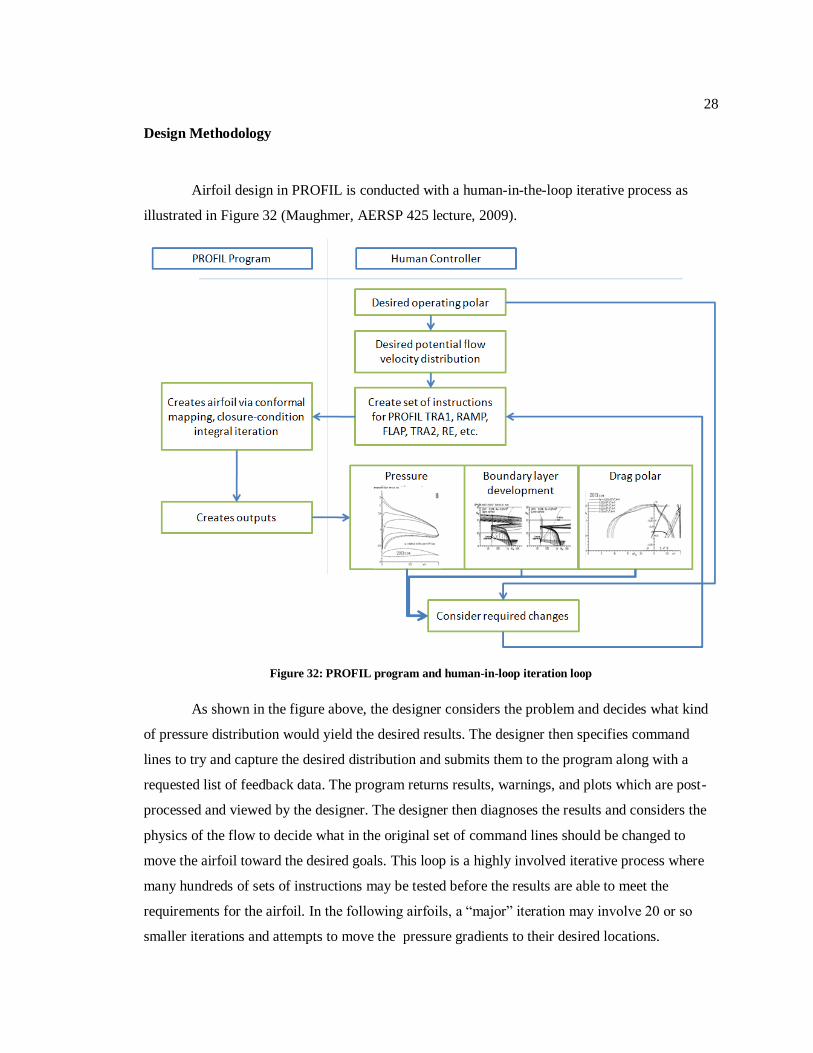
Design Methodology
Airfoil design in PROFIL is conducted with a human-in-the-loop iterative process as
illustrated in Figure 32 (Maughmer, AERSP 425 lecture, 2009).
Figure 32: PROFIL program and human-in-loop iteration loop
As shown in the figure above, the designer considers the problem and decides what kind
of pressure distribution would yield the desired results. The designer then specifies command
lines to try and capture the desired distribution and submits them to the program along with a
requested list of feedback data. The program returns results, warnings, and plots which are post-
processed and viewed by the designer. The designer then diagnoses the results and considers the
physics of the flow to decide what in the original set of command lines should be changed to
move the airfoil toward the desired goals. This loop is a highly involved iterative process where
many hundreds of sets of instructions may be tested before the results are able to meet the
requirements for the airfoil. In the following airfoils, a “major” iteration may involve 20 or so
smaller iterations and attempts to move the pressure gradients to their desired locations.

29
Designed Airfoils
Vertical Tail Airfoil
The final (21st) major iteration yielded the V21 airfoil. It shape and pressure distributions
for several angles of attack are shown in Figure 33.
Figure 33: The V21 airfoil for the vertical tail
The V21 airfoil was designed to minimize drag by being as thin as possible (up to the
minimum required 9.2% thickness) while maintaining a clmax as high as possible up to +/- 1.0. The
airfoil was designed with low Re effects in mind; at the low local Re near the leading edge of the
airfoil, the flow will stay laminar even in a moderately adverse pressure gradient. After the initial
increase in pressure, the pressure recover is made smooth to maintain laminar flow for as long as
30
possible. Thin airfoils generate high lift by producing a large pressure spikes near the leading
edge; these spikes would cause flow separation at an angle of a few degrees. These pressure
spikes were suppressed by specifying a neutral pressure gradient at a high alpha (circled in green
in Figure 33), yielding the rounded leading edge that allows the airfoil to obtain higher alphas and
cls.
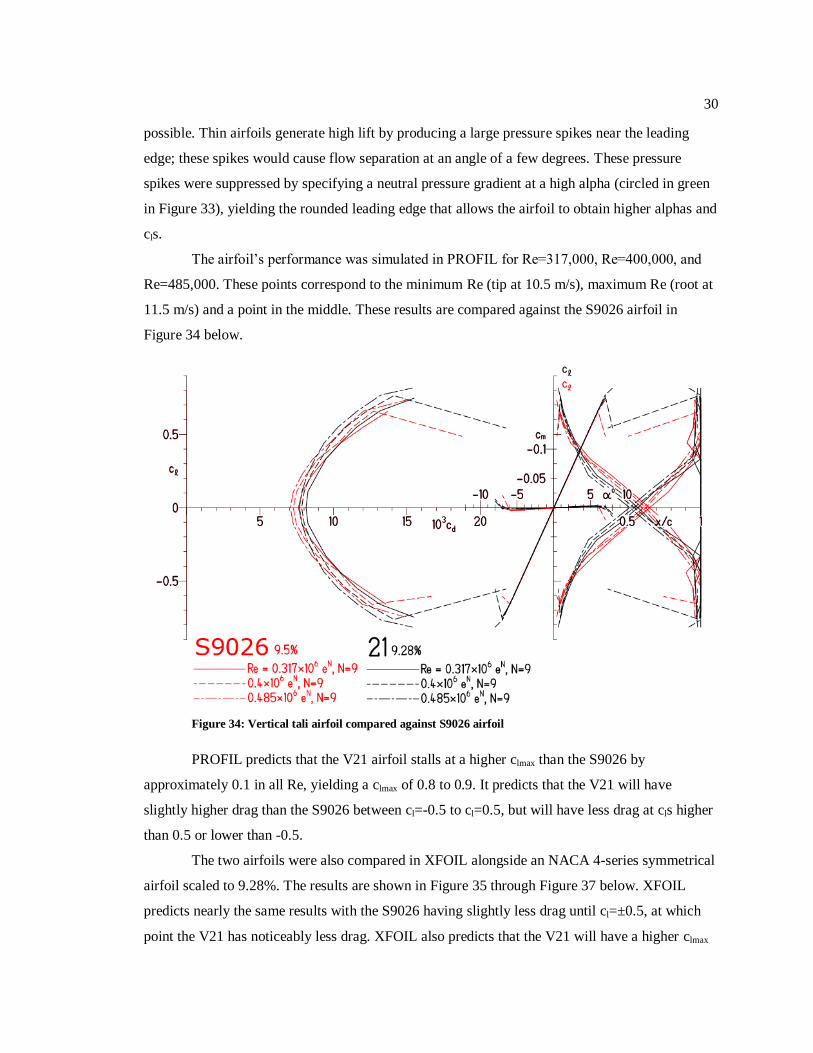
The airfoil’s performance was simulated in PROFIL for Re=317,000, Re=400,000, and
Re=485,000. These points correspond to the minimum Re (tip at 10.5 m/s), maximum Re (root at
11.5 m/s) and a point in the middle. These results are compared against the S9026 airfoil in
Figure 34 below.
Figure 34: Vertical tali airfoil compared against S9026 airfoil
PROFIL predicts that the V21 airfoil stalls at a higher clmax than the S9026 by
approximately 0.1 in all Re, yielding a clmax of 0.8 to 0.9. It predicts that the V21 will have
slightly higher drag than the S9026 between cl=-0.5 to cl=0.5, but will have less drag at cls higher
than 0.5 or lower than -0.5.
The two airfoils were also compared in XFOIL alongside an NACA 4-series symmetrical
airfoil scaled to 9.28%. The results are shown in Figure 35 through Figure 37 below. XFOIL
predicts nearly the same results with the S9026 having slightly less drag until cl=±0.5, at which
point the V21 has noticeably less drag. XFOIL also predicts that the V21 will have a higher clmax

31
of approximately 1.2, which is higher than the S9026. The NACA airfoil has higher drag than
both the V21 and S9026.
Since the results from both simulations are consistent, it can be expected that the V21
airfoil would have slightly higher drag than the S9026 with no deflection, but at higher levels of
deflection (above cl=0.5), the V21 will have lower drag. Since the value of clmax is difficult to
predict using software, and XFOIL is known to overpredict clmax (Maughmer, AERSP 404H
Lecture, 2009), the only conclusion could be that the V21 has a higher clmax but its value may not
reach the clmax=1.0 target.
In summary, the V21 successfully meets the structural requirements and is predicted to
have lower drag than the baseline airfoil at high deflections. The value of clmax, though, may not
reach the required value, though it should be higher than what can be achieved with the S9026.

32
Figure 35: V21, S9026, NACA 9.28% compared Re=385k

33
Figure 36: V21, S9026, NACA 9.28% compared Re=400k

34
Figure 37: V21, S9026, NACA 9.28% compared Re=485k
35
Horizontal Tail
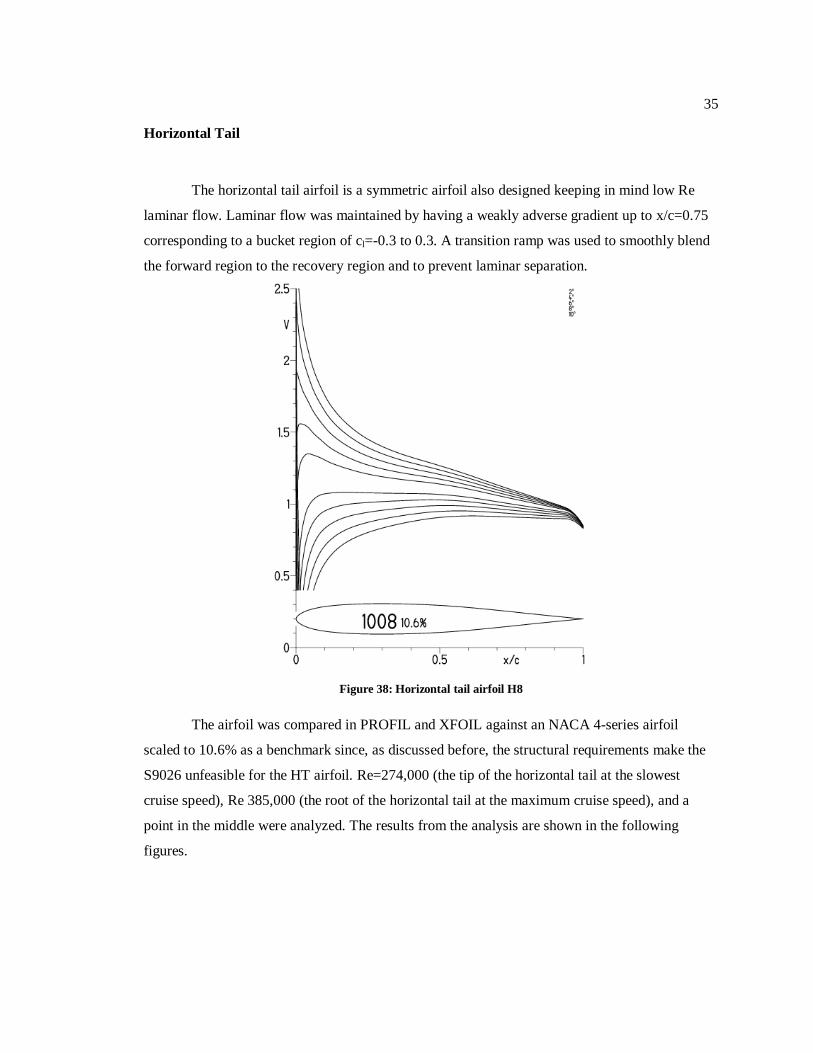
The horizontal tail airfoil is a symmetric airfoil also designed keeping in mind low Re
laminar flow. Laminar flow was maintained by having a weakly adverse gradient up to x/c=0.75
corresponding to a bucket region of cl=-0.3 to 0.3. A transition ramp was used to smoothly blend
the forward region to the recovery region and to prevent laminar separation.
Figure 38: Horizontal tail airfoil H8
The airfoil was compared in PROFIL and XFOIL against an NACA 4-series airfoil
scaled to 10.6% as a benchmark since, as discussed before, the structural requirements make the
S9026 unfeasible for the HT airfoil. Re=274,000 (the tip of the horizontal tail at the slowest
cruise speed), Re 385,000 (the root of the horizontal tail at the maximum cruise speed), and a
point in the middle were analyzed. The results from the analysis are shown in the following
figures.

36
Figure 39: Horizontal tail airfoil (H8, or 1008) compared against scaled NACA airfoil
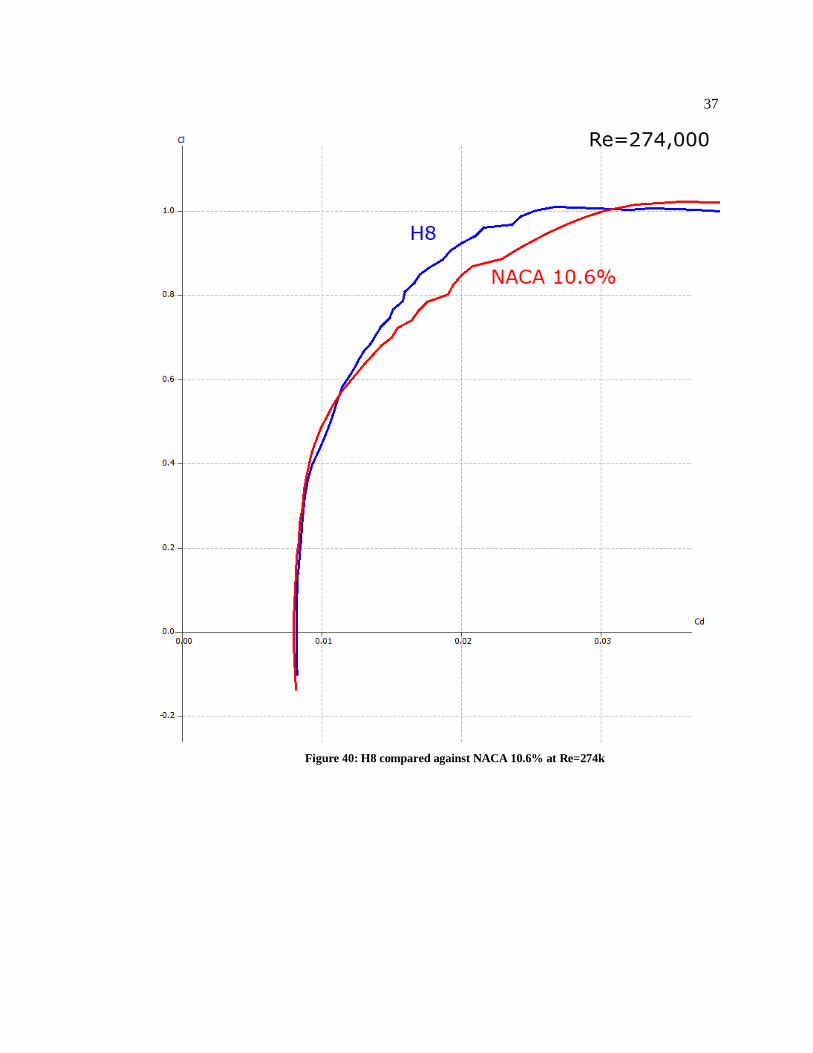
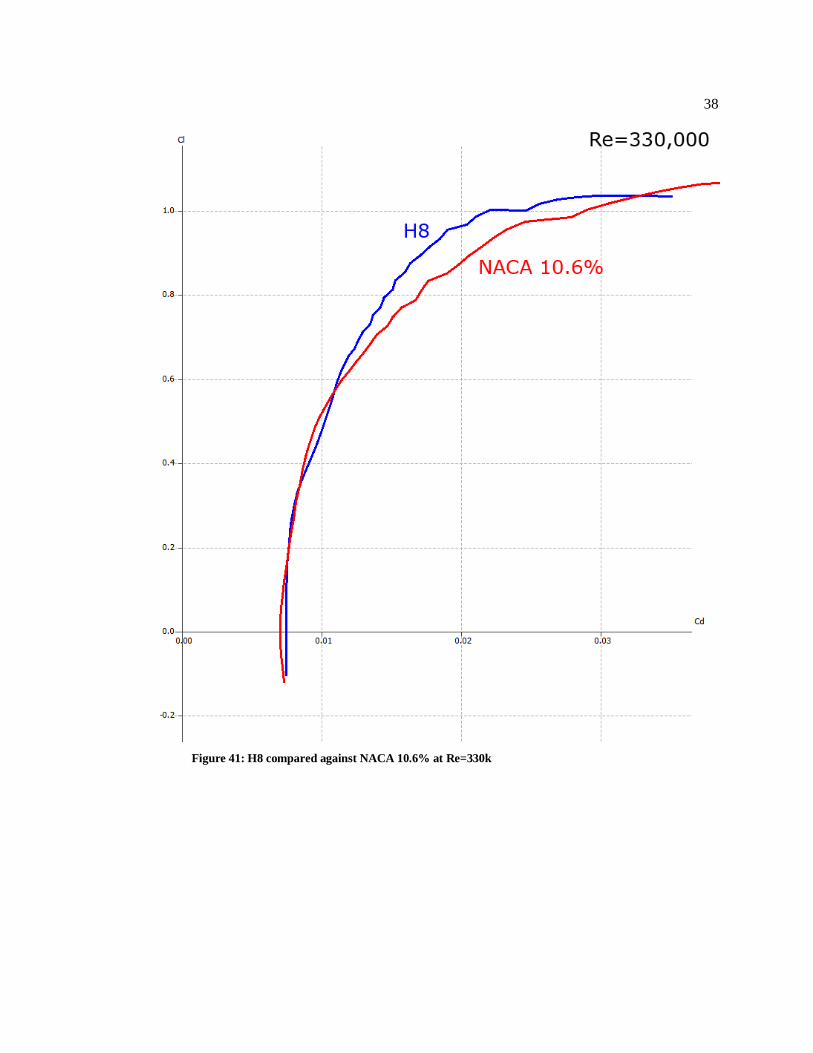
As shown in the PROFIL results in Figure 39 and the XFOIL results in Figure 40 through
Figure 42, the H8 is consistently predicted to have lower drag at higher cls (above cl=0.55).
PROFIL also predicts it to have a higher clmax than the NACA airfoil. PROFIL also predicts that
the H8 airfoil will have less separated flow on the upper surface, as indicated on the right side of
Figure 39 which causes some concerns about stall of the NACA airfoil. Unfortunately, the H8
airfoil is also predicted to have a higher drag coefficient at 0-deflection by about 6 counts.
37
Figure 40: H8 compared against NACA 10.6% at Re=274k
38
Figure 41: H8 compared against NACA 10.6% at Re=330k

39
Figure 42: H8 compared against NACA 10.6 at Re=385k

40
Wing Airfoil
The wing airfoil was created to move the laminar drag bucket into the range defined in
Figure 29 above so that the drag can be reduced in the cruise range. The finalized airfoil, the
W13, is shown below in Figure 43.
Figure 43: The W13 (or 2013) airfoil
The W13 airfoil was made to have a long, gentle pressure recovery on the upper surface
to avoid a sharp top-corner of the bucket as was discussed before. Having this pressure recovery
should cause the transition point to move forward slowly rather than abruptly. The lower surface
pressure gradient is defined so that the drag bucket has a sharp corner at the bottom to deepen the
drag bucket since the HPA should never fly fast enough to use those lower cls (below 0.4). To

41
make sure the airfoil has equal or less pitching moment than the E395, the airfoil is more front-
loaded than the E395, yielding a slightly adverse pressure gradient from x/c = 0.02 to x/c = 0.2.
However, due to the low-Re the airfoil will operate at, the flow remains stable and laminar.
The analysis for various Re corresponding to key points of the aircraft’s operating
envelope is shown below in Figure 44. The points and their corresponding significances are listed
in Figure 44 as well as Table 2.
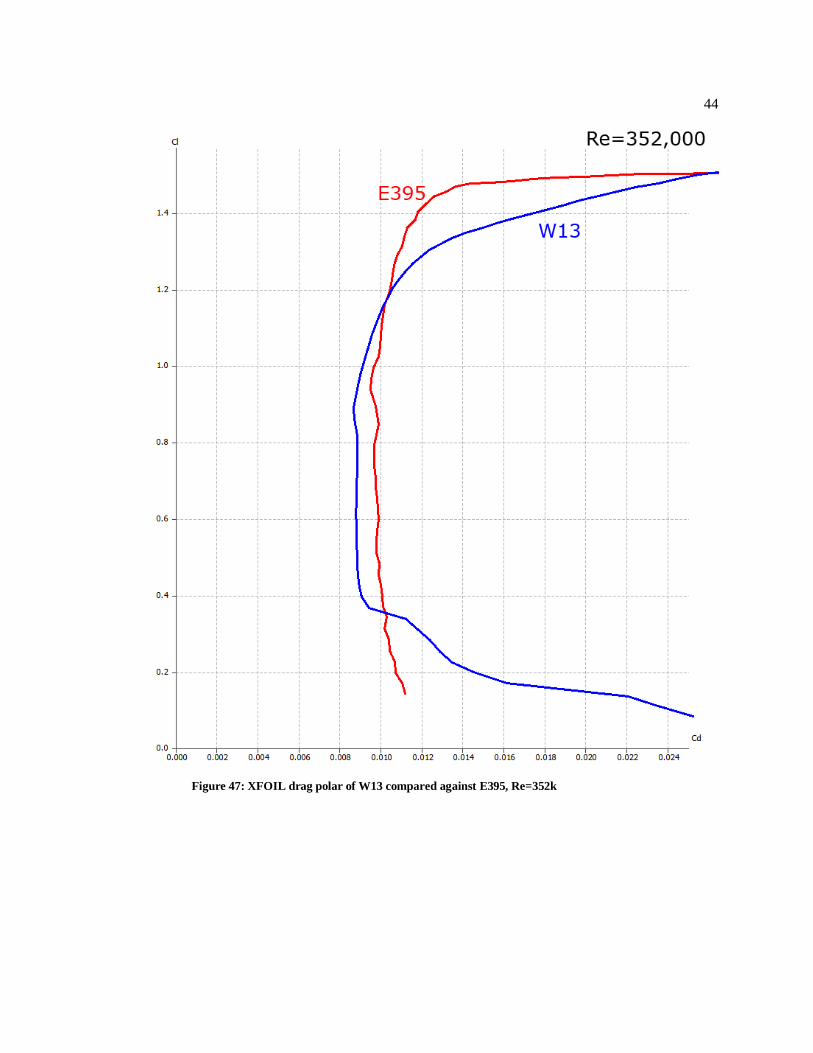
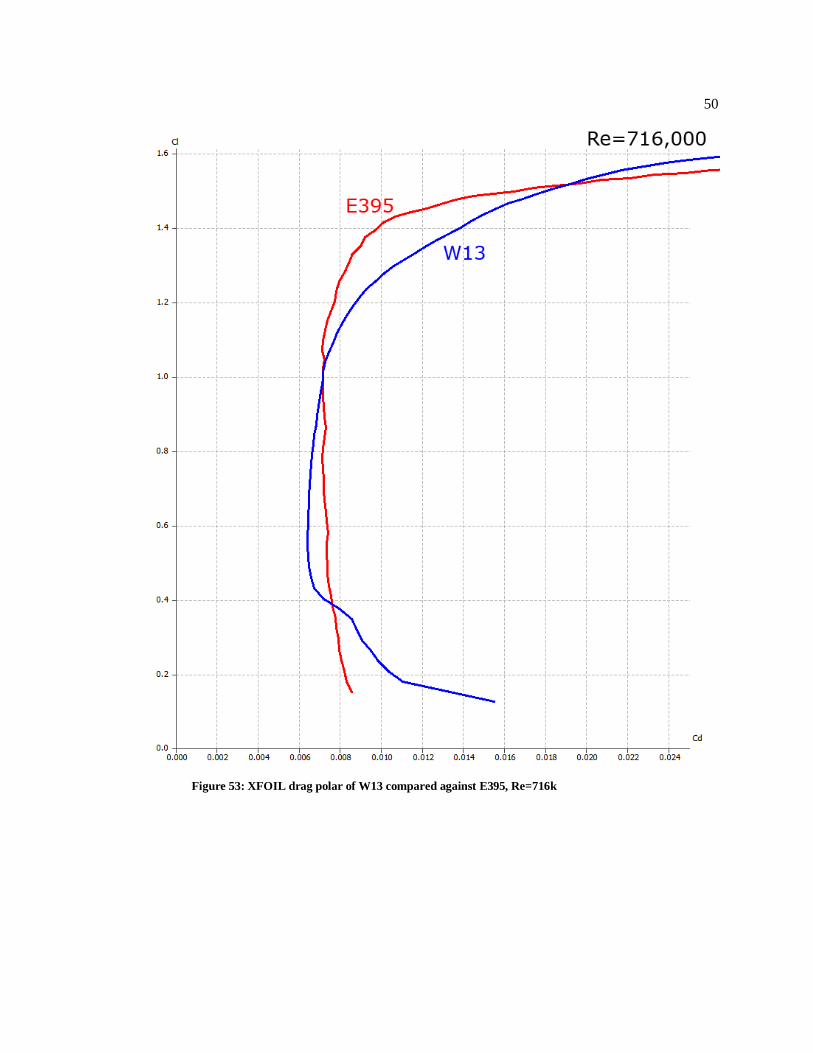
PROFIL and XFOIL both predict that the W13 airfoil has consistently lower drag than
the E395 within the region of cl=1.0 to cl=0.5 and the operating Re of the HPA main wing. Much
of the drag reduction can be attributed to the transition point on the lower surface, which is
pushed backward as can be seen in both the PROFIL and XFOIL results. The W13 is also
predicted to have less nose-down pitching moment than the E395 due to the way the pressures are
distributed, as discussed above.
Figure 44: PROFIl drag polars of E395 and 2013 compared

42
Figure 45: XFOIL drag polar of W13 compared against E395, Re=293k
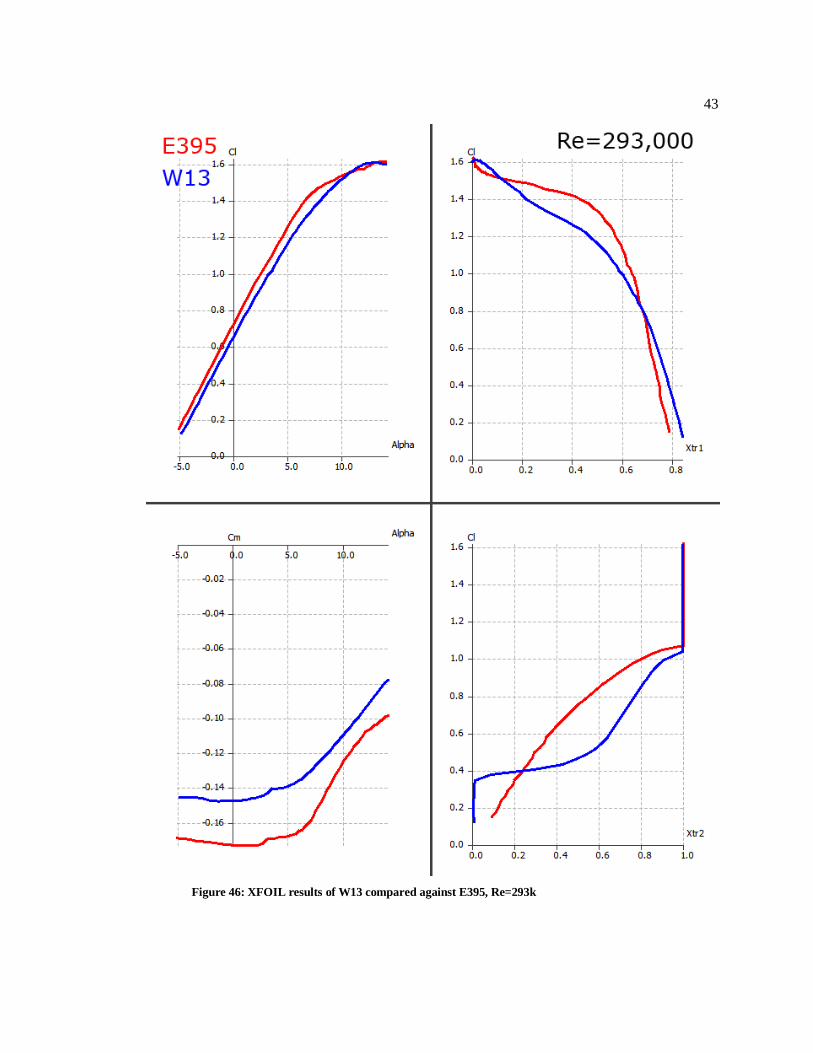
43
Figure 46: XFOIL results of W13 compared against E395, Re=293k
44
Figure 47: XFOIL drag polar of W13 compared against E395, Re=352k

45
Figure 48: XFOIL results of W13 compared against E395, Re=352k

46
Figure 49: XFOIL drag polar of W13 compared against E395, Re=503k

47
Figure 50: XFOIL results of W13 compared against E395, Re=503k

48
Figure 51: XFOIL drag polar of W13 compared against E395, Re=622k

49
Figure 52: XFOIL results of W13 compared against E395, Re=622k
50
Figure 53: XFOIL drag polar of W13 compared against E395, Re=716k

51
Figure 54: XFOIL results of W13 compared against E395, Re=716k

52
The W13 airfoil meets the thickness requirement and is consistently lower in drag than
the E395 airfoil in the Re and cl ranges in which the HPA operates. The W13 also has a lower
nose-down pitching moment than the E395. The clmax for the W13 is predicted to be
approximately the same as the E395 (approximately 1.6), so the stall speed for the HPA is
unchanged.

53
Chapter 6
Resulting Change in Aircraft Performance Characteristics
Drag Buildup
To determine the net effect of the airfoils designed, another drag buildup and power
analysis was conducted using the same technique developed for the first drag buildup.
Figure 55: Drag buildup of HPA with new airfoils
Also visible in Figure 55 is the result from the hard-exit of the lower corner of the
laminar drag bucket for the wing, which causes a sharp bend upward of drag at approximately
15.5 m/s. This does not detrimentally affect the aircraft, however, since that is outside of the
aircraft’s power-capable flight envelope.

54
Aircraft Power
Aircraft power curves for the old and new airfoils are compared in Figure 56 which
shows that, for flight speeds between 10 m/s and 16 m/s, the new airfoils produce a decrease in
power-required for flight.
Figure 56: Aircraft power required curves using new and old airfoils
The power curves also show that, for flight speeds below 10 m/s, the airfoils
detrimentally affect the performance of the aircraft since it takes more power to fly at those
speeds due to the higher drag at a cl of approximately 1.3.
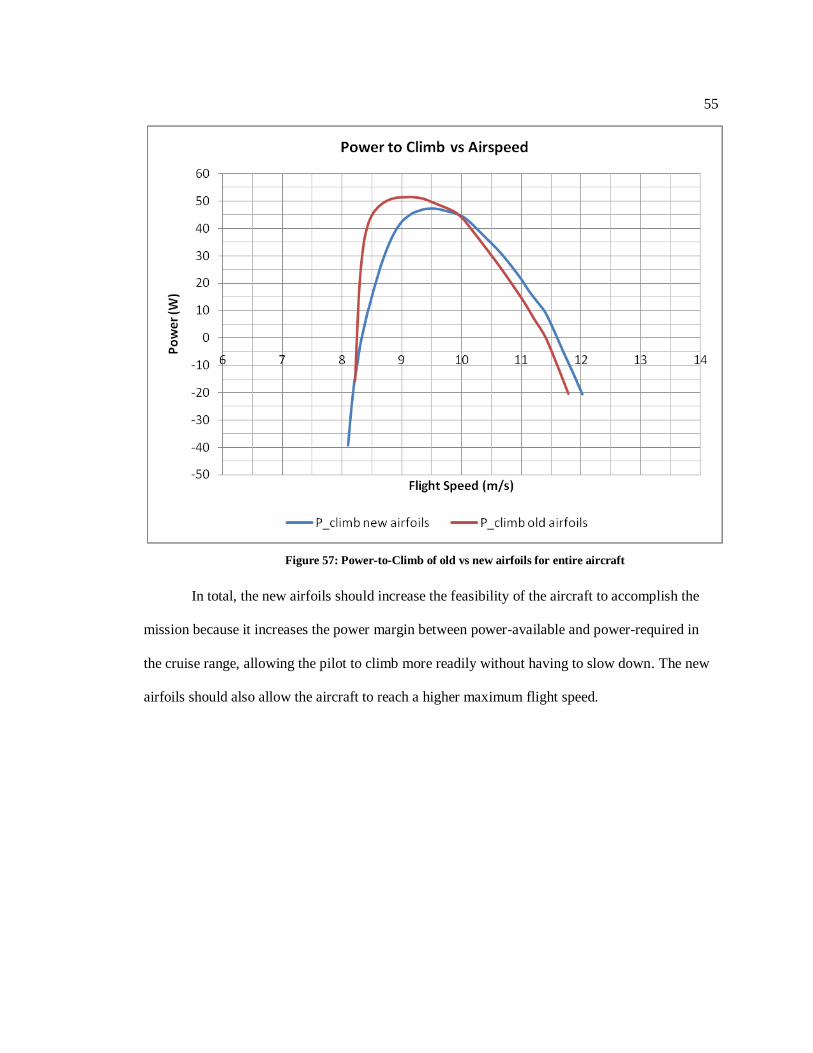
Power-to-climb was also compared against the old airfoils in Figure 57, showing that the
new airfoils allow the aircraft to reach the originally-desired maximum flight speed of 11.5 m/s.
55
Figure 57: Power-to-Climb of old vs new airfoils for entire aircraft
In total, the new airfoils should increase the feasibility of the aircraft to accomplish the
mission because it increases the power margin between power-available and power-required in
the cruise range, allowing the pilot to climb more readily without having to slow down. The new
airfoils should also allow the aircraft to reach a higher maximum flight speed.

56
Chapter 7
Future Work
Airfoil Testing for clmax
Even though accuracy for computational airfoil analysis has increased due to
developments in XFOIL and PROFIL, the programs still struggle to give consistently-accurate
results for clmax for many airfoils. Without wind tunnel and/or testing, there is no consistently-
reliable way to determine whether the airfoils can reach their desired clmaxs. Therefore, it is
suggested that test sections for the new airfoils be built and tested before final integration into the
aircraft.
Airfoil Refinement
The W13 wing airfoil’s drag bucket is currently set a little too low and hurts the aircraft
when it is not operating at above 10 m/s. It is suggested that the airfoil’s drag bucket be moved up
by approximately Δcl=0.2.
Wing Area Increase
One interesting result from developing the wing airfoil was the low drag that could be
accomplished even at 12.3% thickness if only the airfoil could operate at a slightly lower cl. A
quick re-size of the wing was conducted simply by scaling the wing span from 19.5 meters to
22.5 meters, which increased the wing area from 15.55 m2 to 17.55 m
2, reducing the cls necessary
for flight. The drag from the new (larger) wing was compared against the old wing with the E395
and the old wing with the W13 airfoils, as shown in Figure 58.

57
Figure 58: Wing drag polars required to lift 220 lb compared
As shown in Figure 58, it was found that this increase in wing area would yield a drag
reduction of the wing of 9.8% at the cruise velocity of 11 m/s, which would allow for much better
aircraft performance. It is urged that this change is investigated in the next iteration of the aircraft.
Chapter 8
Conclusion
By carefully analyzing the operational range of the aircraft, using a human-in-the-loop
design process, and considering the flow physics and in the design of the pressure gradients, new
airfoils were created that match the structural requirements of the HPA and enhance the
58
performance of the aircraft in its cruise range. The vertical tail and horizontal tail airfoils, V21
and H8, should reach a higher clmax than the baseline airfoils with less drag at those higher
loadings, allowing for greater tail authority. The wing airfoil, W13, deepens the laminar drag
bucket in the cruise cl range and reduces the nose-down pitching moment of the airfoil, reducing
overall flight power.
It is suggested that the airfoil and wing designs should be refined more before the final
design is frozen. Especially, it might be fruitful to investigate a larger wing as it will reduce the cl
of the wing sections and allow the wing to capitalize on the deep drag bucket of the W13 airfoil.

59
Works Cited
Deperrois, A. (n.d.). Retrieved 01 8, 2010, from XFLR5:
http://xflr5.sourceforge.net/xflr5.htm
Eppler, R. (1990). Airfoil Design and Data. Berlin: Springer-Verlag.
Eppler, R. (2006). Airfoil Program System "PROFIL06" User's Guide.
Maughmer, M. D. (2009). AERSP 404H Lecture.
Maughmer, M. D. (2009, 11 20). AERSP 425 lecture.
Whitt, F. R., & Wilson, D. (1982). Bicycling Science. London: M.I.T. Press.

60
Appendix
Coordinates of the V21 airfoil:
1.00000000 0.00000000
0.99668789 0.00008613
0.98696748 0.00059913
0.97130181 0.00168768
0.95012655 0.00323209
0.92367620 0.00505328
0.89218105 0.00721088
0.85608229 0.00975732
0.81588011 0.01268458
0.77211653 0.01595330
0.72536610 0.01949885
0.67622614 0.02323421
0.62530503 0.02705776
0.57322072 0.03085695
0.52059054 0.03450824
0.46802378 0.03787919
0.41610380 0.04081590
0.36533936 0.04320725
0.31627000 0.04498611
0.26941852 0.04607391
0.22527838 0.04639609
0.18431230 0.04587983
0.14694053 0.04442771
0.11347087 0.04194723
0.08416563 0.03840144
0.05911012 0.03373860
0.03846644 0.02808893
0.02216401 0.02159662
0.01043670 0.01447815
0.00294719 0.00694053
0.00083314 0.00332426
0.00023340 0.00161166
0.00000000 0.00000000
0.00023340 -0.00161166
0.00083314 -0.00332426
0.00294719 -0.00694053
0.01043670 -0.01447815
0.02216401 -0.02159662
0.03846644 -0.02808893
0.05911012 -0.03373860
0.08416563 -0.03840144
0.11347087 -0.04194723
0.14694053 -0.04442771
0.18431230 -0.04587983
0.22527838 -0.04639609
0.26941852 -0.04607391
0.31627000 -0.04498611
0.36533936 -0.04320725
0.41610380 -0.04081590
0.46802378 -0.03787919
0.52059054 -0.03450824
0.57322072 -0.03085695
0.62530503 -0.02705776
0.67622614 -0.02323421
0.72536610 -0.01949885
0.77211653 -0.01595330
0.81588011 -0.01268458
0.85608229 -0.00975732
0.89218105 -0.00721088
0.92367620 -0.00505328
0.95012655 -0.00323209
0.97130181 -0.00168768
0.98696748 -0.00059913
0.99668789 -0.00008613
1.00000000 0.00000000

61
PROFIL Code input for V21
TRA1 0021 10.5 .82 15.5 .9 21.5 1.7 23.8 2.2 25.5 4 27.5 6 29.5 9.6
TRA1 0021 0 10 30.5 -10 32.5 -9.6 34.5 -6 36.2 -4 38.5 -2.2 44.5 -1.7
TRA1 0021 49.5 -.9 60 -.82
TRA2 0021 4.5 22.5 2 -.6 .88 4.5 22.5 2 -.6 .88 3 .3 0 2
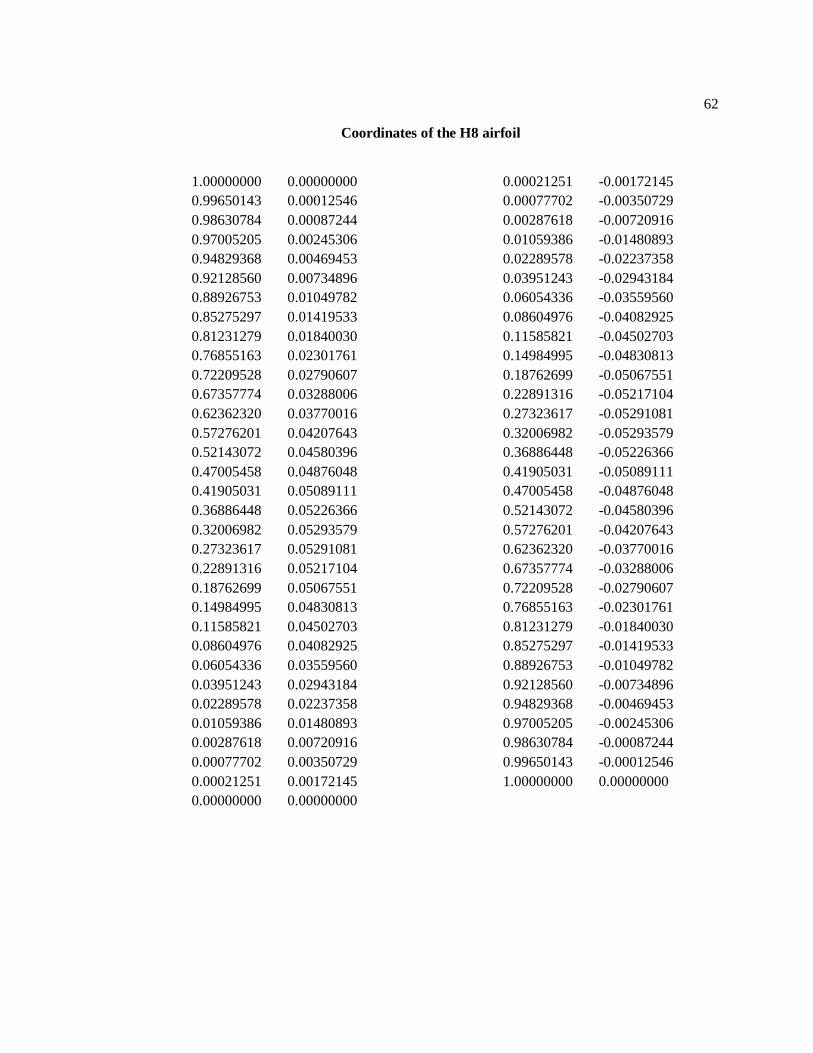
62
Coordinates of the H8 airfoil
1.00000000 0.00000000
0.99650143 0.00012546
0.98630784 0.00087244
0.97005205 0.00245306
0.94829368 0.00469453
0.92128560 0.00734896
0.88926753 0.01049782
0.85275297 0.01419533
0.81231279 0.01840030
0.76855163 0.02301761
0.72209528 0.02790607
0.67357774 0.03288006
0.62362320 0.03770016
0.57276201 0.04207643
0.52143072 0.04580396
0.47005458 0.04876048
0.41905031 0.05089111
0.36886448 0.05226366
0.32006982 0.05293579
0.27323617 0.05291081
0.22891316 0.05217104
0.18762699 0.05067551
0.14984995 0.04830813
0.11585821 0.04502703
0.08604976 0.04082925
0.06054336 0.03559560
0.03951243 0.02943184
0.02289578 0.02237358
0.01059386 0.01480893
0.00287618 0.00720916
0.00077702 0.00350729
0.00021251 0.00172145
0.00000000 0.00000000
0.00021251 -0.00172145
0.00077702 -0.00350729
0.00287618 -0.00720916
0.01059386 -0.01480893
0.02289578 -0.02237358
0.03951243 -0.02943184
0.06054336 -0.03559560
0.08604976 -0.04082925
0.11585821 -0.04502703
0.14984995 -0.04830813
0.18762699 -0.05067551
0.22891316 -0.05217104
0.27323617 -0.05291081
0.32006982 -0.05293579
0.36886448 -0.05226366
0.41905031 -0.05089111
0.47005458 -0.04876048
0.52143072 -0.04580396
0.57276201 -0.04207643
0.62362320 -0.03770016
0.67357774 -0.03288006
0.72209528 -0.02790607
0.76855163 -0.02301761
0.81231279 -0.01840030
0.85275297 -0.01419533
0.88926753 -0.01049782
0.92128560 -0.00734896
0.94829368 -0.00469453
0.97005205 -0.00245306
0.98630784 -0.00087244
0.99650143 -0.00012546
1.00000000 0.00000000

63
PROFIL Code input for H8
TRA1 1008 10.5 2.82 15.5 2.9 21.5 3.7 23.8 4.9 25.5 6.7 26.5 8.6 28.5 10.2
TRA1 1008 29.5 12.3 0 15.3 30.5 -15.3 31.5 -12.3 33.5 -10.2 34.5 -8.6
TRA1 1008 36.2 -6.7 38.5 -4.9 44.5 -3.7 49.5 -2.9 60 -2.82
RAMP 2 2 2 2
TRA2 1008 4.5 13.5 2 -1 .883 4.5 13.5 2 -1 .883 3 .4 0 2

64
Coordinates of the W13 airfoil
1.00000000 0.00000000
0.99656657 0.00083095
0.98671843 0.00364979
0.97136884 0.00850577
0.95128334 0.01492806
0.92679615 0.02228524
0.89794386 0.03033349
0.86515328 0.03904030
0.82894296 0.04817872
0.78980983 0.05745448
0.74820005 0.06655600
0.70454846 0.07520751
0.65928142 0.08314486
0.61280961 0.09013409
0.56553357 0.09598004
0.51784832 0.10053019
0.47014675 0.10367574
0.42282201 0.10535026
0.37626876 0.10552390
0.33086258 0.10420061
0.28698373 0.10144915
0.24502577 0.09736108
0.20537912 0.09205257
0.16844431 0.08565910
0.13462571 0.07829339
0.10427952 0.07002263
0.07764290 0.06088728
0.05484002 0.05102733
0.03594884 0.04066304
0.02104634 0.03004528
0.01008578 0.01953850
0.00305581 0.00971624
0.00008267 0.00133077
0.00000212 0.00020518
0.00011144 -0.00140261
0.00028379 -0.00211398
0.00055294 -0.00273962
0.00097608 -0.00329714
0.00154631 -0.00384347
0.00203946 -0.00423807
0.00304180 -0.00491855
0.01106848 -0.00835964
0.02602085 -0.01201994
0.04647427 -0.01511577
0.07210980 -0.01767900
0.10254072 -0.01970256
0.13735026 -0.02115124
0.17610099 -0.02194410
0.21839574 -0.02199322
0.26384032 -0.02125961
0.31202431 -0.01974630
0.36251611 -0.01749954
0.41485772 -0.01460941
0.46855941 -0.01120870
0.52309453 -0.00746908
0.57789493 -0.00359456
0.63234718 0.00018829
0.68579080 0.00364336
0.73751904 0.00654101
0.78678362 0.00867672
0.83280449 0.00989076
0.87478502 0.01008629
0.91193309 0.00923569
0.94339433 0.00734984
0.96822642 0.00483341
0.98595120 0.00239924
0.99650495 0.00065415

65
PROFIL Code input for W13
TRA1 2013 6.14 5 8.86 5.4 17.91 6.3 23.86 6.7 24.86 7.07 25.69 8.15
TRA1 2013 26.68 9.2 28 10.5 29 12 0 13
TRA1 2013 35 5.2 60 5.45
RAMP 10 6.5 8 8
TRA2 2013 5 11.5 2 1 .98 5 13 2 .5 .9 6 .2 0
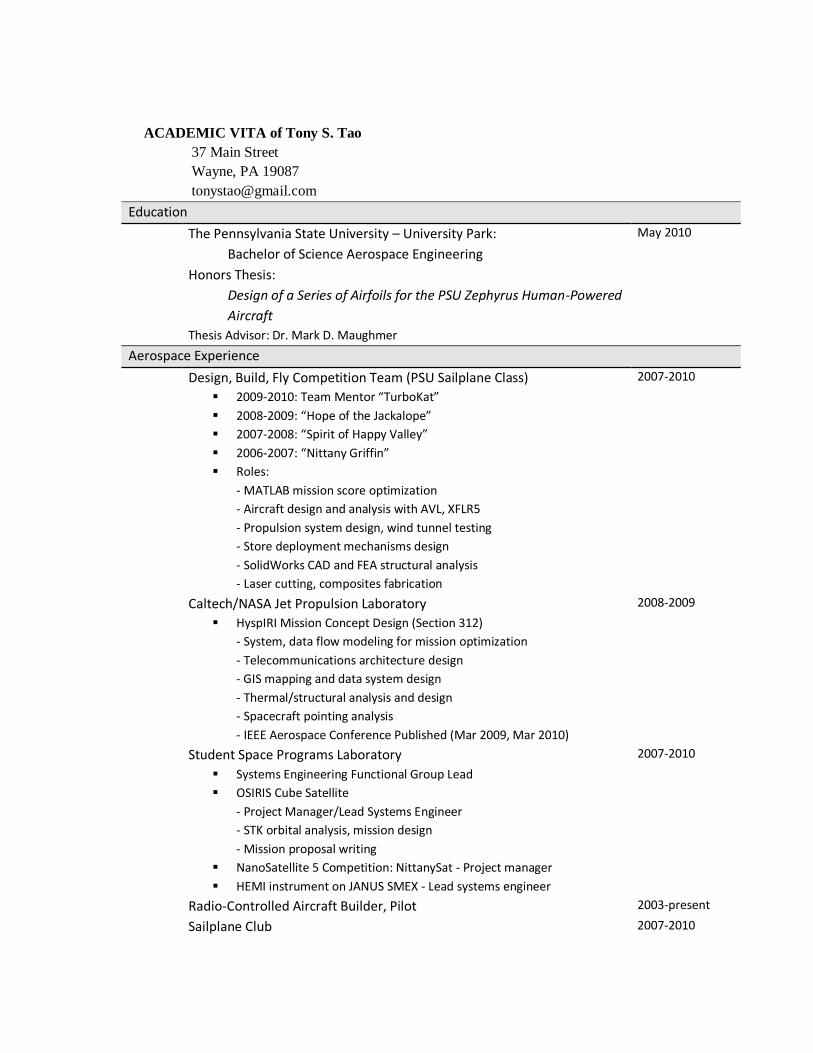
ACADEMIC VITA of Tony S. Tao
37 Main Street
Wayne, PA 19087
Education
The Pennsylvania State University – University Park:
Bachelor of Science Aerospace Engineering
May 2010
Honors Thesis:
Design of a Series of Airfoils for the PSU Zephyrus Human-Powered
Aircraft
Thesis Advisor: Dr. Mark D. Maughmer
Aerospace Experience
Design, Build, Fly Competition Team (PSU Sailplane Class)
2009-2010: Team Mentor “TurboKat”
2008-2009: “Hope of the Jackalope”
2007-2008: “Spirit of Happy Valley”
2006-2007: “Nittany Griffin”
Roles:
- MATLAB mission score optimization
- Aircraft design and analysis with AVL, XFLR5
- Propulsion system design, wind tunnel testing
- Store deployment mechanisms design
- SolidWorks CAD and FEA structural analysis
- Laser cutting, composites fabrication
2007-2010
Caltech/NASA Jet Propulsion Laboratory
HyspIRI Mission Concept Design (Section 312)
- System, data flow modeling for mission optimization
- Telecommunications architecture design
- GIS mapping and data system design
- Thermal/structural analysis and design
- Spacecraft pointing analysis
- IEEE Aerospace Conference Published (Mar 2009, Mar 2010)
2008-2009
Student Space Programs Laboratory
Systems Engineering Functional Group Lead
OSIRIS Cube Satellite
- Project Manager/Lead Systems Engineer
- STK orbital analysis, mission design
- Mission proposal writing
NanoSatellite 5 Competition: NittanySat - Project manager
HEMI instrument on JANUS SMEX - Lead systems engineer
2007-2010
Radio-Controlled Aircraft Builder, Pilot 2003-present
Sailplane Club 2007-2010

Awards
Donald G. and Jayne L. Steva Scholarship
Aero Pioneers of 1944 Scholarship
Dean’s List (2006-present)
President’s Freshman Award
Evan Pugh Scholar