Embed Size (px)
Citation preview
DESIGN OF A PRETREATMENT INSTALLATION
FOR THE WASHING OF EMPTY FRUIT BUNCHES AT
A PALM OIL MILL
Martijn Al
Student number: S0166421
Master Mechanical Engineering
Thermal Engineering Group
University of Twente
UT supervisor: Gerrit Brem
Internship assignment at:
BTG-BTL
Josink Esweg 34,
7545 PN, Enschede
The Netherlands
Mentor: Ardy Toussaint
1
SUMMARY Empty fruit bunch (EFB) is a residual product of the palm oil mill industry. When bio-oil is
generated during the pyrolysis of EFB, the yield is relatively low. In general, biomass types with
high ash content result in low oil yields during pyrolysis. EFB has a quite high ash content ranging
from 3 to 7 %. Of the ashes, the alkalis are the main catalyst to reduce the oil yield. Potassium is the
most common of the alkalis in biomass and can take up to half the amount of ashes in EFB. Reducing
the amount of ashes, with in particular potassium, in EFB can increase the oil yield from below 40%
to yields higher than 60%.
Water washing of EFB can reduce the amount of potassium with about 90%. A basic design for a
washing installation for a is created. It is tried to to minimize water usage and waste, energy
usage and complexity while ash reduction is maximized. Three washing tanks are placed in series
were the washing water is going in counter flow to the EFB to increase ash washout. After each
washing tank a screw press will mechanically press out water to minimize ash and potassium
content in the EFB.

2
LIST OF ABBREVIATIONS EFB Empty Fruit Bunch FFB Fresh Fruit Bunch POME Palm Oil Mill Effluent mf Moisture Free wt% Weight percentage BOD Biological Oxygen Demand COD Chemical Oxygen Demand K Potassium
Ton per hour
3
TABLE OF CONTENTS 1 Introduction ..................................................................................................................................................................... 5
2 Influence of ash on the yield of pyrolysis oil ...................................................................................................... 6
2.1 Ash content ............................................................................................................................................................. 6
2.2 Ash content and composition of EFB ........................................................................................................... 7
2.3 Alkalis and potassium ........................................................................................................................................ 7
3 Empty Fruit Bunches .................................................................................................................................................... 8
3.1 Palm oil production ............................................................................................................................................. 8
3.2 EFB ............................................................................................................................................................................. 8
3.3 Palm oil mill effluent ........................................................................................................................................... 9
4 Washing of biomass .................................................................................................................................................... 10
4.1 Empty fruit bunches .......................................................................................................................................... 10
4.2 Other types of biomass .................................................................................................................................... 11
4.3 Washing of biomass in other fields ............................................................................................................. 13
4.3.1 Fiberboard ................................................................................................................................................... 14
4.3.2 Coal ................................................................................................................................................................. 14
4.4 Influence of washing parameters ................................................................................................................ 14
4.4.1 Size of the feedstock ................................................................................................................................ 14
4.4.2 Fresh or dry................................................................................................................................................. 14
4.4.3 Temperature ............................................................................................................................................... 15
4.4.4 Amount of water ....................................................................................................................................... 15
4.4.5 Residence time ........................................................................................................................................... 15
4.4.6 Type of washing ........................................................................................................................................ 15
4.4.7 Type of water ............................................................................................................................................. 16
4.5 Conclusions ........................................................................................................................................................... 16
5 Fouling and slagging ................................................................................................................................................... 17
6 Design ............................................................................................................................................................................... 19
6.1 Design parameters ............................................................................................................................................. 19
6.2 Sizing pretreatment........................................................................................................................................... 19
6.3 Washing .................................................................................................................................................................. 19
6.3.1 Minimal water purge ............................................................................................................................... 21
4
6.3.2 Water purge ................................................................................................................................................ 21
6.3.3 Potassium content in the POME ......................................................................................................... 22
6.3.4 Water washing tanks ............................................................................................................................... 22
6.3.5 Pumps ............................................................................................................................................................ 23
6.3.6 Screw press ................................................................................................................................................. 24
7 Energy usage .................................................................................................................................................................. 24
8 Discussion & Recommendations ........................................................................................................................... 25
9 Conclusion ....................................................................................................................................................................... 26
10 Bibliography .............................................................................................................................................................. 27
Appendix A Wastewater discharge ............................................................................................................................ 30
A.1 Organic components .............................................................................................................................................. 30
A.2 Mineral components .............................................................................................................................................. 30
A.3 Cleaning ....................................................................................................................................................................... 31
A.4 POME treatment Malaysia ................................................................................................................................... 31
Appendix B Estimated diffusion time ....................................................................................................................... 33
Appendix C Sugar cane bagasse .................................................................................................................................. 34
C.1 Sugar production process .................................................................................................................................... 34
C.2 Water usage ............................................................................................................................................................... 36
C.3 Ash content ................................................................................................................................................................ 36
5
1 INTRODUCTION The purpose of this study is to design a washing installation in order to reduce the ash content of
Empty Fruit Bunches (EFB), a residual product of the pail oil industry. Ash inside a biomasses has
an influence on the oil yield and quality during fast pyrolysis. Biomass with lower ash contents will
generally results in more and better oil. The ash content of EFB is quite high and thus has a quite
low oil yield during pyrolysis. Reducing the ash content in EFB is potentially a method to increase
oil production significantly.
The industrial process of EFB production from the fresh fruit bunches is charted to understand
what pretreatments the EFB has undertaken. Also the process steps in the production of sugar from
sugarcane were studied. This because bagasse, the residual product in the sugar cane industry,
showed promising results in high oil yield during pyrolysis contradicted the relative high ash
content.
Scientific literature is studied about the ash content and composition in EFB and other types of
biomass. The components of the ash that are the probable cause of the reduction in oil yield are
studied and identified. Also results in ash content and composition when washing EFB and other
feedstock are studied and used to set up a list of design parameters for an industrial scale washing
installation.
A basic design has been made where is tried to minimize water usage and waste, energy usage and
complexity while ash reduction is maximized.
This study is done at BTG-BTL as an internship for the master mechanical engineering at the
University of Twente. The author wants to thank his UT supervisor Gerrit Brem and his BTG-BTL
mentor Ardy Toussaint for their guidance and this assignment.
6
2 INFLUENCE OF ASH ON THE YIELD OF PYROLYSIS OIL
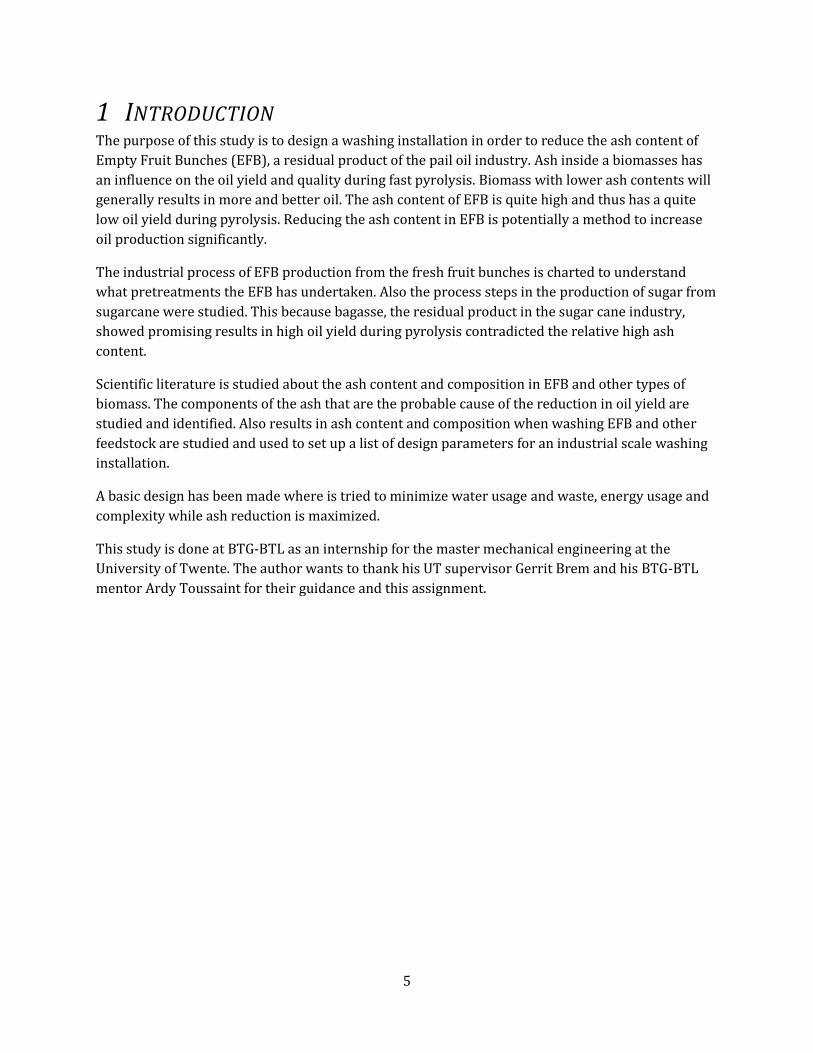
2.1 ASH CONTENT It is known that ash content of each type of biomass has a strong influence on the yield of bio-oil
that can be obtained by fast-pyrolysis. Biomass that has low values of ash content, ordinarily slow
growing crops such as trees, have a high yield of bio-oil. Fast growing crops, such as switchgrass or
straw, have usually a relative high percentage of ash that results in a significant lower bio-oil yield.
In Figure 1 it can be seen that roughly a linear slope can be drawn for the relation between ash
content of the biomass and the yield of bio-oil.
Figure 1: Yield of bio-oil set against the ash content of the biomass [1]
In Table 1 the ash content and the yield after pyrolysis can be seen for a number of different types
of feedstock. Relevant for this study are the values for EFB. As can be seen, empty fruit bunches
have a very high ash content that results in a low yield. Results of the same order of magnitude for
EFB are also found in other literature [2] [3].
Kind of Feedstock
Ash content, mf wt.%
Maximum yield of organics, mf wt%
Temp, Source
IEA poplar 0.46 72 485 Aston Pine wood 0.5 68 477 Aston White spruce 0.5 66.5 500 Waterloo Pine wood 0.5 65.9 602 Aston [ablative] IAE poplar 046 65.8 500 Waterloo Washed EFB 1.03 61.3 500 This work Pine wood 0.5 60 504 Aston Sweet soghum bagass Nd 58 515 Waterloo Sugar cane bagasse 2.44 58 498 Waterloo Miscanthus 5.7 55 458 Aston Beech wood 0.6 54.2 555 Aston [ablative] Rape straw 5.2 48 457 Aston Rape meal 7.7 47 429 Aston Wheat straw 4.6 43 582 Waterloo Poplar bark Nd 43 500 Waterloo Pine bark 1.79 38 505 Aston Unwasched EFB 5.29 36.9 453 This work Table 1: Ash contents and yields of different types of biomass, table from [4]
7
From Table 1 can also be seen that sugar cane bagasse has a quite high ash content while the bio-oil
yield is significant higher. In [5] 4.1 wt% ash was measured and after some temperature and
feedstock size optimization a liquid yield of 56% was achieved. Also in [6] such results are found.
Lab test from BTG also show this behavior. In Appendix C sugar cane bagasse is further studied.
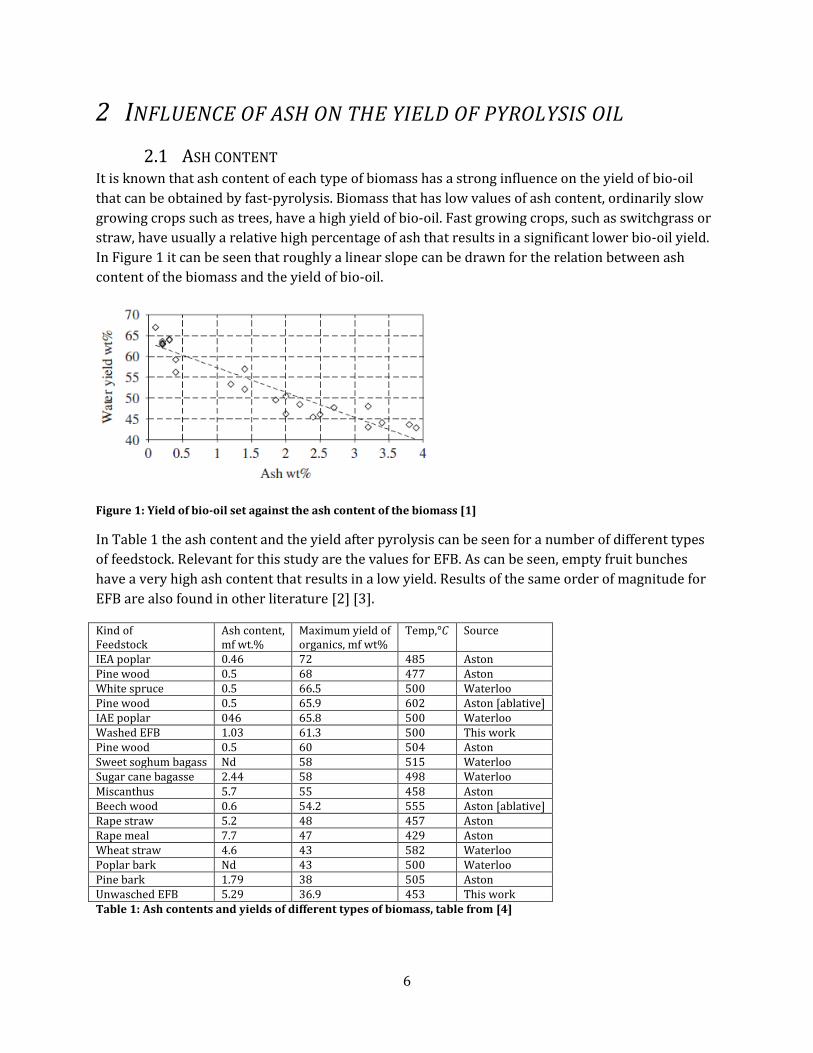
2.2 ASH CONTENT AND COMPOSITION OF EFB To show in more detail the ash content and composition of EFB, Table 2 is acquired from [2]. It
shows an ash content of EFB ranging from 3 to 7 mf wt%. Potassium is a main component of the ash
and ranges between 2 to 2.4 mf wt%.
Table 2: Properties of EFB (mf wt%), from [2]
2.3 ALKALIS AND POTASSIUM It is found in studies [7] [8] [9] [10] that alkalis act as a catalyst during pyrolysis of biomass. In the
presence of alkalis, the fragmentation of monomers that make up the natural polymer chains of
lignocellulosic materials is enhanced over the depolymerization that otherwise occurs. This
catalytic effect results in higher yields of water, gas and char.
Potassium is the most common of the alkalis found in most types of fast growing biomass and
therefore the likely suspect of this catalytic effect by alkalis. For EFB, it can take up to 50% of the
total amount of ash in biomass. One of the properties of potassium is that it is water soluble and
thus can be easily washed out.
A possible explanation of the higher yields during pyrolysis of bagasse (see also Appendix C ) is that
this catalytic effect is reduced due to the absence of most of the alkalis. In chapter 3 it can be seen
that washing of the feedstock can lower the ash content of the biomass.

8
3 EMPTY FRUIT BUNCHES Empty Fruit Bunches, or short EFB, is a residual product in the palm oil industry. In this chapter the
process of palm oil production is sketched and can be seen where the EFB originate. Furthermore
the EFB itself is described. Also the existing waste water of a palm oil mill plant are examined in
order to see where washing water must comply to.
3.1 PALM OIL PRODUCTION In Figure 2, a flow diagram for the production of palm oil can be seen. The empty fruit bunches are
taken out quite in the beginning of the process after sterilization. Sterilization is a batch process in
which the fresh fruit bunches are heated with steam for a period of 60-90 minutes. The process
stops enzymes and softens the fruit bunches for processing. In a stripper the fruits are separated
from the fruit bunches with as remainder the empty fruit bunches (EFB). No further attention is
given to the palm fruits since only the EFB is of interest in this study.
Figure 2: A typical flow diagram of a palm oil refinery, from internal communications
3.2 EFB EFB is a very fibrous material of fibers of about – in length. Due to the sterilizing
pretreatment it is soaked with water and has a moisture content of about 65%. However, due to
this pretreatment it is also very clean biomass and contains almost no sand or other contaminants.
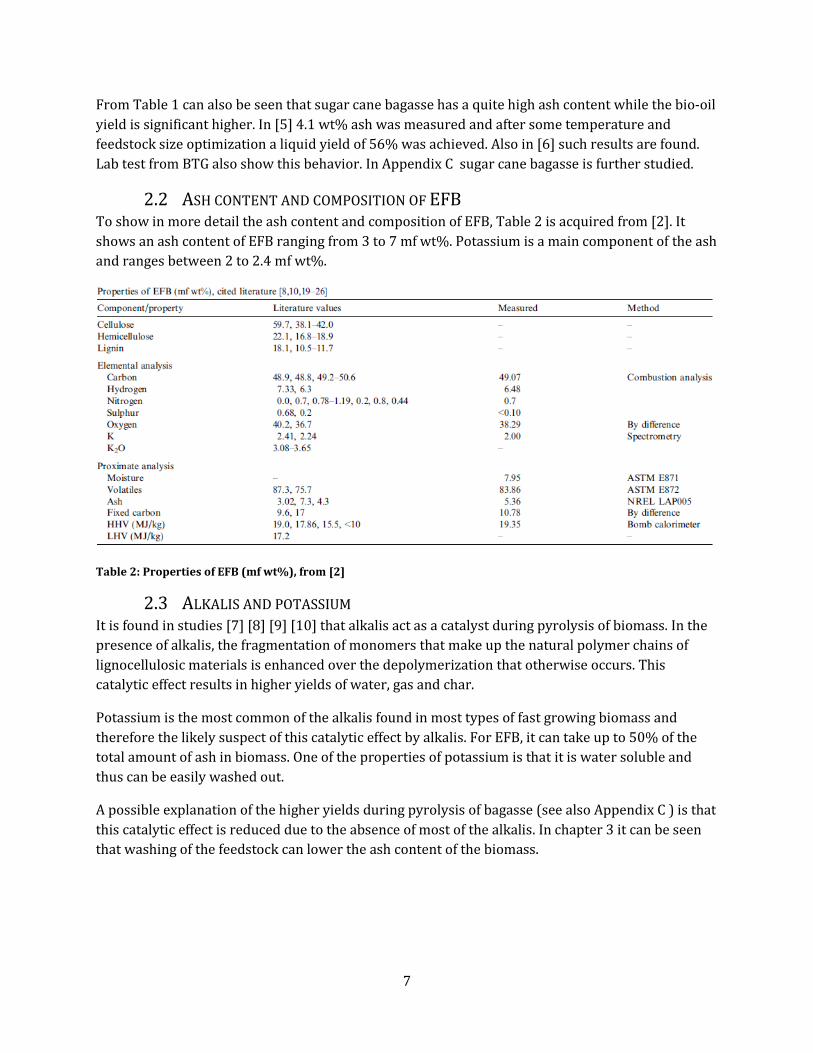
In Figure 3 an example of a whole empty fruit bunch is shown. Its size can vary from –
long and – wide. In Figure 4 can the fibrous structure be seen of shredded EFB.
9
Figure 3: A whole EFB, from [11]
Figure 4: Shredded EFB, from internal communications
In the past, most EFB was used as a fuel in palm oil plants in order to generate the heat required in
the palm oil production. Another commonly used practice is to shred the EFB and return it to the
palm tree plantations in order to use it use it as a natural fertilizer. This last practice is nowadays
more promoted by the Malaysian government since combustion of EFB results in a large amount of
air pollution and it reduces the need for buying (artificial) fertilizers [12].
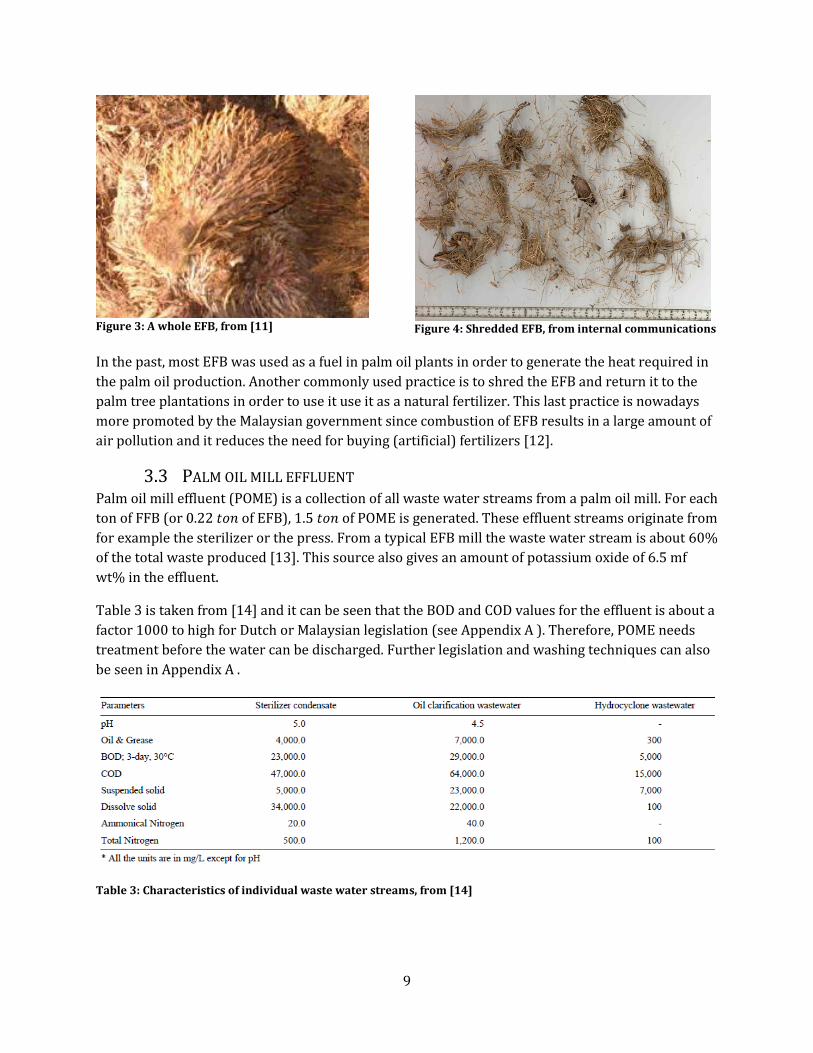
3.3 PALM OIL MILL EFFLUENT Palm oil mill effluent (POME) is a collection of all waste water streams from a palm oil mill. For each
ton of FFB (or of EFB), of POME is generated. These effluent streams originate from
for example the sterilizer or the press. From a typical EFB mill the waste water stream is about 60%
of the total waste produced [13]. This source also gives an amount of potassium oxide of 6.5 mf
wt% in the effluent.
Table 3 is taken from [14] and it can be seen that the BOD and COD values for the effluent is about a
factor 1000 to high for Dutch or Malaysian legislation (see Appendix A ). Therefore, POME needs
treatment before the water can be discharged. Further legislation and washing techniques can also
be seen in Appendix A .
Table 3: Characteristics of individual waste water streams, from [14]
10
4 WASHING OF BIOMASS The washing of biomass can have a positive influence on the yield of bio-oil. This is because of the
removal of ashes with in particular the alkalis during washing. In this chapter scientific literature is
discussed that is found on the topic of biomass washing and its influence on ash content or the bio-
oil yield after pyrolysis of the biomass. Especially the different washing techniques and parameters
with their result in ash reduction are studied.
4.1 EMPTY FRUIT BUNCHES The washing of EFB was extensively studied in the thesis of Abdullah [4]. In this theses multiple
parameters were studied in order to determine what parameters have the most influence in the
amount of ash that is washed out of the EFB. The following parameters were studied with their
corresponding conclusion.
Soaking or stirring: stirring is more effective.
Type of water: distilled water is more effective than tap water.
Water temperature: higher temperature (up to ) is more effective. However, at higher
temperature the feedstock losses are also higher.
EFB particle size: smaller particles are more effective.
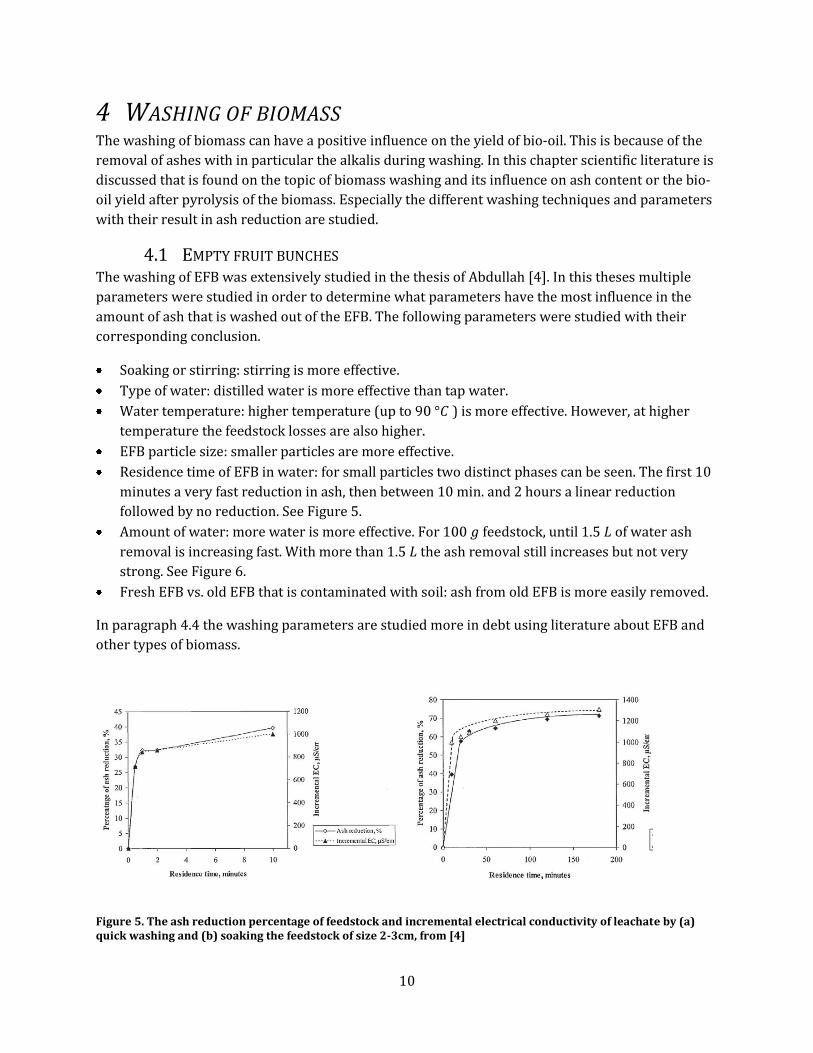
Residence time of EFB in water: for small particles two distinct phases can be seen. The first 10
minutes a very fast reduction in ash, then between 10 min. and 2 hours a linear reduction
followed by no reduction. See Figure 5.
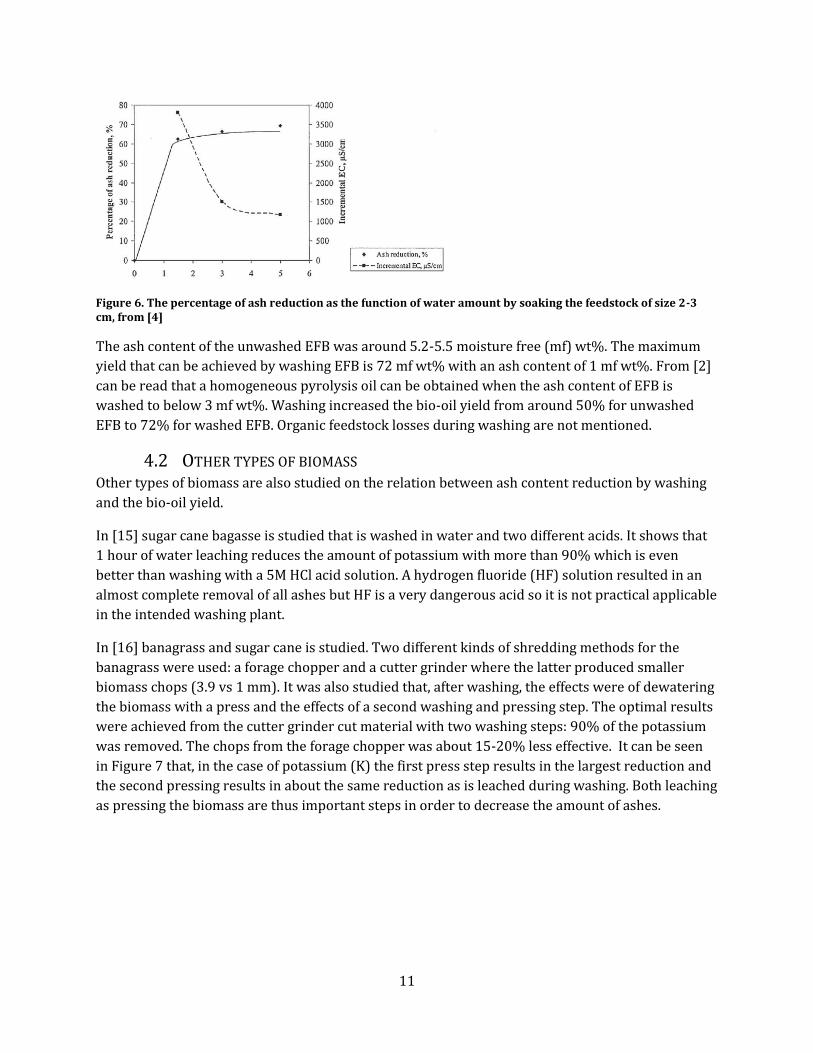
Amount of water: more water is more effective. For feedstock, until of water ash
removal is increasing fast. With more than the ash removal still increases but not very
strong. See Figure 6.
Fresh EFB vs. old EFB that is contaminated with soil: ash from old EFB is more easily removed.
In paragraph 4.4 the washing parameters are studied more in debt using literature about EFB and
other types of biomass.
Figure 5. The ash reduction percentage of feedstock and incremental electrical conductivity of leachate by (a) quick washing and (b) soaking the feedstock of size 2-3cm, from [4]
11
Figure 6. The percentage of ash reduction as the function of water amount by soaking the feedstock of size 2-3 cm, from [4]
The ash content of the unwashed EFB was around 5.2-5.5 moisture free (mf) wt%. The maximum
yield that can be achieved by washing EFB is 72 mf wt% with an ash content of 1 mf wt%. From [2]
can be read that a homogeneous pyrolysis oil can be obtained when the ash content of EFB is
washed to below 3 mf wt%. Washing increased the bio-oil yield from around 50% for unwashed
EFB to 72% for washed EFB. Organic feedstock losses during washing are not mentioned.
4.2 OTHER TYPES OF BIOMASS Other types of biomass are also studied on the relation between ash content reduction by washing
and the bio-oil yield.
In [15] sugar cane bagasse is studied that is washed in water and two different acids. It shows that
1 hour of water leaching reduces the amount of potassium with more than 90% which is even
better than washing with a 5M HCl acid solution. A hydrogen fluoride (HF) solution resulted in an
almost complete removal of all ashes but HF is a very dangerous acid so it is not practical applicable
in the intended washing plant.
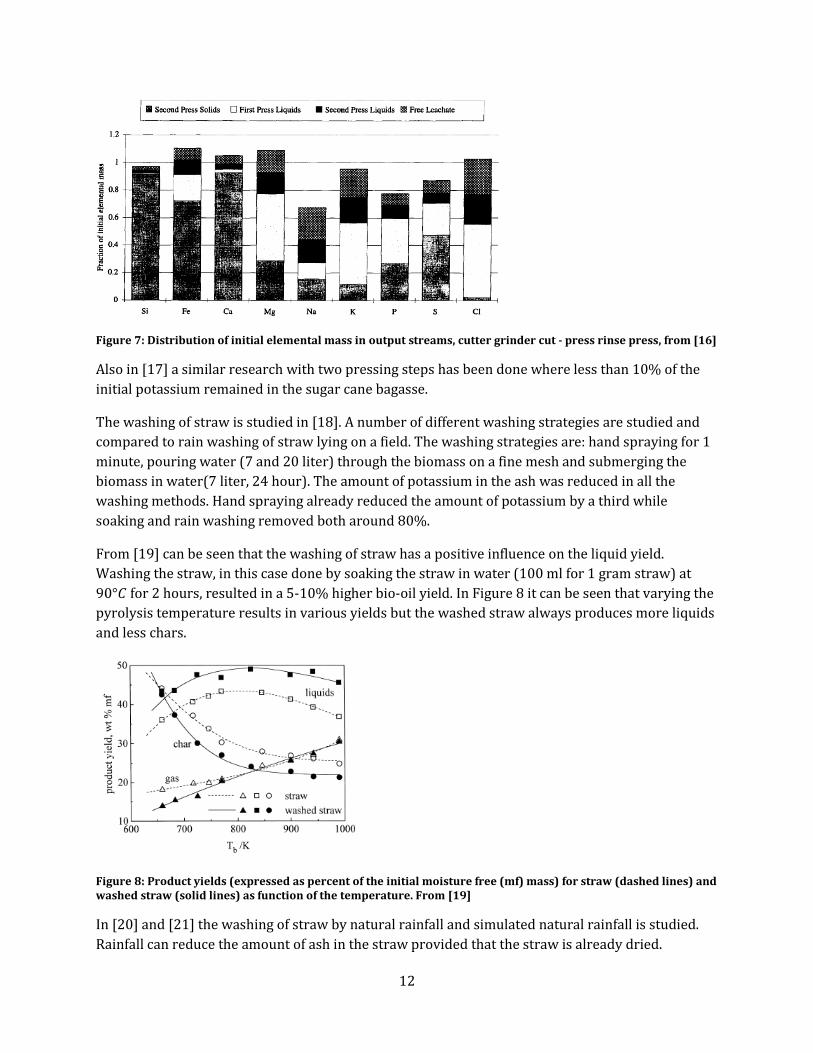
In [16] banagrass and sugar cane is studied. Two different kinds of shredding methods for the
banagrass were used: a forage chopper and a cutter grinder where the latter produced smaller
biomass chops (3.9 vs 1 mm). It was also studied that, after washing, the effects were of dewatering
the biomass with a press and the effects of a second washing and pressing step. The optimal results
were achieved from the cutter grinder cut material with two washing steps: 90% of the potassium
was removed. The chops from the forage chopper was about 15-20% less effective. It can be seen
in Figure 7 that, in the case of potassium (K) the first press step results in the largest reduction and
the second pressing results in about the same reduction as is leached during washing. Both leaching
as pressing the biomass are thus important steps in order to decrease the amount of ashes.
12
Figure 7: Distribution of initial elemental mass in output streams, cutter grinder cut - press rinse press, from [16]
Also in [17] a similar research with two pressing steps has been done where less than 10% of the
initial potassium remained in the sugar cane bagasse.
The washing of straw is studied in [18]. A number of different washing strategies are studied and
compared to rain washing of straw lying on a field. The washing strategies are: hand spraying for 1
minute, pouring water (7 and 20 liter) through the biomass on a fine mesh and submerging the
biomass in water(7 liter, 24 hour). The amount of potassium in the ash was reduced in all the
washing methods. Hand spraying already reduced the amount of potassium by a third while
soaking and rain washing removed both around 80%.
From [19] can be seen that the washing of straw has a positive influence on the liquid yield.
Washing the straw, in this case done by soaking the straw in water (100 ml for 1 gram straw) at
for 2 hours, resulted in a 5-10% higher bio-oil yield. In Figure 8 it can be seen that varying the
pyrolysis temperature results in various yields but the washed straw always produces more liquids
and less chars.
Figure 8: Product yields (expressed as percent of the initial moisture free (mf) mass) for straw (dashed lines) and washed straw (solid lines) as function of the temperature. From [19]
In [20] and [21] the washing of straw by natural rainfall and simulated natural rainfall is studied.
Rainfall can reduce the amount of ash in the straw provided that the straw is already dried.
13
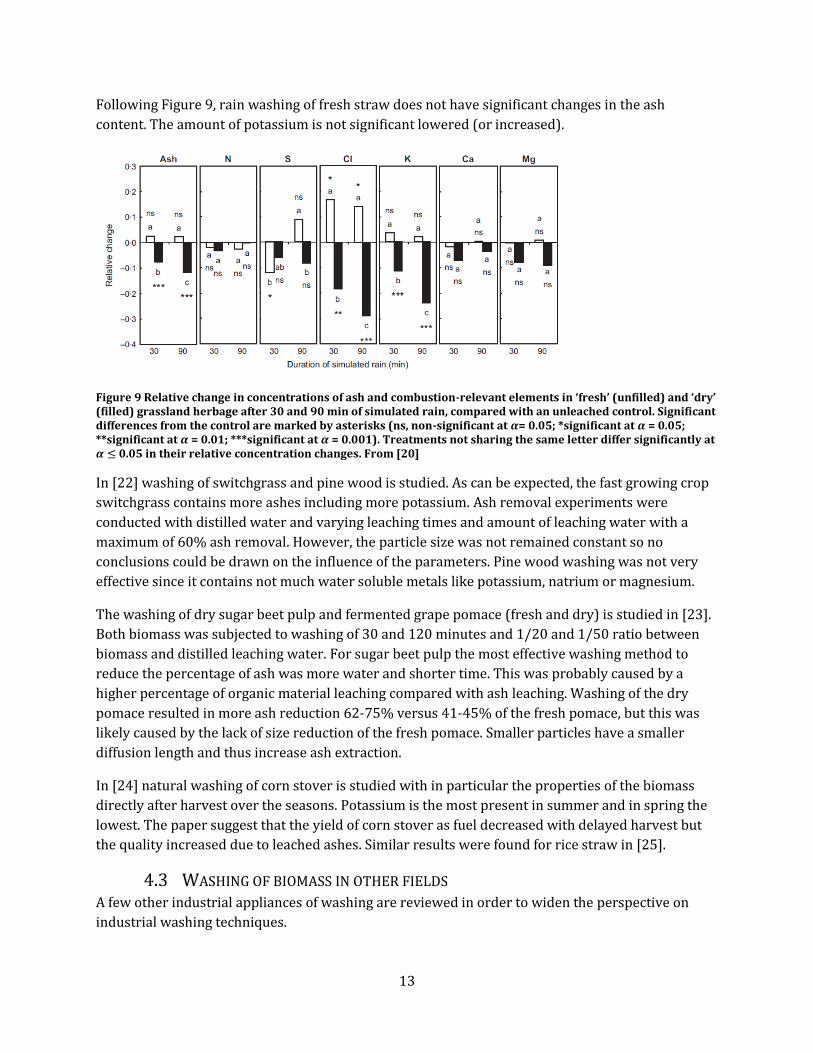
Following Figure 9, rain washing of fresh straw does not have significant changes in the ash
content. The amount of potassium is not significant lowered (or increased).
Figure 9 Relative change in concentrations of ash and combustion-relevant elements in ‘fresh’ (unfilled) and ‘dry’ (filled) grassland herbage after 30 and 90 min of simulated rain, compared with an unleached control. Significant differences from the control are marked by asterisks (ns, non-significant at = 0.05; *significant at = 0.05; **significant at = 0.01; ***significant at = 0.001). Treatments not sharing the same letter differ significantly at
0.05 in their relative concentration changes. From [20]
In [22] washing of switchgrass and pine wood is studied. As can be expected, the fast growing crop
switchgrass contains more ashes including more potassium. Ash removal experiments were
conducted with distilled water and varying leaching times and amount of leaching water with a
maximum of 60% ash removal. However, the particle size was not remained constant so no
conclusions could be drawn on the influence of the parameters. Pine wood washing was not very
effective since it contains not much water soluble metals like potassium, natrium or magnesium.
The washing of dry sugar beet pulp and fermented grape pomace (fresh and dry) is studied in [23].
Both biomass was subjected to washing of 30 and 120 minutes and 1/20 and 1/50 ratio between
biomass and distilled leaching water. For sugar beet pulp the most effective washing method to
reduce the percentage of ash was more water and shorter time. This was probably caused by a
higher percentage of organic material leaching compared with ash leaching. Washing of the dry
pomace resulted in more ash reduction 62-75% versus 41-45% of the fresh pomace, but this was
likely caused by the lack of size reduction of the fresh pomace. Smaller particles have a smaller
diffusion length and thus increase ash extraction.
In [24] natural washing of corn stover is studied with in particular the properties of the biomass
directly after harvest over the seasons. Potassium is the most present in summer and in spring the
lowest. The paper suggest that the yield of corn stover as fuel decreased with delayed harvest but
the quality increased due to leached ashes. Similar results were found for rice straw in [25].
4.3 WASHING OF BIOMASS IN OTHER FIELDS A few other industrial appliances of washing are reviewed in order to widen the perspective on
industrial washing techniques.
14
4.3.1 FIBERBOARD For the production of fiberboard the feedstock, usually wood chips, shavings and saw dust, is first
cleaned of all impurities. Ferro metals can be removed by a magnet while soil, sand and most other
impurities are washed out by submerging in water. When the feedstock is clean, it is put in a
steaming bin in order to heat and soften the material.
A budgetary quotation for a wood chip washing machine was requested from Metso, Fiberboard,
Central Europe North. As biomass feedstock scenario, wood chips originating from a forest were
used. The type of the woodchips is G50, has a moisture content of 50% and a maximal
contamination of 4% sand, stones, metals etc. The quantity of wood chips to be washed is
(on wet biomass basis).
4.3.2 COAL In a coal preparation plant, coal is washed in order to remove soil and rocks. In this way the
combustion of coal is cleaner and the transport costs lower. Washing of coal usually is done with a
dense medium separation process. In this a liquid medium is adjusted to a specific density in which
the pieces of up to 50mm float, while denser contaminants sink. A dense medium cyclone is usually
used to speed up the process.
4.4 INFLUENCE OF WASHING PARAMETERS In this paragraph the information found in the sources from paragraphs 4.1 to 4.3 are discussed. A
large distinction can be made on the type of washing: natural washing in the fields by rainfall and
mechanized washing. The first is not feasible for the intended purpose of EFB washing since in the
EFB is already on the palm oil production site and not on the fields.
In the literature, for washing are numerous varying parameters found for different types of
feedstock. In general, these types of parameters are most studied.
4.4.1 SIZE OF THE FEEDSTOCK The size of the feedstock is an important parameter on how much (and how fast) ashes are washed
out of a biomass. A smaller average size of a feedstock results in a shorter diffusion length of the ash
and thus a smaller diffusion time and thus more ash is washed out in the same time compared to
larger sized feedstock.
Tested EFB sizes in literature were 250-355 , 1 cm and 2-3 cm in length [2] [3]. For long soaking
times (24h) the size does not matter. However, for washing for shorter periods of time size does
matter. Other types of feedstock sizes range from [15] to 3.9 mm [16]. For a test from
BTG a kind of loosely compacted pellet of size 10 mm was used [internal communications].
4.4.2 FRESH OR DRY From [16] it can be read that reducing the feedstock size is much harder for fresh than for dry
biomass. Also does [21] report that ash was not washed away when fresh straw was used. Also [4]
reports that ash from fresh feedstock is harder to purge but adds the comment that the cellular
structure of the old EFB might be weakened.
15
4.4.3 TEMPERATURE An increased temperature of the washing water results in more ash washed out of the biomass. [4]
reports that, using water with a temperature range of 27-90 C that the ash reduction was
enhanced between 74% to 77% (tap water, stirring, 2-3 cm). It must be noted that on higher
temperatures the amount of feedstock that is washed away also increases from 8% to 14%. All
other literature performed washing experiments at room temperature except [19] at 90 C but here
was not varied in temperature. Temperature dependence can be explained by higher diffusion rates
at higher temperatures.
4.4.4 AMOUNT OF WATER The amount of water used for washing varies between a ratio between biomass and water of 1:8.3
[16] (by weight, dry matter to water) to 1:100 [19]. In [23] the difference in ash reduction between
1:20 and 1:50 is studied. For sugar beet pulp, the difference in ash reduction is 48% and 51%
(30min) and for grape pomace the difference was 56% and 61%. From [16] can be seen that during
the washing about 40% of the total potassium is washed out with a water ratio of 1:11.5. In [4] the
amount of water is also varied; ratios of 1:15, 1:30 and 1:50 (for 10% moisture in the feedstock)
resulted in an ash reduction of respectively 62%, 66% an 69%.
4.4.5 RESIDENCE TIME In [16] the shortest residence time of 3 minutes was used and about 20% of the potassium was
washed out. In [23] the difference between 30 and 120 minutes was studied: for sugar beet
pulp(1:50 water ratio) it increased from 57% to 54% ash reduction but for grape pomace ash
reduced from 61% to 69%. As stated, this phenomena can be explained by the unwanted leaching of
biomass. [4] states that the diffusion is very fast in the first 10 minutes(250-355 ) and after that
just slowly more ash is washed out. For the 2-3 cm size feedstock ash is very quickly reduced in the
first minutes (32% reduction) while after 20 minutes the fast diffusion becomes slow when about
60% ash is washed out.
Washing clearly has a minimal time in which the ash removal is fast and a maximum time were
organic parts significant leach out. The residence time of the EFB in a washing tank should thus not
be too long or too short. In Appendix B a very rough estimation of the diffusion time is calculated.
4.4.6 TYPE OF WASHING Numerous types of washing are found in the literature. Most used is soaking where the biomass is
put under water for a specified time. Better results are obtained when the biomass is also stirred
but the extra ash removed is only 2-3% [4]. In [16] and [17]the biomass is pressed, washed and
pressed again. Pressing is useful in two ways before washing: first it decreases the amount of water
with soluble ashes and second it weakens the cellular structure so washing is more effective. In
chapter Appendix C sugar cane processing is discussed that has many similarities with this method.
A second washing step can also be envisioned but in none of the found literature this is studied.
16
4.4.7 TYPE OF WATER As washing water, tap water and distilled water are studied. In [4] both were compared and
distilled water gave a better ash reduction 76% in contrast to 73% with tap water (2-3 cm
feedstock) or 80% versus 73% for feedstock size 250-355 . A third possibility to reuse washing
water that is already polluted with ashes was not found in literature.
4.5 CONCLUSIONS Tap water or other clean water available at the palm oil mill will be used for washing. The
costs of distilled water is much too high to use in an industrial process when only a slight
increase in ash reduction is gained. Also no additives like acids will be added to the water.
The desired size will be the size that is required for the pyrolysis process. The EFB is
shredded to loose fibers of length 0.5 – 1 inch or 1.25 – 2.5 mm. Larger feedstock requires
longer residence times while smaller feedstock has the side effect that organics start to
dissolve in water.
The EFB are directly used after the separation of the fruits and are thus considered fresh.
However, the fruit bunches have undertaken a steam treatment so the cellular structure is
already damaged.
The temperature of the water will not be increased since the effects are not very large while
large amounts of energy are required to heat up the water. When additional ‘free’ steam is
available at the palm oil mill it can be used.
The amount of water is very decisive; more water will increase the ash release. The ration
between dry biomass and water is best between 1:10 and 1:20. This because of the relative
large amount of ash washed out compared to the increase in water usage.
Based on the very fast ash reduction during the initial washing time, the residence time for
shredded feedstock is estimated to be optimal at 10-15 minutes.
17
5 FOULING AND SLAGGING In a large scale pyrolysis plant, char is combusted to produce the heat required for the pyrolysis
process. Char is about 20% of the products after the pyrolysis of a biomass. When char is
combusted, inorganic components of the char can be sticking on the surfaces of the combustion unit
and this is called fouling. When these deposits start melting it becomes sticky and after cooling form
a glassy layer it is called slagging.
In literature it is found that burning a fuel containing ash, has a negative effect on a boilers
efficiency. Some components in the ash like , , and will lowers the melting
temperature of the ash and thus enhance the adhesion of fly ash particles. This can cause fouling in
the heat transfer regions of the boiler and thus reduce efficiency and increases the frequency of
maintenance [26] [27]. According to [28], sugar cane bagasse does not exhibit fouling since both
chorine as potassium are leached during the process of extracting sugar. [29] concludes that
washing biomass feedstock results in the reduction of alkali release during combustion.
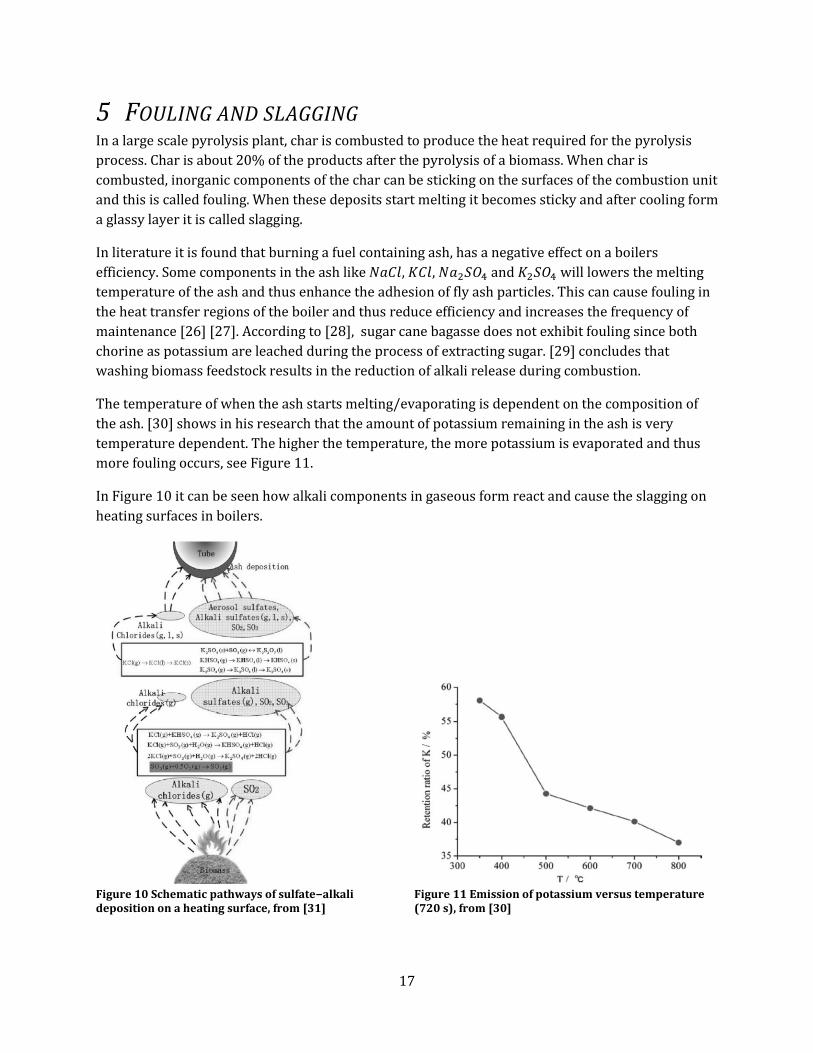
The temperature of when the ash starts melting/evaporating is dependent on the composition of
the ash. [30] shows in his research that the amount of potassium remaining in the ash is very
temperature dependent. The higher the temperature, the more potassium is evaporated and thus
more fouling occurs, see Figure 11.
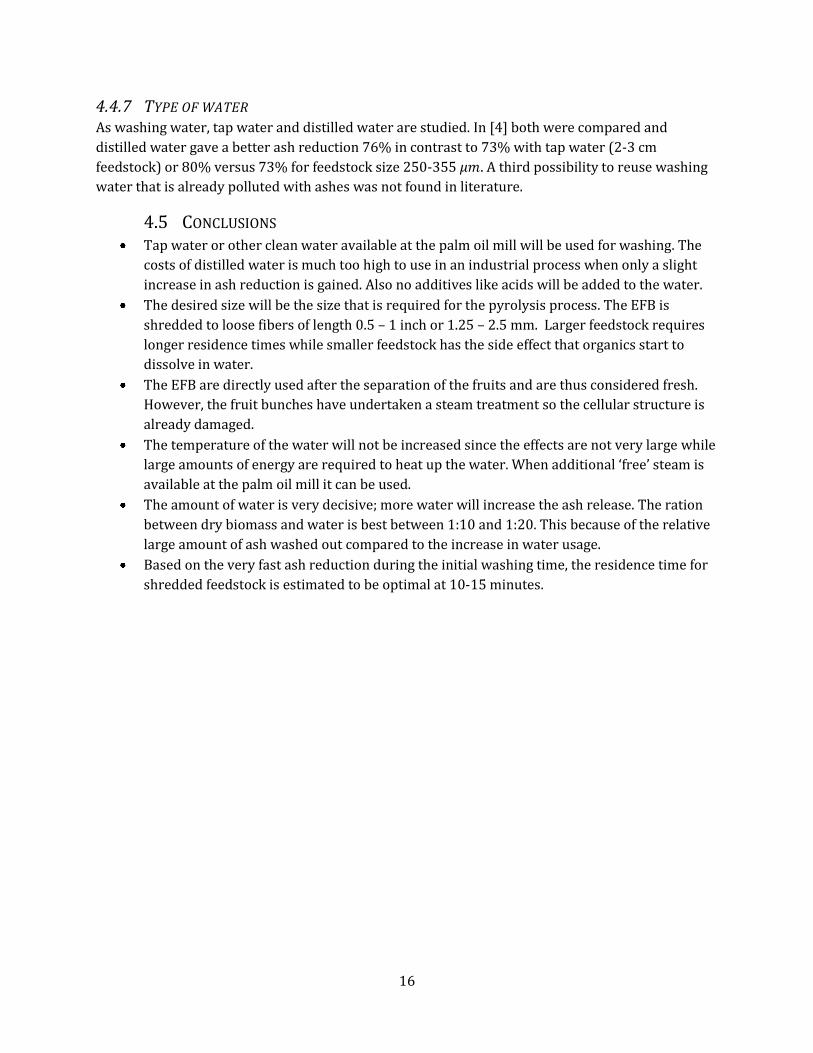
In Figure 10 it can be seen how alkali components in gaseous form react and cause the slagging on
heating surfaces in boilers.
Figure 10 Schematic pathways of sulfate−alkali deposition on a heating surface, from [31]
Figure 11 Emission of potassium versus temperature (720 s), from [30]

18
As a design parameter, [32] states that one must strive to fuel with alkali level smaller than 0.17
kg/GJ in order to prevent fouling. Alkali levels greater than 0.34 kg/GJ will cause definitely fouling
and possibly slagging.
Char produced by the pyrolysis of EFB has an HHV of about or . It is assumed
that all Potassium from the biomass after pyrolysis is incorporated in the char as a worst case
scenario. EFB contain about 2.4% potassium while char is about 20% of the mass of the initial EFB.
This results in an potassium content of almost 10% of the char. This results in of potassium
which will definitely cause fouling and slagging.
During the washing of the EFB it is assumed that 90% of the potassium is washed out. This results
in a potassium amount of and thus still a factor 3 too high to prevent fouling. However,
small part of the potassium will also end up in the pyrolysis oil. Experiments must show how much
potassium will end up in the char.
19
6 DESIGN In this chapter a cost effective EFB washing installation is designed that can be implemented at an
palm oil mill. It is tried to minimize water usage and waste, energy usage and complexity while
maximizing the washout of potassium. The washing installation will be placed after the size
reduction pretreatment and before the drying of the feedstock. In this way, possible existing plants
can easily be modified for washing of EFB
6.1 DESIGN PARAMETERS The following design parameters were used for the design for the washing of EFB. All are based on
results found in chapter 4, minimizing complexity and their application in the pyrolysis unit.
5 tons per hour EFB (dry), moisture content about 65% moisture (wet basis) so 14.3 t/h
Fiber length of the feedstock is 0.5 – 1 inch (or 1.25 – 2.5 cm)
Water biomass ratio 1:10
Average residence time 12 minutes
Tap water without additives is used
No heating of the water
Amount of potassium washed out 90%
6.2 SIZING PRETREATMENT In order to convert the EFB in a pyrolysis plant, it first has to be reduced in size for good
conversion. The effectiveness of washing EFB is also increased when the EFB is reduced in size. It is
thus a logically step to reduce the EFB in size to the required size for pyrolysis before washing.
The size reduction will be done in two separate steps. The first step will consist of a shredding step
in which the whole EFB will be shredded to chumps of about size of length 2 to 4 inch (5 to 10 cm).
In the next step the EFB will be run through a hammer mill in order to reduce the size even more to
0.5 to 1 inch (1.25 to 2.5 cm) and loosening the fibers.
6.3 WASHING For washing two different setups are studied. In the first setup, the EFB is, after the size reduction
pretreatment, washed in a single water tank. The second setup consists of multiple washing tanks
in series with in between dewatering equipment. In this chapter mostly the taking out of potassium
is discussed since this is the mineral that is most required to be washed out.
In theory, a single tank installation requires more water to obtain an equivalent removal of
potassium compared to the water usage in multiple tanks. The concentration of potassium in the
washing water has to be remained relative low in order to wash most potassium out. In a single
tank setup this can only be done by using large amounts of water. In a multiple tank setup the low
concentration has only to be maintained in the last tank to remove the remainder of the potassium.
In the tanks upstream, higher concentrations of potassium in the washing water can be used since
not all potassium has to be removed in that tank. A multiple tank setup has also as advantage that
20
not only diffusion acts as mechanism to remove the potassium from the EFB, also the mechanical
dewatering removes water dissolved potassium.
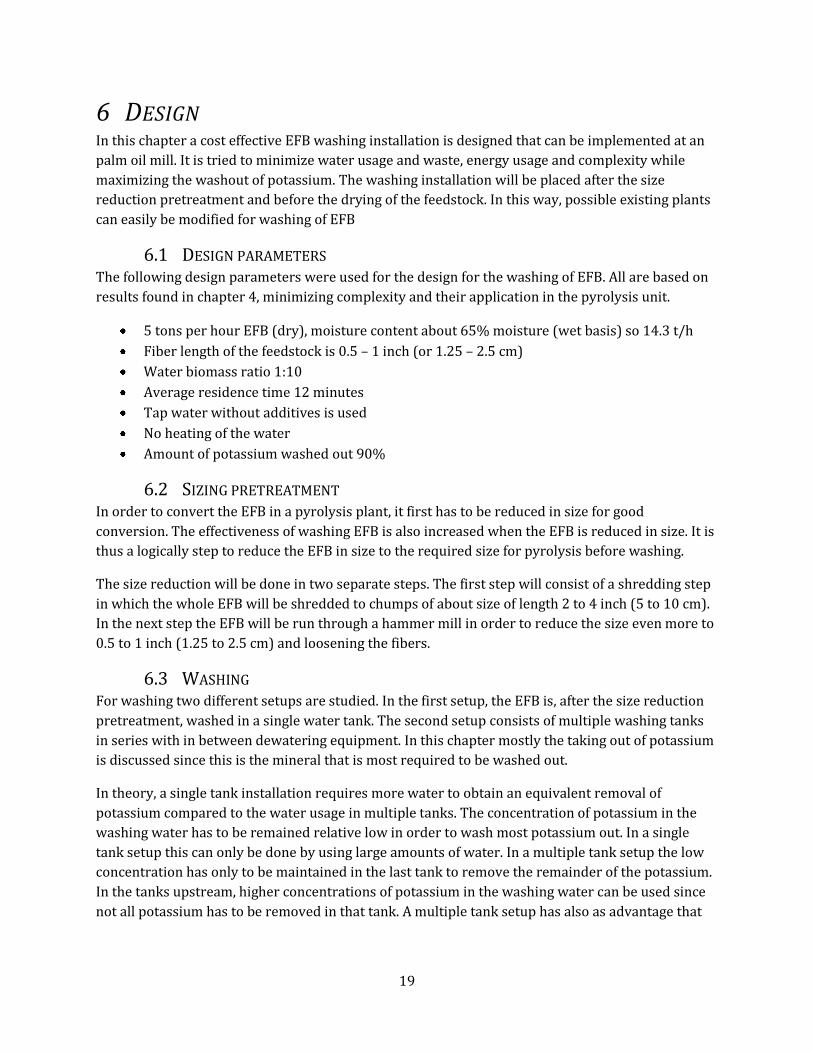
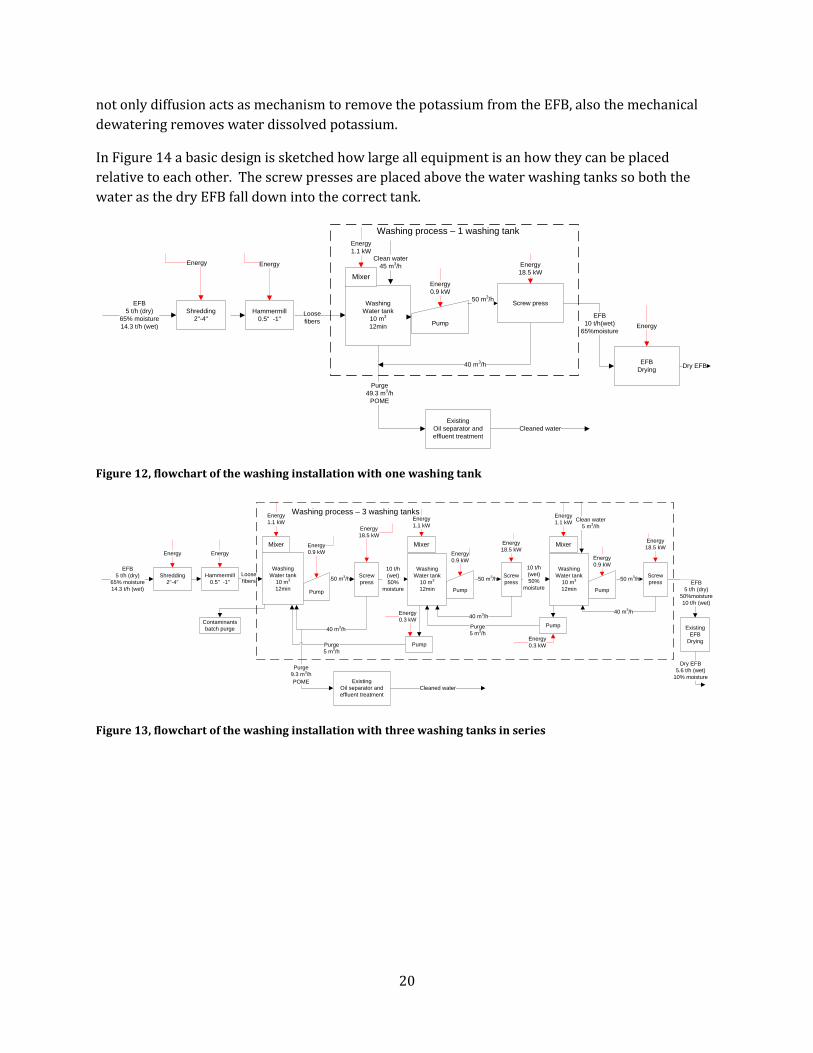
In Figure 14 a basic design is sketched how large all equipment is an how they can be placed
relative to each other. The screw presses are placed above the water washing tanks so both the
water as the dry EFB fall down into the correct tank.
Shredding
2"-4"
EFB
5 t/h (dry)
65% moisture
14.3 t/h (wet)
Washing
Water tank
10 m3
12min
Purge
49.3 m3/h
POME
Clean water
45 m3/h
Hammermill
0.5" -1" Loose
fibersEFB
10 t/h(wet)
65%moisture
EFB
Drying
Existing
Oil separator and
effluent treatment
Dry EFB
Cleaned water
Energy Energy
40 m3/h
Energy
18.5 kW
EnergyPump
Screw press50 m
3/h
Energy
0.9 kW
Washing process – 1 washing tank
Mixer
Energy
1.1 kW
Figure 12, flowchart of the washing installation with one washing tank
Shredding
2"-4"
EFB
5 t/h (dry)
65% moisture
14.3 t/h (wet)
Hammermill
0.5" -1"
Loose
fibers
Existing
EFB
Drying
EFB
5 t/h (dry)
50%moisture
10 t/h (wet)
Existing
Oil separator and
effluent treatment
Dry EFB
5.6 t/h (wet)
10% moisture
Cleaned water
Energy Energy
Screw
press
10 t/h
(wet)
50%
moisture
Screw
press
40 m3/h
Purge
5 m3/h
40 m3/h
Purge
5 m3/h
Energy
18.5 kW
40 m3/h
Washing
Water tank
10 m3
12min
50 m3/h
10 t/h
(wet)
50%
moisture
Screw
press50 m
3/h
Energy
0.9 kW
Energy
18.5 kW
Energy
18.5 kW
50 m3/h
Pump
Contaminants
batch purge
Energy
0.3 kW
Purge
9.3 m3/h
POME
Mixer
Energy
1.1 kW
Washing
Water tank
10 m3
12min Pump
Energy
0.9 kW
Pump
Energy
0.3 kW
Mixer
Energy
1.1 kWClean water
5 m3//h
Washing
Water tank
10 m3
12min Pump
Energy
0.9 kW
Pump
Mixer
Energy
1.1 kW
Washing process – 3 washing tanks
Figure 13, flowchart of the washing installation with three washing tanks in series
21
Water
tank
1
Water
tank
2
Water
tank
3
inlet Screw press out motor
inlet Screw press out motor
inlet Screw press out motor
inlet Screw press out motor
inlet Screw press out motor
inlet Screw press out motorSide view
Top view
6,2
5
pump
0 1,5 2,5 5 mWater
tank
3
Water
tank
2
Water
tank
1
1,60
1,40
1,6
02,5
0
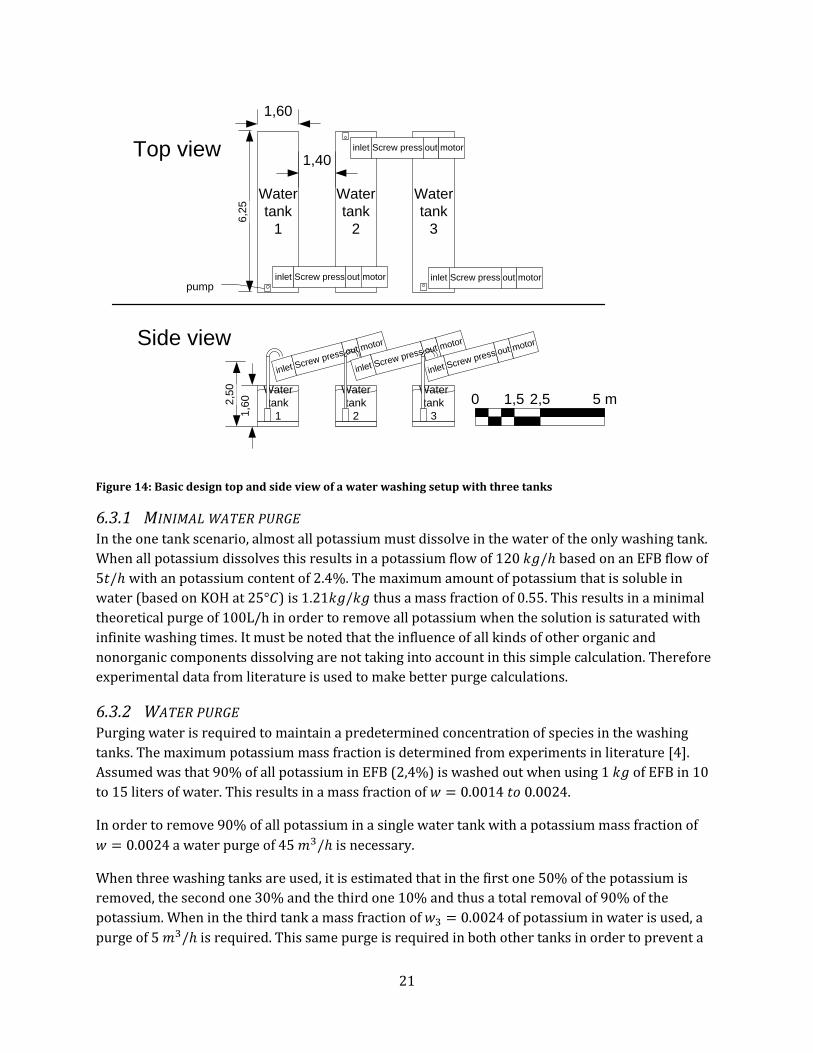
Figure 14: Basic design top and side view of a water washing setup with three tanks
6.3.1 MINIMAL WATER PURGE In the one tank scenario, almost all potassium must dissolve in the water of the only washing tank.
When all potassium dissolves this results in a potassium flow of based on an EFB flow of
with an potassium content of 2.4%. The maximum amount of potassium that is soluble in
water (based on KOH at ) is thus a mass fraction of 0.55. This results in a minimal
theoretical purge of 100L/h in order to remove all potassium when the solution is saturated with
infinite washing times. It must be noted that the influence of all kinds of other organic and
nonorganic components dissolving are not taking into account in this simple calculation. Therefore
experimental data from literature is used to make better purge calculations.
6.3.2 WATER PURGE Purging water is required to maintain a predetermined concentration of species in the washing
tanks. The maximum potassium mass fraction is determined from experiments in literature [4].
Assumed was that 90% of all potassium in EFB (2,4%) is washed out when using of EFB in 10
to 15 liters of water. This results in a mass fraction of .
In order to remove 90% of all potassium in a single water tank with a potassium mass fraction of
a water purge of is necessary.
When three washing tanks are used, it is estimated that in the first one 50% of the potassium is
removed, the second one 30% and the third one 10% and thus a total removal of 90% of the
potassium. When in the third tank a mass fraction of of potassium in water is used, a
purge of is required. This same purge is required in both other tanks in order to prevent a
22
buildup of water. This purge together with the estimation of the amount of potassium washed out
results in a potassium mass fraction in the first and second tank of respectively and
.
In both scenarios an additional amount of of POME is generated due to water that is
pressed out of the biomass. Three washing tanks is chosen in favor over one washing tank based on
the amount of washing water required in the latter case.
6.3.3 POTASSIUM CONTENT IN THE POME From [33] can be read that normally POME contains about 2 kg of potassium per cubic meter so the
mass fraction is about . For each ton of FFB (or of EFB), of POME is
generated. Based on the EFB washing this correspondents with an POME production of
and a potassium amount of . When 90% of the potassium in EFB is washed out
this results in a potassium flow of . Therefore it is unavoidable that the potassium content
is raised in the POME unless the amount of water added is almost doubled. The potassium mass
fraction will become .
6.3.4 WATER WASHING TANKS In the water tanks the actual washing of the biomass takes place. The tanks will be sized at 10 liters
of water for each kilogram of EFB is inside it. An average residence time of 12 minutes per tank will
be maintained so that at any given time one ton of EFB is in each tank. For the washing of
are thus tanks of size necessary.
The water tanks are envisioned that EFB enters from above on one side and the washed EFB is
taken out on the other side at the bottom. In Figure 15 a basic 3D design of a water washing tank is
show. As can be seen the EFB enters at the right side from above through an opening in the tank.
The EFB is positioned above this opening by a conveyor belt for the first tank. The EFB inlet of the
other two tanks have the outlet of the screw press directly above then so the EFB can fall through a
chute directly in the tanks.
On the left side a vortex pump will pump the EFB-water mixture up. The soaked EFB is taken out
together with large amounts of washing water and transported to the inlet of a screw press that is
positioned roughly above the pump.
23
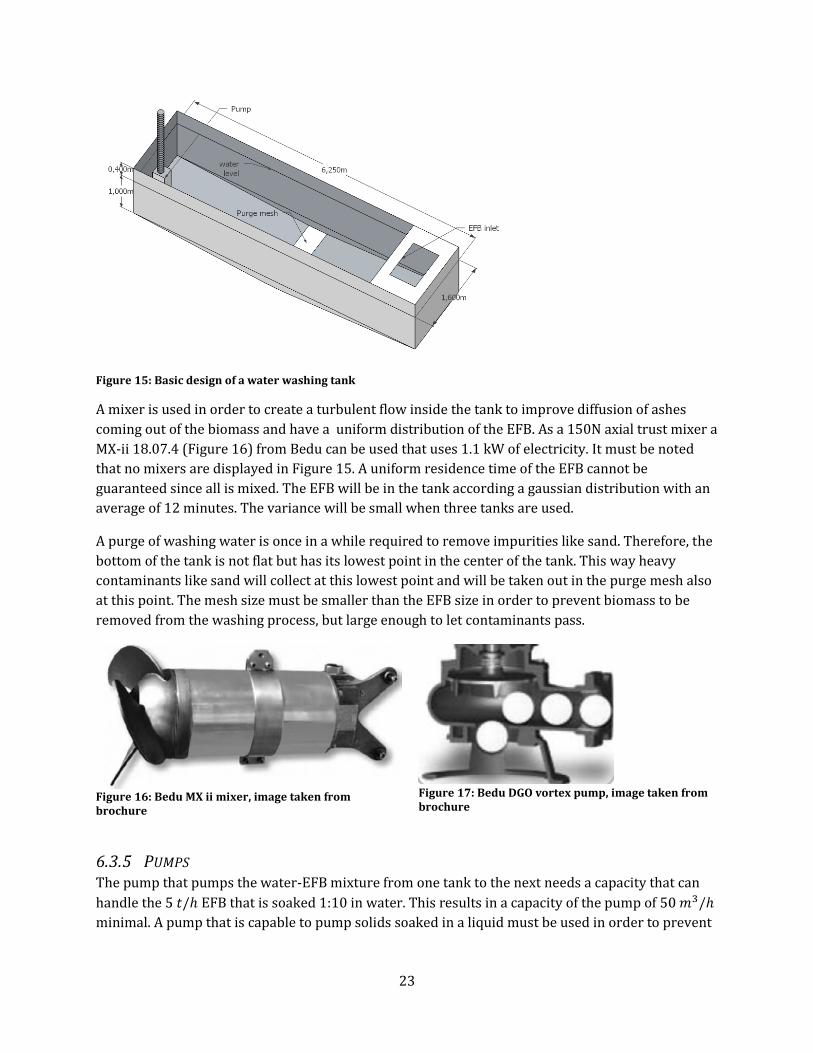
Figure 15: Basic design of a water washing tank
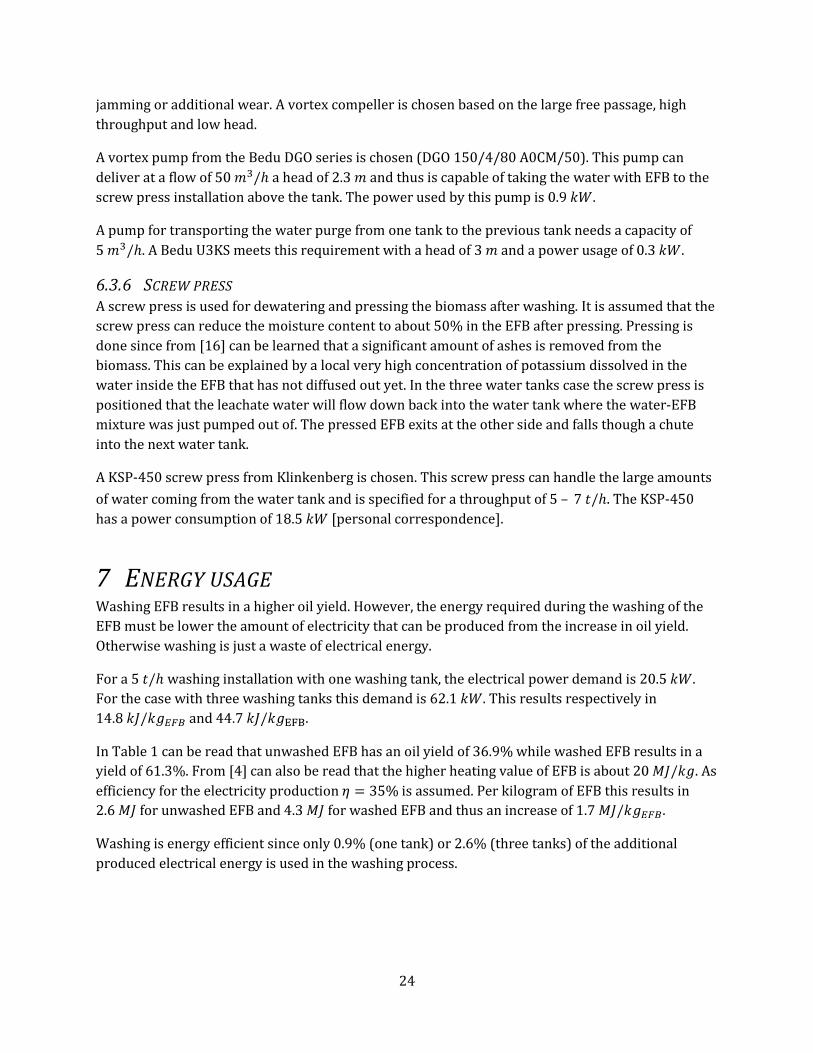
A mixer is used in order to create a turbulent flow inside the tank to improve diffusion of ashes
coming out of the biomass and have a uniform distribution of the EFB. As a 150N axial trust mixer a
MX-ii 18.07.4 (Figure 16) from Bedu can be used that uses 1.1 kW of electricity. It must be noted
that no mixers are displayed in Figure 15. A uniform residence time of the EFB cannot be
guaranteed since all is mixed. The EFB will be in the tank according a gaussian distribution with an
average of 12 minutes. The variance will be small when three tanks are used.
A purge of washing water is once in a while required to remove impurities like sand. Therefore, the
bottom of the tank is not flat but has its lowest point in the center of the tank. This way heavy
contaminants like sand will collect at this lowest point and will be taken out in the purge mesh also
at this point. The mesh size must be smaller than the EFB size in order to prevent biomass to be
removed from the washing process, but large enough to let contaminants pass.
Figure 16: Bedu MX ii mixer, image taken from brochure
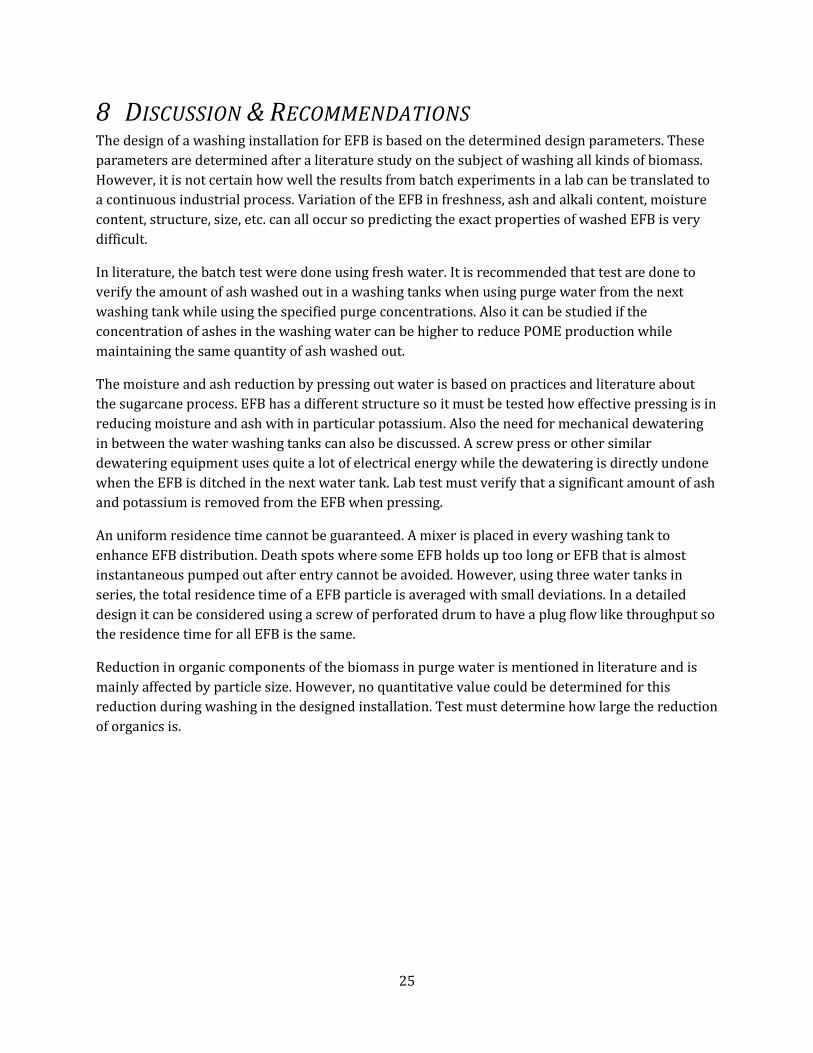
Figure 17: Bedu DGO vortex pump, image taken from brochure
6.3.5 PUMPS The pump that pumps the water-EFB mixture from one tank to the next needs a capacity that can
handle the EFB that is soaked 1:10 in water. This results in a capacity of the pump of
minimal. A pump that is capable to pump solids soaked in a liquid must be used in order to prevent
24
jamming or additional wear. A vortex compeller is chosen based on the large free passage, high
throughput and low head.
A vortex pump from the Bedu DGO series is chosen (DGO 150/4/80 A0CM/50). This pump can
deliver at a flow of a head of and thus is capable of taking the water with EFB to the
screw press installation above the tank. The power used by this pump is .
A pump for transporting the water purge from one tank to the previous tank needs a capacity of
. A Bedu U3KS meets this requirement with a head of and a power usage of .
6.3.6 SCREW PRESS A screw press is used for dewatering and pressing the biomass after washing. It is assumed that the
screw press can reduce the moisture content to about 50% in the EFB after pressing. Pressing is
done since from [16] can be learned that a significant amount of ashes is removed from the
biomass. This can be explained by a local very high concentration of potassium dissolved in the
water inside the EFB that has not diffused out yet. In the three water tanks case the screw press is
positioned that the leachate water will flow down back into the water tank where the water-EFB
mixture was just pumped out of. The pressed EFB exits at the other side and falls though a chute
into the next water tank.
A KSP-450 screw press from Klinkenberg is chosen. This screw press can handle the large amounts
of water coming from the water tank and is specified for a throughput of – . The KSP-450
has a power consumption of [personal correspondence].
7 ENERGY USAGE Washing EFB results in a higher oil yield. However, the energy required during the washing of the
EFB must be lower the amount of electricity that can be produced from the increase in oil yield.
Otherwise washing is just a waste of electrical energy.
For a washing installation with one washing tank, the electrical power demand is .
For the case with three washing tanks this demand is . This results respectively in
and .
In Table 1 can be read that unwashed EFB has an oil yield of while washed EFB results in a
yield of 61.3%. From [4] can also be read that the higher heating value of EFB is about . As
efficiency for the electricity production is assumed. Per kilogram of EFB this results in
for unwashed EFB and for washed EFB and thus an increase of .
Washing is energy efficient since only 0.9% (one tank) or 2.6% (three tanks) of the additional
produced electrical energy is used in the washing process.
25
8 DISCUSSION & RECOMMENDATIONS The design of a washing installation for EFB is based on the determined design parameters. These
parameters are determined after a literature study on the subject of washing all kinds of biomass.
However, it is not certain how well the results from batch experiments in a lab can be translated to
a continuous industrial process. Variation of the EFB in freshness, ash and alkali content, moisture
content, structure, size, etc. can all occur so predicting the exact properties of washed EFB is very
difficult.
In literature, the batch test were done using fresh water. It is recommended that test are done to
verify the amount of ash washed out in a washing tanks when using purge water from the next
washing tank while using the specified purge concentrations. Also it can be studied if the
concentration of ashes in the washing water can be higher to reduce POME production while
maintaining the same quantity of ash washed out.
The moisture and ash reduction by pressing out water is based on practices and literature about
the sugarcane process. EFB has a different structure so it must be tested how effective pressing is in
reducing moisture and ash with in particular potassium. Also the need for mechanical dewatering
in between the water washing tanks can also be discussed. A screw press or other similar
dewatering equipment uses quite a lot of electrical energy while the dewatering is directly undone
when the EFB is ditched in the next water tank. Lab test must verify that a significant amount of ash
and potassium is removed from the EFB when pressing.
An uniform residence time cannot be guaranteed. A mixer is placed in every washing tank to
enhance EFB distribution. Death spots where some EFB holds up too long or EFB that is almost
instantaneous pumped out after entry cannot be avoided. However, using three water tanks in
series, the total residence time of a EFB particle is averaged with small deviations. In a detailed
design it can be considered using a screw of perforated drum to have a plug flow like throughput so
the residence time for all EFB is the same.
Reduction in organic components of the biomass in purge water is mentioned in literature and is
mainly affected by particle size. However, no quantitative value could be determined for this
reduction during washing in the designed installation. Test must determine how large the reduction
of organics is.
26
9 CONCLUSION Ash inside biomass has a negative effect on the yield of oil during pyrolysis. The main cause of this
low yield appears to be a catalytic effect that is caused by potassium. Unwashed empty fruit
bunches (EFB) may contain up to 7 % of ash of which potassium can be up to half of it. Washing of
biomass can reduce the amount of ash inside it. Up to 90% of potassium can be washed out since it
is soluble in water.
Scientific literature describes that the washing EFB can greatly improve the oil yield during
pyrolysis from below 40% to yields higher than 60%. The energy used in washing is only a small
fraction of the potential in electrical energy in the additional generated pyrolysis oil.
From experimental data in scientific literature optimal washing conditions for an industrial process
are determined. The used specifications for designing a washing installation are:
5 tons per hour EFB (dry)
Fiber length of the feedstock is 0.5 – 1 inch (or 1.25 – 2.5 cm)
Water to biomass ratio 1:10
Average residence time 12 minutes
Tap water without additives
No heating of the water
The main part of the designed washing installation for EFB are three washing tanks in which ashes
can diffuse out of the biomass. Three water tanks in series are used. Unwashed EFB is entered at the
first tank and pumped to the next. Clean water is added in the last tank in the row and from here
purged to the previous tank. This way the amount of POME is a factor 5 lower than when only one
washing tank is used.
Screw presses are used to dewater the EFB mechanically. Another advantage of this manner is that
additional ash, that has not yet diffused out of the biomass, is removed. The EFB-water mixture is
pumped out of a tank into the inlet of a screw press situated above the tank. This way, all leaking
and pressed out water flows back in to the tank. The next washing tank is situated directly below
the outlet of a screw press so the EFB falls directly in the next tank.
It is expected that 90% of the potassium content of EFB will be washed out in the designed
installation. Based on a throughput of EFB, the installation uses of water and of
electricity.
27
10 BIBLIOGRAPHY
[1] D. Chiaramonti, "Power generation using fast pyrolysis liquids," 2005.
[2] N. Abdullah, "Bio-oil derived from empty fruit bunches," 2008.
[3] N. Abdullah, "Fast pyrolysis of empty fruit bunches," 2009.
[4] N. Abdullah, "An Assessment of Pyrolysis for processing empty fruit bunches," 2005.
[5] M. R. Islam, "Properties of sugarcane waste-derived bio-oils obtained by fixed-bed fire-tube
heating pyrolysis," 2010.
[6] M. Asadullah, "Production of bio-oil from fixed bed pyrolysis of bagasse," 2007.
[7] W.-p. Pan, "Influence Of Metal Ions On Volatile Products," 1988.
[8] D. S. Scott, "Pretreatment of poplar wood for fast pyrolysis:," 2000.
[9] F. A. Agblevor, "Inorganic Compounds in Biomass Feedstocks. 1. Effect," 1995.
[10] W.-p. Pan, "Volatile Products Of Oxidative Pyrolysis Of Wood: Influence Of Metal Ions," 1990.
[11] R. Venderbosch, "Pyrolysis of empty fruit bunch," 2007.
[12] A. Er, "Palm Oil Milling Wastes and Sustainable Development," 2010.
[13] E. Maksum, "Liquid Waste Utilization (pome) Of Palm Oil Factory," 2004.
[14] P. F. Rupani, "Review of Current Palm Oil Mill Effluent (POME) Treatment Methods:
Vermicomposting as a Sustainable Practice," 2010.
[15] P. Das, "Influence of pretreatment for deashing of sugarcane bagasse on pyrolysis products,"
2004.
[16] S. Q. Turn, "Removal of inorganic constituents of biomass feedstocks by mechanical
dewatering and leaching," 1997.
[17] S. Q. Turn, "Fuel characteristics of processed, high fiber sugarcane," 2003.
[18] B. M. JENKINS, "On the Properties of Washed Straw," 1995.
[19] C. D. Blasi, "Degradation characteristics of straw and washed straw," 2000.
28
[20] B. Tonn, "Influence of leaching on the chemical composition of grassland biomass for
combustion," 2011.
[21] B. Tonn, "Leaching of biomass from semi-natural grasslands - Effects on chemical composition
and ash high-temperature behaviour," 2011.
[22] X. Liu, "Removal of inorganic constituents from pine barks and switchgrass," 2011.
[23] C. Yu, "Solid–liquid extraction of alkali metals and organic compounds by leaching of food
industry residues," 2010.
[24] L. Ji-li, "Variation In Corn Stover Yield And Fule Quality With Harvest Time," 2009.
[25] R. R. Bakker, "Feasibility of collecting naturally leached rice straw for thermal conversion,"
2003.
[26] P. Jensen, "Pretreatment of straw for power production by pyrolysis and char wash," 2001.
[27] B. Jenkins, "Combustion properties of biomass," 1998.
[28] L. L. Baxter, "The behavior of inorganic material in biomass-fired power boilers: field and
laboratory experiences," 1998.
[29] D. C. Dayton, "Release of Inorganic Constituents from Leached Biomass during Thermal
Conversion," 1998.
[30] Y. Liao, "Experimental Study on the Combustion Characteristics and Alkali Transformation
Behavior of Straw," 2012.
[31] X. Wang, "Mechanism Research on the Development of Ash Deposits on the Heating Surface of
Biomass Furnaces," 2012.
[32] T. R. Miles, "Alkali Deposits Found In Biomass Power Plants, A Preliminary Investigation Of
Their Extent And Nature," 1995.
[33] I.-I. f. P. G. o. b. o. GTZ, "Environmental Management Guideline for the Palm Oil Industry," 1997.
[34] C. G. CT3420, "Afvalwaterbehandeling," 2008.
[35] ?, "Kwaliteit Loosbaar Water Van Veb Aan Lankerenseweg 34 3781 NB Voorthuizen," 2011.
[36] W. A. e. Maas, "Ontwerpbeschikking watervergunning ten behoeve van Gebroeders van der
Brand bv," 2012.
29
[37] I. Phillipines, "Scoping Study Clean Technology Opportunities and Barriers in Indonesian Palm
Oil Mill and Rice Mill Industries," ?.
[38] B. Jenkins, "Closed-Loop Biomass Co-Firing – Pilot-Scale and Full-Scale Demonstration Results,
4. ASH DEPOSITION INVESTIGATIONS," 2004.
[39] E. Hugot, Handbook of cane sugar engineering, 1986.
[40] D. SMET, "Sugar Cane Diffusion," 2010.
[41] "Sugar industry," [Online]. Available: http://cpcbenvis.nic.in/newsletter/agro-dec-
1994/dec943.htm.
[42] "POLLUTION PREVENTION DIAGNOSTIC CANE SUGAR MILL," 1998.
[43] M. G. Cortés, "Water and Wastewater Management in a Sugar Process production," 2011.
[44] D. Caldwell, "Molasses in Feeds," ?.
30
Appendix A Wastewater discharge The residual water after washing a biomass contains certain pollutants. These pollutants consist of
minerals and organic components.
A.1 Organic components Discharging waste water that contains organic components is not to be considered lightly; too much
waste discharged into water can destroy all life in it. The reason for this is that the organic
components are broken down by aerobic micro-organisms that use oxygen dissolved in water for it.
Two values are used to determine the amount of oxygen used by the waste water: biological oxygen
demand BOD and chemical oxygen demand COD. The BOD value states the amount of oxygen,
usually mg/L water at 20 C that is used in 5 days. The COD is slightly different and states the total
amount of oxygen needed to break down all organic components in the water.
From [34] it is read that the maximal value for BOD for waste water discharging in surface water in
The Netherlands is .
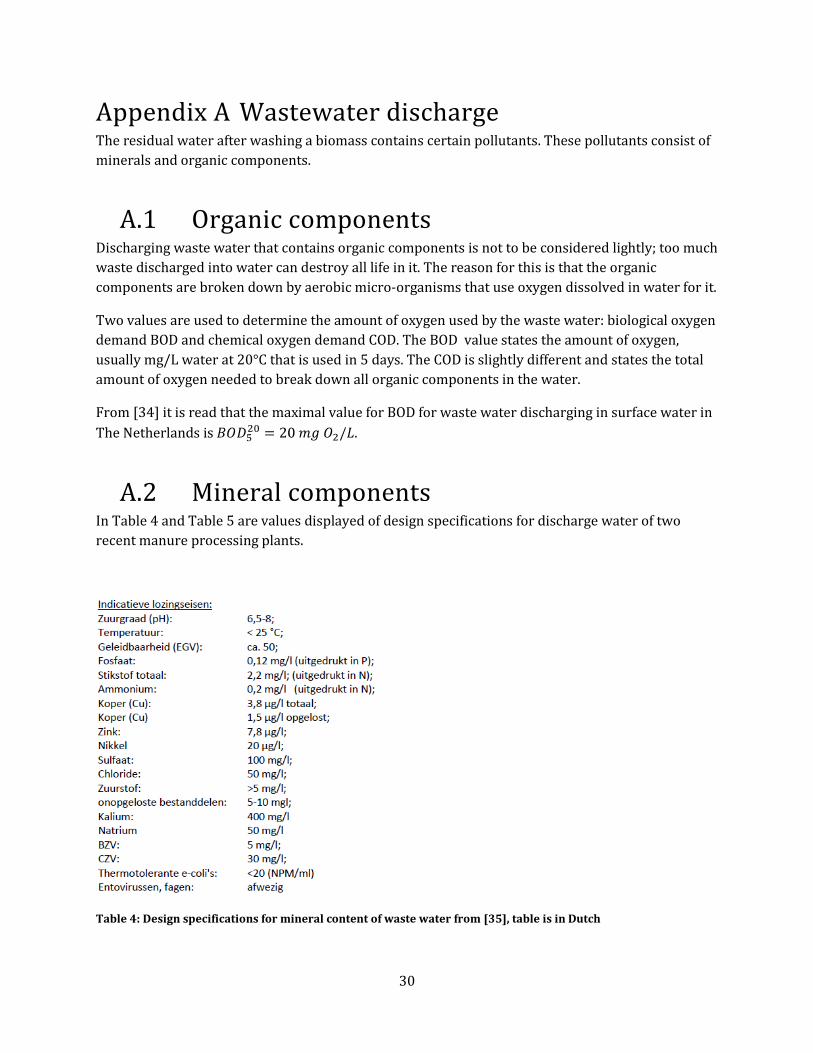
A.2 Mineral components In Table 4 and Table 5 are values displayed of design specifications for discharge water of two
recent manure processing plants.
Table 4: Design specifications for mineral content of waste water from [35], table is in Dutch
31
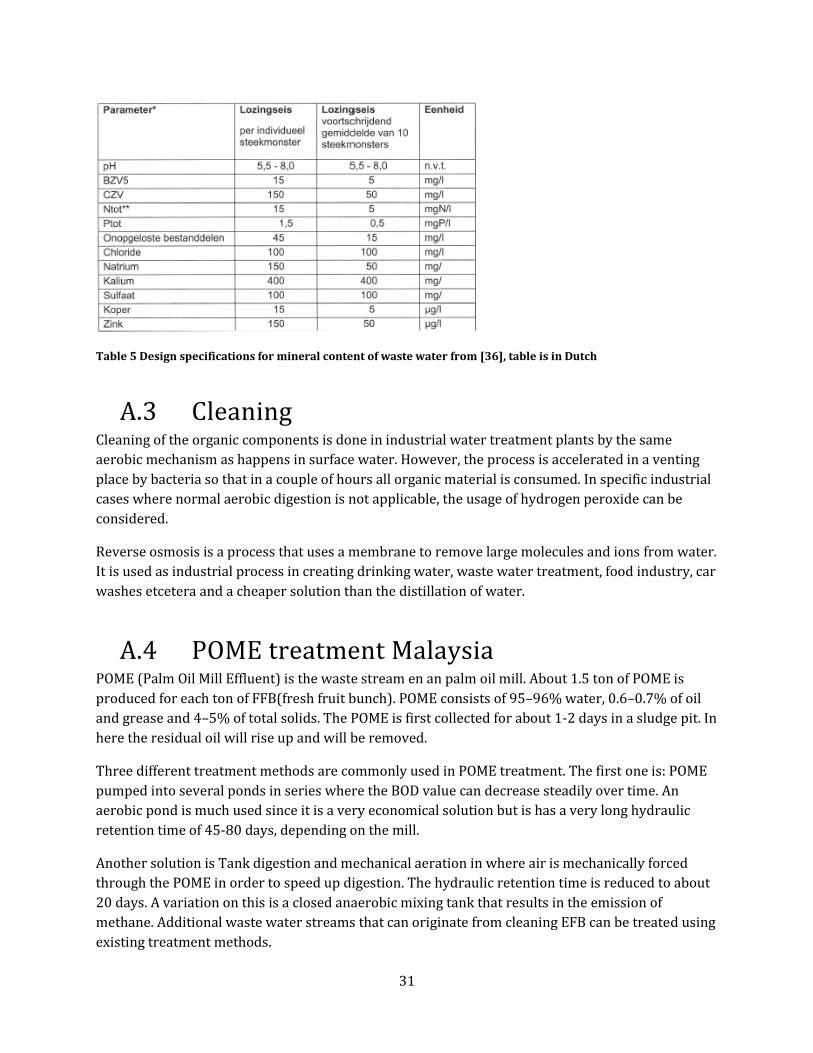
Table 5 Design specifications for mineral content of waste water from [36], table is in Dutch
A.3 Cleaning Cleaning of the organic components is done in industrial water treatment plants by the same
aerobic mechanism as happens in surface water. However, the process is accelerated in a venting
place by bacteria so that in a couple of hours all organic material is consumed. In specific industrial
cases where normal aerobic digestion is not applicable, the usage of hydrogen peroxide can be
considered.
Reverse osmosis is a process that uses a membrane to remove large molecules and ions from water.
It is used as industrial process in creating drinking water, waste water treatment, food industry, car
washes etcetera and a cheaper solution than the distillation of water.
A.4 POME treatment Malaysia POME (Palm Oil Mill Effluent) is the waste stream en an palm oil mill. About 1.5 ton of POME is
produced for each ton of FFB(fresh fruit bunch). POME consists of 95–96% water, 0.6–0.7% of oil
and grease and 4–5% of total solids. The POME is first collected for about 1-2 days in a sludge pit. In
here the residual oil will rise up and will be removed.
Three different treatment methods are commonly used in POME treatment. The first one is: POME
pumped into several ponds in series where the BOD value can decrease steadily over time. An
aerobic pond is much used since it is a very economical solution but is has a very long hydraulic
retention time of 45-80 days, depending on the mill.
Another solution is Tank digestion and mechanical aeration in where air is mechanically forced
through the POME in order to speed up digestion. The hydraulic retention time is reduced to about
20 days. A variation on this is a closed anaerobic mixing tank that results in the emission of
methane. Additional waste water streams that can originate from cleaning EFB can be treated using
existing treatment methods.
32
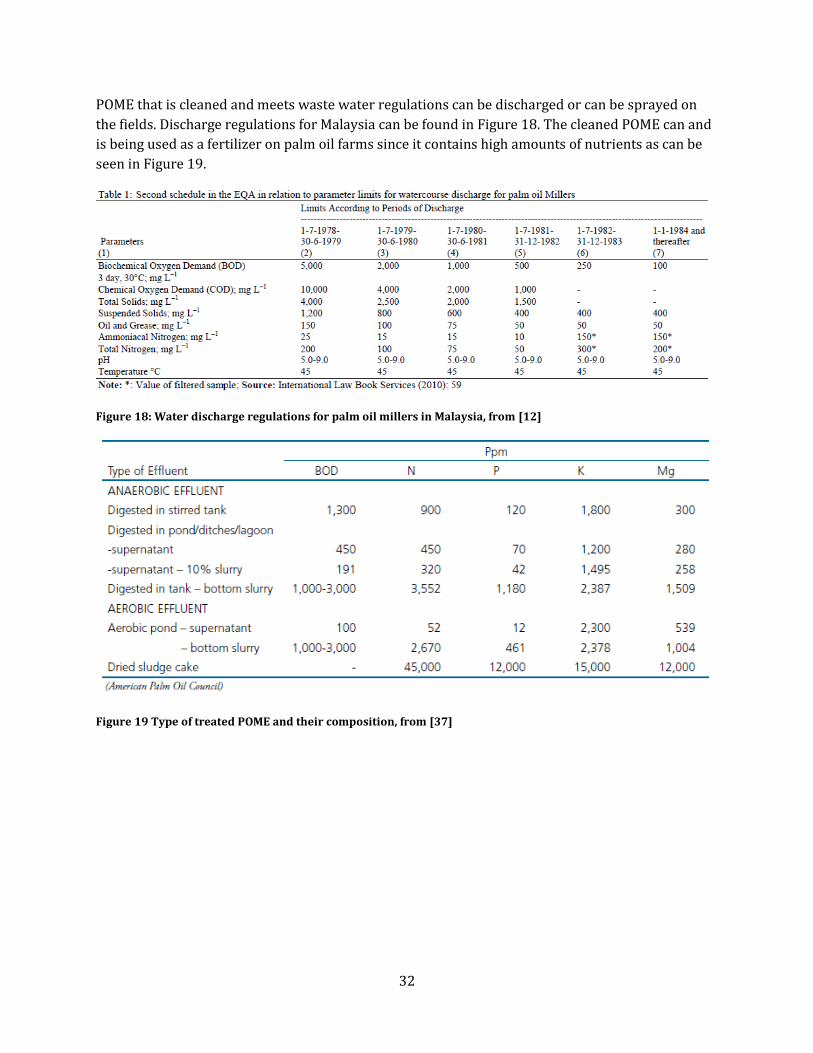
POME that is cleaned and meets waste water regulations can be discharged or can be sprayed on
the fields. Discharge regulations for Malaysia can be found in Figure 18. The cleaned POME can and
is being used as a fertilizer on palm oil farms since it contains high amounts of nutrients as can be
seen in Figure 19.
Figure 18: Water discharge regulations for palm oil millers in Malaysia, from [12]
Figure 19 Type of treated POME and their composition, from [37]
33
Appendix B Estimated diffusion time To make a rough estimate of the time diffusion will take, Fick’s first law of diffusion based on mass
fractions is used. A density of for EFB is used and a diffusion coefficient of
of Potassium chloride in water is used. It is however doubtful is this number is
correct; the number should be larger based on the expected presence of the smaller OH ion
(reactant of the reaction between potassium and water). On the other hand the number should be
significantly lower because the ions must diffuse through a porous solid in water instead of just
water.
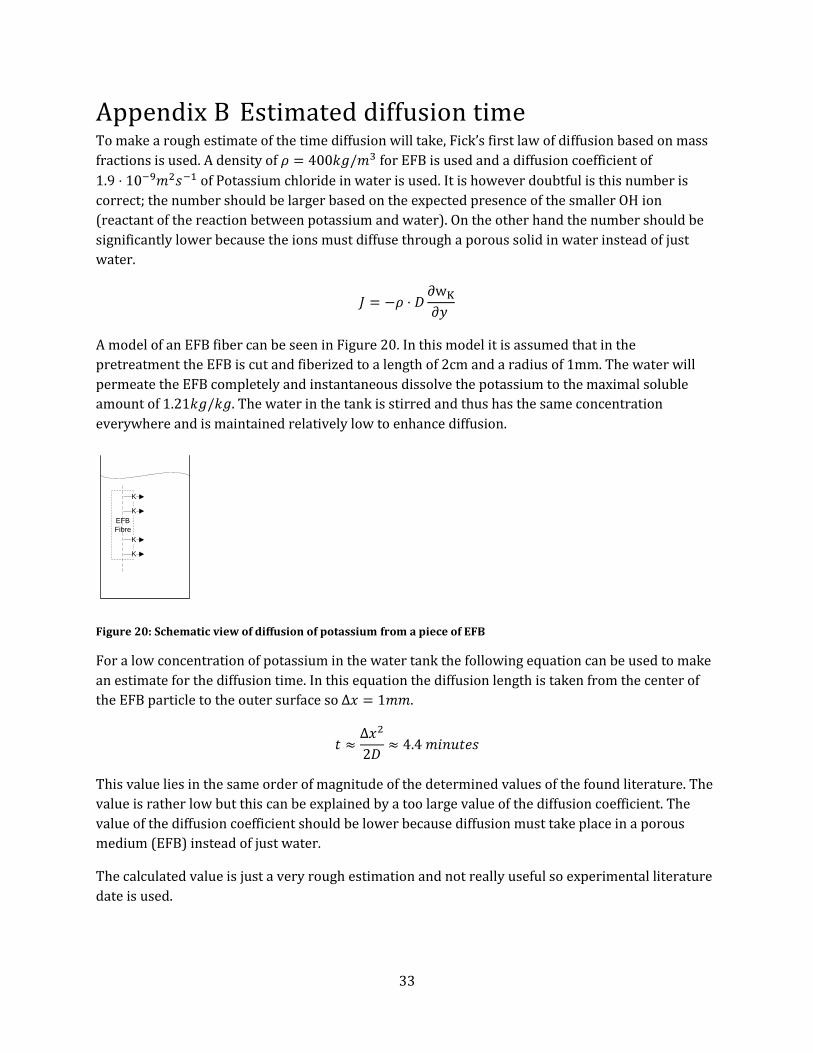
A model of an EFB fiber can be seen in Figure 20. In this model it is assumed that in the
pretreatment the EFB is cut and fiberized to a length of 2cm and a radius of 1mm. The water will
permeate the EFB completely and instantaneous dissolve the potassium to the maximal soluble
amount of . The water in the tank is stirred and thus has the same concentration
everywhere and is maintained relatively low to enhance diffusion.
EFB
Fibre
K
K
K
K
Figure 20: Schematic view of diffusion of potassium from a piece of EFB
For a low concentration of potassium in the water tank the following equation can be used to make
an estimate for the diffusion time. In this equation the diffusion length is taken from the center of
the EFB particle to the outer surface so .
This value lies in the same order of magnitude of the determined values of the found literature. The
value is rather low but this can be explained by a too large value of the diffusion coefficient. The
value of the diffusion coefficient should be lower because diffusion must take place in a porous
medium (EFB) instead of just water.
The calculated value is just a very rough estimation and not really useful so experimental literature
date is used.
34
Appendix C Sugar cane bagasse Sugar cane bagasse is a residual product of the sugar cane industry after the sugar canes are
repeatedly pressed and immersed in water in order to remove as much sugar as possible. Sugar
cane bagasse is very interesting since the unexpected high yields of bio-oil after pyrolysis based on
the relative high ash content. The bagasse is studied on what steps it passes in the sugar production
process in order to explain the high yields of bio-oil.
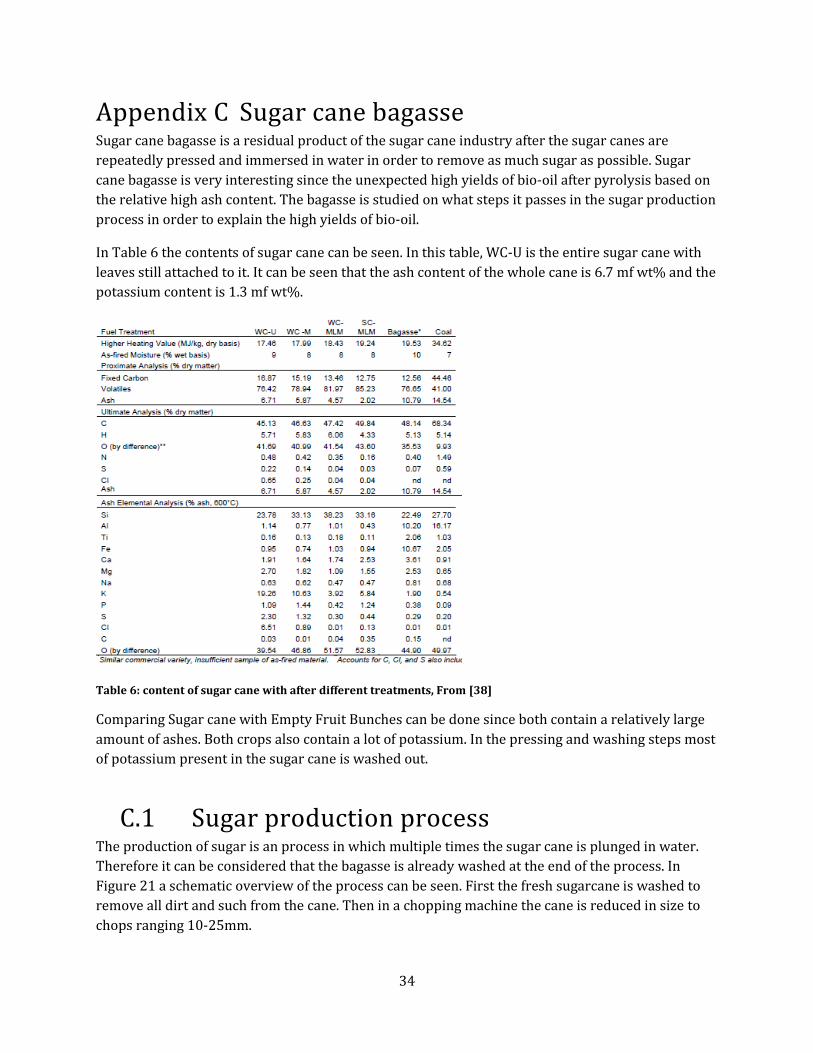
In Table 6 the contents of sugar cane can be seen. In this table, WC-U is the entire sugar cane with
leaves still attached to it. It can be seen that the ash content of the whole cane is 6.7 mf wt% and the
potassium content is 1.3 mf wt%.
Table 6: content of sugar cane with after different treatments, From [38]
Comparing Sugar cane with Empty Fruit Bunches can be done since both contain a relatively large
amount of ashes. Both crops also contain a lot of potassium. In the pressing and washing steps most
of potassium present in the sugar cane is washed out.
C.1 Sugar production process The production of sugar is an process in which multiple times the sugar cane is plunged in water.
Therefore it can be considered that the bagasse is already washed at the end of the process. In
Figure 21 a schematic overview of the process can be seen. First the fresh sugarcane is washed to
remove all dirt and such from the cane. Then in a chopping machine the cane is reduced in size to
chops ranging 10-25mm.
35
WashingSugar Cane Chopping Milling Bagasse
Water
Sugar Juice
Figure 21: Schematic overview of the sugar cane process
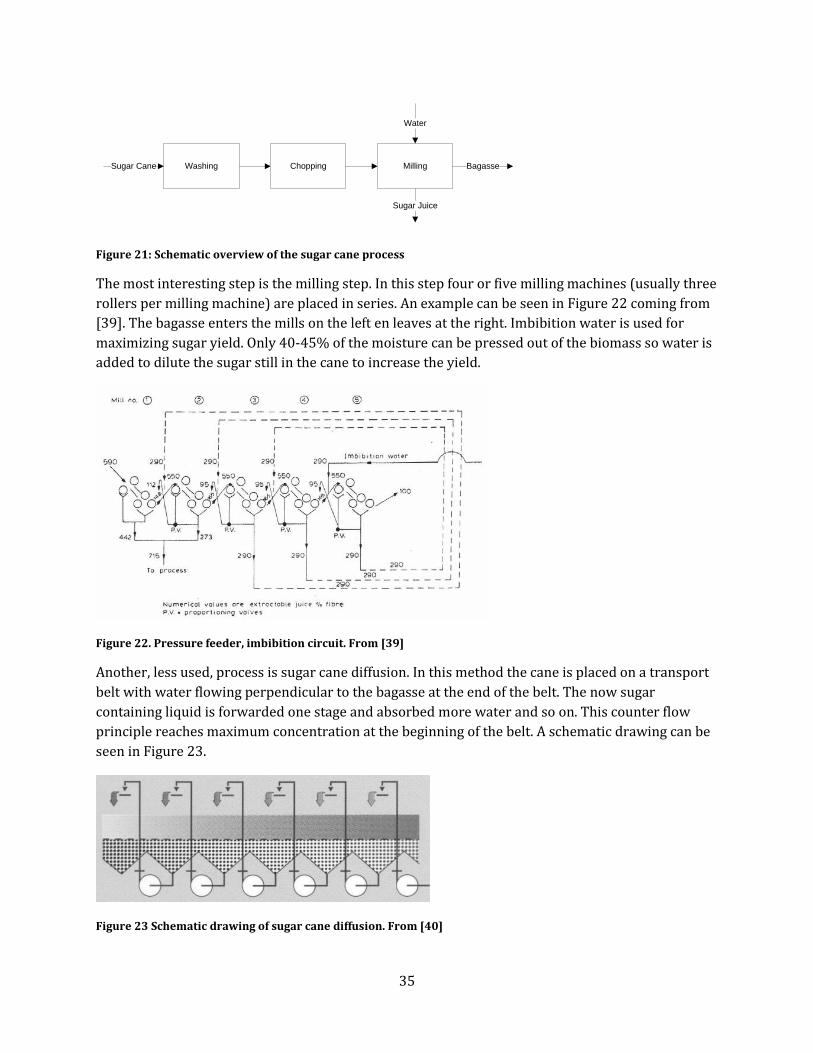
The most interesting step is the milling step. In this step four or five milling machines (usually three
rollers per milling machine) are placed in series. An example can be seen in Figure 22 coming from
[39]. The bagasse enters the mills on the left en leaves at the right. Imbibition water is used for
maximizing sugar yield. Only 40-45% of the moisture can be pressed out of the biomass so water is
added to dilute the sugar still in the cane to increase the yield.
Figure 22. Pressure feeder, imbibition circuit. From [39]
Another, less used, process is sugar cane diffusion. In this method the cane is placed on a transport
belt with water flowing perpendicular to the bagasse at the end of the belt. The now sugar
containing liquid is forwarded one stage and absorbed more water and so on. This counter flow
principle reaches maximum concentration at the beginning of the belt. A schematic drawing can be
seen in Figure 23.
Figure 23 Schematic drawing of sugar cane diffusion. From [40]
36
C.2 Water usage In [41] it is mentioned that around 1500 to 2000 liters of water are used for 1 tons of sugarcane to
produce sugar. 1000 liter of waste water is produced that has a BOD (biochemical oxygen demand)
of 1000 to 1500 mg/liter. It is necessary to clean the waste water, or effluent: discharging it in
water will deplete the water of oxygen and makes the environment unfit for aquatic life.
Discharging on land will cause clogging of soil pores by oil and grease and decaying organics .
However, when condense and cooling water is reused the water usage per ton can be reduced to
100 - 200 L.
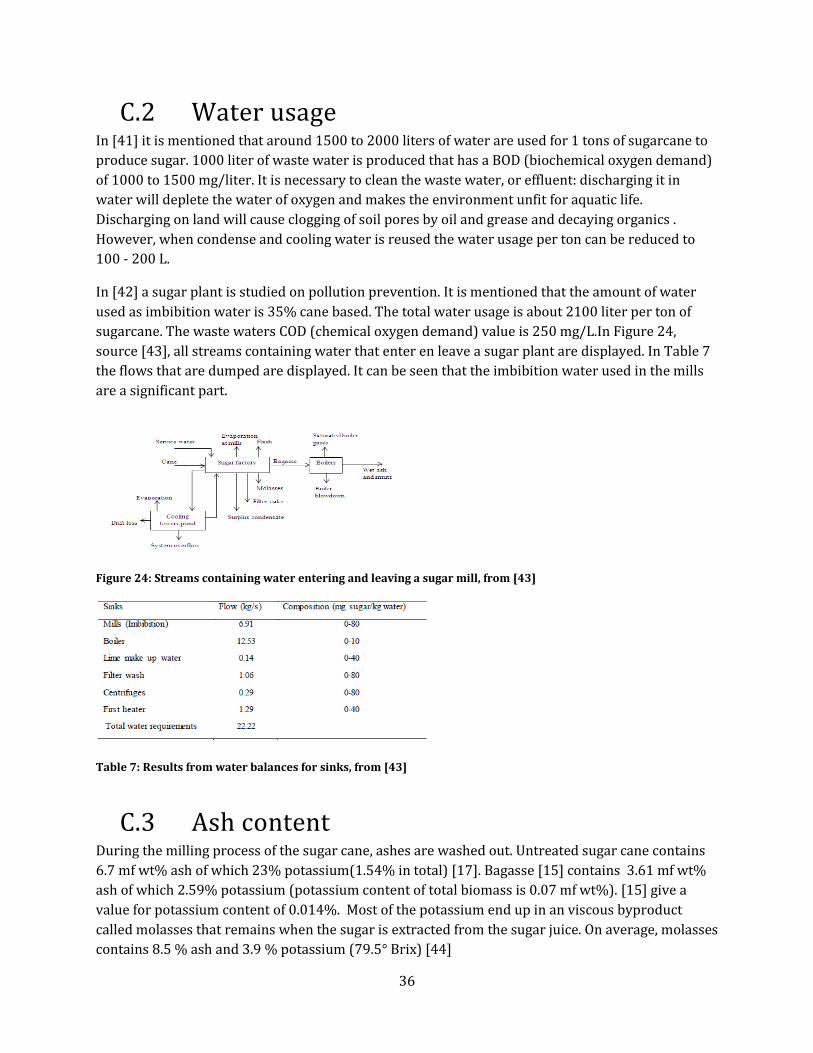
In [42] a sugar plant is studied on pollution prevention. It is mentioned that the amount of water
used as imbibition water is 35% cane based. The total water usage is about 2100 liter per ton of
sugarcane. The waste waters COD (chemical oxygen demand) value is 250 mg/L.In Figure 24,
source [43], all streams containing water that enter en leave a sugar plant are displayed. In Table 7
the flows that are dumped are displayed. It can be seen that the imbibition water used in the mills
are a significant part.
Figure 24: Streams containing water entering and leaving a sugar mill, from [43]
Table 7: Results from water balances for sinks, from [43]
C.3 Ash content During the milling process of the sugar cane, ashes are washed out. Untreated sugar cane contains
6.7 mf wt% ash of which 23% potassium(1.54% in total) [17]. Bagasse [15] contains 3.61 mf wt%
ash of which 2.59% potassium (potassium content of total biomass is 0.07 mf wt%). [15] give a
value for potassium content of 0.014%. Most of the potassium end up in an viscous byproduct
called molasses that remains when the sugar is extracted from the sugar juice. On average, molasses
contains 8.5 % ash and 3.9 % potassium (79.5 Brix) [44]