Embed Size (px)
Citation preview
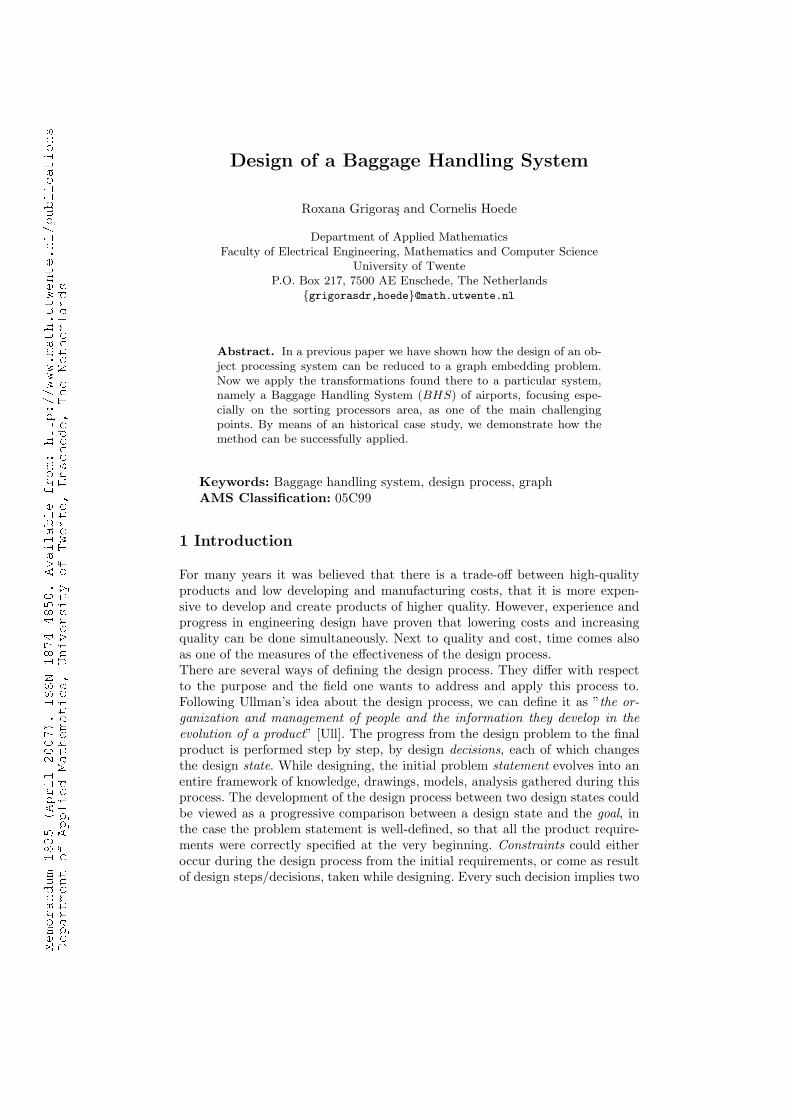
Design of a Baggage Handling System
Roxana Grigoras and Cornelis Hoede
Department of Applied MathematicsFaculty of Electrical Engineering, Mathematics and Computer Science
University of TwenteP.O. Box 217, 7500 AE Enschede, The Netherlands
{grigorasdr,hoede}@math.utwente.nl
Abstract. In a previous paper we have shown how the design of an ob-ject processing system can be reduced to a graph embedding problem.Now we apply the transformations found there to a particular system,namely a Baggage Handling System (BHS) of airports, focusing espe-cially on the sorting processors area, as one of the main challengingpoints. By means of an historical case study, we demonstrate how themethod can be successfully applied.
Keywords: Baggage handling system, design process, graphAMS Classification: 05C99
1 Introduction
For many years it was believed that there is a trade-off between high-qualityproducts and low developing and manufacturing costs, that it is more expen-sive to develop and create products of higher quality. However, experience andprogress in engineering design have proven that lowering costs and increasingquality can be done simultaneously. Next to quality and cost, time comes alsoas one of the measures of the effectiveness of the design process.There are several ways of defining the design process. They differ with respectto the purpose and the field one wants to address and apply this process to.Following Ullman’s idea about the design process, we can define it as ”the or-
ganization and management of people and the information they develop in the
evolution of a product” [Ull]. The progress from the design problem to the finalproduct is performed step by step, by design decisions, each of which changesthe design state. While designing, the initial problem statement evolves into anentire framework of knowledge, drawings, models, analysis gathered during thisprocess. The development of the design process between two design states couldbe viewed as a progressive comparison between a design state and the goal, inthe case the problem statement is well-defined, so that all the product require-ments were correctly specified at the very beginning. Constraints could eitheroccur during the design process from the initial requirements, or come as resultof design steps/decisions, taken while designing. Every such decision implies two
2 Roxana Grigoras and Cornelis Hoede
information units, namely constraints and alternative solutions and an actionnamed evaluation, that is confronting constraints with alternatives.Tools for design are advices, ’rules of thumbs’, diagrams, algorithms and soon. Another, more modern, way of presenting them is to integrate these toolsin programs for designers, so that elementary procedures of design can be au-tomatised1. The rules of thumb do not have to be exactly formulated, they existmostly in tacit form. A possible reason for this is that these rules could be rathercomplicated, they can have many exceptions, which makes them difficult to bewritten down.
In a previous paper [GH], we considered object processing systems and a Smart
Synthesis Tool (SST ) for designing such systems. In this paper we test our theo-retical study on the example of a baggage handling system (BHS) of an airport,in which the processed objects are bags.
In Section 2 we describe how a BHS is currently designed in industry, the twofirst stages of which are the design of a Process Flow Diagram (PFD) and a Ma-
terial Flow Diagram (MFD). PFD’s will be discussed in Section 3, extendingwhat was considered in [GH]. In Section 4 the application of graph transforma-tions on a PFD, in order to turn it into an MFD, will be investigated for anexample. Further aspects of the SST will be discussed in Section 5.
2 Process of designing the Baggage Handling System of an
airport
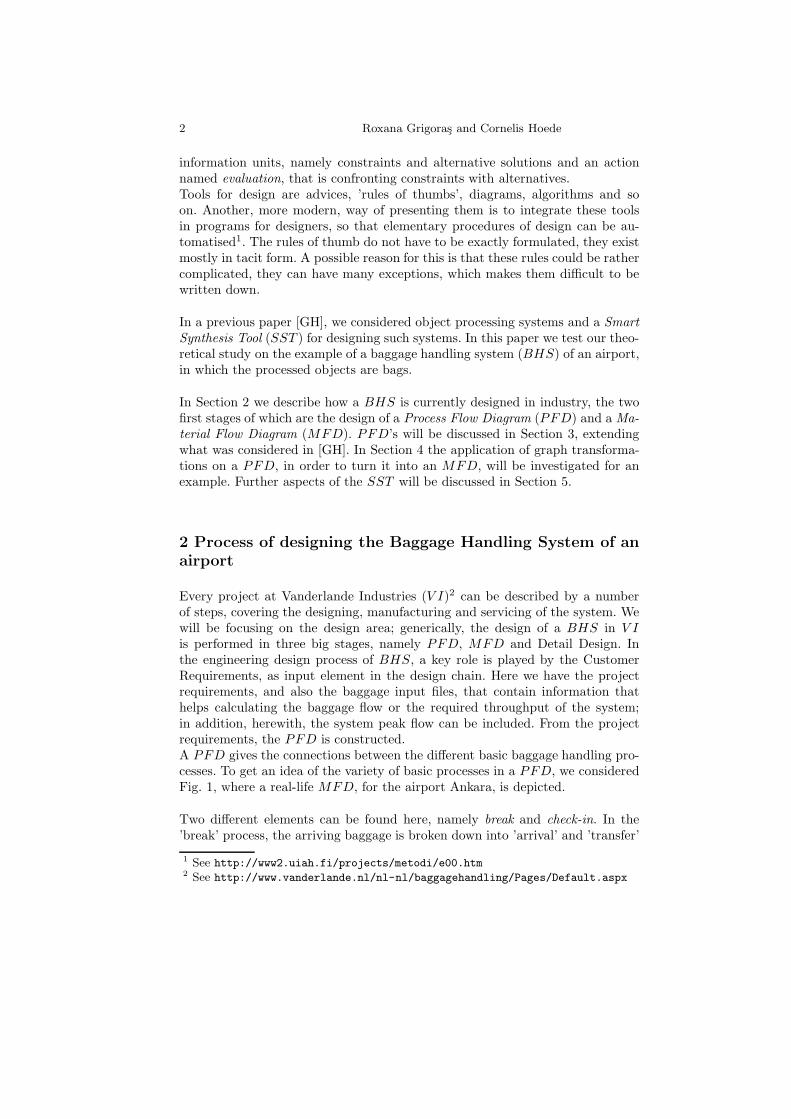
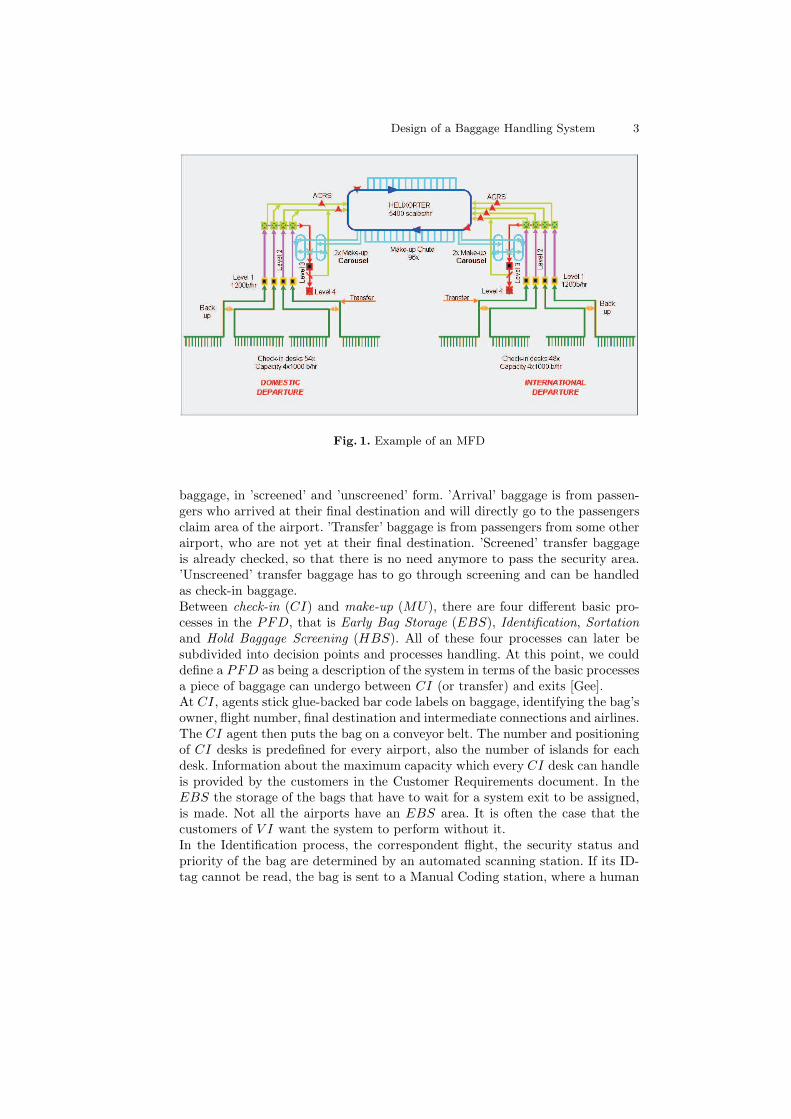
Every project at Vanderlande Industries (V I)2 can be described by a numberof steps, covering the designing, manufacturing and servicing of the system. Wewill be focusing on the design area; generically, the design of a BHS in V Iis performed in three big stages, namely PFD, MFD and Detail Design. Inthe engineering design process of BHS, a key role is played by the CustomerRequirements, as input element in the design chain. Here we have the projectrequirements, and also the baggage input files, that contain information thathelps calculating the baggage flow or the required throughput of the system;in addition, herewith, the system peak flow can be included. From the projectrequirements, the PFD is constructed.A PFD gives the connections between the different basic baggage handling pro-cesses. To get an idea of the variety of basic processes in a PFD, we consideredFig. 1, where a real-life MFD, for the airport Ankara, is depicted.
Two different elements can be found here, namely break and check-in. In the’break’ process, the arriving baggage is broken down into ’arrival’ and ’transfer’
1 See http://www2.uiah.fi/projects/metodi/e00.htm2 See http://www.vanderlande.nl/nl-nl/baggagehandling/Pages/Default.aspx
Design of a Baggage Handling System 3
Fig. 1. Example of an MFD
baggage, in ’screened’ and ’unscreened’ form. ’Arrival’ baggage is from passen-gers who arrived at their final destination and will directly go to the passengersclaim area of the airport. ’Transfer’ baggage is from passengers from some otherairport, who are not yet at their final destination. ’Screened’ transfer baggageis already checked, so that there is no need anymore to pass the security area.’Unscreened’ transfer baggage has to go through screening and can be handledas check-in baggage.Between check-in (CI) and make-up (MU), there are four different basic pro-cesses in the PFD, that is Early Bag Storage (EBS), Identification, Sortation
and Hold Baggage Screening (HBS). All of these four processes can later besubdivided into decision points and processes handling. At this point, we coulddefine a PFD as being a description of the system in terms of the basic processesa piece of baggage can undergo between CI (or transfer) and exits [Gee].At CI, agents stick glue-backed bar code labels on baggage, identifying the bag’sowner, flight number, final destination and intermediate connections and airlines.The CI agent then puts the bag on a conveyor belt. The number and positioningof CI desks is predefined for every airport, also the number of islands for eachdesk. Information about the maximum capacity which every CI desk can handleis provided by the customers in the Customer Requirements document. In theEBS the storage of the bags that have to wait for a system exit to be assigned,is made. Not all the airports have an EBS area. It is often the case that thecustomers of V I want the system to perform without it.In the Identification process, the correspondent flight, the security status andpriority of the bag are determined by an automated scanning station. If its ID-tag cannot be read, the bag is sent to a Manual Coding station, where a human

4 Roxana Grigoras and Cornelis Hoede
operator scans the bag. The Sortation process directs the bags to the correctsystem outputs; if the bag cannot be sorted, it is sent back to the Identificationarea or, if necessary, to the Screening area.HBS is a very important process where the bags are screened for security rea-sons. See Fig. 2 for a good illustration of the complexity the basic process HBScan have. In general, five screening levels can be identified. With each level ofscreening the level of detail with which the bag is examined, increases. In levelone screening (SC1), the bag is sent through an X-Ray machine and the pictureis automatically scanned. If the bag is not cleared, it is sent to the level twoscreening (SC2). At this level, the X-Ray picture previously taken is analysedby a trained human operator. It may be that the bag is directed to another X-Ray machine, where it is again examined. If the bag is not cleared at this stage,it is sent to the level three screening (SC3), where a more detailed picture istaken with a CT-scanner. In case the bag is rejected, an operator will examinethe picture in the level four screening (SC4). If the bag is still suspect, it issent to the last level of screening (SC5), where the bag is removed from thesystem and manually investigated in the presence of its owner. For simplicityreasons, we will refer to the level of screening as SC1/2, SC3/4, considering theexamination done by the operators in SC2 and SC4 as being contained in SC1,respectively SC3.
Fig. 2. Security Screening System
Figure 3 gives an example, for the airport Prague, of the way the various basicprocesses were designed to be interrelated in a PFD.

Design of a Baggage Handling System 5
Unscreened
Transfer BaggageCheck In
HBS 1/2
HBS 3/4Yes
HBS 5
Suspect
Bag?
Yes
Bag Removed
Suspect
Bag?
Suspect
Bag?
Determine ID
No
No
Yes
No
Manual CodingID
Read?No
StorageYes Store
Bag?
Bag
sorted?
Make UP
No
No*Yes
Sortation
* The unsorted bags are manually
transported to the correct system
exit.
Fig. 3. PFD Prague
6 Roxana Grigoras and Cornelis Hoede
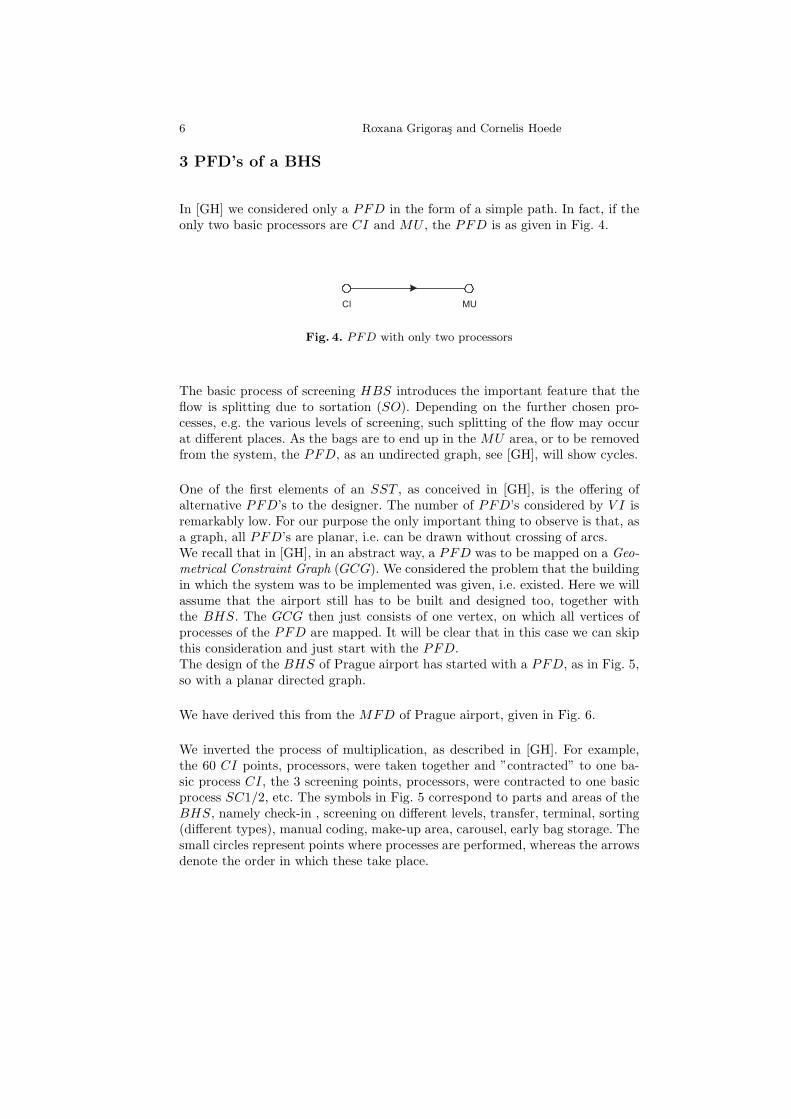
3 PFD’s of a BHS
In [GH] we considered only a PFD in the form of a simple path. In fact, if theonly two basic processors are CI and MU , the PFD is as given in Fig. 4.
CI MU
Fig. 4. PFD with only two processors
The basic process of screening HBS introduces the important feature that theflow is splitting due to sortation (SO). Depending on the further chosen pro-cesses, e.g. the various levels of screening, such splitting of the flow may occurat different places. As the bags are to end up in the MU area, or to be removedfrom the system, the PFD, as an undirected graph, see [GH], will show cycles.
One of the first elements of an SST , as conceived in [GH], is the offering ofalternative PFD’s to the designer. The number of PFD’s considered by V I isremarkably low. For our purpose the only important thing to observe is that, asa graph, all PFD’s are planar, i.e. can be drawn without crossing of arcs.We recall that in [GH], in an abstract way, a PFD was to be mapped on a Geo-
metrical Constraint Graph (GCG). We considered the problem that the buildingin which the system was to be implemented was given, i.e. existed. Here we willassume that the airport still has to be built and designed too, together withthe BHS. The GCG then just consists of one vertex, on which all vertices ofprocesses of the PFD are mapped. It will be clear that in this case we can skipthis consideration and just start with the PFD.The design of the BHS of Prague airport has started with a PFD, as in Fig. 5,so with a planar directed graph.
We have derived this from the MFD of Prague airport, given in Fig. 6.
We inverted the process of multiplication, as described in [GH]. For example,the 60 CI points, processors, were taken together and ”contracted” to one ba-sic process CI, the 3 screening points, processors, were contracted to one basicprocess SC1/2, etc. The symbols in Fig. 5 correspond to parts and areas of theBHS, namely check-in , screening on different levels, transfer, terminal, sorting(different types), manual coding, make-up area, carousel, early bag storage. Thesmall circles represent points where processes are performed, whereas the arrowsdenote the order in which these take place.

Design of a Baggage Handling System 7
SO2
MC
MU
SO4
TE1
PL
EBS
CA
SO3
SC5
SC3/4
SO1
OUT
SC1/2
CI
TR
TE1
Fig. 5. PFD of Prague airport as planar graph

8 Roxana Grigoras and Cornelis Hoede
Fig. 6. MFD of Prague airport
4 Graph transformations applied on a PFD
Our aim in this section is to show how Fig. 5, a PFD, can be transformed intoFig. 6, an MFD, with the help of the SST described in [GH] and that is givenin Table 1.
The first step in using the SST has already been described. The PFD is mappedon the one vertex of the GCG. That vertex is then multiplied with 10, becausethe ten processors have to be located at ten different places. Then the PFD ofFig. 5 is considered again.The second step is to multiply the processors. The CI vertex is multiplied by60, the SC1/2 processor by 3, the SC3/4 processor by 2, the sorting SO1 isconsidered a processor and multiplied by 3, SO3 is not multiplied, neither isSC5, SO2 is multiplied by 3, the carousel CA is multiplied by 2, manual codingMC is multiplied by 2 as is SO4.These factors are determined on the basis of capacity considerations, but the vul-nerability aspect is envisaged as well, for which operations research techniquescan be used. In Table 1 this is the third procedure.The third step is the most important one for this paper. For each of the arcs wewill now investigate how the transportation could be designed to give the MFDof Fig. 6.

Design of a Baggage Handling System 9
TASK/PROBLEM SUPPORT
Choosing the PFD The SST offers a survey of possible PFD’s fromwhich the designer may choose.
Mapping the PFD on the GCG The SST calculates all possible mappings of thechosen PFD on the GCG.
Multiplication of the processors The SST uses a survey of the available pro–cessors, calculates the desired number of pro–cessors and checks whether the chosen multipli-cation is realisable at the location given by themapping of the PFD on the GCG.
Placing the processors The SST offers the designer help in placing theprocessor at the intended location.
Multiplication of the transporters The SST can be given a survey of the availabletransportation systems, then calculates the de-sired number of transporters and checks whetherthe chosen multiplication of transporters is achiev-able.
Generation of layouts The SST offers a survey of possible layouts of thetransportation system, indicating whether the lay-outs can be realised in a planar way or necessarilyinvolve crossings.
Compactification The SST offers alternatives for layouts that re-quire less space, due to multi-level design, so thatcrossings in the designed transportation systemcan be admitted.
Table 1. Summary of potential support of an SST
We will be focusing in the following on the ’multiplication of the transporters’and the ’generation of layouts’ (see Table 1), with emphasis on the fifth pro-cedure. In the next section we will be also considering the ’compactification’

10 Roxana Grigoras and Cornelis Hoede
aspect.We recall now briefly the graph transformations T1, T2 and T3, presented in[GH], which will constitute the basis for the following analysis.The first type of transformation, T1, describes multiplication of one transporta-tion machine. The transportation is distributed over a certain number of parallelmachines. In Fig. 7 this is illustrated, as well as the transition to the total graphform.
Transformation T
n2=1
n1=1
1
Fig. 7. Transformation T1. Multiplication of one transportation machine.
The second type of transformation, T2, describes the multiplication of splittingpoints and fusion points, indicated by small black circles.In a general way the two processor groups are partitioned into subgroups, so n1
processors are partitioned into subgroups of n1,1, n1,2, . . . , n1,k processors and n2
processors are partitioned into subgroups of n2,1, n2,2, . . . , n2,l processors. Thebasic transportation design is transformed into a design with k splitting pointsand l fusion points. These are now first to be connected to the processors andthen to each other, see Fig. 8.
n1,1 n1,2 n1,k
n2,1 n2,2 n2,l
Fig. 8. Transformation T2. Multiplication of splitting and fusion points.
Design of a Baggage Handling System 11
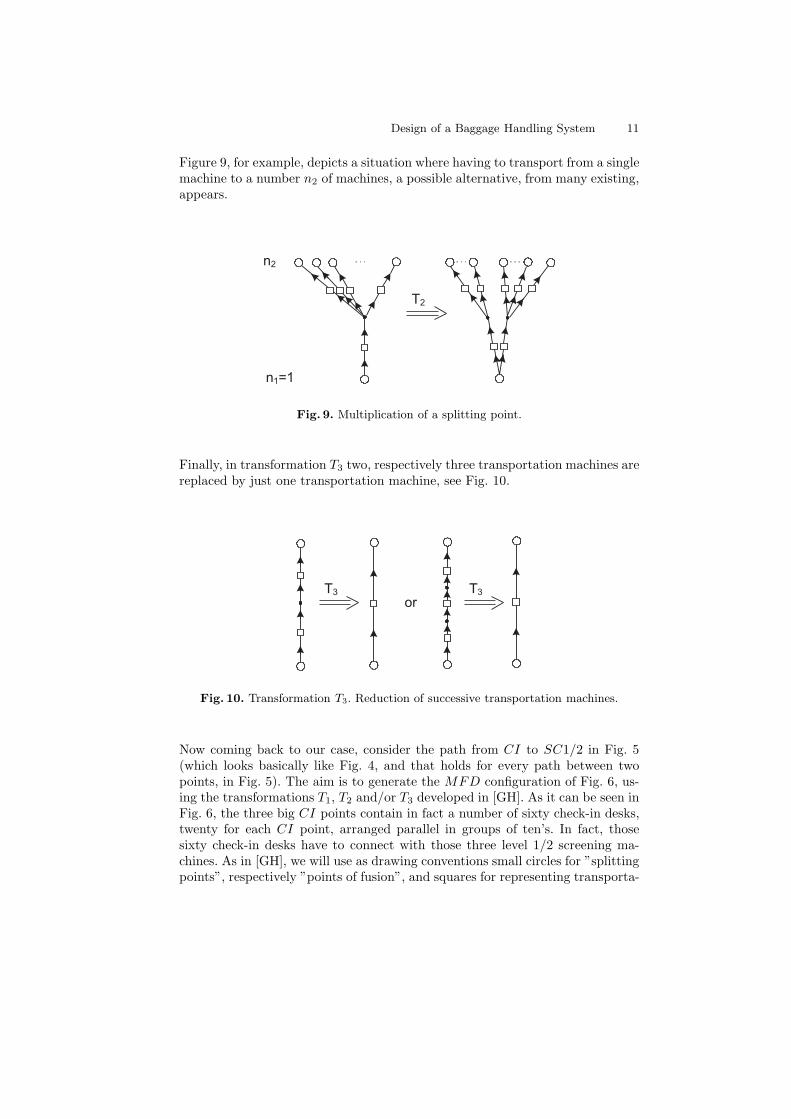
Figure 9, for example, depicts a situation where having to transport from a singlemachine to a number n2 of machines, a possible alternative, from many existing,appears.
T2
n1=1
n2
Fig. 9. Multiplication of a splitting point.
Finally, in transformation T3 two, respectively three transportation machines arereplaced by just one transportation machine, see Fig. 10.
T3 T3
or
Fig. 10. Transformation T3. Reduction of successive transportation machines.
Now coming back to our case, consider the path from CI to SC1/2 in Fig. 5(which looks basically like Fig. 4, and that holds for every path between twopoints, in Fig. 5). The aim is to generate the MFD configuration of Fig. 6, us-ing the transformations T1, T2 and/or T3 developed in [GH]. As it can be seen inFig. 6, the three big CI points contain in fact a number of sixty check-in desks,twenty for each CI point, arranged parallel in groups of ten’s. In fact, thosesixty check-in desks have to connect with those three level 1/2 screening ma-chines. As in [GH], we will use as drawing conventions small circles for ”splittingpoints”, respectively ”points of fusion”, and squares for representing transporta-
12 Roxana Grigoras and Cornelis Hoede
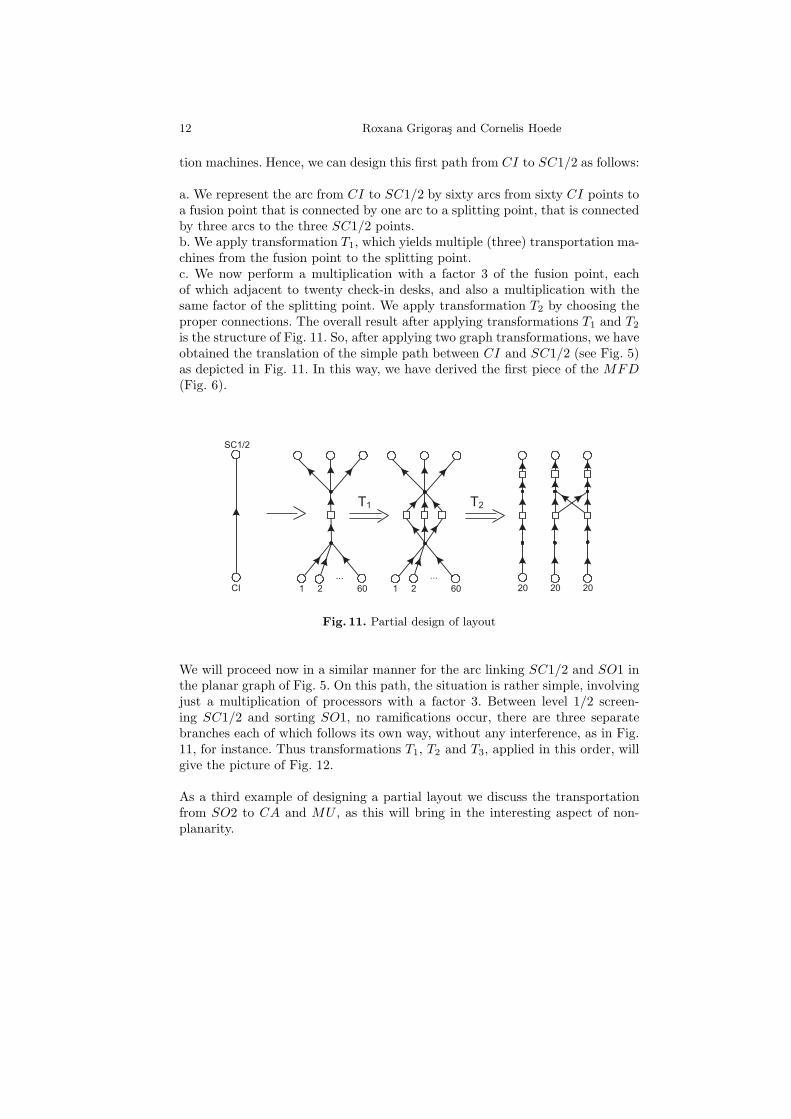
tion machines. Hence, we can design this first path from CI to SC1/2 as follows:
a. We represent the arc from CI to SC1/2 by sixty arcs from sixty CI points toa fusion point that is connected by one arc to a splitting point, that is connectedby three arcs to the three SC1/2 points.b. We apply transformation T1, which yields multiple (three) transportation ma-chines from the fusion point to the splitting point.c. We now perform a multiplication with a factor 3 of the fusion point, eachof which adjacent to twenty check-in desks, and also a multiplication with thesame factor of the splitting point. We apply transformation T2 by choosing theproper connections. The overall result after applying transformations T1 and T2
is the structure of Fig. 11. So, after applying two graph transformations, we haveobtained the translation of the simple path between CI and SC1/2 (see Fig. 5)as depicted in Fig. 11. In this way, we have derived the first piece of the MFD(Fig. 6).
T1 T2
CI
SC1/2
...
1 2 60 1 2 60 20 2020
...
Fig. 11. Partial design of layout
We will proceed now in a similar manner for the arc linking SC1/2 and SO1 inthe planar graph of Fig. 5. On this path, the situation is rather simple, involvingjust a multiplication of processors with a factor 3. Between level 1/2 screen-ing SC1/2 and sorting SO1, no ramifications occur, there are three separatebranches each of which follows its own way, without any interference, as in Fig.11, for instance. Thus transformations T1, T2 and T3, applied in this order, willgive the picture of Fig. 12.
As a third example of designing a partial layout we discuss the transportationfrom SO2 to CA and MU , as this will bring in the interesting aspect of non-planarity.

Design of a Baggage Handling System 13
T1 T2 T3
SC1/2
SO1
Fig. 12. Partial design of layout
We recall Kuratowski’s Theorem on planar graphs: A graph G is planar if and
only if G does not contain a subgraph homeomorphic to K3,3 or K5, and the factthat a graph H is called homeomorphic to a graph G if both graphs can be ob-
tained from the same graph by replacing edges by paths, i.e. subdividing the edges.
CA consists of two ’ending’ points, whereas MU consists of one such point. AsSO2 consists of three processors that have to be connected to the three proces-sors: CA (two) and MU , in case all SO2 are to be connected to all CA and MU ,the K3,3 structure is present and we necessarily have crossings. In the actual de-sign of the MFD, see Fig. 6, only six transportation processors are present.Therefore first we will be applying the graph transformation T1, which will leadto a number of six transportation processors. In a next phase, one of these sixbranches will become a separate arc to one of the CA, two other branches willmerge into one arc to the other CA, and the other three will go to MU . Thedesign of the two branches to the CA’s, respectively MU will be a bit differ-ent: here vulnerability considerations play a role. In Fig. 13 we have applied thetransformation T2 in the following way. Both, the fusion point and the splittingpoint were multiplied by 2. Now the fusion point towards MU is multiplied by3 as is the splitting point to MU . This is also an operation T2. The followingoperation T2 involves a multiplication of the fusion point, respectively the split-ting towards the CA’s by a factor 2, and choosing the proper connections, oneSO2 to one fusion point and the other two, to a second fusion point, see Fig. 13.The next step illustrates that the designer may decide to reduce the number oftransporters. This can be done by the inverse operation T−1
1. Finally we apply
transformation T3 to all of the paths, one of which is from a fusion point to a CA.
From the previous three arcs of the PFD as planar graph of Fig. 5, we havedemonstrated how, in a rather unsophisticated manner, the correspondent piecesin the MFD of Fig. 6 could be derived. Since the three cases were representativefor the whole picture, that is Fig. 5, we can say that the transformations T1, T2
and T3 suffice and are quite satisfactory, in the sense that the generation of an

14 Roxana Grigoras and Cornelis Hoede
MFD does not pose any special problems. The point is that any arc of Fig.5 could be taken and those three graph transformations could be applied. Theorder in which these have to be applied may differ for every arc. When doingso, the entire MFD can be generated. The only challenge which remains nowis a clever way to implement this method in the SST tool, but this is not ourpresent concern.
T1 T2
SO2
CA MU CA MUCA CA MUCA CA MUCA
CA MUCA
T2
CA MUCA
T2
CA MUCA
T3
SO2 SO2 SO2 SO2 SO2 SO2 SO2 SO2 SO2
SO2 SO2 SO2 SO2 SO2 SO2 SO2 SO2 SO2
CA MUCA
T1
SO2 SO2 SO2
-1
Fig. 13. Partial design of layout
5 On compactification
We have seen that the first step in the design led to a PFD that was planar,see Fig. 5. Due to multiplication of processors and transportation processors,conveyor belts, the designer faces the problem of choosing the connections whenapplying operation T2 in which fusion points and splitting points are multipliedas well. As is clear in the second example of Section 4, a simple planar con-figuration can be chosen for connecting the three SC1/2 processors with thethree SO1 processors. However, the third example showed that the designer canchoose a non-planar configuration for connecting the three SO2 processors tothe two CA and one MU processors, in the case of the Prague MFD.The point we want to make is that when the building is to be designed togetherwith the BHS one can allow any non-planar layout. If transportation has to takeplace on one level and crossings of flows have to be avoided, a planar design of
Design of a Baggage Handling System 15
the layout is obligatory. If, however, the building is to be adjusted to the layout,crossings of flows can be allowed in the design, as they are handled by lettingflows take place on different levels of the building.
Now this seems to be a costly affair as, instead of one big hall, several storiesare to be built. However, there are reasons to consider designs that exhibit non-planarity. Suppose the area needed for a planar design is considerably larger thanfor a non-planar design. This not only means that more ground is needed, thatmight not be available, but also that the length of the transportation proces-sors would have to be considerably longer. This again would possibly cost more,but, probably more important, may affect the capacity of the transportationprocessors. So, it might be necessary to accept non-planarity. But then anotherproblem comes in, namely that of compactification. It might be a demand tochoose an MFD that allows a very compact realisation. The actual realisationof the BHS in Prague is quite compact and knows various levels.
We call compactification of a design, a transformation of the design, such thatthe actual realisation takes as few space as possible. This will involve minimizingdistances between processors. This problem is related to the well-known problemof sphere packing, where identical spheres are required to be packed in such away that the ”density” of the packing is maximized.
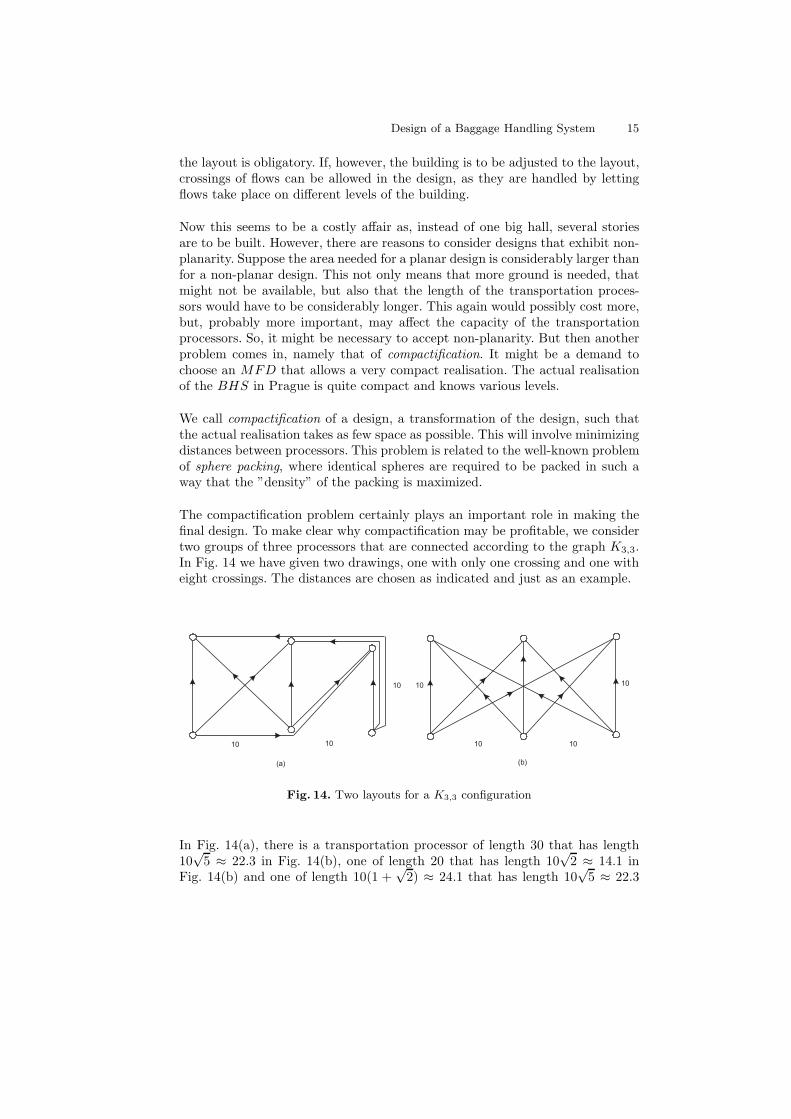
The compactification problem certainly plays an important role in making thefinal design. To make clear why compactification may be profitable, we considertwo groups of three processors that are connected according to the graph K3,3.In Fig. 14 we have given two drawings, one with only one crossing and one witheight crossings. The distances are chosen as indicated and just as an example.
10 10
10
10 10
1010
(a) (b)
Fig. 14. Two layouts for a K3,3 configuration
In Fig. 14(a), there is a transportation processor of length 30 that has length10
√5 ≈ 22.3 in Fig. 14(b), one of length 20 that has length 10
√2 ≈ 14.1 in
Fig. 14(b) and one of length 10(1 +√
2) ≈ 24.1 that has length 10√
5 ≈ 22.3
16 Roxana Grigoras and Cornelis Hoede
in Fig. 14(b). The other six transportation processors have the same length in(a) and (b). So (b) may be considered to be ’better’ in this respect. Moreover,the connections between the elements of the layout in (b) with other processorsneed not cause crossings with transportation processors from or to those otherprocessors, whereas for the layout of (a) they will, in most cases.
In Fig. 14(b) we see that allowing crossings indeed gives the possibility to com-pactify the design and the corresponding physical realisation. In Fig. 14(a) fewercrossings concerning the transportation processors between the two groups ofconsecutive handling processors occur. However, if a group of handling proces-sors is designed to be part of a transportation process with a third group ofhandling processors, either before or after in the ordering of the PFD, theremay be crossings of transportation processors belonging to two different pairs ofconsecutive handling processors.
The SST may be involved in the following way. First, all transportation proces-sors between two consecutive handling processor groups are designed as in Fig.14(b). Thus only, though many, crossings of transportation processors occur be-tween consecutive pairs of groups of handling processors in the designed MFD.The graph of the MFD can now be considered as a candidate for a compactdesign. In case the designer does not want that many crossings in the overalldesign, the natural problem arises to draw the graph with as few crossings aspossible. It is here that the SST can support by calculating the solution. This isnot an easy task as the problem is NP −hard in the sense of complexity theory,see [Dic].
6 Discussion
We have shown that the three transformations introduced in [GH] indeed allowthe design of the MFD of Prague airport. Implementation of these steps in theSST seems straightforward.We also pointed out that non-planarity of designed layouts stems from the mul-tiplication process, that takes place in view of capacity and vulnerability con-siderations.Finally, we discussed shortly the notion of compactification once non-planarityis accepted, as buildings can have several levels. From a graph-theoretical viewthe compactification aspect seems to pose the most interesting challenge, as theproblem of drawing a non-planar graph with minimum number of crossings isan NP − hard problem.
In the bibliography only a few items are references. The other items are givenas general background.

Design of a Baggage Handling System 17
Bibliography
[BR] Braha, D., and Reich, Y., Topological structures for modeling engineering design
processes, Research in Engineering Design, Vol. 14, (2003), pp. 185–199.[Car] Carson, J., Panel on transportation and logistics modeling, Proceedings of the
1997 Winter Simulation Conference.[Dic] Dickerson, M., Visual Drawings: Visualizing Non-planar Diagrams in a Planar
Way, Journal of Graph Algorithms and Applications, Vol. 9, No. 1, (2005), pp.31–52.
[Die] Diestel, R., (2005). Graph Theory. Berlin: Springer.[Gee] Geerdes, W., Smart design of baggage handling systems?, Master Thesis, (2007),
University of Twente, The Netherlands.[GH] Grigoras, D.R., and Hoede, C., (2007) Design of Object Processing Systems,
Memorandum 1830, Department of Applied Mathematics, University of Twente,Enschede, ISSN 1874-4850.
[JC] Jim, H.K., and Chang, Z.Y., An airport passenger terminal simulator: A planning
and design tool, Simulation Practice and Theory, Vol. 6, (1998), pp. 387–396.[LL] Leone, K., and Liu, R., The key design parameters of checked baggage security
screening systems in airports, Journal of Air Transport Management, Vol. 11,(2005), pp. 69–78.
[PH] Pagani, J., and El Halim, A., and Hassan., Y., and Easa, S. User-perceived level-
of-service evaluation model for airport baggage-handling systems, TransportationResearch Record 1788, (2002), pp. 33–42.
[PR] Pons, D.J., and Raine, J.K., Design mechanisms and constraints, Research inEngineering Design, Vol. 16, (2005), pp. 73–85.
[Sal] Salustri, F.A., Towards an action logic for design processes, International Con-ference on Engineering Design Iced 03 Stockholm, August 19-21, (2003).
[Suh] Suh, N.P., Axiomatic Design Theory for Systems, Research in Engineering De-sign, Vol. 10, (1998), pp. 189–209.
[Ull] Ullman, D.G., (1997). The mechanical design process. New York: McGraw Hill.[Van] System Book, Part 2 Baggage handling, 2001, Vanderlande Industries, Veghel,
the Netherlands.