Embed Size (px)
Citation preview

Design Methods for
Offshore Wind Turbines
at Exposed Sites
Final Report of the OWTES Project EU Joule III Project JOR3-CT98-0284

Garrad Hassan and Partners Ltd. St. Vincent’s Works Silverthorne Lane Bristol BS2 0QD, UK Report No. 2317/BR/22D 2004 Garrad Hassan and Partners Ltd. All rights reserved. Any use or application of data, methods or results presented in this report will be at the user’s own risk. Cover photograph 2004 AMEC Wind Energy

DESIGN METHODS FOR OFFSHORE WIND TURBINES AT EXPOSED SITES
T. R. Camp, M. J. Morris (Garrad Hassan and Partners Ltd.) R. van Rooij, J. van der Tempel, M. Zaaijer, A Henderson (Delft University of Technology)
K. Argyriadis & S. Schwartz (Germanischer Lloyd WindEnergie GmbH) H. Just (Vestas Wind Systems A/S) W. Grainger (AMEC Wind Energy)
D. Pearce (Powergen Renewables Ltd.)
EU Joule III Project JOR3-CT95-0284
FINAL REPORT November 2003
Research funded in part by THE EUROPEAN COMMISSION
in the framework of the Non Nuclear Energy Programme

JOR3-CT-98-0284 OWTES
OWTES PARTNERSHIP AND CONTACT DETAILS Garrad Hassan and Partners Ltd. (Project Coordinator) Dr T. R. Camp St. Vincent’s Works, Silverthorne Lane, Bristol, BS2 0QD, UK Tel.: +44 (0)117 972 9900 Fax: +44 (0)117 972 9901 Email: [email protected] Web: www.garradhassan.com Delft University of Technology Ir. Ruud P.J.O.M. van Rooij Faculty of Civil Engineering and Geosciences, Section Wind Energy, Stevinweg 1, 2628 CN Delft, The Netherlands Tel.: +31 (0)15 27 81093 Fax: +31 (0)15 27 85347 Email: [email protected] Web: www.windenergy.citg.tudelft.nl Germanischer Lloyd WindEnergie GmbH Dipl.-Ing. Kimon Argyriadis Steinhöft 9, 20459 Hamburg, Germany Tel.: +49 (0)40 31106 707 Fax: +49 (0)40 31106 1720 Email: [email protected] Web: www.gl-wind.com Vestas Wind Systems A/S Per Hessellund Lauritsen Smed Hansens Vej 27, DK-6940 Lem, Denmark Tel.: +45 (0)96 75 26 26 Fax: +45 (0)96 75 26 08 Email: [email protected] Web: www.vestas.com AMEC Wind Energy Dr W. Grainger Bridge End, Hexham, Northumberland, NE46 4NU, UK Tel.: +44 (0)1434 611300 Fax: +44 (0)1434 601200 Email: [email protected] Web: www.amec.com/wind Powergen Renewables Ltd. David Pearce Power Technology, Ratcliffe on Soar, Nottingham, NG11 0EE, UK Tel.: +44 (0)115 936 2362 Fax: +44 (0)115 936 2363 Email: [email protected] Web: www.powertech.co.uk

FINAL REPORT
i
CONTENTS
ACKNOWLEDGEMENTS 1 EXECUTIVE SUMMARY 2 OBJECTIVES 3 MEASUREMENTS AT BLYTH OFFSHORE WIND FARM 4 ANALYSIS OF ENVIRONMENTAL CONDITIONS 5 VERIFICATION OF DESIGN TOOLS 6 PARAMETRIC DESIGN STUDY 7 REVIEW OF CERTIFICATION RULES 8 RECOMMENDATIONS FOR DESIGN 9 CONCLUDING REMARKS 10 DELIVERABLE REPORTS REFERENCES

JOR3-CT98-0284 OWTES
ii
ACKNOWLEDGEMENTS The partners of the OWTES project wish to acknowledge the financial support of the European Commission (Joule project JOR3-CT98-0284), the UK Department of Trade and Industry and Novem, The Netherlands Agency for Energy and the Environment. We would also like to thank Blyth Offshore Wind Ltd. for their permission to use one of the turbines of the Blyth offshore wind farm for the load measurements described in this report.
FINAL REPORT
1
1 EXECUTIVE SUMMARY 1.1 Background In order to ensure that the operation of wind farms installed at hostile offshore sites will be reliable and cost effective, it is clearly essential that the wind turbines and support structures are designed and optimised taking proper account of the external conditions at the site. Over the last twenty years enormous progress has been made with the development and validation of software tools which offer sophisticated and reliable representations of onshore wind turbines and are in use by the industry for design and certification calculations. In parallel there have been major advances in the methods used by the offshore engineering community for the design analysis of conventional offshore structures. Although there are obvious similarities between offshore oil and gas production platforms and offshore wind turbine structures, there are also several important differences. In the context of design calculations, an offshore wind turbine is much more influenced by wind loading and the design loads are considerably more sensitive to structural dynamic characteristics than is the case for oil and gas platforms. In addition, since offshore wind turbines are likely to be installed in relatively shallow water, there is considerable uncertainty in the calculation of hydrodynamic loading, both for fatigue and also extreme loads which may be driven by breaking waves. To address these uncertainties, the OWTES project (“Design Methods for Offshore Wind Turbines at Exposed Sites”) has undertaken the first set of detailed structural measurements on an offshore turbine at an exposed site and has used this data for validation of design calculation methods and review of certification rules. The measurements were carried out on one of the two Vestas V66 2MW turbines installed in the Blyth offshore wind farm in north-east England. Sea conditions at this site are considerably more hostile than those in the Baltic Sea or the Dutch Ijsselmeer, the locations of the only offshore wind farms to have been built prior to this project. The measurements, taken over a period of sixteen months, have allowed a thorough investigation of the environmental conditions at the site, the dynamic behaviour of the wind turbine and its support structure, and the combined aerodynamic and hydrodynamic loading of the major structural components. Following analysis of the database of measurements and its use for validation and enhancement of state-of-the-art design tools capable of modelling offshore wind turbines, computational design studies have been carried out in order to identify key design requirements for turbines installed at exposed sites. The project has also included a review of the current Germanischer Lloyd certification rules for offshore wind turbines, including recommendations for revisions to these certification rules where appropriate. A final and important part of the project has been to review the design procedures used by the several companies that contributed to the design of the Blyth offshore wind farm, as well as the “lessons learned” during the first two years of operation. The project has been undertaken by a partnership of organisations, each with a major interest in offshore wind energy and each contributing different expertise and different perspectives on the problems involved. The partnership has comprised Delft University of Technology (DUT), Germanischer Lloyd WindEnergie (GL), Vestas Wind Systems (VS), Amec Wind Energy (AW) and Powergen Renewables (PG) under the leadership of Garrad Hassan and Partners (GH). Subcontractors to the project have included H R Wallingford Ltd., John Brown Hydrocarbons Ltd., Paul Vermeulen Consultancy, Stork Product Engineering, Fugro Engineers BV and Alkyon, Hydraulic Consultancy and Research..

JOR3-CT98-0284 OWTES
2
The project was divided into seven tasks. The leadership of each task was assigned to one of the project partners, while contributions to the objectives of each task were made by several of the partners. The objectives of each task are summarised below:
• Task 1: Measurements at Blyth Harbour (led by GH)
- Install a measurement system capable of making detailed measurements of the wind, waves and currents as well as the loading and response of the wind turbine and its support structure.
- Establish a database of measurements over a period of at least 12 months.
• Task 2: Data analysis (led by GH) - Analyse the database of measurements to characterise the environmental
conditions at the site and identify the correlation of wind, waves and currents. - Review the wind turbine and support structure design specification and the GL
certification rules in the context of the measured environmental conditions. - Investigate the relative importance of hydrodynamic and aerodynamic loads to
the fatigue and extreme loading of the machine.
• Task 3: Verification of design tools (led by GH) - Validate and enhance state-of-the-art methods for computer modelling and
design analysis of offshore wind turbines.
• Task 4: Parametric design study (led by DUT) - Investigate the sensitivity of design driving fatigue and extreme loads to a range
of site environmental conditions, structural dynamic characteristics and computational approaches.
• Task 5: Review of certification rules (led by GL) - Review and, where appropriate, recommend revision of the current GL
certification rules for offshore wind turbines.
• Task 6: Recommendations for design (led by VS) - Review the key design requirements of offshore wind turbines for severe sites.
• Task 7: Synthesis and reporting (led by GH) - Draw together all the important findings of the project and prepare a detailed
final report
1.2 Applied methodology, scientific achievements and main deliverables
The overall objective of the OWTES project was to make recommendations for the improved design of offshore wind turbines, particularly those sited at exposed sites where wave loading is a significant design driver. At the core of the project was a sixteen-month period of data collection from one of the two wind turbines installed in the Blyth offshore wind farm. These turbines were the first to be installed in the North Sea and the first to experience significant wind and wave loading. A comprehensive monitoring system was installed on one of these turbines, capable of recording the environmental conditions at the turbine (wind, waves and currents) and the resulting structural loads. The resulting database of measurements was used by the OWTES project partners to assess many aspects of the design process for offshore wind turbines. Analysis of the measured environmental conditions at Blyth was used to determine the different properties of offshore and onshore winds. Winds from the sea were found to be significantly less turbulent than winds from the land, and to have a more uniform velocity

FINAL REPORT
3
profile. Both of these effects contribute toward lower fatigue loading of offshore turbines, as was found when the measured fatigue loads at Blyth were compared with design values. Measurements of the wave characteristics highlighted two areas where the proximity of offshore wind turbines to the shore necessitates modifications to the design methods used by the established offshore engineering industry. The first of these results from the non-linearity of waves in shallow water. The extreme design wave will certainly be highly non-linear and may be a breaking wave, requiring sophisticated wave models and careful application of empirical results. At very shallow sites, even the normal wave climate may require non-linear effects to be accounted for to enable accurate calculation of structural fatigue loads. The second effect of the proximity of the shore-line is the variation of fetch with wind direction. Because wave heights are strongly influenced by the fetch distance as well as the wind speed, simple correlations of wave height as a function of wind speed are not adequate for the design of offshore wind turbines. Instead, site measurements of wave and wind conditions should be made to enable the design of the turbine support structure to be optimised. The database of measurements was also used to verify and enhance state-of-the-art design tools for offshore wind turbines. The measured turbine performance and loads were compared to predictions made by the Bladed, DUWECS, Vestas and Germanischer Lloyd codes. Bladed and DUWECS were the subject of most comparison work and a number of enhancements were made to both codes as a result. By comparing measured and predicted loads, it was possible to choose values of wave loading coefficients which will be used for future design work. It was confirmed that a correct dynamic model of the turbine structure is critical for the accurate prediction of fatigue and extreme loads. Natural frequencies of vibration of the turbine structure were predicted well by all the design codes. In addition, the importance of aerodynamic damping of wave-induced tower vibration in reducing fatigue loads, previously only predicted by theory, was confirmed by measurements. It was found that the bathymetry of the Blyth site made the turbines susceptible to breaking waves. Spilling breaking waves were recorded on a number of occasions during the monitoring period and the wave profiles and resulting structural loads were measured. Good agreement was found between the measured wave loading and loads predicted using high-order stream function theory. A study of foundation models for offshore wind turbines determined the sensitivity of the predicted natural frequency of the turbine support structure to variations in foundation models and soil properties. It was found that the expected uncertainty in the natural frequency of piled foundations is approximately 4% and that this is relatively insensitive to moderate amounts of scour. Gravity base structures, however, showed greater sensitivity to the choice of modelling technique and soil parameter values. Several foundation models were compared, including a finite element model, a linear elastic model and a simple fixity depth model. The finite element and linear elastic models were found to give similarly acceptable results, but the use of the fixity depth model without a priori knowledge of the foundation stiffness was found to be inaccurate and its use is discouraged. As a part of this study, measurements of the natural frequencies of turbine support structures in the Lely and Irene Vorrink wind farms in the Netherlands were made and were compared with predictions. As another important component of the design process, models of hydrodynamic loading were studied for slender structures (such as piles) and compact structures (such as gravity bases). It was found that for slender support structures, such as piles, a stochastic linear wave model, combined with Wheeler stretching, is the best compromise for fatigue load calculations. For extreme wave calculations, a non-linear wave model must always be used.

JOR3-CT98-0284 OWTES
4
For compact structures it is recommended that diffraction analyses be performed, as well as a check using the Froude-Krylov or pressure-integration methods. In another study, the robustness of the whole design process for offshore wind turbines was reviewed. The design process used for the offshore wind turbines as Blyth was analysed and described in a number of flow charts. A comparison was then made with the design process for a conventional oil and gas structure. The main difference between the two design processes was found to result from the greater flexibility of the offshore wind turbine structure. Because wind-induced and wave-induced loading cannot be treated independently, time domain calculations capable of modelling the important non-linearities must be used. A study of methods for calculating structural fatigue loads was also undertaken. Firstly the effects of the accuracy of different sources of wind and wave data (hind cast, satellite and buoy) on predicted fatigue loads was considered. Secondly, the number of time domain simulations required for accurate predictions of fatigue loads was considered. By judicious averaging of sea-state parameters and neglecting any misalignment between wind and wave directions, a surprisingly low number of simulations was found to give acceptable results. An important objective of the OWTES project was to review existing design standards for offshore wind turbines and to make recommendations for improvement, where appropriate. In this context, Germanischer Lloyd WindEnergie made a thorough review of the existing GL regulation. Using the measured environmental data at Blyth it was concluded that a shortfall of the existing regulation is the proposal to use the Pierson-Moskowitz wave energy spectrum only. It was concluded that the use of other standard spectra should be allowed and that the importance of correctly accounting for the water depth and fetch should be specified. It was also concluded that a more detailed description of the methods required to calculate the 50-year return storm load case should be included in the regulation. It was concluded that a certification of the whole wind turbine structure to generic classes, as for onshore turbines, is not possible for offshore wind turbines due to the very site-specific nature of the support structure design. However, because the influence of waves on the loading of the tower top machinery is very small, standard machinery designs may be developed. A review of design requirements for future offshore wind turbines was also carried out. Meetings were held with companies involved in the design of the Blyth wind farm and the more recent Horns Rev wind farm in Danish waters. As a result a large number of practical design issues were highlighted as requiring further method development. These included issues related to approval procedures, project organisation, foundation design, corrosion protection, control and monitoring, quality, personnel safety, navigational safety, mechanical and electrical design. In summary, the results of the OWTES project have led to a greater understanding of the many design requirements for offshore wind turbines. As offshore wind farms are currently being developed in deeper water sites in the North Sea, the results of the project will have useful applications in the coming years.

FINAL REPORT
5
2 OBJECTIVES The overall aim of this project has been to improve the design methods for wind turbines located at exposed offshore sites, in order to facilitate the cost-effective exploitation of the huge offshore wind energy resource available in the EU. This aim has been met through the achievement of a number of important project objectives:
• To install a measurement system at the Blyth Harbour offshore wind farm capable of making detailed measurements of the wind, waves and currents as well as the loading and response of one of the two wind turbines at the site.
• To use the measurement system to monitor the wind conditions, waves, and currents at this exposed site.
• To measure the dynamic loads acting on the rotor, drive train, tower and monopile foundation of the offshore wind turbine for a wide range of wind conditions and sea states.
• To establish a database of environmental and structural load measurements. The database will contain wind, wave and current measurements to characterise fully the environmental conditions at Blyth, and structural measurements to characterise the fatigue and extreme loading of the offshore wind turbine and its support structure.
• To analyse the database of environmental and structural measurements in order to derive a thorough understanding of the aerodynamic and hydrodynamic loads and their influence on the dynamic response of the offshore wind turbine and its support structure.
• To use the database of measurements to enable validation and enhancement of state-of-the-art methods for computer modelling and design analysis of offshore wind turbines.
• To undertake parametric analyses for investigation of the complex relationships between component fatigue and extreme loading, the design characteristics of an offshore wind turbine and its support structure, and the site wind, wave, current and sea bed conditions.
• To investigate the robustness of design calculations for offshore wind turbines with respect to variations in the environmental conditions, wind turbine and support structure design concept and methods of analysis.
• To provide a critical appraisal of present design procedures and certification rules for offshore wind turbines and to recommend changes where appropriate.
• To catalogue the key design requirements of offshore wind turbines for sites where the environmental conditions are severe.

JOR3-CT98-0284 OWTES
6
3 MEASUREMENTS AT BLYTH OFFSHORE WIND FARM The principal objectives of the monitoring programme were to measure the environmental conditions experienced by one of the turbines of the Blyth offshore wind farm and the corresponding structural loads. The measurement system that was installed at Blyth comprised three main elements: (i) measurement of the turbine structural loading, (ii) measurement of the sea-state, and (iii) measurement of wind conditions at an onshore meteorological mast close to the turbine. Of the two Vestas V66 turbines, it was decided to instrument the southern-most turbine. This turbine is positioned at the top of a steeply shelving region of the sea bed which was considered would increase the likelihood of breaking waves at this turbine. Breaking waves were indeed experienced at the site during the monitoring period, as described in Section 5.
3.1 Structural loading measurements The turbine loading was measured using a large array of strain-gauges which were applied to every major structural element of the turbine. On the tower and pile foundation, strain-gauges are used to measure bending moments in two dimensions at eight vertical stations. Blade loads were measured as flapwise and edgewise bending moments at the blade roots. The low-speed shaft of the turbine was also instrumented to measure torque and bending moments in two orthogonal directions. In addition, signals related to the control and operational status of the turbine were recorded, including blade pitch angles, the speed and position of the rotor, nacelle orientation, brake status and generated power. The locations of the strain gauges on the turbine and support structure are shown schematically in Figure 3.1. The strain gauges fitted to the turbine pile, tower and blade roots were calibrated during September 2002. This was a major exercise and was the result of collaboration between a total of 10 personnel from GH, AW and VS. The main procedure for calibrating the tower and pile strain gauges involved placing a large anchor onto the sea bed, attaching a cable between the anchor and the turbine nacelle, and tensioning this cable using a Tirfor winch. A load cell and
Figure 3.1: Structural measurements
Blade flapwise and edge-wise bending moments at the root of each blade.
X&Y bending moments & torsion of low-speed shaft
X&Y bending moments at tower top & base, plus torsion at tower top
X&Y bending moments at: Mean sea level (MSL), two stations between MSL and mudline, two stations between mud-line and pile base. Torsion at MSL and lowest pile station
Figure 3.2: Strain gauge calibration

FINAL REPORT
7
clinometer in the nacelle were used to record the tension in the cable and the angle of application of this load. Figures 3.2 shows a detail of the winch operation. This procedure was found to be only partially successful because the anchor did not achieve a good grip on the sea bed. As an alternative procedure for calibrating the tower and pile strain gauges, the nacelle was rotated over 360 degrees. As the combined centre of mass of the rotor and nacelle overhangs the centre-line of the tower, this manoeuvre applied a rotating bending moment, of known magnitude, to the tower top. The results of this experiment were used as the primary means of calibrating the tower and pile strain-gauges, and the resulting calibrations were checked using the results of the cable-pull procedure. The strain-gauges fitted at the root of each blade were calibrated using the blade self-weight. The azimuth angle of the rotor was adjusted until each blade in turn was horizontal. The pitch system was then operated to rotate the blade about its axis, thereby transferring the bending moment due to the blade weight between the edgewise and flapwise strain-gauges. While doing this, measurements of the blade pitch angle were made to calibrate the pitch angle signal. 3.2 Sea-state measurements The wave and current climate was recorded using instruments mounted both above and below water level. A Saab WaveRadar unit was mounted on the turbine walkway to measure the instantaneous water level at the turbine base, including time-history profiles of passing waves. Simultaneously, instruments mounted on the sea bed approximately 40m from the foundation recorded statistics describing the wave climate and the current profile. These instruments include a wave and tide recorder (Coastal Leasing Microspec) and an acoustic doppler current profiler (Nortek ADCP). The sea-state instrumentation is shown schematically in Figure 3.3.
3.3 Wind measurements Wind conditions were measured using anemometers and wind vanes mounted on an onshore meteorological mast and on the turbine nacelle. Although the meteorological mast for the project would ideally have been located offshore, close to the monitored turbine, the large cost of such an installation was beyond the project budget. The mast was therefore positioned on the coast, approximately 1km from the southern turbine. The mast featured anemometers at heights of 10m, 20m, 30m and 40m above ground level and instruments to measure
Saab WaveRadar
Video camera
Coastal Leasing Microspec & Nortek ADCP
40m
Figure 3.3: Sea-state instrumentation 500m
BLYTH
Northern turbine
Southern turbine
Met. mast
Figure 3.4: Met. mast location

JOR3-CT98-0284 OWTES
8
atmospheric pressure, temperature and precipitation. The position of the meteorological mast relative to the offshore turbines is shown in Figure 3.4. 3.4 Measurement programme The turbine structural loads, the sea-state at the turbine base and the wind characteristics were recorded simultaneously using a Garrad Hassan T-MON measurement system. This well-proven, robust system was found to perform well in the offshore environment. Analogue-to-digital converters distributed around the turbine structure collected and sent data via a fibre-optic link to an onshore control room. Here, the collection and recording of data was controlled by a central computer which had a modem connection to allow remote interrogation. The measurement period began in October 2001 and continued to January 2003. During this period, every sensor on the turbine was sampled at 40Hz and data collected in two formats: ‘summary’ datasets and ‘campaign’ datasets. Summary datasets consisted of the basic statistics of each channel, measured every ten minutes, comprising the minimum, maximum, mean and standard deviation of each signal. Campaign datasets stored time-history data from each measured channel and were recorded in order to establish the dynamic behaviour, fatigue load spectra and extreme loads experienced by the turbine. The recording of campaign datasets was triggered automatically by the central computer when pre-defined trigger conditions were met. Campaign datasets were triggered to store time-history records of turbine operation or idling under both ‘normal’ and ‘extreme’ external conditions. A matrix of normal conditions was defined in terms of variations in mean wind speed, tidal water level, significant wave height, wind direction (offshore or onshore) and turbine state (operating, idling, start-up, shut-down). Extreme conditions that triggered the collection of campaign data included wind speeds above the cut-out wind speed of 25m/s and significant wave heights above 4m. Approximately 1,300 campaign datasets were recorded during the monitoring period, giving a total of nearly 500 hours of measured time-history records. During the same monitoring period, over 12,300 hours of summary data were collected. This data was processed into engineering units by the application of sensor calibration factors and distributed to the OWTES project partners in tab-delimited text files. Further details of the monitoring system installed at the Blyth offshore wind farm are given in [3.1] and [3.2].
FINAL REPORT
9
4 ANALYSIS OF ENVIRONMENTAL CONDITIONS An important component of the OWTES project was the detailed monitoring of the environmental conditions at the southern turbine of the Blyth offshore wind farm. As described in Section 3, wind conditions were measured using a nacelle-mounted anemometer and a package of sensors mounted on an onshore meteorological mast. Sea state conditions were measured using a wave-radar system mounted on the turbine walkway and instrumentation positioned on the sea bed. The recorded wind and sea state data were processed in order to characterise the environmental conditions at the site. In this section, the results of this data processing are presented for the wind conditions (Section 4.1), the wave conditions (Section 4.2) and the current conditions (Section 4.3). 4.1 Wind conditions Wind speeds were measured at two locations on the site: on the turbine nacelle and at a meteorological mast sited onshore, at the north end of Blyth harbour wall. The meteorological mast was positioned approximately 1km south-west of the turbine. This site was chosen as the closest onshore position to the turbine which was free of flow obstructions. Wind speeds measured by the nacelle-mounted anemometer were influenced by the presence of the nacelle and the upwind rotor. A calibration was applied to the anemometer signal, prior to connection to the data acquisition system, to correct the mean measured wind speed to the mean free-stream wind speed. This calibration, supplied and implemented by VS, was checked during the measurement campaign as described in Section 2.1. It was not possible to measure the ambient turbulence of the wind from the nacelle-mounted anemometer, however, due to the unsteadiness introduced by the upstream rotor. For the processing of measured wind data it was convenient to classify the wind into ‘onshore’ and ‘offshore’ directions. Onshore winds (i.e. those blowing toward the shore from the sea) were classified as having wind directions between 0° and 140°, while offshore winds (i.e. those blowing off the shore toward the sea) were classified as having wind directions between 180° and 325°. The sectors 140°-180° and 325°-360° were excluded from some elements of data processing as winds in these sectors were approximately parallel to the coast and had characteristics some way between maritime and land conditions. 4.1.1 Wind speed and direction frequency distributions Figure 4.1 shows the wind rose calculated using data recorded at the 43m met. mast station between 17 September 2002 and 23 May 2003. A similar wind speed and direction frequency distribution was recorded by the nacelle anemometer over the longer time period of August 2001 to January 2003. 4.1.2 Wind shear The empirical power law model relates the wind speed V(h) at height h above the ground to the wind speed V(h0) at a reference height h0 in the following manner:
α
=
00 )()(
hh
hVhV
where α is the wind shear exponent.

JOR3-CT98-0284 OWTES
10
5 % 10% 15%
0-3 3-6 6-9 >9 m/s
Figure 4.1: Wind rose (43m met. mast anemometer)
Wind speeds recorded at four heights on the meteorological mast were used to estimate the value of the wind shear exponent for onshore and offshore wind directions. By fitting the data to the above expression, a mean wind shear exponent value of 0.05 was found for wind directions from the sea and a value of 0.29 was found for wind directions from the land. Of particular note is the low value of wind shear exponent associated with onshore wind directions. As a check on the measured values of wind shear exponent, the mean wind speeds measured by the met. mast were extrapolated from 43m to hub height using the measured wind shear exponents and compared with mean wind speeds measured at the turbine nacelle (corrected to account for the presence of the rotor and nacelle). Table 4.1 shows agreements between these two values of mean wind speed of approximately 2%.
Wind direction Onshore (0° to 140°) Offshore (180° to 325°)
Measured wind shear 0.053 0.294
Turbine mean wind speed 9.57 m/s 6.25 m/s
Extrapolated mast wind speed
9.76 m/s 6.16 m/s
Comparison 2.01% -1.47%
Table 4.1: Comparison of hub-height mean wind speeds 4.1.4 Turbulence intensity Due to the turbine anemometer being located in disturbed flow behind the rotor, analysis of the turbulent and spectral characteristics of the wind was performed using data from the met. mast. Figure 4.2 presents the variation of turbulence intensity with wind speed for offshore wind directions, measured at 43m height above OS datum. Superimposed on the scatter plot of 10-minute measured values are binned mean values of turbulence intensity, and the range of +/-1 standard deviation within each bin. Figure 4.3 compares the measured characteristic values of turbulence intensity (mean plus 1 standard deviation) with standard distributions taken from the IEC [4.1] and Germanischer Lloyd [4.2] regulations. It can be seen that the

FINAL REPORT
11
measured values of turbulence intensity for wind directions from the land are nearly constant between 3m/s and 22m/s. Figures 4.4 and 4.5 presents turbulence intensity measurements in the same format for onshore wind directions. It can be seen that the mean values of measured turbulence intensity are significantly lower than for offshore wind directions, as might be expected from the lower roughness. The measured values of characteristic turbulence intensity compare reasonably well with the Germanischer Lloyd value of 12% except for wind speeds below 5m/s when the measured turbulence is significantly greater.
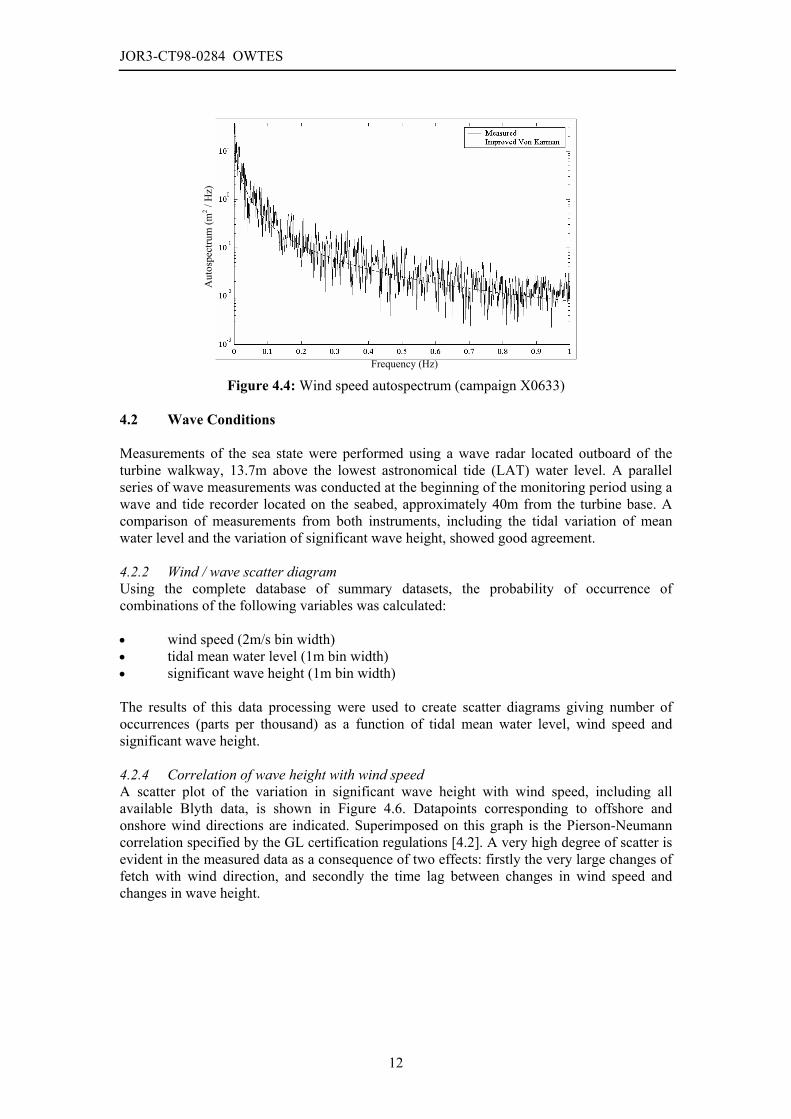
4.1.5 Spectral analysis of the wind Figure 4.4 shows an auto spectrum of measured wind speed for a wind direction from the sea (campaign dataset x0633) for frequencies from 0 to 1 Hz. Superimposed over the measured data is the theoretical “Improved Von Karman” spectrum [4.3]. It can be seen that the Improved Von Karman model provides a good fit to this measured wind speed spectrum.
4.1.6 Extreme wind speeds The database of summary data was examined to find the maximum 10-minute mean and maximum instantaneous wind speeds recorded at the turbine nacelle during the 16-month monitoring period. These were found to be: • Maximum 10-minute mean wind speed: 17.0m/s, recorded on 11/02/02. • Maximum instantaneous wind speed: 49.8m/s, recorded on 28/01/02
Figure 4.2: Turbulence intensity for wind directions from the shore
Figure 4.3: Turbulence intensity for wind directions from the sea
JOR3-CT98-0284 OWTES
12
Figure 4.4: Wind speed autospectrum (campaign X0633)
4.2 Wave Conditions Measurements of the sea state were performed using a wave radar located outboard of the turbine walkway, 13.7m above the lowest astronomical tide (LAT) water level. A parallel series of wave measurements was conducted at the beginning of the monitoring period using a wave and tide recorder located on the seabed, approximately 40m from the turbine base. A comparison of measurements from both instruments, including the tidal variation of mean water level and the variation of significant wave height, showed good agreement. 4.2.2 Wind / wave scatter diagram Using the complete database of summary datasets, the probability of occurrence of combinations of the following variables was calculated: • wind speed (2m/s bin width) • tidal mean water level (1m bin width) • significant wave height (1m bin width) The results of this data processing were used to create scatter diagrams giving number of occurrences (parts per thousand) as a function of tidal mean water level, wind speed and significant wave height. 4.2.4 Correlation of wave height with wind speed A scatter plot of the variation in significant wave height with wind speed, including all available Blyth data, is shown in Figure 4.6. Datapoints corresponding to offshore and onshore wind directions are indicated. Superimposed on this graph is the Pierson-Neumann correlation specified by the GL certification regulations [4.2]. A very high degree of scatter is evident in the measured data as a consequence of two effects: firstly the very large changes of fetch with wind direction, and secondly the time lag between changes in wind speed and changes in wave height.
Frequency (Hz)
Aut
ospe
ctru
m (m
2 / H
z)

FINAL REPORT
13
Figure 4.6: Variation of significant wave height with wind speed Consistent with the much longer fetch for onshore wind directions it is clear that higher waves are generated for onshore winds of a given speed than for offshore winds of the same speed. The trend of measured wave heights for onshore wind directions shows higher waves at low wind speeds than the Pierson-Neumann correlation, and lower waves above 8m/s wind speed. An important conclusion to be drawn from Figures 4.6 is the inadequacy of a simple wave height / wind speed correlation relative to site measurements. For the purpose of offshore wind turbine design it is preferable to obtain measurements of the wave conditions from the wind farm site. Sophisticated wave prediction calculations (ray-tracking etc) are likely to be less accurate than site measurements but are preferable to simple correlations of wave height as a function of wind speed. 4.2.5 Wind / wave misalignment A further feature of the wind and wave characteristics at Blyth, and one that may be important for the fatigue loading of the structure, is the misalignment between wind and wave directions. Because no direct measurement of wave direction was made, it was necessary to calculate this from the recorded data. This could not be performed for the summary data, which is in the format of statistical values only, but was done for 440 campaign datasets with sea state and nacelle orientation measurements. The wave directions, which were not measured directly, were calculated as follows:
• The measured mudline bending moment of each campaign was resolved into 5°
intervals around the base, giving 72 different resolved bending moment time-histories. • The spectral coherence between the sea level variation and each resolved mudline
bending moment time history was calculated. • The resolved angle that generated the highest coherence between the two signals at the
frequency corresponding to the peak spectral period of the waves (see section 3.4) was then considered to be the wave direction.
The results of this misalignment analysis are presented in Figure 4.7. As expected, for onshore wind directions the probability of almost zero misalignment is relatively high as the local wind plays a large part in defining the direction of waves propagation. For offshore wind directions, conversely, there is a very low probability of the misalignment being nearly zero because most waves approach the turbine from the open sea. As the highest wind speeds occur for onshore wind directions (easterly winds) and the lowest wind speeds occur for
Wind speed (m/s)
Sign
ifica
nt w
ave
heig
ht (m
)

JOR3-CT98-0284 OWTES
14
offshore wind directions (westerly winds), it can be seen that combinations of high wind speeds and high wind-wave misalignments are unlikely to occur.
Figure 4.7: Wind-wave misalignment for onshore and offshore wind directions 4.2.6 Spectral properties of recorded waves Spectral analyses of the sea surface elevation time history were performed for a selection of campaigns datasets. An example is shown in Figure 4.8 for campaign x0576. This figure shows that the wave energy is concentrated in a relatively narrow range of frequencies (in this case close to 0.1Hz). Superimposed on the graph in Figure 4.8 is a spectrum of the standard JONSWAP form. This was fitted to the measured wave energy spectrum using the method of Houmb and Overik [4.4]. Figure 4.8 illustrates a feature of nearly all of the wave spectra recorded at Blyth: a smaller ‘bulge’ in the wave energy spectrum over a range of frequencies close to twice the frequency of the peak in the spectrum. It is believed that this is due to the fact that, in the shallow water depth in which the turbine is situated, the waves’ profiles are not sinusoidal (linear) but have a more steeply sided (non-linear) profile. Recent work by Veldkamp [4.5] has shown that small non-linear waves may be modelled by correcting linear wave models for second order effects. Figure 4.9 (taken from [4.5]) compares a measured wave spectrum at Blyth with a theoretically-derived spectrum that attempts to account for second-order effects. The agreement between measured and predicted spectra is better at twice the peak frequency than the JONSWAP fit shown in Figure 4.8, although in the particular example shown the second-order ‘bulge’ overestimates the measurements.
Misalignment
Prob
abili
ty
FINAL REPORT
15
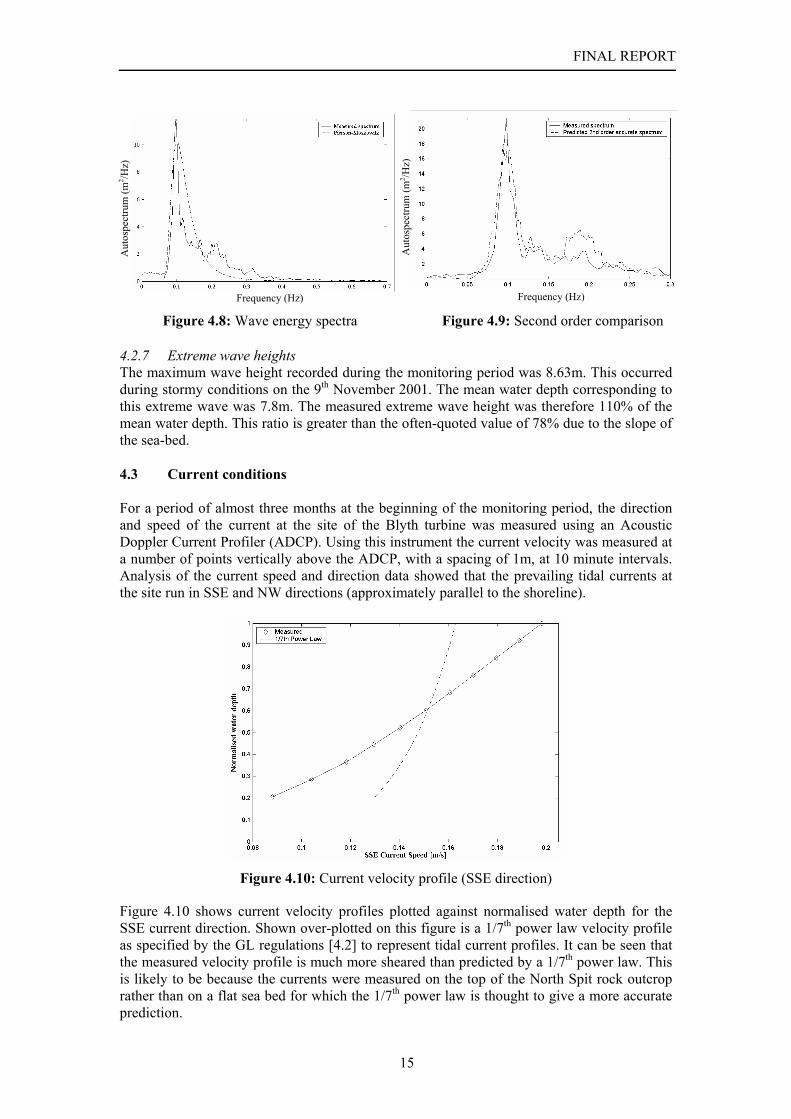
4.2.7 Extreme wave heights The maximum wave height recorded during the monitoring period was 8.63m. This occurred during stormy conditions on the 9th November 2001. The mean water depth corresponding to this extreme wave was 7.8m. The measured extreme wave height was therefore 110% of the mean water depth. This ratio is greater than the often-quoted value of 78% due to the slope of the sea-bed. 4.3 Current conditions For a period of almost three months at the beginning of the monitoring period, the direction and speed of the current at the site of the Blyth turbine was measured using an Acoustic Doppler Current Profiler (ADCP). Using this instrument the current velocity was measured at a number of points vertically above the ADCP, with a spacing of 1m, at 10 minute intervals. Analysis of the current speed and direction data showed that the prevailing tidal currents at the site run in SSE and NW directions (approximately parallel to the shoreline).
Figure 4.10: Current velocity profile (SSE direction)
Figure 4.10 shows current velocity profiles plotted against normalised water depth for the SSE current direction. Shown over-plotted on this figure is a 1/7th power law velocity profile as specified by the GL regulations [4.2] to represent tidal current profiles. It can be seen that the measured velocity profile is much more sheared than predicted by a 1/7th power law. This is likely to be because the currents were measured on the top of the North Spit rock outcrop rather than on a flat sea bed for which the 1/7th power law is thought to give a more accurate prediction.
Frequency (Hz)
Aut
ospe
ctru
m (m
2 /Hz)
Frequency (Hz)
Aut
ospe
ctru
m (m
2 /Hz)
Figure 4.8: Wave energy spectra Figure 4.9: Second order comparison

JOR3-CT98-0284 OWTES
16
4.4 Summary The analysis of the environmental data recorded at Blyth has resulted in a number of conclusions, some specific to the site of the Blyth offshore wind farm and others of generic significance: • The turbulence intensity of the wind was found to be lower for wind directions from
the sea (Iu = 8% at 15m/s) than for wind directions from the land (Iu = 15% at 15m/s).
• Wind shear exponents were found to be significantly lower for onshore (from the sea towards land) wind directions (0.05) than for offshore (from the land towards sea) wind directions (0.29).
• It was found that significant wave height could be calculated to acceptable accuracy using a 10-minute period of data collection.
• Analysis of wave data has shown the significance of the fetch and the time lag between changes in wind speed and changes in wave height, in predicting wave conditions as a function of wind speed. It was concluded that generic correlations are not suitable substitutes for site measurements.
• Analysis of wave energy spectra showed evidence of the non-linearity of the waves at this relatively shallow site. This may have consequences for the calculation of the fatigue loading of the structure.
• It has been shown that the largest waves at the Blyth site typically occur when the wind is blowing onshore and that there is a low probability of wind / wave misalignment during these periods. Conversely, large waves are rare and there is a high probability of wind / wave misalignment when the wind is blowing in the offshore direction.

FINAL REPORT
17
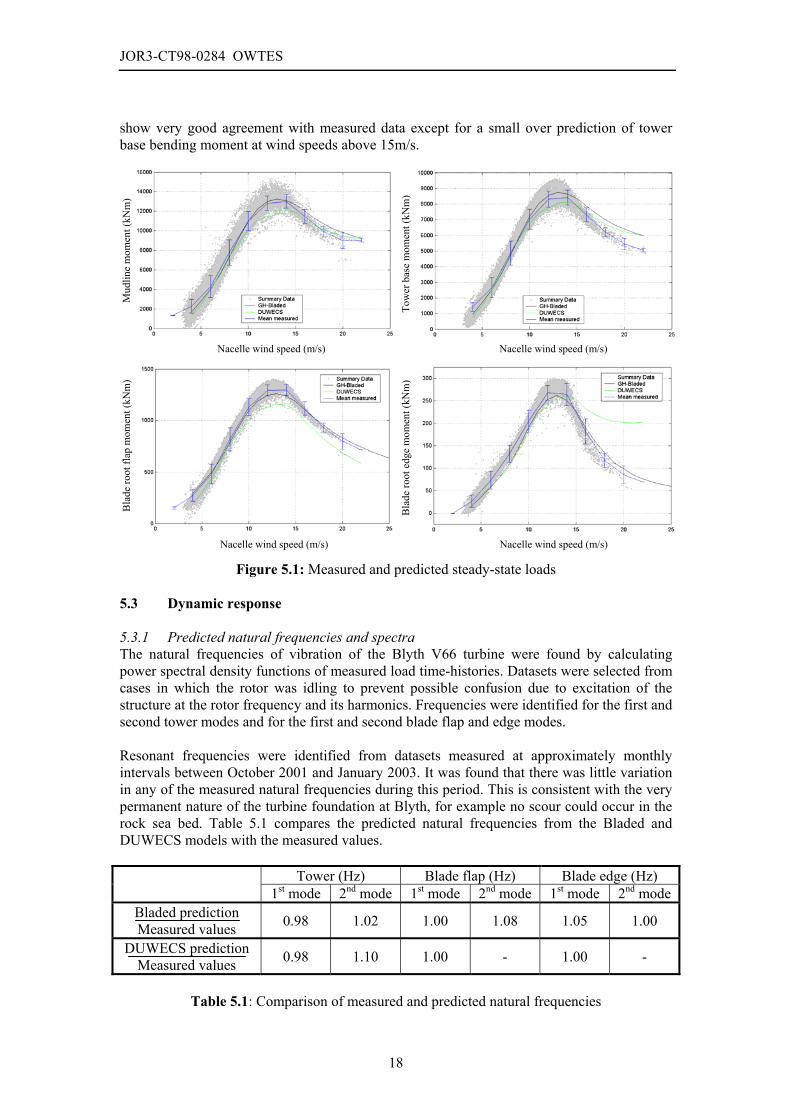
5 VERIFICATION OF DESIGN TOOLS The database of measurements recorded on the Blyth turbine was used to verify and enhance state-of-the-art design tools for offshore wind turbines. Two computer codes were examined during this study: Bladed (GH) and DUWECS (DUT). As the first step in this study, the Vestas V66 turbine was modelled using the Bladed and DUWECS codes. The programs were then used to predict various aspects of the turbine performance and loading. The predictions were compared to the measured performance and loads experienced by the turbine, and any discrepancies were investigated. 5.1 Machine data and computer modelling The data required to model the V66 turbine, its support structure and foundation were provided by VS and AW. The following features of the turbine were specified: • Rotor configuration • Blade geometry, mass, stiffness and aerodynamic properties • Hub and nacelle details • Drive train properties • Blade pitch control system • Support structure geometry, mass and stiffness • Soil properties The description of the turbine was then used by GH and DUT to create models of the turbine and support structure using the Bladed and DUWECS codes. Both GH and DUT found that the correct dynamic characteristics of the support structure could be predicted by modelling a rigid foundation. This is consistent with the expected rigid nature of the grouted rock-socket foundation used at Blyth. Models of the blade pitch control system were built based on information and assistance from Vestas. The controller implemented in the Bladed code used a combination of standard GH controller software and specific inputs provided by VS. 5.2 Steady-state performance and loading The variations of mean turbine performance and structural loading with wind speed were compared with values predicted using Bladed and DUWECS. Some examples of structural loads are shown in Figures 5.1. Mean measured values are shown by blue lines, while error bars on these lines indicate +/-1 standard deviation of the plotted variable. The predictions are shown over-plotted on these graphs. The wind speed values used for these comparisons were recorded by the nacelle anemometer. The measured values were corrected using a calibration implemented by Vestas in order to estimate the ambient wind speed at hub height, i.e. the wind speed unaffected by presence of the rotor and nacelle. Given the uncertainties inherent in this calibration process, there is some uncertainty in the accuracy of these wind speed values. Predictions from the DUWECS code show generally good agreement with measurements except for an underestimate of fore-aft loads between 8m/s and 14m/s. This discrepancy is seen in the tower base, mudline and blade root flap bending moments. Blade root edgewise bending moments are over predicted at wind speeds above 15m/s. The Bladed predictions
JOR3-CT98-0284 OWTES
18
show very good agreement with measured data except for a small over prediction of tower base bending moment at wind speeds above 15m/s.
Figure 5.1: Measured and predicted steady-state loads
5.3 Dynamic response 5.3.1 Predicted natural frequencies and spectra The natural frequencies of vibration of the Blyth V66 turbine were found by calculating power spectral density functions of measured load time-histories. Datasets were selected from cases in which the rotor was idling to prevent possible confusion due to excitation of the structure at the rotor frequency and its harmonics. Frequencies were identified for the first and second tower modes and for the first and second blade flap and edge modes. Resonant frequencies were identified from datasets measured at approximately monthly intervals between October 2001 and January 2003. It was found that there was little variation in any of the measured natural frequencies during this period. This is consistent with the very permanent nature of the turbine foundation at Blyth, for example no scour could occur in the rock sea bed. Table 5.1 compares the predicted natural frequencies from the Bladed and DUWECS models with the measured values.
Tower (Hz) Blade flap (Hz) Blade edge (Hz) 1st mode 2nd mode 1st mode 2nd mode 1st mode 2nd mode
Bladed prediction Measured values 0.98 1.02 1.00 1.08 1.05 1.00
DUWECS prediction Measured values 0.98 1.10 1.00 - 1.00 -
Table 5.1: Comparison of measured and predicted natural frequencies
Mud
line
mom
ent (
kNm
)
Tow
er b
ase
mom
ent (
kNm
) B
lade
root
edg
e m
omen
t (kN
m)
Bla
de ro
ot fl
ap m
omen
t (kN
m)
Nacelle wind speed (m/s) Nacelle wind speed (m/s)
Nacelle wind speed (m/s) Nacelle wind speed (m/s)

FINAL REPORT
19
Using the Bladed code, several campaign datasets were modelled as time-domain simulations. The external conditions for the simulations were specified to be as similar as possible to the measured conditions for the appropriate campaign. The predicted load time-histories were then Fourier-analysed and the computed power spectra were compared with measured spectra for the same load components. Comparisons of tower load autospectra highlighted some areas of improvement required in the Bladed tower model which were subsequently made. Figure 5.2 shows example comparisons of measured and predicted autospectra for tower fore-aft loads, tower side-to-side loads and blade root loads. Coloured lines on these graphs indicate predicted natural frequencies and harmonics of the rotor speed.
Figure 5.2: Measured and predicted autospectra
5.3.2 Support structure damping The Bladed model linearisation tool was used to estimate the proportions of the overall damping of the support structure that could be attributed to aerodynamic damping and hydrodynamic damping. By changing the model parameters to create systems where one damping characteristic was ineffective, the contribution of each type of damping was determined. To eliminate aerodynamic damping from the rotor, the turbine was modelled as idling (the component of aerodynamic damping resulting from drag of the pitched rotor blades was neglected). To eliminate hydrodynamic damping, the hydrodynamic drag and inertial coefficients used in Morison’s equation were set to zero. Internal structural damping was an input to the turbine model and was assumed to be 0.5% of critical damping. Two campaign records of an operational turbine were modelled using the Bladed linearisation tool: X0763 at a mean wind speed of 18.4m/s and X0635 at a mean wind speed of 9.6m/s. The predicted components of damping associated with the first tower mode are shown in Table 5.2. For both cases, the level of hydrodynamic damping was predicted to be negligible. This is due to the very low velocities and accelerations of the structure close to the sea bed. Damping resulting from aerodynamic drag on the tower was also found to be very small. The

JOR3-CT98-0284 OWTES
20
largest component of damping was predicted to be the aerodynamic damping of the rotor, at approximately 4% of critical damping. The aerodynamic damping is higher at a wind speed of 9.6m/s than at 18.4m/s because of the higher thrust force at wind speeds close to the rated wind speed. The predicted values of aerodynamic damping compare favourably with damping factor values calculated from measured campaigns [5.1] which were found to be approximately 4%.
X0763 X0635
Structural 0. 50% 0. 50%
Aerodynamic: tower drag 0. 07% 0.02%
Aerodynamic: rotor 3.76% 4.93%
Hydrodynamic 0.00% 0.00%
TOTAL 4.33% 5.45%
Table 5.2: Predicted damping components (% of critical damping) 5.4 Fatigue loading 5.4.1 Measured and predicted fatigue loads As described in [5.1], the data processing to calculate fatigue damage equivalent loads (DELs) and Markov matrices from the database of measurements comprised two steps. In the first step a scatter diagram of external conditions and turbine operating states was defined based on summary datasets. In the second step, load time histories from approximately 460 campaign datasets were rainflow cycle counted and the results combined on the basis of the probability of occurrence of the external conditions and turbine operating state. The wind direction was specifically accounted for in this data processing because of the different turbulence intensity and wind shear properties for onshore and offshore wind directions. The GH Bladed program was then used to create a time-domain simulation for each of the measured campaign datasets, modelling the external conditions to be as close to the measured campaign as possible. The wind shear exponent was calculated from long-term met. mast anemometer data, being different for onshore and offshore wind directions. The mean wind speed was found from met. mast anemometer readings, extrapolated to the turbine hub height using the appropriate wind shear exponent. The turbulence intensity was specified as the standard deviation of wind speed recorded by the 40m met. mast anemometer, normalised by the hub-height wind speed. All modelled wind data were created using the ‘improved Von Karman’ turbulence model [5.2]. Wave conditions were input to the simulations as Pierson-Moskowitz wave energy spectra. For each simulation / campaign, the significant wave height (Hs) was calculated from the campaign dataset as 4.005 times the standard deviation of sea surface elevation. The peak spectral period (Tp) was then found by fitting a Pierson-Moskowitz spectrum to the measured wave energy spectrum using the ‘least squares’ method. The measured mean sea level for each campaign was also included in the simulation.
The simulations modelled the turbine either in idling or power production mode, depending on the operational status of the turbine as recorded by the respective campaign dataset. The measured difference in the wind and wave directions was also taken into account. The

FINAL REPORT
21
simulations were used to create load time-histories at several heights in the tower and pile and at the blade roots. Damage equivalent fatigue loads (DELs) were calculated from the measured campaign data and the simulation output by rainflow cycle counting the load time-histories. For each load component, the DEL values from each campaign and simulation were weighted using the probabilities of occurrence of the external conditions and turbine state to give a single value for the measured DEL and a single value for the predicted DEL. DELs were calculated for a reference frequency of 1Hz. In a similar manner, Markov matrices were combined by weighting according to the probabilities of occurrence. The number of cycles in the resulting Markov matrices were scaled to be appropriate to a turbine lifetime of 20 years. The method of calculating the DEL values and Markov matrices from both the measurements and predictions assumed that the wind always approached the turbine from the same direction, parallel to the rotor axis (X-axis). The principal overturning moments of the support structure are therefore parallel to the Y-axis. The measured and predicted DEL values are compared in Table 5.3. The values of inverse SN slope (m) which were assumed for each load component are also given.
Bending moment m Predicted DELMeasured DEL
Tower top X 4 0.91 Tower top Y 4 1.02 Tower base X 4 0.87 Tower base Y 4 1.11
Mean sea level X 4 0.84 Mean sea level Y 4 1.06
Pile level 1 X 4 0.80 Pile level 1 Y 4 1.02 Pile level 2 X 4 0.78 Pile level 2 Y 4 1.00
Mudline X 4 0.83 Mudline Y 4 1.02
Blade root flap 10 0.99 Blade root edge 10 0.95
LSS torque 4 1.10
Table 5.3: Comparison of measured and predicted DELs Comparing first the support structure overturning moments in the fore-aft direction (Y components), very good agreement between the measured and predicted DEL values can be seen. Predictions of the support structure bending moments in the side-to-side direction (X components) are not as close to the measured values as the fore-aft components. The predicted side-to-side damage equivalent bending moments are approximately 10% lower than measurements at the tower top, the discrepancy increasing to approximately 20% at the mudline. This may result from the fact that the model of the turbine used for the simulations neglected any rotor imbalance. The predictions of the blade root fatigue loads in the flapwise and edgewise directions are both very good, while the prediction of low-speed shaft torque fatigue load is reasonable.

JOR3-CT98-0284 OWTES
22
Figure 5.3 shows cycle exceedance distributions for the mudline overturning moment and blade root flapwise moment, showing good agreement between the measured and predicted distributions.
Figure 5.3: Measured and predicted cycle exceedence distributions
5.4.2 Wave contribution to fatigue loads Having verified the Bladed fatigue load calculations as discussed in the previous section, the Bladed model was then used to estimate the proportions of the fatigue loads that resulted from wind loading alone. To do this, the set of approximately 460 simulations was re-run in the same way except that no waves were modelled. The DEL values were again combined on the basis of probability of occurrence. Table 5.4 compares the two sets of predicted fatigue loads: one calculated for both wind and wave loading and the other considering wind loading alone.
Bending moment m Wind loading only Wind and wave loading
Tower top X 4 1.000 Tower top Y 4 1.000 Tower base X 4 1.000 Tower base Y 4 1.001
Mean sea level X 4 1.000 Mean sea level Y 4 1.001
Pile level 1 X 4 0.998 Pile level 1 Y 4 0.999 Pile level 2 X 4 0.984 Pile level 2 Y 4 0.985
Mudline X 4 0.963 Mudline Y 4 0.967
Blade root flap 10 1.002 Blade root edge 10 1.001
LSS torque 4 1.001
Table 5.4: Comparison of predicted DELs with and without wave loading The results given in Table 5.4 show that waves make a relatively small contribution to the total fatigue loading of the turbine structure at Blyth. This is due to the relatively stiff turbine foundation and the shallow water depth. As would be expected, the largest contribution of the waves to fatigue loading occurs at the mudline where both fore-aft and side-to-side bending moments increase by approximately 4% due to wave action. At increasing tower station

FINAL REPORT
23
heights the wave contribution to fatigue loads decreases and is essentially zero at the tower base and above. 5.5 Extreme wave loading The aims of this investigation were to compare the measured and predicted loads on the turbine support structure resulting from the passage of large waves passed the turbine base. Two studies were conducted: firstly the measured and predicted loads applied by the waves were compared, and secondly a comparison was made of the predicted and measured dynamic responses of the support structure to the impact of large waves. 5.5.1 Comparison of measured and predicted applied wave loads The measured support structure loads included contributions from the wind loading, wave loading and structural dynamics. As described in [5.1], a method of data processing was developed to estimate the applied load time-history from the waves only. A two-input-single-output linear shift operator time series model was estimated from measures of rotor out-of-plane load and low speed shaft torque to the tower mudline bending moment resolved into the mean wave direction. The linear model was assumed to represent the wind component of the mudline bending moment. The wave component was then estimated as the difference between the measured mudline bending moment and the wind component predicted by the linear model. The dynamic component of the measured overturning moment was found to be small and was neglected. The results of this method of data processing were checked by searching the campaign datasets for waves of similar heights and comparing the processed time-histories of mudline applied bending moments. This check was carried out for waves of approximately 2.9m, 3.5m, 4.3m and 5.0m height. Load ranges were found to agree to approximately 10%. Using the Bladed program, simulations were run to predict the wave applied loads for waves of the same four heights. In this case, high-order stream function theory was used to calculate the water particle kinematics associated with the wave and the resulting loads were calculated using Morison’s equation. The calculations assumed a drag coefficient (Cd) of 0.6 and an inertia coefficient (Cm) of 1.3. No separate calculation of slap loading (an inertial load associated with the impact of the wave crest) was made. At Blyth the turbines are installed on a rocky outcrop known as the ‘North Spit’. As waves approach the turbines, the water depth reduces rapidly in the region of the outcrop. An effect of a sloping sea-bed is to increase the height of the breaking wave relative to the breaking wave height for a flat sea-bed. The breaking wave height may increase by a factor of up to 1.5 for a sea-bed slope of 10%, as shown by Figure 6.10 of [5.3]. A consequence of this is that, when modelling a wave with a given wave height and period, the wave characteristics will be more non-linear (i.e. closer to breaking) for a flat sea-bed than they would be for a sloping sea-bed. Because the wave solver contained within the Bladed program calculates wave properties for a flat sea-bed, some adjustment was necessary to account for the effect of the actual sea-bed slope on the predicted wave profile and water particle kinematics. This adjustment was made as follows: 1. The mean water level was determined for the campaign datasets considered. This was
found to be 2.5m above lowest astronomical tide (LAT), equivalent to a total depth of 8.5m.

JOR3-CT98-0284 OWTES
24
2. Other campaign datasets recorded during storm conditions were examined to find the breaking wave height for the same mean water depth. This was found to be 8.5m (i.e. 100% of the mean depth).
3. The water depth modelled using the Bladed program was increased so that a wave of 8.5m height was predicted to just break using the stream function wave solution. It was found that it was necessary to increase the water depth to 10.3m.
4. The simulations used to predict the applied wave load were then run using the increased water depth.
5. The predicted mudline bending moment time-histories were then scaled by (actual depth / modelled depth)2.
Figure 5.4 shows the ensemble-averaged measured mudline bending moment time-histories for wave heights of 4.3m and 5.0m. Also plotted in these figures are the predicted applied loads for waves of the same heights, calculated using the procedure described above and predicted loads calculated using linear Airy wave theory.
Figure 5.4: Measured and predicted applied wave loads
The ranges of the measured and stream function predicted load time-histories shown in Figure 5.4 are seen to agree well. The load ranges predicted by linear wave theory, however, are significantly lower than the measured ranges and the stream function predicted ranges. This observation confirms the requirement to use a non-linear wave theory for extreme load calculations. 5.5.2 Dynamic response Owing to the flexibility of the turbine support structure, the impact of an extreme wave at the tower base can lead to a significant dynamic response of the structure. During the early part of the monitoring period at Blyth, several periods of stormy weather led to wave heights of up to 8.5m. The left-hand graph in Figure 5.5 shows the measured mudline bending moment time-history for a sequence of four waves of approximately 6m height recorded during one of these storms. In this case the measured bending moments shown are ‘as measured’ values and include contributions from the applied wave loads, the applied wind loads and the structural dynamics. The right-hand graph in this figure shows a predicted load time-history, calculated using the Bladed program, for a regular wavetrain of 6m high stream function waves. Comparing the measured and predicted responses in Figure 5.5 it can be seen that both exhibit the same qualitative behaviour. As a wave impacts the support structure a large peak in the
4.3m wave height 5.0m wave height

FINAL REPORT
25
mudline bending moment occurs. This is followed by an oscillation of the support structure at its natural frequency of 0.47Hz until the next wave impacts and the cycle repeats. The measured and predicted peak load ranges compare reasonably well, although it should be noted that the measured wave heights in this sequence varied between 4.5m and 8.0m height and so an accurate quantitative agreement is not to be expected. An interesting observation in the measured load time-history is the response of the support structure at the second mode frequency, which can be seen most clearly after the first and second wave impacts shown in Figure 5.5. This second mode oscillation (confirmed by frequency analysis) is heavily damped and decays much more rapidly than the first mode vibration.
Figure 5.5: Measured and predicted dynamic response
5.6 Summary In this section the use of the database of measurements recorded on the Blyth turbine to verify and enhance state-of-the-art design tools for offshore wind turbines has been described. Two computer codes were examined: Bladed (GH) and DUWECS (DUT). Both codes were used to predict various aspects of the turbine performance and loading. The predictions were then compared to the measured values and the causes of any discrepancies were investigated. In the course of this study, both design tools were improved following investigations into apparent differences between measurements and predictions. Specific conclusions from this work include: • Predictions of the variations of steady-state performance and loads with wind speed
showed good agreements with measurements. The DUWECS model of the blade pitch control system was improved in this context.
• The measured natural frequencies of structural vibration compared well with measured values. For both models, it was found that it was necessary to assume the foundation to be rigid to achieve the measured support structure natural frequencies.
• The Bladed code was used to predict the degree of tower damping provided by the operating rotor. The aerodynamic damping was found to be approximately 4% which compared well with values derived from measurements.
• Measured and predicted fatigue bending moments of the turbine support structure were found to agree to within approximately 5% in the fore-aft direction, and to within approximately 20% in the side-to-side direction. The poorer agreement in the side-to-side direction is due in part to not modelling the (unknown) rotor imbalance.
Predicted: Measured:

JOR3-CT98-0284 OWTES
26
• As a result of the stiff foundation and relatively shallow water, wave loading was found to make a small contribution to fatigue loads. The largest contribution was made at the mudline where the damage equivalent bending moment increased by 4% due to wave action.
• Measured extreme wave loads were compared with predictions calculated using stream function theory and Morison’s equation. After making a correction for the sea-bed slope effect, good agreement in form and magnitude of the load time-history was achieved. The dynamic response of the turbine structure to large wave impacts was found to be modelled well by the Bladed code.

FINAL REPORT
27
6 PARAMETRIC DESIGN STUDY 6.1 Sensitivity analysis for foundations of offshore wind turbines As shown in [6.5], dynamic response is an important aspect in the prediction of extreme and fatigue loading of the support structure of an offshore wind energy converter (OWEC). The predictability of this dynamic response differs in some important aspects from that of platforms for the offshore oil industry and of onshore wind energy converters. The natural frequency of an OWEC is wedged between different excitation frequencies, whereas the natural frequency of a fixed platform for the offshore oil industry is usually designed to be well above the wave excitation frequencies. The geometry and dimensions of offshore foundations differ from typical onshore solutions, resulting particularly in an expected larger influence of soil characteristics for slender monopile foundations. The first and second natural frequencies of the support structure were taken as the primary indicators of dynamic response. The work focused on the two following issues relating to the prediction of the natural frequency in wind turbine design codes: (i) sensitivity of the predicted natural frequency to variations in input parameters and foundation models, and (ii) comparison of predicted and measured natural frequencies. The support structures were modelled using the finite element program ANSYS®. The soil-structure interaction models that were used in this study are common in the offshore oil industry, e.g. as recommended in [6.1]. The selected models were sufficiently sophisticated to incorporate the influence of the parameters that were varied in the study. It was assumed that the parameter sensitivities could be determined with sufficient accuracy with these models, while the validity of the absolute values of the calculated natural frequencies was investigated by comparison with the measurements. This work is reported extensively in [6.3] and [6.9] and was presented at two conferences, see [6.8] and [6.10]. 6.1.1 Sensitivity of predicted frequency For the sensitivity study five different support structure concepts are selected, all designed for a 3 MW wind turbine. The five concepts, shown in Figure 6.1, are:
1. Tubular tower on a monopile 2. Tubular tower on a gravity base structure 3. Tripod and tubular tower with piles 4. Lattice tower with piles 5. Lattice tower with a gravity base structure
2.1. 3. 4. 5.
Figure 6.1: Schematic representation of concepts used in sensitivity study.

JOR3-CT98-0284 OWTES
28
The sensitivity of the natural frequency to foundation and soil properties was the main objective of the parameter sensitivity study. Therefore, many basic parameters that describe the soil and foundation were varied. Some environmental and structural parameters were also varied, to provide insight in the relative importance of the sensitivities. The following types of analyses were performed:
1. Parameter sensitivity, relating to uncertainties, changes during the operational lifetime
and (small) changes in location. 2. Site dependency, relating to larger changes in location and soil conditions. 3. Loading conditions, relating to non-linear foundation behaviour. 4. Different foundation models, based amongst others on [6.2] and [6.6].
As an example of the results of the sensitivity study the differences between the predicted first natural frequencies with several foundation models are shown in Figure 6.2. The study of foundation models was only performed for support structure concepts with a piled foundation.
Win
kler
FEM
(ref
eren
ce)
8D 6D 4D 2D
(Sea
bed)
0D
FEM
-bas
ed
Ran
dolp
h
Forc
e m
etho
d
Dis
plac
emen
t met
hod
Onl
y ax
ial s
prin
gs
Onl
y la
tera
l stif
fnes
s m
atrix
0.80
1.00
1.20
1st n
atur
al fr
eque
ncy
(nor
mal
ised
)
Effective fixity depth
Springs
Stiffness matrix
Tubular tower
Tripod
Lattice tower
Figure 6.2: Predicted first natural frequency for several foundation models. 6.1.2 Measured and predicted natural frequencies For the comparison of predicted and measured natural frequencies, design data was collected for the wind farms Lely, see [6.4], and Irene Vorrink in the Dutch IJsselmeer. The location and typical soil profiles of these wind farms are shown in Figure 6.3.

FINAL REPORT
29
0
-4
-24
-29
-19
SAND [d]
SOFT CLAY
STIFF CLAY
SAND [vd]
SOFT CLAY
STIFF CLAY
0
-2-3
-7-8
-22
-26
-10
SAND [d]
SAND [vd]
SAND [d]
SAND [d]
SILT
Upper left: Lely; lower right: Irene Vorrink Lely Irene Vorrink
Figure 6.3: Location of measured wind farms and typical soil profiles. The Lely wind farm consists of four NW41 turbines, manufactured by NedWind. The two bladed turbines have a rated power of 500 kW each and a rotor diameter of 40.77 m. The turbines in the Irene Vorrink wind farm are NTK 600 turbines, made by the Nordtank Energy Group. The turbines have a rated power of 600 kW each and a rotor diameter of 43 m. Both wind farms are depicted in Figure 6.4.
Figure 6.4: Wind farms Lely (left) and Irene Vorrink (right). The following measurements were carried out within this programme: • To determine the resonant frequencies of the bending mode of the tower, monitoring
was done during periods of one hour, with the turbine parked and in production at various wind velocities.
• To determine the damping ratio of the tower, transient translation movements were measured after a stop.
• To determine the rotational resonant frequencies transient rotational movements of the nacelle were measured after yaw movement.

JOR3-CT98-0284 OWTES
30
All turbines for which data was collected were modelled in the finite element program, to compare the measured natural frequencies with predictions. Table 6.1 gives an example of the results. The measurements at the Lely wind farm were also compared with measurements made in 1995, reported in [6.7], in order to determine aging effects.
1st Bending mode (Hz) 2nd Bending mode (Hz) Turbine number Predicted Measured Difference Predicted Measured Difference
3 0.517 0.546 -5.3% 2.5 3.3 -24%
7 0.557 0.554 0.5% 3.2 3.3 -3%
12 0.542 0.553 -2.0% 3.0 3.3 -9%
23 0.544 0.563 -3.4% 3.0 3.3 -9%
28 0.541 0.560 -3.4% 3.0 3.3 -9%
Table 6.1: Predicted and measured frequencies of turbines in Irene Vorrink wind farm 6.1.3 Conclusions It is emphasised here that many conclusions drawn from this study are only directly applicable to the reference cases considered and that interpretation of the results in a general perspective needs careful consideration of the assumed conditions. The parameter sensitivity shows that the uncertainty of the first natural frequency of the analysed support structures with pile foundations will be in the order of 4%. The sensitivity of the tripod and lattice tower was smaller than that of the tubular tower. The natural frequency of the tubular tower decreased by less than 5% for a scour hole of 2 times the pile diameter. The uncertainty of the first natural frequency of the analysed gravity base structures appears to be in the order of 20%. However, the analysis of the GBS is based on a rather simple foundation model and a conservatively large variation of soil parameters. The design process of gravity base structures will require a more thorough analysis of variations within a wind farm. Several foundation models were compared. Three of these models have a different basis: a finite element model based on stress strain curves, a linear elastic model developed by Randolph and an effective fixity depth model. The finite element model and the linear elastic model give comparable results for the investigated nearly uniform soil. The uncertainty in the assumed effective fixity depth results in a large uncertainty in the predicted natural frequency. The use of the effective fixity depth model without a priori knowledge of the foundation is strongly discouraged for analysis beyond an initial guess of support structure behaviour. The first and second natural frequency obtained with a stiffness matrix with coupled lateral behaviour gives very good correspondence with the finite element foundation model. The use of uncoupled springs for lateral displacement, rotation and axial displacement is not recommended. For the tripod and lattice tower the lateral flexibility of the piles appeared to be much more important than the axial flexibility. The predicted fundamental natural frequencies of five turbines in the wind farm ‘Irene Vorrink’ are within approximately 5% of the measured frequencies. The depth of the first stiff soil layer appears to be an important parameter. One of the turbines in the wind farm ‘Lely’ showed a large difference of 9% between predicted and natural frequency. The other turbine

FINAL REPORT
31
showed an even much larger, inexplicable difference. Comparison of measurements of the current study with a previous study revealed no substantial change of natural frequency. This study has focussed on the influence of the foundation on the natural frequency. Further work must reveal the influence of the foundation on other aspects of dynamic response, in particular fatigue damage. 6.2 Verification and improvement of hydrodynamic loading calculations In the shallow seas that are the favoured locations for offshore wind farms, the limited water depths can result in highly non-linear waves. The determination of the design wave loads will involve selection of appropriate models of wave kinematics as well as force and structural dynamics models. Each selection will involve a compromise between accuracy and usability (speed, ease of use and simplicity of evaluation). Non-linear waves result in a considerable increase of the hydrodynamic loads and need to be considered during the design phase. Breaking waves do not have to be an issue when the location is carefully chosen which has to be preferred because no proper model exists. For European waters and seas ice is not a common phenomenon and determination of the loads is difficult and is dominated by the local ice characteristics. The wave models currently used in wind turbine design codes like Bladed (GH) and DUWECS (DUT) match the standards of dedicated offshore structural design codes and do their job well, in particular for slender monopile foundations. The calculation and determination of design wave loads on offshore structures is a complex undertaking involving different wave models, load-calculation methods and probability analyses. Both the extreme and fatigue load cases need to be considered with and without the wind loads acting on the rotor. The procedures necessary to calculate the critical wave loading, for either the fatigue or extreme cases, can be divided into three stages:
1. determining the design wave or wave climate 2. selecting an appropriate wave load calculation procedure 3. determining the effect on the structure
This task focuses on all three stages, as each is of equal importance for achieving an appropriate design solution. Also, each stage cannot be considered in isolation, as they are interrelated: for instance, the design wave can depend on the structural response when a larger wave at a frequency away from the structure's natural frequency can be less critical than a smaller wave close to the natural frequency. The locations and design requirements for wind turbines differ from the offshore oil and gas industry and the application of existing wave and load models will be different. Offshore wind turbines will generally be located in what is termed intermediate water depths, a region of the seas where until now relatively few structures have been built. Additional experiences have to be acquired and existing wave and load models in combination with uncertainty margins have to be investigated. 6.2.1 Selecting the appropriate load calculation method There are two main methods currently extensively used, among the wider possible range listed in Table 6.2:

JOR3-CT98-0284 OWTES
32
1. Morison's method, usually in the time domain, used for slender structures, such as monopiles and tripods,
2. Diffraction theory, used for massive structures, such as gravity base supports
Mor
ison
Diff
ract
ion
Frou
de-K
rylo
v /
Pres
sure
In
tegr
atio
n
CFD
Time / Frequency Domain TD FD FD TD TD
Forces
inertia √ √ √ √ √ Transverse
drag √ √ 6 X X √
Lateral (drag) √ √ 6 X X √
Pressure X 1 X 1 √ √ √
Geometry
Diffraction X 2 X 2 √ X √
1D √ √ X √ √ Surface Effects 3
3D X X X √ √
Massive Structures X X √ √ √
Wave Model
Non-linear wave models & extrapol. √ X X √ √
Stochastic (Linear) √ √ √ X 5 X 5
Applicability (* = poor / *** = good)
Commercial Availability *** *** *** ** *
Ease of Use *** ** ** ** *
Calculation Speed ** *** *** * *
Table 6.2: Wave load calculation methods
1 = can be modelled relatively easily by adding an extra term; 2 = can be modelled using MacCamy-Fuchs correction for simple shapes; 3 = non-linear surface effects between the structure and the wave-field: 1D = in vertical direction only (i.e. wave height considered only at the vertical-axis of the structure), 3D = full geometric field (i.e. wave height at each surface element of the structure); 4 = must be estimated; 5 = high demands on computation power; 6 = linearised
The pressure integration method (or Froude-Krylov method) offers the advantage of being able to model massive and complex structural geometries with any wave model [6.14], and it in general lead to a small increase in loads when in particular the non-linear wave model is chosen. Diffraction has to be estimated in a similar manner as for Morison's method and so accuracy and extend of application is limited.

FINAL REPORT
33
Where the method could offer the most beneficial results, i.e. gravity base structures in shallow water, the wind loads on the turbine do dominate the design process, however this method has already been used for the design of gravity base structures for offshore wind farms i.e. Middelgrunden. The influence of the structure on the wave pattern is unfortunately not modelled in the diffraction methods yet. In the longer term CFD could help, being able to model all aspects. 6.2.2 Linear versus non-linear wave theory Today, waves kinematics are generally modelled using two different methods: (i) linear or Airy theory, possibly incorporating vertical extrapolation, such as Wheeler stretching, to take account of the wave height, and (ii) the non-linear theory (=stream function model) which always includes the elevation of the water surface. In the past, Stokes theory has been used widely; however for many users it has now been superseded by the stream function theory. A number of other theories are of interest to researchers and include solitary wave, cnoidal and Boussinesq theories, however these are generally not incorporated into commercial software. The choice of the actual wave model to be used depends upon the relationship between the wave height-and-period and the water-depth-and-wave-period. Waves with low steepness (i.e. where the height to length ratio is low) in deep waters can be modelled accurately with linear wave theory; in other cases, stream function theory of an appropriate order is recommended, see Figure 6.5.
Windfarm Extreme & Fatigue
Figure 6.5: Recommended wave models according to API [6.15] and the area of interest for wind turbine applications when located in intermediate water depths
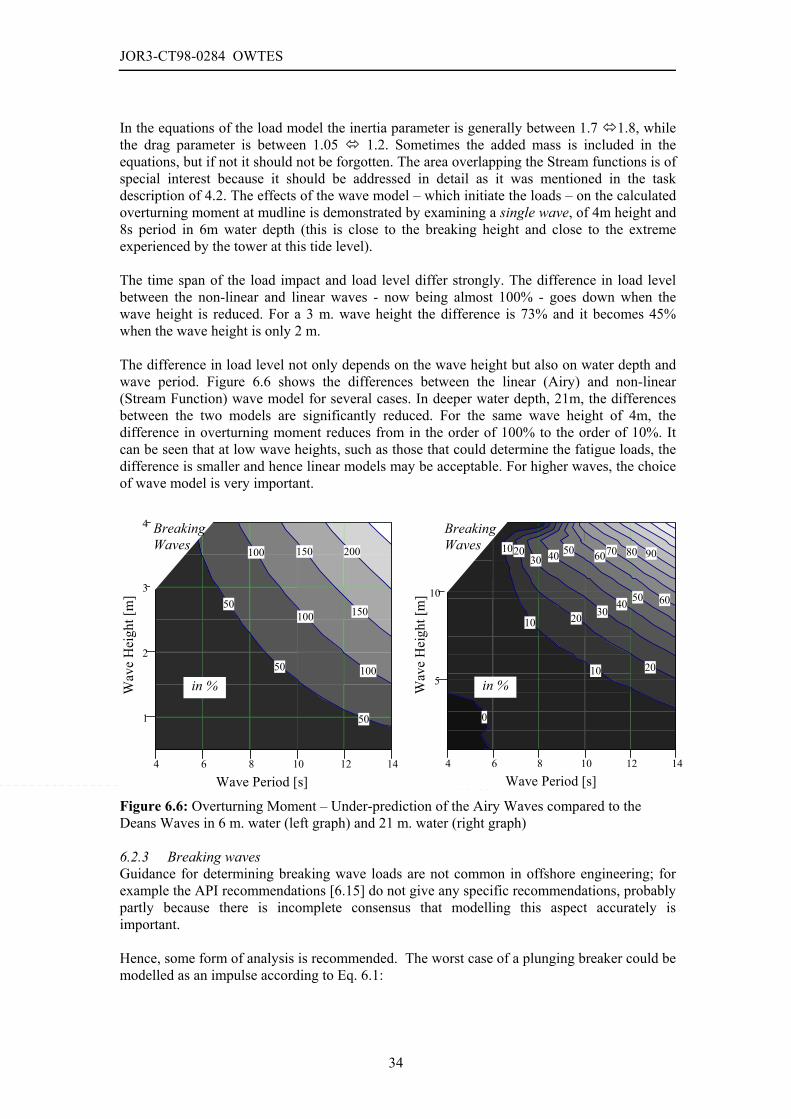
JOR3-CT98-0284 OWTES
34
In the equations of the load model the inertia parameter is generally between 1.7 1.8, while the drag parameter is between 1.05 1.2. Sometimes the added mass is included in the equations, but if not it should not be forgotten. The area overlapping the Stream functions is of special interest because it should be addressed in detail as it was mentioned in the task description of 4.2. The effects of the wave model – which initiate the loads – on the calculated overturning moment at mudline is demonstrated by examining a single wave, of 4m height and 8s period in 6m water depth (this is close to the breaking height and close to the extreme experienced by the tower at this tide level). The time span of the load impact and load level differ strongly. The difference in load level between the non-linear and linear waves - now being almost 100% - goes down when the wave height is reduced. For a 3 m. wave height the difference is 73% and it becomes 45% when the wave height is only 2 m. The difference in load level not only depends on the wave height but also on water depth and wave period. Figure 6.6 shows the differences between the linear (Airy) and non-linear (Stream Function) wave model for several cases. In deeper water depth, 21m, the differences between the two models are significantly reduced. For the same wave height of 4m, the difference in overturning moment reduces from in the order of 100% to the order of 10%. It can be seen that at low wave heights, such as those that could determine the fatigue loads, the difference is smaller and hence linear models may be acceptable. For higher waves, the choice of wave model is very important.
Figure 6.6: Overturning Moment – Under-prediction of the Airy Waves compared to the Deans Waves in 6 m. water (left graph) and 21 m. water (right graph) 6.2.3 Breaking waves Guidance for determining breaking wave loads are not common in offshore engineering; for example the API recommendations [6.15] do not give any specific recommendations, probably partly because there is incomplete consensus that modelling this aspect accurately is important. Hence, some form of analysis is recommended. The worst case of a plunging breaker could be modelled as an impulse according to Eq. 6.1:
DifferenceM
4 6 8 10 12 14
5
10
908070
60
60
50
50
40
40
30
30
20
20
20
10
10
10
0
Wave Period [s]
Wav
e H
eigh
t [m
]
Breaking Waves
in %
DifferenceM
4 6 8 10 12 14
1
2
3
4
200
150
150
100
100
100
50
50
50
Wave Period [s]
Wav
e H
eigh
t [m
]
Breaking Waves
in %

FINAL REPORT
35
bSI CCRF ηλρ ..... 2= (6.1) Two forms of CS, the time varying impact force function, have been examined; Von Kármán and Wagner. The latter predicts a shorter more complex variation of the sawtooth force representation and is regarded as the most accurate one, however von Kármán’s is still more widely used. These formulations only refer to the total loads on the cylinder; local pressures can be much higher up to 32ρv2, i.e. more than ten times higher but are also much shorter at less than 1% of the wave period. If the cylinders are inclined, for example as on a tripod structure, the wave loads will generally be decreased, since they are inclined away from the waves; in the event that a wave is able to break on an element inclined into the wave, the loads are significantly increased. 6.2.4 Ice Loads [6.16] In most European waters, sea ice is not a common phenomenon. It mostly occurs in the Barents Sea, northern and western parts of the Norwegian Sea, and inland waters such as the Baltic and Skagerak. For a preliminary evaluation, charts based on satellite data may be used, as presented in NORSOK N-003 for the Barents Sea, and by Vefsnmo et al (1990). API RP 2N [6.17] provides ice categories and typical ice extremes such as thickness, diameter and speed for locations in the North American Arctic that can be applied for similar conditions in other areas. There are some 6 categories given by API RP 2N but for European offshore waters only first year floe, first year ridges, and ice rubble are the typically occurring ice types. Loading could be static or dynamic, the latter only occurs when there is an ambient current or strong wind. No standardised design data are readily available for European sites, and data should be obtained from local sources. Most design codes come from northern countries such as Norway, Canada, and USA (Alaska) that provide guidance on the subject. DNV’s code for offshore structures (DNV-OS-C101) gives very little detail. The Norwegian Code, NORSOK N-003 is slightly better and provides some guidance to the different types of ice loading. All refer to the American Petroleum Institute (API), which has developed a recommended practice for arctic conditions (API RP 2N) and provides by far the best information.
As an example, the ice loads from a one-year floe can be approximated by:
• Generalised Korzhavin’s Equation • Modified Korzhavin’s Equation • Based on Measurements • Based on Peak Pressure Equation Except the generalised Korzhavin’s equation (1962) all other are described in the API RP 2N 1995 standard. The generalised Korzhavin’s equation for the pressure exerted on a structure is: ce mkIP σ×××= (6.2) Where:
I = indentation coefficient (between 0.1 and 0.5) k = contact coefficient, m = shape factor and σc = ice compressive strength (typical values are 8 to 10 MPa).

JOR3-CT98-0284 OWTES
36
Both the generalised Korzhavin’s equation and the modified Korzhavin’s equation use the compressive strength of the ice, which typically leads to conservative estimates of the loads. Both methods are suitable for a first estimation. For all ice types different equations are available, but the determination of the parameters is always the major problem and quite some experience and knowledge of ice characteristics are recommended.
6.2.5 Structural loads Massive structures, such as gravity base foundations, tend to be very stiff, hence there is minimal dynamic coupling between the waves and the structure and the loads are straight forward to calculate. Slender structures, such as monopiles, are compliant and hence move dynamically to either shed part of the wave loads or amplify them, depending on how close together the wave and structural frequencies are. This is shown as the peak in Figure 6.7. It can also be seen that there is very good agreement between the commercial package SESAM (Det Norske Veritas) and DUWECS (a turbine design code). The response spectra due to a severe sea state are shown in Figure 6.8. The results from the Bladed code (GH) are similar to DUWECS and a proper representation of the wave and current loading has been established.
0.00E+00
1.00E+07
2.00E+07
3.00E+07
4.00E+07
5.00E+07
6.00E+07
7.00E+07
0 0.5 1 1.5 2 2.5 3 3.5 4
frequency [rad/s]
TRF
[Nm
/m]
DUWECSSESAM
0.0E+00
5.0E+13
1.0E+14
1.5E+14
2.0E+14
2.5E+14
3.0E+14
0 0.5 1 1.5 2 2.5 3
frequency [rad/s]
S MM
[N2 m
2 s /
rad]
SESAMDUWECS
Figure 6.7: Response transfer function Figure 6.8: Response spectra for a severe sea state
6.2.6 Summary For slender support structures, it is recommended that analyses involving a combination of linear stochastic seas and non-linear regular waves should be performed, as is the current practice. In shallow sea the non-linear wave model has the preference and it should always be used in case of extreme wave loading. For stochastic waves the linear waves with Wheeler stretching seems to be the best compromise because transformation of the non-linear model is not solved yet. The difference in load predictions of load amplitude and shape of the variation during passing should however be evaluated during the design process. For compact structures, it is recommended that diffraction analyses be performed as well as checks using the Froude-Krylov (or pressure integration) method. During conceptual evaluation, Morison may be used but care must be taken how the forces on the base slab are determined. Diffraction theories do not include the effect of the structure on the waves and some uncertainties will still remain.

FINAL REPORT
37
In most European waters, sea ice is not a common phenomenon. It mostly occurs in the Barents Sea, northern and western parts of the Norwegian Sea, and inland waters such as the Baltic and Skagerak. Determination of the ice loads mainly depends on proper modelling of the ice characteristics. The measured wave loads at Blyth are higher than any of the applied theories predict. It is expected that this is partly due to impact loads associated with breaking waves. Modelling of such waves cannot be carried out adequately and additional safety factors must be incorporated to compensate for the uncertainties. 6.3 Robustness of offshore wind turbine design calculations The combination of wave excitation and wind-turbine interaction demands careful consideration in the design process of offshore wind turbines (OWT’s). Even with the long-term experience of both parenting engineering fields, onshore wind and offshore oil & gas, the design approach is not always straightforward. This study has been undertaken with the aim of providing guidance with regard to the methods adopted for design load calculations for offshore wind turbines in the following areas: • representation of structural dynamics • correlation of wind and waves for extreme load calculations • correlation of wind and waves for fatigue calculations • number of wind classes and sea states required for fatigue calculations • directional distribution of sea states • relative merits of time and frequency domain calculations • simultaneous or successive consideration of aero- and hydrodynamic loading The design process as it has been used for the OWT’s at Blyth has first been analysed and described in a number of flowcharts. A comparison was made with a design description for a “standard” offshore oil & gas structure. The main differences in approach lie in the fact that combined wind and wave loading on the OWT cannot simply be added up or linearised. It is therefore inevitable to perform time domain simulations for fatigue and extreme loading checks. For a normal jacket, fatigue calculations can be linearised and treated in the frequency domain, which reduces the calculation time significantly. A detailed final design report was used as reference procedure for this study. The basic design steps in this procedure are shown in Figure 6.9.
preliminairydesign
Design codes
Environmentalconditions
Models External forces& parameters
Ultimate limit stateschecks
Fatiguechecks
Design requirementsfullfilled
Detailed designchecks
Figure 6.9: Basic description of OWT design process

JOR3-CT98-0284 OWTES
38
Structural modelling of the OWT can be easily done in a finite element program. Natural frequencies compare well with measured values although the high accuracy in the final answer depends on correct and detailed modelling data. The structural damping was calculated from a braking measurement. The damping factor was 0.8% of the critical damping, which is considerably lower than the recommended 2 to 3 % from design guidelines. To establish the actual natural frequency and damping ratio for the Blyth turbine, a measurement of a braking event was used. The time trace of the tower top acceleration of this event is shown in Figure 6.10.
70 80 90 100 110 120 130 140
-1
-0.5
0
0.5
1
Figure 6.10. Free vibration after braking event For extreme loading conditions, deterministic models are used to obtain maximum wave and wind forces on the OWT. By combining these events according to design regulations the maximum structural response is calculated. This superposition of loads may underestimate true extreme response. This approach is depicted in the left-hand side of Figure 6.11. By using integrated models for combined response, not external maximum load, but internal maximum response is examined. A flowchart of this approach is shown in the right-hand side of Figure 6.11. Even though these models already exist, the procedures to determine extreme response are not yet fully developed. Probabilistic response-based methods have not yet reached maturity for use in the design process.
Tow
er to
p ac
cele
ratio
n m
/s2
Time in measurement campaign s

FINAL REPORT
39
Metocean data
Deterministicmaximum mean
wind speed and gust
Deterministicmaximum waveheight and period
turbine model supportstructure model
Maximum loadcalculations
Maximum loadcalculations
Combined maximumload cases
IEC DNV, API
Checkstructuralstrength
when insufficient: change!
Design strong enough
when insufficient: change!
Metocean data
Upper tail ofenvironmental
parameters
offshore windturbine design
Checkstructuralstrength
when insufficient: change!
Design strong enough
integrated model
time series waves
time series wind
time series response
filter peaks
Fit distribution ofpeaks
Probabilistic 50 yearresponse
Establish criticaloperational windows
Figure 6.11: Extreme load and response calculation according to codes and extreme response based probabilistic method Using different data sources with correlated wind and wave data for a lifetime fatigue analysis showed that data from hind-cast and satellite sources compare fairly well with buoy measured data, though they tend to give an over-estimation and are therefore conservative, as can be seen in Table 6.3. Especially preliminary design for several locations can benefit from more easily obtainable satellite data. Detailed design does require more information either from site measurements or oceanographic studies.
Dataset Hind cast Satellite Buoy
Miner sum damage for 20 yrs 0.859 1.302 0.652
Table 6.3: 20-year fatigue damage results for 3 data sets at the same location Reducing the number of wind classes and sea states from 200 to 14 shows, for the turbine in this report, no major differences in fatigue calculation results, as can be seen in Table 6.4. Reducing the number of environment states for fatigue calculation drastically reduces calculation time.

JOR3-CT98-0284 OWTES
40
Series Wind speed bin width (m/s)
Wave height bin width (m)
Wave period bin width (s)
Number of simulations
Tower Base equivalent
bending moment
1 2 0.5 0.5 204 2419.55
2 2 2.5 2.5 39 2424.67
3 2 6.0 6.5 14 2411.54
Table 6.4: Simulation types Co-linear calculation of wind and waves gives a small under prediction of the peak damage equivalent load in the prevailing wind direction and an over-prediction in the direction perpendicular to the prevailing wind direction. The differences are very small, as seen in Figure 6.12.
Figure 6.12: Plot of DEL for m = 4 around tower mudline
Wave load simulations can be performed in the frequency domain without loss of much accuracy for mudline bending moments. Loads at intervals above the mudline differ from time domain calculations. This is mainly due to the simplified dynamics of the model used. For preliminary design and parameter variation, addition of separate aerodynamic and hydrodynamic load cases gives a fast and good approximation of the simultaneous load calculations. Using frequency domain wave loading in these summations should only be limited to mudline bending moments. Simultaneous time domain calculations will always be required in the detailing phase of the design.

FINAL REPORT
41
7 REVIEW OF CERTIFICATION RULES Germanischer Lloyd’s Regulation for the Certification of Offshore Wind Energy Conversion Systems [7.1], issued in 1995, is a result of the Joule 1 Offshore study [7.2] by merging the GL Regulations for the Certification of Wind Energy Conversion Systems [7.3] and the Rules for Offshore Installations [7.4]. In the meantime since the first issue of the regulation, new knowledge has been gathered on offshore wind and wave conditions. The measurements on the Blyth turbines have been used for critical evaluation of the regulations and adjustment to practical experience. The objective of this task is to review and, where appropriate, recommend revision of the current Germanischer Lloyd certification rules for offshore wind turbines. The review depends to a large extent on the interpretation of the measured data from Blyth (Task 2) as well as the calculations undertaken for design tool verification (Task 3) and the parametric study (Task 4). In a first step a comparison of GL Regulation with other regulations and standards was performed. In particular GL undertook a review of all existing design standards and certification rules relating to offshore structures which might have relevance to offshore wind turbine design. It is also important to note that a number of members of the project consortium are playing an active role in the development of a new international design standard for offshore wind turbines, IEC 61400-3. It is clear that the results of the OWTES project will make a valuable contribution to the development of this new international standard. Although there is considerably more work to be carried out for this task, the activity is proceeding in accordance with the scope of work specified in contract JOR3-CT98-0284. 7.1 Review of GL regulations A review of the certification rules raised questions which can summarized in the following: • Is a generic design applicable? What should be the generic description? • Are the descriptions of external conditions correct? • Load cases sufficient, applicable? • Load calculation procedures and methods? • Safety factor strategy. Resolve differences in wind and offshore industry. • Construction details to be included. Special provisions for offshore wind turbines. These questions rely on the certification body view point and cannot be complete and representative for the offshore wind industry. Comments of the project participants regarding their general experience on the certification rules and the experience from their participation in the different tasks are included in final report. From the analysis performed on the site data, the design analysis of the Vestas turbine built up in Blyth and the robustness analysis following points can be included and analysed:
• Review of the Certification Rules (user perspective)
General experience from the participants having used the GL-Regulation has often resulted in many questions regarding the usage of the Regulation. This is often solved by direct contact between user and the certification body engineers. A list of these points will be drawn up.
• Review of the Certification Rules (scientific perspective)

JOR3-CT98-0284 OWTES
42
Results from the robustness analysis are discussed in respect of the necessity of including in the Certification rules, for example the indication on the variation of design parameters like variation of natural frequencies due to errors in soil conditions and due to scour. Further the GL-Regulation gives no description of breaking wave kinematics and load analysis procedure and no detailed information about the consideration of sea ice.
• Review of the certification Rules (design/manufacturer perspective) The turbine machinery has been certified by GL-Wind for the Blyth site by Vestas. The load analysis performed for the certification is used for comparison with the measured site data. A list of external conditions which was used for turbine selection and analysis compared to existing external condition obtained from the data collected will be drawn up. The combination of wind and wave probabilities and the description of shallow water effects are discussed.
• Review of the certification Rules (operator perspective) Essential points from the experience achieved during erection and the first years of operation are collected and considered for including in the Certification Regulation. This part focuses on operation and maintenance aspects.
7.2 Generic Design It is a general view that a generic design may help manufacturers in the development of offshore wind turbines. The defined turbine classes are applicable for wind conditions. Wave heights are site specific and the influence of the different external conditions especially on the support structure raises doubts on the applicability of this procedure. In short following points have been identified: • “Marinized” onshore turbines are initially developed according to standard classes. • Machine loading depends largely on wind load. Minor contribution from wave loading. • Support structure influenced from wind, wave loading, water depth and soil (Task 4). • Generic approach for the machine, site specific for the substructure possible. • Existing classes I and II apply for offshore conditions, class III may be applicable in
special cases. The Blyth site is class III for extreme values but would be covered by class II for fatigue analysis.
An analysis was performed comparing machinery load according to the GL generic class I offshore certification and a site specific certification based on GL´s regulations. Additionally a comparison of the offshore loads with the load of the onshore version of the turbine was performed. The co-ordinate system used is the GL Wind co-ordinate system and the data was selected from existing projects GL-Wind is involved in. The environmental conditions are between class I and class II according the GL-Regulations for offshore wind turbines. The main environmental conditions are given in Table 7.1.
V (10m. av.)
(m/s) V (5s. av.)
(m/s) Vm
(m/s) Hmax (m)
d (m)
GL class I offshore 50 60 10 10 14
Sites (mean) 46 56 ≈ 10 ≈ 10 ≈ 14
GL class II onshore 42.5 59.5 8.5 - -
Table 7.1: Environmental conditions for generic class compared to side data

FINAL REPORT
43
As it can be shown from Table 7.2 the fatigue machinery (from blade tip to yaw bearing) loads of the generic offshore wind turbine are less or equal to the loads of the equivalent onshore wind turbine. It is also shown, that the site specific fatigue loads are more benign than the generic offshore loads. Similar results are achieved for most of the extreme loads considered. A difference is seen in the edgewise load and the side force loading due to different wind speeds and rotational speeds of the offshore turbine compared to the onshore version. Due to the operating load cases considered the site specific loads do not deviate significantly from the generic offshore loads. Differences are seen in the tower top loads due to the different support structure dynamics (site / generic). This makes clear that the support structure has to be site specific designed.
Fatigue loads Extreme loads
GL2 onshore GL1 offshore
GL1 offshoremean of sites GL2 onshore
GL1 offshore GL1 offshoremean of sites
Blade root edge
1.14 1.12 Blade root edge 0.99 0.91
Blade root flap 1.07 1.13 Blade root flap 0.73 1.10
Hub fixed Fx 1.21 0.99 Hub fixed Fx 1.03 0.98
Hub fixed Mx 1.17 1.24 Hub fixed Mx 0.99 0.96
Hub fixed My 1.30 1.04 Hub fixed My 1.15 0.92
Hub rot. Myz 1.11 0.96 Hub rot. Myz 1.02 1.22
Tower top Fx 1.18 1.00 Tower top Fx 1.09 0.94
Tower top Mx 1.20 1.18 Tower top Mx 1.23 1.04
Tower top My 1.27 1.04 Tower top My 1.08 0.94
Mean 1.18 1.08 Mean 1.03 1.00 Table 7.2: Comparison of dimensioning loads to the generic loads according to GL Offshore WT class I To give a quantitative overall value of the conservatism of the different realisations of the wind turbine machinery a mean safety factor for the loads from all components considered was calculated. This factor is shown in Table 7.3.
Case fatigue safety factor extreme safety factor
onshore generic / offshore generic 1.2 1.0
offshore generic / site specific x 1.1 1.0
Table 7.3: Mean safety factor between different realisations A similar analysis was performed for the turbines installed at Blyth Harbour. The results of this analysis are shown in Table 7.4. It has to be mentioned that the offshore turbine installed at Blyth has a higher power rating than the onshore turbine (2MW vs. 1.75MW). The question of a generic design relates also to the external conditions at the site and how these compare to the generic classes provided in the regulation.

JOR3-CT98-0284 OWTES
44
Fatigue loads GL2 onshore Blyth site Extreme loads GL2 onshore
Blyth site
Blade root M edge 1.42 Blade root M edge 0.84
Blade root M flap 1.10 Blade root M flap 1.21
Hub fixed Fx 1.45 Hub fixed Fx 1.87
Hub fixed Mx 1.43 Hub fixed Mx 0.96
Hub fixed My 1.13 Hub fixed My 1.00
Hub rotating Myz 1.18 Hub rotating Myz 1.01
Tower top Fx 1.25 Tower top Fx 1.22
Tower top Mx 1.41 Tower top Mx 0.98
Tower top My 1.06 Tower top My 1.15
Mean 1.27 Mean 1.14
Table 7.4: Load comparison onshore to Blyth site specific 7.3 Description of external conditions It is of major importance to obtain appropriate site data and the question regarding the offshore wind turbine regulation is if the description of the external conditions is correct. 7.3.1 Wind Some experience on the modelling of offshore wind conditions exists through wind and offshore industry measurements. In the present project some difficulties arise for the comparison of the measured data to the theoretical approach since the measurement mast is located some miles away from the site, on land. Generally from the analysis performed it is recognised that the extreme 50-year storm case is the design driver for the support structure ultimate loading. The assumptions for the extreme wind speed and the extreme wave height gain significance in this relation. Regarding the extreme wind speed a comparison to the values given in the different regulations was performed. It was assumed the site lies 2km from the shore. Table 7.5 shows that the site at Blyth Harbour would match very well GL-class 3 conditions, while all other Regulations and classes result in higher wind speeds. The extreme wave height to be combined with this wind speed is assumed to be site specific and no guidance is given in any Regulation or standard. Limiting for the wave height is very often the breaking wave height HB = 0.78 * Depth. For fatigue analysis the mean wind speed, the turbulence intensity and the sea state parameters have to be considered. A comparison of the values given in the different Regulations was performed for the wind gradient, the wind speed turbulence intensity and the mean wind speed.

FINAL REPORT
45
Regulation 10-min. extreme 3s-extreme comments
GL-OWT 50 61.2 Class 1
GL-OWT 42.5 52.2 Class 2
GL-OWT 37.5 45.9 Class 3
Danish recommendations 41.78 54.82
API 41.2 49.1 typical 31 m/s at 10m
GL-Offshore 46.1 54.0 sheltered waters
Offshore Study [7.2] 42.4
Blyth 36.7 43.45 Table 7.5: 50-year extreme wind speed according to different Regulations and at the Blyth site
Figure 7.1: Wind profile A comparison of the wind profile from different regulations is shown in Figure 7.1. The diagram shows considerable difference in the wind gradient. While the GL Regulations for offshore wind turbines uses an exponential model with an exponent α = 0.11 the offshore regulations use exponential models with α = 1/8 = 0.125 (GL-Rules) or a logarithmic model (API). The Danish recommendations for offshore wind turbines use a logarithmic model with a roughness length of z0 = 0.001. The different approaches for the ambient turbulence intensity are shown in the Figure 7.2.
0
10
20
30
40
50
60
70
80
90
9 9.5 10 10.5 11 11.5 12 12.5 13 13.5
Wind speed (10-min- average) [m/s]
Hei
ght a
bove
MSL
[m]
GL-Reg. Offshore wind TurbinesGL Offshore rulesDanish RecommendationsAPI
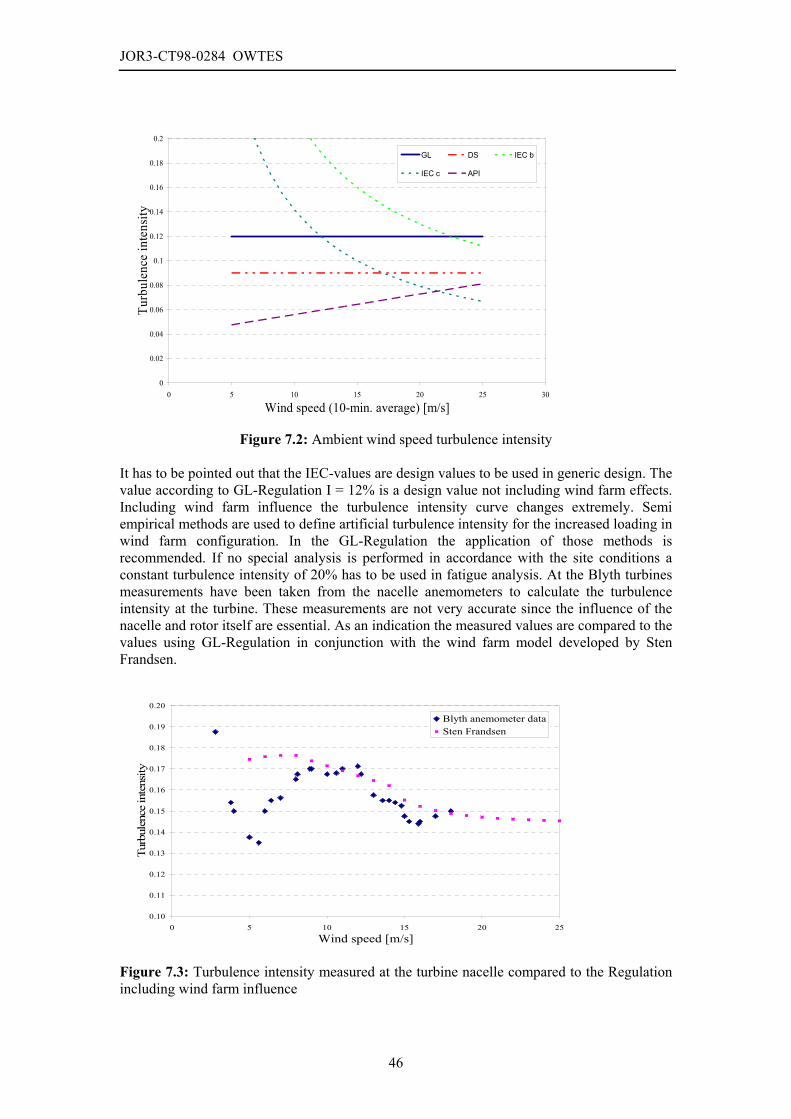
JOR3-CT98-0284 OWTES
46
Figure 7.2: Ambient wind speed turbulence intensity
It has to be pointed out that the IEC-values are design values to be used in generic design. The value according to GL-Regulation I = 12% is a design value not including wind farm effects. Including wind farm influence the turbulence intensity curve changes extremely. Semi empirical methods are used to define artificial turbulence intensity for the increased loading in wind farm configuration. In the GL-Regulation the application of those methods is recommended. If no special analysis is performed in accordance with the site conditions a constant turbulence intensity of 20% has to be used in fatigue analysis. At the Blyth turbines measurements have been taken from the nacelle anemometers to calculate the turbulence intensity at the turbine. These measurements are not very accurate since the influence of the nacelle and rotor itself are essential. As an indication the measured values are compared to the values using GL-Regulation in conjunction with the wind farm model developed by Sten Frandsen.
Figure 7.3: Turbulence intensity measured at the turbine nacelle compared to the Regulation including wind farm influence
0.10
0.11
0.12
0.13
0.14
0.15
0.16
0.17
0.18
0.19
0.20
0 5 10 15 20 25Wind speed [m/s]
Turb
ulen
ce in
tens
ity
Blyth anemometer dataSten Frandsen
0
0.02
0.04
0.06
0.08
0.1
0.12
0.14
0.16
0.18
0.2
0 5 10 15 20 25 30
Wind speed (10-min. average) [m/s]
Turb
ulen
ce in
tens
ityGL DS IEC b
IEC c API

FINAL REPORT
47
From the comparison it can be seen that the values assumed for the Blyth site load analysis are conservative, even if big uncertainty is combined to the nacelle anemometer measurements. A further decisive point is the mean annual wind speed at the site. The values given in the different regulations, the assumed and the measured data at the Blyth Harbour wind farm site are presented in Table 7.6. From the mean wind speed point of view the site corresponds to GL class 2. Regulation 10-min. k comments
GL-OT 10 2 Class 1
GL-OT 8.5 2 Class 2
GL-OT 7.5 2 Class 3
Danish recommendations 10 / 8.5 1.9 North Sea / Baltic Sea
Offshore Study [7.2] 8.2 2.06
Vestas load analysis 8.0 2
Blyth measurement 7.7 2.07 Table 7.6: Annual mean wind speed comparison 7.3.2 Waves Essential influence in the support structure fatigue design has the sea state and the combination of the sea states to the wind speed. The waves are described by the long term distribution of the sea state in the scatter diagram while the short term description is given by wave spectral representations. The two in offshore industry most frequently used standard formulations of the wave frequency spectrum in marine applications are the Pierson-Moskowitz spectrum [7.1] for a fully developed sea and the JONSWAP spectrum (Joint North Sea Wave Project) [7.5] for a developing sea. The Pierson-Moskowitz and the JONSWAP spectra were developed for deep water situations. For finite water depth a self-similar spectral shape, the TMA-Spectrum [7.6], was developed. This spectrum is an extension of the JONSWAP spectrum and water depth dependant. In the present case not only the water depth is limited but the distance to the coast is relatively low. The result will be that the sea state is not fully developed and the wave heights are limited by the finite water depth. In Figure 7.4 the TMA spectrum and the Pierson Moskowitz spectrum are compared to representative lumped mean values from the site scatter diagram.

JOR3-CT98-0284 OWTES
48
Figure 7.4: Wind speed and significant wave height correlation It can be seen, that the TMA-spectrum, for fetch and water depth limited sea states and the PM-spectrum for fully developed sea are capable to cover measured data to a certain degree. The lumped wind wave correlations contain wave heights for different fetches, wind directions and wind duration as well as swell. For the lumped wave heights out of the scatter diagram the site is next to the shore, so the direction of the wind plays an important role in the wave height. The theoretical spectra also does not contain swell wave, which can be seen in Figure 7.4 for low wind speeds. From the external data considered it is clear that the importance of water depth, fetch and time should be taken into account. In most cases the scatter diagram does not include any information about the wind speed to be used in combination with the wave height. In these cases theoretical assumptions on the wind wave correlation have to be built up, based on the JONSWAP equations. These combinations have many uncertainties since parameters as storm duration, fetch, water depth have big influence. A simple method is to correlate the cumulative probability distribution functions of the wind speed and the significant wave height. From the pairs of same probability of exceedance the pairs of wind speed and significant wave height are derived. In this process caution has to be taken for the existence of wind driven sea and swell waves. In this case the analysis has to be performed for two different distributions of wave heights according to their overall probability of occurrence. In the GL-Regulation the original assumptions for the Pierson-Moskowitz spectrum are used. A major drawback of the equations given in the GL-Regulation is that they do not take account of the limited water depth at the site. It is clear that they result to extremely high wave heights.
7.3.3 Wind and wave direction Directionality of wind, wave and current may be considered if accurate data is available. In this case not only the mean wind and wave direction have to be considered, but the distribution of the wind and wave misalignment too. Generally, if no detailed information is available, it is recommended to apply wind and wave data as unidirectional, acting from the same direction for the turbines lifetime. In the regulation the wave direction is always the
0.00
1.00
2.00
3.00
4.00
5.00
6.00
2.0 4.0 6.0 8.0 10.0 12.0 14.0 16.0 18.0Wind speed [m/s]
Sign
ifica
nt w
ave
heig
ht H
s [m
]GL-RegulationTMA-SpectrumBlyth Scatter Diagram

FINAL REPORT
49
direction of the mean wind speed. In general this applies for open sea conditions and extreme waves. The database of measurements recorded at Blyth Harbour is evaluated in order to establish a complete characterisation of the environmental conditions at the site. The measurements of environmental data and structural response are used to examine the extent to which the assumptions underlying the current GL Certification Regulations for offshore wind turbines are valid for the Blyth Harbour site. Additionally the measurement is used for comparison to the initial assumptions made for the site specific turbine analysis. From the data collected it is obvious that the site conditions are not optimal covered by one of the standard classes included in the GL Regulations. To be conservative the generic offshore class II should be used for comparisons since this class covers all aspects of the external conditions. 7.4 Load analysis Generally from the experience in offshore and onshore load analysis it is recognised that design driving load cases for the machinery are depending on the control system of the turbine and the extreme wind speed. Aerodynamic loading dominates the loading on the machinery. For the support structure the extreme 50-year storm case is often the design driver for the ultimate loading, with the portion of wave to wind load varying with the water depth. When calculating 50-year storm loads several aspects of loading have to be considered: • Wind turbulence and associated gust factors • Extreme wave nonlinear kinematics • Breaking wave kinematics • Turbine elastic behaviour This implies some problems in the analysis procedure. To take account of the turbine elastic behaviour and the quadratic nature of wind loading time domain simulations are used based on stochastic wind speed time series. In this case turbine dynamic behaviour and amplification of wind loads is correctly represented, but several realisations are necessary due to the stochastic nature of gusts. An often used alternative is to use a constant wind speed and then multiply the loads with a dynamic amplification factor as defined in building standards. The non-linearity in wave particle kinematics, especially in shallow waters, may play an important influence for consideration of wave loading. Since offshore structures placed in shallow waters are dominated by non-linear extreme wave action and not by elastic response the quasi static approach is often used. In combination with stochastic wind speed time series a stochastic wave time series could be used. This calculation would result in a correct phasing of wind speed and wave elevation during a storm (provided the simulation length and number is big enough). The turbine elastic behaviour is represented in the load analysis. A major problem is that only linear wave kinematics can be used for the stochastic wave train. Methods proposed in recent time to include wave kinematics non-linearity have found only scientific application and are still too complicated for engineering use. The alternative form would be to use the dynamic amplification factor method for the wind load and nonlinear single wave kinematics for the wave load. The problematic point is to calculate the dynamic amplification factor for the wind loading and to separate wind loading from wave loading.

JOR3-CT98-0284 OWTES
50
In the offshore industry the 1-minute averaged wind speed is usually used in combination with the extreme wave for the global structure analysis. In [1] a reduced wave height was derived to be combined with the extreme gust wind speed (5s-average), having the same probability of occurrence as the combination of maximum wave height with 1-minute averaged wind speed. To comply with the requirements of the dynamic analysis and the wave kinematics non-linearity the present approach includes several realisations of the 50-year storm:
• Dynamic simulation using stochastic wind and waves. This approach uses linear wave
theory – often extended with Wheeler stretching -, and takes full account of the structure dynamics.
• Simulation using constant (1-minute averaged) wind speed (vred), with correction for dynamic amplification and deterministic non-linear extreme wave (Hmax = 1.86 Hs). In this case the extreme wave influence for wave load dominated structures is considered.
• Simulation using constant (5-second averaged) wind speed, with correction for dynamic amplification and deterministic non-linear reduced extreme wave (Hmax = 1.32 Hs). In this case the extreme non-linear wave influence for wind load dominated structures is considered.
7.5 Summary From the external data considered it is clear that a major drawback of the GL-Regulation is the proposal only of the PM-spectrum. Even if in the regulation other spectra are allowed, the importance of water depth, fetch and time should be mentioned in the regulation. A general description of the JONSWAP and TMA spectra should be given. A more detailed description of consideration of the 50 year storm load case and the method of applying has to be included in the regulation. A certification of the whole offshore wind turbine structure as in the onshore case, independent of the site, is not possible. Since the influence of the wave loading on the machinery is of minor importance, standardised machinery designs may be developed. The machinery may be certified according to generic classes, as defined in GL´s Regulation for the Certification for Offshore Wind Turbines. The influence of the site hydraulic and soil conditions on the support structure is significant, resulting in site specific designs.

FINAL REPORT
51
8 RECOMMENDATIONS FOR DESIGN In this section results are reported for Task 6 of the OWTES project. The work of this task can be characterised as a catalogue of design requirements for offshore wind turbines and is based on an analysis of the actual loads measured on the installed wind turbine and its support structure compared with the applied design loads. Further the work is based on practical experience gained by designers, manufacturer and service organisations during design, construction installation and operation of the wind turbine. Apart from the companies participating in the OWTES project, helpful contributions have been received from a large number of external sources having relations to the offshore wind energy. In particular the two companies Tech-wise A/S and LIC Engineering A/S have submitted extensive and valuable contributions. The contribution from Tech-wise is based on the practical experience gained during design, construction and operation of the world’s first large scale offshore wind farm located at Horns Rev. The contribution from LIC Engineering takes background in the company’s extensive experience within the field of offshore foundations.
8.1 Results of data analysis In this section the measured blade and tower loads are compared to design loads. The comparisons are only made for measured loads and design loads dealing with normal operation of the turbine, which means that loads during special operating conditions and stand still are not considered. The comparisons between measured loads and design loads were performed for the edgewise and flapwise bending moments at the blade root, and the roll and downwind bending moments at the tower top and the tower bottom. Mean, maximum and minimum values are compared in Section 8.1.1 while in Section 8.1.2 comparisons are made between equivalent fatigue loads. The loads are compared for the wind speed range at which the turbine is operating, i.e. between 4 m/s and 25 m/s.
8.1.1 Comparison of steady-state loads In Figure 8.1 the 3 thin lines represent the design loads and the remaining scatter of points represent the measured loads. The crosses connected by a thin line represent the mean value of the load time series simulated for each load case, while the squares and circles connected by thin lines represent the minimum and maximum value, respectively, for each load case. Each point in the scatter is determined from measured time series of 10 minutes, and the dashed line through each type of point represent the average. Note that all loads are normalised. Considering the mean loads, there is a good correlation between the measured loads and the design loads for the edge moment. The mean of the measured loads generally is higher for the blade root flap moment. According to the experience gained through investigations carried out in the recent years there is a good correspondence between the design loads and the measured flap wise blade moment. The deviations should therefore be found in calibration uncertainties for the concerned strain gauges. The measured downwind moments in the tower are a little higher than the design moments. The measured moments are, however within the expected deviations. As the down wind tower

JOR3-CT98-0284 OWTES
52
moments primarily originate in the blade loads in flap wise direction, it is concluded that the deviations shall be found in the above mentioned calibration uncertainties.
Figure 8.1: Mean, minimum and maximum loads. The measured values of tower moments in the roll direction are smaller than the design loads. For all load components the differences between the maximum and mean design loads are in all cases higher than the measured differences, which is expectable as the applied design turbulence intensity is higher than that of the site. Since the design loads derived from the extreme conditions are much higher than the measured maximum loads, these are not critical.
8.1.2 Comparison of equivalent fatigue loads In order to compare the fatigue damage caused by the measured loads and the design loads an equivalent fatigue load was found for each time series. The results are shown plotted in Figure 8.2. The design fatigue loads are in accordance with the trends in the previous section except that the discrepancy between the design values and the measured values for the flap moment is not so distinct as in the previous section and the design fatigue down wind tower moments are higher than the measured ones. The reason shall be found in the fact that the fatigue loads reflect the turbulence. Hence, as concluded in the foregoing section, the design turbulence is higher that the actual turbulence at the site. The fatigue design loads are thus satisfactory. For further details see the main report of task 6: Recommendations for Design of Offshore Wind Turbines.
The three figures represent: Measured and design edge moments Measured and design roll moments at tower bottom. Measured and design downwind moments at tower bottom.

FINAL REPORT
53
8.2 Results of gathered experience Installation and operation of wind turbines in the offshore environment are relatively new topics, and turbine design as well as concept and method developments are continuously proceeding. This section is a summary of design requirements, which primarily are identified through the experience gained by persons, who are engaged with design, installation and operation of offshore wind farms.
Figure 8.2: Comparison of equivalent fatigue loads 8.2.1 General requirements Many of the interviewed persons have expressed their concern on procedures, activities and approval related to an offshore wind farm. These concerns can be summarised to recommend that:
• Scope of work and procedures for approval by certifying bodies and public authorities should be early identified and scheduled in a phase wise programme.
• The organisational structure for handling the project should be identified at the earliest possible stage of a project in order to ensure communication routines, propagation of information, consensus to interfaces etc.
• Requirements set out by various national and international authorities as well as rules and practices governed by stake holding organisations should be harmonised.
8.2.2 Hydrodynamics and Geotechnics This section is concentrated on hydrodynamics, geotechnics, monopile foundations and installation.
0 5 10 15 20 250.4
0.5
0.6
0.7
0.8
0.9
1
Wind speed [m/s]
[-]
Edge moment (kNm)
m=4m=8
The three figures represent: Measured values and design values of equivalent fatigue edge moment. Measured values and design values of equivalent fatigue roll moment at tower bottom. Measured values and design values of equivalent fatigue downwind moment at tower bottom.
0 5 10 15 20 250
0.05
0.1
0.15
0.2
0.25
0.3
0.35
0.4
0.45
Wind speed [m/s]
[-]
Tower bottom roll moment (kNm)
m=4m=8
0 5 10 15 20 250
0.05
0.1
0.15
0.2
0.25
0.3
0.35
0.4
0.45
Wind speed [m/s]
[-]
Tower bottom roll moment (kNm)
m=4m=8

JOR3-CT98-0284 OWTES
54
• Load Combinations and Design Requirements The following load combinations shall be considered: Ultimate Limit State, Fatigue loads, Accidental loads, Seismic loads and Load combinations. The design requirements include: Lifetime requirements, Access and optional requirements, Environmental requirements and Aesthetic requirements.
• Environmental loads Hydrodynamic loads on the structure and on the appurtenances shall be calculated according to a proven standard. Effect of marine growth shall be included according to the national recommended practice for the individual waters. Ice loads must be included for sub-arctic areas. Ice thickness shall be determined according to local national recommendations. Determination of ice forces on the offshore wind turbine foundation shall be made according to a well proven standard.
• General Geotechnical Considerations The design of foundations shall take account of all effects which may be of influence on deformations, bearing capacity and installation of the foundation system. This should include:
− Identification of the characteristics of each soil layer with the help of on site testing and laboratory testing.
− Investigation of the effect of cyclic loading, which may cause a reduction of shear strength and bearing capacity of the soil.
− Identification of other dynamic loads such as impact loads by e.g. ships or wave slamming, which may have impact on soil resistance.
• Scour and Erosion The possibility of scour or erosion undermining the seabed around the foundation shall always be investigated. Where scouring and erosion occur the foundation and the power cable tie-in shall be suitably protected. Special care shall be made to the scour around the tie-in of the power cables. Free spans of the cables must not be present unless protected by J-tubes or other means. The scour protection should be verified by regular surveys. Countermeasures shall be taken in case of exceeding the limits established in the design.
• Soil stability, Liquefaction and Settlements The risk of slope failure or the possibility of a deep slip shall be investigated when required. Total or effective stress analyses shall be used for soil stability investigations. Seabed movements due to waves’ action, earthquake or operational effects, e.g. driving, dredging, may cause reduced resistance or increased loading. Long term settlements and displacements of the structure as well as the surrounding soil shall be analysed. The load deformation behaviour of a piled foundation is to be analysed with special regard to possible structural interaction.

FINAL REPORT
55
• Geotechnical Investigations The foundation design of fixed OWECS shall consider all types of loads, which may occur during installation, and operation of the structure. The soil behaviour and its interaction with the foundation shall be investigated with special regard to static, dynamic and transient loading. The actual extent of geotechnical field investigations has to be set up individually for each site. They will include: The homogeneity of the formations in the wind park site; Faults etc.; The knowledge of the geological formation from previous constructions or from adjacent sites; The history of formation of the geological structure; The cost and difficulty of investigating the area; The representativeness of in-situ soil samples in the case where the in-situ soil will be changed or modified by the installation.
• Analysis In general a complete model shall be made of the wind turbine, its tower and its foundation. A full time series analysis of all loads should be made including the control system of the wind turbine. However, most available analytical tools will not be able to include all effects.
8.2.3 Piled foundations Piles are support members placed in soil with a length considerably greater than the diameter.
• Design The design of piles shall consider the following factors: Diameter, material, penetration, spacing, soils resistance, and installation method. The various stages of the piles such as end-state, installation, ground improvement shall be listed and axial- and lateral load parameters derived for each stage. The design methods shall for each individual stage incorporate the pile geometries and arrangement (also temporarily). They shall simulate the non-linear properties of the soil and the effects of dynamic loading. The piles shall be analysed for: Ultimate Limit State (ULS), Fatigue Limit State (FLS), Accidental Limit State (ALS), Utility Loads and Installation loads. Offshore pile structures will be exposed to combinations of: compression, tension, bending and shear.
• Skin friction and end bearing capacity For driven piles the design values for skin friction “f” and end-bearing capacity “q” may be established either on the basis of test results or according to empirical methods. For drilled and grouted piles the skin friction of drilled and grouted piles in rock is limited by the shear strength of the rock and of the friction factor between pile surface and rock. When establishing the design values, the installation methods, e.g. drilling or jetting shall be analysed step by step. The influence of rock strength, rock fracturing and bond to pile surface shall be determined. The capacity of steel/grout bond and shear key design shall be examined with great care. For jetting the rearranging of the grain skeleton, possibility for liquefaction, regeneration of soil and difference from original in-situ soil shall be assessed. In rock end-bearing capacity should be specified on the basis of the triaxial shear strength of the rock. Due regard shall be given to a reduction of bearing capacity in fractured rocks and in laminated rocks. For driving in rock the effect of the driving on the rock fracturing shall be assessed.

JOR3-CT98-0284 OWTES
56
Certain soils and rocks will have physical or chemical properties, which may change the soils parameters: Grain crushing, Cementation and Fracturing (in rocks). The soils parameters shall be selected with due reference to such changes. For clays shear strength increases with increase in strain velocity (impact). The effect can be included in ULS and ALS.
• Piles driven or vibrated into non-homogeneous soil For piles penetrating non-homogeneous soils tip resistance and end bearing capacities depend on which layer the tip is placed on and the distance to layer interfaces.
• Laterally loaded piles It shall be ensured that the pile foundation is capable to sustain all static and cyclic loads acting in lateral direction. The soil resistance in the vicinity of the mudline contributes significantly to the lateral capacity of a pile foundation. Any disturbance of the soil, e.g. due to scouring, or to the installation of piles or conductors shall therefore be considered. The design shall fulfil three main criteria: The load-deflection behaviour shall meet the requirements of wind turbine operability. The allowable pile stresses shall not be exceeded, and for monopiles the ambient soil or rock shall remain in the elastic state for ULS, ALS, FLS.
• Monopiles For monopiles the stiffness of the soil determines the length of the piles. Therefore this parameter shall be determined with great care. Both analysis and experience from full-scale in-situ tests may be needed. In ULS the deformations shall remain in the elastic range or it shall be verified that separated by large loads it will not result in lasting deformations exceeding the tolerances for the project. One such criterion is the so-called toe-kick criterion for the tip of the pile. The length of the pile shall be so long that: 1 The pile tip is below the point with vertical tangent to the deflection curve and 2 the lateral deflection δp of the tip is: δp > 0.001⋅D (D is the diameter), where 1 is the overriding criteria even if all deflections are smaller than specified in 2. The deflection of the tip shall be less than the deflection of the point of deflection curve with vertical tangent and the tip shall be below this point.
• Pile structure design The pile structure design shall consider all types of loads, which may occur during installation and operation phases. During pile installation the stresses including buckling shall not exceed the allowable values. Buckling shall be determined. Consideration shall be given to axial loads and bending moments due to pile weight and full hammer weight. Bending moments due to pile batter eccentricities are to be accounted for. Account shall be taken for possible impacts and eccentricities during hammer placement. Combined stresses during driving shall not exceed yield stress, and fatigue damage during driving shall be included in the total damage for allowable fatigue damage in FLS. The ratio of pile diameter and wall thickness shall be so that local buckling during installation is avoided. For piles to be driven in hard soils a driving shoe should be provided. The pile tip shall be able to sustain meeting with stones during driving. Appurtenances, flanges, and

FINAL REPORT
57
stiffeners welded or bolted to the pile shall be investigated in a special dynamic drivability analysis. All loads resulting from the design load conditions shall be considered for the pile structure design. The soil stiffness has to be accounted for when calculating the bending moment distribution. Due regard shall be given to the effect of scour and lack of soil adhesion due to large pile deflections. The axial load transfer may be calculated according to the “axial soil resistance – pile deflection” characteristics or alternatively according to the skin friction capacity of the pile. Loads may be transferred to leg and sleeve piles by grouting the annulus. The design grout strength shall be verified by a representative number of specimens taken during grouting operations.
• Summary for pile design A revision of the calculation basis for bending loaded support structures is desirable as follows:
− Pile lengths are generally determined by using the Zero toe kick criterion. This criterion is relatively simple and widely accepted for structures, which mainly are gravity loaded. In the case of structures loaded by bending the criterion seems to be rather conservative.
− Dimensioning of shear loaded grout connections is well described. For dimensioning of bending loaded grouted connections the standards need further development.
Guidelines need to be prepared for design of support structures subject to ship loads. The guidelines should include recommendations concerning, for example:
− Application and design of collapse zones in the support structure to prevent bottom damage to ships.
− Extent of acceptable damages to the support structure as result of a ship collision. − Evaluation of consequences for possible staff being engaged with service of the wind
turbine at the time of a ship collision. Considerations should be made concerning:
− Secondary loads, such as boat impact. − Secondary structures, such as splash impact on platform grillage.
8.2.4 Platform and access The platform shall provide safe access for service staff entering from a boat. A suitable and rigid ladder extending so far downwards, that it will always be accessible even for a person lying in the water, shall lead to the platform. Further the platform shall provide sufficient working and handling space.
8.2.5 Corrosion Common corrosion protective measures are; increased material scantlings; cathodic protection system; protective surface coating. A combination of the methods will often be selected .The corrosion protection system(s) should be designed for protection of the structure subject to corrosion in accordance with ISO 12944. A suitable corrosion protection system should take account for a high corrosion class for external parts, e.g. Corrosion Class C5-M for external fitted parts at foundation and lower part of the tower. A lower corrosion class can be applied for components installed in well protected areas, e.g. Corrosion Class C3 for parts in the centre part of the nacelle.

JOR3-CT98-0284 OWTES
58
8.2.6 Wind Turbine Design The design of wind turbines for installation in the offshore environment should be focussed on robustness and simplicity of the structures. Only long term tested designs, components and applications should be used. Considerations in respect of redundancy should be focussed on safety when determining which functions that are required to be duplicated. Alternative means of personnel transport, e.g. a standby vessel, should receive a higher priority than duplicated operational features. For the purpose of securing the power production the focus should be to obtain the highest possible operational reliability of components and systems. A complete listing of the suggestions for design requirements for offshore wind turbines is not possible to be included in this summary. Complete details are included in the main report for task 6.
• Mechanical Design As the requirement for a low noise level may be relaxed, the tip speed of an offshore wind turbine could be considered. At increased tip speed erosion of blades should be dealt with. The temperature and humidity conditions in the offshore environment require increased focus on temperature and moisture control both taking lower surrounding temperatures but also higher operational temperatures into consideration. If an offshore wind turbine becomes inoperative, it must be expected, that the turbine will be idle for longer time than an onshore turbine due to e.g. logistic reasons. As maintenance staff will need to plan inspection visits and that also an idle turbine is subject to wind and other environmental loads, particular considerations should be made to cater for prolonged idle time. An internal crane suitable for handling consumables and minor parts should be provided. The design of offshore wind turbines should cater for suitable working and handling space for the purpose of exchange of components. Methods for exchange of major parts should be thoroughly considered. Any design solutions should be demonstrated. Doors and hatches for access to the turbine shall be easily operated and shall provide effective closure for water intrusion when closed. Doors shall be of weather and splash tight design.
• Electrical Design Increased acceleration amplitudes may be expected. Application of design requirements concerning axial loads of bearings in generators and motors (like in the ship building industry) should be considered. In the case of using dry type transformers installation of an arc detection device would facilitate timely interruption. Offshore wind turbines should be equipped with UPS (Uninterruptable Power Supply) as well as an alternative source of power supply (e.g. a diesel generator placed at each WTG or centrally at the transformer platform).

FINAL REPORT
59
• Control and Monitoring. The control system of the wind turbine should be operating able both in the turbine and from a remote location (control centre or transformer platform). The remote operation shall be disabled when operated in the turbine. Disabling of remote control should be physically installed at the turbine entrance. Special considerations shall be made for disabling of remote control in case that helicopter landing of staff is provided. Criteria for change of operation status for the turbine shall be thoroughly evaluated. Change of operation status to a lower operation level, as consequence of a registered error, should be defined according to such criteria. Feed back errors should not be the reason for change of operation level. Installation of an operation condition monitoring system will improve the possibility for preparation of the maintenance scheduling. It is increasingly important to provide a flexible communication system, which can interface with the communication system of conventional power plants. The communication system shall be so designed, that communication with the turbines receives the highest priority. The wind turbines of an offshore wind farm shall be operated as autonomous units. Each turbine shall operate independently and shall not be affected by errors occurring in any other turbines in the wind farm.
8.2.7 Safety A high degree of safety shall always be observed in designing offshore wind turbines. Safety aspects include the safety of personnel, construction as well as navigation and aviation.
• Fire prevention and extinguishing As a general fire precaution non-flammable or fire retardant materials should be used to the extent possible. Fire detection (smoke and/or heat detection) should be provided with a shut down function for the turbine in order to limit damages due to fire. A fire extinguishing system should be of a type and so designed that highest possible safety is provided for persons who may be present in the turbine at the outbreak of a fire. Further the extinguishing agent should cause as little damage to components as possible.
• Personnel Safety Training in how to act in emergency situations as well as to learn how to act on the sea shall be mandatory through education and courses. The highest degree of autonomy should be achieved for the staff entering an offshore wind turbine. As a safety precaution offshore wind turbines should be fitted with a survival accommodation equipped with consumables, means of communication etc. to and extent and amount that enables the service staff and/or distressed persons at the sea to survive for a limited period. The safety equipment employed during an offshore project shall at all times be adequately supplied and maintained. The equipment shall comply with the international requirements as well as applicable national requirements, which may be set by the authorities, under which the subject project is governed. A Project specific plan should be prepared for evacuation of personnel in case of accidents.

JOR3-CT98-0284 OWTES
60
Safety manual including safety instructions shall be available in each turbine. The manual shall be prepared specifically for each site. The operating organisation shall be responsible for maintenance and updating of the manuals.
• Safety during installation Thorough risk analysis shall be carried out for all offshore operations. Plans for stowage, lashing and securing of the main components shall be prepared for the offshore transportation. The plans shall be supported with calculations of motion forces to verify the lashing and securing plan. Vessels for installation and service shall be adequately equipped for their purpose and have sufficient power to navigate safely in unexpected weather conditions. Description of all operations reduces the risk of accidents. Consequently extreme focus shall be set on the safety with a view to reduce the number of accidents. Prior to start up of offshore installations it should be ensured that a suitable weather window is expected available so that operations, once initiated, can safely be completed within a period of acceptable weather conditions.
• Navigation and Aviation Safety Presently the AIS protocol does not serve the purpose of marking an area of a wind farm. Stakeholders will therefore have to approach the relevant organisations if interest therefore can be established. By January 2003 the AIS protocol only supports ships as single point (X,Y) coordinates. A specification implemented for an irregular object should be amended to the protocol. Two levels of legislation have to be observed:
− National (Country dependent) − International (Depending on the internal laws at sea defined by: IALA)
The AIS protocol should be worked out in such a way, that ships also inform their displacement (to be investigated). In the case of a ship approaching a wind farm, the handling authority will become able to evaluate the possible damages and their magnitude in the case that the ship collides with the wind farm. Further it will become possible to determine the requirement for assistance by tug boats and emergency assistance. Further the AIS marking of an offshore wind farm should be made in such a way, that the area of the wind farm is plotted in the electronic sea chart (to be investigated), which is a part of the AIS system. Locating an AIS unit at the wind farm should consequently not be required. AIS shall – according to the approach described here - be placed at national coast stations. Ships approaching a wind farm, which is electronically plotted will receive a warning thereof.
During preparation of projects for customers in different countries it has been noted, that national requirements to warning lights and other signals for navigation and aviation are widely different. Introduction of common international regulations for navigation and aviation warnings and marking would be desirable. Uniform regulations would not only ease the design of safety appliances for offshore wind turbines, but would also reduce the risk of mistakes by navigators and pilots. 8.3 Summary The present uncertainties concerning design drivers for wind turbines installed at offshore sites such as parts of the North Sea having severe environmental conditions have caused the

FINAL REPORT
61
need to collect knowledge concerning the actual environmental impacts in order to compare these with the existing design basis for offshore wind turbines. Actual measured environmental loads obtained through strain gauges fitted to the structure of one of the Blyth turbines combined with wind, waves and current measurements have been compared with the applied design loads for the turbines. During the interviews with persons representing all activities involved in designing, construction and operation of offshore wind turbines a large number of potential improvements to the design of offshore wind turbines have been identified. Further it has been envisaged that there is a strong need for improvements of procedures and organising of an offshore wind farm project from start-up to completion. A number of areas of the design process for offshore wind turbines have been identified as requiring improvements. These include approval procedures, project organisation, foundation design, corrosion protection, control and monitoring, quality, personnel safety, navigational safety, mechanical and electrical design.

JOR3-CT98-0284 OWTES
62
9 CONCLUDING REMARKS The OWTES project has contributed to the understanding of the design requirements for offshore wind turbines in a number of important areas. Of particular value has been the creation of a database of measurements from one of the first offshore wind turbines to be exposed to North Sea wind and wave conditions. This database has provided an important input into many of the other tasks undertaken within the OWTES project and will be used by other researchers in the future. Many aspects of the turbine design process have been considered, including modelling techniques for the foundation, hydrodynamic loading, the flexible support structure and the wind turbine machinery. The very coupled nature of these systems has been revealed by many of the studies and hence the development of software tools which correctly combine these several systems into one dynamic model is critical to achieving an optimised design. The project has included the verification and enhancement of several of these tools. The scope of the project has included a wide range of engineering disciplines. At the most theoretical, the project has included studies of mathematical models of wave kinematics and representations of the structural dynamics. At the most practical, important conclusions on the aspects of the design process that require further development have been gathered from the designers of the Blyth offshore wind farm and the Horns Rev wind farm. With many offshore wind farms currently planned for development in the North Sea and other European seas, many at deeper water sites than existing projects, the conclusions of the OWTES project have many immediate applications.

FINAL REPORT
63
10 DELIVERABLE REPORTS In addition to this final report and the various periodic progress reports, the following technical reports have been prepared as deliverables of this project:
• Data Collection Requirements, GH document no. 2317/BS/01, January 2002.
• Site Environmental Conditions, GH document no. 2317/BR/14, July 2003
• Measured Fatigue and Extreme Loads, GH document no. 2317/BR/15, July 2003
• Verification of Design Tools, GH document no. 2317/BR/16, July 2003.
• Description of Blyth V66 Turbine and Support Structure, GH document no. 2317/BR/18, May 2003.
• Measured Dynamic Characteristics, GH document no. 2317/BR/19, May 2003.
• Description of Database of Measurements, GH document no. 2317/BR/20, July 2003.
• Description of the Measurement System, GH document no. 2317/BR/21, May 2003.
• Terminology, Reference Systems and Conventions, DUT document no. DUWIND
2001.004.
• Sensitivity Analysis for Foundations of Offshore Wind Turbines, DUT document no. WE 02181, March 2002.
• Hydrodynamic Loading on Offshore Wind Turbines, DUT document no DUWIND
2003.025, March 2003.
• Robustness of Design Load Calculations for Offshore Wind Turbines, DUT document no. DUWIND 2003.026, April 2003
• Recommendations for Design of Offshore Wind Turbines, Vestas document, July
2003.
• Review of Certification Rules, Germainscher Lloyd, August 2003. There have been many conference presentations and conference papers resulting from the work and results of the project.

JOR3-CT98-0284 OWTES
64
REFERENCES 3.1 Morris, M. J., “OWTES: Description of the measurement system,” GH report
2317/BR/21, Issue A, 25th July 2003.
3.2 Camp, T. R., et al, “Load measurements on a 2MW offshore wind turbine in the North Sea,” Proceedings of the EWEA conference, Paris, 2-5 April 2002.
4.1 IEC International standard IEC 61400-1, Wind turbine generator systems – Part 1: Safety Requirements, Draft 3rd edition 2003.
4.2 Germanischer Lloyd Rules and Guidelines 2000, IV – Non-marine Technology, Part 1 – Wind Energy, and Part 2 – Offshore Wind Energy.
4.3 ESDU Data item 85020, “Characteristics of atmospheric turbulence near the ground,” October 1985, amended 1993.
4.4 Houmb O.G. and Overik T.. ‘Parameterization of wave spectra and the long term joint distribution of wave height and period’. BOSS 1979, Vol. 1, Trondheim.
4.5 Veldkamp D. and Camp T.R.. ‘Influence of wave modelling on the prediction of fatigue and extreme loads for offshore wind turbines’. Proceedings of EWEA conference, Madrid, 16-19 June 2003.
5.1 Evans, B., “OWTES: Measured fatigue and extreme loads,” GH report 2317/BR/15 Issue A, 11 July 2003.
5.2 Engineering Sciences Data Unit, “Characteristics of atmospheric turbulence near the ground. Part II: Single point data for strong winds (neutral atmosphere)”, ESDU 85020, 1985 (amended 1993).
5.3 Barltrop, N. D. P., and Adams, A. J., “Dynamics of Fixed Marine Structures,” Pub. Butterworth Heinemann, 3rd edition, 1991.
6.1 API, “RP 2A-LRFD: API Recommended Practices for Planning, Designing and Constructing Fixed Offshore Platforms – Load and Resistance Factor Design,” First Edition, July 1, 1993.
6.2 Barltrop, N.D.P., Adams, A.J., “Dynamics of Fixed Marine Structures,” Butterworth-Heinemann Ltd, Oxford, 1991.
6.3 Kay, S.; Kraan, M. van der, “Geotechnical Data and Analysis - Stage 1, Offshore Wind Turbines at Exposed Sites, North Sea,” Fugro Engineers B.V., Leidschendam, October 2000.
6.4 Kouwenhoven, H.J.; Topper, A.M.; Sande, A.M.C. van de, “Windfarm “Lely”, the First Off-shore Windfarm in the Netherlands,” Proceedings of the 5th European Wind Energy Association Conference and Exhibition, Thessaloniki, Greece, October 1994.
6.5 Kühn, M., “Dynamics and Design Optimisation of Offshore Wind Wind Energy Conversion Systems,” PhD thesis, Delft University of Technology, Delft, 2001.
6.6 Randolph, M.F., “The Response of Flexible Piles to Lateral Loading,” Géotechnique, Vol. 31, no. 2, pp 247-259, 1981.
6.7 Wekken, A.J.P. van der, “Frequency Measurements Nedwind 40 Wind Turbines of Wind Farm Lely,” ECN, Petten, October 1995, (Confidential).
6.8 Zaaijer, M.B., “Foundation models for the dynamic response of offshore wind turbines,” Proceedings of MAREC 2002, Newcastle, UK, September 2002.

FINAL REPORT
65
6.9 Zaaijer, M.B., et al, “Design methods for offshore wind turbines at exposed sites (OWTES) - Sensitivity analysis for foundations of offshore wind turbines,” Section Wind Energy, WE 02181, Delft, March 2000.
6.10 Zaaijer, M.B., Vugts, J.H., “Sensitivity of Dynamics of Fixed Offshore Support Structures to Foundation and Soil Properties,” Proceedings of the European Wind Energy Conference and Exhibition 2001, Copenhagen, Denmark, July 2001.
6.11 Henderson, A.R., “Hydrodynamic Loading on Offshore Wind Turbines – OWTES task 4.2 report,” March 2003.
6.12 Henderson, A.R., Camp, T.R., “Hydrodynamic Loading of Offshore Wind Turbines,” Proceedings of the EWEA conference, Copenhagen, 2001.
6.13 Cheng P., W., “Reliability based method applied to extreme response of an Offshore Wind Turbine,” PhD. Thesis, TUDelft, 2002.
6.14 Chakrabarti, S.K., “Hydrodynamics of Offshore Structures”, WIT Press, ISBN 0-905451-66-X, 1991.
6.15 API, RP 2A-LRFD, “API Recommended Practices for Planning, Designing and Constructing Fixed Offshore Platforms – Load and Resistance Factor Design,” 20th Edition, American Petroleum Institute, 1 July 1993.
6.16 Alkyon Hydraulic Consultancy & Research, “Overview on Ice loading (OWEC Tool II project),” March 2003.
6.17 API, “Recommended Practice for Planning, Designing, and Constructing Structures and Pipelines for Arctic Conditions,” API RP 2N, 1995.
6.18 IEC 61400-03, “Wind turbine Generator Systems, Part 1 edt. 2. Wind turbine safety and design, part 3: Safety requirements for offshore wind turbines.”
7.1 Germanischer Lloyd, “Regulation for the Certification of Offshore Wind Energy Converter Systems,” Hamburg 1995.
7.2 Matthies et al, “Study of Offshore Wind Energy in the EC JOULE I (JOUR 0072)”, Verlag Natürliche Energie 1995.
7.3 Germanischer Lloyd, “Regulation for the Certification of Wind Energy Conversion Systems,” Hamburg, 1999.
7.4 Germanischer Lloyd, “Rules for Classification and Construction - Offshore Technology, Part 2 Offshore Installations,” Hamburg, 1999.
7.5 CD ISO 19901-1 “Petroleum and natural gas industries — Specific requirements for offshore structures — Part 1: Metocean design and operating conditions”
7.6 E. Bouws, H. Günther, W. Rosenthal, C.L. Vincent, “Similarity of the Wind Wave Spectrum in Finite Depth Water,” Journal of Geophysical Research, vol.90, 1985.