Embed Size (px)
Citation preview

design is at the heart of everything we do.
ANNUAL REPORT AND FINANCIAL STATEMENTS 2017
IG D
ESIGN
GRO
UP PLC
AN
NUA
L REPORT A
ND
FINA
NCIA
L STATEM
ENTS 2017
We transform paper and a whole lot more into products that help celebrate life’s special occasions and turn them into memories.
We are proud to serve the best retailers around the globe with a complete end-to-end service from design to distribution.
We are IG Design Group plc
1 billionstickers
FUN FACT
Last year we sold almost
Enough to cover the London Gherkin many times over
1 billionstickers
FUN FACT
Last year we sold almost
Enough to cover the London Gherkin many times over
IG Design Group plcAnnual report and financial statements 2017
Overview
01
What’s inside
OverviewA summary of the Company’s progress and highlights of our performance for 2016/17.
GovernanceInformation on how the Company is governed and activities of the Board.
Strategic reportA review of the Company’s strategy with a more detailed look at activity during the financial year together with its risk management.
Financials – GroupThe Group financial statements and comprehensive notes covering the year ended 31 March 2017.
Financials – CompanyThe Company financial statements and comprehensive notes covering the year ended 31 March 2017.
Additional information
02 Our figures
03 Operational highlights
32 Board of Directors
34 Chairman’s corporate governance review
37 Directors’ remuneration report
42 Directors’ report
44 Statement of Directors’ responsibilities
04 Chief Executive Officer’s review
12 Where we operate
14 Business model
16 Our strategy
18 Financial review
27 Risk management
30 Corporate, social and environmental responsibility
45 Independent auditor’s report
46 Consolidated income statement
47 Consolidated statement of comprehensive income
48 Consolidated statement of changes in equity
49 Consolidated balance sheet
50 Consolidated cash flow statement
51 Notes to the consolidated financial statements
89 Company balance sheet
90 Company statement of changes in equity
91 Company cash flow statement
92 Notes to the Company financial statements
103 Advisers
IG Design Group plcAnnual report and financial statements 2017
02
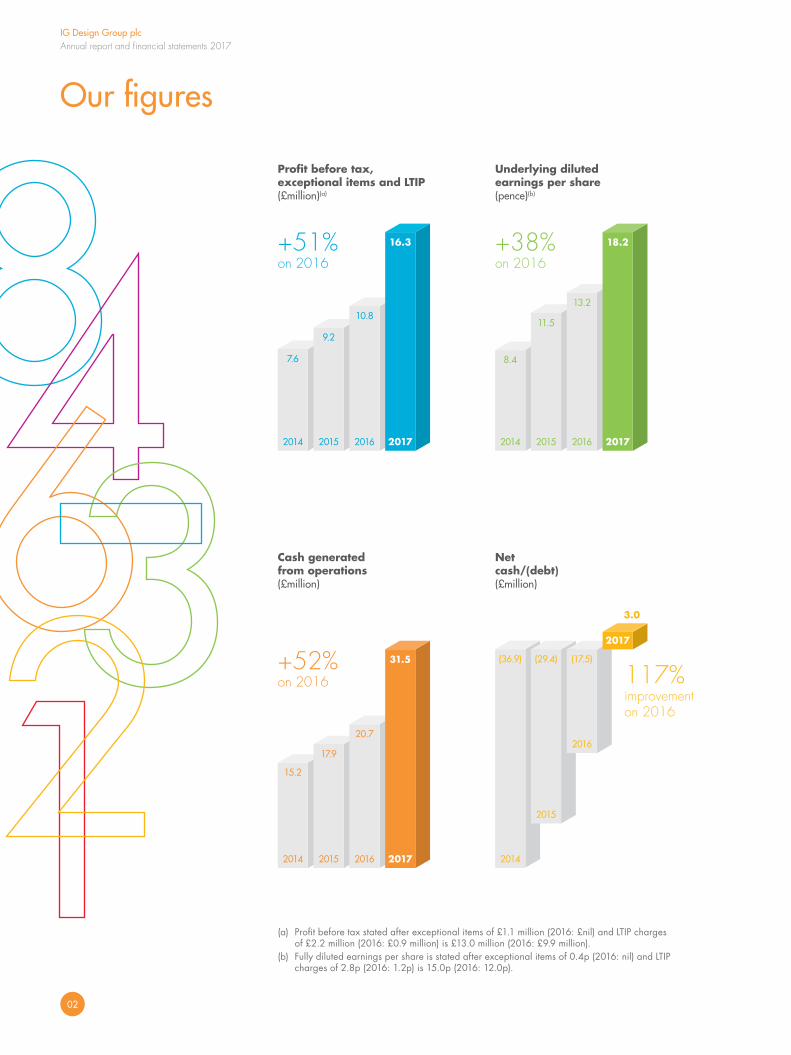
Our figures
2014 2015 2016 2017
7.6
9.2
10.8
16.3
2014 2015 2016 2017
15.2
17.9
20.7
31.5
2014 2015 2016 2017
8.4
11.5
13.2
18.2
2014
2015
2016
2017
(36.9) (29.4) (17.5)
3.0
Profit before tax, exceptional items and LTIP(£million)(a)
Cash generated from operations (£million)
Underlying diluted earnings per share (pence)(b)
Net cash/(debt) (£million)
(a) Profit before tax stated after exceptional items of £1.1 million (2016: £nil) and LTIP charges of £2.2 million (2016: £0.9 million) is £13.0 million (2016: £9.9 million).
(b) Fully diluted earnings per share is stated after exceptional items of 0.4p (2016: nil) and LTIP charges of 2.8p (2016: 1.2p) is 15.0p (2016: 12.0p).
+51% on 2016
+52% on 2016
+38% on 2016
117% improvement on 2016
IG Design Group plcAnnual report and financial statements 2017
Overview
03
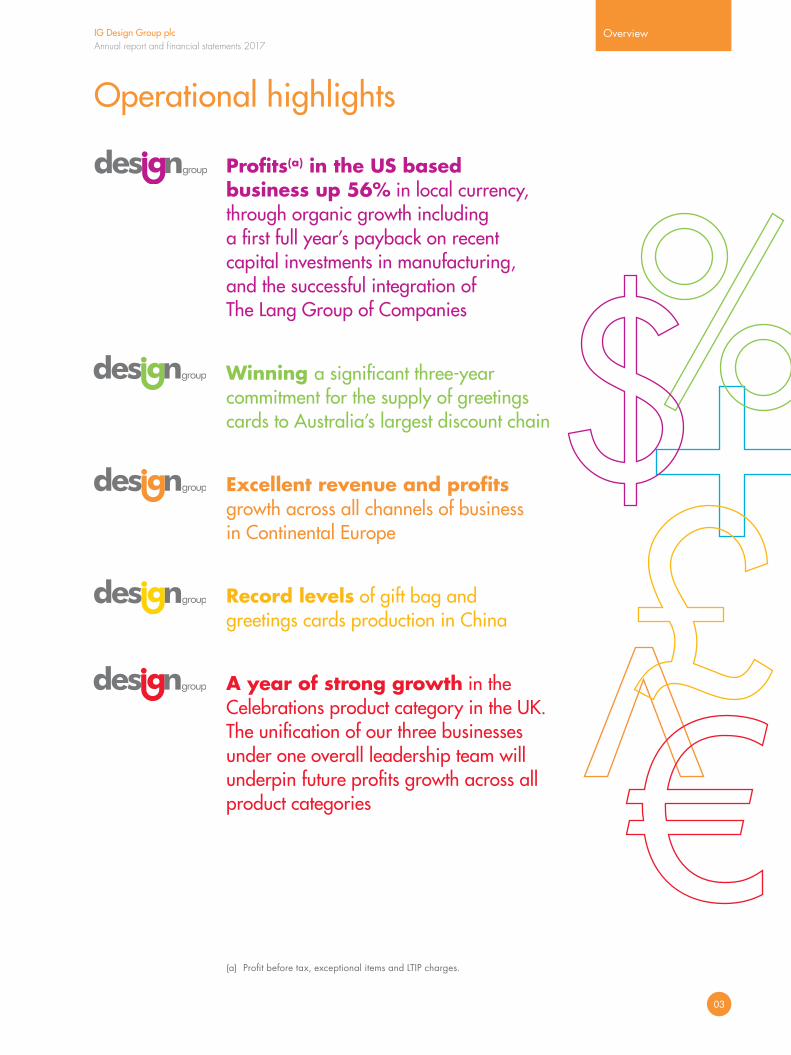
Operational highlights
(a) Profit before tax, exceptional items and LTIP charges.
Profits(a) in the US based business up 56% in local currency, through organic growth including a first full year’s payback on recent capital investments in manufacturing, and the successful integration of The Lang Group of Companies
Winning a significant three-year commitment for the supply of greetings cards to Australia’s largest discount chain
Excellent revenue and profits growth across all channels of business in Continental Europe
Record levels of gift bag and greetings cards production in China
A year of strong growth in the Celebrations product category in the UK. The unification of our three businesses under one overall leadership team will underpin future profits growth across all product categories
IG Design Group plcAnnual report and financial statements 2017
04
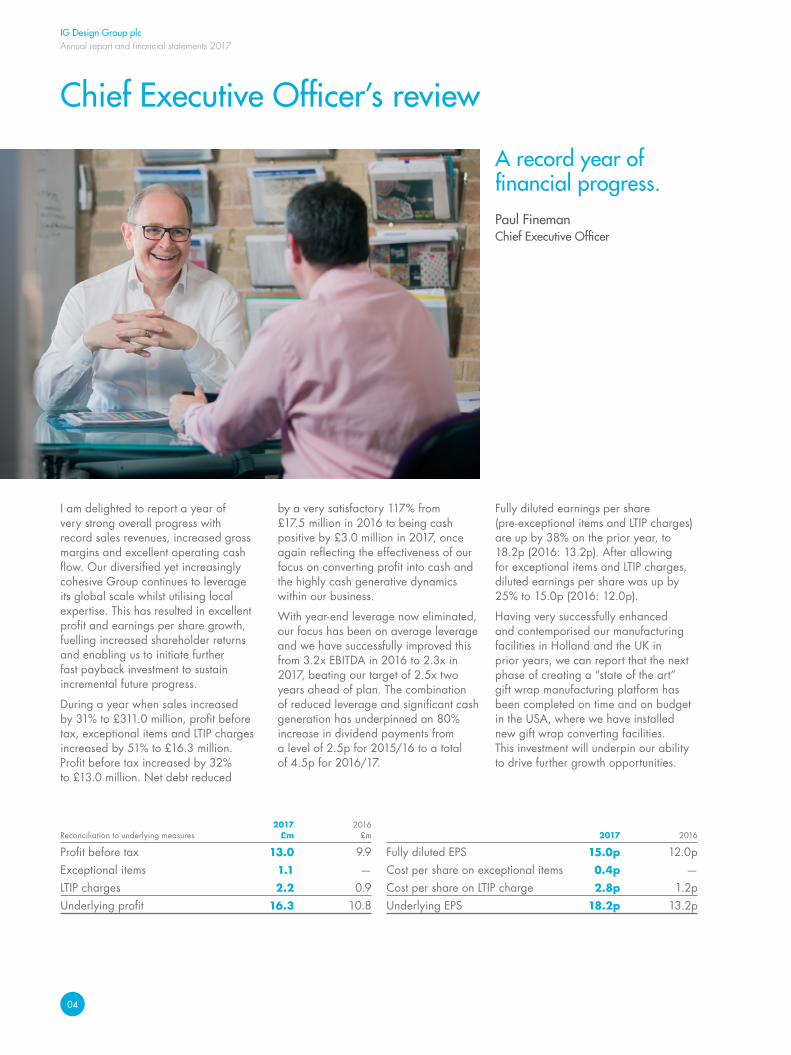
Chief Executive Officer’s review
I am delighted to report a year of very strong overall progress with record sales revenues, increased gross margins and excellent operating cash flow. Our diversified yet increasingly cohesive Group continues to leverage its global scale whilst utilising local expertise. This has resulted in excellent profit and earnings per share growth, fuelling increased shareholder returns and enabling us to initiate further fast payback investment to sustain incremental future progress.
During a year when sales increased by 31% to £311.0 million, profit before tax, exceptional items and LTIP charges increased by 51% to £16.3 million. Profit before tax increased by 32% to £13.0 million. Net debt reduced
by a very satisfactory 117% from £17.5 million in 2016 to being cash positive by £3.0 million in 2017, once again reflecting the effectiveness of our focus on converting profit into cash and the highly cash generative dynamics within our business.
With year-end leverage now eliminated, our focus has been on average leverage and we have successfully improved this from 3.2x EBITDA in 2016 to 2.3x in 2017, beating our target of 2.5x two years ahead of plan. The combination of reduced leverage and significant cash generation has underpinned an 80% increase in dividend payments from a level of 2.5p for 2015/16 to a total of 4.5p for 2016/17.
Fully diluted earnings per share (pre-exceptional items and LTIP charges) are up by 38% on the prior year, to 18.2p (2016: 13.2p). After allowing for exceptional items and LTIP charges, diluted earnings per share was up by 25% to 15.0p (2016: 12.0p).
Having very successfully enhanced and contemporised our manufacturing facilities in Holland and the UK in prior years, we can report that the next phase of creating a “state of the art” gift wrap manufacturing platform has been completed on time and on budget in the USA, where we have installed new gift wrap converting facilities. This investment will underpin our ability to drive further growth opportunities.
A record year of financial progress.Paul FinemanChief Executive Officer
2017 2016 Reconciliation to underlying measures £m £m
Profit before tax 13.0 9.9Exceptional items 1.1 —LTIP charges 2.2 0.9Underlying profit 16.3 10.8
2017 2016
Fully diluted EPS 15.0p 12.0pCost per share on exceptional items 0.4p —Cost per share on LTIP charge 2.8p 1.2pUnderlying EPS 18.2p 13.2p
FUN FACT
Last year we sold almost
1 billionmetres of gift wrap
That’s enough to go from Earth to the Moon and back
IG Design Group plcAnnual report and financial statements 2017
06
Chief Executive Officer’s reviewcontinued
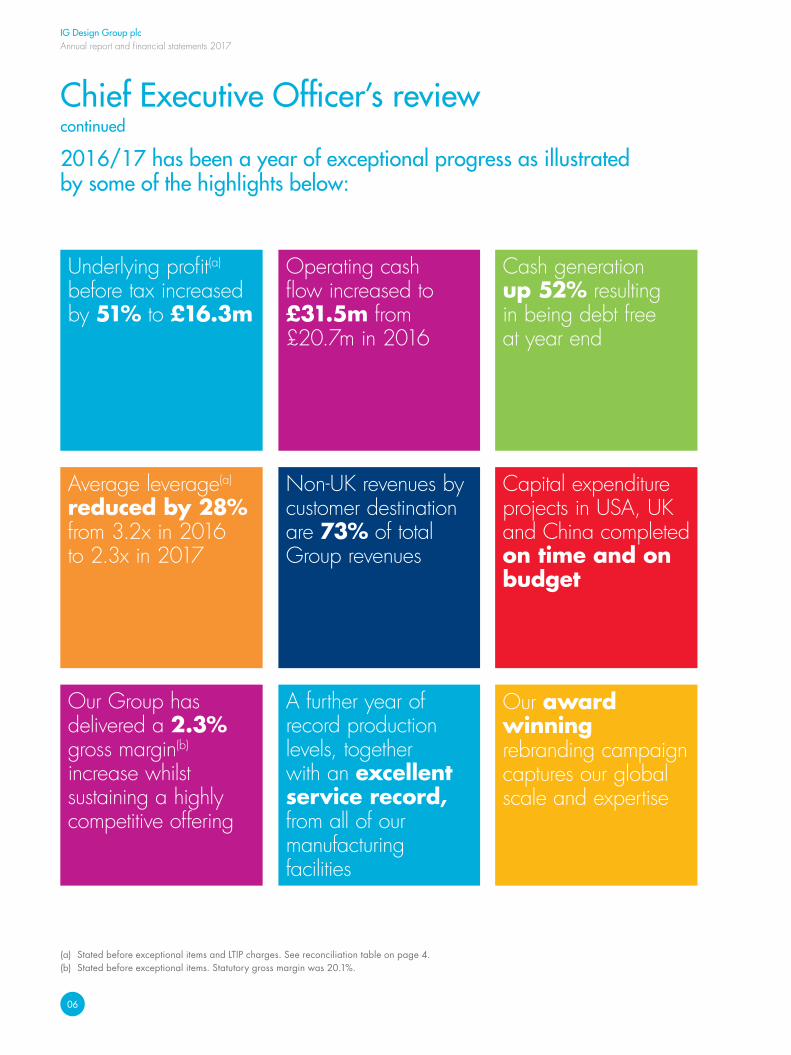
2016/17 has been a year of exceptional progress as illustrated by some of the highlights below:
Underlying profit(a) before tax increased by 51% to £16.3m
Average leverage(a)
reduced by 28% from 3.2x in 2016 to 2.3x in 2017
Our Group has delivered a 2.3% gross margin(b) increase whilst sustaining a highly competitive offering
Operating cash flow increased to £31.5m from £20.7m in 2016
Non‑UK revenues by customer destination are 73% of total Group revenues
A further year of record production levels, together with an excellent service record, from all of our manufacturing facilities
Cash generation up 52% resulting in being debt free at year end
Capital expenditure projects in USA, UK and China completed on time and on budget
Our award winning rebranding campaign captures our global scale and expertise
(a) Stated before exceptional items and LTIP charges. See reconciliation table on page 4.(b) Stated before exceptional items. Statutory gross margin was 20.1%.
IG Design Group plcAnnual report and financial statements 2017
Strategic report
07
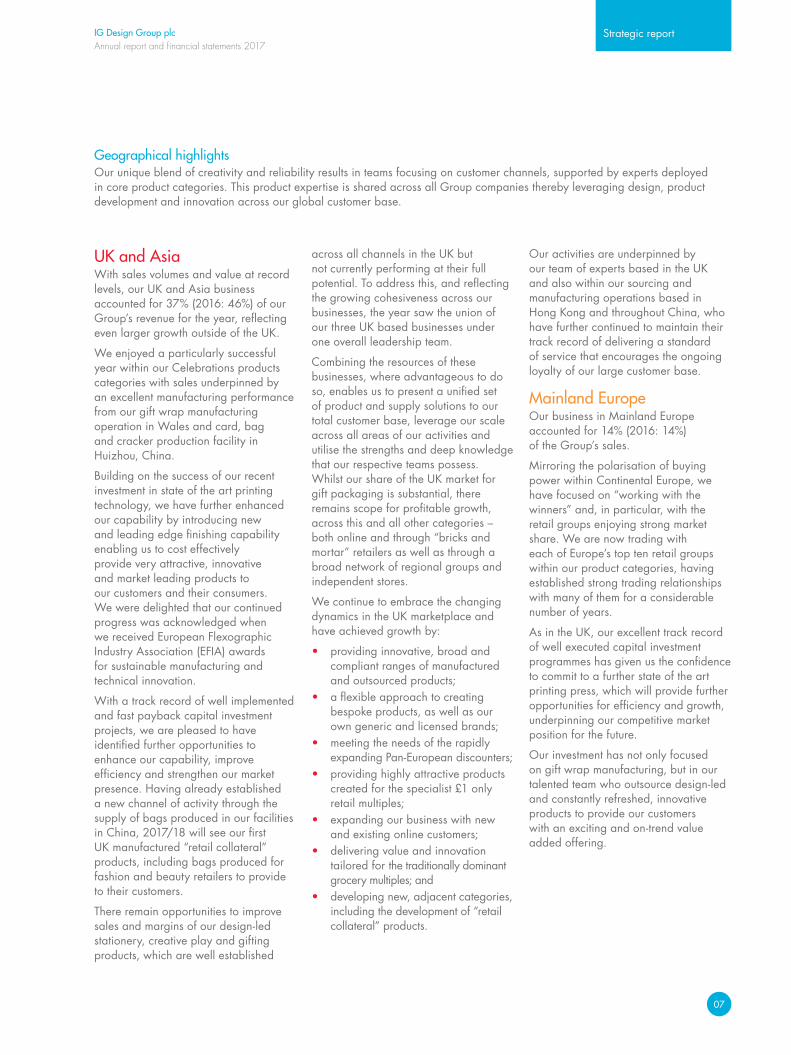
UK and AsiaWith sales volumes and value at record levels, our UK and Asia business accounted for 37% (2016: 46%) of our Group’s revenue for the year, reflecting even larger growth outside of the UK.
We enjoyed a particularly successful year within our Celebrations products categories with sales underpinned by an excellent manufacturing performance from our gift wrap manufacturing operation in Wales and card, bag and cracker production facility in Huizhou, China.
Building on the success of our recent investment in state of the art printing technology, we have further enhanced our capability by introducing new and leading edge finishing capability enabling us to cost effectively provide very attractive, innovative and market leading products to our customers and their consumers. We were delighted that our continued progress was acknowledged when we received European Flexographic Industry Association (EFIA) awards for sustainable manufacturing and technical innovation.
With a track record of well implemented and fast payback capital investment projects, we are pleased to have identified further opportunities to enhance our capability, improve efficiency and strengthen our market presence. Having already established a new channel of activity through the supply of bags produced in our facilities in China, 2017/18 will see our first UK manufactured “retail collateral” products, including bags produced for fashion and beauty retailers to provide to their customers.
There remain opportunities to improve sales and margins of our design-led stationery, creative play and gifting products, which are well established
across all channels in the UK but not currently performing at their full potential. To address this, and reflecting the growing cohesiveness across our businesses, the year saw the union of our three UK based businesses under one overall leadership team.
Combining the resources of these businesses, where advantageous to do so, enables us to present a unified set of product and supply solutions to our total customer base, leverage our scale across all areas of our activities and utilise the strengths and deep knowledge that our respective teams possess. Whilst our share of the UK market for gift packaging is substantial, there remains scope for profitable growth, across this and all other categories – both online and through “bricks and mortar” retailers as well as through a broad network of regional groups and independent stores.
We continue to embrace the changing dynamics in the UK marketplace and have achieved growth by:
• providing innovative, broad and compliant ranges of manufactured and outsourced products;
• a flexible approach to creating bespoke products, as well as our own generic and licensed brands;
• meeting the needs of the rapidly expanding Pan-European discounters;
• providing highly attractive products created for the specialist £1 only retail multiples;
• expanding our business with new and existing online customers;
• delivering value and innovation tailored for the traditionally dominant grocery multiples; and
• developing new, adjacent categories, including the development of “retail collateral” products.
Our activities are underpinned by our team of experts based in the UK and also within our sourcing and manufacturing operations based in Hong Kong and throughout China, who have further continued to maintain their track record of delivering a standard of service that encourages the ongoing loyalty of our large customer base.
Mainland Europe Our business in Mainland Europe accounted for 14% (2016: 14%) of the Group’s sales.
Mirroring the polarisation of buying power within Continental Europe, we have focused on “working with the winners” and, in particular, with the retail groups enjoying strong market share. We are now trading with each of Europe’s top ten retail groups within our product categories, having established strong trading relationships with many of them for a considerable number of years.
As in the UK, our excellent track record of well executed capital investment programmes has given us the confidence to commit to a further state of the art printing press, which will provide further opportunities for efficiency and growth, underpinning our competitive market position for the future.
Our investment has not only focused on gift wrap manufacturing, but in our talented team who outsource design-led and constantly refreshed, innovative products to provide our customers with an exciting and on-trend value added offering.
Geographical highlightsOur unique blend of creativity and reliability results in teams focusing on customer channels, supported by experts deployed in core product categories. This product expertise is shared across all Group companies thereby leveraging design, product development and innovation across our global customer base.
IG Design Group plcAnnual report and financial statements 2017
08
Chief Executive Officer’s reviewcontinued
We were especially pleased to sustain double-digit growth momentum in Poland and Slovakia, underpinned by our strong trading partnerships with those major retail groups in Western Europe who have expanded into these fast growing markets in central Europe, as well as with local companies.
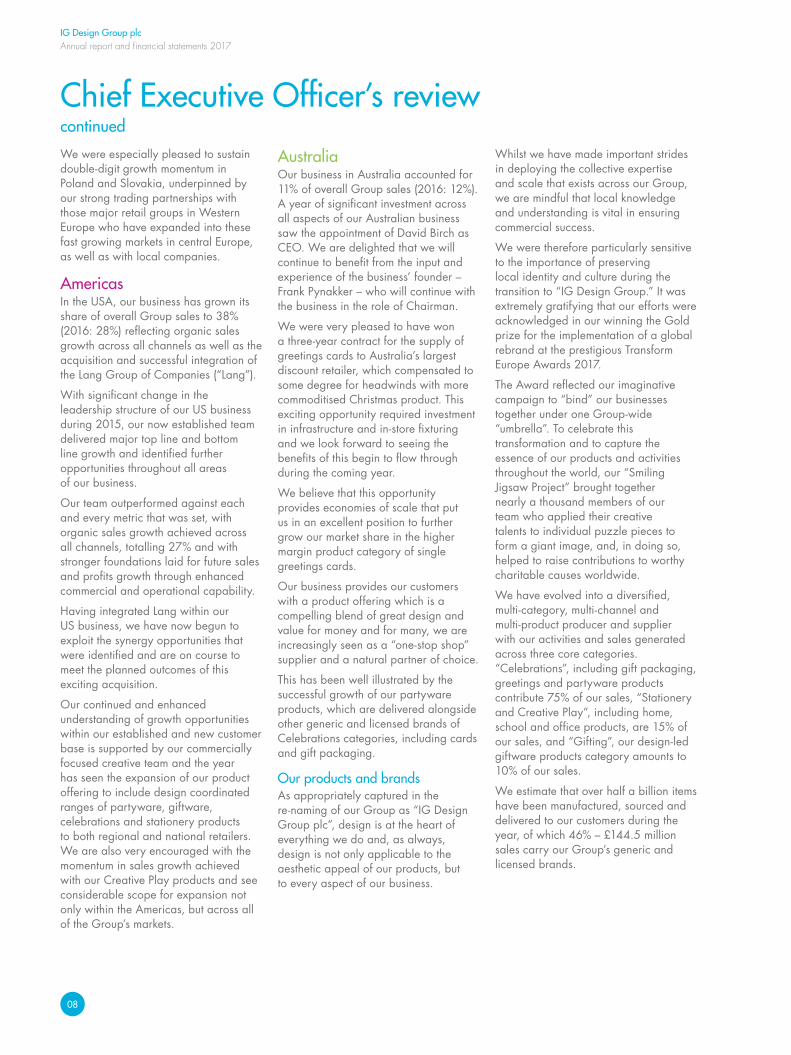
Americas In the USA, our business has grown its share of overall Group sales to 38% (2016: 28%) reflecting organic sales growth across all channels as well as the acquisition and successful integration of the Lang Group of Companies (“Lang”).
With significant change in the leadership structure of our US business during 2015, our now established team delivered major top line and bottom line growth and identified further opportunities throughout all areas of our business.
Our team outperformed against each and every metric that was set, with organic sales growth achieved across all channels, totalling 27% and with stronger foundations laid for future sales and profits growth through enhanced commercial and operational capability.
Having integrated Lang within our US business, we have now begun to exploit the synergy opportunities that were identified and are on course to meet the planned outcomes of this exciting acquisition.
Our continued and enhanced understanding of growth opportunities within our established and new customer base is supported by our commercially focused creative team and the year has seen the expansion of our product offering to include design coordinated ranges of partyware, giftware, celebrations and stationery products to both regional and national retailers. We are also very encouraged with the momentum in sales growth achieved with our Creative Play products and see considerable scope for expansion not only within the Americas, but across all of the Group’s markets.
AustraliaOur business in Australia accounted for 11% of overall Group sales (2016: 12%). A year of significant investment across all aspects of our Australian business saw the appointment of David Birch as CEO. We are delighted that we will continue to benefit from the input and experience of the business’ founder – Frank Pynakker – who will continue with the business in the role of Chairman.
We were very pleased to have won a three-year contract for the supply of greetings cards to Australia’s largest discount retailer, which compensated to some degree for headwinds with more commoditised Christmas product. This exciting opportunity required investment in infrastructure and in-store fixturing and we look forward to seeing the benefits of this begin to flow through during the coming year.
We believe that this opportunity provides economies of scale that put us in an excellent position to further grow our market share in the higher margin product category of single greetings cards.
Our business provides our customers with a product offering which is a compelling blend of great design and value for money and for many, we are increasingly seen as a “one-stop shop” supplier and a natural partner of choice.
This has been well illustrated by the successful growth of our partyware products, which are delivered alongside other generic and licensed brands of Celebrations categories, including cards and gift packaging.
Our products and brands As appropriately captured in the re-naming of our Group as “IG Design Group plc”, design is at the heart of everything we do and, as always, design is not only applicable to the aesthetic appeal of our products, but to every aspect of our business.
Whilst we have made important strides in deploying the collective expertise and scale that exists across our Group, we are mindful that local knowledge and understanding is vital in ensuring commercial success.
We were therefore particularly sensitive to the importance of preserving local identity and culture during the transition to “IG Design Group.” It was extremely gratifying that our efforts were acknowledged in our winning the Gold prize for the implementation of a global rebrand at the prestigious Transform Europe Awards 2017.
The Award reflected our imaginative campaign to “bind” our businesses together under one Group-wide “umbrella”. To celebrate this transformation and to capture the essence of our products and activities throughout the world, our “Smiling Jigsaw Project” brought together nearly a thousand members of our team who applied their creative talents to individual puzzle pieces to form a giant image, and, in doing so, helped to raise contributions to worthy charitable causes worldwide.
We have evolved into a diversified, multi-category, multi-channel and multi-product producer and supplier with our activities and sales generated across three core categories. “Celebrations”, including gift packaging, greetings and partyware products contribute 75% of our sales, “Stationery and Creative Play”, including home, school and office products, are 15% of our sales, and “Gifting”, our design-led giftware products category amounts to 10% of our sales.
We estimate that over half a billion items have been manufactured, sourced and delivered to our customers during the year, of which 46% – £144.5 million sales carry our Group’s generic and licensed brands.
IG Design Group plcAnnual report and financial statements 2017
Strategic report
9
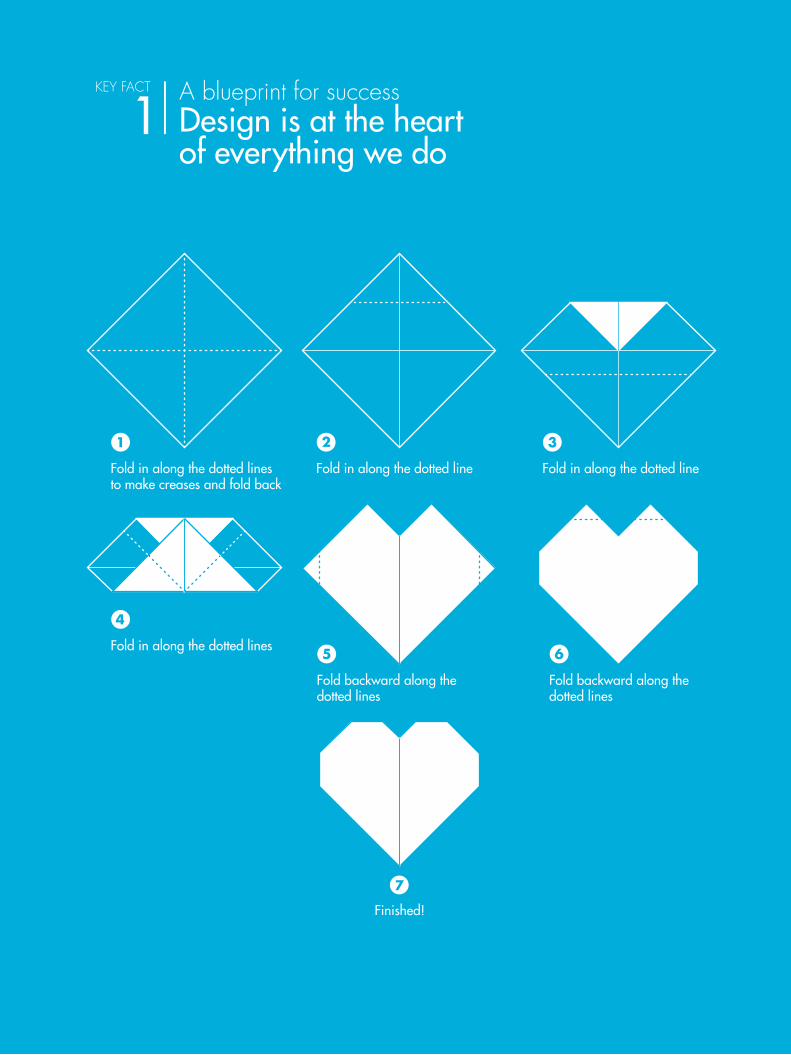
Fold in along the dotted lines to make creases and fold back
Fold in along the dotted lines
Fold backward along the dotted lines
Finished!
Fold backward along the dotted lines
Fold in along the dotted line Fold in along the dotted line
A blueprint for successDesign is at the heart of everything we do
KEY FACT
IG Design Group plcAnnual report and financial statements 2017
10
Design remains the “common thread” that binds
our businesses together. This is reflected in the
significant variety of products that we manufacture and source, all of which are carefully designed to
optimise consumer, customer and commercial appeal.
Paul FinemanChief Executive Officer
IG Design Group plcAnnual report and financial statements 2017
Strategic report
09
Chief Executive Officer’s reviewcontinued
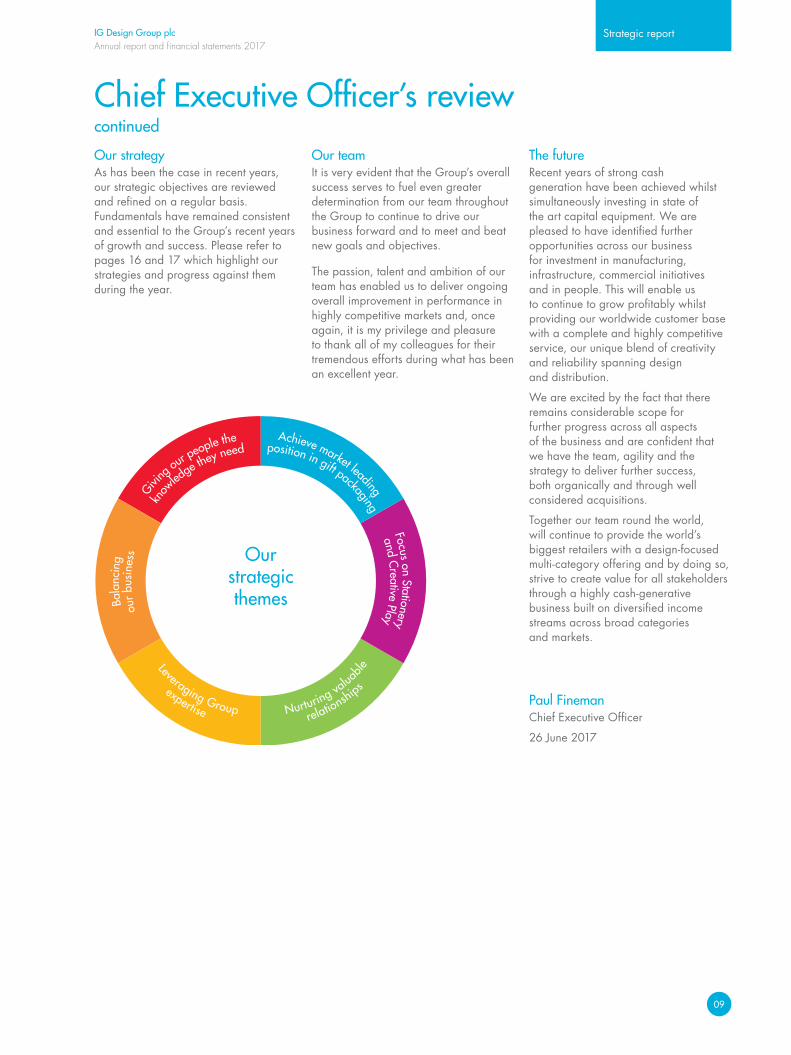
Our strategyAs has been the case in recent years, our strategic objectives are reviewed and refined on a regular basis. Fundamentals have remained consistent and essential to the Group’s recent years of growth and success. Please refer to pages 16 and 17 which highlight our strategies and progress against them during the year.
Our teamIt is very evident that the Group’s overall success serves to fuel even greater determination from our team throughout the Group to continue to drive our business forward and to meet and beat new goals and objectives.
The passion, talent and ambition of our team has enabled us to deliver ongoing overall improvement in performance in highly competitive markets and, once again, it is my privilege and pleasure to thank all of my colleagues for their tremendous efforts during what has been an excellent year.
The futureRecent years of strong cash generation have been achieved whilst simultaneously investing in state of the art capital equipment. We are pleased to have identified further opportunities across our business for investment in manufacturing, infrastructure, commercial initiatives and in people. This will enable us to continue to grow profitably whilst providing our worldwide customer base with a complete and highly competitive service, our unique blend of creativity and reliability spanning design and distribution.
We are excited by the fact that there remains considerable scope for further progress across all aspects of the business and are confident that we have the team, agility and the strategy to deliver further success, both organically and through well considered acquisitions.
Together our team round the world, will continue to provide the world’s biggest retailers with a design-focused multi-category offering and by doing so, strive to create value for all stakeholders through a highly cash-generative business built on diversified income streams across broad categories and markets.
Paul FinemanChief Executive Officer
26 June 2017
know
ledge th
ey need
Givi
ng ou
r people the
our
busi
ness
Bala
ncin
g
Leveraging Group
expertise Nurturing valua
ble
relationships
and Creative Play
Focus on Stationery
position in gift packagingAchieve market leading
Ourstrategic themes
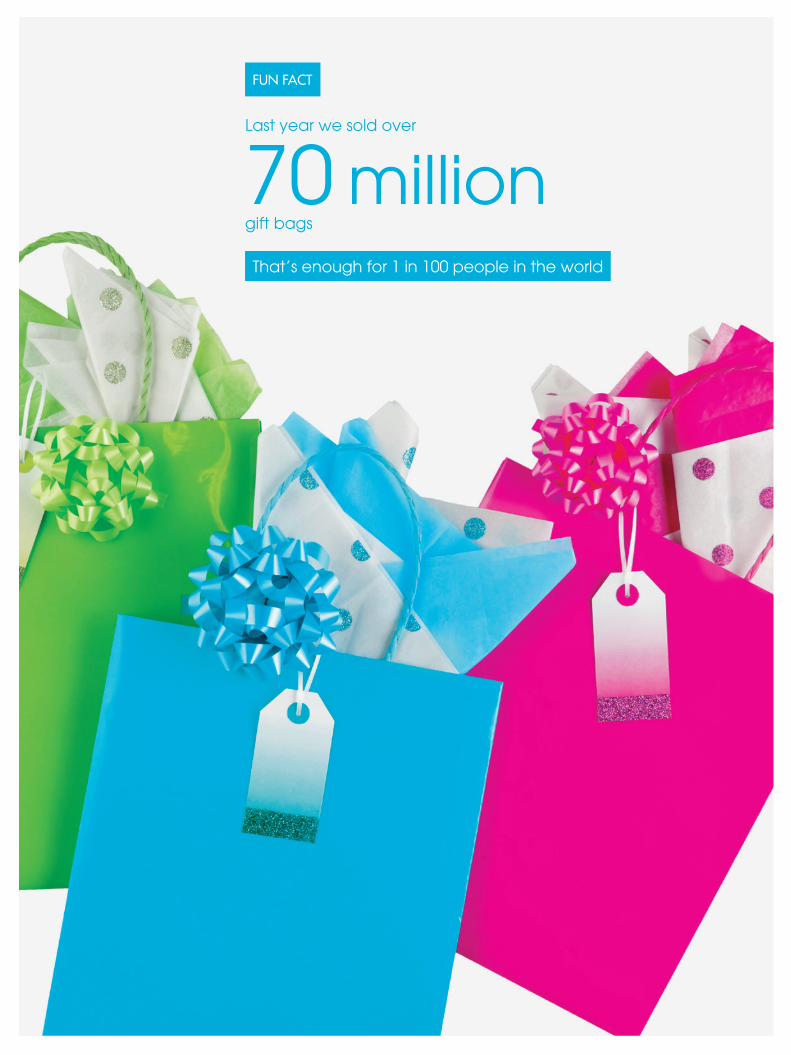
FUN FACT
Last year we sold over
70 milliongift bags
That’s enough for 1 in 100 people in the world
IG Design Group plcAnnual report and financial statements 2017
Strategic report
11
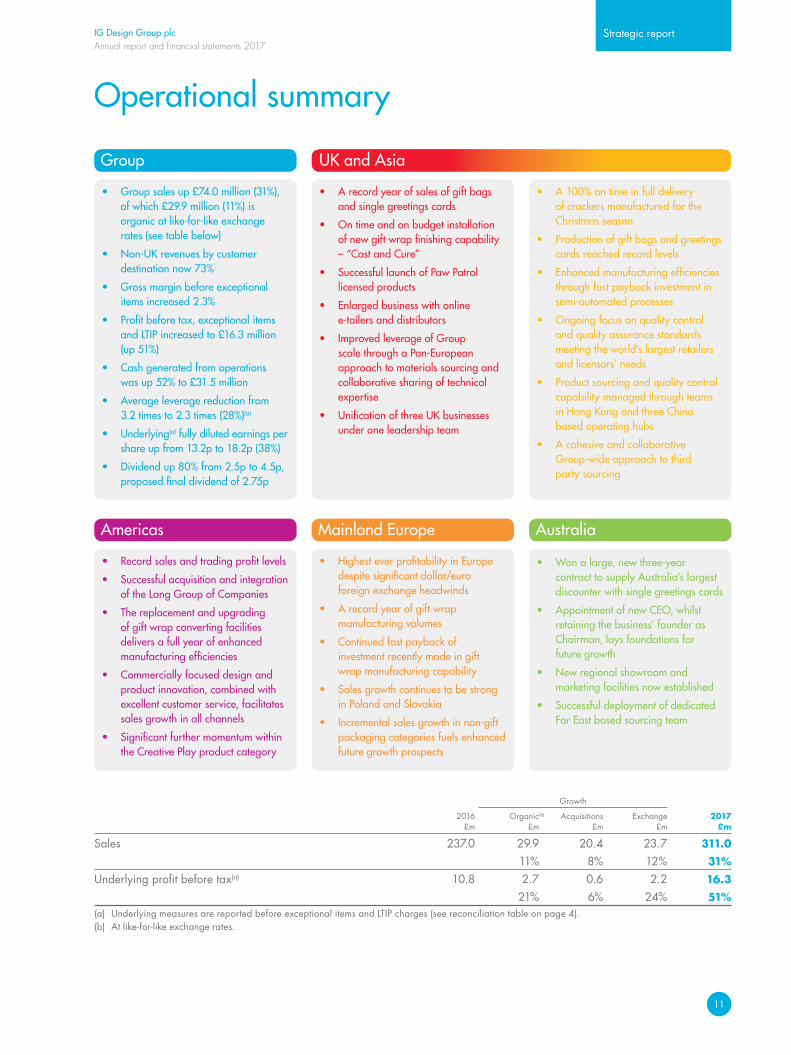
• A record year of sales of gift bags and single greetings cards
• On time and on budget installation of new gift wrap finishing capability – “Cast and Cure”
• Successful launch of Paw Patrol licensed products
• Enlarged business with online e-tailers and distributors
• Improved leverage of Group scale through a Pan-European approach to materials sourcing and collaborative sharing of technical expertise
• Unification of three UK businesses under one leadership team
• A 100% on time in full delivery of crackers manufactured for the Christmas season
• Production of gift bags and greetings cards reached record levels
• Enhanced manufacturing efficiencies through fast payback investment in semi-automated processes
• Ongoing focus on quality control and quality assurance standards meeting the world’s largest retailers and licensors’ needs
• Product sourcing and quality control capability managed through teams in Hong Kong and three China based operating hubs
• A cohesive and collaborative Group-wide approach to third party sourcing
Operational summary
• Record sales and trading profit levels
• Successful acquisition and integration of the Lang Group of Companies
• The replacement and upgrading of gift wrap converting facilities delivers a full year of enhanced manufacturing efficiencies
• Commercially focused design and product innovation, combined with excellent customer service, facilitates sales growth in all channels
• Significant further momentum within the Creative Play product category
Americas
Group
Mainland Europe
• Highest ever profitability in Europe despite significant dollar/euro foreign exchange headwinds
• A record year of gift wrap manufacturing volumes
• Continued fast payback of investment recently made in gift wrap manufacturing capability
• Sales growth continues to be strong in Poland and Slovakia
• Incremental sales growth in non-gift packaging categories fuels enhanced future growth prospects
Australia
• Won a large, new three-year contract to supply Australia’s largest discounter with single greetings cards
• Appointment of new CEO, whilst retaining the business’ founder as Chairman, lays foundations for future growth
• New regional showroom and marketing facilities now established
• Successful deployment of dedicated Far East based sourcing team
• Group sales up £74.0 million (31%), of which £29.9 million (11%) is organic at like-for-like exchange rates (see table below)
• Non-UK revenues by customer destination now 73%
• Gross margin before exceptional items increased 2.3%
• Profit before tax, exceptional items and LTIP increased to £16.3 million (up 51%)
• Cash generated from operations was up 52% to £31.5 million
• Average leverage reduction from 3.2 times to 2.3 times (28%)(a)
• Underlying(a) fully diluted earnings per share up from 13.2p to 18.2p (38%)
• Dividend up 80% from 2.5p to 4.5p, proposed final dividend of 2.75p
UK and Asia
Growth
2016 Organic(b) Acquisitions Exchange 2017 £m £m £m £m £m
Sales 237.0 29.9 20.4 23.7 311.0
11% 8% 12% 31%
Underlying profit before tax(a) 10.8 2.7 0.6 2.2 16.3
21% 6% 24% 51%(a) Underlying measures are reported before exceptional items and LTIP charges (see reconciliation table on page 4).(b) At like-for-like exchange rates.
IG Design Group plcAnnual report and financial statements 2017
12
Where we operate
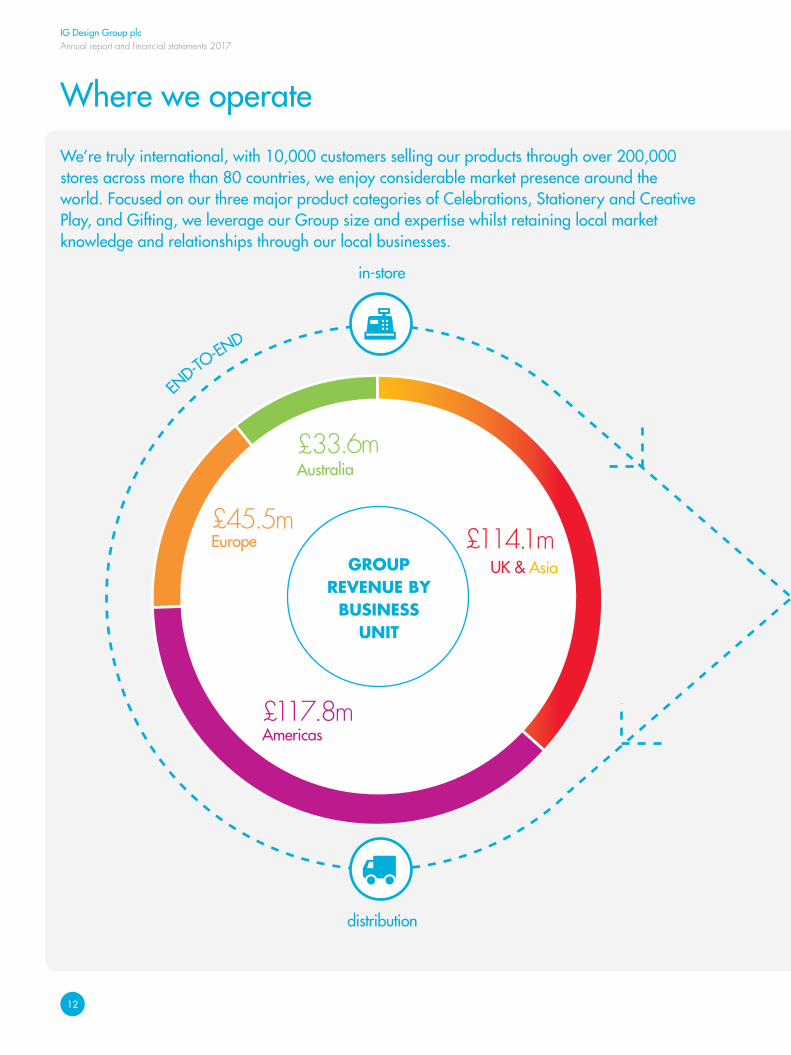
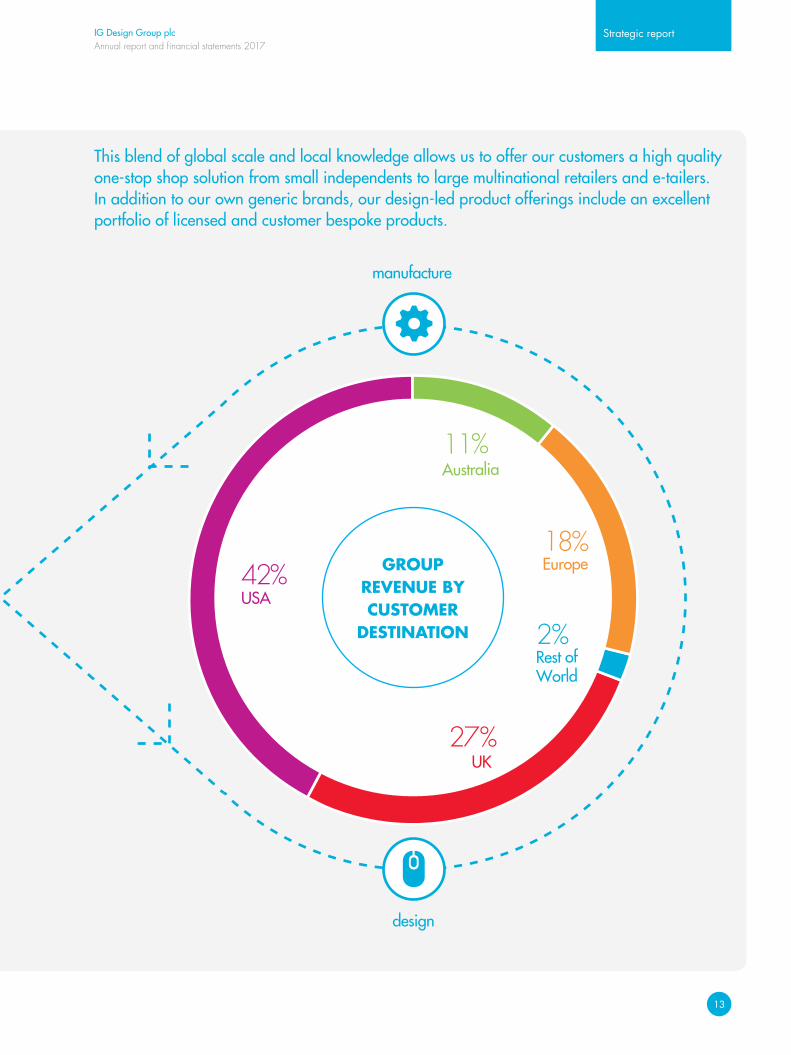
£45.5mEurope 18%
Europe
2%Rest of World
£33.6mAustralia
11%Australia
£114.1mUK & Asia
27%UK
£117.8mAmericas
42%USA
in-store manufacture
distribution design
END-TO
-END
We’re truly international, with 10,000 customers selling our products through over 200,000 stores across more than 80 countries, we enjoy considerable market presence around the world. Focused on our three major product categories of Celebrations, Stationery and Creative Play, and Gifting, we leverage our Group size and expertise whilst retaining local market knowledge and relationships through our local businesses.
GROUP REVENUE BY
BUSINESS UNIT
IG Design Group plcAnnual report and financial statements 2017
Strategic report
13
£45.5mEurope 18%
Europe
2%Rest of World
£33.6mAustralia
11%Australia
£114.1mUK & Asia
27%UK
£117.8mAmericas
42%USA
in-store manufacture
distribution design
END-TO
-END
This blend of global scale and local knowledge allows us to offer our customers a high quality one-stop shop solution from small independents to large multinational retailers and e-tailers. In addition to our own generic brands, our design-led product offerings include an excellent portfolio of licensed and customer bespoke products.
GROUP REVENUE BY CUSTOMER
DESTINATION
IG Design Group plcAnnual report and financial statements 2017
14
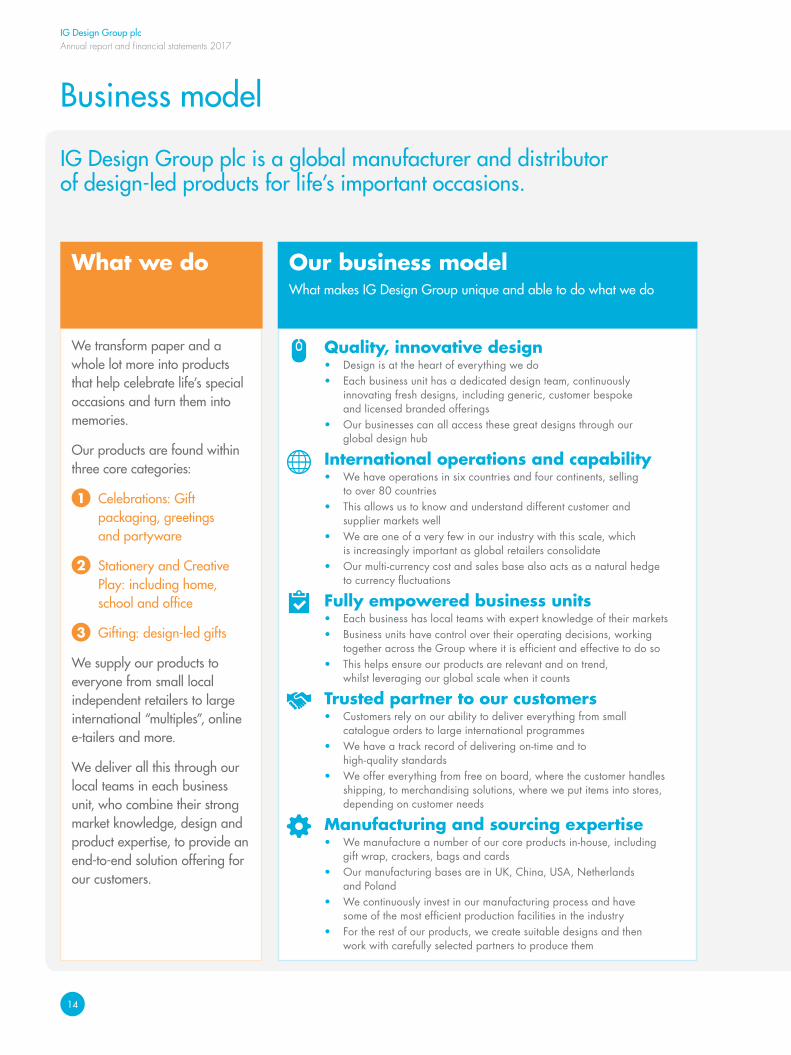
What we do
Business model
We transform paper and a whole lot more into products that help celebrate life’s special occasions and turn them into memories.
Our products are found within three core categories:
1 Celebrations: Gift packaging, greetings and partyware
2 Stationery and Creative Play: including home, school and office
3 Gifting: design-led gifts
We supply our products to everyone from small local independent retailers to large international “multiples”, online e-tailers and more.
We deliver all this through our local teams in each business unit, who combine their strong market knowledge, design and product expertise, to provide an end-to-end solution offering for our customers.
IG Design Group plc is a global manufacturer and distributor of design-led products for life’s important occasions.
Quality, innovative design• Design is at the heart of everything we do• Each business unit has a dedicated design team, continuously
innovating fresh designs, including generic, customer bespoke and licensed branded offerings
• Our businesses can all access these great designs through our global design hub
International operations and capability • We have operations in six countries and four continents, selling
to over 80 countries• This allows us to know and understand different customer and
supplier markets well• We are one of a very few in our industry with this scale, which
is increasingly important as global retailers consolidate• Our multi-currency cost and sales base also acts as a natural hedge
to currency fluctuations
Fully empowered business units• Each business has local teams with expert knowledge of their markets• Business units have control over their operating decisions, working
together across the Group where it is efficient and effective to do so• This helps ensure our products are relevant and on trend,
whilst leveraging our global scale when it counts
Trusted partner to our customers• Customers rely on our ability to deliver everything from small
catalogue orders to large international programmes• We have a track record of delivering on-time and to
high-quality standards• We offer everything from free on board, where the customer handles
shipping, to merchandising solutions, where we put items into stores, depending on customer needs
Manufacturing and sourcing expertise• We manufacture a number of our core products in-house, including
gift wrap, crackers, bags and cards• Our manufacturing bases are in UK, China, USA, Netherlands
and Poland• We continuously invest in our manufacturing process and have
some of the most efficient production facilities in the industry• For the rest of our products, we create suitable designs and then
work with carefully selected partners to produce them
Our business model What makes IG Design Group unique and able to do what we do
IG Design Group plcAnnual report and financial statements 2017
Strategic report
15
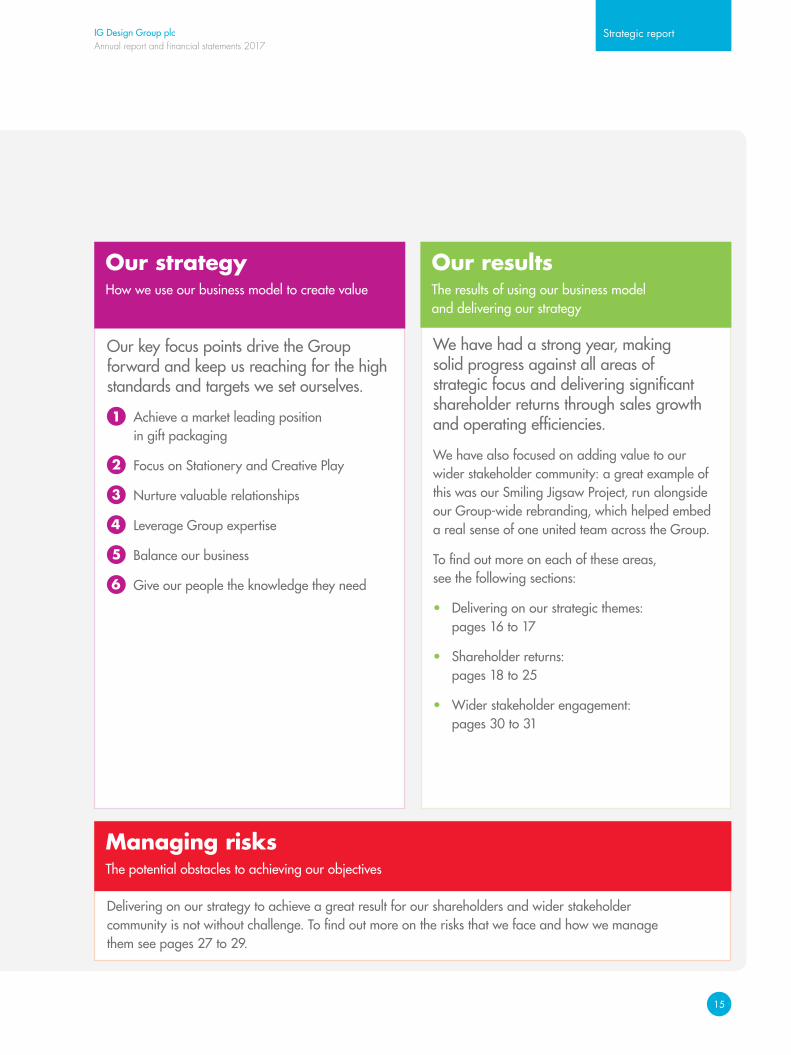
Delivering on our strategy to achieve a great result for our shareholders and wider stakeholder community is not without challenge. To find out more on the risks that we face and how we manage them see pages 27 to 29.
Managing risksThe potential obstacles to achieving our objectives
We have had a strong year, making solid progress against all areas of strategic focus and delivering significant shareholder returns through sales growth and operating efficiencies.
We have also focused on adding value to our wider stakeholder community: a great example of this was our Smiling Jigsaw Project, run alongside our Group-wide rebranding, which helped embed a real sense of one united team across the Group.
To find out more on each of these areas, see the following sections:
• Delivering on our strategic themes: pages 16 to 17
• Shareholder returns: pages 18 to 25
• Wider stakeholder engagement: pages 30 to 31
Our key focus points drive the Group forward and keep us reaching for the high standards and targets we set ourselves.
1 Achieve a market leading position in gift packaging
2 Focus on Stationery and Creative Play
3 Nurture valuable relationships
4 Leverage Group expertise
5 Balance our business
6 Give our people the knowledge they need
Our strategyHow we use our business model to create value
Our results The results of using our business model and delivering our strategy
IG Design Group plcAnnual report and financial statements 2017
16
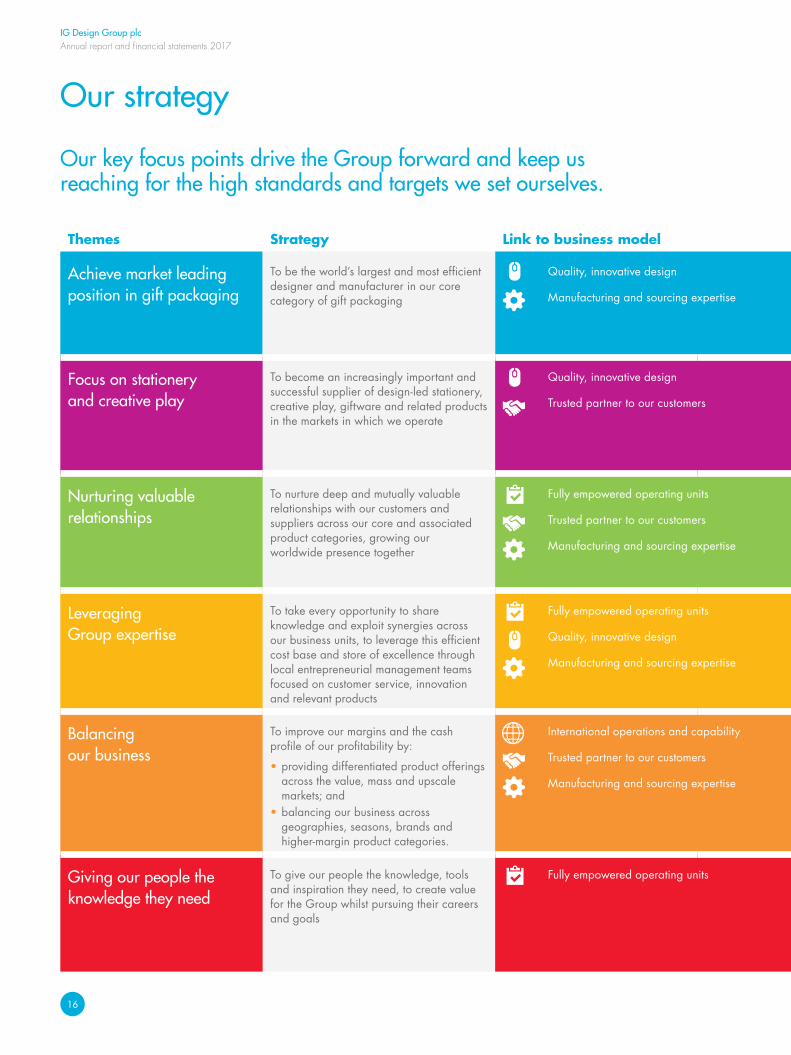
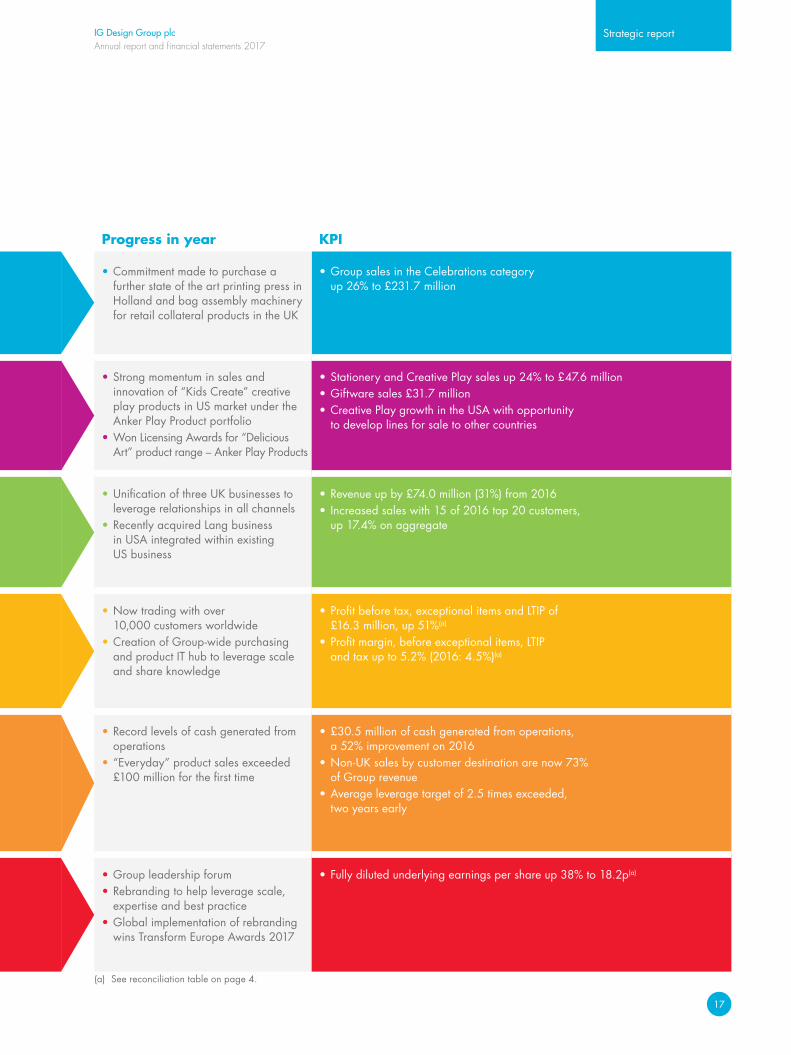
Themes Strategy Link to business model Progress in year KPI
Achieve market leading position in gift packaging
To be the world’s largest and most efficient designer and manufacturer in our core category of gift packaging
Quality, innovative design
Manufacturing and sourcing expertise
• Commitment made to purchase a further state of the art printing press in Holland and bag assembly machinery for retail collateral products in the UK
• Group sales in the Celebrations category up 26% to £231.7 million
Focus on stationery and creative play
To become an increasingly important and successful supplier of design-led stationery, creative play, giftware and related products in the markets in which we operate
Quality, innovative design
Trusted partner to our customers
• Strong momentum in sales and innovation of “Kids Create” creative play products in US market under the Anker Play Product portfolio
• Won Licensing Awards for “Delicious Art” product range – Anker Play Products
• Stationery and Creative Play sales up 24% to £47.6 million• Giftware sales £31.7 million• Creative Play growth in the USA with opportunity
to develop lines for sale to other countries
Nurturing valuable relationships
To nurture deep and mutually valuable relationships with our customers and suppliers across our core and associated product categories, growing our worldwide presence together
Fully empowered operating units
Trusted partner to our customers
Manufacturing and sourcing expertise
• Unification of three UK businesses to leverage relationships in all channels
• Recently acquired Lang business in USA integrated within existing US business
• Revenue up by £74.0 million (31%) from 2016• Increased sales with 15 of 2016 top 20 customers,
up 17.4% on aggregate
Leveraging Group expertise
To take every opportunity to share knowledge and exploit synergies across our business units, to leverage this efficient cost base and store of excellence through local entrepreneurial management teams focused on customer service, innovation and relevant products
Fully empowered operating units
Quality, innovative design
Manufacturing and sourcing expertise
• Now trading with over 10,000 customers worldwide
• Creation of Group-wide purchasing and product IT hub to leverage scale and share knowledge
• Profit before tax, exceptional items and LTIP of £16.3 million, up 51%(a)
• Profit margin, before exceptional items, LTIP and tax up to 5.2% (2016: 4.5%)(a)
Balancing our business
To improve our margins and the cash profile of our profitability by:
• providing differentiated product offerings across the value, mass and upscale markets; and
• balancing our business across geographies, seasons, brands and higher-margin product categories.
International operations and capability
Trusted partner to our customers
Manufacturing and sourcing expertise
• Record levels of cash generated from operations
• “Everyday” product sales exceeded £100 million for the first time
• £30.5 million of cash generated from operations, a 52% improvement on 2016
• Non-UK sales by customer destination are now 73% of Group revenue
• Average leverage target of 2.5 times exceeded, two years early
Giving our people the knowledge they need
To give our people the knowledge, tools and inspiration they need, to create value for the Group whilst pursuing their careers and goals
Fully empowered operating units • Group leadership forum• Rebranding to help leverage scale,
expertise and best practice• Global implementation of rebranding
wins Transform Europe Awards 2017
• Fully diluted underlying earnings per share up 38% to 18.2p(a)
Our strategy
Our key focus points drive the Group forward and keep us reaching for the high standards and targets we set ourselves.
IG Design Group plcAnnual report and financial statements 2017
Strategic report
17
Themes Strategy Link to business model Progress in year KPI
Achieve market leading position in gift packaging
To be the world’s largest and most efficient designer and manufacturer in our core category of gift packaging
Quality, innovative design
Manufacturing and sourcing expertise
• Commitment made to purchase a further state of the art printing press in Holland and bag assembly machinery for retail collateral products in the UK
• Group sales in the Celebrations category up 26% to £231.7 million
Focus on stationery and creative play
To become an increasingly important and successful supplier of design-led stationery, creative play, giftware and related products in the markets in which we operate
Quality, innovative design
Trusted partner to our customers
• Strong momentum in sales and innovation of “Kids Create” creative play products in US market under the Anker Play Product portfolio
• Won Licensing Awards for “Delicious Art” product range – Anker Play Products
• Stationery and Creative Play sales up 24% to £47.6 million• Giftware sales £31.7 million• Creative Play growth in the USA with opportunity
to develop lines for sale to other countries
Nurturing valuable relationships
To nurture deep and mutually valuable relationships with our customers and suppliers across our core and associated product categories, growing our worldwide presence together
Fully empowered operating units
Trusted partner to our customers
Manufacturing and sourcing expertise
• Unification of three UK businesses to leverage relationships in all channels
• Recently acquired Lang business in USA integrated within existing US business
• Revenue up by £74.0 million (31%) from 2016• Increased sales with 15 of 2016 top 20 customers,
up 17.4% on aggregate
Leveraging Group expertise
To take every opportunity to share knowledge and exploit synergies across our business units, to leverage this efficient cost base and store of excellence through local entrepreneurial management teams focused on customer service, innovation and relevant products
Fully empowered operating units
Quality, innovative design
Manufacturing and sourcing expertise
• Now trading with over 10,000 customers worldwide
• Creation of Group-wide purchasing and product IT hub to leverage scale and share knowledge
• Profit before tax, exceptional items and LTIP of £16.3 million, up 51%(a)
• Profit margin, before exceptional items, LTIP and tax up to 5.2% (2016: 4.5%)(a)
Balancing our business
To improve our margins and the cash profile of our profitability by:
• providing differentiated product offerings across the value, mass and upscale markets; and
• balancing our business across geographies, seasons, brands and higher-margin product categories.
International operations and capability
Trusted partner to our customers
Manufacturing and sourcing expertise
• Record levels of cash generated from operations
• “Everyday” product sales exceeded £100 million for the first time
• £30.5 million of cash generated from operations, a 52% improvement on 2016
• Non-UK sales by customer destination are now 73% of Group revenue
• Average leverage target of 2.5 times exceeded, two years early
Giving our people the knowledge they need
To give our people the knowledge, tools and inspiration they need, to create value for the Group whilst pursuing their careers and goals
Fully empowered operating units • Group leadership forum• Rebranding to help leverage scale,
expertise and best practice• Global implementation of rebranding
wins Transform Europe Awards 2017
• Fully diluted underlying earnings per share up 38% to 18.2p(a)
(a) See reconciliation table on page 4.
IG Design Group plcAnnual report and financial statements 2017
18
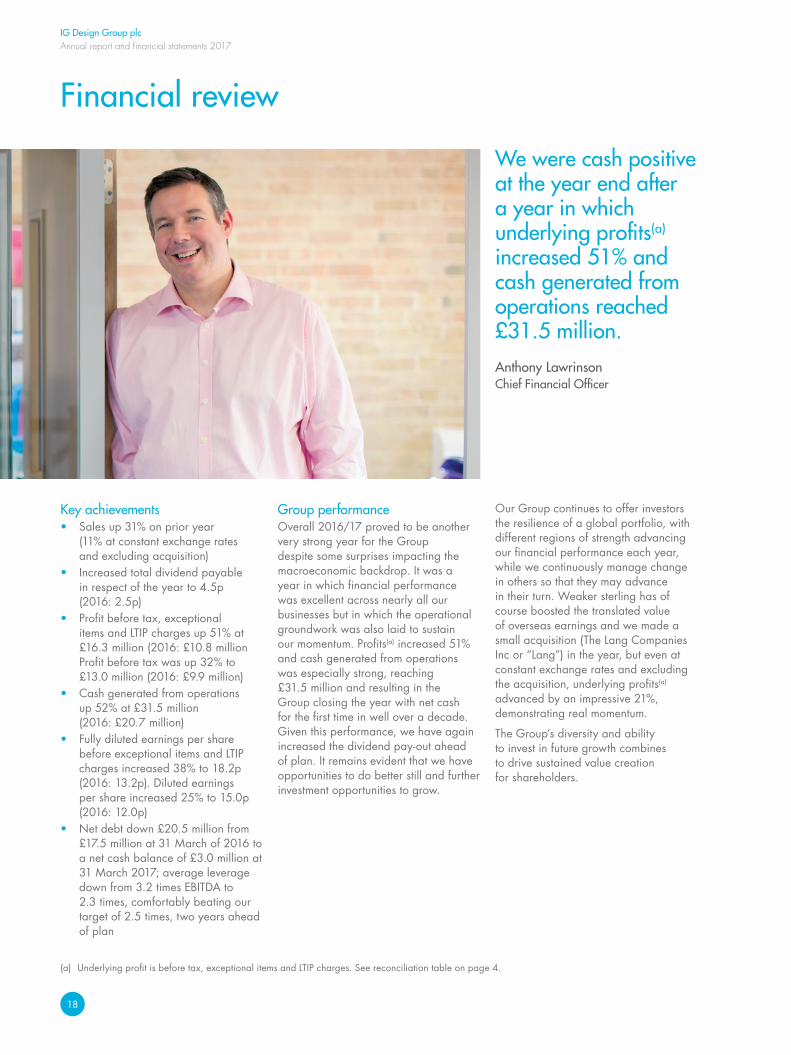
Financial review
Key achievements• Sales up 31% on prior year
(11% at constant exchange rates and excluding acquisition)
• Increased total dividend payable in respect of the year to 4.5p (2016: 2.5p)
• Profit before tax, exceptional items and LTIP charges up 51% at £16.3 million (2016: £10.8 million Profit before tax was up 32% to £13.0 million (2016: £9.9 million)
• Cash generated from operations up 52% at £31.5 million (2016: £20.7 million)
• Fully diluted earnings per share before exceptional items and LTIP charges increased 38% to 18.2p (2016: 13.2p). Diluted earnings per share increased 25% to 15.0p (2016: 12.0p)
• Net debt down £20.5 million from £17.5 million at 31 March of 2016 to a net cash balance of £3.0 million at 31 March 2017; average leverage down from 3.2 times EBITDA to 2.3 times, comfortably beating our target of 2.5 times, two years ahead of plan
Group performanceOverall 2016/17 proved to be another very strong year for the Group despite some surprises impacting the macroeconomic backdrop. It was a year in which financial performance was excellent across nearly all our businesses but in which the operational groundwork was also laid to sustain our momentum. Profits(a) increased 51% and cash generated from operations was especially strong, reaching £31.5 million and resulting in the Group closing the year with net cash for the first time in well over a decade. Given this performance, we have again increased the dividend pay-out ahead of plan. It remains evident that we have opportunities to do better still and further investment opportunities to grow.
Our Group continues to offer investors the resilience of a global portfolio, with different regions of strength advancing our financial performance each year, while we continuously manage change in others so that they may advance in their turn. Weaker sterling has of course boosted the translated value of overseas earnings and we made a small acquisition (The Lang Companies Inc or “Lang”) in the year, but even at constant exchange rates and excluding the acquisition, underlying profits(a) advanced by an impressive 21%, demonstrating real momentum.
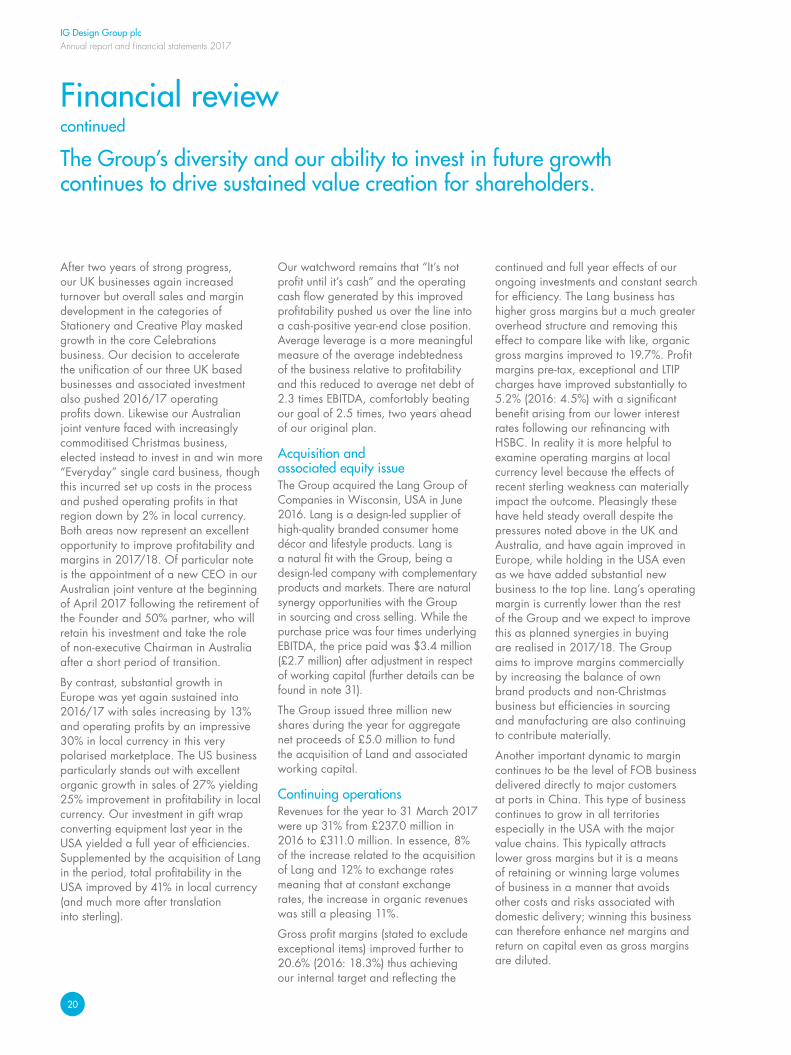
The Group’s diversity and ability to invest in future growth combines to drive sustained value creation for shareholders.
(a) Underlying profit is before tax, exceptional items and LTIP charges. See reconciliation table on page 4.
We were cash positive at the year end after a year in which underlying profits(a) increased 51% and cash generated from operations reached £31.5 million.Anthony LawrinsonChief Financial Officer
FUN FACT
Last year we sold nearly
40 millioncolouring and writing instruments
End to end, they would be nearly as long as the Great Wall of China
IG Design Group plcAnnual report and financial statements 2017
20
Financial reviewcontinued
After two years of strong progress, our UK businesses again increased turnover but overall sales and margin development in the categories of Stationery and Creative Play masked growth in the core Celebrations business. Our decision to accelerate the unification of our three UK based businesses and associated investment also pushed 2016/17 operating profits down. Likewise our Australian joint venture faced with increasingly commoditised Christmas business, elected instead to invest in and win more “Everyday” single card business, though this incurred set up costs in the process and pushed operating profits in that region down by 2% in local currency. Both areas now represent an excellent opportunity to improve profitability and margins in 2017/18. Of particular note is the appointment of a new CEO in our Australian joint venture at the beginning of April 2017 following the retirement of the Founder and 50% partner, who will retain his investment and take the role of non-executive Chairman in Australia after a short period of transition.
By contrast, substantial growth in Europe was yet again sustained into 2016/17 with sales increasing by 13% and operating profits by an impressive 30% in local currency in this very polarised marketplace. The US business particularly stands out with excellent organic growth in sales of 27% yielding 25% improvement in profitability in local currency. Our investment in gift wrap converting equipment last year in the USA yielded a full year of efficiencies. Supplemented by the acquisition of Lang in the period, total profitability in the USA improved by 41% in local currency (and much more after translation into sterling).
Our watchword remains that “It’s not profit until it’s cash” and the operating cash flow generated by this improved profitability pushed us over the line into a cash-positive year-end close position. Average leverage is a more meaningful measure of the average indebtedness of the business relative to profitability and this reduced to average net debt of 2.3 times EBITDA, comfortably beating our goal of 2.5 times, two years ahead of our original plan.
Acquisition and associated equity issue The Group acquired the Lang Group of Companies in Wisconsin, USA in June 2016. Lang is a design-led supplier of high-quality branded consumer home décor and lifestyle products. Lang is a natural fit with the Group, being a design-led company with complementary products and markets. There are natural synergy opportunities with the Group in sourcing and cross selling. While the purchase price was four times underlying EBITDA, the price paid was $3.4 million (£2.7 million) after adjustment in respect of working capital (further details can be found in note 31).
The Group issued three million new shares during the year for aggregate net proceeds of £5.0 million to fund the acquisition of Land and associated working capital.
Continuing operationsRevenues for the year to 31 March 2017 were up 31% from £237.0 million in 2016 to £311.0 million. In essence, 8% of the increase related to the acquisition of Lang and 12% to exchange rates meaning that at constant exchange rates, the increase in organic revenues was still a pleasing 11%.
Gross profit margins (stated to exclude exceptional items) improved further to 20.6% (2016: 18.3%) thus achieving our internal target and reflecting the
continued and full year effects of our ongoing investments and constant search for efficiency. The Lang business has higher gross margins but a much greater overhead structure and removing this effect to compare like with like, organic gross margins improved to 19.7%. Profit margins pre-tax, exceptional and LTIP charges have improved substantially to 5.2% (2016: 4.5%) with a significant benefit arising from our lower interest rates following our refinancing with HSBC. In reality it is more helpful to examine operating margins at local currency level because the effects of recent sterling weakness can materially impact the outcome. Pleasingly these have held steady overall despite the pressures noted above in the UK and Australia, and have again improved in Europe, while holding in the USA even as we have added substantial new business to the top line. Lang’s operating margin is currently lower than the rest of the Group and we expect to improve this as planned synergies in buying are realised in 2017/18. The Group aims to improve margins commercially by increasing the balance of own brand products and non-Christmas business but efficiencies in sourcing and manufacturing are also continuing to contribute materially.
Another important dynamic to margin continues to be the level of FOB business delivered directly to major customers at ports in China. This type of business continues to grow in all territories especially in the USA with the major value chains. This typically attracts lower gross margins but it is a means of retaining or winning large volumes of business in a manner that avoids other costs and risks associated with domestic delivery; winning this business can therefore enhance net margins and return on capital even as gross margins are diluted.
The Group’s diversity and our ability to invest in future growth continues to drive sustained value creation for shareholders.
IG Design Group plcAnnual report and financial statements 2017
Strategic report
3
A blueprint for successDebt milestone achieved
KEY FACT
IG Design Group plcAnnual report and financial statements 2017
4
We are delighted to be cash positive at the year end for the first time in many years. Our focus on cash flow is providing us with the ability to fund future growth opportunities and pay increasing dividends
to our shareholders.Anthony LawrinsonChief Financial Officer
IG Design Group plcAnnual report and financial statements 2017
Strategic report
21
Financial reviewcontinued
Overheads (before exceptional items and LTIP charges) have increased in absolute terms, reflecting the higher overheads in Lang, increased investment in people and future growth, foreign exchange effects as well as the effect of increased performance pay following this year’s result. However, the underlying trend in these costs remains largely steady year-on-year as a percentage of sales. Tight cost control is a feature of our business and opportunities to remove or reduce costs are constantly sought out. As we invest to develop further sales opportunities such as we are currently doing in the USA, overheads will continue to increase in absolute terms. We will ensure that new costs are only incurred where actual or prospective value can be demonstrated.
As a result of the above, underlying operating profit before exceptional items and LTIP charges increased by 29% to £17.5 million (2016: £13.5 million) or 13% after exceptional items and LTIP charges. Excluding the effect of acquisitions and at like-for-like exchange rates, underlying operating profit increased by 6% to £16.9 million (2016: £15.9 million).
Exceptional charges of £1.0 million arising during the year (2016: nil) relate to the costs of acquisition and subsequent restructuring of the Lang business, and to restructuring of the US printing platform. The charges are less than previously expected because the balance of £0.2 million is expected to arise in 2017/18 as the restructuring completes. Of this amount, £0.9 million has been or will be settled in cash and a net amount of £0.3 million is the non-cash effect.
The non-cash element includes a ‘bargain purchase’ gain on the acquisition of Lang of £1.3 million which arose because the cost of the investment was less than the fair value of the net assets. As indicated in the half year report, this non-cash gain is offset by non-cash write downs of assets in the US business of £1.7 million in anticipation of a more holistic Group approach to printing across our worldwide assets (further details can be found in note 10).
Finance expenses in the year were significantly lower than the prior year at £1.2 million (2016: £2.8 million); this partly reflects a reversal of last year where certain foreign exchange contracts that did not qualify to be hedge accounted were marked to market. Stripping out the effect of these, the underlying interest cost and associated charges were £1.9 million (2016: £2.2 million) reaping the rewards of lower average debt levels and lower margins particularly following our global refinancing in June 2016 with HSBC. Notes 8 and 26 to the financial statements provide further information.
Underlying profits(a) were up 51% to £16.3 million (2016: £10.8 million) while profit before tax was up 32% to £13.0 million (2016: £9.9 million). The strong increase reflects the benefit of a much lower interest charge but also takes in the cost of exceptional items in the current year £1.0 million (2016: £nil) and a much higher LTIP charge. The largely non-cash LTIP charges of £2.2 million (2016: £0.9 million) are higher because:
a) we have a clear leadership incentive programme under which a new award is made each year for a three-year period and we now have three awards running on a rolling basis;
b) the Group’s performance is well ahead of plan and with the current trajectory, schemes are likely to vest at maximum levels; and
c) the substantial share price rise increases the charges associated with Employer’s National Insurance. However, the Group will also receive a much increased corporation tax deduction (mainly in the UK) based upon market value at exercise. More information can be found in the remuneration report on pages 37 to 41.
TaxationThe Group manages its tax affairs in an open and transparent manner, observing full compliance with all applicable rules and regulations in countries in which it operates and not entering into any tax avoidance or otherwise aggressive tax planning schemes. The headline taxation charge is higher as anticipated at £2.7 million (2016: £2.2 million) though of course on a higher profit base. The effective underlying tax charge on profits before exceptional items and LTIP charges is higher than the prior year at 24.2% (2016: 22.5%). This is still well below the underlying blended rate that would arise from the Group s current geographical profile of profits.
Recent performance has been sufficiently strong in those areas with historical tax losses, that we have now recognised all material tax losses in the accounts. The underlying blended rate is currently 30% and this rate will likely increase as our profile of profitability increases in the USA where the tax rate is higher at 35%. Our actual tax rate will therefore now trend quite quickly in future periods towards the underlying blended rate. The tax losses not yet recognised in the balance sheet in the UK and Asian segment have a current tax value of £673,000 and £nil in the USA, compared with the prior period of £719,000 and £1,385,000 respectively.
Actual taxation paid in cash during the year was slightly higher than the prior year at £2.0 million (2016: £1.8 million) as our businesses in Australia and the Netherlands do not have losses to off-set their profits. With improving and sustained profitability, we expect to pay cash tax in the USA in 2017/18 and in the UK in the following year.
(a) Profits – profit before tax, exceptional items and LTIP charges.
IG Design Group plcAnnual report and financial statements 2017
22
Financial reviewcontinued
Profit for the yearOverall net profit for the year increased by 35% to £10.3 million (2016: £7.6 million); after removing the effect of exceptional items and LTIP charges, the underlying profitability increased still more by 45% to £12.4 million (2016: £8.6 million).
Earnings per share and dividendsBasic earnings per share were 15.7p (2016: 12.3p). After removing the effect of exceptional items and LTIP charges, the underlying earnings per share were 19.0p (2016: 13.5p) representing an increase of 41%.
However, in order to properly reflect the dilutive effect of employee share incentive schemes, the Company s key target is determined by reference to underlying fully diluted earnings per share (which is stated before the effect of exceptional items and the largely non-cash LTIP charges but after the dilutive effect of share options which have vested but not yet been exercised). This ensures that incentive plan outcomes and shareholder interests remain aligned. Details of share plans can be found in note 25 to the financial statements and in the remuneration report on pages 37 to 41.
Fully diluted earnings per share (stated before exceptional items and LTIP charges) were 18.2p, up 38% on the prior year (2016: 13.2p), securing another year of double digit growth in earnings.
Accordingly, the Board is pleased to propose a final dividend of 2.75p per share for the year (2016: 1.75p) which will be paid during September, subject to shareholder approval. Together with the interim dividend of 1.75p (2016: 0.75p) this makes for a total dividend in respect of the year of 4.5p per share. This dividend is covered four times by underlying earnings and there should be scope to increase this further in future periods while still investing in growth and managing average leverage comfortably. The Board has determined that any dividend will always be covered not less than two and a half times by underlying earnings per share. Dividend policy will be balanced against the attractive opportunities to invest in efficiency and growth that continue to present themselves.
Balance sheet and cash flowAt 31 March 2017 net debt had been eliminated with a net cash balance of £3.0 million (2016: £17.5 million net debt) though of course the seasonal nature of the business means debt levels will build again in anticipation of the peak trading period before again falling in late November onwards. Thus the ratio of year-end net debt to EBITDA, exceptional items and LTIP charges (leverage) was nil compared with 1.0 times in 2016. Furthermore, the Group has now achieved its target for average leverage (the ratio of average net debt to EBITDA). At the year end this metric was 2.3 times, much improved on 3.2 times in 2016, better than our target of 2.5 times and two years ahead of plan. The current average leverage of 2.3 times sits within our target long term range of 2.0-2.75 times EBITDA.
Year-end net cash included amounts denominated in US dollars of $3.3 million (2016: $0.3 million debt) and in euros of €0.6 million net debt (2016: €7.2 million net debt). The year-end exchange rates were $1.25 (2016: $1.44) and €1.17 (2016: €1.26). Therefore, at like-for-like exchange rates the net cash balance would have improved by a further £0.4 million.
Working capital management continues to be a priority. Outstanding debtors are monitored closely, both to maximise cash but also to reduce our credit risk. Trade debtors are higher at £26.0 million (2016: £18.6 million) at the year end, but this is unsurprising given the higher value of sales and the acquisition of Lang. Debtor days remain tightly controlled and the charge for bad and doubtful debts in the year was only £0.7 million, less than 0.2% (2016: 0.1%) of turnover.
Net stock levels after provisioning for older stock were higher at £49.5 million (2016: £46.0 million) as the business is growing. Stock levels fell particularly in the UK through good working capital management enabled by the investment in Wales, offsetting increases in faster growing geographies.
Older stock (measured as over 15 months since last purchase) increased to £7.2 million (2016: £5.9 million). Provisioning increased to £8.4 million from £4.6 million in the prior period, substantially increasing the level of provisioning against stock and thus improving the quality of the balance sheet. This reflects our desire to adopt a more consistent approach to provisioning across our businesses.
In 2016/17 we traded with over 10,000 customers with a base of over 200,000 stores in over 80 countries worldwide.
IG Design Group plcAnnual report and financial statements 2017
Strategic report
23
Group cash generated from operations was again very strong at £31.5 million (2016: £20.7 million), reflecting the strength of operating profitability and assisted again by a net reduction in working capital of £10.9 million (2016: reduction of £3.5 million).
Investment in capital expenditure during the year of £4.6 million (2016: £4.4 million) was at a similar level to depreciation. The Group continues to invest wherever we see strong returns and improved efficiencies. The manufacturing platforms across all our sites in China, UK and Europe are up to date, underpinning our competitive position, and yet we still see further opportunities for bolt-on capital investment in these locations to add further capability.
In particular we have approved the investment in the Netherlands in a second high speed, high definition printing press. Once in place in 2018/19, this additional press will reduce risk, increase efficiency and sustain further growth in profitability. In the USA the business case for the final phase to update our printing capability is still under appraisal but likely to take place later than previously anticipated as we exploit our other Group assets to the full first. The US business in co-ordination with appropriate Group colleagues is currently defining a new ERP solution that will underpin future growth and create efficiencies, while in the UK and Asia a range of smaller investments are progressing to develop new product solutions, add increased capacity and to provide operational efficiencies. Our cash flow is strong enough to absorb these investments and build foundations for additional future growth while still meeting our plans to increase dividends, especially now that our leverage target has been achieved.
Equity attributable to shareholders has increased to £86.2 million from £68.0 million predominantly reflecting profits generated in the year.
Risks and key performance indicatorsOur areas of primary focus are:• improved earnings attributable
to shareholders, which we aim to achieve through top-line growth and mix management in selected markets and channels together with strong cost and gross margin management;
• seeking out value creating areas of investment so that we can sustain double digit growth in earnings for shareholders; and
• maintaining at prudent levels, our average leverage measured as the ratio of average net debt to pre-exceptional EBITDA, which we aim to achieve through strong and increasing profitability together with close management of our working capital and focused investment.
Operationally this means a focus on:• nurturing valuable
relationships: monitoring the profitability, product mix and service delivered in respect of our customer base; growing those relationships in existing and new territories and product categories;
• creating a toolbox of expertise: ensuring that we have market-leading design and product capability in our categories, sharing knowledge through common platforms;
• providing best quality, value and service: monitoring and benchmarking the key elements of our cost bases, buying or manufacturing as efficiently and effectively as possible from a total cost perspective across the whole season so that we can deliver great value to customers and strong returns to shareholders;
• balancing our business: we monitor the mix and profitability in each of our businesses across season, brand and product categories, seeking out those opportunities that yield the best returns on our scarce capital while rooting out those activities that consume resources for little or no gain; and
• providing differentiated product offerings: across the value, mass and upscale markets.
IG Design Group plcAnnual report and financial statements 2017
24
Financial reviewcontinued
Foreign exchange impact to profit and earningsOur diverse geographical revenue and profit streams continue to provide us with market resilience, but naturally this carries with it the volatility of currency.
As noted above in the context of net debt, foreign exchange rates can impact significantly on the translation of our overseas figures relative to prior years. During the year the US dollar rate moved from 1.44 to 1.25, the euro from 1.26 to 1.17 and the Australian dollar rate from 1.87 to 1.64. As noted above, this change in rates had a material impact on the sterling value of sales and profits during the year – though the impact to net profit was lower at only £1.5 million because the Group matches the currency of costs and funding where possible.
Additionally, the relative strength of the US dollar against other currencies can materially impact purchase prices out of China. This is noticeable across all our non-US trading businesses which are all finding that their margins are squeezed through substantial foreign exchange headwinds on products bought in from the Far East. It is also a feature of our business that we innovate, invest and commercially redesign products to combat this effect but this can take more than one season.
With Brexit negotiations now to take place and the outcome of the UK general election removing the previous majority of the Conservative government, movements in foreign exchange rates, prices and markets in general could be material and are very unpredictable. We import substantial amounts of raw material and finished product from overseas markets, notably China and to a lesser degree we export from the UK to the USA and Europe. It is important to the Group that we have clarity on the future trading environment so that we can adapt appropriately. For the year ahead, our Group has strong natural hedges in terms of US dollar to sterling, and no material transaction exposure to euro movements. Our European and Australian businesses have greater outstanding exposures to volatility in the US dollar as a result of world events with a weaker dollar favouring them. As noted above, our business is flexible and with the benefit of time to see macroeconomic considerations settle, we can re-engineer our product to hit required price points.
The greatest impact of such volatility as we have seen this year remains the translation effect on our sales, profits and working capital cash flows. Weak sterling has provided us with the advantage this year of higher reported profits and a reversal of this position would clearly slow our growth in sterling terms, though this would now appear less likely. However, our portfolio of businesses is strong enough to move forwards regardless of circumstances and we forecast and plan prudently to try to accommodate these risks. We also fund a large part of the working capital needs of our overseas businesses in local currency, so the translation impact on facilities headroom is less pronounced than otherwise would be the case.
Treasury operations Our global refinancing (announced in June 2016) is a milestone moment for the Group as it represents the opportunity to fund our operations in an innovative and truly joined-up manner, optimising efficiency and cost. The terms and conditions of the refinancing are materially more favourable than those previously in place both financially and in respect of freedom to act. While there were costs associated with cancelling the old facilities and setting up the new, the benefits in 2016/17 were greater than expected. More expensive hire purchase facilities were repaid in the year, yielding further savings.
Since the year end, the Group has also exercised an option to extend the core facilities for a further year and increased the facility value of the invoice financing arrangements to support our growth. The Group is now funded globally with HSBC providing a full suite of cost-effective facilities available to all wholly owned businesses while Westpac continues to support our Australian joint venture. To support this structure, we have now moved our worldwide operational banking to HSBC other than minor niche requirements in selected territories.
IG Design Group plcAnnual report and financial statements 2017
Strategic report
25
The HSBC facilities comprise:• a three-year revolving credit facility
(“RCF”) of £18 million. This facility is capable of extension on the same terms for a further year if the parties agree;
• invoice financing arrangements for an initial term of three years in the UK, European, US and Asian markets; and
• a further flexible RCF with availability varying from month to month. This is reviewed annually but capable of extension to match the maturity of the core RCF. This working capital RCF is designed to meet our requirements during those months when stock is being built but will be undrawn for that part of the year where the invoice financing facilities are sufficient to provide our needs.
In total we estimate the effectively available facilities at over £125.5 million more than sufficient to cover even our peak requirements. The facilities have flexible elements within them that mean they can also grow with us. The facility includes an additional uncommitted amount to finance potential acquisitions. The facilities do not amortise with time.
There are financial covenants, tested quarterly, attached to our new facilities as follows:
• interest cover, being the ratio of earnings before interest, depreciation and amortisation to interest on a rolling twelve-month basis; and
• leverage, being the ratio of debt to pre-exceptional EBITDA on a rolling twelve-month basis.
There is a further covenant tested monthly in respect of the working capital RCF by which available asset cover must not fall below agreed levels relative to amounts drawn.
The Group now has no interest rate hedges in place and elects to accept floating interest rates across a range of currencies. While we will keep this risk under review, our debt is at its lowest point in many years and may fall further relative to profitability. While global interest rates are rising they remain low and margins have further capacity to fall as leverage performance improves and we are therefore comfortable with this position. The Group also actively manages FX transaction exposure in each of its businesses, with advice and support from the central treasury team.
Note 26 to the financial statements provides further information in respect of treasury matters.
ConclusionThe Group delivered an exceptionally strong year, with all metrics well beyond our initial expectations. We are still building further foundations for success, investing carefully and creating new competencies that will power continued growth in profitability for many years ahead. Achieving a debt-free year end and profits(a) growth of almost 51% was especially pleasing. Our continued outperformance in the arena of cash management is providing the Group with additional flexibility and options to create value for shareholders in the future.
Anthony LawrinsonChief Financial Officer
26 June 2017
(a) Profit before tax, exceptional items and LTIP charges.
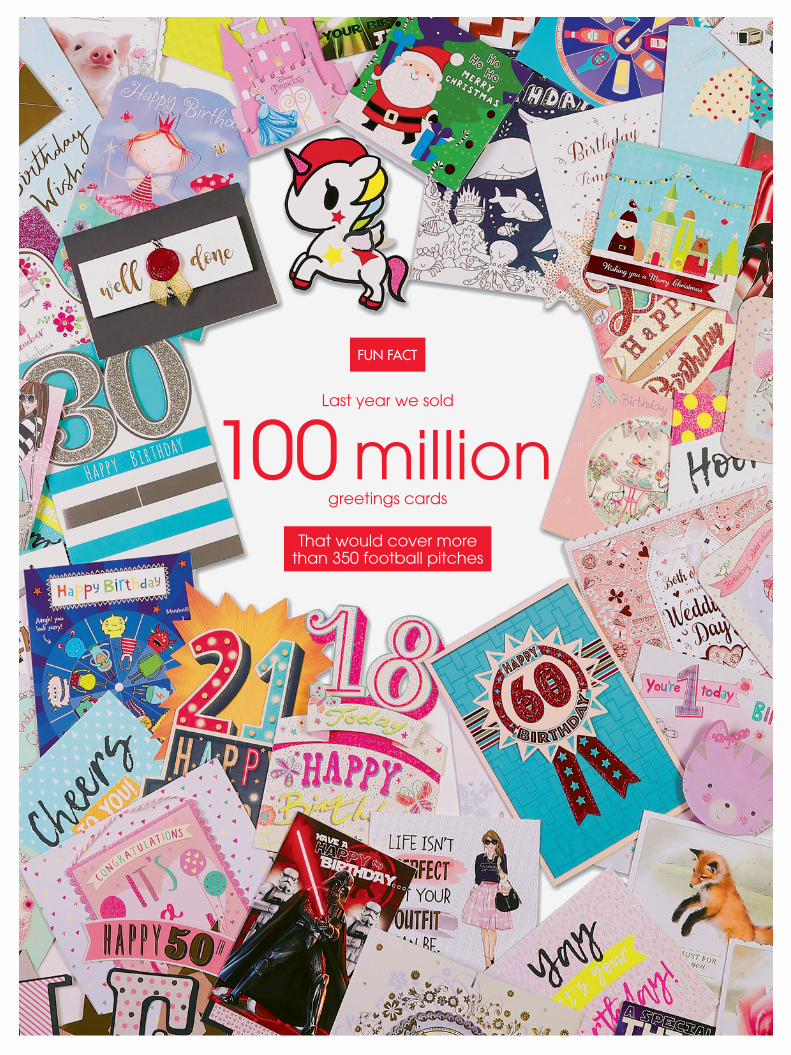
FUN FACT
Last year we sold
100 milliongreetings cards
That would cover more than 350 football pitches
IG Design Group plcAnnual report and financial statements 2017
Strategic report
27
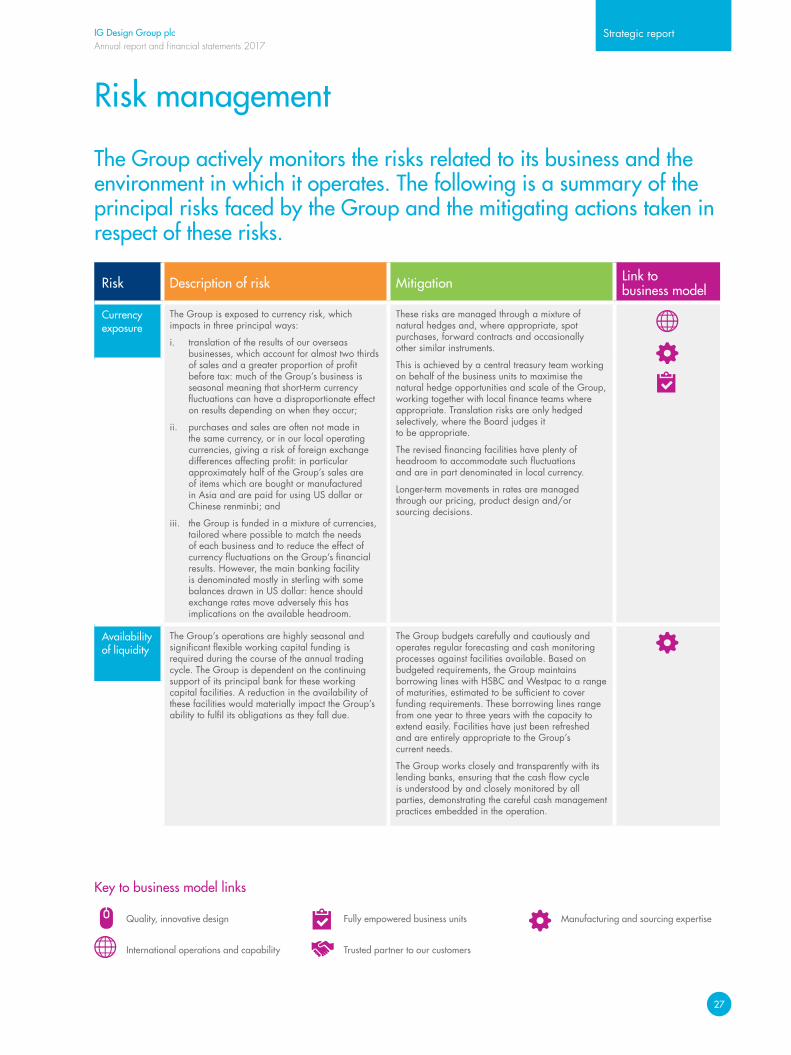
Risk management
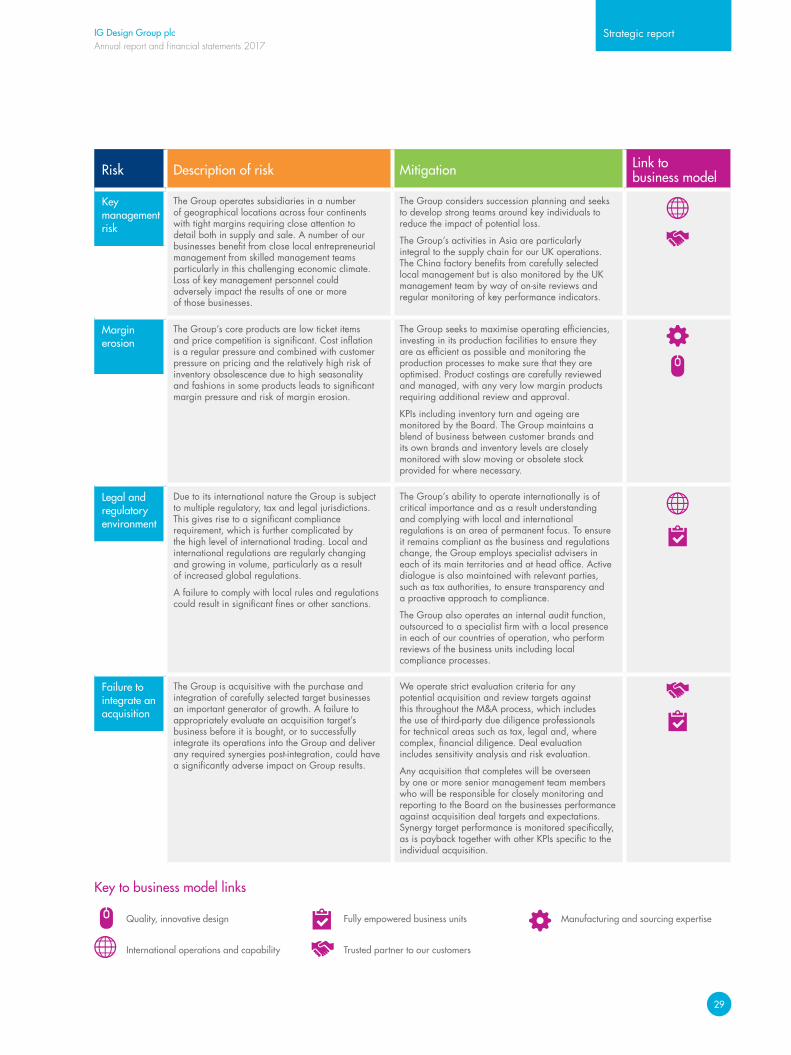
The Group actively monitors the risks related to its business and the environment in which it operates. The following is a summary of the principal risks faced by the Group and the mitigating actions taken in respect of these risks.
Risk Description of risk Mitigation Link to business model
Currency exposure
The Group is exposed to currency risk, which impacts in three principal ways:
i. translation of the results of our overseas businesses, which account for almost two thirds of sales and a greater proportion of profit before tax: much of the Group’s business is seasonal meaning that short-term currency fluctuations can have a disproportionate effect on results depending on when they occur;
ii. purchases and sales are often not made in the same currency, or in our local operating currencies, giving a risk of foreign exchange differences affecting profit: in particular approximately half of the Group’s sales are of items which are bought or manufactured in Asia and are paid for using US dollar or Chinese renminbi; and
iii. the Group is funded in a mixture of currencies, tailored where possible to match the needs of each business and to reduce the effect of currency fluctuations on the Group’s financial results. However, the main banking facility is denominated mostly in sterling with some balances drawn in US dollar: hence should exchange rates move adversely this has implications on the available headroom.
These risks are managed through a mixture of natural hedges and, where appropriate, spot purchases, forward contracts and occasionally other similar instruments.
This is achieved by a central treasury team working on behalf of the business units to maximise the natural hedge opportunities and scale of the Group, working together with local finance teams where appropriate. Translation risks are only hedged selectively, where the Board judges it to be appropriate.
The revised financing facilities have plenty of headroom to accommodate such fluctuations and are in part denominated in local currency.
Longer-term movements in rates are managed through our pricing, product design and/or sourcing decisions.
Availability of liquidity
The Group’s operations are highly seasonal and significant flexible working capital funding is required during the course of the annual trading cycle. The Group is dependent on the continuing support of its principal bank for these working capital facilities. A reduction in the availability of these facilities would materially impact the Group’s ability to fulfil its obligations as they fall due.
The Group budgets carefully and cautiously and operates regular forecasting and cash monitoring processes against facilities available. Based on budgeted requirements, the Group maintains borrowing lines with HSBC and Westpac to a range of maturities, estimated to be sufficient to cover funding requirements. These borrowing lines range from one year to three years with the capacity to extend easily. Facilities have just been refreshed and are entirely appropriate to the Group’s current needs.
The Group works closely and transparently with its lending banks, ensuring that the cash flow cycle is understood by and closely monitored by all parties, demonstrating the careful cash management practices embedded in the operation.
Quality, innovative design
International operations and capability
Fully empowered business units
Trusted partner to our customers
Manufacturing and sourcing expertise
Key to business model links
IG Design Group plcAnnual report and financial statements 2017
28
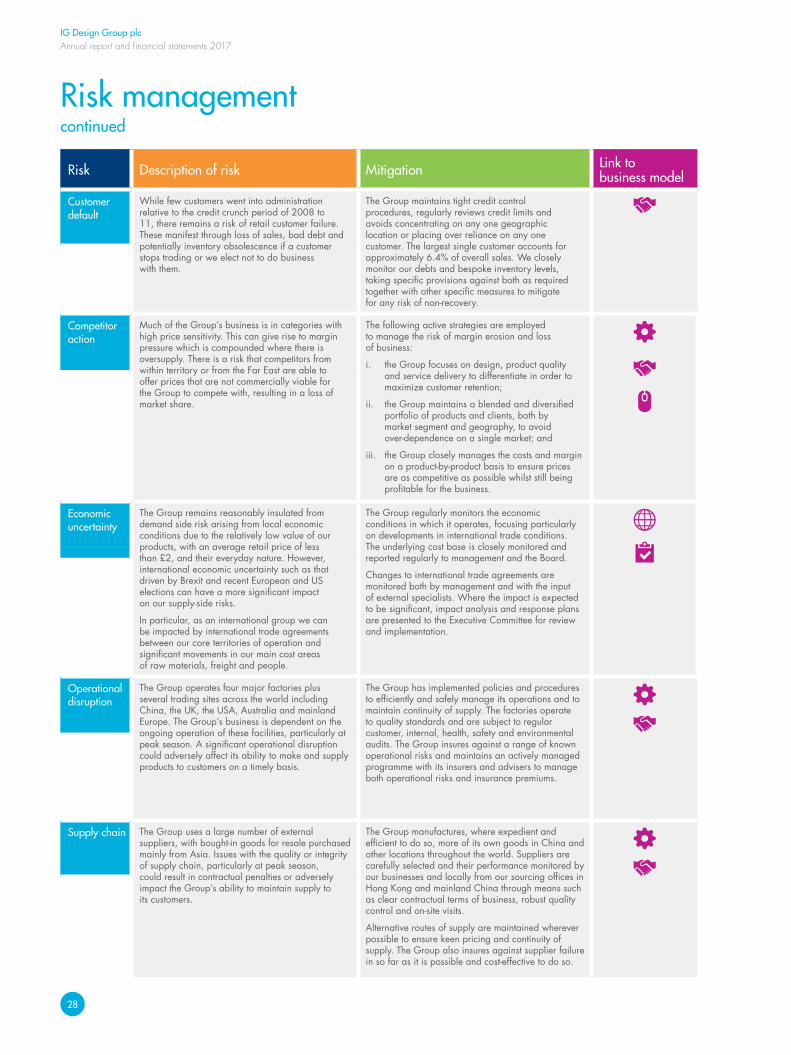
Risk managementcontinued
Risk Description of risk Mitigation Link to business model
Customer default
While few customers went into administration relative to the credit crunch period of 2008 to 11, there remains a risk of retail customer failure. These manifest through loss of sales, bad debt and potentially inventory obsolescence if a customer stops trading or we elect not to do business with them.
The Group maintains tight credit control procedures, regularly reviews credit limits and avoids concentrating on any one geographic location or placing over reliance on any one customer. The largest single customer accounts for approximately 6.4% of overall sales. We closely monitor our debts and bespoke inventory levels, taking specific provisions against both as required together with other specific measures to mitigate for any risk of non-recovery.
Competitor action
Much of the Group’s business is in categories with high price sensitivity. This can give rise to margin pressure which is compounded where there is oversupply. There is a risk that competitors from within territory or from the Far East are able to offer prices that are not commercially viable for the Group to compete with, resulting in a loss of market share.
The following active strategies are employed to manage the risk of margin erosion and loss of business:
i. the Group focuses on design, product quality and service delivery to differentiate in order to maximize customer retention;
ii. the Group maintains a blended and diversified portfolio of products and clients, both by market segment and geography, to avoid over-dependence on a single market; and
iii. the Group closely manages the costs and margin on a product-by-product basis to ensure prices are as competitive as possible whilst still being profitable for the business.
Economic uncertainty
The Group remains reasonably insulated from demand side risk arising from local economic conditions due to the relatively low value of our products, with an average retail price of less than £2, and their everyday nature. However, international economic uncertainty such as that driven by Brexit and recent European and US elections can have a more significant impact on our supply-side risks.
In particular, as an international group we can be impacted by international trade agreements between our core territories of operation and significant movements in our main cost areas of raw materials, freight and people.
The Group regularly monitors the economic conditions in which it operates, focusing particularly on developments in international trade conditions. The underlying cost base is closely monitored and reported regularly to management and the Board.
Changes to international trade agreements are monitored both by management and with the input of external specialists. Where the impact is expected to be significant, impact analysis and response plans are presented to the Executive Committee for review and implementation.
Operational disruption
The Group operates four major factories plus several trading sites across the world including China, the UK, the USA, Australia and mainland Europe. The Group’s business is dependent on the ongoing operation of these facilities, particularly at peak season. A significant operational disruption could adversely affect its ability to make and supply products to customers on a timely basis.
The Group has implemented policies and procedures to efficiently and safely manage its operations and to maintain continuity of supply. The factories operate to quality standards and are subject to regular customer, internal, health, safety and environmental audits. The Group insures against a range of known operational risks and maintains an actively managed programme with its insurers and advisers to manage both operational risks and insurance premiums.
Supply chain The Group uses a large number of external suppliers, with bought-in goods for resale purchased mainly from Asia. Issues with the quality or integrity of supply chain, particularly at peak season, could result in contractual penalties or adversely impact the Group’s ability to maintain supply to its customers.
The Group manufactures, where expedient and efficient to do so, more of its own goods in China and other locations throughout the world. Suppliers are carefully selected and their performance monitored by our businesses and locally from our sourcing offices in Hong Kong and mainland China through means such as clear contractual terms of business, robust quality control and on-site visits.
Alternative routes of supply are maintained wherever possible to ensure keen pricing and continuity of supply. The Group also insures against supplier failure in so far as it is possible and cost-effective to do so.
IG Design Group plcAnnual report and financial statements 2017
Strategic report
29
Risk Description of risk Mitigation Link to business model
Key management risk
The Group operates subsidiaries in a number of geographical locations across four continents with tight margins requiring close attention to detail both in supply and sale. A number of our businesses benefit from close local entrepreneurial management from skilled management teams particularly in this challenging economic climate. Loss of key management personnel could adversely impact the results of one or more of those businesses.
The Group considers succession planning and seeks to develop strong teams around key individuals to reduce the impact of potential loss.
The Group’s activities in Asia are particularly integral to the supply chain for our UK operations. The China factory benefits from carefully selected local management but is also monitored by the UK management team by way of on-site reviews and regular monitoring of key performance indicators.
Margin erosion
The Group’s core products are low ticket items and price competition is significant. Cost inflation is a regular pressure and combined with customer pressure on pricing and the relatively high risk of inventory obsolescence due to high seasonality and fashions in some products leads to significant margin pressure and risk of margin erosion.
The Group seeks to maximise operating efficiencies, investing in its production facilities to ensure they are as efficient as possible and monitoring the production processes to make sure that they are optimised. Product costings are carefully reviewed and managed, with any very low margin products requiring additional review and approval.
KPIs including inventory turn and ageing are monitored by the Board. The Group maintains a blend of business between customer brands and its own brands and inventory levels are closely monitored with slow moving or obsolete stock provided for where necessary.
Legal and regulatory environment
Due to its international nature the Group is subject to multiple regulatory, tax and legal jurisdictions. This gives rise to a significant compliance requirement, which is further complicated by the high level of international trading. Local and international regulations are regularly changing and growing in volume, particularly as a result of increased global regulations.
A failure to comply with local rules and regulations could result in significant fines or other sanctions.
The Group’s ability to operate internationally is of critical importance and as a result understanding and complying with local and international regulations is an area of permanent focus. To ensure it remains compliant as the business and regulations change, the Group employs specialist advisers in each of its main territories and at head office. Active dialogue is also maintained with relevant parties, such as tax authorities, to ensure transparency and a proactive approach to compliance.
The Group also operates an internal audit function, outsourced to a specialist firm with a local presence in each of our countries of operation, who perform reviews of the business units including local compliance processes.
Failure to integrate an acquisition
The Group is acquisitive with the purchase and integration of carefully selected target businesses an important generator of growth. A failure to appropriately evaluate an acquisition target’s business before it is bought, or to successfully integrate its operations into the Group and deliver any required synergies post-integration, could have a significantly adverse impact on Group results.
We operate strict evaluation criteria for any potential acquisition and review targets against this throughout the M&A process, which includes the use of third-party due diligence professionals for technical areas such as tax, legal and, where complex, financial diligence. Deal evaluation includes sensitivity analysis and risk evaluation.
Any acquisition that completes will be overseen by one or more senior management team members who will be responsible for closely monitoring and reporting to the Board on the businesses performance against acquisition deal targets and expectations. Synergy target performance is monitored specifically, as is payback together with other KPIs specific to the individual acquisition.
Quality, innovative design
International operations and capability
Fully empowered business units
Trusted partner to our customers
Manufacturing and sourcing expertise
Key to business model links
IG Design Group plcAnnual report and financial statements 2017
30
Corporate, social and environmental responsibility
Our employees, shareholders, communities, partners and customers are all vital to the success of our business, which is why we take seriously our corporate social responsibility.
Throughout all of our operations, we work hard to comply with the highest possible standards, in line with our unwavering commitment to our employees, our customers and our planet. In upholding the highest standards of ethical behaviour, it is our aim to foster the relationships we have with all of our stakeholders, continuing to build a more considerate and sustainable company.
In line with the Group’s rebrand and structural unification, our entire Group now acts collectively in its commitment to our shared economic, social and environmental sustainability aims.
StakeholdersAll of our stakeholders – our customers, employees, suppliers and investors – are vital to the success of the Group. But it’s our people, their energy, commitment, focus and calibre which make the Group the reliable and agile business it is.
We invest in our people; from training and education offered throughout the Group, through to opportunities for career progression, the Group offers an environment in which our employees are encouraged to grow and deliver their very best. It’s these same opportunities which allow The Design Group to attract and retain the brightest talent.
Our recent rebrand and unifying restructure has resulted in the Group being better positioned than ever to offer consistently high levels of service to our customers globally. Resource pooling and data sharing allow for the Group to always deliver our best, with key information, learnings and guidelines shared between Group companies.
Through recognising that each of our customers is unique and so requires a different service to satisfy their needs and expectations, we work hard to build deep and lasting relationships with our customers. Our ability, product offering, unique design capabilities and our fundamental aim of becoming a partner of choice to our customers allows the Group to make the most out of every commercial opportunity that presents itself.
By leveraging recent and ongoing investments in equipment and technology, the Group now offers customers a portfolio of products and service that enables us to compete and grow.
Health, safety and human rightsThe Group is committed to providing a safe workplace for all employees in every area of our business. A strong and visible commitment to health and safety is present throughout the Group.
It is our aim to exceed the requirements of health and safety legislation and we deploy experts to ensure continuous improvement of health and safety across all our businesses.
We take human rights seriously and continuously strive to strengthen and protect the systems and management in this area. The Modern Day Slavery Act come into force in 2015 and we have taken steps to promote and improve our commitment to removing abuse and exploitation in the workplace.
Sustainability and environmentIn every area of our business, we have a deep-rooted belief in doing our part to protect the environment and preserve our planet.
From using vetted suppliers who share our environmentally aware views and commitments, through to our ongoing efforts to cut waste and recycle materials wherever possible, sustainability is a part of everything we do.
As well as operational commitments, we encourage an ethos of energy-saving and environmental protection, encouraging our suppliers and our employees to consider the impact their actions have on the wider world. This culture of preservation is backed by operational efficiency in all aspects of our business, with measures in place to make the most out of the resources and supplies we have.
Continuous reviews take place within the Group, with the aim of enhancing our overall environmental performance, reducing waste and holding ourselves to account.
As an international group, we understand that our responsibilities extend beyond the walls of our business, into the environment, the community and the wider world.
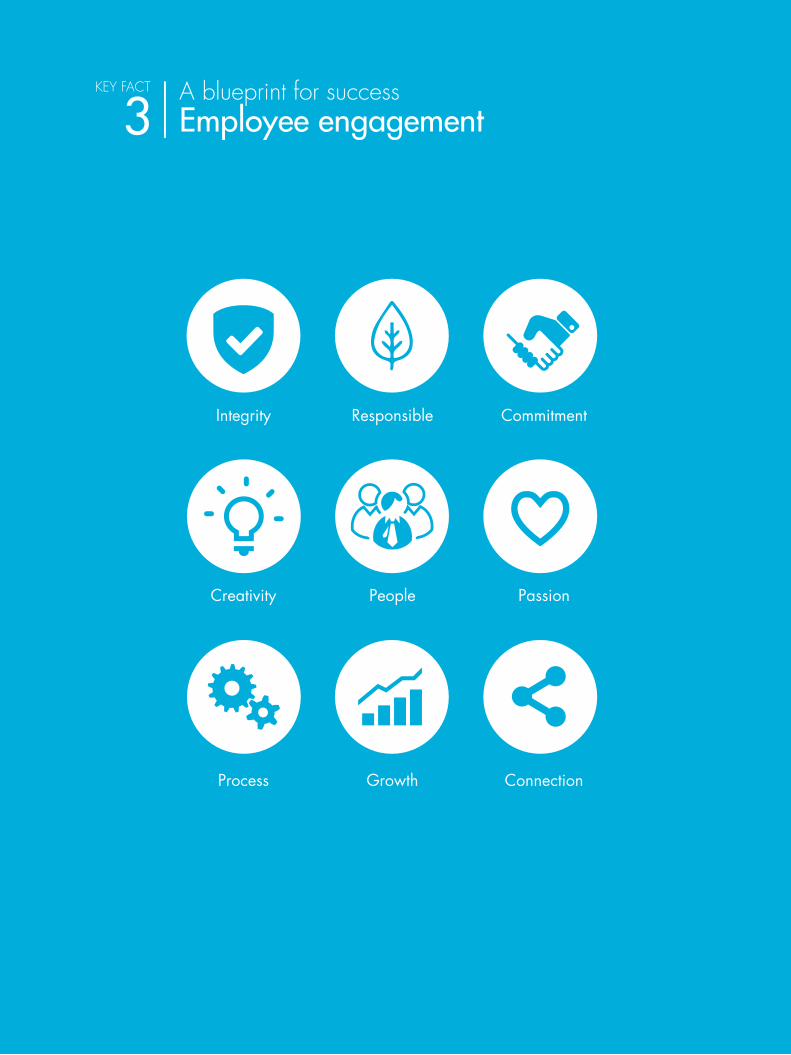
IG Design Group plcAnnual report and financial statements 2017
Strategic report
5
Page titleA blueprint for successEmployee engagement
KEY FACT
Integrity Responsible Commitment
Creativity People Passion
Process Growth Connection
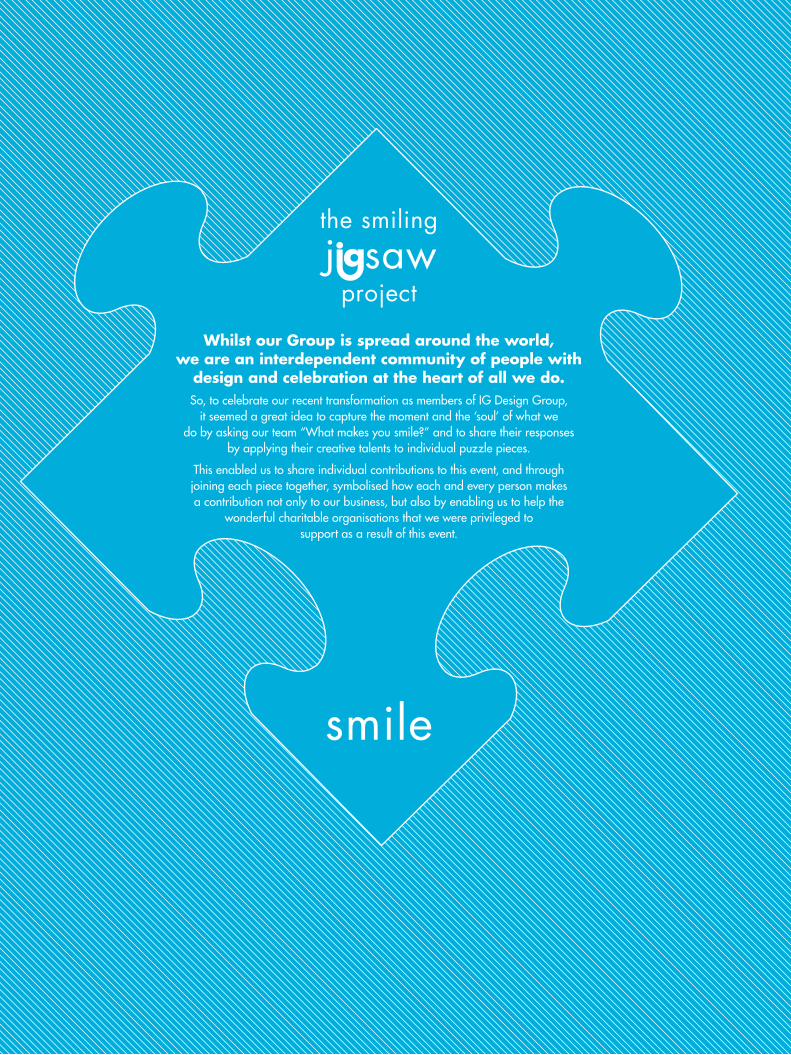
IG Design Group plcAnnual report and financial statements 2017
6
Page title
Whilst our Group is spread around the world, we are an interdependent community of people with
design and celebration at the heart of all we do. So, to celebrate our recent transformation as members of IG Design Group,
it seemed a great idea to capture the moment and the ‘soul’ of what we do by asking our team “What makes you smile?” and to share their responses
by applying their creative talents to individual puzzle pieces.
This enabled us to share individual contributions to this event, and through joining each piece together, symbolised how each and every person makes a contribution not only to our business, but also by enabling us to help the
wonderful charitable organisations that we were privileged to support as a result of this event.
smile
the smiling
project
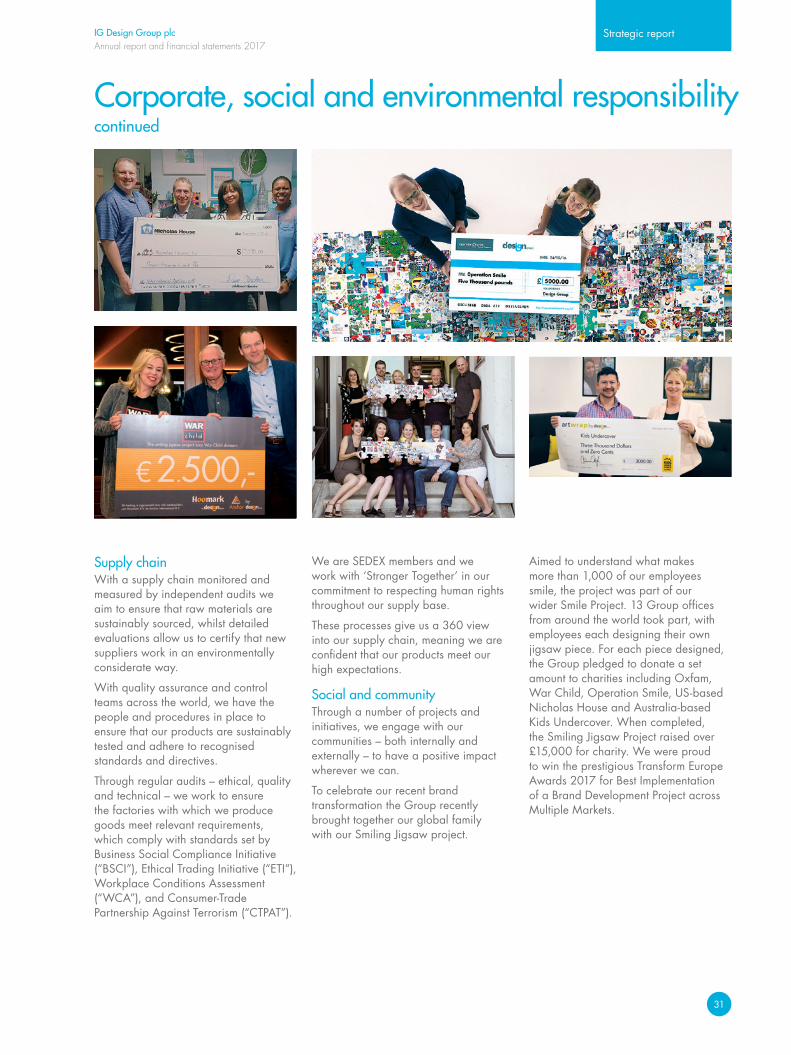
IG Design Group plcAnnual report and financial statements 2017
Strategic report
31
Corporate, social and environmental responsibilitycontinued
Supply chainWith a supply chain monitored and measured by independent audits we aim to ensure that raw materials are sustainably sourced, whilst detailed evaluations allow us to certify that new suppliers work in an environmentally considerate way.
With quality assurance and control teams across the world, we have the people and procedures in place to ensure that our products are sustainably tested and adhere to recognised standards and directives.
Through regular audits – ethical, quality and technical – we work to ensure the factories with which we produce goods meet relevant requirements, which comply with standards set by Business Social Compliance Initiative (“BSCI”), Ethical Trading Initiative (“ETI”), Workplace Conditions Assessment (“WCA”), and Consumer-Trade Partnership Against Terrorism (“CTPAT”).
We are SEDEX members and we work with ‘Stronger Together’ in our commitment to respecting human rights throughout our supply base.
These processes give us a 360 view into our supply chain, meaning we are confident that our products meet our high expectations.
Social and community Through a number of projects and initiatives, we engage with our communities – both internally and externally – to have a positive impact wherever we can.
To celebrate our recent brand transformation the Group recently brought together our global family with our Smiling Jigsaw project.
Aimed to understand what makes more than 1,000 of our employees smile, the project was part of our wider Smile Project. 13 Group offices from around the world took part, with employees each designing their own jigsaw piece. For each piece designed, the Group pledged to donate a set amount to charities including Oxfam, War Child, Operation Smile, US-based Nicholas House and Australia-based Kids Undercover. When completed, the Smiling Jigsaw Project raised over £15,000 for charity. We were proud to win the prestigious Transform Europe Awards 2017 for Best Implementation of a Brand Development Project across Multiple Markets.
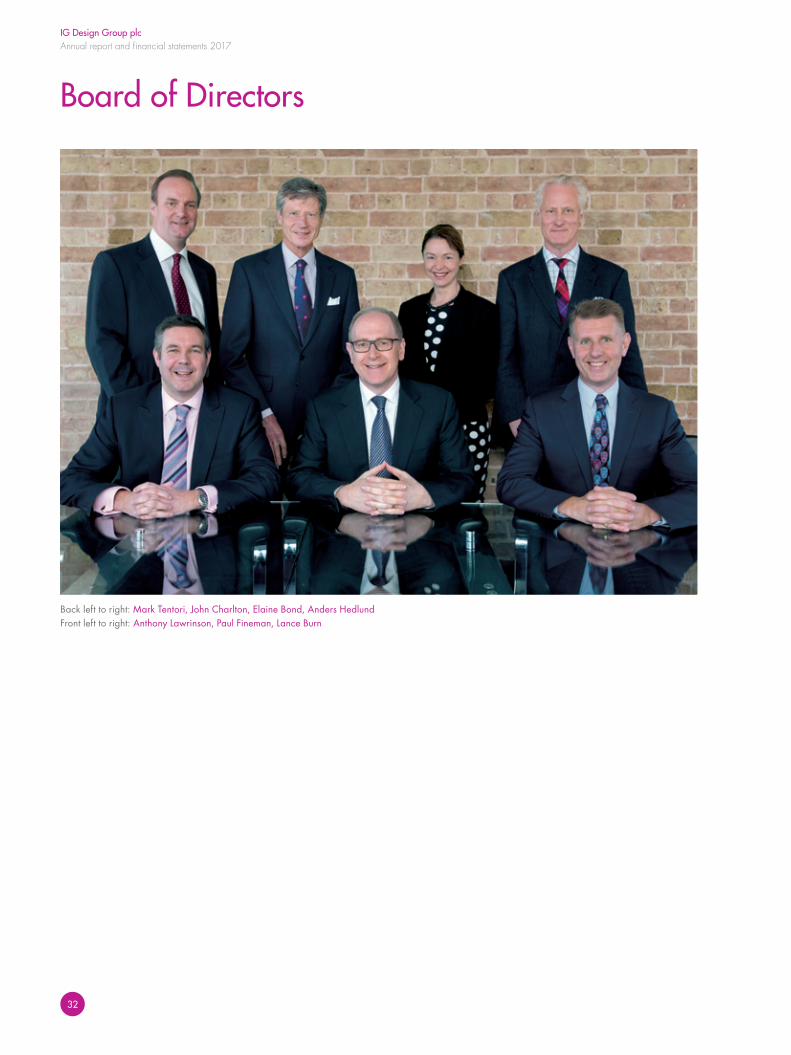
IG Design Group plcAnnual report and financial statements 2017
32
Board of Directors
Back left to right: Mark Tentori, John Charlton, Elaine Bond, Anders HedlundFront left to right: Anthony Lawrinson, Paul Fineman, Lance Burn
IG Design Group plcAnnual report and financial statements 2017
Governance
33
John CharltonNon‑Executive ChairmanJohn joined the Board in April 2010 and was appointed Chairman of the Board on 7 September 2011. John is a member of the Audit and Remuneration Committees and Chairs the Nomination Committee. John is also Chairman of SA Greeting (Pty) Ltd and was Chairman of Amscan International Ltd. In his executive career, he was previously Senior Vice President International of American Greetings Corporation and Chief Executive of UK Greetings Ltd.
Committees
Anders HedlundFounder and Non‑Executive Deputy ChairmanAnders founded the Group in 1979 and was joint Chief Executive Officer of International Greetings until December 2007, when he was appointed as Nominee Non‑Executive Director.
Lance BurnExecutive DirectorLance joined the Board in October 2012 and has been Managing Director of IG Design Group UK Limited since 2009 and the Group’s subsidiary operation in China since 2011. Lance’s previous roles included directing businesses for Rank Hovis McDougal plc, Saint Gobain Solaglas UK and also international overseas‑based roles for Pepsico International in Africa and India.
Paul FinemanChief Executive OfficerPaul joined the Board in May 2005 as Chief Executive Officer of Anker International PLC. He was appointed Group Managing Director in January 2008 and then appointed Group CEO in January 2009. Paul was awarded Chief Executive Officer of the Year by the Quoted Companies Awards 2017.
Elaine BondNon‑Executive DirectorElaine joined the Board as a Non‑Executive Director on 1 February 2012. Elaine chairs the Remuneration Committee and is a member of the Audit and Nomination Committees. She was until recently a Non‑Executive Director of Yorkshire Ambulance Service and was previously Group Operations Director of UK Greetings Ltd, the UK subsidiary of American Greetings.
Committees
Anthony LawrinsonChief Financial Officer and Company SecretaryAnthony joined the Board in October 2011 as Chief Financial Officer and Company Secretary. Having qualified with Price Waterhouse, Anthony’s former roles included Group Finance Director of Reliance Security Group, Chief Financial Officer at O2 Airwave, and Group Treasurer at O2 PLC and Hickson International PLC. Anthony is a member of the ICAEW and a Fellow of the Association of Corporate Treasurers.
Mark TentoriNon‑Executive DirectorMark joined the Board as a Non‑Executive Director and Chair of the Audit Committee on 1 January 2016. He is a member of the Remuneration and Nomination Committees. Mark is currently Portfolio Partner at Charterhouse Capital Partners LLP. Prior to this, Mark held a number of CFO and COO roles in public and private companies operating in a wide range of sectors and geographic locations. These included CFO of Deb Group Ltd, United Coffee and LINPAC Group Ltd. Mark also spent ten years with Price Waterhouse where he qualified as a Chartered Accountant.
Committees
Audit Committee
Remuneration Committee
Nomination Committee
Chair
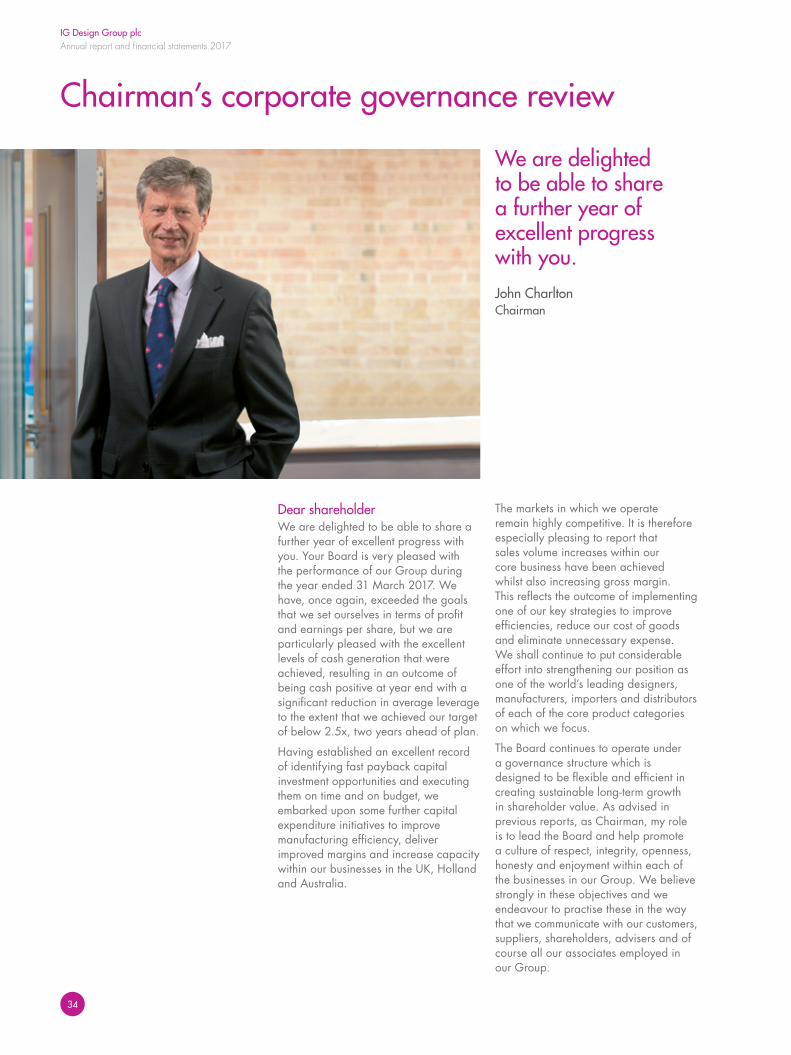
IG Design Group plcAnnual report and financial statements 2017
34
Chairman’s corporate governance review
Dear shareholderWe are delighted to be able to share a further year of excellent progress with you. Your Board is very pleased with the performance of our Group during the year ended 31 March 2017. We have, once again, exceeded the goals that we set ourselves in terms of profit and earnings per share, but we are particularly pleased with the excellent levels of cash generation that were achieved, resulting in an outcome of being cash positive at year end with a significant reduction in average leverage to the extent that we achieved our target of below 2.5x, two years ahead of plan.
Having established an excellent record of identifying fast payback capital investment opportunities and executing them on time and on budget, we embarked upon some further capital expenditure initiatives to improve manufacturing efficiency, deliver improved margins and increase capacity within our businesses in the UK, Holland and Australia.
The markets in which we operate remain highly competitive. It is therefore especially pleasing to report that sales volume increases within our core business have been achieved whilst also increasing gross margin. This reflects the outcome of implementing one of our key strategies to improve efficiencies, reduce our cost of goods and eliminate unnecessary expense. We shall continue to put considerable effort into strengthening our position as one of the world’s leading designers, manufacturers, importers and distributors of each of the core product categories on which we focus.
The Board continues to operate under a governance structure which is designed to be flexible and efficient in creating sustainable long‑term growth in shareholder value. As advised in previous reports, as Chairman, my role is to lead the Board and help promote a culture of respect, integrity, openness, honesty and enjoyment within each of the businesses in our Group. We believe strongly in these objectives and we endeavour to practise these in the way that we communicate with our customers, suppliers, shareholders, advisers and of course all our associates employed in our Group.
We are delighted to be able to share a further year of excellent progress with you.John CharltonChairman
IG Design Group plcAnnual report and financial statements 2017
Governance
35
Corporate governanceAs previously reported, the UK Corporate Governance Code (formerly the Combined Code) sets out standards of good practice in relation to board leadership and effectiveness, remuneration, accountability, audit, risk management and relations with shareholders.
Whilst there is no obligation for AIM‑listed companies to comply fully with this Code, the Board endorses the principles of effective corporate governance and we are committed to maintaining the highest standards of ethics and professional competence. That said, the Directors do not consider that full compliance with every aspect of the Code is appropriate for our Group at this stage in its development. However, we shall keep the matter under review and continue to develop procedures and policies as the Group grows.
Board of DirectorsThe principal duty of the Board is to represent and protect the interests of the Company’s shareholders. The Board plays an important role in working with the executive management in each of our businesses to ensure that our businesses are well governed, financially strong, and that we mitigate any risks that our managers identify. Your Board continues to work hard to strike that essential balance between achieving our short‑term objectives and longer‑term growth and development. To this end, your Board has a policy to work closely with management in developing proposals on strategy for each of our businesses and for our Group, as a whole.
Division of responsibilitiesThere is a distinct and defined division of responsibilities between the Chairman and the Chief Executive Officer (CEO). The Chairman is primarily responsible for the effective working of the Board in conjunction with management and the CEO for the operational management of the business and for the implementation of the strategy agreed by the Board.
Composition of the BoardThere were no changes to the composition of the Board during the year. We continue to operate with three Executive Directors balanced by three Non‑Executive Directors, with myself as Chairman. Our Non‑Executive Directors have an important role of constructively challenging, and working closely with the Executive Directors to develop and agree proposals on strategy, to scrutinise management’s performance in meeting agreed goals and objectives and monitoring performance reports.
The Board has three Committees – Remuneration, Audit and Nomination. Our Remuneration Committee is chaired by Elaine Bond, one of our Non‑Executive Directors and the Committee comprises Mark Tentori and myself. Our Audit Committee comprises Elaine and myself and is chaired by Mark. Our Nomination Committee is chaired by myself, and Elaine and Mark sit on that Committee.
The Audit Committee satisfies itself on the integrity of financial information and that controls and risk management systems within our businesses are robust and defensible. The Committee meets as required during the year and at least twice with the Group’s external auditor. Its role is to review the interim and final financial statements for approval by the Board, to ensure that operational and financial controls are functioning properly, and to provide the forum through which the Group’s external auditor reports to the Board.
On completion of the audit, the Committee reviewed the performance of its external auditor KPMG LLP, with feedback from executive management. The Committee has resolved to propose KPMG’s re‑appointment at the next Annual General Meeting.
Following a competitive tender process in the autumn of 2016, the Company appointed Mazars LLP to provide internal audit services to the Group. As the internal auditors, Mazars will perform a series of audits across the Group in line with the risk‑based internal audit plan. This plan will be reviewed and approved annually by the Committee. Mazars will meet with the Committee to present the findings of their work and follow‑up checks twice a year.
The Remuneration Committee determines appropriate levels of remuneration and compensation for Executive Directors. The Committee meets as required during the year and is closely involved in agreeing the positions within our senior management team that should participate in our Long Term Incentive Plan (“LTIP”), together with the level of awards. The Remuneration Committee is also responsible for agreeing the performance criteria for annual bonuses and LTIP for Executive Directors and senior management.
Anders Hedlund, who founded our Group, is a Nominee Director. Anders Hedlund is presumed not independent, because as founder, he has served on the Board since the Company’s inception, his family hold significant interests in the shareholding of the Company and he also fulfils a consultancy role within one of the Group’s businesses. As reported in the financial statements, there are also some related party transactions between certain of the subsidiaries within our Group and companies under the ultimate control of the Hedlund family.
As at the date of this report, all of the other Non‑Executive Directors are considered independent under the UK Corporate Governance Code.
IG Design Group plcAnnual report and financial statements 2017
36
Chairman’s corporate governance reviewcontinued
Board process and informationThe Board met seven times during the year, including an in‑depth review of 2017/18 budgets, annual operating plans and strategic objectives with the Executive Directors and some members of the senior management teams of our businesses. This took place over two days during March 2017. The Board aims to meet at least six times a year for formal Board meetings and up to six further times in between for informal business reviews, to review budgets and to focus on strategy. As previously advised, where possible and cost effective, the Board tries to meet on the premises of various of its subsidiaries during the year, which provides an opportunity for the Directors to visit our businesses, meet with the senior management and be seen by our associates as a Board that genuinely wishes to be involved.
Dialogue occurs regularly between Directors outside of scheduled meetings. Meeting agendas include review and approval of minutes recorded, matters arising, a review of material operational matters relating to our businesses and other special items for discussion or consideration. Board papers are usually circulated at least three business days in advance to allow Directors adequate time to prepare.
Our Non‑Executive Directors also meet as a team outside of Board meetings to discuss the performance of our Board as a whole and various topics and matters that require their specific input and attention.
The Board receives operational and financial information and reports from the CEO/CFO to assist in monitoring and assessing the ongoing performance of the businesses on a monthly basis.
Accountability and auditAll Directors have accepted a duty of care and accountability to act in the interests of the Company.
As stated, the Audit Committee oversees how the Board monitors risk and reviews the adequacy of the risk management framework.
Risk managementThe Board of Directors has overall responsibility for the establishment and oversight of the Group’s risk management framework. The Group’s risk management systems, policies and procedures are established to identify and analyse the risks faced by the Group, to set appropriate risk limits and controls, and to monitor the risks and adherence to limits. Such a system is designed to manage, rather than eliminate, the risk of failure to achieve business objectives and can only provide a reasonable and not absolute assurance against material misstatement or loss.
Risk management processes are reviewed regularly by the Audit Committee to reflect changes in market conditions and the Group’s activities. The Board’s oversight covers all controls, including financial, operational and compliance controls and general risk management. It is based principally on reviewing reports from management to consider whether significant risks are identified, evaluated, managed and controlled and whether any significant weaknesses are promptly remedied and indicate the need for more extensive monitoring.
Whilst this report provides an overview of the policies and procedures that we adopt in following good corporate governance, I wish to take the opportunity of thanking my fellow Directors for their hard work, commitment, loyalty and support that they give to our Group. I also wish to place on record once again our sincere thanks and appreciation to all our employees and associates throughout the Group. It is through their efforts and support that we are, once again, able to report another year of very strong progress. We value greatly their commitment and loyalty. It is also with great pride that I congratulate Paul Fineman, our Group CEO on being recognised with the award of Chief Executive Officer of the Year by the Quoted Company Awards 2017.
Finally, I should like to take this opportunity to thank our shareholders, bankers, customers, suppliers and advisers for their input and contributions to all our businesses throughout the world. As always, we never take your support for granted and we are very appreciative of the strong working relationship and partnership that we continue to enjoy with you.
John CharltonChairman
26 June 2017
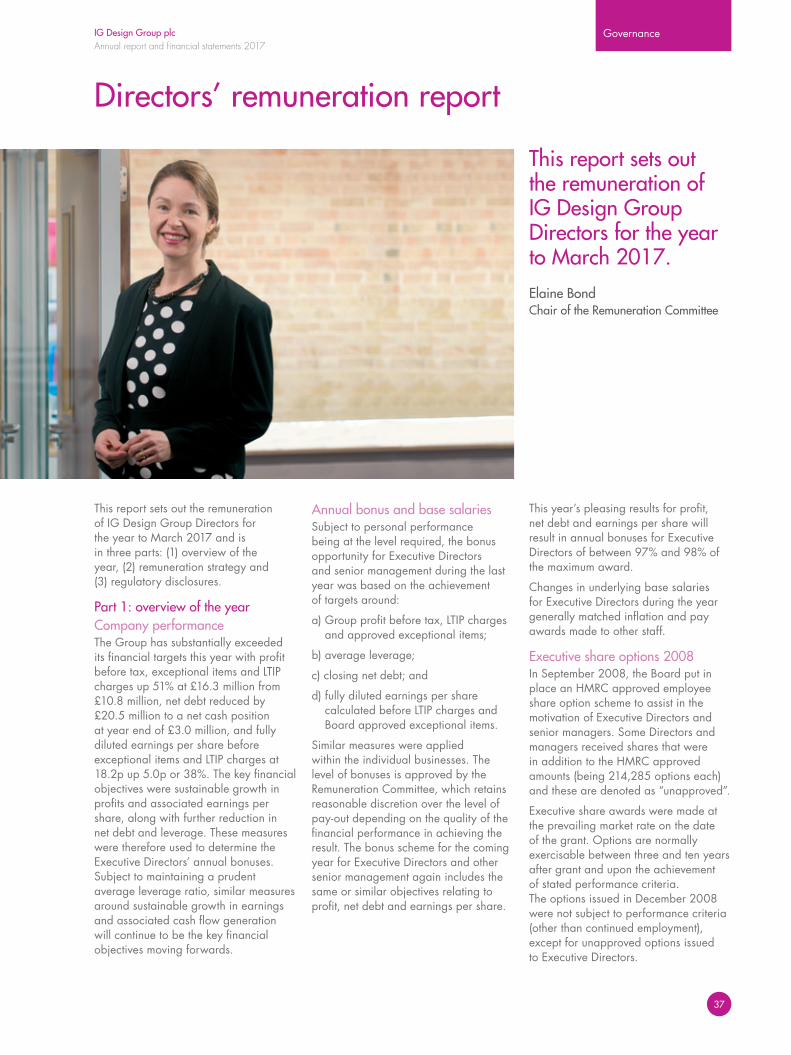
IG Design Group plcAnnual report and financial statements 2017
Governance
37
Directors’ remuneration report
This report sets out the remuneration of IG Design Group Directors for the year to March 2017 and is in three parts: (1) overview of the year, (2) remuneration strategy and (3) regulatory disclosures.
Part 1: overview of the year Company performanceThe Group has substantially exceeded its financial targets this year with profit before tax, exceptional items and LTIP charges up 51% at £16.3 million from £10.8 million, net debt reduced by £20.5 million to a net cash position at year end of £3.0 million, and fully diluted earnings per share before exceptional items and LTIP charges at 18.2p up 5.0p or 38%. The key financial objectives were sustainable growth in profits and associated earnings per share, along with further reduction in net debt and leverage. These measures were therefore used to determine the Executive Directors’ annual bonuses. Subject to maintaining a prudent average leverage ratio, similar measures around sustainable growth in earnings and associated cash flow generation will continue to be the key financial objectives moving forwards.
Annual bonus and base salariesSubject to personal performance being at the level required, the bonus opportunity for Executive Directors and senior management during the last year was based on the achievement of targets around:
a) Group profit before tax, LTIP charges and approved exceptional items;
b) average leverage;
c) closing net debt; and
d) fully diluted earnings per share calculated before LTIP charges and Board approved exceptional items.
Similar measures were applied within the individual businesses. The level of bonuses is approved by the Remuneration Committee, which retains reasonable discretion over the level of pay‑out depending on the quality of the financial performance in achieving the result. The bonus scheme for the coming year for Executive Directors and other senior management again includes the same or similar objectives relating to profit, net debt and earnings per share.
This year’s pleasing results for profit, net debt and earnings per share will result in annual bonuses for Executive Directors of between 97% and 98% of the maximum award.
Changes in underlying base salaries for Executive Directors during the year generally matched inflation and pay awards made to other staff.
Executive share options 2008In September 2008, the Board put in place an HMRC approved employee share option scheme to assist in the motivation of Executive Directors and senior managers. Some Directors and managers received shares that were in addition to the HMRC approved amounts (being 214,285 options each) and these are denoted as “unapproved”.
Executive share awards were made at the prevailing market rate on the date of the grant. Options are normally exercisable between three and ten years after grant and upon the achievement of stated performance criteria. The options issued in December 2008 were not subject to performance criteria (other than continued employment), except for unapproved options issued to Executive Directors.
This report sets out the remuneration of IG Design Group Directors for the year to March 2017.Elaine BondChair of the Remuneration Committee
IG Design Group plcAnnual report and financial statements 2017
38
Directors’ remuneration reportcontinued
Part 1: overview of the year continuedExecutive share options 2008 continuedNo further options are being granted under this scheme. These options may be exercised between 17 December 2011 and 17 December 2018.
There are no Directors currently holding share options under this scheme (2016: nil). There have been no grants under this scheme during the year.
The mid‑market price of the Company’s shares on 31 March 2017 was 311p per share; the highest and lowest mid‑market prices of the Company’s shares during the year were 317p and 145p respectively.
Long Term Incentive PlanOn 31 March 2014, the Company announced the introduction of a new Long Term Incentive Plan (“LTIP”). Under the LTIP, ordinary shares of 5p each (“ordinary shares”) may be awarded annually to Executive Board Directors of the Company, Managing Directors and other selected senior management team (“SMT”) members within the Group. Ordinary shares only vest to the degree that stretching performance conditions are met. The maximum dilution under the LTIP is 15% over a ten‑year period, excluding the 2012‑2015 award to Anthony Lawrinson set out below and disregarding prior option schemes. The scheme rules which have been agreed by the Remuneration Committee include reasonable provisions in the event of change of control, suitable flexibility to modify performance targets in specified situations and also a mechanism for claw‑back under certain circumstances. The Board retains the flexibility for the Employee Benefit Trust to buy ordinary shares to mitigate future dilution.
The performance period for each award under the LTIP is expected to be three years. The cost to employees of ordinary shares issued under the LTIP, if the performance criterion is met, will be
nil. In principle the number of ordinary shares to be granted to each employee under the LTIP will not in value be more than 100% of the relevant employee’s salary based on the relevant share price at the time of grant, although the rules allow an upper maximum of 150%.
LTIP 2012‑2015 awardsOf a maximum of 1,400,000 shares 1,107,652 shares vested in favour of Anthony Lawrinson in June 2015 with the balance lapsing. Of these, 500,000 have not yet been exercised.
No shares were exercised during the year (2016: 607,652).
LTIP 2014‑2017 awardsProvisional share awards totalling 1,297,698 (1,330,351 after adjusting for the effect of dividends) were issued during the year to 18 members of the leadership teams across the Group. The performance condition applied is CAGR in fully diluted earnings per share before exceptional items and this must be not less than 10% for any initial vesting to take place and up to 20% for the whole amount to vest. Both Anthony Lawrinson and Lance Burn as Executive Directors hold awards under the scheme as disclosed on page 42.
The CAGR achieved over the three‑year period was 23%.
All of these shares formally vested on 21 June 2017 following Remuneration Committee and Audit Committee approval of the results for the year ended 31 March 2017.
LTIP 2015‑2018 awardsProvisional share awards totalling 1,176,859 (1,216,833 after adjusting for the effect of dividends) were issued during the year to 26 members of the leadership teams across the Group. The performance conditions applied are a) fully diluted earnings per share (measured before LTIP charges and exceptional items), b) profit before tax, LTIP and exceptional items and
c) average leverage. Vesting increases on a straight‑line basis and the full number of shares are issuable when all three stretch targets are met. For more details on the performance conditions see note 25. Paul Fineman, Anthony Lawrinson and Lance Burn as Executive Directors hold provisional awards under the scheme as disclosed on page 42.
LTIP 2016‑2019 awardsProvisional share awards totalling 896,649 (916,509 after adjusting for the effect of dividends) were issued to 28 members of the leadership teams across the Group. The performance conditions applied are a) fully diluted earnings per share (measured before LTIP charges and exceptional items) and b) profit before tax, LTIP and exceptional items. Vesting increases on a straight‑line basis and the full number of shares are issuable when both stretch targets are met. For more details on the performance conditions see note 25. Paul Fineman, Anthony Lawrinson and Lance Burn as Executive Directors hold provisional awards under the scheme as disclosed on page 42.
2016/17 annual bonusThe aggregate annual bonus of the Executive Directors to be paid in respect of the year ended 31 March 2017 has increased from £575,336 in the prior year to approximately £789,910. This remuneration is directly linked to meeting profit, average leverage, net debt and earnings per share targets, which have been reflected in the Company’s increased share price.
The Remuneration Committee has carefully reviewed the level of performance related remuneration earned by the Executive Directors. The Committee considers that it is a strong reflection of the Company’s operating and financial performance over the past year and that it is aligned with the financial interests of shareholders generally.
IG Design Group plcAnnual report and financial statements 2017
Governance
39
Other Remuneration Committee highlightsDuring the year the Committee considered the following:
• overall remuneration structure and levels for Executive Directors and other senior management members;
• targets for the annual bonus potential for Executive Directors and senior management for 2017/18, including the consistency of bonus targets with other management and staff; and
• awards under the new LTIP scheme, and appropriate performance criteria.
The Committee believes the Company’s remuneration strategy, and the structures implementing that strategy, have contributed positively to maintaining the stable and highly motivated management team of the Company, who have continued to deliver consistently strong performances for shareholders.
Part 2: remuneration strategy and policy The Group’s remuneration policy is to ensure that the remuneration of Executive Directors is sufficiently competitive to enable the Group to retain and motivate existing Directors and attract high‑quality performers in the future. The Group aims to incentivise and reward its Executive Directors in a way that is consistent with the Group’s commercial objectives and to align the interests of the Directors with those of the shareholders. To achieve this, the Executive Directors’ total remuneration comprises both fixed remuneration and variable reward, the latter reflecting Company performance. The main elements of remuneration for Executive Directors are set out below. Only the basic salary is pensionable.
The Group’s remuneration policy in respect of Non‑Executive Directors is to pay annual fees which reflect the responsibilities and duties placed upon them, whilst also having regard to market practice.
The remuneration of the Non‑Executive Directors and of the Chairman is set by the Board.
Part 3: additional regulatory disclosuresThe Remuneration CommitteeThe Remuneration Committee was established by the Board and operates under terms of reference agreed by the Board on 29 September 2008 and updated on 25 February 2015. Elaine Bond was appointed Chair so as to have a fully independent Chairperson who is not the Chairperson for the Main Board.
The Remuneration Committee consists of:
• Elaine Bond (Chairperson of the Remuneration Committee);
• John Charlton (Non‑Executive Chairman); and
• Mark Tentori (Non‑Executive Director).
Role of Remuneration CommitteeThe Committee determines the remuneration of the Group’s Executive Directors, and reviews that of senior executives; who report directly to the Group CEO. It is also responsible for determining the targets for performance‑related pay schemes, approving any award of the Company’s shares under share option or incentive schemes to employees, and overseeing any major changes in employee benefit structures. The Committee members have no conflicts of interest arising from cross‑directorships and no Director is permitted to be involved in any decisions as to his or her own remuneration.
Remuneration Committee workplanThe Remuneration Committee takes the following approach in the course of the year:
Standing compliance items:
• minutes of the last meeting, action log and matters arising;
• feedback from the Board meetings;• compensation authorisation for CEO
direct reports, prior to appointment, as necessary;
• approval of payments to CEO direct reports to apply on termination of employment, as necessary;
• approval of any remuneration consultants to advise Committee, as necessary;
• due regard to published information regarding pay, bonuses and other executive benefits in companies comparable to the Company (benchmarking), as proposed by CEO or work independently commissioned by the Committee; and
• due regard to published documents regarding remuneration and changes to UK Corporate Governance Code (as advised by the Company Secretary).
Remuneration Committee workplanMeeting date and specific/assurance Items
April
Agree bonus targets for next financial yearAgree any changes to remuneration for Chairman, CEO, CEO direct reports and information on SMT membersAgree bonus awards for current financial yearReview detail of LTIPs vesting
June
Agree LTIP awardsAgree LTIP scheme for next financial yearReview and agreement of service agreements for CEO direct reports and SMT (to include notice periods and compensation commitment on early termination)Agree remuneration section of Company annual report
November
Review and agreement of expense claims policyReview and agreement of pension contribution arrangements and benefits in kind awards for CEO direct reports and SMTAnnual review of terms of referenceReview of training requirements for Remuneration Committee members
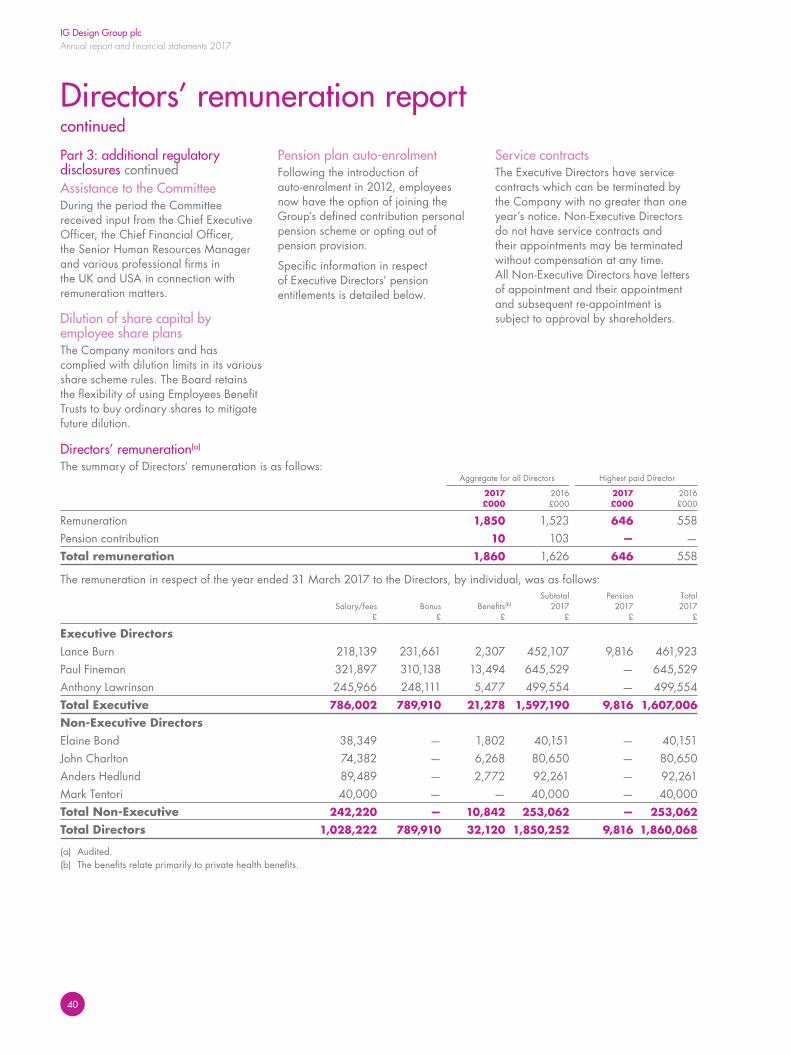
IG Design Group plcAnnual report and financial statements 2017
40
Directors’ remuneration reportcontinued
Part 3: additional regulatory disclosures continuedAssistance to the CommitteeDuring the period the Committee received input from the Chief Executive Officer, the Chief Financial Officer, the Senior Human Resources Manager and various professional firms in the UK and USA in connection with remuneration matters.
Dilution of share capital by employee share plansThe Company monitors and has complied with dilution limits in its various share scheme rules. The Board retains the flexibility of using Employees Benefit Trusts to buy ordinary shares to mitigate future dilution.
Pension plan auto‑enrolmentFollowing the introduction of auto‑enrolment in 2012, employees now have the option of joining the Group’s defined contribution personal pension scheme or opting out of pension provision.
Specific information in respect of Executive Directors’ pension entitlements is detailed below.
Service contractsThe Executive Directors have service contracts which can be terminated by the Company with no greater than one year’s notice. Non‑Executive Directors do not have service contracts and their appointments may be terminated without compensation at any time. All Non‑Executive Directors have letters of appointment and their appointment and subsequent re‑appointment is subject to approval by shareholders.
Directors’ remuneration(a)
The summary of Directors’ remuneration is as follows: Aggregate for all Directors Highest paid Director 2017 2016 2017 2016 £000 £000 £000 £000
Remuneration 1,850 1,523 646 558Pension contribution 10 103 — —Total remuneration 1,860 1,626 646 558
The remuneration in respect of the year ended 31 March 2017 to the Directors, by individual, was as follows: Subtotal Pension Total Salary/fees Bonus Benefits(b) 2017 2017 2017 £ £ £ £ £ £
Executive Directors Lance Burn 218,139 231,661 2,307 452,107 9,816 461,923Paul Fineman 321,897 310,138 13,494 645,529 — 645,529Anthony Lawrinson 245,966 248,111 5,477 499,554 — 499,554Total Executive 786,002 789,910 21,278 1,597,190 9,816 1,607,006
Non‑Executive Directors Elaine Bond 38,349 — 1,802 40,151 — 40,151John Charlton 74,382 — 6,268 80,650 — 80,650Anders Hedlund 89,489 — 2,772 92,261 — 92,261Mark Tentori 40,000 — — 40,000 — 40,000Total Non‑Executive 242,220 — 10,842 253,062 — 253,062
Total Directors 1,028,222 789,910 32,120 1,850,252 9,816 1,860,068
(a) Audited.(b) The benefits relate primarily to private health benefits.
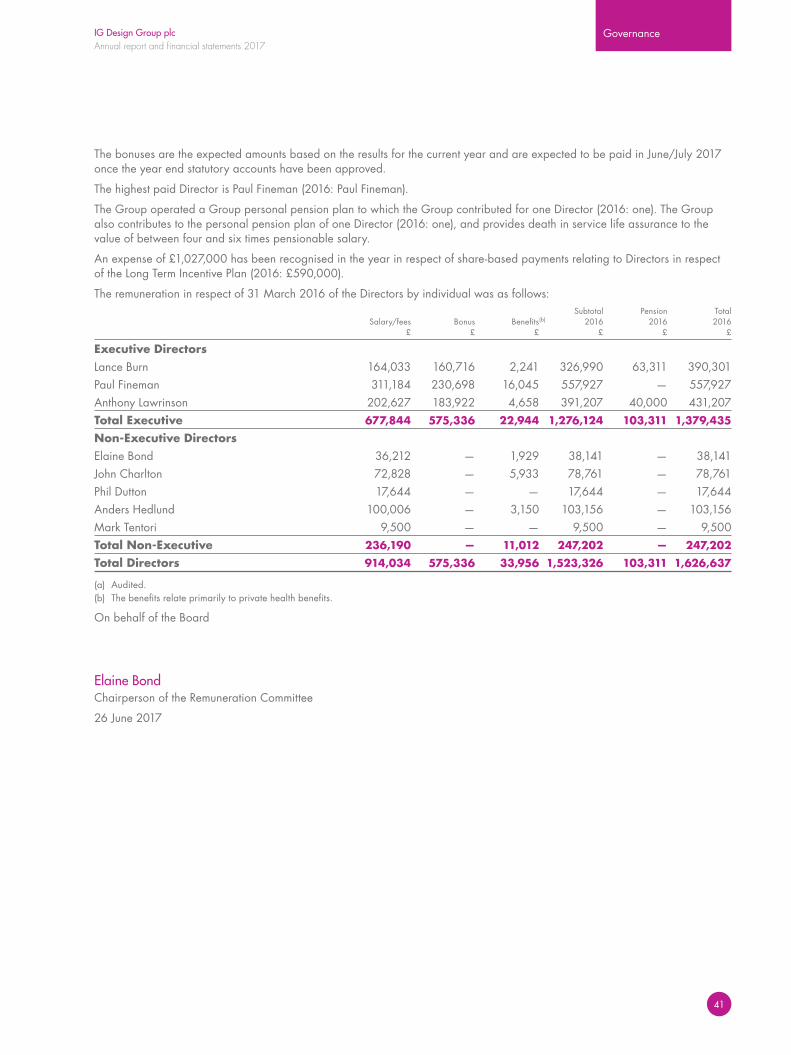
IG Design Group plcAnnual report and financial statements 2017
Governance
41
The bonuses are the expected amounts based on the results for the current year and are expected to be paid in June/July 2017 once the year end statutory accounts have been approved.
The highest paid Director is Paul Fineman (2016: Paul Fineman).
The Group operated a Group personal pension plan to which the Group contributed for one Director (2016: one). The Group also contributes to the personal pension plan of one Director (2016: one), and provides death in service life assurance to the value of between four and six times pensionable salary.
An expense of £1,027,000 has been recognised in the year in respect of share‑based payments relating to Directors in respect of the Long Term Incentive Plan (2016: £590,000).
The remuneration in respect of 31 March 2016 of the Directors by individual was as follows: Subtotal Pension Total Salary/fees Bonus Benefits(b) 2016 2016 2016 £ £ £ £ £ £
Executive Directors Lance Burn 164,033 160,716 2,241 326,990 63,311 390,301Paul Fineman 311,184 230,698 16,045 557,927 — 557,927Anthony Lawrinson 202,627 183,922 4,658 391,207 40,000 431,207Total Executive 677,844 575,336 22,944 1,276,124 103,311 1,379,435
Non‑Executive Directors Elaine Bond 36,212 — 1,929 38,141 — 38,141John Charlton 72,828 — 5,933 78,761 — 78,761Phil Dutton 17,644 — — 17,644 — 17,644Anders Hedlund 100,006 — 3,150 103,156 — 103,156Mark Tentori 9,500 — — 9,500 — 9,500Total Non‑Executive 236,190 — 11,012 247,202 — 247,202
Total Directors 914,034 575,336 33,956 1,523,326 103,311 1,626,637
(a) Audited.(b) The benefits relate primarily to private health benefits.
On behalf of the Board
Elaine BondChairperson of the Remuneration Committee
26 June 2017
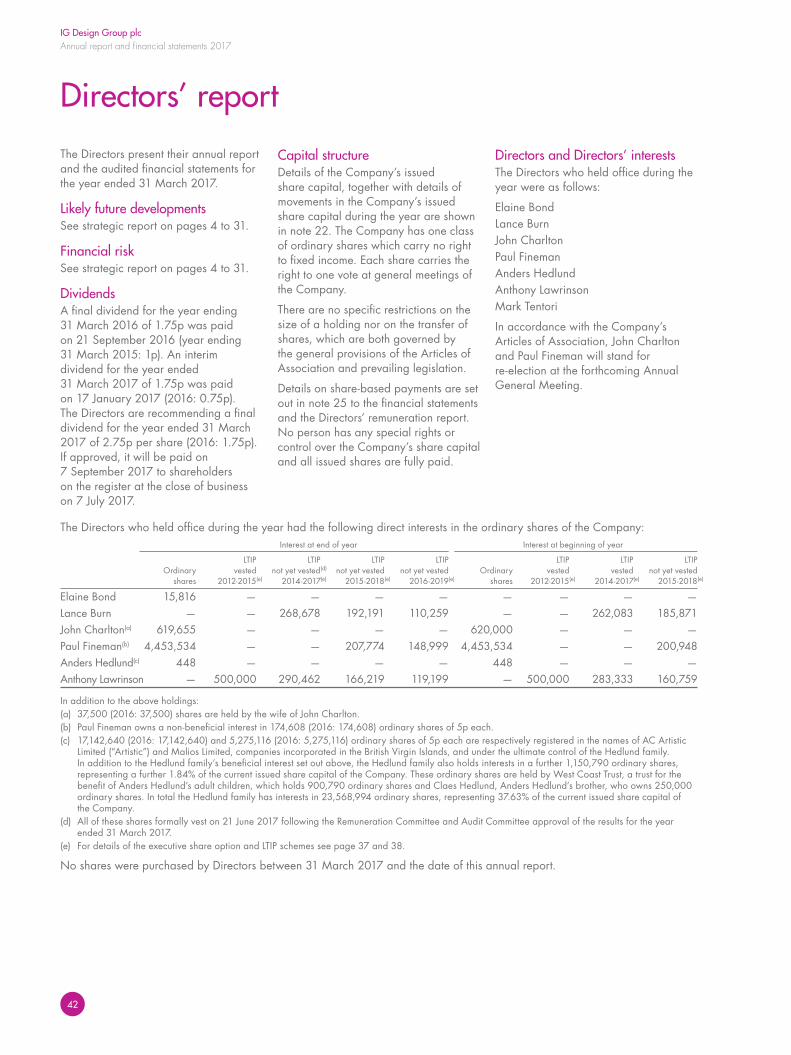
IG Design Group plcAnnual report and financial statements 2017
42
Directors’ reportThe Directors present their annual report and the audited financial statements for the year ended 31 March 2017.
Likely future developmentsSee strategic report on pages 4 to 31.
Financial riskSee strategic report on pages 4 to 31.
DividendsA final dividend for the year ending 31 March 2016 of 1.75p was paid on 21 September 2016 (year ending 31 March 2015: 1p). An interim dividend for the year ended 31 March 2017 of 1.75p was paid on 17 January 2017 (2016: 0.75p). The Directors are recommending a final dividend for the year ended 31 March 2017 of 2.75p per share (2016: 1.75p). If approved, it will be paid on 7 September 2017 to shareholders on the register at the close of business on 7 July 2017.
Capital structureDetails of the Company’s issued share capital, together with details of movements in the Company’s issued share capital during the year are shown in note 22. The Company has one class of ordinary shares which carry no right to fixed income. Each share carries the right to one vote at general meetings of the Company.
There are no specific restrictions on the size of a holding nor on the transfer of shares, which are both governed by the general provisions of the Articles of Association and prevailing legislation.
Details on share‑based payments are set out in note 25 to the financial statements and the Directors’ remuneration report. No person has any special rights or control over the Company’s share capital and all issued shares are fully paid.
Directors and Directors’ interestsThe Directors who held office during the year were as follows:
Elaine BondLance Burn John Charlton Paul Fineman Anders Hedlund Anthony Lawrinson Mark Tentori
In accordance with the Company’s Articles of Association, John Charlton and Paul Fineman will stand for re‑election at the forthcoming Annual General Meeting.
The Directors who held office during the year had the following direct interests in the ordinary shares of the Company: Interest at end of year Interest at beginning of year LTIP LTIP LTIP LTIP LTIP LTIP LTIP Ordinary vested not yet vested(d) not yet vested not yet vested Ordinary vested vested not yet vested shares 2012‑2015(e) 2014‑2017(e) 2015‑2018(e) 2016‑2019(e) shares 2012‑2015(e) 2014‑2017(e) 2015‑2018(e)
Elaine Bond 15,816 — — — — — — — —Lance Burn — — 268,678 192,191 110,259 — — 262,083 185,871John Charlton(a) 619,655 — — — — 620,000 — — —Paul Fineman(b) 4,453,534 — — 207,774 148,999 4,453,534 — — 200,948Anders Hedlund(c) 448 — — — — 448 — — —Anthony Lawrinson — 500,000 290,462 166,219 119,199 — 500,000 283,333 160,759
In addition to the above holdings:(a) 37,500 (2016: 37,500) shares are held by the wife of John Charlton.(b) Paul Fineman owns a non‑beneficial interest in 174,608 (2016: 174,608) ordinary shares of 5p each.(c) 17,142,640 (2016: 17,142,640) and 5,275,116 (2016: 5,275,116) ordinary shares of 5p each are respectively registered in the names of AC Artistic
Limited (“Artistic”) and Malios Limited, companies incorporated in the British Virgin Islands, and under the ultimate control of the Hedlund family. In addition to the Hedlund family’s beneficial interest set out above, the Hedlund family also holds interests in a further 1,150,790 ordinary shares, representing a further 1.84% of the current issued share capital of the Company. These ordinary shares are held by West Coast Trust, a trust for the benefit of Anders Hedlund’s adult children, which holds 900,790 ordinary shares and Claes Hedlund, Anders Hedlund’s brother, who owns 250,000 ordinary shares. In total the Hedlund family has interests in 23,568,994 ordinary shares, representing 37.63% of the current issued share capital of the Company.
(d) All of these shares formally vest on 21 June 2017 following the Remuneration Committee and Audit Committee approval of the results for the year ended 31 March 2017.
(e) For details of the executive share option and LTIP schemes see page 37 and 38.
No shares were purchased by Directors between 31 March 2017 and the date of this annual report.
IG Design Group plcAnnual report and financial statements 2017
Governance
43
EmployeesThe Group recognises the benefits of keeping employees informed on matters affecting them as employees and on the various factors affecting the performance of the Group. This is achieved through employee briefings that are held in most businesses at least twice a year and regular team briefings.
The Group conforms to current employment laws on the employment of disabled persons and, where we are informed of any employee disability, management makes all reasonable efforts to accommodate that employee’s requirements.
DonationsPolitical contributions in the year were nil (2016: nil).
Health and safetyThe Group is committed to maintaining high standards of health and safety in every area of the business.
It is the aim of the Group to exceed the requirements of health and safety legislation and we have established a health and safety co‑ordinator to ensure continuous improvement of health and safety across the Group.
Going concernThe Group’s business activities, together with the factors likely to affect its future development, its performance and position are set out in the Chief Executive Officer’s review. The financial position of the Group, its cash flows, liquidity position and its management of both working capital and capital expenditure are set out in the financial review. Details of bank loans and borrowings are given in note 17 to the financial statements and liquidity risks are given in note 26 to the financial statements.
The Group relies on its banks for financial support and is confident that the facilities in place are sufficient to meet its needs for the foreseeable future (see note 1 to the financial statements). Accordingly the Directors continue to adopt the going concern basis in preparing the financial statements.
Purchase of own sharesThe Directors are authorised to make market purchases of the Company’s own shares under an authority granted at the last Annual General Meeting. During the year the Company did not buy back any of its shares. The Directors will seek renewal of this authority at the forthcoming Annual General Meeting and at each succeeding Annual General Meeting.
Any shares purchased under this authority would either be treated as cancelled (and the number of shares in issue reduced accordingly) or held in treasury, available for re‑sale by the Company or transferred to an employee share scheme.
AuditorThe Directors who held office at the date of approval of this annual report confirm that, so far as they are each aware, there is no relevant audit information of which the Company’s auditor is unaware and, each Director has taken all the steps that ought to have been taken as a Director to make himself aware of any relevant audit information and to establish that the Company’s auditor is aware of that information. This confirmation is given and should be interpreted in accordance with the provisions of Section 418 of the Companies Act 2006.
By order of the Board
Anthony LawrinsonDirector
26 June 2017
IG Design Group plcAnnual report and financial statements 2017
44
Statement of Directors’ responsibilitiesin respect of the annual report and the Directors’ report and financial statementsThe Directors are responsible for preparing the annual report and the Group and Parent Company financial statements in accordance with applicable law and regulations.
Company law requires the Directors to prepare Group and Parent Company financial statements for each financial year. As required by the AIM Rules of the London Stock Exchange they are required to prepare the Group financial statements in accordance with IFRS as adopted by the EU and applicable law and have elected to prepare the Parent Company financial statements in accordance with UK Accounting Standards and applicable law (UK Generally Accepted Accounting Practice) including FRS 102 the Financial Reporting Standard applicable in the UK and Republic of Ireland.
Under company law the Directors must not approve the financial statements unless they are satisfied that they give a true and fair view of the state of affairs of the Group and Parent Company and of their profit or loss for that period. In preparing each of the Group and Parent Company financial statements, the Directors are required to:
• select suitable accounting policies and then apply them consistently;
• make judgements and estimates that are reasonable and prudent;
• for the Group financial statements, state whether they have been prepared in accordance with IFRS as adopted by the EU;
• for the Parent Company financial statements, state whether applicable UK Accounting Standards have been followed, subject to any material departures disclosed and explained in the financial statements; and
• prepare the financial statements on the going concern basis unless it is inappropriate to presume that the Group and the Parent Company will continue in business.
The Directors are responsible for keeping adequate accounting records that are sufficient to show and explain the Parent Company’s transactions and disclose with reasonable accuracy at any time the financial position of the Parent Company and enable them to ensure that its financial statements comply with the Companies Act 2006. They have general responsibility for taking such steps as are reasonably open to them to safeguard the assets of the Group and to prevent and detect fraud and other irregularities.
The Directors are responsible for the maintenance and integrity of the corporate and financial information included on the Company’s website. Legislation in the UK governing the preparation and dissemination of financial statements may differ from legislation in other jurisdiction.
IG Design Group plcAnnual report and financial statements 2017
Financials – Group
45
We have audited the financial statements of IG Design Group plc for the year ended 31 March 2017 set out on pages 46 to 102. The financial reporting framework that has been applied in the preparation of the Group financial statements is applicable law and International Financial Reporting Standards (IFRSs) as adopted by the EU. The financial reporting framework that has been applied in the preparation of the Parent Company financial statements is applicable law and UK Accounting Standards (UK Generally Accepted Accounting Practice), including FRS 102 The Financial Reporting Standard applicable in the UK and Republic of Ireland.
This report is made solely to the Company’s members, as a body, in accordance with Chapter 3 of Part 16 of the Companies Act 2006. Our audit work has been undertaken so that we might state to the Company’s members those matters we are required to state to them in an auditor’s report and for no other purpose. To the fullest extent permitted by law, we do not accept or assume responsibility to anyone other than the Company and the Company’s members, as a body, for our audit work, for this report, or for the opinions we have formed.
Respective responsibilities of Directors and auditorAs explained more fully in the Statement of Directors’ responsibilities set out on page 44, the Directors are responsible for the preparation of the financial statements and for being satisfied that they give a true and fair view. Our responsibility is to audit, and express an opinion on, the financial statements in accordance with applicable law and International Standards on Auditing (UK and Ireland). Those standards require us to comply with the Auditing Practices Board’s Ethical Standards for Auditors.
Scope of the audit of the financial statements A description of the scope of an audit of financial statements is provided on the Financial Reporting Council’s website at www.frc.org.uk/auditscopeukprivate.
Opinion on financial statements In our opinion:
• the financial statements give a true and fair view of the state of the Group’s and of the Parent Company’s affairs as at 31 March 2017 and of the Group’s profit for the year then ended;
• the Group financial statements have been properly prepared in accordance with IFRSs as adopted by the EU;
• the Parent Company financial statements have been properly prepared in accordance with UK Generally Accepted Accounting Practice; and
• the financial statements have been prepared in accordance with the requirements of the Companies Act 2006.
Opinion on other matters prescribed by the Companies Act 2006 In our opinion the information given in the Strategic report and the Directors’ report for the financial year is consistent with the financial statements.
Based solely on the work required to be undertaken in the course of the audit of the financial statements and from reading the Strategic report and the Directors’ report:
• we have not identified material misstatements in those reports; and
• in our opinion, those reports have been prepared in accordance with the Companies Act 2006.
Matters on which we are required to report by exceptionWe have nothing to report in respect of the following matters where the Companies Act 2006 requires us to report to you if, in our opinion:
• adequate accounting records have not been kept by the Parent Company, or returns adequate for our audit have not been received from branches not visited by us; or
• the Parent Company financial statements are not in agreement with the accounting records and returns; or
• certain disclosures of Directors’ remuneration specified by law are not made; or
• we have not received all the information and explanations we require for our audit.
Peter Selvey Senior Statutory Auditor for and on behalf of KPMG LLP Chartered Accountants Altius House One North Fourth Street Milton Keynes MK9 1NE
26 June 2017
Independent auditor’s reportto the members of IG Design Group plc
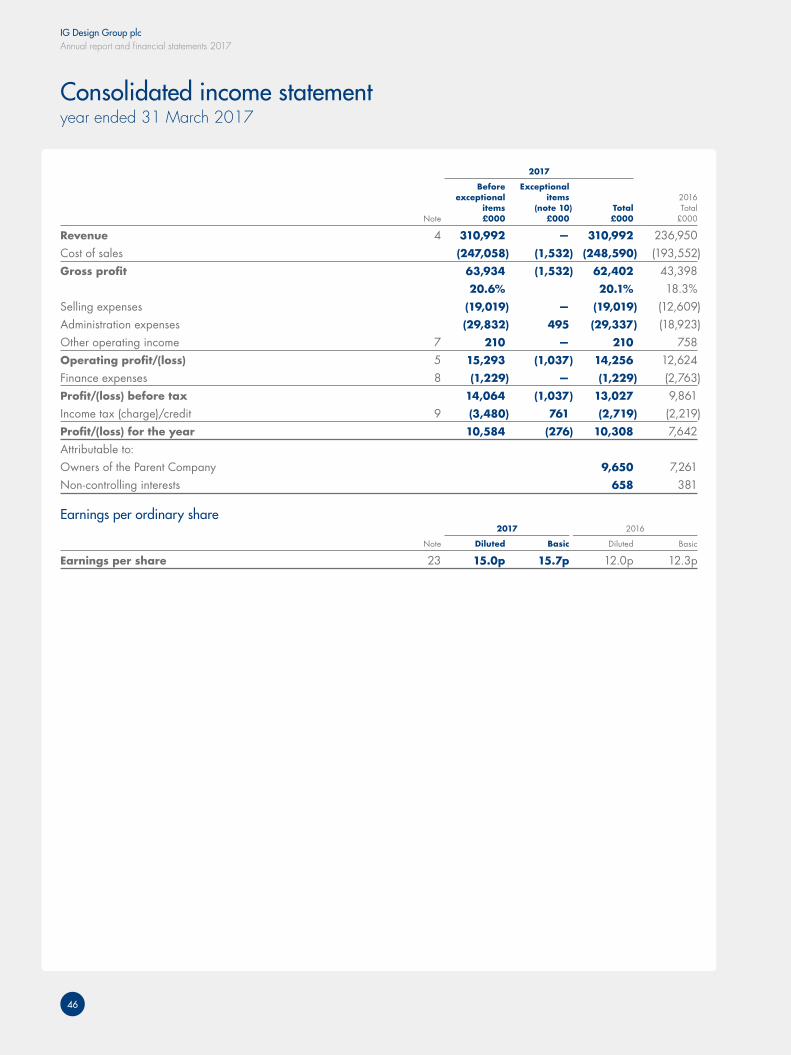
IG Design Group plcAnnual report and financial statements 2017
46
Consolidated income statementyear ended 31 March 2017
2017
Before Exceptional exceptional items 2016 items (note 10) Total Total Note £000 £000 £000 £000
Revenue 4 310,992 — 310,992 236,950 Cost of sales (247,058) (1,532) (248,590) (193,552)Gross profit 63,934 (1,532) 62,402 43,398 20.6% 20.1% 18.3%Selling expenses (19,019) — (19,019) (12,609)Administration expenses (29,832) 495 (29,337) (18,923)Other operating income 7 210 — 210 758 Operating profit/(loss) 5 15,293 (1,037) 14,256 12,624 Finance expenses 8 (1,229) — (1,229) (2,763)Profit/(loss) before tax 14,064 (1,037) 13,027 9,861 Income tax (charge)/credit 9 (3,480) 761 (2,719) (2,219)Profit/(loss) for the year 10,584 (276) 10,308 7,642 Attributable to:Owners of the Parent Company 9,650 7,261 Non-controlling interests 658 381
Earnings per ordinary share 2017 2016 Note Diluted Basic Diluted Basic
Earnings per share 23 15.0p 15.7p 12.0p 12.3p
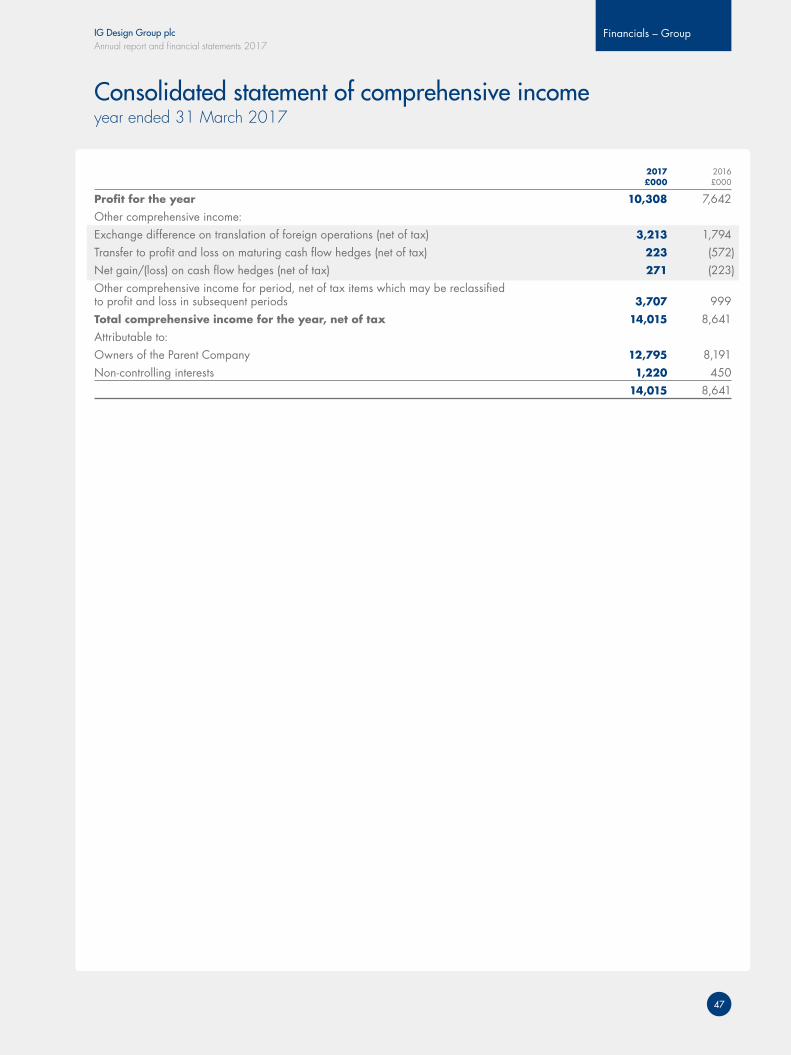
IG Design Group plcAnnual report and financial statements 2017
Financials – Group
47
Consolidated statement of comprehensive incomeyear ended 31 March 2017
2017 2016 £000 £000
Profit for the year 10,308 7,642 Other comprehensive income:Exchange difference on translation of foreign operations (net of tax) 3,213 1,794 Transfer to profit and loss on maturing cash flow hedges (net of tax) 223 (572)Net gain/(loss) on cash flow hedges (net of tax) 271 (223)Other comprehensive income for period, net of tax items which may be reclassified to profit and loss in subsequent periods 3,707 999 Total comprehensive income for the year, net of tax 14,015 8,641 Attributable to:Owners of the Parent Company 12,795 8,191 Non-controlling interests 1,220 450 14,015 8,641
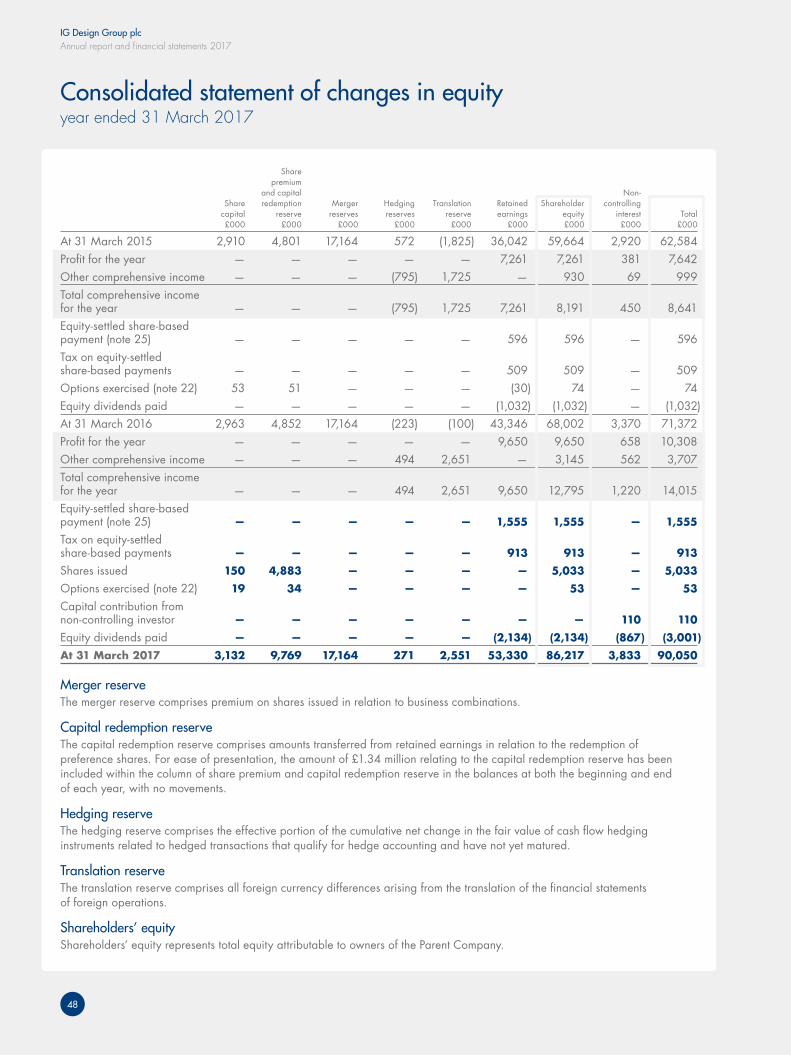
IG Design Group plcAnnual report and financial statements 2017
48
Consolidated statement of changes in equityyear ended 31 March 2017
Share premium and capital Non- Share redemption Merger Hedging Translation Retained Shareholder controlling capital reserve reserves reserves reserve earnings equity interest Total £000 £000 £000 £000 £000 £000 £000 £000 £000
At 31 March 2015 2,910 4,801 17,164 572 (1,825) 36,042 59,664 2,920 62,584 Profit for the year — — — — — 7,261 7,261 381 7,642 Other comprehensive income — — — (795) 1,725 — 930 69 999 Total comprehensive income for the year — — — (795) 1,725 7,261 8,191 450 8,641 Equity-settled share-based payment (note 25) — — — — — 596 596 — 596 Tax on equity-settled share-based payments — — — — — 509 509 — 509 Options exercised (note 22) 53 51 — — — (30) 74 — 74 Equity dividends paid — — — — — (1,032) (1,032) — (1,032)At 31 March 2016 2,963 4,852 17,164 (223) (100) 43,346 68,002 3,370 71,372 Profit for the year — — — — — 9,650 9,650 658 10,308 Other comprehensive income — — — 494 2,651 — 3,145 562 3,707 Total comprehensive income for the year — — — 494 2,651 9,650 12,795 1,220 14,015 Equity-settled share-based payment (note 25) — — — — — 1,555 1,555 — 1,555
Tax on equity-settled share-based payments — — — — — 913 913 — 913
Shares issued 150 4,883 — — — — 5,033 — 5,033 Options exercised (note 22) 19 34 — — — — 53 — 53
Capital contribution from non-controlling investor — — — — — — — 110 110
Equity dividends paid — — — — — (2,134) (2,134) (867) (3,001)
At 31 March 2017 3,132 9,769 17,164 271 2,551 53,330 86,217 3,833 90,050
Merger reserveThe merger reserve comprises premium on shares issued in relation to business combinations.
Capital redemption reserveThe capital redemption reserve comprises amounts transferred from retained earnings in relation to the redemption of preference shares. For ease of presentation, the amount of £1.34 million relating to the capital redemption reserve has been included within the column of share premium and capital redemption reserve in the balances at both the beginning and end of each year, with no movements.
Hedging reserveThe hedging reserve comprises the effective portion of the cumulative net change in the fair value of cash flow hedging instruments related to hedged transactions that qualify for hedge accounting and have not yet matured.
Translation reserveThe translation reserve comprises all foreign currency differences arising from the translation of the financial statements of foreign operations.
Shareholders’ equityShareholders’ equity represents total equity attributable to owners of the Parent Company.
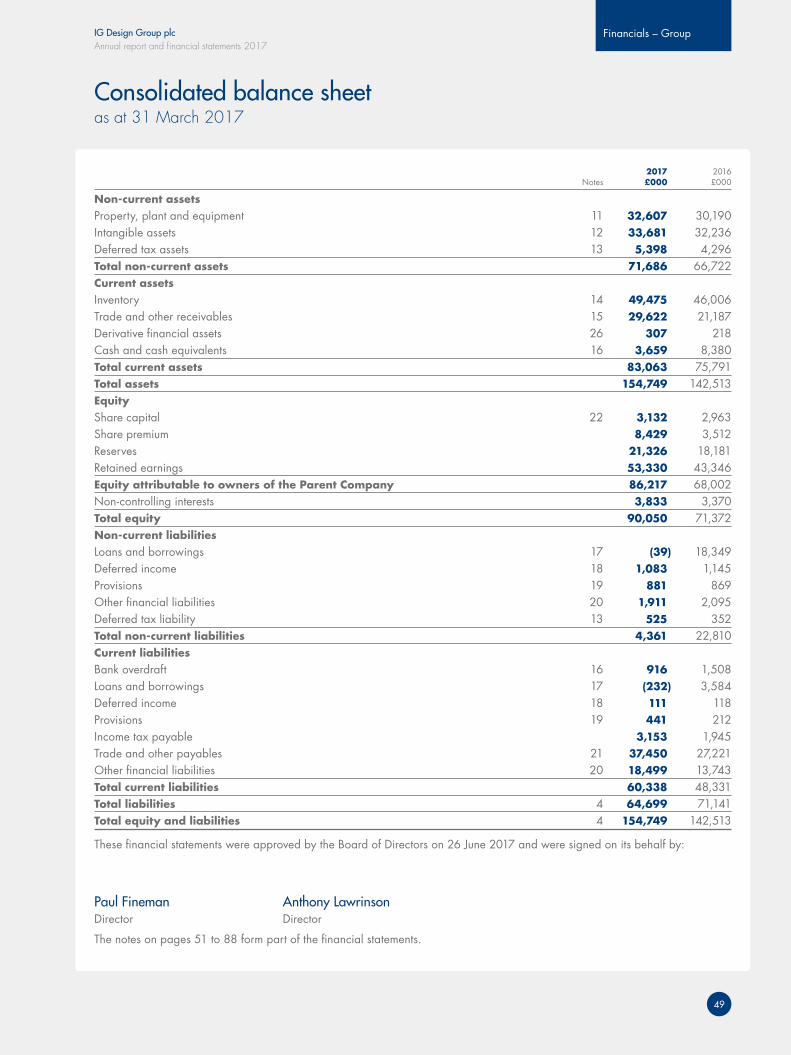
IG Design Group plcAnnual report and financial statements 2017
Financials – Group
49
Consolidated balance sheetas at 31 March 2017
2017 2016 Notes £000 £000
Non-current assetsProperty, plant and equipment 11 32,607 30,190 Intangible assets 12 33,681 32,236 Deferred tax assets 13 5,398 4,296 Total non-current assets 71,686 66,722 Current assetsInventory 14 49,475 46,006 Trade and other receivables 15 29,622 21,187 Derivative financial assets 26 307 218 Cash and cash equivalents 16 3,659 8,380 Total current assets 83,063 75,791 Total assets 154,749 142,513 EquityShare capital 22 3,132 2,963 Share premium 8,429 3,512 Reserves 21,326 18,181 Retained earnings 53,330 43,346 Equity attributable to owners of the Parent Company 86,217 68,002 Non-controlling interests 3,833 3,370 Total equity 90,050 71,372 Non-current liabilities Loans and borrowings 17 (39) 18,349 Deferred income 18 1,083 1,145 Provisions 19 881 869 Other financial liabilities 20 1,911 2,095 Deferred tax liability 13 525 352 Total non-current liabilities 4,361 22,810 Current liabilitiesBank overdraft 16 916 1,508 Loans and borrowings 17 (232) 3,584 Deferred income 18 111 118 Provisions 19 441 212 Income tax payable 3,153 1,945 Trade and other payables 21 37,450 27,221 Other financial liabilities 20 18,499 13,743 Total current liabilities 60,338 48,331 Total liabilities 4 64,699 71,141 Total equity and liabilities 4 154,749 142,513
These financial statements were approved by the Board of Directors on 26 June 2017 and were signed on its behalf by:
Paul Fineman Anthony Lawrinson Director Director
The notes on pages 51 to 88 form part of the financial statements.
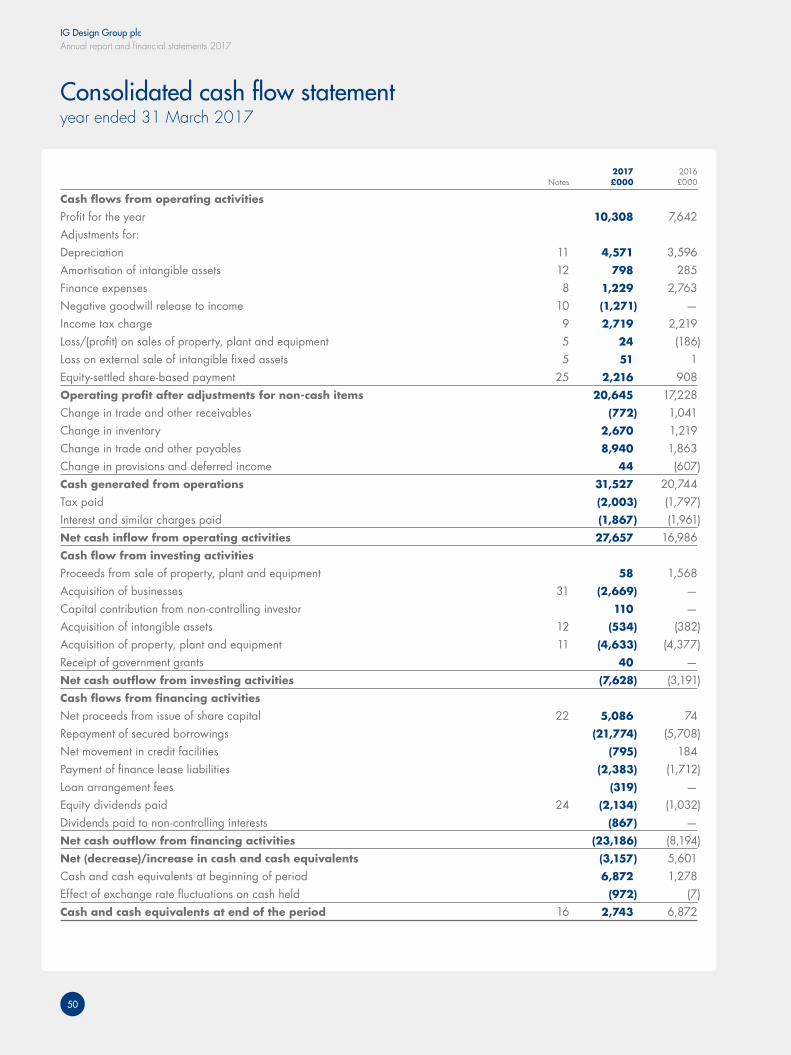
IG Design Group plcAnnual report and financial statements 2017
50
Consolidated cash flow statementyear ended 31 March 2017
2017 2016 Notes £000 £000
Cash flows from operating activities Profit for the year 10,308 7,642 Adjustments for: Depreciation 11 4,571 3,596 Amortisation of intangible assets 12 798 285 Finance expenses 8 1,229 2,763 Negative goodwill release to income 10 (1,271) —Income tax charge 9 2,719 2,219 Loss/(profit) on sales of property, plant and equipment 5 24 (186)Loss on external sale of intangible fixed assets 5 51 1 Equity-settled share-based payment 25 2,216 908 Operating profit after adjustments for non-cash items 20,645 17,228 Change in trade and other receivables (772) 1,041 Change in inventory 2,670 1,219 Change in trade and other payables 8,940 1,863 Change in provisions and deferred income 44 (607)Cash generated from operations 31,527 20,744 Tax paid (2,003) (1,797)Interest and similar charges paid (1,867) (1,961)Net cash inflow from operating activities 27,657 16,986 Cash flow from investing activities Proceeds from sale of property, plant and equipment 58 1,568 Acquisition of businesses 31 (2,669) —Capital contribution from non-controlling investor 110 —Acquisition of intangible assets 12 (534) (382)Acquisition of property, plant and equipment 11 (4,633) (4,377)Receipt of government grants 40 —Net cash outflow from investing activities (7,628) (3,191)Cash flows from financing activities Net proceeds from issue of share capital 22 5,086 74 Repayment of secured borrowings (21,774) (5,708)Net movement in credit facilities (795) 184 Payment of finance lease liabilities (2,383) (1,712)Loan arrangement fees (319) —Equity dividends paid 24 (2,134) (1,032)Dividends paid to non-controlling interests (867) —Net cash outflow from financing activities (23,186) (8,194)Net (decrease)/increase in cash and cash equivalents (3,157) 5,601 Cash and cash equivalents at beginning of period 6,872 1,278 Effect of exchange rate fluctuations on cash held (972) (7)Cash and cash equivalents at end of the period 16 2,743 6,872
IG Design Group plcAnnual report and financial statements 2017
Financials – Group
51
Notes to the consolidated financial statementsyear ended 31 March 2017
1 Accounting policiesIG Design Group plc is a public limited company, incorporated and domiciled in England and Wales. The Company’s ordinary shares are listed on AIM.
The Group financial statements consolidate those of the Company and its subsidiaries (together referred to as the “Group”).
The Group financial statements have been prepared and approved by the Directors in accordance with EU adopted International Financial Reporting Standards.
The accounting policies set out below have, unless otherwise stated, been applied consistently to all periods presented in these Group financial statements.
Judgements made by the Directors in the application of these accounting policies that have significant effect on the financial statements and estimates with a significant risk of material adjustment in the next year are discussed in the policies below.
Going concern basisThe financial statements have been prepared on the going concern basis.
In forming their conclusion that the business is and will remain a going concern, the Directors have reviewed the budgets and forecasts prepared and sensitivity analysis thereon. The business is highly seasonal and this results in peak funding demands.
To meet the funding requirements the business has agreed funding in place with HSBC and this has been renegotiated as part of a new three year deal in place from 6 June 2016 and extended for a further year on 31 May 2017. As with any company placing reliance on external entities for financial support, the Directors acknowledge that there can be no certainty that this support will continue although, at the date of approval of this report, they have no reason to believe that it will not do so.
After making enquiries, the Directors have a reasonable expectation that the Company and the Group have adequate resources to continue in operational existence for the foreseeable future. Thus, they continue to adopt the going concern basis of accounting in preparing the financial statements.
Measurement conventionThe financial statements are prepared on the historical cost basis except derivative financial instruments which are stated at their fair value.
Changes in accounting policiesThe accounting policies adopted in the preparation of the financial statements are consistent with those followed in the preparation of the Group’s annual financial statements for the year ended 31 March 2016.
Basis of consolidationa) Subsidiaries Subsidiaries are entities controlled by the Group. The Group considers all facts and circumstances in assessing whether it has the power to control the relevant activities of investee and to benefit from the results thereof, including rights arising from shareholder agreements, contractual arrangements and potential voting rights held by the Group. The financial statements of subsidiaries are included in the consolidated financial statements from the date that control commences to the date that control ceased.
Business combinations are accounted for using the acquisition method as at the date on which control is transferred to the Group.
For acquisitions on or after 1 January 2010, the Group measures goodwill at the acquisition date as:
• the fair value of the consideration transferred; plus
• the recognised amount of any non-controlling interests in the acquiree; plus
• if the business combination is achieved in stages, the fair value of the existing equity interest in the acquiree; less
• the net recognised amount (generally fair value) of the identifiable assets acquired and liabilities assumed.
When the result is negative, a ‘bargain purchase’ gain is recognised immediately in the income statement.
Provisional fair values allocated at a reporting date are finalised within twelve months of the acquisition date.
b) Joint arrangementsA joint venture is a contractual arrangement whereby the Group undertakes an economic activity that is subject to joint control with third parties.
The Group’s interests in joint ventures are accounted for using the equity method. Under this method the Group’s share of the profits less losses of jointly controlled entities is included in the consolidated income statement and its interest in their net assets is included in ‘investments’ in the consolidated balance sheet.
Foreign currency translationThe consolidated financial statements are presented in pounds sterling, which is the Company’s functional currency and the Group’s presentational currency.
Transactions in foreign currencies are translated at the foreign exchange rate ruling at the date of the transaction. Monetary assets and liabilities denominated in foreign currencies at the balance sheet date are translated at the foreign exchange rate ruling at that date. Foreign exchange differences arising on translation are recognised in the income statement.
IG Design Group plcAnnual report and financial statements 2017
52
Notes to the consolidated financial statements continuedyear ended 31 March 2017
1 Accounting policies continuedForeign currency translation continuedThe assets and liabilities of foreign operations, including goodwill and fair value adjustments arising on consolidation, are translated at foreign exchange rates ruling at the balance sheet date. The revenues and expenses of foreign operations are translated at an average rate for the period where this rate approximates to the foreign exchange rates ruling at the dates of the transactions. Exchange differences arising from this translation of foreign operations, and of related qualifying hedges, are taken directly to the translation reserve. They are released into the income statement upon disposal or loss of control and on maturity or disposal of the hedge, respectively.
Exchange differences arising from a monetary item receivable from or payable to a foreign operation, the settlement of which is neither planned nor likely in the foreseeable future, are considered to form part of a net investment in a foreign operation and are recognised in other comprehensive income in the translation reserve. The cumulative translation differences previously recognised in other comprehensive income (or where the foreign operation is part of a subsidiary, the parent’s interest in the cumulative translation differences) are released into the income statement upon disposal of the foreign operation or on loss of control of the subsidiary that includes the foreign operation.
Classification of financial instruments issued by the GroupFinancial instruments issued by the Group are treated as equity (i.e. forming part of shareholders’ funds) only to the extent that they meet the following two conditions:
a) they include no contractual obligations upon the Group to deliver cash or other financial assets or to exchange financial assets or
financial liabilities with another party under conditions that are potentially unfavourable to the Group; and
b) where the instrument will or may be settled in the Company’s own equity instruments, it is either a non-derivative that includes no obligation to deliver a variable number of the Company’s own equity instruments or is a derivative that will be settled by the Company’s exchanging a fixed amount of cash or other financial assets for a fixed number of its own equity instruments.
To the extent that this definition is not met, the proceeds of issue are classified as a financial liability. Where the instrument so classified takes the legal form of the Company’s own shares, the amounts presented in these financial statements for called up share capital and share premium exclude amounts in relation to those shares.
Trade and other receivablesTrade and other debtors are recognised initially at transaction price less attributable transaction costs. Trade and other debtors are subsequently reviewed for recoverability and impairment with any losses taken to profit and loss immediately. If the arrangement constitutes a financing transaction, for example if payment is deferred beyond normal business terms, then it is measured at the present value of future payments discounted at a market rate of instrument for a similar debt instrument.
Trade and other payablesWhere it is likely to be materially different from the nominal value, trade and other payables are recognised initially at fair value. Subsequent to initial recognition they are measured at amortised cost using the effective interest method.
Cash and cash equivalentsCash and cash equivalents comprise cash balances and call deposits. Bank overdrafts that are repayable on demand and form an integral part
of the Group’s cash management are included as a component of cash and cash equivalents for the purposes of the cash flow statement.
Interest‑bearing borrowingsInterest-bearing borrowings are recognised initially at fair value less attributable transaction costs. Subsequent to initial recognition, interest-bearing borrowings are stated at amortised cost using the effective interest method.
Derivative financial instruments and hedgingDerivative financial instrumentsDerivative financial instruments are recognised at fair value. The gain or loss on remeasurement to fair value is recognised immediately in the income statement. However, where derivatives qualify for hedge accounting, recognition of any resultant gain or loss depends on the nature of the item being hedged.
Cash flow hedgesWhere a derivative financial instrument is designated as a hedge of the variability in cash flows of a recognised asset or liability, or a highly probable forecast transaction, the effective part of any gain or loss on the derivative financial instrument is recognised as other comprehensive income in the hedging reserve. Any ineffective portion of the hedge is recognised immediately in the income statement.
Amounts previously recognised in other comprehensive income are transferred to the income statement in the periods when the hedged item affects profit or loss (for instance when the forecast sale that is hedged takes place). The gain or loss relating to the effective portion of forward foreign exchange contract hedging export sales is recognised in the income statement within ‘sales’. However, when the forecast transaction that is hedged results in the recognition of a non-financial asset (for example, inventory), the gains or losses previously recognised in other comprehensive income are transferred from other
IG Design Group plcAnnual report and financial statements 2017
Financials – Group
53
comprehensive income and included in the initial measurement of the cost of the asset. The deferred amounts are ultimately recognised in cost of goods sold (in the case of inventory).
When a hedging instrument expires or is sold, terminated or exercised, or the entity revokes designation of the hedge relationship but the hedged forecast transaction is still expected to occur, the cumulative gain or loss at that point remains in other comprehensive income and is recognised in accordance with the above policy when the transaction occurs. If the hedged transaction is no longer expected to take place, the cumulative unrealised gain or loss recognised in other comprehensive income is recognised in the income statement immediately.
Property, plant and equipmentProperty, plant and equipment is stated at cost less accumulated depreciation and impairment losses.
Where parts of an item of property, plant and equipment have different useful lives, they are accounted for as separate items of property, plant and equipment.
Leases in which the Group assumes substantially all the risks and rewards of ownership of the leased asset are classified as finance leases. Where land and buildings are held under finance leases the accounting treatment of the land is considered separately from that of the buildings. Leased assets acquired by way of a finance lease are stated at an amount equal to the lower of their fair value and the present value of the minimum lease payments at inception of the lease, less accumulated depreciation and impairment losses. Lease payments are accounted for as described below.
Depreciation is charged to the income statement on a straight-line basis over the estimated useful lives of each part of an item of property, plant and equipment. The estimated useful lives are as follows:
freehold buildings 25-30 yearsleasehold land and buildings life of leaseplant and equipment four-25 yearsfixtures and fittings three-five yearsmotor vehicles four years
No depreciation is provided on freehold land.
Included within plant and machinery are assets with a range of depreciation rates. These rates are tailored to the nature of the assets to reflect their estimated useful lives.
Depreciation methods, useful lives and residual values are reviewed at each balance sheet date.
Intangible assets and goodwillSubject to the transitional relief in IFRS 1, all business combinations are accounted for by applying the purchase method. Goodwill represents amounts arising on acquisition of subsidiaries. In respect of business acquisitions that have occurred since 1 April 2006, goodwill represents the difference between the cost of the acquisition and the fair value of the net identifiable assets acquired. Identifiable intangibles are those which can be sold separately or which arise from legal rights regardless of whether those rights are separable.
Goodwill is stated at cost less any accumulated impairment losses. Goodwill is allocated to cash-generating units and is not amortised but is tested every half year for impairment.
In respect of acquisitions prior to 1 April 2006, goodwill is included on the basis of its deemed cost, which represents the amount recorded under UK GAAP at that time which was broadly comparable save that only separable intangibles were recognised and goodwill was amortised. Goodwill written off to reserves under UK GAAP prior to 1998 has not been reinstated.
If the cost of an acquisition is less than the fair value of the Group’s share of the net assets of the subsidiary acquired, the difference is recognised directly in the income statement.
Other intangible assetsExpenditure on internally generated goodwill and brands is recognised in the income statement as an expense as incurred.
Other intangible assets that are acquired by the Group are stated at cost less accumulated amortisation and impairment losses.
The main class of other intangible assets is publishing imprints.
AmortisationAmortisation is charged to the income statement on a straight-line basis over the estimated useful lives of intangible assets unless such lives are indefinite. All other intangible assets are amortised from the date they are available for use. The estimated useful life of computer software and other intangibles are three to five years.
Amortisation charges are included under ‘administrative expenses’ in the income statement.
IG Design Group plcAnnual report and financial statements 2017
54
Notes to the consolidated financial statements continuedyear ended 31 March 2017
1 Accounting policies continuedInventoriesInventories are stated at the lower of cost and net realisable value. Cost is based on a weighted average and includes expenditure incurred in acquiring the inventories and bringing them to their existing location and condition. In the case of manufactured inventories and work in progress, cost includes an appropriate share of overheads based on normal operating capacity.
ImpairmentThe carrying amounts of the Group’s assets other than inventories and deferred tax assets are reviewed at each balance sheet date to determine whether there is any indication of impairment. If any such indication exists, the asset’s recoverable amount is estimated.
An impairment loss is recognised whenever the carrying amount of an asset or its cash-generating unit exceeds its recoverable amount. Impairment losses are recognised in the income statement.
Impairment losses recognised in respect of cash-generating units are allocated first to reduce the carrying amount of any goodwill allocated to cash-generating units and then to reduce the carrying amount of the other assets in the unit on a pro rata basis. A cash-generating unit is the smallest identifiable group of assets that generates cash inflows that are largely independent of the cash inflows from other assets or groups of assets.
The recoverable amount of the Group’s assets is the greater of their fair value less costs to sell and value in use. In assessing value in use, the estimated future cash flows are discounted to their present value using a pre-tax discount rate that reflects current market assessments of the time, value of money and the risks specific to the asset. For an asset that does not generate largely independent cash inflows, the recoverable amount is determined for the cash-generating unit to which the asset belongs.
An impairment in respect of goodwill is not reversed. In respect of other assets, an impairment is reversed when there is an indication that the impairment may no longer exist and there has been a change in the estimates used to determine the recoverable amount. An impairment is reversed only to the extent that the asset’s carrying amount does not exceed the carrying amount that would have been determined, net of depreciation or amortisation, if no impairment had been recognised.
ProvisionsA provision is recognised in the balance sheet when the Group has a present legal or constructive obligation as a result of a past event and it is probable that an outflow of economic benefits will be required to settle the obligation. If the effect is material, provisions are determined by discounting the expected future cash flows at a pre-tax rate that reflects current market assessments of the time value of money and, where appropriate, the risks specific to the liability. Where discounting is used, the increase in the provision due to the passage of time is recognised as borrowing costs.
Revenue recognitionRevenue represents the amounts, net of discounts, allowances for volume and promotional rebates and other payments to customers (excluding value added tax) derived from the provision of goods and services to customers during the year. Sales of goods are recognised when a Group entity has delivered products to the customer or transferred legal title and the collectability of the related receivable is reasonably assured. Provisions are made for volume and promotional rebates where they have been agreed or are reasonably likely to arise, based upon actual and forecast sales.
Where goods are sold on a sale or return basis revenue is initially booked net of an expectation of the proportion that will be returned by the customer, which is based on historical experience.
This is updated for the final value of returns on payment by the customer.
Where goods are sold on a consignment basis the revenue is booked when the goods have been sold by the customer.
Exceptional itemsExceptional items are those items of financial performance which, because of size or incidence, require separate disclosure to enable underlying performance to be assessed.
Government grantsCapital-based government grants are included within other financial liabilities in the balance sheet and credited to operating profit over the estimated useful economic lives of the assets to which they relate.
Supplier incomeThe Group does not have material retrospective supplier incentive arrangements but where these do arise, they are recognised within cost of sales on an accruals basis as earned for each relevant supplier rebate.
ExpensesOperating lease paymentsPayments made and lease incentives received under operating leases are recognised in the income statement on a straight-line basis over the term of the lease.
Finance lease paymentsMinimum lease payments are apportioned between the finance charge and the reduction of the outstanding liability. The finance charge is allocated to each period during the lease term so as to produce a constant periodic rate of interest on the remaining balance of the liability.
Finance income and expensesFinance expenses comprise interest payable, finance charges on finance leases and unwinding of the discount on provisions.
IG Design Group plcAnnual report and financial statements 2017
Financials – Group
55
Net movements in the fair value of derivatives which have not been designated as an effective hedge, and any ineffective portion of fair value movement on derivatives designated as a hedge are also included within finance income or expense.
Interest income and interest payable is recognised in profit or loss as it accrues, using the effective interest method.
TaxationTax on the profit or loss for the year comprises current and deferred tax. Tax is recognised in the income statement except to the extent that it relates to items recognised in other comprehensive income or directly in equity, in which case it is recognised in other comprehensive income or equity respectively.
Current tax is the expected tax payable on the taxable income for the year, using tax rates enacted or substantively enacted at the balance sheet date and any adjustment to tax payable in respect of previous years.
Deferred tax is provided on temporary differences between the carrying amounts of assets and liabilities for financial reporting purposes and the amounts used for taxation purposes. The following temporary differences are not provided for: the initial recognition of goodwill; the initial recognition of assets or liabilities that affect neither accounting nor taxable profit other than in a business combination; and differences relating to investments in subsidiaries to the extent that they will probably not reverse in the foreseeable future. The amount of deferred tax provided is based on the expected manner of realisation or settlement of the carrying amount of assets and liabilities, using tax rates enacted or substantively enacted at the balance sheet date.
A deferred tax asset is recognised only to the extent that it is probable that future taxable profits will be available against which the asset can be utilised.
Dividend distributionFinal dividends to shareholders of IG Design Group plc are recognised as a liability in the period that they are approved by shareholders.
Employee benefitsPensionsThe Group operates a defined contribution personal pension scheme. The assets of this scheme are held separately from those of the Group in an independently administered fund. The pension charge represents contributions payable by the Group to the fund.
The Netherlands subsidiary operates an industrial defined benefit fund, based on average wages, that has an agreed maximum contribution. The pension fund is a multi-employer fund and there is no contractual or constructive obligation for charging the net defined benefit cost of the plan to participating entities other than an agreed maximum contribution for the period, that is shared between employer (4/7) and employees (3/7). The Dutch Government is not planning to make employers fund any deficits in industrial pension funds; accordingly the Group treats the scheme as a defined contribution scheme for disclosure purposes. The Group recognises a cost equal to its contributions payable for the period.
Share‑based payment transactionsThe cost of equity-settled transactions with employees is measured by reference to the fair value of the options at the date on which they are granted. The fair value is determined by using an appropriate pricing model. The fair value cost is then recognised over the vesting period, ending on the date on which the relevant employees become fully entitled to the award.
The quantum of awards expected to vest and the relevant cost charged is reviewed annually such that at each balance sheet date the cumulative expense is the relevant share of the expected total cost, pro-rated across the vesting period.
No expense is recognised for awards that are not expected to ultimately vest, for example due to an employee leaving or business performance targets not being met. The annual expense for equity settled transactions is recognised in the income statement with a corresponding entry in equity.
National Insurance (“NI”) on share‑based incentivesEmployer’s NI is accrued, where applicable, at a rate which management expects to be the prevailing rate when share-based incentives are exercised and is based on the latest market value of options expected to vest or having already vested.
Borrowing costsBorrowing costs directly attributable to the acquisition, construction or production of an asset that necessarily takes a substantial period of time to get ready for its intended use or sale are capitalised as part of the cost of the respective asset. Costs directly attributable to the arrangement of new borrowing facilities are included within the fair value of proceeds received and amortised over the life of the relevant facilities. All other borrowing costs are expensed in the period they occur. Borrowing costs consist of interest and other costs that an entity incurs in connection with the borrowing of funds.
New standardsThere are no IFRS or IFRIC interpretations or amendments effective for the first time this financial year that have any material impact on the Group.
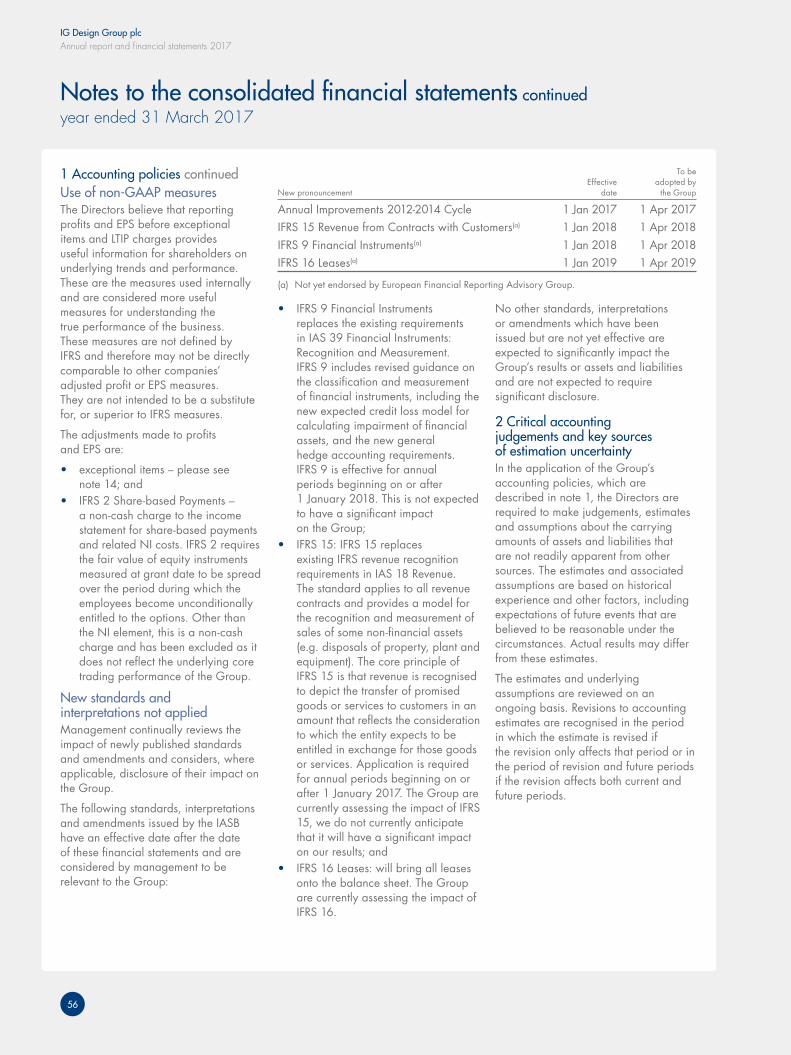
IG Design Group plcAnnual report and financial statements 2017
56
Notes to the consolidated financial statements continuedyear ended 31 March 2017
1 Accounting policies continuedUse of non‑GAAP measuresThe Directors believe that reporting profits and EPS before exceptional items and LTIP charges provides useful information for shareholders on underlying trends and performance. These are the measures used internally and are considered more useful measures for understanding the true performance of the business. These measures are not defined by IFRS and therefore may not be directly comparable to other companies’ adjusted profit or EPS measures. They are not intended to be a substitute for, or superior to IFRS measures.
The adjustments made to profits and EPS are:
• exceptional items – please see note 14; and
• IFRS 2 Share-based Payments – a non-cash charge to the income statement for share-based payments and related NI costs. IFRS 2 requires the fair value of equity instruments measured at grant date to be spread over the period during which the employees become unconditionally entitled to the options. Other than the NI element, this is a non-cash charge and has been excluded as it does not reflect the underlying core trading performance of the Group.
New standards and interpretations not applied Management continually reviews the impact of newly published standards and amendments and considers, where applicable, disclosure of their impact on the Group.
The following standards, interpretations and amendments issued by the IASB have an effective date after the date of these financial statements and are considered by management to be relevant to the Group:
To be Effective adopted by New pronouncement date the Group
Annual Improvements 2012-2014 Cycle 1 Jan 2017 1 Apr 2017IFRS 15 Revenue from Contracts with Customers(a) 1 Jan 2018 1 Apr 2018IFRS 9 Financial Instruments(a) 1 Jan 2018 1 Apr 2018IFRS 16 Leases(a) 1 Jan 2019 1 Apr 2019
(a) Not yet endorsed by European Financial Reporting Advisory Group.
• IFRS 9 Financial Instruments replaces the existing requirements in IAS 39 Financial Instruments: Recognition and Measurement. IFRS 9 includes revised guidance on the classification and measurement of financial instruments, including the new expected credit loss model for calculating impairment of financial assets, and the new general hedge accounting requirements. IFRS 9 is effective for annual periods beginning on or after 1 January 2018. This is not expected to have a significant impact on the Group;
• IFRS 15: IFRS 15 replaces existing IFRS revenue recognition requirements in IAS 18 Revenue. The standard applies to all revenue contracts and provides a model for the recognition and measurement of sales of some non-financial assets (e.g. disposals of property, plant and equipment). The core principle of IFRS 15 is that revenue is recognised to depict the transfer of promised goods or services to customers in an amount that reflects the consideration to which the entity expects to be entitled in exchange for those goods or services. Application is required for annual periods beginning on or after 1 January 2017. The Group are currently assessing the impact of IFRS 15, we do not currently anticipate that it will have a significant impact on our results; and
• IFRS 16 Leases: will bring all leases onto the balance sheet. The Group are currently assessing the impact of IFRS 16.
No other standards, interpretations or amendments which have been issued but are not yet effective are expected to significantly impact the Group’s results or assets and liabilities and are not expected to require significant disclosure.
2 Critical accounting judgements and key sources of estimation uncertaintyIn the application of the Group’s accounting policies, which are described in note 1, the Directors are required to make judgements, estimates and assumptions about the carrying amounts of assets and liabilities that are not readily apparent from other sources. The estimates and associated assumptions are based on historical experience and other factors, including expectations of future events that are believed to be reasonable under the circumstances. Actual results may differ from these estimates.
The estimates and underlying assumptions are reviewed on an ongoing basis. Revisions to accounting estimates are recognised in the period in which the estimate is revised if the revision only affects that period or in the period of revision and future periods if the revision affects both current and future periods.
IG Design Group plcAnnual report and financial statements 2017
Financials – Group
57
The estimates and assumptions that have had a significant bearing on the financial statements in the current year or could have a significant risk of causing a material adjustment to the carrying amounts of assets and liabilities within the next financial year are discussed below:
Critical judgements in applying the Group’s accounting policiesThe following are the critical judgements, apart from those involving estimations (which are dealt with separately below), that the Directors have made in the process of applying the Group’s accounting policies and that have the most significant effect on the amounts recognised in the financial statements.
Exceptional itemsThe Directors have chosen to separate certain items of financial performance which they believe, because of size or incidence, require separate disclosure to enable underlying performance to be assessed. These items are fully described in note 10.
Key sources of estimation uncertaintyThe key assumptions concerning the future, and other key sources of estimation uncertainty at the balance sheet date, that have significant risk of causing a material adjustment to the carrying amount of assets and liabilities within the next financial year, are discussed in the strategic report and below.
Consolidation of less than 100% owned subsidiariesWhere the Company owns less than 100% of the share capital and voting rights of Group companies, the decision of whether or not the investee should be treated as a subsidiary and consolidated
in full in the Group accounts requires judgement. Management consider the individual facts and circumstances relating to the ability to control and benefit from the risks and rewards of investee trading in determining the appropriate treatment, which is then adopted consistently and reviewed annually for any changes in these facts and circumstances.
Impairment of goodwill and property, plant and equipmentDetermining whether goodwill and property, plant and equipment are impaired requires an estimation of the value in use of the cash-generating units to which goodwill has been allocated or to which property, plant and equipment belong. The value in use calculation requires the entity to estimate the future cash flows expected to arise from the cash-generating unit and a suitable discount rate in order to calculate present value. The carrying amount of goodwill at the balance sheet date was £32.0 million (2016: £31.5 million). No impairment (2016: nil) was required. The carrying amount of property, plant and equipment was £32.6 million (2016: £30.2 million). No impairment loss (2016: nil) was required (see notes 11 and 12).
Provision for slow moving inventoryThe Group has guidelines for providing for inventory which may be sold below cost due to its age or condition. Directors assess the inventory at each location and in some cases decide that there are specific reasons to provide more than the guideline levels, or less if there are specific action plans in place which mean the guideline provision level is not required. Determining the level of inventory provision requires an estimation of likely future realisable value of the inventory in various time
frames and comparing with the cost of holding stock for those time frames. Regular monitoring of stock levels, the ageing of stock and the level of the provision is carried out by the Directors. Details of inventory carrying values are provided in note 14. At the year end, stock acquired more than 15 months previously had increased from £5.9 million to £7.2 million and the Group has provisions of £8.4 million (2016: £4.6 million) over the total inventory value.
Share‑based paymentsThe Directors are required to estimate the fair value of the awards granted and the quantum of awards expected to vest. This entails the use of pricing models for the fair value calculation and the Directors use specialist advisers to support on this calculation where the pricing model is complex. The estimate of awards expected to vest required judgement and is reliant on the accuracy of management forecasts. Details of the key assumptions made in the measurement of share-based payments are provided in note 25.
TaxationThere are many transactions and calculations for which the ultimate tax determination is uncertain. Significant judgement is required in determining the Group’s tax assets and liabilities. Deferred tax assets have been recognised to the extent they are recoverable based on profit projections for future years. Income tax liabilities for anticipated issues have been recognised based on estimates of whether additional tax will be due. Notwithstanding the above, the Group believes that it will recover tax assets and has adequate provision to cover all risks across all business operations. See note 13 for more details.
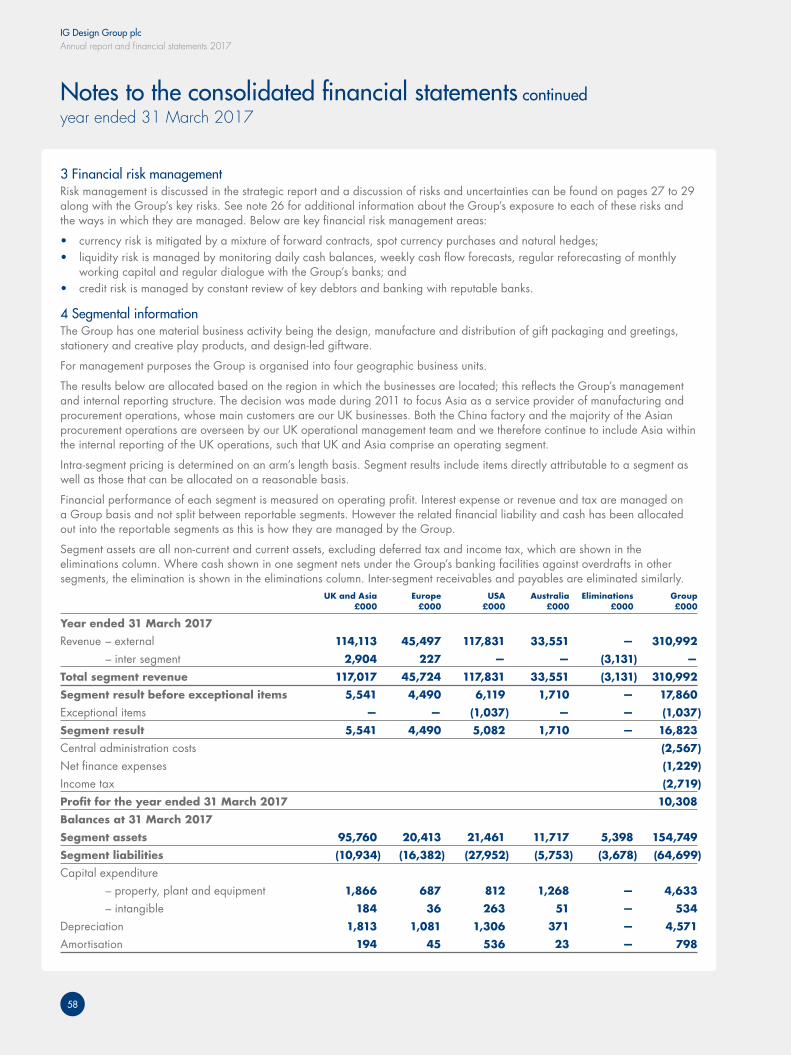
IG Design Group plcAnnual report and financial statements 2017
58
Notes to the consolidated financial statements continuedyear ended 31 March 2017
3 Financial risk managementRisk management is discussed in the strategic report and a discussion of risks and uncertainties can be found on pages 27 to 29 along with the Group’s key risks. See note 26 for additional information about the Group’s exposure to each of these risks and the ways in which they are managed. Below are key financial risk management areas:
• currency risk is mitigated by a mixture of forward contracts, spot currency purchases and natural hedges;• liquidity risk is managed by monitoring daily cash balances, weekly cash flow forecasts, regular reforecasting of monthly
working capital and regular dialogue with the Group’s banks; and• credit risk is managed by constant review of key debtors and banking with reputable banks.
4 Segmental informationThe Group has one material business activity being the design, manufacture and distribution of gift packaging and greetings, stationery and creative play products, and design-led giftware.
For management purposes the Group is organised into four geographic business units.
The results below are allocated based on the region in which the businesses are located; this reflects the Group’s management and internal reporting structure. The decision was made during 2011 to focus Asia as a service provider of manufacturing and procurement operations, whose main customers are our UK businesses. Both the China factory and the majority of the Asian procurement operations are overseen by our UK operational management team and we therefore continue to include Asia within the internal reporting of the UK operations, such that UK and Asia comprise an operating segment.
Intra-segment pricing is determined on an arm’s length basis. Segment results include items directly attributable to a segment as well as those that can be allocated on a reasonable basis.
Financial performance of each segment is measured on operating profit. Interest expense or revenue and tax are managed on a Group basis and not split between reportable segments. However the related financial liability and cash has been allocated out into the reportable segments as this is how they are managed by the Group.
Segment assets are all non-current and current assets, excluding deferred tax and income tax, which are shown in the eliminations column. Where cash shown in one segment nets under the Group’s banking facilities against overdrafts in other segments, the elimination is shown in the eliminations column. Inter-segment receivables and payables are eliminated similarly. UK and Asia Europe USA Australia Eliminations Group £000 £000 £000 £000 £000 £000
Year ended 31 March 2017 Revenue – external 114,113 45,497 117,831 33,551 — 310,992 – inter segment 2,904 227 — — (3,131) —
Total segment revenue 117,017 45,724 117,831 33,551 (3,131) 310,992 Segment result before exceptional items 5,541 4,490 6,119 1,710 — 17,860 Exceptional items — — (1,037) — — (1,037)
Segment result 5,541 4,490 5,082 1,710 — 16,823 Central administration costs (2,567)
Net finance expenses (1,229)
Income tax (2,719)
Profit for the year ended 31 March 2017 10,308
Balances at 31 March 2017
Segment assets 95,760 20,413 21,461 11,717 5,398 154,749 Segment liabilities (10,934) (16,382) (27,952) (5,753) (3,678) (64,699)
Capital expenditure – property, plant and equipment 1,866 687 812 1,268 — 4,633 – intangible 184 36 263 51 — 534
Depreciation 1,813 1,081 1,306 371 — 4,571 Amortisation 194 45 536 23 — 798
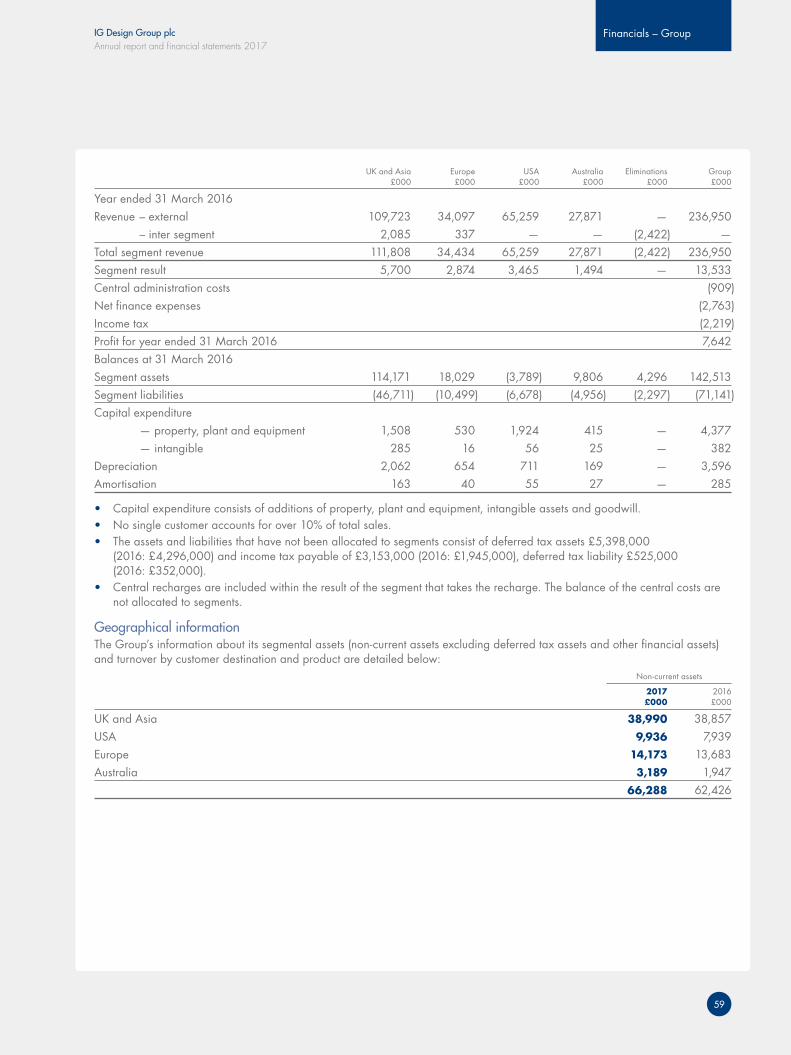
IG Design Group plcAnnual report and financial statements 2017
Financials – Group
59
UK and Asia Europe USA Australia Eliminations Group £000 £000 £000 £000 £000 £000
Year ended 31 March 2016 Revenue – external 109,723 34,097 65,259 27,871 — 236,950 – inter segment 2,085 337 — — (2,422) — Total segment revenue 111,808 34,434 65,259 27,871 (2,422) 236,950 Segment result 5,700 2,874 3,465 1,494 — 13,533 Central administration costs (909)Net finance expenses (2,763)Income tax (2,219)Profit for year ended 31 March 2016 7,642 Balances at 31 March 2016 Segment assets 114,171 18,029 (3,789) 9,806 4,296 142,513 Segment liabilities (46,711) (10,499) (6,678) (4,956) (2,297) (71,141)Capital expenditure — property, plant and equipment 1,508 530 1,924 415 — 4,377 — intangible 285 16 56 25 — 382 Depreciation 2,062 654 711 169 — 3,596 Amortisation 163 40 55 27 — 285
• Capital expenditure consists of additions of property, plant and equipment, intangible assets and goodwill.• No single customer accounts for over 10% of total sales.• The assets and liabilities that have not been allocated to segments consist of deferred tax assets £5,398,000
(2016: £4,296,000) and income tax payable of £3,153,000 (2016: £1,945,000), deferred tax liability £525,000 (2016: £352,000).
• Central recharges are included within the result of the segment that takes the recharge. The balance of the central costs are not allocated to segments.
Geographical informationThe Group’s information about its segmental assets (non-current assets excluding deferred tax assets and other financial assets) and turnover by customer destination and product are detailed below: Non-current assets
2017 2016 £000 £000
UK and Asia 38,990 38,857USA 9,936 7,939Europe 14,173 13,683Australia 3,189 1,947 66,288 62,426
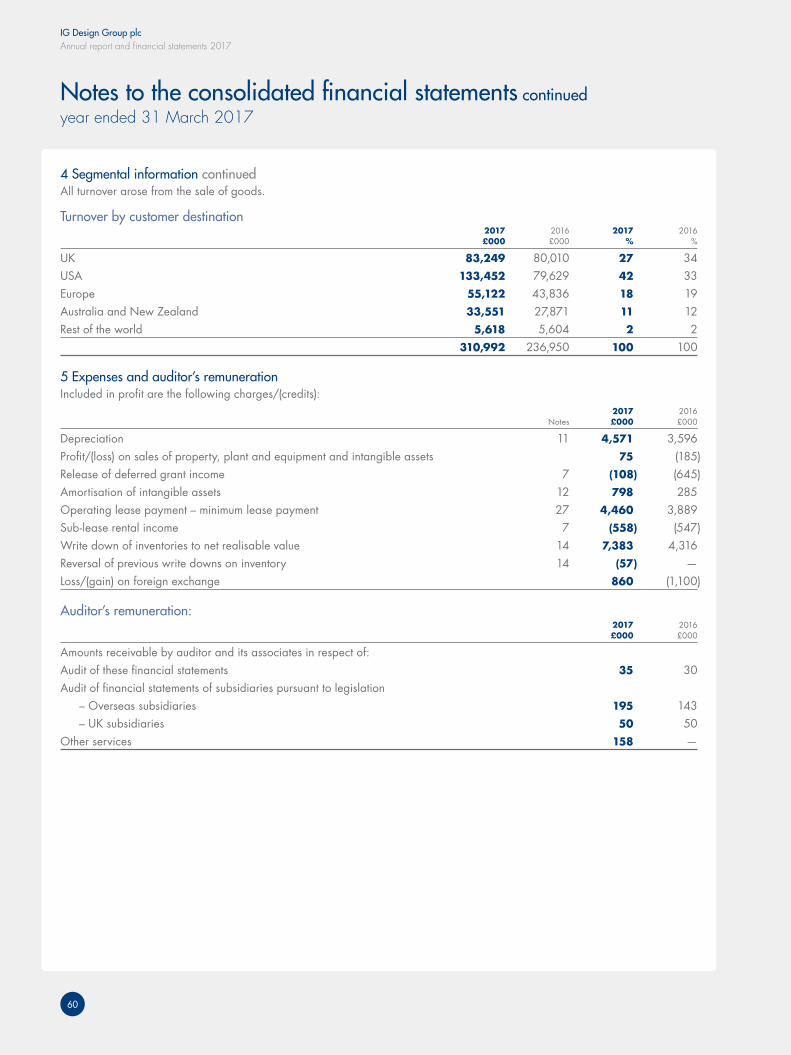
IG Design Group plcAnnual report and financial statements 2017
60
Notes to the consolidated financial statements continuedyear ended 31 March 2017
4 Segmental information continuedAll turnover arose from the sale of goods.
Turnover by customer destination 2017 2016 2017 2016 £000 £000 % %
UK 83,249 80,010 27 34USA 133,452 79,629 42 33Europe 55,122 43,836 18 19Australia and New Zealand 33,551 27,871 11 12Rest of the world 5,618 5,604 2 2 310,992 236,950 100 100
5 Expenses and auditor’s remunerationIncluded in profit are the following charges/(credits): 2017 2016 Notes £000 £000
Depreciation 11 4,571 3,596 Profit/(loss) on sales of property, plant and equipment and intangible assets 75 (185)Release of deferred grant income 7 (108) (645)Amortisation of intangible assets 12 798 285 Operating lease payment – minimum lease payment 27 4,460 3,889 Sub-lease rental income 7 (558) (547)Write down of inventories to net realisable value 14 7,383 4,316 Reversal of previous write downs on inventory 14 (57) — Loss/(gain) on foreign exchange 860 (1,100)
Auditor’s remuneration: 2017 2016 £000 £000
Amounts receivable by auditor and its associates in respect of: Audit of these financial statements 35 30 Audit of financial statements of subsidiaries pursuant to legislation – Overseas subsidiaries 195 143 – UK subsidiaries 50 50 Other services 158 —
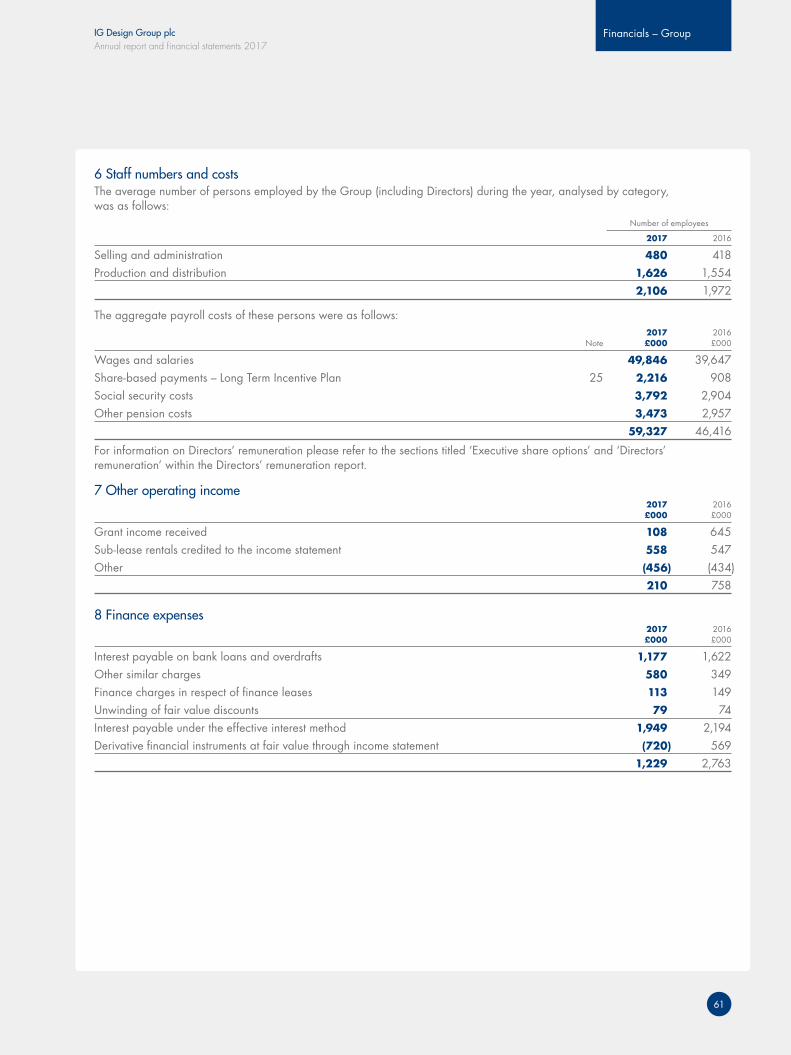
IG Design Group plcAnnual report and financial statements 2017
Financials – Group
61
6 Staff numbers and costsThe average number of persons employed by the Group (including Directors) during the year, analysed by category, was as follows: Number of employees
2017 2016
Selling and administration 480 418 Production and distribution 1,626 1,554 2,106 1,972 The aggregate payroll costs of these persons were as follows: 2017 2016 Note £000 £000
Wages and salaries 49,846 39,647 Share-based payments – Long Term Incentive Plan 25 2,216 908 Social security costs 3,792 2,904 Other pension costs 3,473 2,957 59,327 46,416
For information on Directors’ remuneration please refer to the sections titled ‘Executive share options’ and ‘Directors’ remuneration’ within the Directors’ remuneration report.
7 Other operating income 2017 2016 £000 £000
Grant income received 108 645 Sub-lease rentals credited to the income statement 558 547 Other (456) (434) 210 758
8 Finance expenses 2017 2016 £000 £000
Interest payable on bank loans and overdrafts 1,177 1,622 Other similar charges 580 349 Finance charges in respect of finance leases 113 149 Unwinding of fair value discounts 79 74 Interest payable under the effective interest method 1,949 2,194 Derivative financial instruments at fair value through income statement (720) 569 1,229 2,763
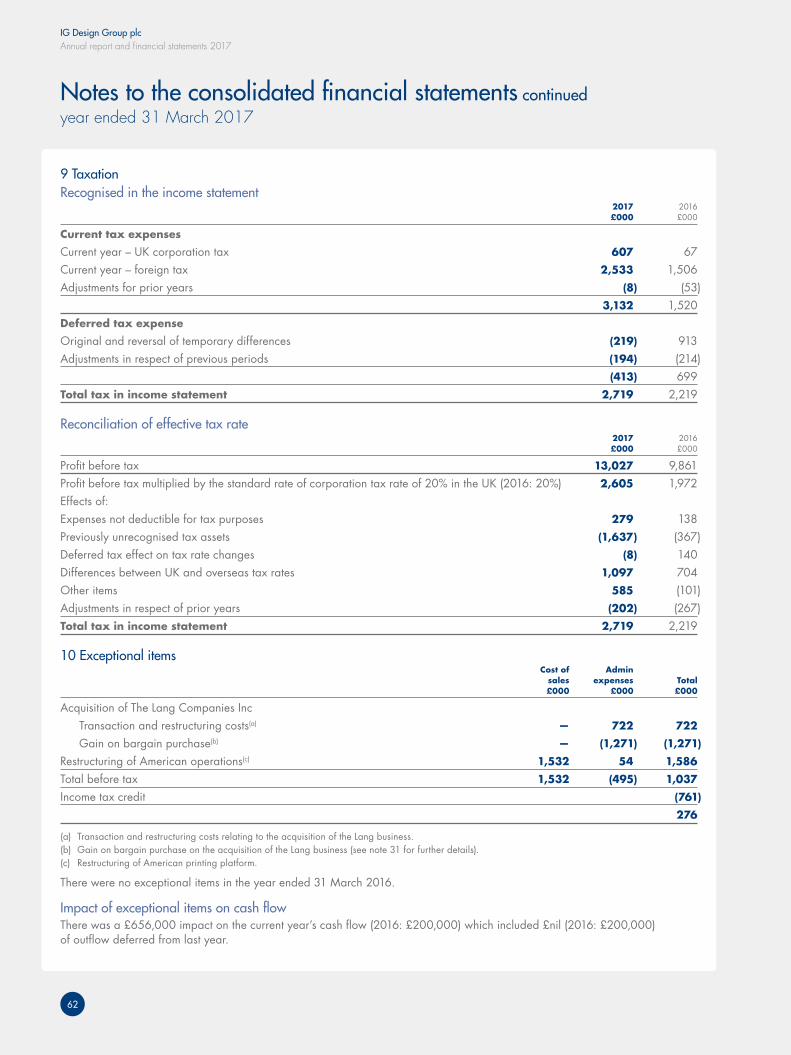
IG Design Group plcAnnual report and financial statements 2017
62
Notes to the consolidated financial statements continuedyear ended 31 March 2017
9 TaxationRecognised in the income statement 2017 2016 £000 £000
Current tax expenses Current year – UK corporation tax 607 67 Current year – foreign tax 2,533 1,506 Adjustments for prior years (8) (53) 3,132 1,520 Deferred tax expense
Original and reversal of temporary differences (219) 913 Adjustments in respect of previous periods (194) (214) (413) 699 Total tax in income statement 2,719 2,219
Reconciliation of effective tax rate 2017 2016 £000 £000
Profit before tax 13,027 9,861 Profit before tax multiplied by the standard rate of corporation tax rate of 20% in the UK (2016: 20%) 2,605 1,972 Effects of:Expenses not deductible for tax purposes 279 138 Previously unrecognised tax assets (1,637) (367)Deferred tax effect on tax rate changes (8) 140 Differences between UK and overseas tax rates 1,097 704 Other items 585 (101)Adjustments in respect of prior years (202) (267)Total tax in income statement 2,719 2,219
10 Exceptional items Cost of Admin sales expenses Total £000 £000 £000
Acquisition of The Lang Companies Inc Transaction and restructuring costs(a) — 722 722 Gain on bargain purchase(b) — (1,271) (1,271)
Restructuring of American operations(c) 1,532 54 1,586 Total before tax 1,532 (495) 1,037 Income tax credit (761)
276
(a) Transaction and restructuring costs relating to the acquisition of the Lang business.(b) Gain on bargain purchase on the acquisition of the Lang business (see note 31 for further details).(c) Restructuring of American printing platform.
There were no exceptional items in the year ended 31 March 2016.
Impact of exceptional items on cash flowThere was a £656,000 impact on the current year’s cash flow (2016: £200,000) which included £nil (2016: £200,000) of outflow deferred from last year.
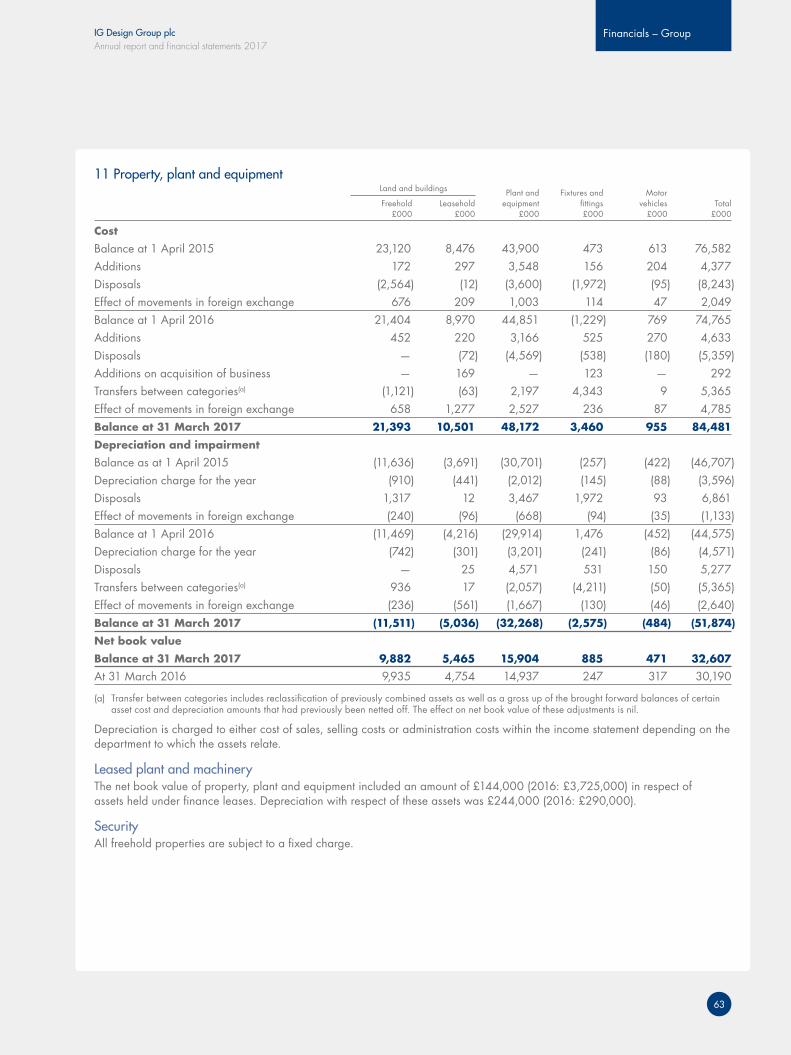
IG Design Group plcAnnual report and financial statements 2017
Financials – Group
63
11 Property, plant and equipment Land and buildings Plant and Fixtures and Motor Freehold Leasehold equipment fittings vehicles Total £000 £000 £000 £000 £000 £000
Cost
Balance at 1 April 2015 23,120 8,476 43,900 473 613 76,582 Additions 172 297 3,548 156 204 4,377 Disposals (2,564) (12) (3,600) (1,972) (95) (8,243)Effect of movements in foreign exchange 676 209 1,003 114 47 2,049 Balance at 1 April 2016 21,404 8,970 44,851 (1,229) 769 74,765 Additions 452 220 3,166 525 270 4,633 Disposals — (72) (4,569) (538) (180) (5,359)Additions on acquisition of business — 169 — 123 — 292 Transfers between categories(a) (1,121) (63) 2,197 4,343 9 5,365Effect of movements in foreign exchange 658 1,277 2,527 236 87 4,785 Balance at 31 March 2017 21,393 10,501 48,172 3,460 955 84,481 Depreciation and impairment
Balance as at 1 April 2015 (11,636) (3,691) (30,701) (257) (422) (46,707)Depreciation charge for the year (910) (441) (2,012) (145) (88) (3,596)Disposals 1,317 12 3,467 1,972 93 6,861 Effect of movements in foreign exchange (240) (96) (668) (94) (35) (1,133)Balance at 1 April 2016 (11,469) (4,216) (29,914) 1,476 (452) (44,575)Depreciation charge for the year (742) (301) (3,201) (241) (86) (4,571)Disposals — 25 4,571 531 150 5,277 Transfers between categories(a) 936 17 (2,057) (4,211) (50) (5,365)Effect of movements in foreign exchange (236) (561) (1,667) (130) (46) (2,640)Balance at 31 March 2017 (11,511) (5,036) (32,268) (2,575) (484) (51,874)
Net book value
Balance at 31 March 2017 9,882 5,465 15,904 885 471 32,607 At 31 March 2016 9,935 4,754 14,937 247 317 30,190
(a) Transfer between categories includes reclassification of previously combined assets as well as a gross up of the brought forward balances of certain asset cost and depreciation amounts that had previously been netted off. The effect on net book value of these adjustments is nil.
Depreciation is charged to either cost of sales, selling costs or administration costs within the income statement depending on the department to which the assets relate.
Leased plant and machineryThe net book value of property, plant and equipment included an amount of £144,000 (2016: £3,725,000) in respect of assets held under finance leases. Depreciation with respect of these assets was £244,000 (2016: £290,000).
SecurityAll freehold properties are subject to a fixed charge.
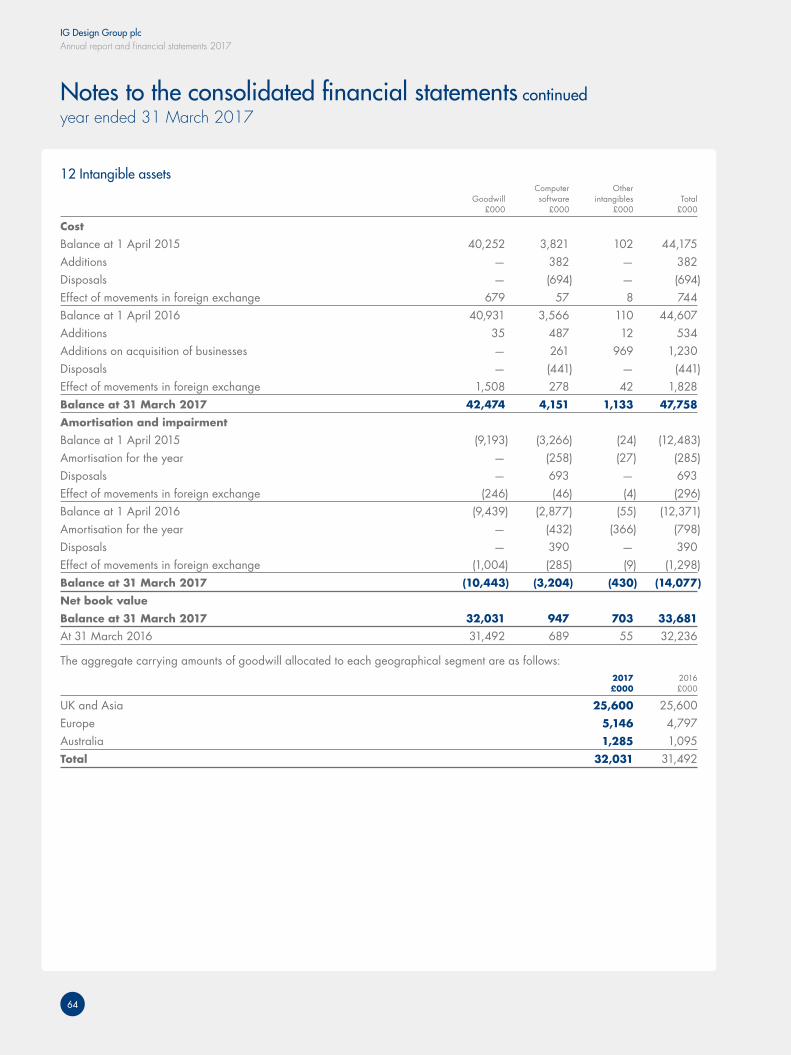
IG Design Group plcAnnual report and financial statements 2017
64
Notes to the consolidated financial statements continuedyear ended 31 March 2017
12 Intangible assets Computer Other Goodwill software intangibles Total £000 £000 £000 £000
Cost
Balance at 1 April 2015 40,252 3,821 102 44,175 Additions — 382 — 382 Disposals — (694) — (694)Effect of movements in foreign exchange 679 57 8 744 Balance at 1 April 2016 40,931 3,566 110 44,607 Additions 35 487 12 534 Additions on acquisition of businesses — 261 969 1,230 Disposals — (441) — (441)Effect of movements in foreign exchange 1,508 278 42 1,828 Balance at 31 March 2017 42,474 4,151 1,133 47,758 Amortisation and impairment
Balance at 1 April 2015 (9,193) (3,266) (24) (12,483)Amortisation for the year — (258) (27) (285)Disposals — 693 — 693 Effect of movements in foreign exchange (246) (46) (4) (296)Balance at 1 April 2016 (9,439) (2,877) (55) (12,371)Amortisation for the year — (432) (366) (798)Disposals — 390 — 390 Effect of movements in foreign exchange (1,004) (285) (9) (1,298)Balance at 31 March 2017 (10,443) (3,204) (430) (14,077)
Net book value
Balance at 31 March 2017 32,031 947 703 33,681 At 31 March 2016 31,492 689 55 32,236
The aggregate carrying amounts of goodwill allocated to each geographical segment are as follows: 2017 2016 £000 £000
UK and Asia 25,600 25,600 Europe 5,146 4,797 Australia 1,285 1,095 Total 32,031 31,492
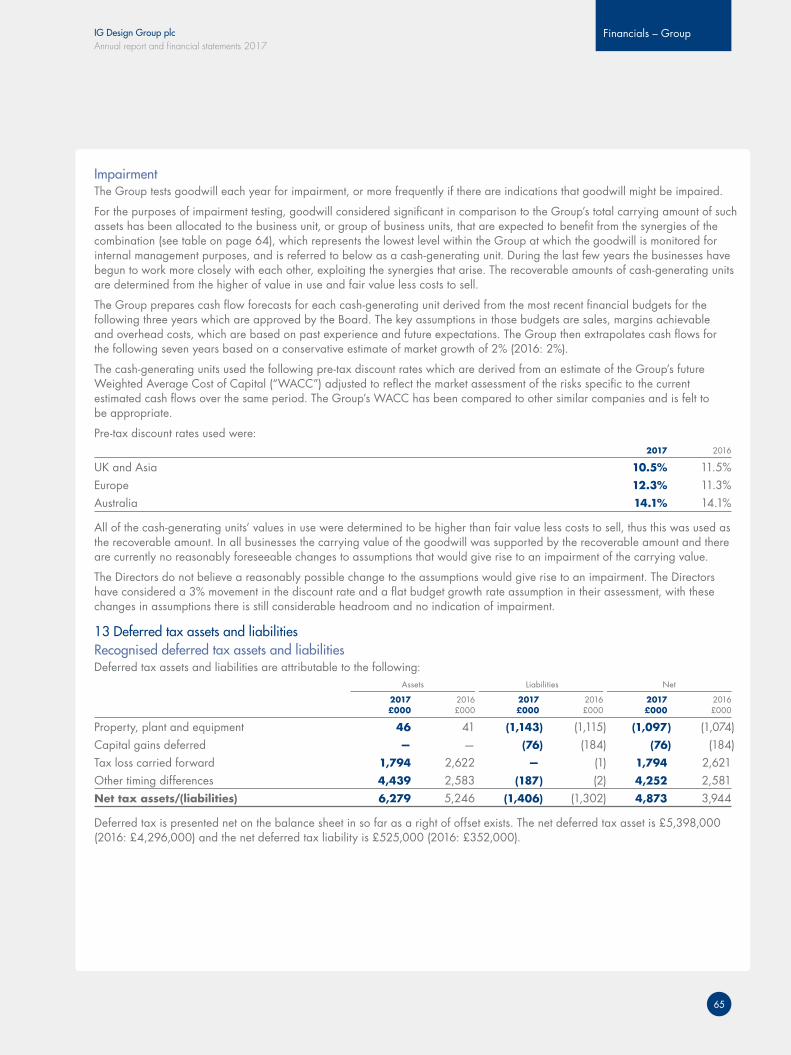
IG Design Group plcAnnual report and financial statements 2017
Financials – Group
65
ImpairmentThe Group tests goodwill each year for impairment, or more frequently if there are indications that goodwill might be impaired.
For the purposes of impairment testing, goodwill considered significant in comparison to the Group’s total carrying amount of such assets has been allocated to the business unit, or group of business units, that are expected to benefit from the synergies of the combination (see table on page 64), which represents the lowest level within the Group at which the goodwill is monitored for internal management purposes, and is referred to below as a cash-generating unit. During the last few years the businesses have begun to work more closely with each other, exploiting the synergies that arise. The recoverable amounts of cash-generating units are determined from the higher of value in use and fair value less costs to sell.
The Group prepares cash flow forecasts for each cash-generating unit derived from the most recent financial budgets for the following three years which are approved by the Board. The key assumptions in those budgets are sales, margins achievable and overhead costs, which are based on past experience and future expectations. The Group then extrapolates cash flows for the following seven years based on a conservative estimate of market growth of 2% (2016: 2%).
The cash-generating units used the following pre-tax discount rates which are derived from an estimate of the Group’s future Weighted Average Cost of Capital (“WACC”) adjusted to reflect the market assessment of the risks specific to the current estimated cash flows over the same period. The Group’s WACC has been compared to other similar companies and is felt to be appropriate.
Pre-tax discount rates used were: 2017 2016
UK and Asia 10.5% 11.5%Europe 12.3% 11.3%Australia 14.1% 14.1%
All of the cash-generating units’ values in use were determined to be higher than fair value less costs to sell, thus this was used as the recoverable amount. In all businesses the carrying value of the goodwill was supported by the recoverable amount and there are currently no reasonably foreseeable changes to assumptions that would give rise to an impairment of the carrying value.
The Directors do not believe a reasonably possible change to the assumptions would give rise to an impairment. The Directors have considered a 3% movement in the discount rate and a flat budget growth rate assumption in their assessment, with these changes in assumptions there is still considerable headroom and no indication of impairment.
13 Deferred tax assets and liabilitiesRecognised deferred tax assets and liabilitiesDeferred tax assets and liabilities are attributable to the following: Assets Liabilities Net 2017 2016 2017 2016 2017 2016 £000 £000 £000 £000 £000 £000
Property, plant and equipment 46 41 (1,143) (1,115) (1,097) (1,074)Capital gains deferred — — (76) (184) (76) (184)Tax loss carried forward 1,794 2,622 — (1) 1,794 2,621 Other timing differences 4,439 2,583 (187) (2) 4,252 2,581 Net tax assets/(liabilities) 6,279 5,246 (1,406) (1,302) 4,873 3,944
Deferred tax is presented net on the balance sheet in so far as a right of offset exists. The net deferred tax asset is £5,398,000 (2016: £4,296,000) and the net deferred tax liability is £525,000 (2016: £352,000).
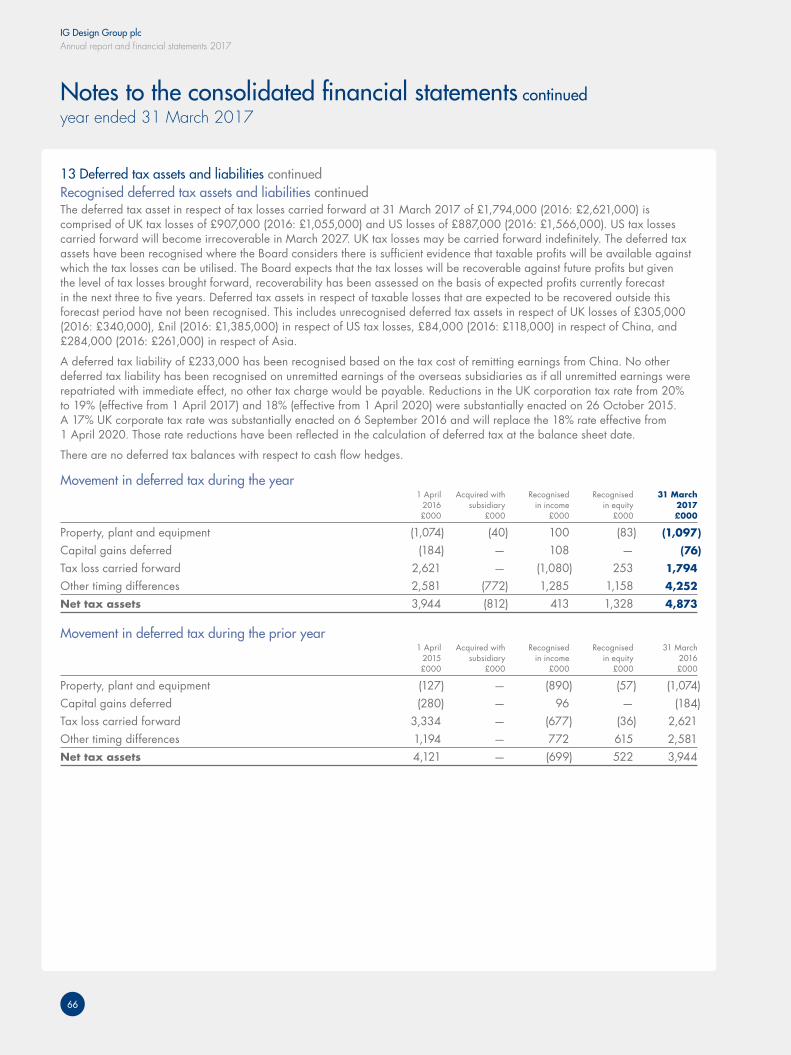
IG Design Group plcAnnual report and financial statements 2017
66
Notes to the consolidated financial statements continuedyear ended 31 March 2017
13 Deferred tax assets and liabilities continuedRecognised deferred tax assets and liabilities continuedThe deferred tax asset in respect of tax losses carried forward at 31 March 2017 of £1,794,000 (2016: £2,621,000) is comprised of UK tax losses of £907,000 (2016: £1,055,000) and US losses of £887,000 (2016: £1,566,000). US tax losses carried forward will become irrecoverable in March 2027. UK tax losses may be carried forward indefinitely. The deferred tax assets have been recognised where the Board considers there is sufficient evidence that taxable profits will be available against which the tax losses can be utilised. The Board expects that the tax losses will be recoverable against future profits but given the level of tax losses brought forward, recoverability has been assessed on the basis of expected profits currently forecast in the next three to five years. Deferred tax assets in respect of taxable losses that are expected to be recovered outside this forecast period have not been recognised. This includes unrecognised deferred tax assets in respect of UK losses of £305,000 (2016: £340,000), £nil (2016: £1,385,000) in respect of US tax losses, £84,000 (2016: £118,000) in respect of China, and £284,000 (2016: £261,000) in respect of Asia.
A deferred tax liability of £233,000 has been recognised based on the tax cost of remitting earnings from China. No other deferred tax liability has been recognised on unremitted earnings of the overseas subsidiaries as if all unremitted earnings were repatriated with immediate effect, no other tax charge would be payable. Reductions in the UK corporation tax rate from 20% to 19% (effective from 1 April 2017) and 18% (effective from 1 April 2020) were substantially enacted on 26 October 2015. A 17% UK corporate tax rate was substantially enacted on 6 September 2016 and will replace the 18% rate effective from 1 April 2020. Those rate reductions have been reflected in the calculation of deferred tax at the balance sheet date.
There are no deferred tax balances with respect to cash flow hedges.
Movement in deferred tax during the year 1 April Acquired with Recognised Recognised 31 March 2016 subsidiary in income in equity 2017 £000 £000 £000 £000 £000
Property, plant and equipment (1,074) (40) 100 (83) (1,097)
Capital gains deferred (184) — 108 — (76)
Tax loss carried forward 2,621 — (1,080) 253 1,794 Other timing differences 2,581 (772) 1,285 1,158 4,252 Net tax assets 3,944 (812) 413 1,328 4,873
Movement in deferred tax during the prior year 1 April Acquired with Recognised Recognised 31 March 2015 subsidiary in income in equity 2016 £000 £000 £000 £000 £000
Property, plant and equipment (127) — (890) (57) (1,074)Capital gains deferred (280) — 96 — (184)Tax loss carried forward 3,334 — (677) (36) 2,621 Other timing differences 1,194 — 772 615 2,581 Net tax assets 4,121 — (699) 522 3,944
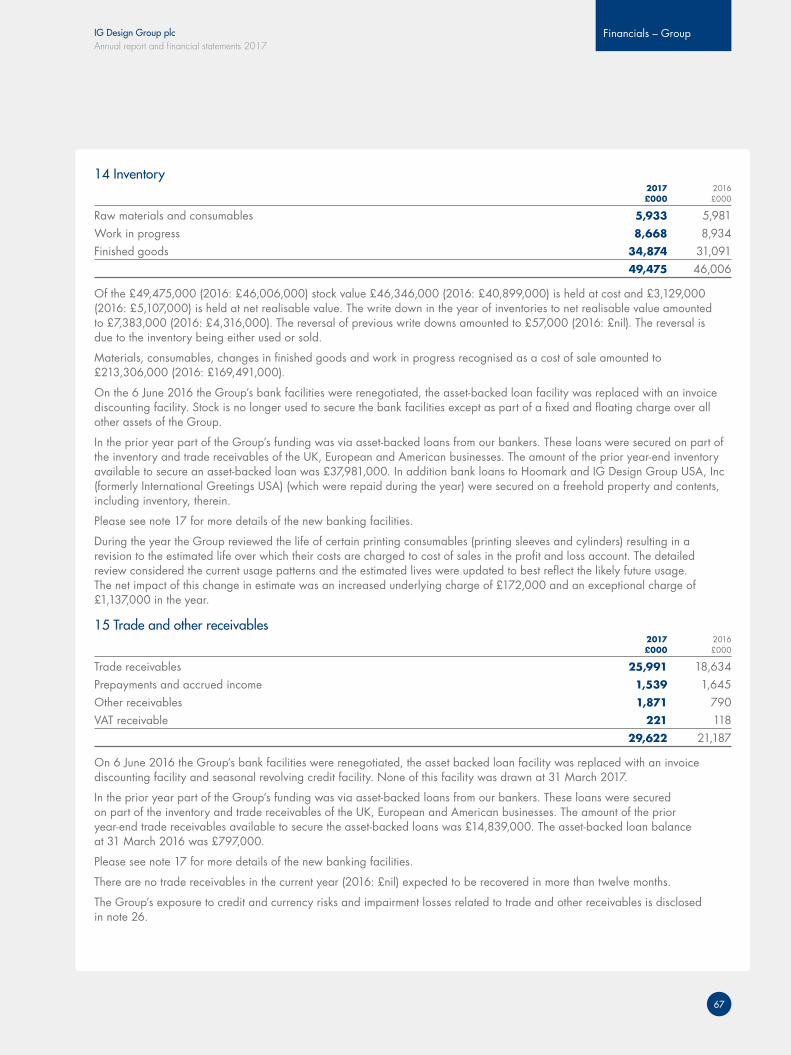
IG Design Group plcAnnual report and financial statements 2017
Financials – Group
67
14 Inventory 2017 2016 £000 £000
Raw materials and consumables 5,933 5,981 Work in progress 8,668 8,934 Finished goods 34,874 31,091 49,475 46,006
Of the £49,475,000 (2016: £46,006,000) stock value £46,346,000 (2016: £40,899,000) is held at cost and £3,129,000 (2016: £5,107,000) is held at net realisable value. The write down in the year of inventories to net realisable value amounted to £7,383,000 (2016: £4,316,000). The reversal of previous write downs amounted to £57,000 (2016: £nil). The reversal is due to the inventory being either used or sold.
Materials, consumables, changes in finished goods and work in progress recognised as a cost of sale amounted to £213,306,000 (2016: £169,491,000).
On the 6 June 2016 the Group’s bank facilities were renegotiated, the asset-backed loan facility was replaced with an invoice discounting facility. Stock is no longer used to secure the bank facilities except as part of a fixed and floating charge over all other assets of the Group.
In the prior year part of the Group’s funding was via asset-backed loans from our bankers. These loans were secured on part of the inventory and trade receivables of the UK, European and American businesses. The amount of the prior year-end inventory available to secure an asset-backed loan was £37,981,000. In addition bank loans to Hoomark and IG Design Group USA, Inc (formerly International Greetings USA) (which were repaid during the year) were secured on a freehold property and contents, including inventory, therein.
Please see note 17 for more details of the new banking facilities.
During the year the Group reviewed the life of certain printing consumables (printing sleeves and cylinders) resulting in a revision to the estimated life over which their costs are charged to cost of sales in the profit and loss account. The detailed review considered the current usage patterns and the estimated lives were updated to best reflect the likely future usage. The net impact of this change in estimate was an increased underlying charge of £172,000 and an exceptional charge of £1,137,000 in the year.
15 Trade and other receivables 2017 2016 £000 £000
Trade receivables 25,991 18,634 Prepayments and accrued income 1,539 1,645 Other receivables 1,871 790 VAT receivable 221 118 29,622 21,187
On 6 June 2016 the Group’s bank facilities were renegotiated, the asset backed loan facility was replaced with an invoice discounting facility and seasonal revolving credit facility. None of this facility was drawn at 31 March 2017.
In the prior year part of the Group’s funding was via asset-backed loans from our bankers. These loans were secured on part of the inventory and trade receivables of the UK, European and American businesses. The amount of the prior year-end trade receivables available to secure the asset-backed loans was £14,839,000. The asset-backed loan balance at 31 March 2016 was £797,000.
Please see note 17 for more details of the new banking facilities.
There are no trade receivables in the current year (2016: £nil) expected to be recovered in more than twelve months.
The Group’s exposure to credit and currency risks and impairment losses related to trade and other receivables is disclosed in note 26.
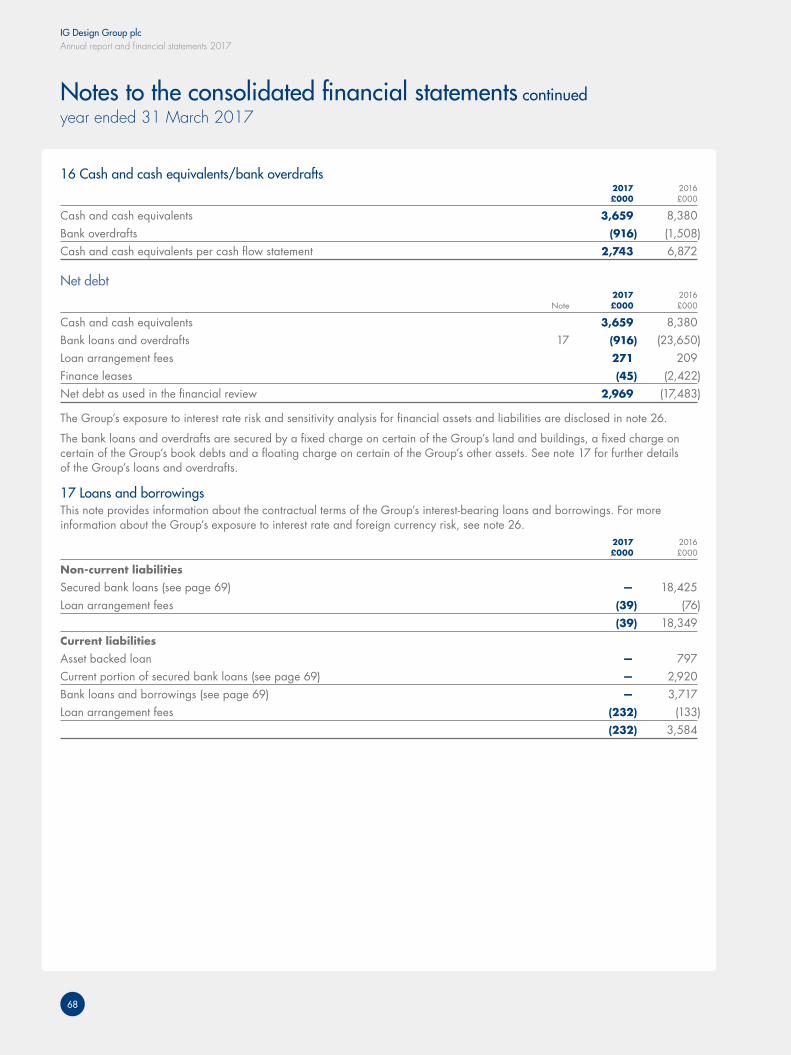
IG Design Group plcAnnual report and financial statements 2017
68
Notes to the consolidated financial statements continuedyear ended 31 March 2017
16 Cash and cash equivalents/bank overdrafts 2017 2016 £000 £000
Cash and cash equivalents 3,659 8,380 Bank overdrafts (916) (1,508)Cash and cash equivalents per cash flow statement 2,743 6,872
Net debt 2017 2016 Note £000 £000
Cash and cash equivalents 3,659 8,380 Bank loans and overdrafts 17 (916) (23,650)Loan arrangement fees 271 209 Finance leases (45) (2,422)Net debt as used in the financial review 2,969 (17,483)
The Group’s exposure to interest rate risk and sensitivity analysis for financial assets and liabilities are disclosed in note 26.
The bank loans and overdrafts are secured by a fixed charge on certain of the Group’s land and buildings, a fixed charge on certain of the Group’s book debts and a floating charge on certain of the Group’s other assets. See note 17 for further details of the Group’s loans and overdrafts.
17 Loans and borrowingsThis note provides information about the contractual terms of the Group’s interest-bearing loans and borrowings. For more information about the Group’s exposure to interest rate and foreign currency risk, see note 26. 2017 2016 £000 £000
Non-current liabilities
Secured bank loans (see page 69) — 18,425 Loan arrangement fees (39) (76) (39) 18,349 Current liabilities
Asset backed loan — 797 Current portion of secured bank loans (see page 69) — 2,920 Bank loans and borrowings (see page 69) — 3,717 Loan arrangement fees (232) (133) (232) 3,584
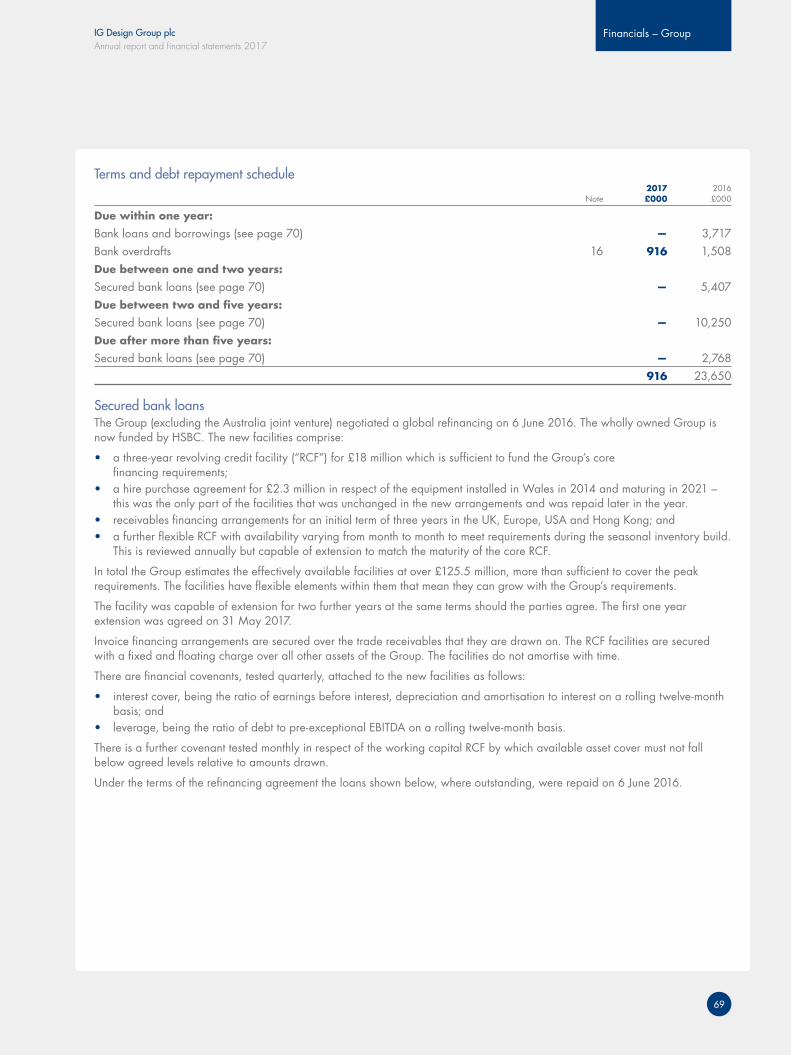
IG Design Group plcAnnual report and financial statements 2017
Financials – Group
69
Terms and debt repayment schedule 2017 2016 Note £000 £000
Due within one year:
Bank loans and borrowings (see page 70) — 3,717 Bank overdrafts 16 916 1,508 Due between one and two years:
Secured bank loans (see page 70) — 5,407 Due between two and five years:
Secured bank loans (see page 70) — 10,250 Due after more than five years:
Secured bank loans (see page 70) — 2,768 916 23,650
Secured bank loansThe Group (excluding the Australia joint venture) negotiated a global refinancing on 6 June 2016. The wholly owned Group is now funded by HSBC. The new facilities comprise:
• a three-year revolving credit facility (“RCF”) for £18 million which is sufficient to fund the Group’s core financing requirements;
• a hire purchase agreement for £2.3 million in respect of the equipment installed in Wales in 2014 and maturing in 2021 – this was the only part of the facilities that was unchanged in the new arrangements and was repaid later in the year.
• receivables financing arrangements for an initial term of three years in the UK, Europe, USA and Hong Kong; and• a further flexible RCF with availability varying from month to month to meet requirements during the seasonal inventory build.
This is reviewed annually but capable of extension to match the maturity of the core RCF.
In total the Group estimates the effectively available facilities at over £125.5 million, more than sufficient to cover the peak requirements. The facilities have flexible elements within them that mean they can grow with the Group’s requirements.
The facility was capable of extension for two further years at the same terms should the parties agree. The first one year extension was agreed on 31 May 2017.
Invoice financing arrangements are secured over the trade receivables that they are drawn on. The RCF facilities are secured with a fixed and floating charge over all other assets of the Group. The facilities do not amortise with time.
There are financial covenants, tested quarterly, attached to the new facilities as follows:
• interest cover, being the ratio of earnings before interest, depreciation and amortisation to interest on a rolling twelve-month basis; and
• leverage, being the ratio of debt to pre-exceptional EBITDA on a rolling twelve-month basis.
There is a further covenant tested monthly in respect of the working capital RCF by which available asset cover must not fall below agreed levels relative to amounts drawn.
Under the terms of the refinancing agreement the loans shown below, where outstanding, were repaid on 6 June 2016.
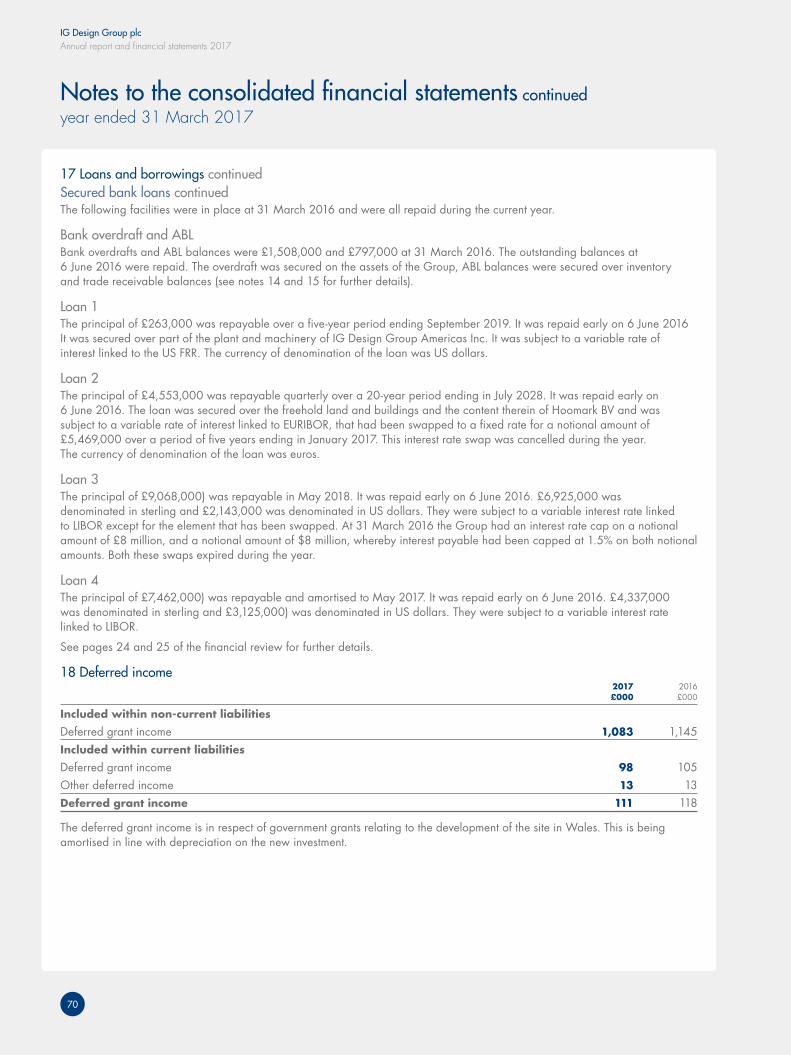
IG Design Group plcAnnual report and financial statements 2017
70
Notes to the consolidated financial statements continuedyear ended 31 March 2017
17 Loans and borrowings continuedSecured bank loans continuedThe following facilities were in place at 31 March 2016 and were all repaid during the current year.
Bank overdraft and ABLBank overdrafts and ABL balances were £1,508,000 and £797,000 at 31 March 2016. The outstanding balances at 6 June 2016 were repaid. The overdraft was secured on the assets of the Group, ABL balances were secured over inventory and trade receivable balances (see notes 14 and 15 for further details).
Loan 1The principal of £263,000 was repayable over a five-year period ending September 2019. It was repaid early on 6 June 2016 It was secured over part of the plant and machinery of IG Design Group Americas Inc. It was subject to a variable rate of interest linked to the US FRR. The currency of denomination of the loan was US dollars.
Loan 2The principal of £4,553,000 was repayable quarterly over a 20-year period ending in July 2028. It was repaid early on 6 June 2016. The loan was secured over the freehold land and buildings and the content therein of Hoomark BV and was subject to a variable rate of interest linked to EURIBOR, that had been swapped to a fixed rate for a notional amount of £5,469,000 over a period of five years ending in January 2017. This interest rate swap was cancelled during the year. The currency of denomination of the loan was euros.
Loan 3The principal of £9,068,000) was repayable in May 2018. It was repaid early on 6 June 2016. £6,925,000 was denominated in sterling and £2,143,000 was denominated in US dollars. They were subject to a variable interest rate linked to LIBOR except for the element that has been swapped. At 31 March 2016 the Group had an interest rate cap on a notional amount of £8 million, and a notional amount of $8 million, whereby interest payable had been capped at 1.5% on both notional amounts. Both these swaps expired during the year.
Loan 4The principal of £7,462,000) was repayable and amortised to May 2017. It was repaid early on 6 June 2016. £4,337,000 was denominated in sterling and £3,125,000) was denominated in US dollars. They were subject to a variable interest rate linked to LIBOR.
See pages 24 and 25 of the financial review for further details.
18 Deferred income 2017 2016 £000 £000
Included within non-current liabilities
Deferred grant income 1,083 1,145 Included within current liabilities
Deferred grant income 98 105 Other deferred income 13 13 Deferred grant income 111 118
The deferred grant income is in respect of government grants relating to the development of the site in Wales. This is being amortised in line with depreciation on the new investment.
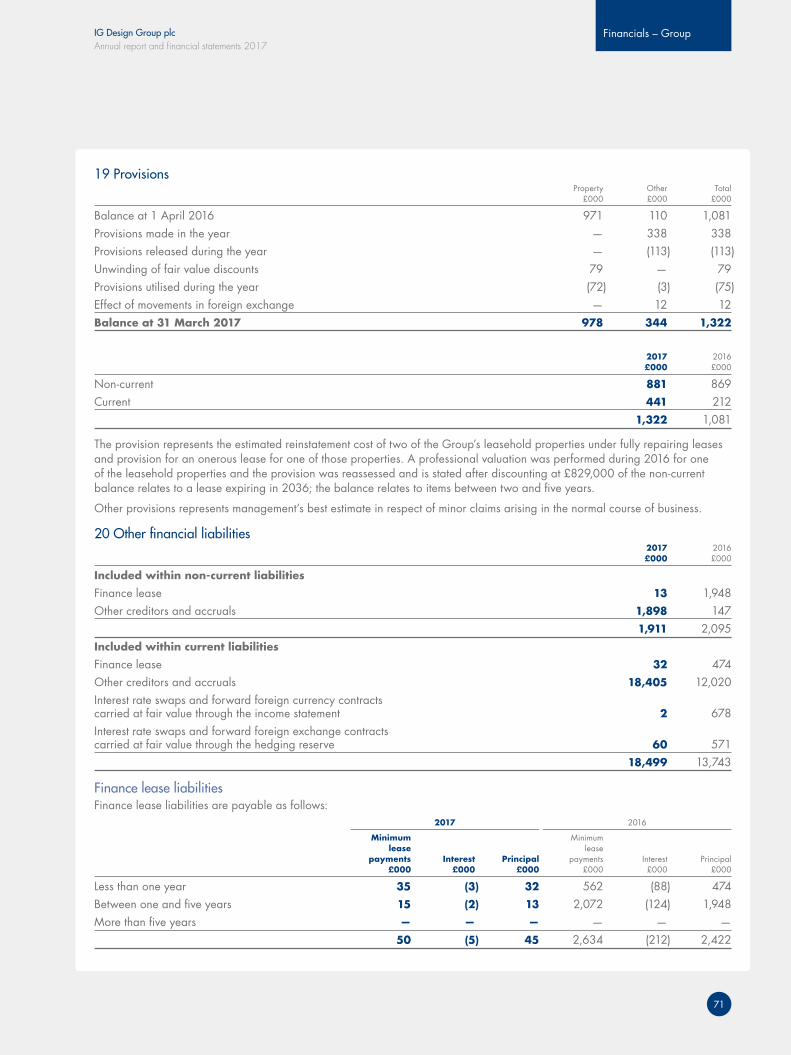
IG Design Group plcAnnual report and financial statements 2017
Financials – Group
71
19 Provisions Property Other Total £000 £000 £000
Balance at 1 April 2016 971 110 1,081 Provisions made in the year — 338 338 Provisions released during the year — (113) (113)Unwinding of fair value discounts 79 — 79 Provisions utilised during the year (72) (3) (75)Effect of movements in foreign exchange — 12 12 Balance at 31 March 2017 978 344 1,322
2017 2016 £000 £000
Non-current 881 869 Current 441 212 1,322 1,081
The provision represents the estimated reinstatement cost of two of the Group’s leasehold properties under fully repairing leases and provision for an onerous lease for one of those properties. A professional valuation was performed during 2016 for one of the leasehold properties and the provision was reassessed and is stated after discounting at £829,000 of the non-current balance relates to a lease expiring in 2036; the balance relates to items between two and five years.
Other provisions represents management’s best estimate in respect of minor claims arising in the normal course of business.
20 Other financial liabilities 2017 2016 £000 £000
Included within non-current liabilities
Finance lease 13 1,948 Other creditors and accruals 1,898 147 1,911 2,095 Included within current liabilities
Finance lease 32 474 Other creditors and accruals 18,405 12,020 Interest rate swaps and forward foreign currency contracts carried at fair value through the income statement 2 678 Interest rate swaps and forward foreign exchange contracts carried at fair value through the hedging reserve 60 571 18,499 13,743
Finance lease liabilitiesFinance lease liabilities are payable as follows: 2017 2016 Minimum Minimum lease lease payments Interest Principal payments Interest Principal £000 £000 £000 £000 £000 £000
Less than one year 35 (3) 32 562 (88) 474Between one and five years 15 (2) 13 2,072 (124) 1,948More than five years — — — — — — 50 (5) 45 2,634 (212) 2,422
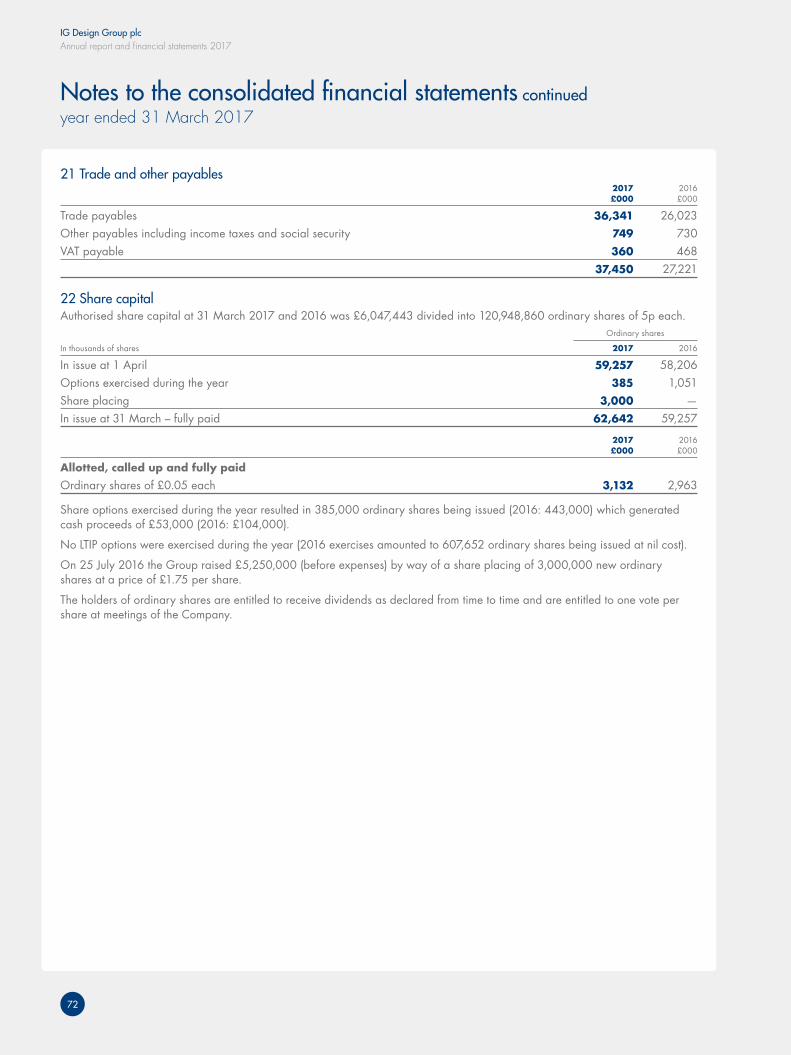
IG Design Group plcAnnual report and financial statements 2017
72
Notes to the consolidated financial statements continuedyear ended 31 March 2017
21 Trade and other payables 2017 2016 £000 £000
Trade payables 36,341 26,023 Other payables including income taxes and social security 749 730 VAT payable 360 468 37,450 27,221
22 Share capital Authorised share capital at 31 March 2017 and 2016 was £6,047,443 divided into 120,948,860 ordinary shares of 5p each. Ordinary shares
In thousands of shares 2017 2016
In issue at 1 April 59,257 58,206Options exercised during the year 385 1,051Share placing 3,000 —In issue at 31 March – fully paid 62,642 59,257
2017 2016 £000 £000
Allotted, called up and fully paid Ordinary shares of £0.05 each 3,132 2,963
Share options exercised during the year resulted in 385,000 ordinary shares being issued (2016: 443,000) which generated cash proceeds of £53,000 (2016: £104,000).
No LTIP options were exercised during the year (2016 exercises amounted to 607,652 ordinary shares being issued at nil cost).
On 25 July 2016 the Group raised £5,250,000 (before expenses) by way of a share placing of 3,000,000 new ordinary shares at a price of £1.75 per share.
The holders of ordinary shares are entitled to receive dividends as declared from time to time and are entitled to one vote per share at meetings of the Company.
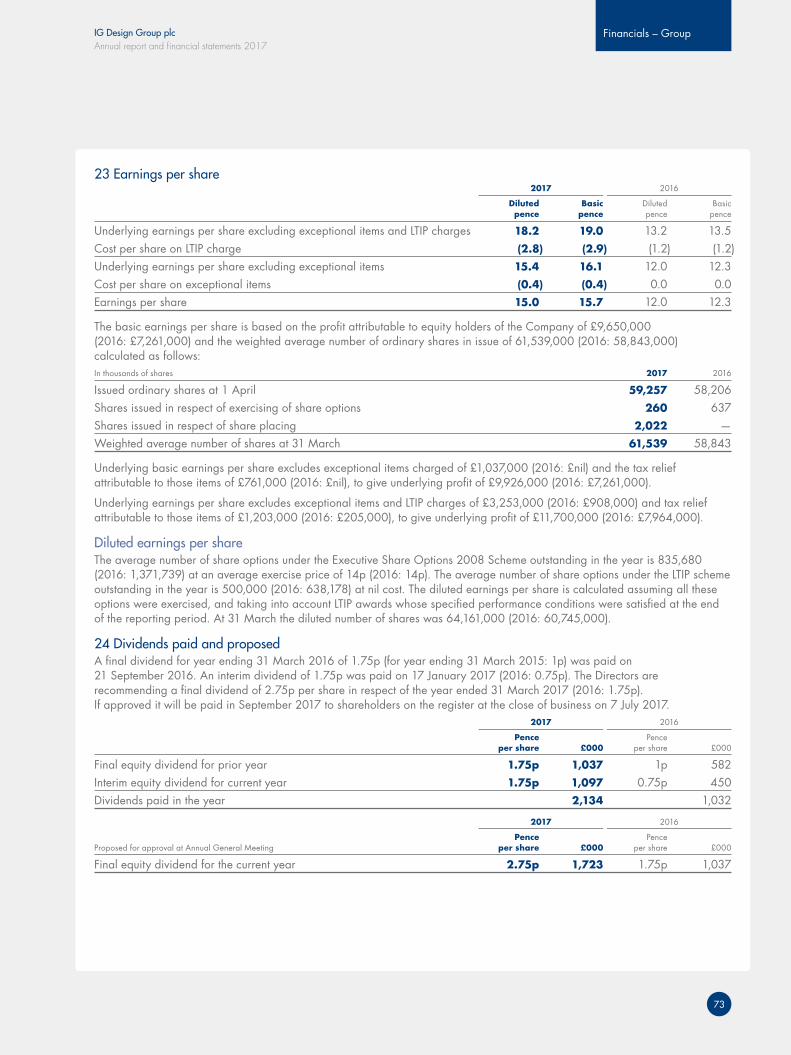
IG Design Group plcAnnual report and financial statements 2017
Financials – Group
73
23 Earnings per share 2017 2016 Diluted Basic Diluted Basic pence pence pence pence
Underlying earnings per share excluding exceptional items and LTIP charges 18.2 19.0 13.2 13.5Cost per share on LTIP charge (2.8) (2.9) (1.2) (1.2)Underlying earnings per share excluding exceptional items 15.4 16.1 12.0 12.3Cost per share on exceptional items (0.4) (0.4) 0.0 0.0Earnings per share 15.0 15.7 12.0 12.3
The basic earnings per share is based on the profit attributable to equity holders of the Company of £9,650,000 (2016: £7,261,000) and the weighted average number of ordinary shares in issue of 61,539,000 (2016: 58,843,000) calculated as follows:In thousands of shares 2017 2016
Issued ordinary shares at 1 April 59,257 58,206Shares issued in respect of exercising of share options 260 637 Shares issued in respect of share placing 2,022 — Weighted average number of shares at 31 March 61,539 58,843
Underlying basic earnings per share excludes exceptional items charged of £1,037,000 (2016: £nil) and the tax relief attributable to those items of £761,000 (2016: £nil), to give underlying profit of £9,926,000 (2016: £7,261,000).
Underlying earnings per share excludes exceptional items and LTIP charges of £3,253,000 (2016: £908,000) and tax relief attributable to those items of £1,203,000 (2016: £205,000), to give underlying profit of £11,700,000 (2016: £7,964,000).
Diluted earnings per shareThe average number of share options under the Executive Share Options 2008 Scheme outstanding in the year is 835,680 (2016: 1,371,739) at an average exercise price of 14p (2016: 14p). The average number of share options under the LTIP scheme outstanding in the year is 500,000 (2016: 638,178) at nil cost. The diluted earnings per share is calculated assuming all these options were exercised, and taking into account LTIP awards whose specified performance conditions were satisfied at the end of the reporting period. At 31 March the diluted number of shares was 64,161,000 (2016: 60,745,000).
24 Dividends paid and proposedA final dividend for year ending 31 March 2016 of 1.75p (for year ending 31 March 2015: 1p) was paid on 21 September 2016. An interim dividend of 1.75p was paid on 17 January 2017 (2016: 0.75p). The Directors are recommending a final dividend of 2.75p per share in respect of the year ended 31 March 2017 (2016: 1.75p). If approved it will be paid in September 2017 to shareholders on the register at the close of business on 7 July 2017. 2017 2016 Pence Pence per share £000 per share £000
Final equity dividend for prior year 1.75p 1,037 1p 582 Interim equity dividend for current year 1.75p 1,097 0.75p 450 Dividends paid in the year 2,134 1,032
2017 2016 Pence Pence Proposed for approval at Annual General Meeting per share £000 per share £000
Final equity dividend for the current year 2.75p 1,723 1.75p 1,037
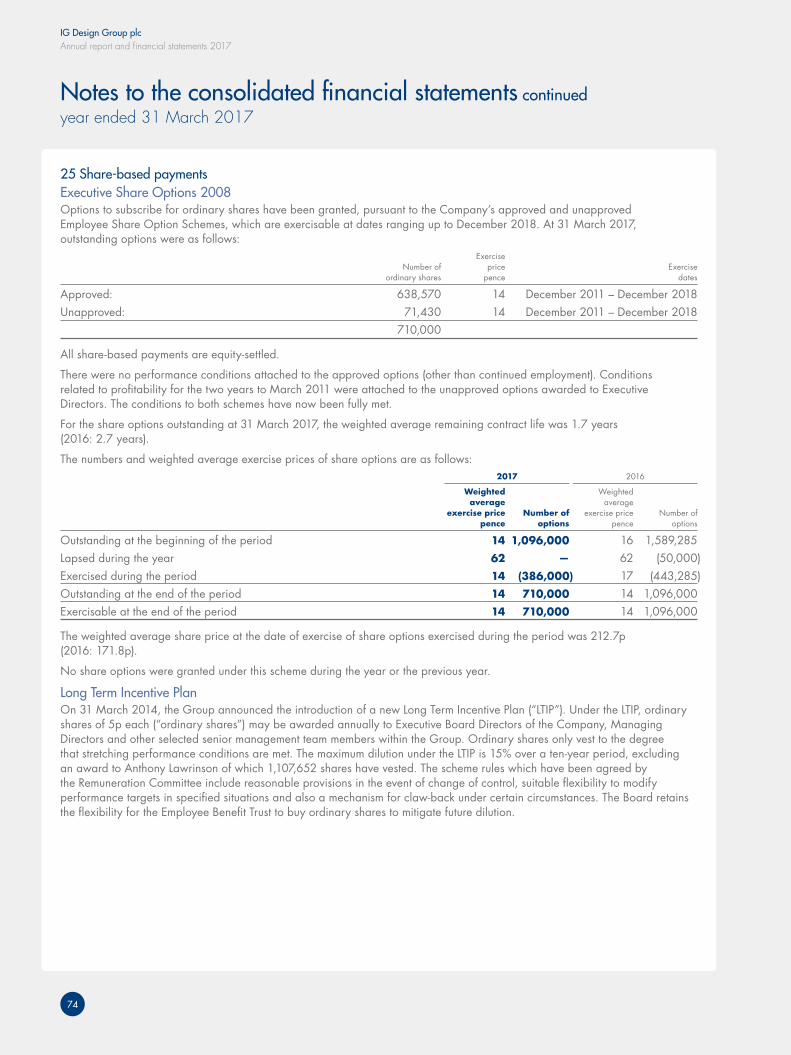
IG Design Group plcAnnual report and financial statements 2017
74
Notes to the consolidated financial statements continuedyear ended 31 March 2017
25 Share‑based paymentsExecutive Share Options 2008Options to subscribe for ordinary shares have been granted, pursuant to the Company’s approved and unapproved Employee Share Option Schemes, which are exercisable at dates ranging up to December 2018. At 31 March 2017, outstanding options were as follows: Exercise Number of price Exercise ordinary shares pence dates
Approved: 638,570 14 December 2011 – December 2018Unapproved: 71,430 14 December 2011 – December 2018 710,000
All share-based payments are equity-settled.
There were no performance conditions attached to the approved options (other than continued employment). Conditions related to profitability for the two years to March 2011 were attached to the unapproved options awarded to Executive Directors. The conditions to both schemes have now been fully met.
For the share options outstanding at 31 March 2017, the weighted average remaining contract life was 1.7 years (2016: 2.7 years).
The numbers and weighted average exercise prices of share options are as follows: 2017 2016 Weighted Weighted average average exercise price Number of exercise price Number of pence options pence options
Outstanding at the beginning of the period 14 1,096,000 16 1,589,285 Lapsed during the year 62 — 62 (50,000)Exercised during the period 14 (386,000) 17 (443,285)Outstanding at the end of the period 14 710,000 14 1,096,000Exercisable at the end of the period 14 710,000 14 1,096,000
The weighted average share price at the date of exercise of share options exercised during the period was 212.7p (2016: 171.8p).
No share options were granted under this scheme during the year or the previous year.
Long Term Incentive PlanOn 31 March 2014, the Group announced the introduction of a new Long Term Incentive Plan (“LTIP”). Under the LTIP, ordinary shares of 5p each (“ordinary shares”) may be awarded annually to Executive Board Directors of the Company, Managing Directors and other selected senior management team members within the Group. Ordinary shares only vest to the degree that stretching performance conditions are met. The maximum dilution under the LTIP is 15% over a ten-year period, excluding an award to Anthony Lawrinson of which 1,107,652 shares have vested. The scheme rules which have been agreed by the Remuneration Committee include reasonable provisions in the event of change of control, suitable flexibility to modify performance targets in specified situations and also a mechanism for claw-back under certain circumstances. The Board retains the flexibility for the Employee Benefit Trust to buy ordinary shares to mitigate future dilution.
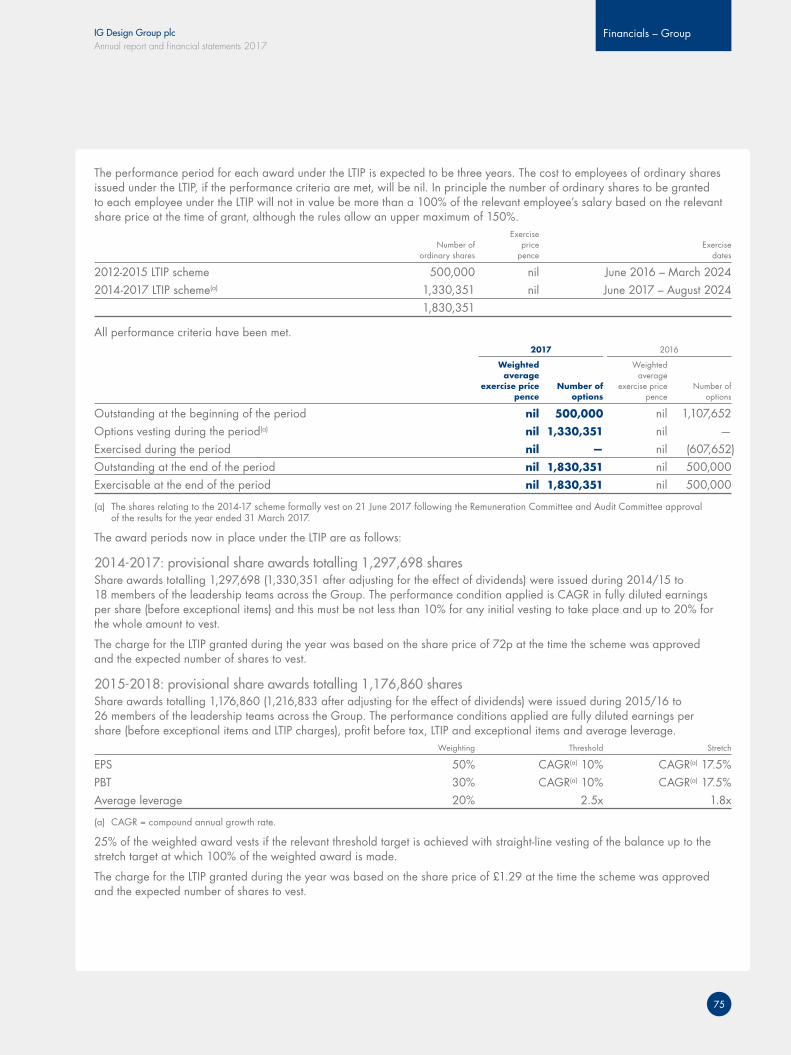
IG Design Group plcAnnual report and financial statements 2017
Financials – Group
75
The performance period for each award under the LTIP is expected to be three years. The cost to employees of ordinary shares issued under the LTIP, if the performance criteria are met, will be nil. In principle the number of ordinary shares to be granted to each employee under the LTIP will not in value be more than a 100% of the relevant employee’s salary based on the relevant share price at the time of grant, although the rules allow an upper maximum of 150%. Exercise Number of price Exercise ordinary shares pence dates
2012-2015 LTIP scheme 500,000 nil June 2016 – March 20242014-2017 LTIP scheme(a) 1,330,351 nil June 2017 – August 2024 1,830,351
All performance criteria have been met. 2017 2016 Weighted Weighted average average exercise price Number of exercise price Number of pence options pence options
Outstanding at the beginning of the period nil 500,000 nil 1,107,652 Options vesting during the period(a) nil 1,330,351 nil — Exercised during the period nil — nil (607,652)Outstanding at the end of the period nil 1,830,351 nil 500,000 Exercisable at the end of the period nil 1,830,351 nil 500,000
(a) The shares relating to the 2014-17 scheme formally vest on 21 June 2017 following the Remuneration Committee and Audit Committee approval of the results for the year ended 31 March 2017.
The award periods now in place under the LTIP are as follows:
2014‑2017: provisional share awards totalling 1,297,698 sharesShare awards totalling 1,297,698 (1,330,351 after adjusting for the effect of dividends) were issued during 2014/15 to 18 members of the leadership teams across the Group. The performance condition applied is CAGR in fully diluted earnings per share (before exceptional items) and this must be not less than 10% for any initial vesting to take place and up to 20% for the whole amount to vest.
The charge for the LTIP granted during the year was based on the share price of 72p at the time the scheme was approved and the expected number of shares to vest.
2015‑2018: provisional share awards totalling 1,176,860 sharesShare awards totalling 1,176,860 (1,216,833 after adjusting for the effect of dividends) were issued during 2015/16 to 26 members of the leadership teams across the Group. The performance conditions applied are fully diluted earnings per share (before exceptional items and LTIP charges), profit before tax, LTIP and exceptional items and average leverage. Weighting Threshold Stretch
EPS 50% CAGR(a) 10% CAGR(a) 17.5%PBT 30% CAGR(a) 10% CAGR(a) 17.5%Average leverage 20% 2.5x 1.8x
(a) CAGR = compound annual growth rate.
25% of the weighted award vests if the relevant threshold target is achieved with straight-line vesting of the balance up to the stretch target at which 100% of the weighted award is made.
The charge for the LTIP granted during the year was based on the share price of £1.29 at the time the scheme was approved and the expected number of shares to vest.
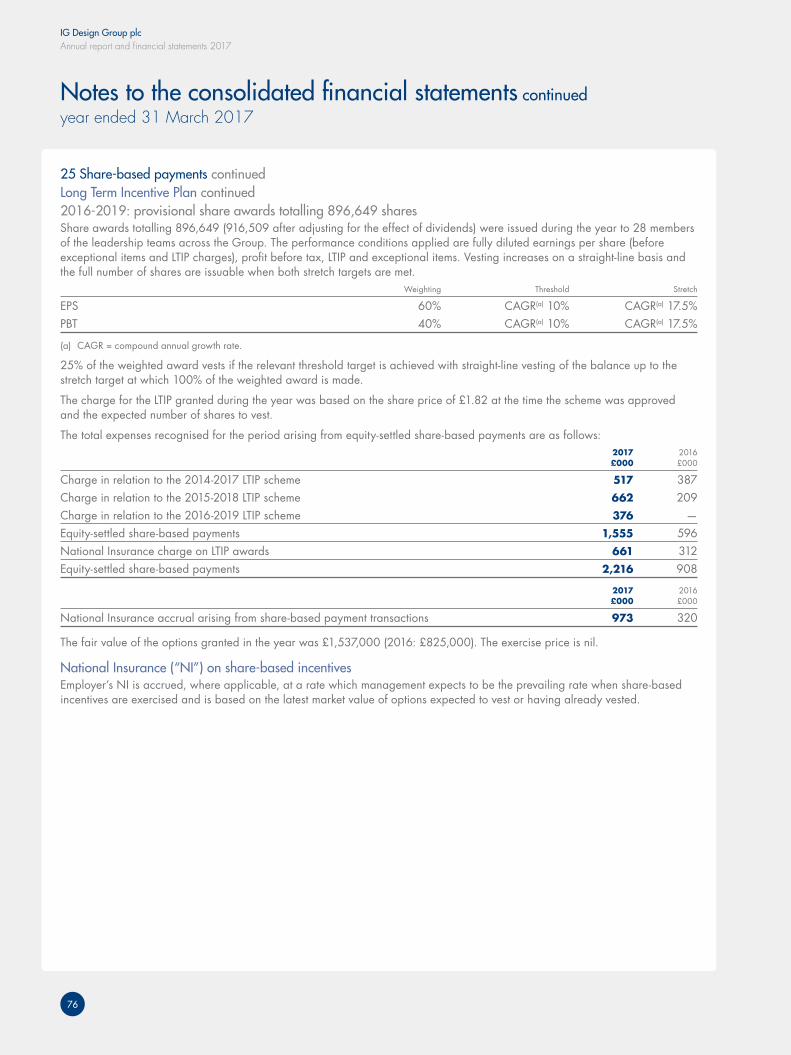
IG Design Group plcAnnual report and financial statements 2017
76
Notes to the consolidated financial statements continuedyear ended 31 March 2017
25 Share‑based payments continuedLong Term Incentive Plan continued2016‑2019: provisional share awards totalling 896,649 sharesShare awards totalling 896,649 (916,509 after adjusting for the effect of dividends) were issued during the year to 28 members of the leadership teams across the Group. The performance conditions applied are fully diluted earnings per share (before exceptional items and LTIP charges), profit before tax, LTIP and exceptional items. Vesting increases on a straight-line basis and the full number of shares are issuable when both stretch targets are met. Weighting Threshold Stretch
EPS 60% CAGR(a) 10% CAGR(a) 17.5%PBT 40% CAGR(a) 10% CAGR(a) 17.5%
(a) CAGR = compound annual growth rate.
25% of the weighted award vests if the relevant threshold target is achieved with straight-line vesting of the balance up to the stretch target at which 100% of the weighted award is made.
The charge for the LTIP granted during the year was based on the share price of £1.82 at the time the scheme was approved and the expected number of shares to vest.
The total expenses recognised for the period arising from equity-settled share-based payments are as follows: 2017 2016 £000 £000
Charge in relation to the 2014-2017 LTIP scheme 517 387 Charge in relation to the 2015-2018 LTIP scheme 662 209 Charge in relation to the 2016-2019 LTIP scheme 376 — Equity-settled share-based payments 1,555 596 National Insurance charge on LTIP awards 661 312 Equity-settled share-based payments 2,216 908
2017 2016 £000 £000
National Insurance accrual arising from share-based payment transactions 973 320
The fair value of the options granted in the year was £1,537,000 (2016: £825,000). The exercise price is nil.
National Insurance (“NI”) on share‑based incentivesEmployer’s NI is accrued, where applicable, at a rate which management expects to be the prevailing rate when share-based incentives are exercised and is based on the latest market value of options expected to vest or having already vested.
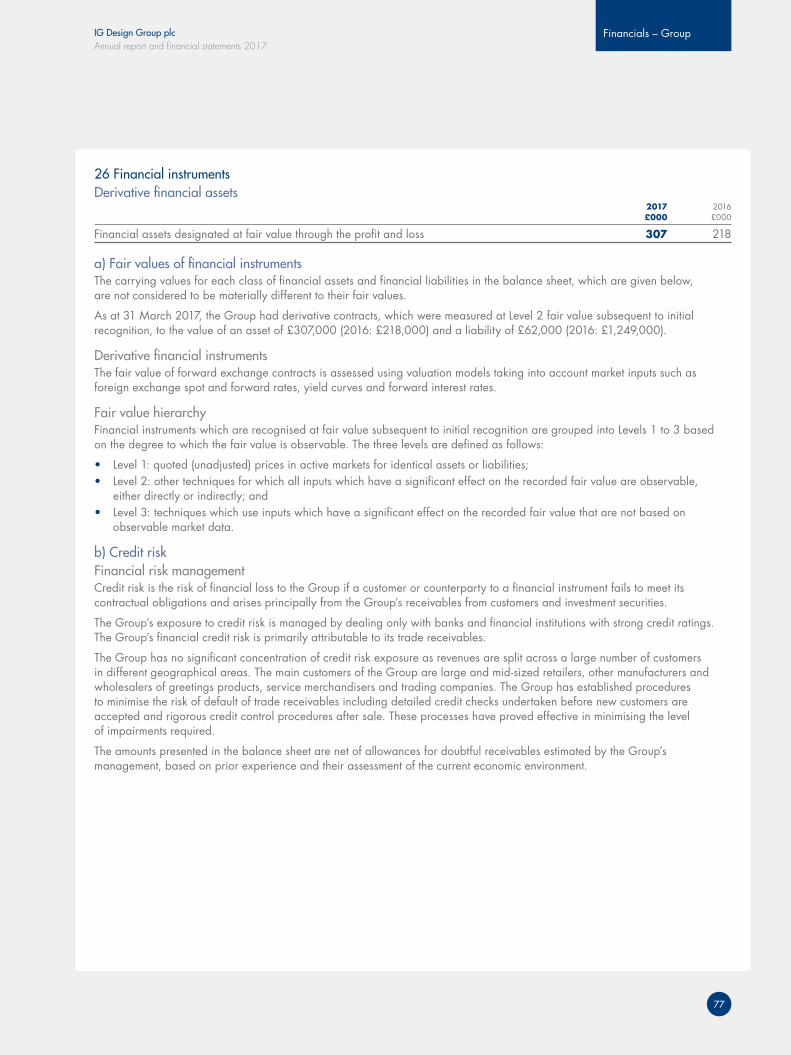
IG Design Group plcAnnual report and financial statements 2017
Financials – Group
77
26 Financial instrumentsDerivative financial assets 2017 2016 £000 £000
Financial assets designated at fair value through the profit and loss 307 218
a) Fair values of financial instrumentsThe carrying values for each class of financial assets and financial liabilities in the balance sheet, which are given below, are not considered to be materially different to their fair values.
As at 31 March 2017, the Group had derivative contracts, which were measured at Level 2 fair value subsequent to initial recognition, to the value of an asset of £307,000 (2016: £218,000) and a liability of £62,000 (2016: £1,249,000).
Derivative financial instrumentsThe fair value of forward exchange contracts is assessed using valuation models taking into account market inputs such as foreign exchange spot and forward rates, yield curves and forward interest rates.
Fair value hierarchyFinancial instruments which are recognised at fair value subsequent to initial recognition are grouped into Levels 1 to 3 based on the degree to which the fair value is observable. The three levels are defined as follows:
• Level 1: quoted (unadjusted) prices in active markets for identical assets or liabilities;• Level 2: other techniques for which all inputs which have a significant effect on the recorded fair value are observable,
either directly or indirectly; and• Level 3: techniques which use inputs which have a significant effect on the recorded fair value that are not based on
observable market data.
b) Credit riskFinancial risk managementCredit risk is the risk of financial loss to the Group if a customer or counterparty to a financial instrument fails to meet its contractual obligations and arises principally from the Group’s receivables from customers and investment securities.
The Group’s exposure to credit risk is managed by dealing only with banks and financial institutions with strong credit ratings. The Group’s financial credit risk is primarily attributable to its trade receivables.
The Group has no significant concentration of credit risk exposure as revenues are split across a large number of customers in different geographical areas. The main customers of the Group are large and mid-sized retailers, other manufacturers and wholesalers of greetings products, service merchandisers and trading companies. The Group has established procedures to minimise the risk of default of trade receivables including detailed credit checks undertaken before new customers are accepted and rigorous credit control procedures after sale. These processes have proved effective in minimising the level of impairments required.
The amounts presented in the balance sheet are net of allowances for doubtful receivables estimated by the Group’s management, based on prior experience and their assessment of the current economic environment.
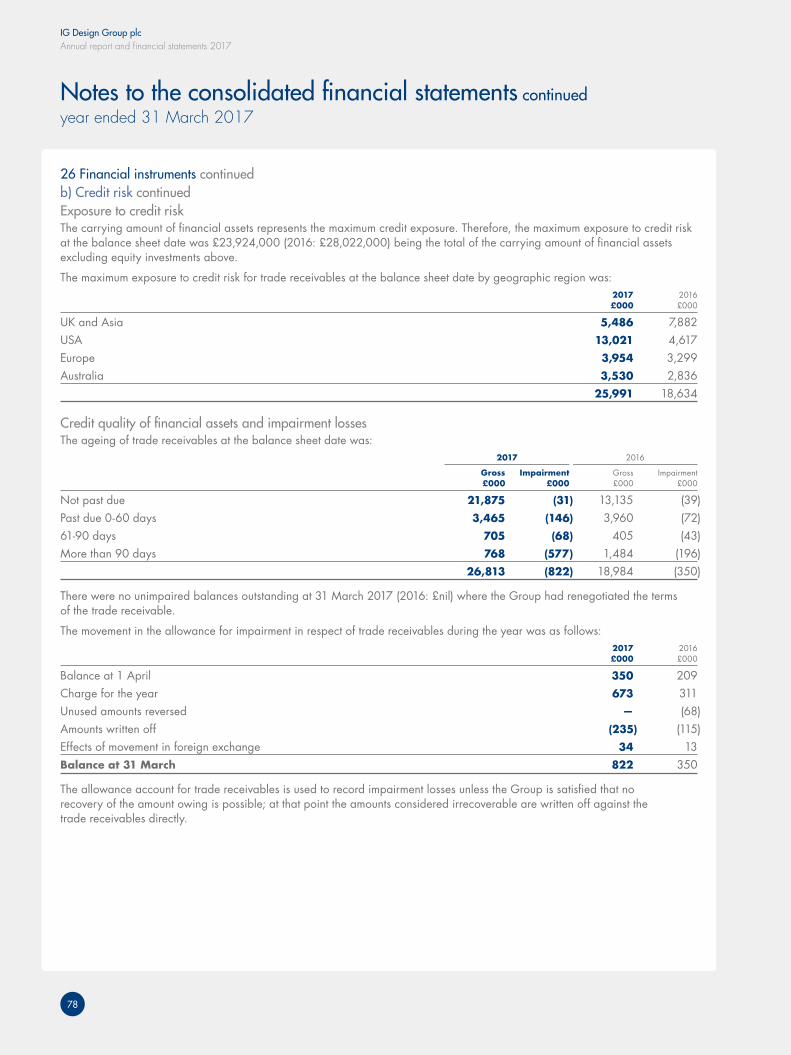
IG Design Group plcAnnual report and financial statements 2017
78
Notes to the consolidated financial statements continuedyear ended 31 March 2017
26 Financial instruments continuedb) Credit risk continuedExposure to credit riskThe carrying amount of financial assets represents the maximum credit exposure. Therefore, the maximum exposure to credit risk at the balance sheet date was £23,924,000 (2016: £28,022,000) being the total of the carrying amount of financial assets excluding equity investments above.
The maximum exposure to credit risk for trade receivables at the balance sheet date by geographic region was: 2017 2016 £000 £000
UK and Asia 5,486 7,882USA 13,021 4,617Europe 3,954 3,299Australia 3,530 2,836 25,991 18,634
Credit quality of financial assets and impairment lossesThe ageing of trade receivables at the balance sheet date was: 2017 2016 Gross Impairment Gross Impairment £000 £000 £000 £000
Not past due 21,875 (31) 13,135 (39)Past due 0-60 days 3,465 (146) 3,960 (72)61-90 days 705 (68) 405 (43)More than 90 days 768 (577) 1,484 (196) 26,813 (822) 18,984 (350)
There were no unimpaired balances outstanding at 31 March 2017 (2016: £nil) where the Group had renegotiated the terms of the trade receivable.
The movement in the allowance for impairment in respect of trade receivables during the year was as follows: 2017 2016 £000 £000
Balance at 1 April 350 209 Charge for the year 673 311 Unused amounts reversed — (68)Amounts written off (235) (115)Effects of movement in foreign exchange 34 13 Balance at 31 March 822 350
The allowance account for trade receivables is used to record impairment losses unless the Group is satisfied that no recovery of the amount owing is possible; at that point the amounts considered irrecoverable are written off against the trade receivables directly.

IG Design Group plcAnnual report and financial statements 2017
Financials – Group
79
c) Liquidity riskFinancial risk managementThe Group’s policy with regard to liquidity ensures adequate access to funds by maintaining an appropriate mix of short-term and longer-term facilities, which are reviewed on a regular basis. The maturity profile and details of debt outstanding at 31 March 2017 is set out in note 17.
The following are the contractual maturities of financial liabilities, including estimated interest payments: Nominal Carrying Contractual One year One to two interest rate amount cash flows or less years 31 March 2017 Notes % £000 £000 £000 £000
Non-derivative financial liabilities
Finance leases – euro leases(a) 20 5.0 45 (50) (35) (15)
Other financial liabilities(a) 20 20,303 (20,303) (18,405) (1,898)
Trade payables(a) 21 36,341 (36,341) (36,341) —
Other payables(a) 21 1,109 (1,109) (1,109) —
Bank overdraft(a) 4.0 – 5.3 916 (916) (916) —
Derivative financial liabilities
Forward foreign exchange contracts carried at fair value through the income statement(b) 2 — — —
Forward foreign exchange contracts carried at fair value through the hedging reserve(b) 60 (1,574) (1,574) —
58,776 (60,293) (58,380) (1,913)
(a) Measured at Level 3.(b) Measured at Level 2.
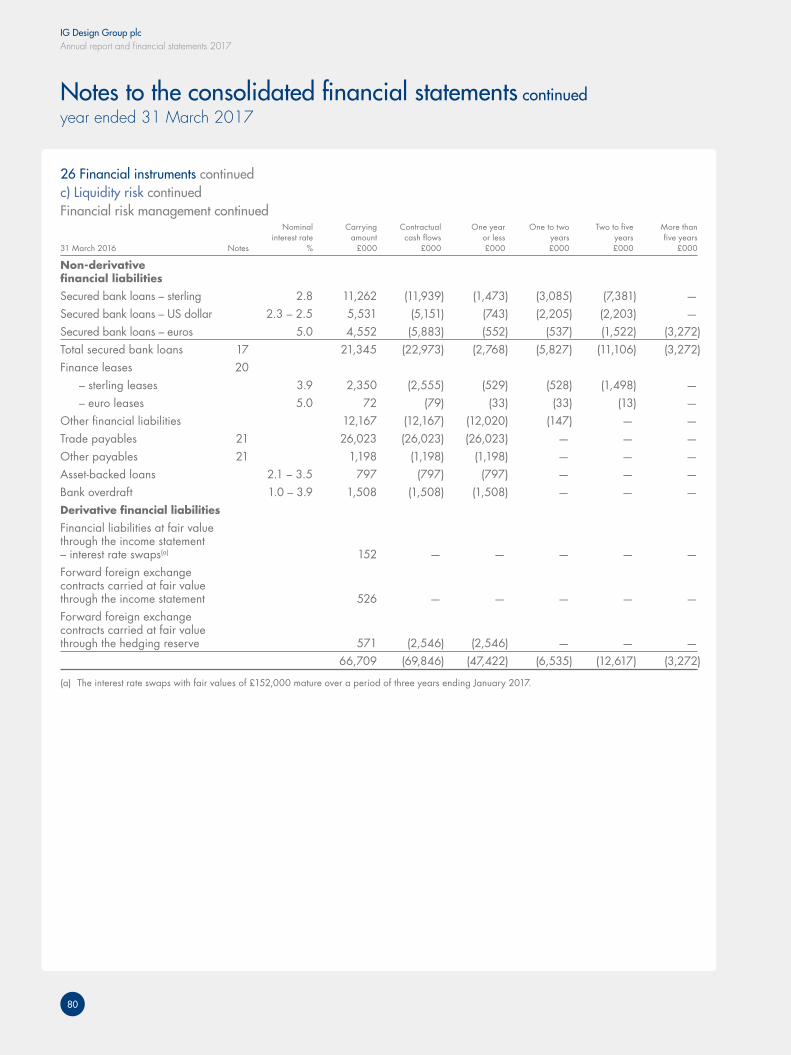
IG Design Group plcAnnual report and financial statements 2017
80
Notes to the consolidated financial statements continuedyear ended 31 March 2017
26 Financial instruments continuedc) Liquidity risk continuedFinancial risk management continued Nominal Carrying Contractual One year One to two Two to five More than interest rate amount cash flows or less years years five years 31 March 2016 Notes % £000 £000 £000 £000 £000 £000
Non-derivative financial liabilities Secured bank loans – sterling 2.8 11,262 (11,939) (1,473) (3,085) (7,381) — Secured bank loans – US dollar 2.3 – 2.5 5,531 (5,151) (743) (2,205) (2,203) — Secured bank loans – euros 5.0 4,552 (5,883) (552) (537) (1,522) (3,272)Total secured bank loans 17 21,345 (22,973) (2,768) (5,827) (11,106) (3,272)Finance leases 20 – sterling leases 3.9 2,350 (2,555) (529) (528) (1,498) — – euro leases 5.0 72 (79) (33) (33) (13) — Other financial liabilities 12,167 (12,167) (12,020) (147) — — Trade payables 21 26,023 (26,023) (26,023) — — — Other payables 21 1,198 (1,198) (1,198) — — — Asset-backed loans 2.1 – 3.5 797 (797) (797) — — — Bank overdraft 1.0 – 3.9 1,508 (1,508) (1,508) — — — Derivative financial liabilities Financial liabilities at fair value through the income statement – interest rate swaps(a) 152 — — — — — Forward foreign exchange contracts carried at fair value through the income statement 526 — — — — — Forward foreign exchange contracts carried at fair value through the hedging reserve 571 (2,546) (2,546) — — — 66,709 (69,846) (47,422) (6,535) (12,617) (3,272)
(a) The interest rate swaps with fair values of £152,000 mature over a period of three years ending January 2017.
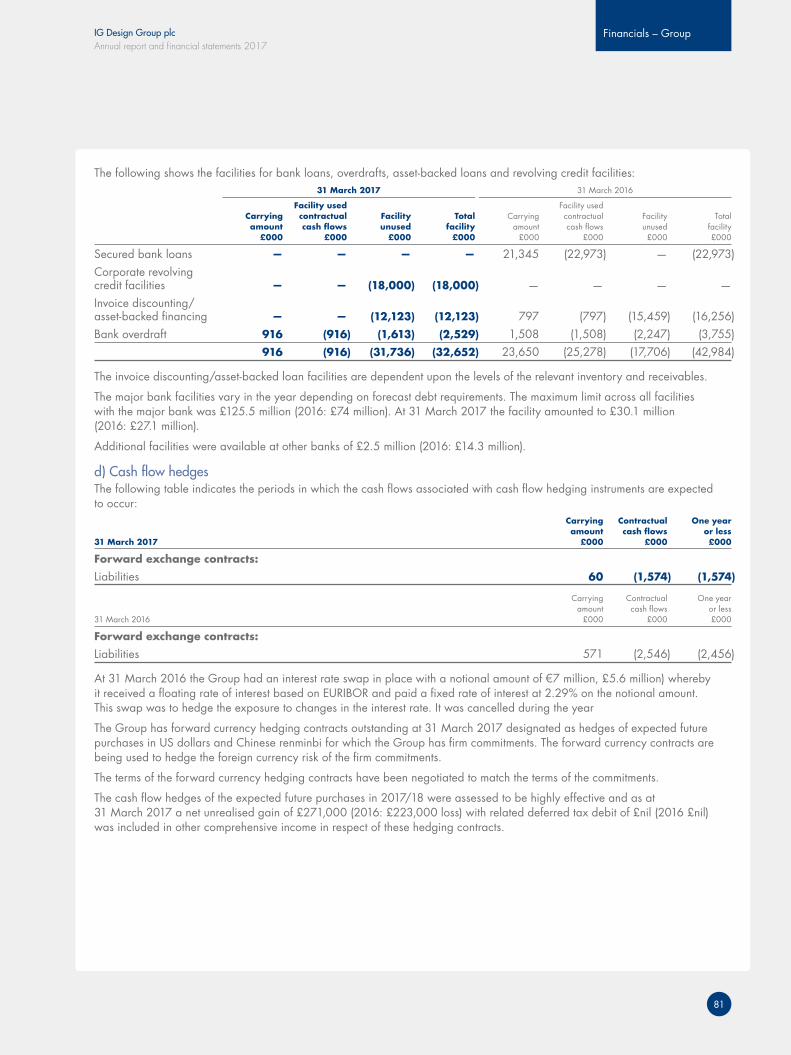
IG Design Group plcAnnual report and financial statements 2017
Financials – Group
81
The following shows the facilities for bank loans, overdrafts, asset-backed loans and revolving credit facilities: 31 March 2017 31 March 2016 Facility used Facility used Carrying contractual Facility Total Carrying contractual Facility Total amount cash flows unused facility amount cash flows unused facility £000 £000 £000 £000 £000 £000 £000 £000
Secured bank loans — — — — 21,345 (22,973) — (22,973)Corporate revolving credit facilities — — (18,000) (18,000) — — — — Invoice discounting/ asset-backed financing — — (12,123) (12,123) 797 (797) (15,459) (16,256)Bank overdraft 916 (916) (1,613) (2,529) 1,508 (1,508) (2,247) (3,755) 916 (916) (31,736) (32,652) 23,650 (25,278) (17,706) (42,984)
The invoice discounting/asset-backed loan facilities are dependent upon the levels of the relevant inventory and receivables.
The major bank facilities vary in the year depending on forecast debt requirements. The maximum limit across all facilities with the major bank was £125.5 million (2016: £74 million). At 31 March 2017 the facility amounted to £30.1 million (2016: £27.1 million).
Additional facilities were available at other banks of £2.5 million (2016: £14.3 million).
d) Cash flow hedgesThe following table indicates the periods in which the cash flows associated with cash flow hedging instruments are expected to occur: Carrying Contractual One year amount cash flows or less 31 March 2017 £000 £000 £000
Forward exchange contracts: Liabilities 60 (1,574) (1,574)
Carrying Contractual One year amount cash flows or less 31 March 2016 £000 £000 £000
Forward exchange contracts:
Liabilities 571 (2,546) (2,456)
At 31 March 2016 the Group had an interest rate swap in place with a notional amount of €7 million, £5.6 million) whereby it received a floating rate of interest based on EURIBOR and paid a fixed rate of interest at 2.29% on the notional amount. This swap was to hedge the exposure to changes in the interest rate. It was cancelled during the year
The Group has forward currency hedging contracts outstanding at 31 March 2017 designated as hedges of expected future purchases in US dollars and Chinese renminbi for which the Group has firm commitments. The forward currency contracts are being used to hedge the foreign currency risk of the firm commitments.
The terms of the forward currency hedging contracts have been negotiated to match the terms of the commitments.
The cash flow hedges of the expected future purchases in 2017/18 were assessed to be highly effective and as at 31 March 2017 a net unrealised gain of £271,000 (2016: £223,000 loss) with related deferred tax debit of £nil (2016 £nil) was included in other comprehensive income in respect of these hedging contracts.
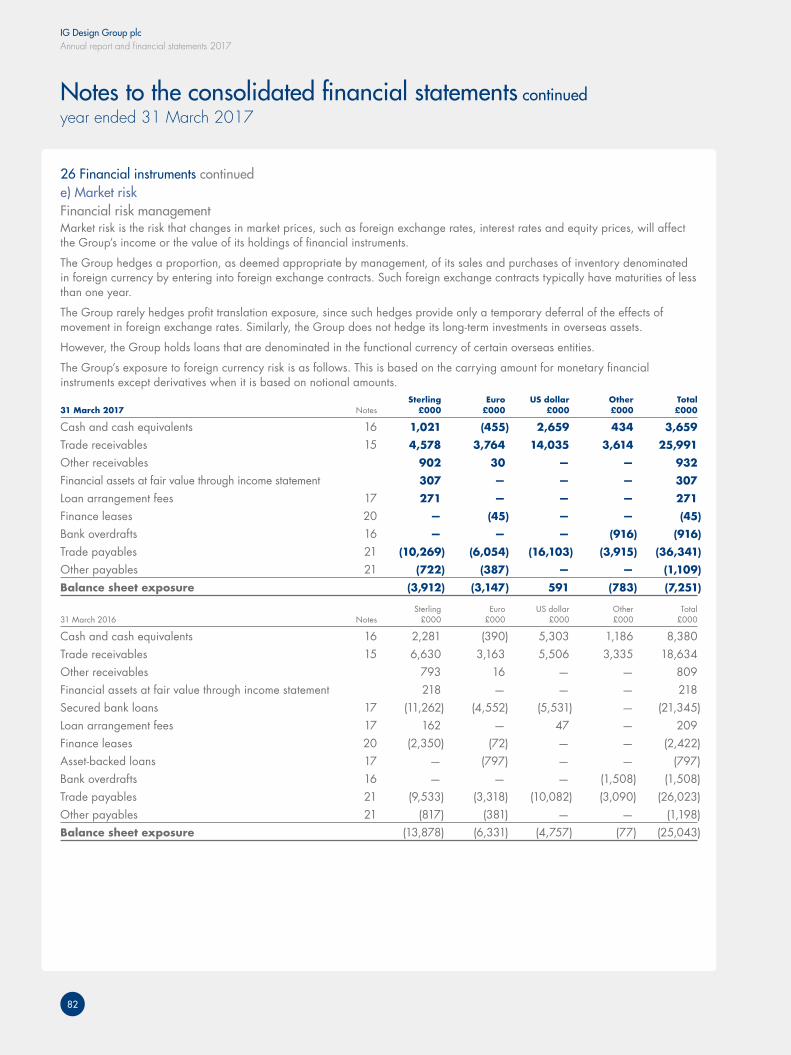
IG Design Group plcAnnual report and financial statements 2017
82
Notes to the consolidated financial statements continuedyear ended 31 March 2017
26 Financial instruments continuede) Market riskFinancial risk management Market risk is the risk that changes in market prices, such as foreign exchange rates, interest rates and equity prices, will affect the Group’s income or the value of its holdings of financial instruments.
The Group hedges a proportion, as deemed appropriate by management, of its sales and purchases of inventory denominated in foreign currency by entering into foreign exchange contracts. Such foreign exchange contracts typically have maturities of less than one year.
The Group rarely hedges profit translation exposure, since such hedges provide only a temporary deferral of the effects of movement in foreign exchange rates. Similarly, the Group does not hedge its long-term investments in overseas assets.
However, the Group holds loans that are denominated in the functional currency of certain overseas entities.
The Group’s exposure to foreign currency risk is as follows. This is based on the carrying amount for monetary financial instruments except derivatives when it is based on notional amounts. Sterling Euro US dollar Other Total 31 March 2017 Notes £000 £000 £000 £000 £000
Cash and cash equivalents 16 1,021 (455) 2,659 434 3,659 Trade receivables 15 4,578 3,764 14,035 3,614 25,991 Other receivables 902 30 — — 932 Financial assets at fair value through income statement 307 — — — 307 Loan arrangement fees 17 271 — — — 271 Finance leases 20 — (45) — — (45)
Bank overdrafts 16 — — — (916) (916)
Trade payables 21 (10,269) (6,054) (16,103) (3,915) (36,341)
Other payables 21 (722) (387) — — (1,109)
Balance sheet exposure (3,912) (3,147) 591 (783) (7,251)
Sterling Euro US dollar Other Total 31 March 2016 Notes £000 £000 £000 £000 £000
Cash and cash equivalents 16 2,281 (390) 5,303 1,186 8,380 Trade receivables 15 6,630 3,163 5,506 3,335 18,634 Other receivables 793 16 — — 809 Financial assets at fair value through income statement 218 — — — 218 Secured bank loans 17 (11,262) (4,552) (5,531) — (21,345)Loan arrangement fees 17 162 — 47 — 209 Finance leases 20 (2,350) (72) — — (2,422)Asset-backed loans 17 — (797) — — (797)Bank overdrafts 16 — — — (1,508) (1,508)Trade payables 21 (9,533) (3,318) (10,082) (3,090) (26,023)Other payables 21 (817) (381) — — (1,198)Balance sheet exposure (13,878) (6,331) (4,757) (77) (25,043)

IG Design Group plcAnnual report and financial statements 2017
Financials – Group
83
The following significant exchange rates applied during the year: Average rate Reporting date spot rate 2017 2016 2017 2016
Euro 1.19 1.36 1.17 1.26 US dollar 1.30 1.50 1.25 1.44
Sensitivity analysisA 10% weakening of the following currencies against sterling at 31 March 2017 would have affected equity and profit or loss by the amounts shown below. This calculation assumes that the change occurred at the balance sheet date and had been applied to risk exposures existing at that date.
This analysis assumes that all other variables, in particular other exchange rates and interest rates, remain constant. The analysis is performed on the same basis for 31 March 2016. Equity Profit/(loss) 2017 2016 2017 2016 £000 £000 £000 £000
Euro 286 89 (732) 18 US dollar (54) 432 (635) (959)
On the basis of the same assumptions, a 10% strengthening of the above currencies against sterling at 31 March 2017 would have affected equity and profit or loss by the following amounts: Equity Profit/(loss) 2017 2016 2017 2016 £000 £000 £000 £000
Euro (350) (109) 895 (22)US dollar 66 (529) 777 1,172
ProfileAt the balance sheet date the interest rate profile of the Group’s interest-bearing financial instruments was: 2017 2016 Notes £000 £000
Fixed rate instruments
Financial liabilities — (19,112)Variable rate instruments
Financial assets 3,659 8,380 Financial liabilities (916) (4,538)Loan arrangement fees 271 209 Finance leases (45) (2,422)Net cash/(debt) 16 2,969 (17,483)
The fixed rate borrowings in the prior year above are shown after taking account of interest rate swaps and interest rate caps.
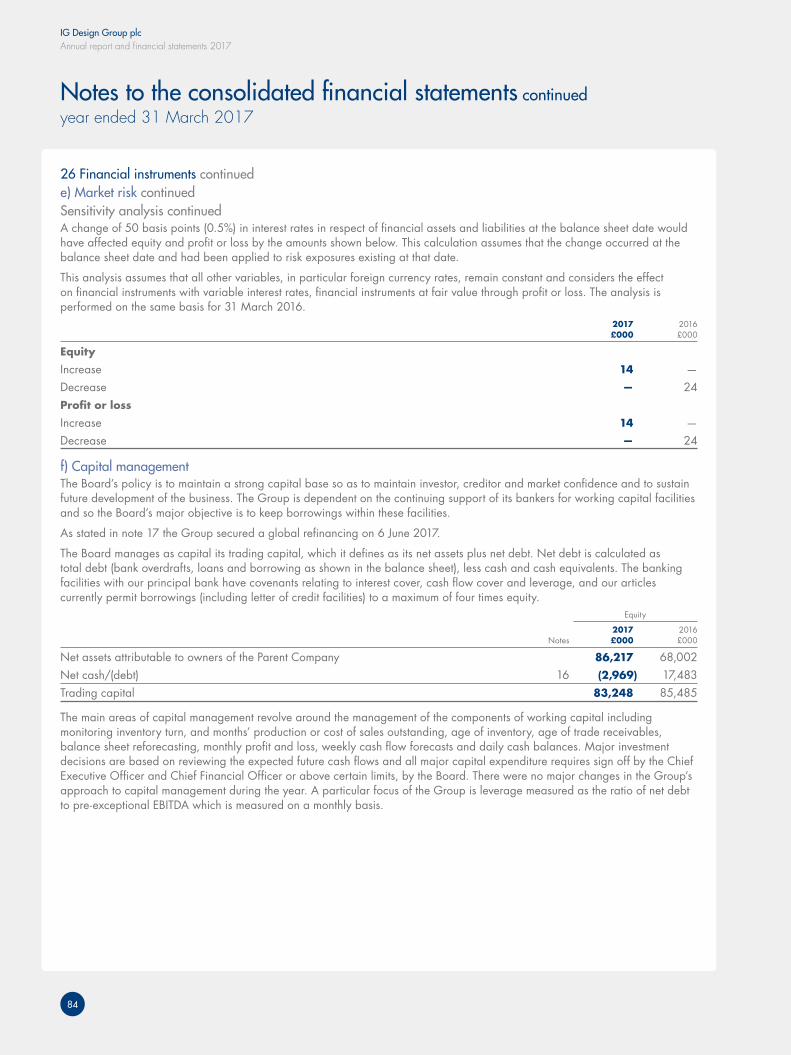
IG Design Group plcAnnual report and financial statements 2017
84
Notes to the consolidated financial statements continuedyear ended 31 March 2017
26 Financial instruments continuede) Market risk continuedSensitivity analysis continuedA change of 50 basis points (0.5%) in interest rates in respect of financial assets and liabilities at the balance sheet date would have affected equity and profit or loss by the amounts shown below. This calculation assumes that the change occurred at the balance sheet date and had been applied to risk exposures existing at that date.
This analysis assumes that all other variables, in particular foreign currency rates, remain constant and considers the effect on financial instruments with variable interest rates, financial instruments at fair value through profit or loss. The analysis is performed on the same basis for 31 March 2016. 2017 2016 £000 £000
Equity
Increase 14 — Decrease — 24Profit or loss
Increase 14 — Decrease — 24
f) Capital managementThe Board’s policy is to maintain a strong capital base so as to maintain investor, creditor and market confidence and to sustain future development of the business. The Group is dependent on the continuing support of its bankers for working capital facilities and so the Board’s major objective is to keep borrowings within these facilities.
As stated in note 17 the Group secured a global refinancing on 6 June 2017.
The Board manages as capital its trading capital, which it defines as its net assets plus net debt. Net debt is calculated as total debt (bank overdrafts, loans and borrowing as shown in the balance sheet), less cash and cash equivalents. The banking facilities with our principal bank have covenants relating to interest cover, cash flow cover and leverage, and our articles currently permit borrowings (including letter of credit facilities) to a maximum of four times equity. Equity
2017 2016 Notes £000 £000
Net assets attributable to owners of the Parent Company 86,217 68,002 Net cash/(debt) 16 (2,969) 17,483 Trading capital 83,248 85,485
The main areas of capital management revolve around the management of the components of working capital including monitoring inventory turn, and months’ production or cost of sales outstanding, age of inventory, age of trade receivables, balance sheet reforecasting, monthly profit and loss, weekly cash flow forecasts and daily cash balances. Major investment decisions are based on reviewing the expected future cash flows and all major capital expenditure requires sign off by the Chief Executive Officer and Chief Financial Officer or above certain limits, by the Board. There were no major changes in the Group’s approach to capital management during the year. A particular focus of the Group is leverage measured as the ratio of net debt to pre-exceptional EBITDA which is measured on a monthly basis.

IG Design Group plcAnnual report and financial statements 2017
Financials – Group
85
27 Operating leasesNon-cancellable operating lease rentals are payable as follows: 2017 2016 £000 £000
Less than one year 4,515 4,051 Between one and five years 11,064 11,698 More than five years 19,419 5,853 34,998 21,602
Non-cancellable operating leases are receivables as follows: 2017 2016 £000 £000
Less than one year — 908 Between one and five years 790 2,355 790 3,263
The Group leases a number of warehouse and factory facilities as well as vehicles and office equipment under operating leases. The leases of warehouse and factory facilities typically have an option to renew at the end of the lease term and lease payments are subject to five-yearly rent reviews.
One of the leased properties has been sublet by the Group and part of a second. The main sub-leases have periods to run of between one and five years. Sub-lease payments of £558,000 (2016: £547,000) were received during the financial year.
During the year £4,460,000 was recognised as an expense in the income statement in respect of operating leases (2016: £3,889,000).
28 Capital commitmentsAt 31 March 2017, the Group had outstanding authorised capital commitments to purchase plant and equipment for £575,000 (2016: £160,000).
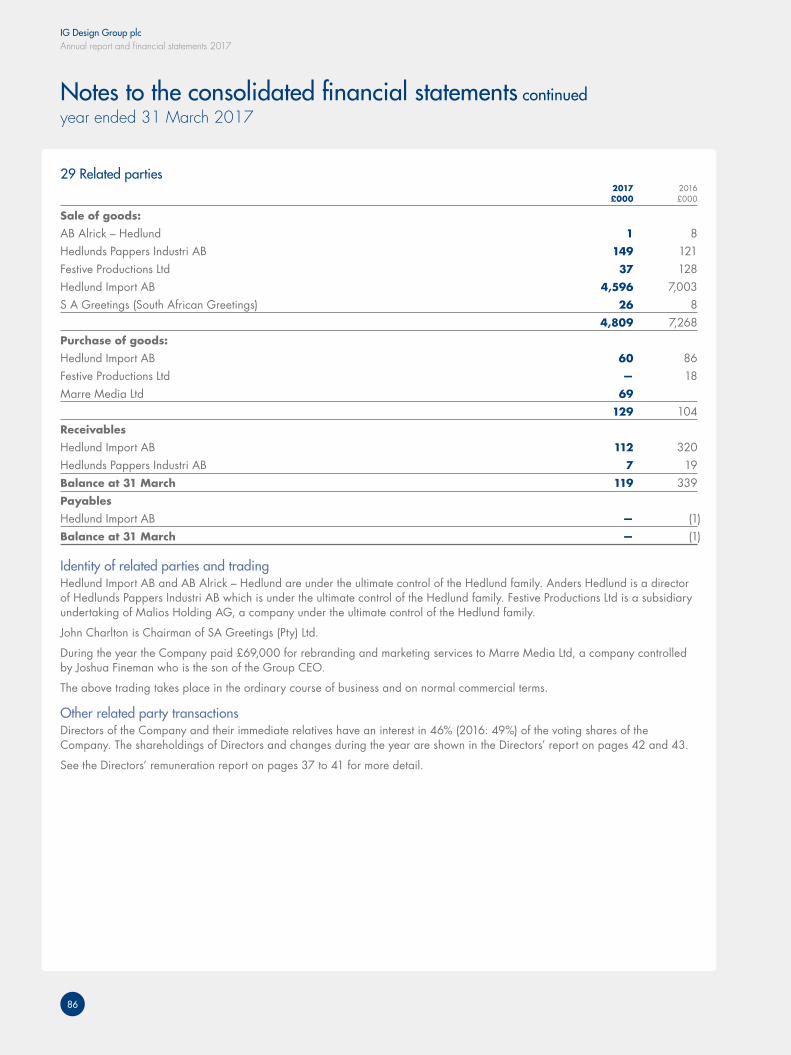
IG Design Group plcAnnual report and financial statements 2017
86
Notes to the consolidated financial statements continuedyear ended 31 March 2017
29 Related parties 2017 2016 £000 £000
Sale of goods:
AB Alrick – Hedlund 1 8 Hedlunds Pappers Industri AB 149 121 Festive Productions Ltd 37 128 Hedlund Import AB 4,596 7,003 S A Greetings (South African Greetings) 26 8 4,809 7,268 Purchase of goods:
Hedlund Import AB 60 86 Festive Productions Ltd — 18 Marre Media Ltd 69 129 104 Receivables
Hedlund Import AB 112 320 Hedlunds Pappers Industri AB 7 19 Balance at 31 March 119 339 Payables
Hedlund Import AB — (1)Balance at 31 March — (1)
Identity of related parties and tradingHedlund Import AB and AB Alrick – Hedlund are under the ultimate control of the Hedlund family. Anders Hedlund is a director of Hedlunds Pappers Industri AB which is under the ultimate control of the Hedlund family. Festive Productions Ltd is a subsidiary undertaking of Malios Holding AG, a company under the ultimate control of the Hedlund family.
John Charlton is Chairman of SA Greetings (Pty) Ltd.
During the year the Company paid £69,000 for rebranding and marketing services to Marre Media Ltd, a company controlled by Joshua Fineman who is the son of the Group CEO.
The above trading takes place in the ordinary course of business and on normal commercial terms.
Other related party transactionsDirectors of the Company and their immediate relatives have an interest in 46% (2016: 49%) of the voting shares of the Company. The shareholdings of Directors and changes during the year are shown in the Directors’ report on pages 42 and 43.
See the Directors’ remuneration report on pages 37 to 41 for more detail.
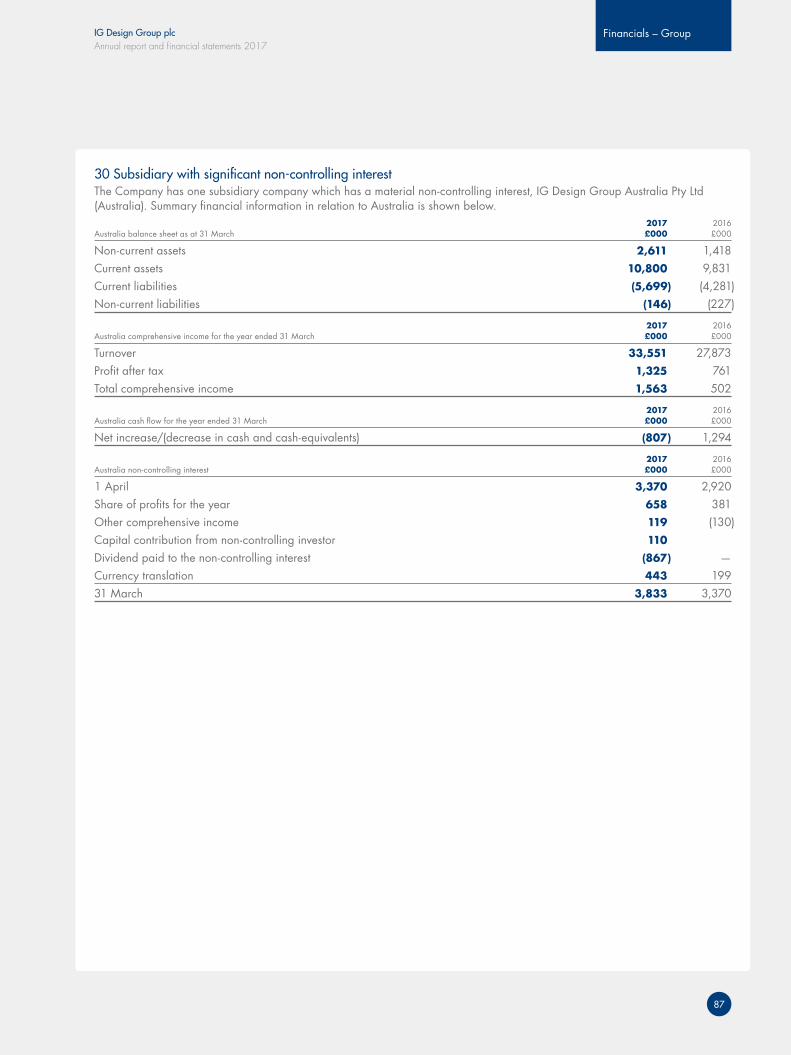
IG Design Group plcAnnual report and financial statements 2017
Financials – Group
87
30 Subsidiary with significant non‑controlling interestThe Company has one subsidiary company which has a material non-controlling interest, IG Design Group Australia Pty Ltd (Australia). Summary financial information in relation to Australia is shown below. 2017 2016 Australia balance sheet as at 31 March £000 £000
Non-current assets 2,611 1,418 Current assets 10,800 9,831 Current liabilities (5,699) (4,281)Non-current liabilities (146) (227)
2017 2016 Australia comprehensive income for the year ended 31 March £000 £000
Turnover 33,551 27,873 Profit after tax 1,325 761 Total comprehensive income 1,563 502
2017 2016 Australia cash flow for the year ended 31 March £000 £000
Net increase/(decrease in cash and cash-equivalents) (807) 1,294
2017 2016 Australia non-controlling interest £000 £000
1 April 3,370 2,920 Share of profits for the year 658 381 Other comprehensive income 119 (130)Capital contribution from non-controlling investor 110 Dividend paid to the non-controlling interest (867) —Currency translation 443 199 31 March 3,833 3,370
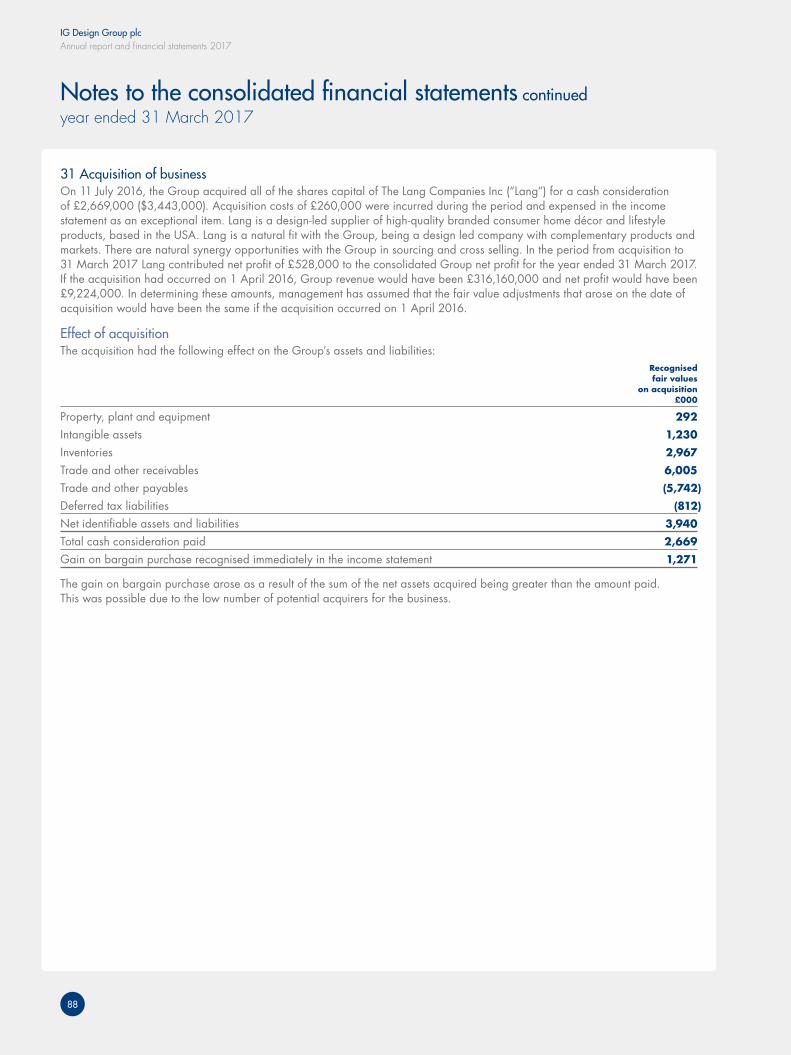
IG Design Group plcAnnual report and financial statements 2017
88
Notes to the consolidated financial statements continuedyear ended 31 March 2017
31 Acquisition of businessOn 11 July 2016, the Group acquired all of the shares capital of The Lang Companies Inc (“Lang”) for a cash consideration of £2,669,000 ($3,443,000). Acquisition costs of £260,000 were incurred during the period and expensed in the income statement as an exceptional item. Lang is a design-led supplier of high-quality branded consumer home décor and lifestyle products, based in the USA. Lang is a natural fit with the Group, being a design led company with complementary products and markets. There are natural synergy opportunities with the Group in sourcing and cross selling. In the period from acquisition to 31 March 2017 Lang contributed net profit of £528,000 to the consolidated Group net profit for the year ended 31 March 2017. If the acquisition had occurred on 1 April 2016, Group revenue would have been £316,160,000 and net profit would have been £9,224,000. In determining these amounts, management has assumed that the fair value adjustments that arose on the date of acquisition would have been the same if the acquisition occurred on 1 April 2016.
Effect of acquisitionThe acquisition had the following effect on the Group’s assets and liabilities: Recognised fair values on acquisition £000
Property, plant and equipment 292 Intangible assets 1,230
Inventories 2,967 Trade and other receivables 6,005
Trade and other payables (5,742)
Deferred tax liabilities (812)
Net identifiable assets and liabilities 3,940 Total cash consideration paid 2,669 Gain on bargain purchase recognised immediately in the income statement 1,271
The gain on bargain purchase arose as a result of the sum of the net assets acquired being greater than the amount paid. This was possible due to the low number of potential acquirers for the business.
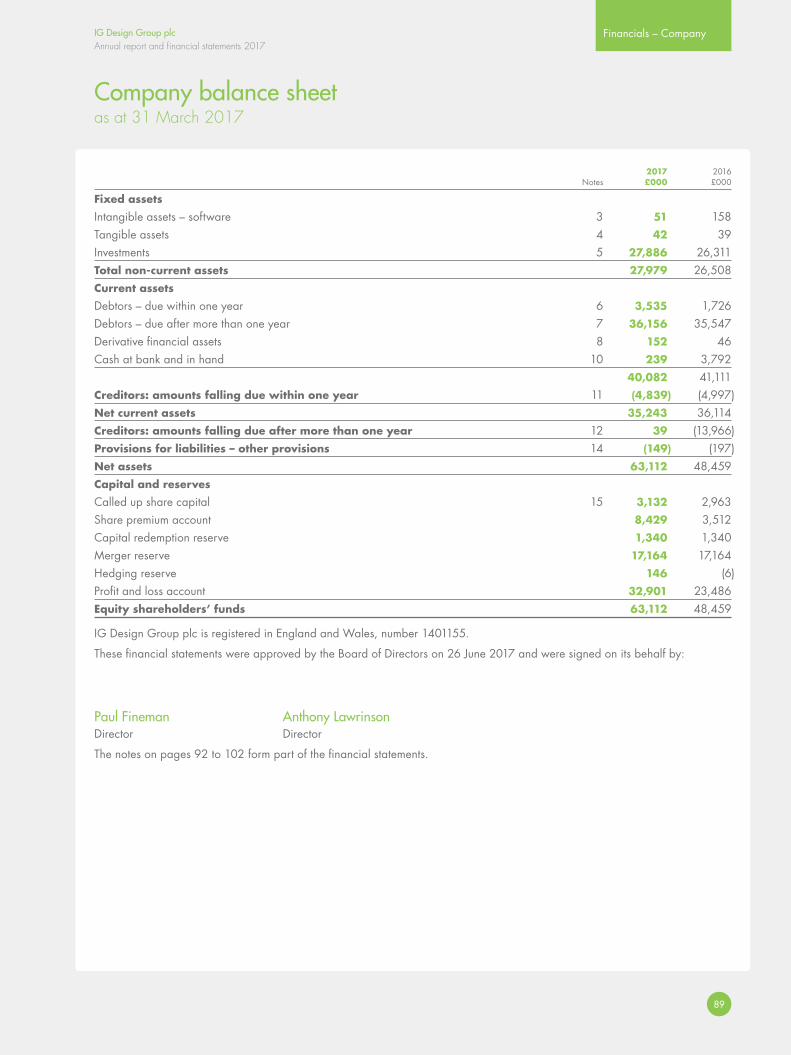
IG Design Group plcAnnual report and financial statements 2017
Financials – Company
89
2017 2016 Notes £000 £000
Fixed assets
Intangible assets – software 3 51 158Tangible assets 4 42 39Investments 5 27,886 26,311Total non-current assets 27,979 26,508Current assets
Debtors – due within one year 6 3,535 1,726Debtors – due after more than one year 7 36,156 35,547Derivative financial assets 8 152 46Cash at bank and in hand 10 239 3,792 40,082 41,111Creditors: amounts falling due within one year 11 (4,839) (4,997)Net current assets 35,243 36,114Creditors: amounts falling due after more than one year 12 39 (13,966)Provisions for liabilities – other provisions 14 (149) (197)Net assets 63,112 48,459Capital and reserves Called up share capital 15 3,132 2,963Share premium account 8,429 3,512Capital redemption reserve 1,340 1,340Merger reserve 17,164 17,164Hedging reserve 146 (6)Profit and loss account 32,901 23,486Equity shareholders’ funds 63,112 48,459
IG Design Group plc is registered in England and Wales, number 1401155.
These financial statements were approved by the Board of Directors on 26 June 2017 and were signed on its behalf by:
Paul Fineman Anthony LawrinsonDirector Director
The notes on pages 92 to 102 form part of the financial statements.
Company balance sheetas at 31 March 2017
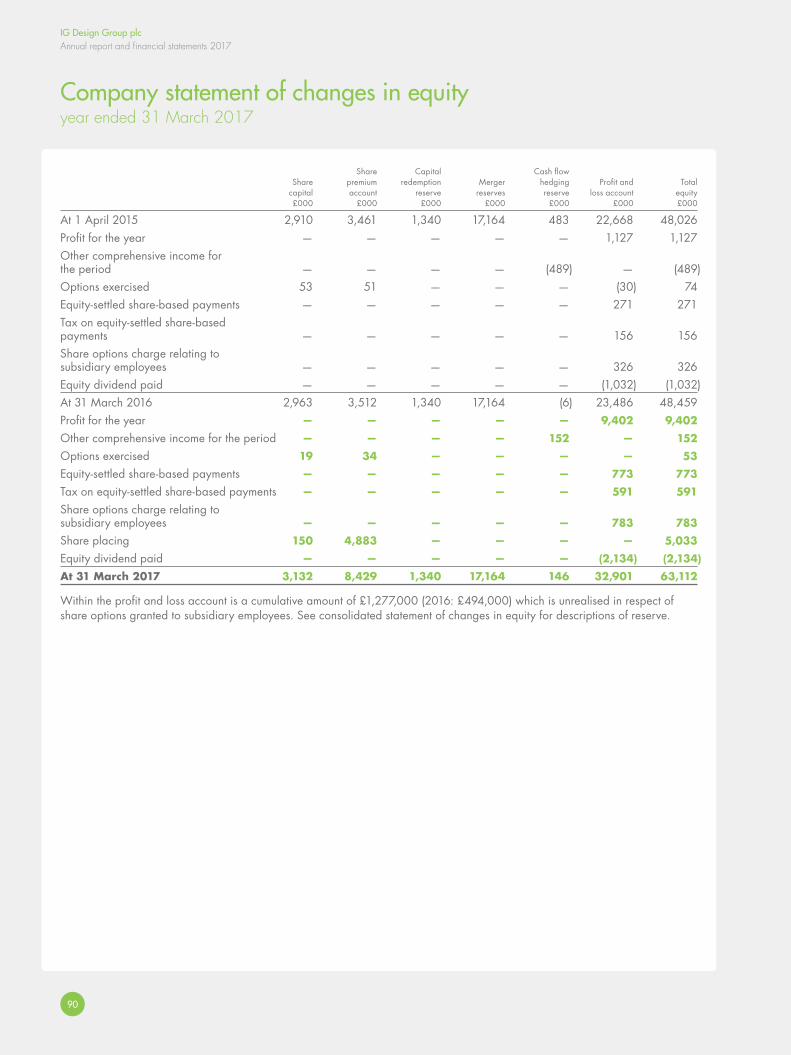
IG Design Group plcAnnual report and financial statements 2017
90
Company statement of changes in equityyear ended 31 March 2017
Share Capital Cash flow Share premium redemption Merger hedging Profit and Total capital account reserve reserves reserve loss account equity £000 £000 £000 £000 £000 £000 £000
At 1 April 2015 2,910 3,461 1,340 17,164 483 22,668 48,026Profit for the year — — — — — 1,127 1,127Other comprehensive income for the period — — — — (489) — (489)Options exercised 53 51 — — — (30) 74Equity-settled share-based payments — — — — — 271 271Tax on equity-settled share-based payments — — — — — 156 156Share options charge relating to subsidiary employees — — — — — 326 326Equity dividend paid — — — — — (1,032) (1,032)At 31 March 2016 2,963 3,512 1,340 17,164 (6) 23,486 48,459Profit for the year — — — — — 9,402 9,402
Other comprehensive income for the period — — — — 152 — 152
Options exercised 19 34 — — — — 53
Equity-settled share-based payments — — — — — 773 773
Tax on equity-settled share-based payments — — — — — 591 591
Share options charge relating to subsidiary employees — — — — — 783 783
Share placing 150 4,883 — — — — 5,033
Equity dividend paid — — — — — (2,134) (2,134)
At 31 March 2017 3,132 8,429 1,340 17,164 146 32,901 63,112
Within the profit and loss account is a cumulative amount of £1,277,000 (2016: £494,000) which is unrealised in respect of share options granted to subsidiary employees. See consolidated statement of changes in equity for descriptions of reserve.
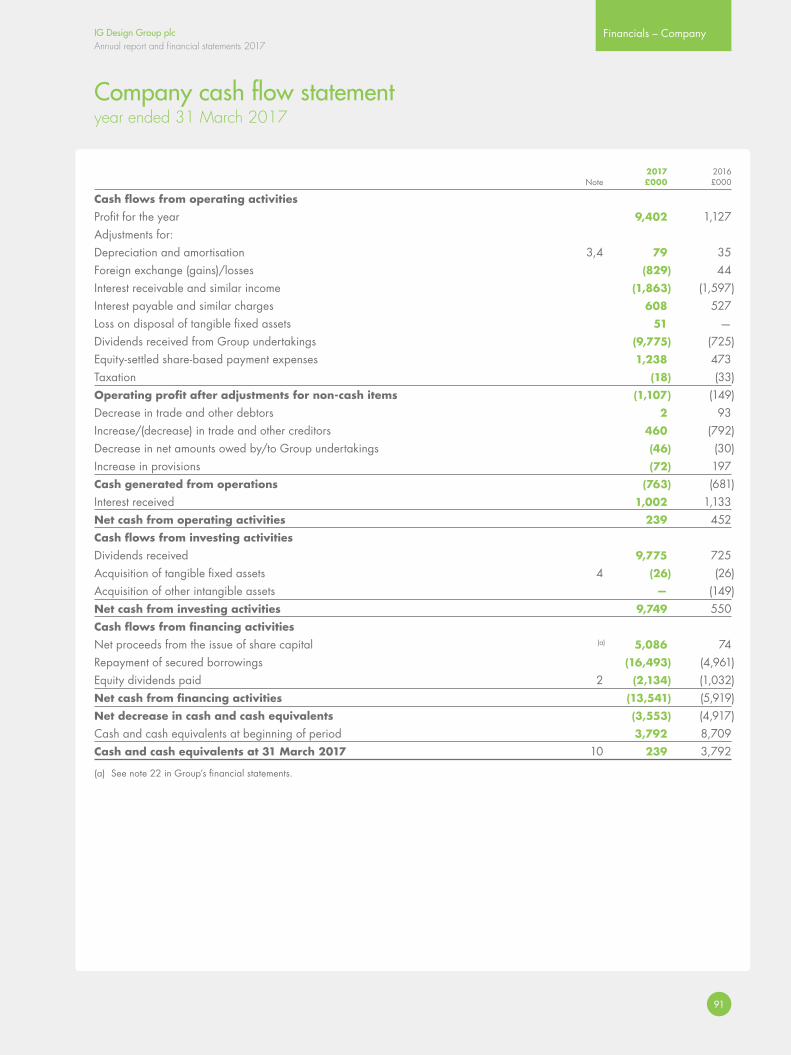
IG Design Group plcAnnual report and financial statements 2017
Financials – Company
91
Company cash flow statementyear ended 31 March 2017
2017 2016 Note £000 £000
Cash flows from operating activities
Profit for the year 9,402 1,127Adjustments for:Depreciation and amortisation 3,4 79 35Foreign exchange (gains)/losses (829) 44Interest receivable and similar income (1,863) (1,597)Interest payable and similar charges 608 527Loss on disposal of tangible fixed assets 51 —Dividends received from Group undertakings (9,775) (725)Equity-settled share-based payment expenses 1,238 473Taxation (18) (33)Operating profit after adjustments for non-cash items (1,107) (149)Decrease in trade and other debtors 2 93Increase/(decrease) in trade and other creditors 460 (792)Decrease in net amounts owed by/to Group undertakings (46) (30)Increase in provisions (72) 197Cash generated from operations (763) (681)Interest received 1,002 1,133Net cash from operating activities 239 452Cash flows from investing activities
Dividends received 9,775 725Acquisition of tangible fixed assets 4 (26) (26)Acquisition of other intangible assets — (149)Net cash from investing activities 9,749 550Cash flows from financing activities Net proceeds from the issue of share capital (a) 5,086 74Repayment of secured borrowings (16,493) (4,961)Equity dividends paid 2 (2,134) (1,032)Net cash from financing activities (13,541) (5,919)Net decrease in cash and cash equivalents (3,553) (4,917)Cash and cash equivalents at beginning of period 3,792 8,709Cash and cash equivalents at 31 March 2017 10 239 3,792
(a) See note 22 in Group’s financial statements.
IG Design Group plcAnnual report and financial statements 2017
92
Notes to the Company financial statementsyear ended 31 March 2017
1 Accounting policies – CompanyBasis of preparationIG Design Group plc (the “Company”) is a company limited by shares and incorporated and domiciled in the UK.
The Company financial statements present the information about the Company as a separate entity and not about the Group.
These financial statements were prepared in accordance with Financial Reporting Standard 102 the Financial Reporting Standard applicable in the UK and Republic of Ireland (“FRS 102”) as issued in August 2014. The amendments to FRS 102 issued in July 2015 have been applied. The presentation currency of these financial statements is sterling. All amounts in the financial statements have been rounded to the nearest £1,000.
The accounting policies set out below have, unless otherwise stated, been applied consistently to all periods presented in these financial statements.
Judgements made by the Directors in the application of these accounting policies that have significant effect on the financial statements and estimates with a significant risk of material adjustment in the next year are discussed in note 20.
Under Section 408 of the Companies Act 2006 the Company is exempt from the requirement to present its own profit and loss account on the grounds that a parent undertaking includes the Company in its own published consolidated financial statements.
Measurement conventionThe financial statements are prepared on the historical cost basis except that the following assets and liabilities are stated at their fair value: derivative financial instruments, financial instruments classified at fair value through the profit and loss account and financial instruments at fair value through the hedging reserve.
Going concernSee note 1 to the Group accounting policies on page 51. Based on the financial performance of the Group, the Directors have a reasonable expectation that the Company has adequate resources to continue its operational existence for the foreseeable future. For this reason they continue to adopt the going concern basis of accounting in preparing the annual financial statements.
Foreign currenciesTransactions in foreign currencies are recorded using the rate of exchange ruling at the date of the transaction. Monetary assets and liabilities denominated in foreign currencies are translated using the rate of exchange ruling at the balance sheet date and the gains or losses on translation are included in the profit and loss account except for differences arising on the retranslation of qualifying cash flow hedges and items which are accounted for at fair value with changes taken to other comprehensive income, which are recognised in other comprehensive income.
Basic financial instrumentsTrade and other debtors/creditorsTrade and other debtors are recognised initially at transaction price less attributable transaction costs. Trade and other debtors are subsequently reviewed for recoverability and impairment with any losses taken to profit and loss immediately. If the arrangement constitutes a financing transaction, for example if payment is deferred beyond normal business terms, then it is measured at the present value of future payments discounted at a market rate of instrument for a similar debt instrument.
Interest‑bearing borrowings classified as basic financial instrumentsInterest-bearing borrowings are recognised initially at the present value of future payments discounted at a market rate of interest, less direct arrangement costs. Subsequent to initial recognition, interest-bearing borrowings are stated at amortised cost using the effective interest method, less any impairment losses.
Investments in subsidiariesThese are the separate financial statements of the Company. Investments in subsidiaries are carried at cost less any provision for impairment.
Cash and cash equivalentsCash and cash equivalents comprise cash balances. Bank overdrafts that are repayable on demand and form an integral part of the Company’s cash management are included as a component of cash and cash equivalents for the purpose of the cash flow statement only.
IG Design Group plcAnnual report and financial statements 2017
Financials – Company
93
Other financial instrumentsFinancial instruments not considered to be basic financial instruments (other financial instruments)Other financial instruments not meeting the definition of basic financial instruments are recognised initially at fair value. Subsequent to initial recognition other financial instruments are measured at fair value with changes recognised in profit or loss except that hedging instruments in a designated hedging relationship shall be recognised as set out below:
Derivative financial instruments and hedgingDerivative financial instruments are recognised at fair value. The gain or loss on remeasurement to fair value is recognised immediately in profit or loss, except where it qualifies for hedge accounting.
Cash flow hedges Where a derivative financial instrument is designated as a hedge of the variability in cash flows of a recognised asset or liability, or a highly probable forecast transaction, the effective part of any gain or loss on the derivative financial instrument is recognised directly in other comprehensive income. Any ineffective portion of the hedge is recognised immediately in profit or loss.
When a hedging instrument expires or is sold, terminated or exercised, or the Company discontinues designation of the hedge relationship but the hedged forecast transaction is still expected to occur, the cumulative gain or loss at that point remains in equity and is recognised in accordance with the above policy when the transaction occurs. If the hedged transaction is no longer expected to take place, the cumulative unrealised gain or loss recognised in equity is recognised in the income statement immediately.
Intangible fixed assets – softwareSoftware is stated at cost less amortisation. Cost is amortised over three years to write off the asset over its useful economic life.
Tangible fixed assets – property, plant and equipment and depreciationTangible fixed assets are stated at cost less accumulated depreciation. Depreciation is provided by the Company to write off the cost less the estimated residual value of tangible property, plant and equipment by equal instalments over their estimated useful economic lives as follows:
• fixtures and fittings – three to five years.
ProvisionsA provision is recognised in the balance sheet when the Company has a present legal or constructive obligation as a result of a past event, that can be reliably measured and it is probable that an outflow of economic benefits will be required to settle the obligation. Provisions are recognised at the best estimate of the amount required to settle the obligation at the reporting date.
Where the Company enters into financial guarantee contracts to guarantee the indebtedness of other companies within the Group, the Company treats the guarantee contract as a contingent liability until such time as it becomes probable that the Company will be required to make a payment under the guarantee.
LeasesWhere the Company enters into a lease which entails taking substantially all the risks and rewards of ownership of an asset, the lease is treated as a ‘finance lease’. The asset is recorded in the balance sheet as a tangible fixed asset and is depreciated over its estimated useful life or the term of the lease, whichever is shorter. Future instalments under such leases, net of finance charges, are included within creditors. Rentals payable are apportioned between the finance element, which is charged to the profit and loss account on a straight-line basis over the life of the lease, and the capital element which reduces the outstanding obligation for future instalments.
All other leases are accounted for as ‘operating leases’ and the rentals payable are charged to the profit and loss account on a straight-line basis over the life of the lease.
Share‑based paymentsThe cost of equity-settled transactions with employees is measured by reference to the fair value of the option at the date on which they are granted and is recognised as an expense over the vesting period, which ends on the date on which the relevant employees become fully entitled to the award. Fair value is determined by using an appropriate pricing model. In valuing equity-settled transactions, no account is taken of any service and performance (vesting conditions), other than performance conditions linked to the price of the shares of the Company (market conditions). Any other conditions which are required to be met in order for an employee to become fully entitled to an award are considered to be non-vesting conditions. Like market performance conditions, non-vesting conditions are taken into account in determining the grant date fair value.
IG Design Group plcAnnual report and financial statements 2017
94
Notes to the Company financial statements continuedyear ended 31 March 2017
1 Accounting policies – Company continuedShare‑based payments continuedNo expense is recognised for awards that do not ultimately vest, except for awards where vesting is conditional upon a market vesting condition or a non-vesting condition, which are treated as vesting irrespective of whether or not the market vesting condition or non-vesting condition is satisfied, provided that all other non-market vesting conditions are satisfied.
At each balance sheet date before vesting, the cumulative expense is calculated, representing the extent to which the vesting period has expired and management’s best estimate of the achievement or otherwise of non-market vesting conditions and of the number of equity instruments that will ultimately vest or, in the case of an instrument subject to a market condition or a non-vesting condition, be treated as vesting as described above. The movement in cumulative expense since the previous balance sheet date is recognised in the income statement, with a corresponding entry in equity.
Where the Company grants options over its own shares to the employees of its subsidiaries, it recognises an increase in the cost of investment in its subsidiaries equivalent to the equity-settled share-based payment charge recognised in its subsidiaries’ financial statements with the corresponding credit being recognised directly in equity. Amounts recharged to the subsidiary are recognised as a reduction in the cost of investment in subsidiary. If the amount recharged exceeds the increase in the cost of investment, the excess is recognised as a dividend to the extent that it reflects post-acquisition profits of the subsidiary.
Dividends on shares presented within shareholders’ fundsDividends unpaid at the balance sheet date are only recognised as a liability at that date to the extent that they are appropriately authorised and are no longer at the discretion of the Company. Unpaid dividends that do not meet these criteria are disclosed in the notes to the financial statements.
TaxationTax on the profit or loss for the year comprises current and deferred tax. Tax is recognised in the profit and loss account except to the extent that it relates to items recognised directly in equity or other comprehensive income, in which case it is recognised directly in equity or other comprehensive income accordingly.
Current tax is the expected tax payable or receivable on the taxable income or loss for the year, using tax rates enacted or substantively enacted at the balance sheet date, and any adjustment to tax payable in respect of previous years.
Deferred tax is provided on timing differences which arise from the inclusion of income and expenses in tax assessments in periods different from those in which they are recognised in the financial statements. The following timing differences are not provided for differences between accumulated depreciation and tax allowances for the cost of a fixed asset and differences relating to investments in subsidiaries, to the extent that it is not probable that they will reverse in the foreseeable future and the reporting entity is able to control the reversal of the timing difference. Deferred tax is not recognised on permanent differences arising because certain types of income or expense are non-taxable or are disallowable for tax or because certain tax charges or allowances are greater or smaller than the corresponding income or expense.
Deferred tax is provided in respect of the additional tax that will be paid or avoided on differences between the amount at which an asset (other than goodwill) or liability is recognised in a business combination and the corresponding amount that can be deducted or assessed for tax. Goodwill is adjusted by the amount of such deferred tax.
Deferred tax is measured at the tax rate that is expected to apply to the reversal of the related difference, using tax rates enacted or substantively enacted at the balance sheet date. Deferred tax balances are not discounted.
Unrelieved tax losses and other deferred tax assets are recognised only to the extent that is it probable that they will be recovered against the reversal of deferred tax liabilities or other future taxable profits.
Employee benefitsPensionsThe Company operates a defined contribution personal pension scheme. The assets of this scheme are held separately from those of the Company in an independently administered fund. The pension charge represents contributions payable by the Company to the fund.
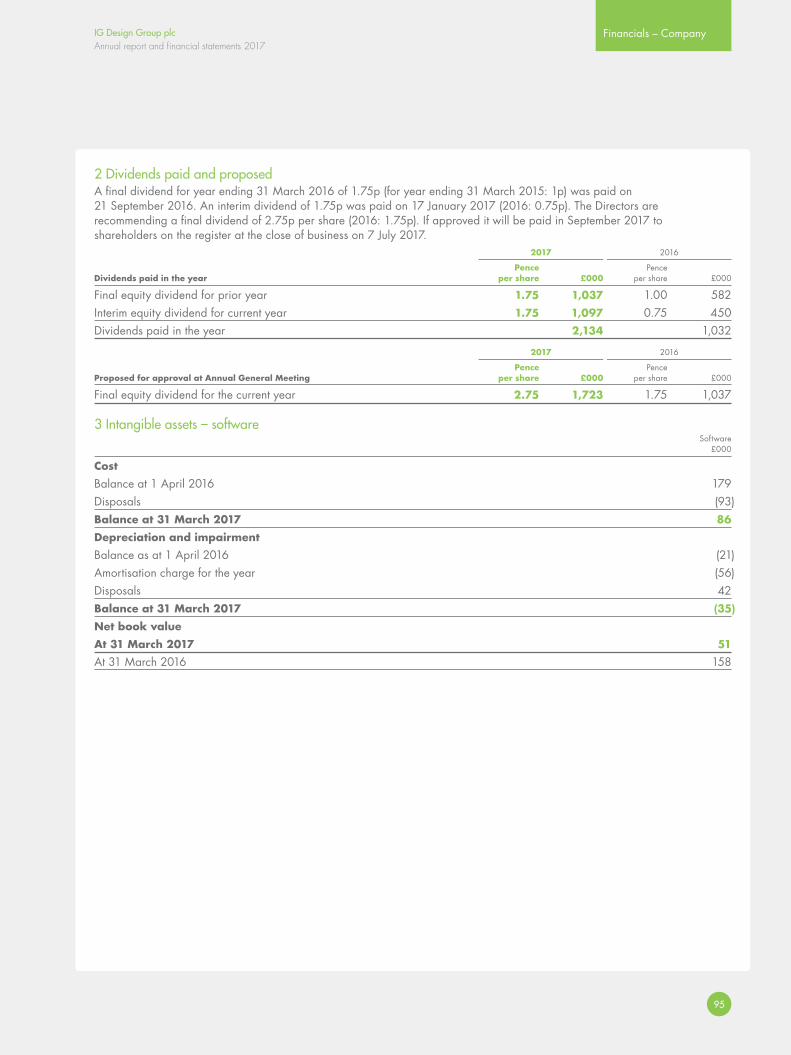
IG Design Group plcAnnual report and financial statements 2017
Financials – Company
95
2 Dividends paid and proposedA final dividend for year ending 31 March 2016 of 1.75p (for year ending 31 March 2015: 1p) was paid on 21 September 2016. An interim dividend of 1.75p was paid on 17 January 2017 (2016: 0.75p). The Directors are recommending a final dividend of 2.75p per share (2016: 1.75p). If approved it will be paid in September 2017 to shareholders on the register at the close of business on 7 July 2017. 2017 2016 Pence Pence Dividends paid in the year per share £000 per share £000
Final equity dividend for prior year 1.75 1,037 1.00 582Interim equity dividend for current year 1.75 1,097 0.75 450Dividends paid in the year 2,134 1,032
2017 2016 Pence Pence Proposed for approval at Annual General Meeting per share £000 per share £000
Final equity dividend for the current year 2.75 1,723 1.75 1,037
3 Intangible assets – software Software £000
Cost
Balance at 1 April 2016 179Disposals (93)Balance at 31 March 2017 86
Depreciation and impairment
Balance as at 1 April 2016 (21)Amortisation charge for the year (56)Disposals 42Balance at 31 March 2017 (35)
Net book value At 31 March 2017 51
At 31 March 2016 158
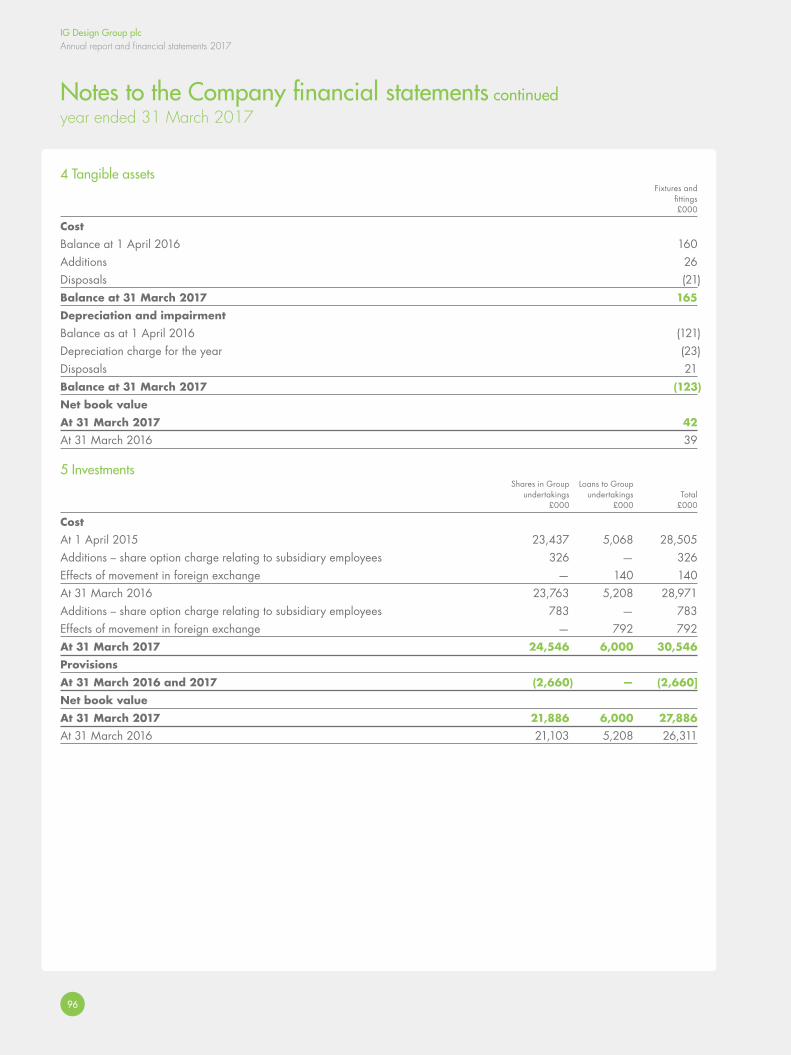
IG Design Group plcAnnual report and financial statements 2017
96
Notes to the Company financial statements continuedyear ended 31 March 2017
4 Tangible assets Fixtures and fittings £000
Cost
Balance at 1 April 2016 160Additions 26Disposals (21)Balance at 31 March 2017 165
Depreciation and impairment
Balance as at 1 April 2016 (121)Depreciation charge for the year (23)Disposals 21Balance at 31 March 2017 (123)
Net book value
At 31 March 2017 42
At 31 March 2016 39
5 Investments Shares in Group Loans to Group undertakings undertakings Total £000 £000 £000
Cost
At 1 April 2015 23,437 5,068 28,505Additions – share option charge relating to subsidiary employees 326 — 326Effects of movement in foreign exchange — 140 140At 31 March 2016 23,763 5,208 28,971Additions – share option charge relating to subsidiary employees 783 — 783Effects of movement in foreign exchange — 792 792At 31 March 2017 24,546 6,000 30,546
Provisions At 31 March 2016 and 2017 (2,660) — (2,660]
Net book value
At 31 March 2017 21,886 6,000 27,886
At 31 March 2016 21,103 5,208 26,311
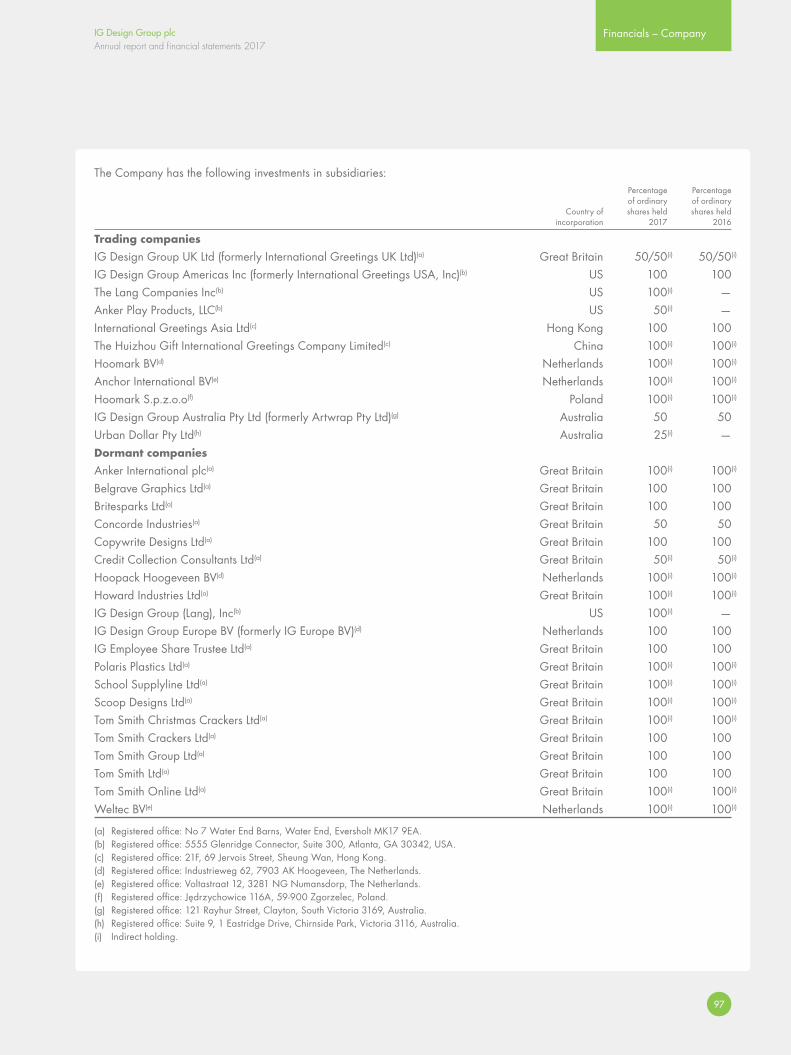
IG Design Group plcAnnual report and financial statements 2017
Financials – Company
97
The Company has the following investments in subsidiaries: Percentage Percentage of ordinary of ordinary Country of shares held shares held incorporation 2017 2016
Trading companies
IG Design Group UK Ltd (formerly International Greetings UK Ltd)(a) Great Britain 50/50(i) 50/50(i)
IG Design Group Americas Inc (formerly International Greetings USA, Inc)(b) US 100 100The Lang Companies Inc(b) US 100(i) —Anker Play Products, LLC(b) US 50(i) —International Greetings Asia Ltd(c) Hong Kong 100 100The Huizhou Gift International Greetings Company Limited(c) China 100(i) 100(i)
Hoomark BV(d) Netherlands 100(i) 100(i)
Anchor International BV(e) Netherlands 100(i) 100(i)
Hoomark S.p.z.o.o(f) Poland 100(i) 100(i)
IG Design Group Australia Pty Ltd (formerly Artwrap Pty Ltd)(g) Australia 50 50Urban Dollar Pty Ltd(h) Australia 25(i) —Dormant companies
Anker International plc(a) Great Britain 100(i) 100(i)
Belgrave Graphics Ltd(a) Great Britain 100 100Britesparks Ltd(a) Great Britain 100 100Concorde Industries(a) Great Britain 50 50Copywrite Designs Ltd(a) Great Britain 100 100Credit Collection Consultants Ltd(a) Great Britain 50(i) 50(i)
Hoopack Hoogeveen BV(d) Netherlands 100(i) 100(i)
Howard Industries Ltd(a) Great Britain 100(i) 100(i)
IG Design Group (Lang), Inc(b) US 100(i) —IG Design Group Europe BV (formerly IG Europe BV)(d) Netherlands 100 100IG Employee Share Trustee Ltd(a) Great Britain 100 100Polaris Plastics Ltd(a) Great Britain 100(i) 100(i)
School Supplyline Ltd(a) Great Britain 100(i) 100(i)
Scoop Designs Ltd(a) Great Britain 100(i) 100(i)
Tom Smith Christmas Crackers Ltd(a) Great Britain 100(i) 100(i)
Tom Smith Crackers Ltd(a) Great Britain 100 100Tom Smith Group Ltd(a) Great Britain 100 100Tom Smith Ltd(a) Great Britain 100 100Tom Smith Online Ltd(a) Great Britain 100(i) 100(i)
Weltec BV(e) Netherlands 100(i) 100(i)
(a) Registered office: No 7 Water End Barns, Water End, Eversholt MK17 9EA.(b) Registered office: 5555 Glenridge Connector, Suite 300, Atlanta, GA 30342, USA.(c) Registered office: 21F, 69 Jervois Street, Sheung Wan, Hong Kong.(d) Registered office: Industrieweg 62, 7903 AK Hoogeveen, The Netherlands.(e) Registered office: Voltastraat 12, 3281 NG Numansdorp, The Netherlands.(f) Registeredoffice:Jędrzychowice116A,59-900Zgorzelec,Poland.(g) Registered office: 121 Rayhur Street, Clayton, South Victoria 3169, Australia.(h) Registered office: Suite 9, 1 Eastridge Drive, Chirnside Park, Victoria 3116, Australia.(i) Indirect holding.
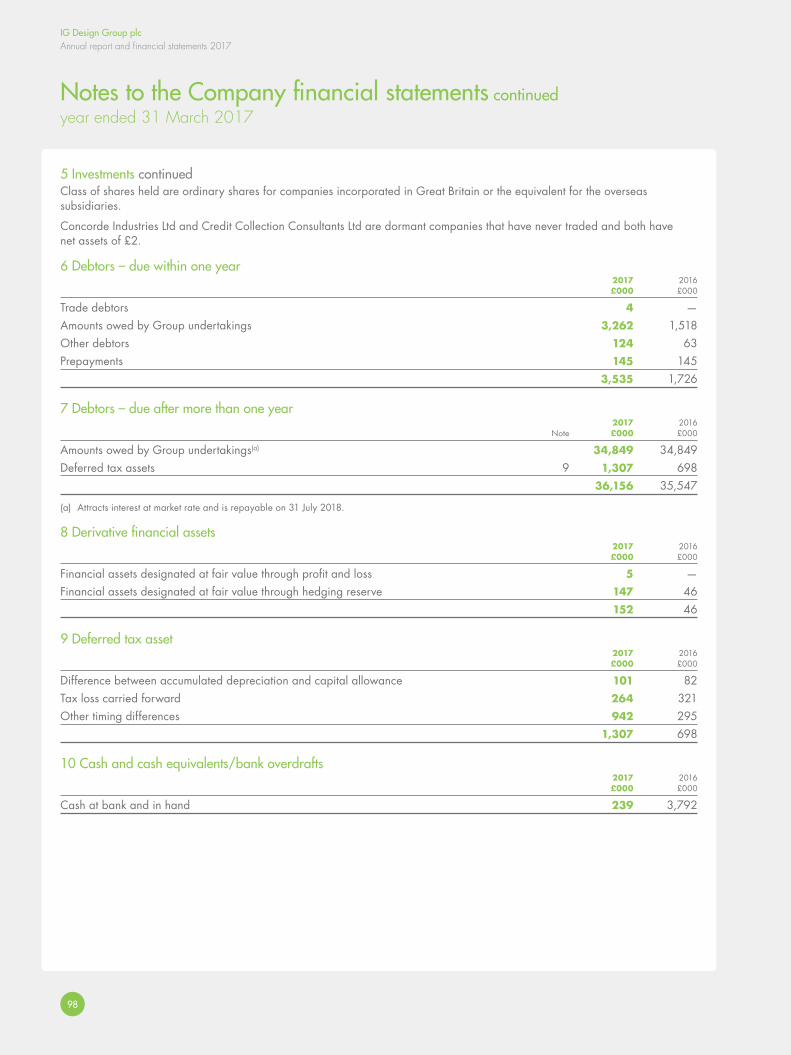
IG Design Group plcAnnual report and financial statements 2017
98
Notes to the Company financial statements continuedyear ended 31 March 2017
5 Investments continuedClass of shares held are ordinary shares for companies incorporated in Great Britain or the equivalent for the overseas subsidiaries.
Concorde Industries Ltd and Credit Collection Consultants Ltd are dormant companies that have never traded and both have net assets of £2.
6 Debtors – due within one year 2017 2016 £000 £000
Trade debtors 4 —Amounts owed by Group undertakings 3,262 1,518Other debtors 124 63Prepayments 145 145 3,535 1,726
7 Debtors – due after more than one year 2017 2016 Note £000 £000
Amounts owed by Group undertakings(a) 34,849 34,849Deferred tax assets 9 1,307 698 36,156 35,547
(a) Attracts interest at market rate and is repayable on 31 July 2018.
8 Derivative financial assets 2017 2016 £000 £000
Financial assets designated at fair value through profit and loss 5 —Financial assets designated at fair value through hedging reserve 147 46 152 46
9 Deferred tax asset 2017 2016 £000 £000
Difference between accumulated depreciation and capital allowance 101 82Tax loss carried forward 264 321Other timing differences 942 295 1,307 698
10 Cash and cash equivalents/bank overdrafts 2017 2016 £000 £000
Cash at bank and in hand 239 3,792
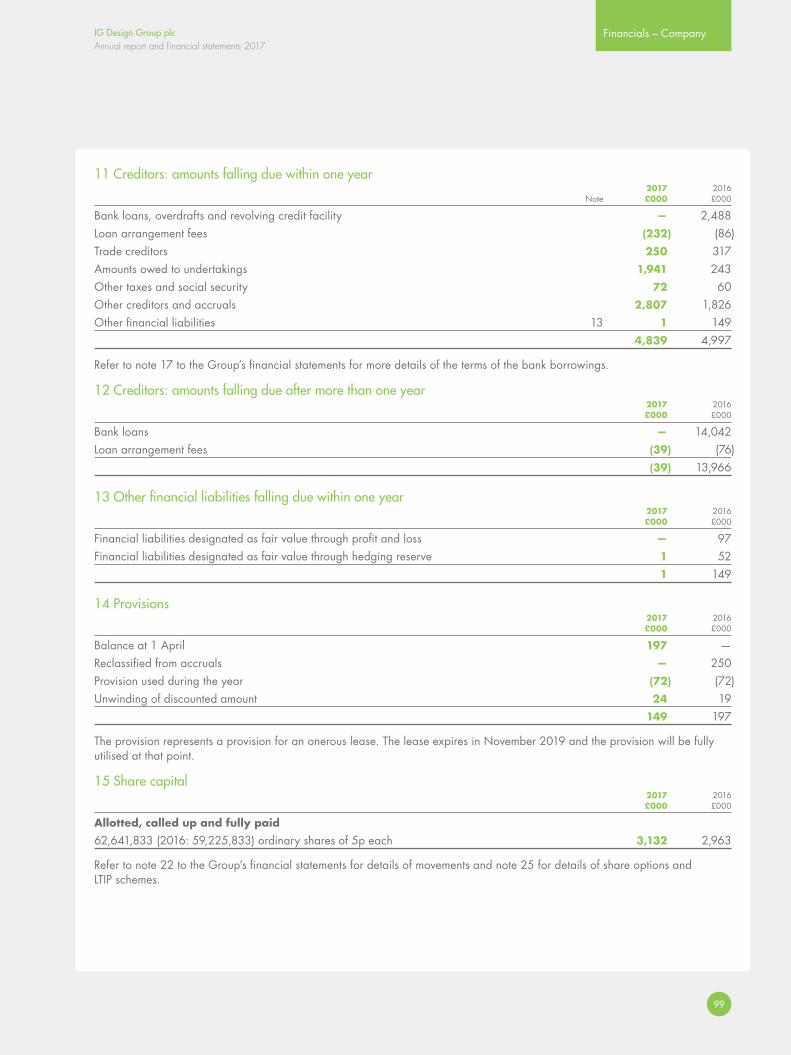
IG Design Group plcAnnual report and financial statements 2017
Financials – Company
99
11 Creditors: amounts falling due within one year 2017 2016 Note £000 £000
Bank loans, overdrafts and revolving credit facility — 2,488Loan arrangement fees (232) (86)Trade creditors 250 317Amounts owed to undertakings 1,941 243Other taxes and social security 72 60Other creditors and accruals 2,807 1,826Other financial liabilities 13 1 149 4,839 4,997
Refer to note 17 to the Group’s financial statements for more details of the terms of the bank borrowings.
12 Creditors: amounts falling due after more than one year 2017 2016 £000 £000
Bank loans — 14,042Loan arrangement fees (39) (76) (39) 13,966
13 Other financial liabilities falling due within one year 2017 2016 £000 £000
Financial liabilities designated as fair value through profit and loss — 97Financial liabilities designated as fair value through hedging reserve 1 52 1 149
14 Provisions 2017 2016 £000 £000
Balance at 1 April 197 —Reclassified from accruals — 250Provision used during the year (72) (72)Unwinding of discounted amount 24 19 149 197
The provision represents a provision for an onerous lease. The lease expires in November 2019 and the provision will be fully utilised at that point.
15 Share capital 2017 2016 £000 £000
Allotted, called up and fully paid 62,641,833 (2016: 59,225,833) ordinary shares of 5p each 3,132 2,963
Refer to note 22 to the Group’s financial statements for details of movements and note 25 for details of share options and LTIP schemes.
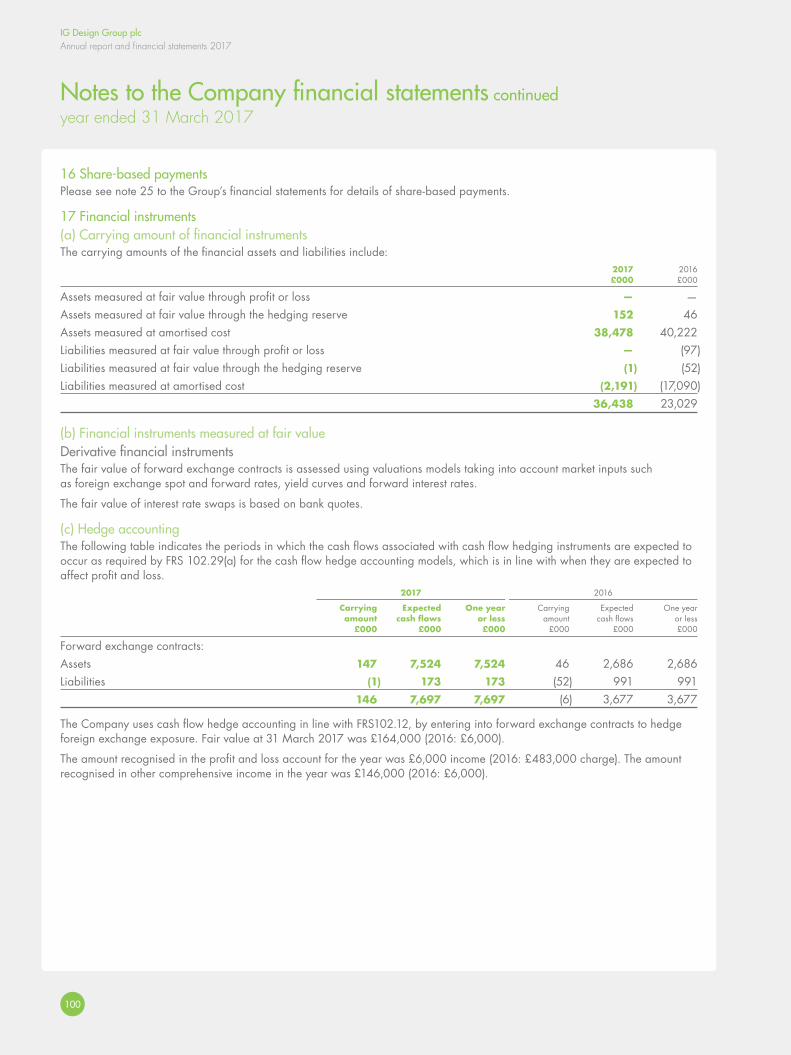
IG Design Group plcAnnual report and financial statements 2017
100
Notes to the Company financial statements continuedyear ended 31 March 2017
16 Share‑based paymentsPlease see note 25 to the Group’s financial statements for details of share-based payments.
17 Financial instruments(a) Carrying amount of financial instrumentsThe carrying amounts of the financial assets and liabilities include: 2017 2016 £000 £000
Assets measured at fair value through profit or loss — —Assets measured at fair value through the hedging reserve 152 46Assets measured at amortised cost 38,478 40,222Liabilities measured at fair value through profit or loss — (97)Liabilities measured at fair value through the hedging reserve (1) (52)Liabilities measured at amortised cost (2,191) (17,090) 36,438 23,029
(b) Financial instruments measured at fair valueDerivative financial instrumentsThe fair value of forward exchange contracts is assessed using valuations models taking into account market inputs such as foreign exchange spot and forward rates, yield curves and forward interest rates.
The fair value of interest rate swaps is based on bank quotes.
(c) Hedge accountingThe following table indicates the periods in which the cash flows associated with cash flow hedging instruments are expected to occur as required by FRS 102.29(a) for the cash flow hedge accounting models, which is in line with when they are expected to affect profit and loss. 2017 2016 Carrying Expected One year Carrying Expected One year amount cash flows or less amount cash flows or less £000 £000 £000 £000 £000 £000
Forward exchange contracts:Assets 147 7,524 7,524 46 2,686 2,686Liabilities (1) 173 173 (52) 991 991 146 7,697 7,697 (6) 3,677 3,677
The Company uses cash flow hedge accounting in line with FRS102.12, by entering into forward exchange contracts to hedge foreign exchange exposure. Fair value at 31 March 2017 was £164,000 (2016: £6,000).
The amount recognised in the profit and loss account for the year was £6,000 income (2016: £483,000 charge). The amount recognised in other comprehensive income in the year was £146,000 (2016: £6,000).
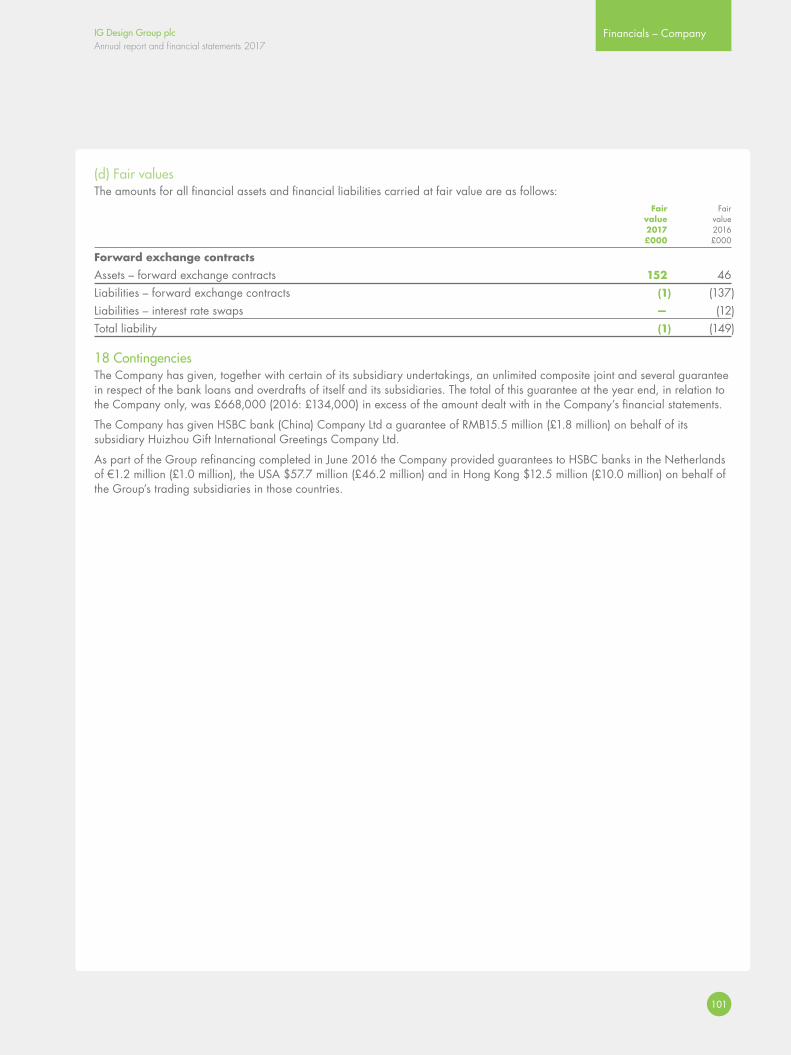
IG Design Group plcAnnual report and financial statements 2017
Financials – Company
101
(d) Fair valuesThe amounts for all financial assets and financial liabilities carried at fair value are as follows: Fair Fair value value 2017 2016 £000 £000
Forward exchange contracts
Assets – forward exchange contracts 152 46Liabilities – forward exchange contracts (1) (137)Liabilities – interest rate swaps — (12)Total liability (1) (149)
18 ContingenciesThe Company has given, together with certain of its subsidiary undertakings, an unlimited composite joint and several guarantee in respect of the bank loans and overdrafts of itself and its subsidiaries. The total of this guarantee at the year end, in relation to the Company only, was £668,000 (2016: £134,000) in excess of the amount dealt with in the Company’s financial statements.
The Company has given HSBC bank (China) Company Ltd a guarantee of RMB15.5 million (£1.8 million) on behalf of its subsidiary Huizhou Gift International Greetings Company Ltd.
As part of the Group refinancing completed in June 2016 the Company provided guarantees to HSBC banks in the Netherlands of €1.2 million (£1.0 million), the USA $57.7 million (£46.2 million) and in Hong Kong $12.5 million (£10.0 million) on behalf of the Group’s trading subsidiaries in those countries.
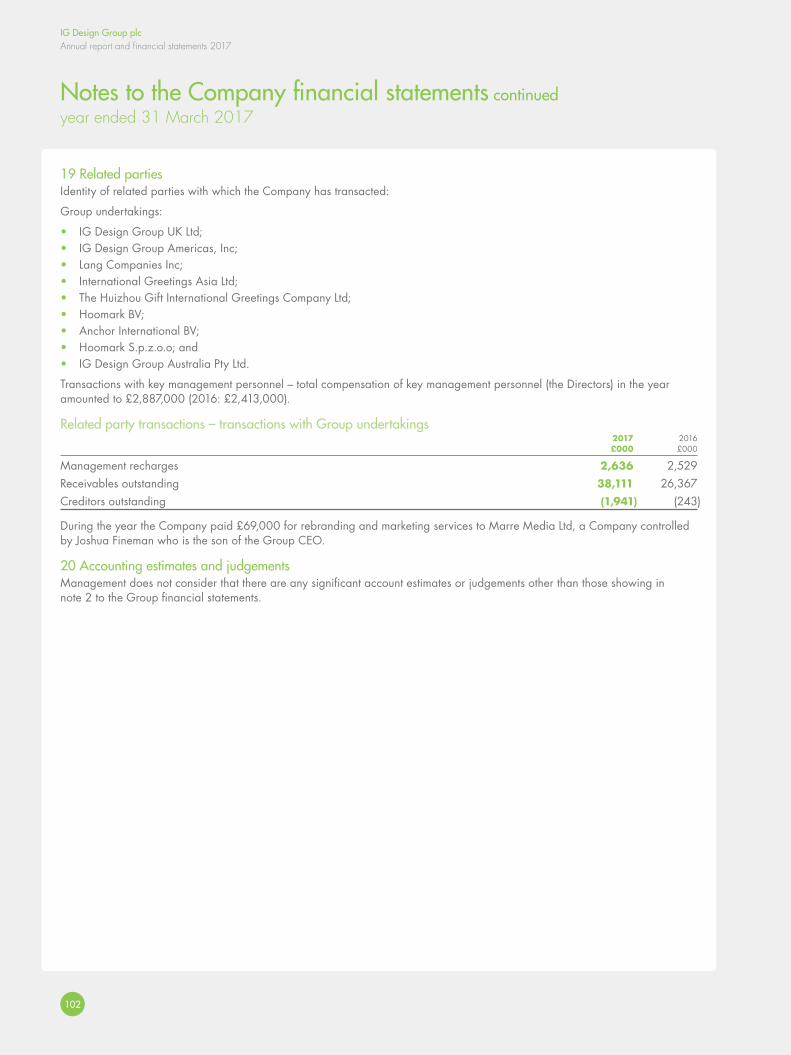
IG Design Group plcAnnual report and financial statements 2017
102
Notes to the Company financial statements continuedyear ended 31 March 2017
19 Related partiesIdentity of related parties with which the Company has transacted:
Group undertakings:
• IG Design Group UK Ltd;• IG Design Group Americas, Inc;• Lang Companies Inc;• International Greetings Asia Ltd;• The Huizhou Gift International Greetings Company Ltd;• Hoomark BV;• Anchor International BV;• Hoomark S.p.z.o.o; and• IG Design Group Australia Pty Ltd.
Transactions with key management personnel – total compensation of key management personnel (the Directors) in the year amounted to £2,887,000 (2016: £2,413,000).
Related party transactions – transactions with Group undertakings 2017 2016 £000 £000
Management recharges 2,636 2,529Receivables outstanding 38,111 26,367Creditors outstanding (1,941) (243)
During the year the Company paid £69,000 for rebranding and marketing services to Marre Media Ltd, a Company controlled by Joshua Fineman who is the son of the Group CEO.
20 Accounting estimates and judgementsManagement does not consider that there are any significant account estimates or judgements other than those showing in note 2 to the Group financial statements.
IG Design Group plcAnnual report and financial statements 2017
Additional information
103
Advisers
IG Design Group plc is registered in England and Wales, number 1401155
Registered office No 7, Water End Barns Water End Eversholt MK17 9EA
Financial and nominated adviser and brokerCenkos Securities Plc 6, 7, 8, Tokenhouse Yard London EC2R 7AS
AuditorKPMG LLPAltius House One North Fourth Street Milton Keynes MK9 1NE
Financial PRRedleaf Communications First Floor 4 London Wall Buildings Blomfield Street London EC2M 5NT
Share registrarCapita Asset Services The Registry 34 Beckenham Road Beckenham BR3 4TU
Tel UK: 0871 664 0300 (calls cost 12p per minute plus network extras. Lines are open from 9.00am to 5.30pm Monday to Friday.)
Tel overseas: +44 (0)20 8639 3399
Email: [email protected]
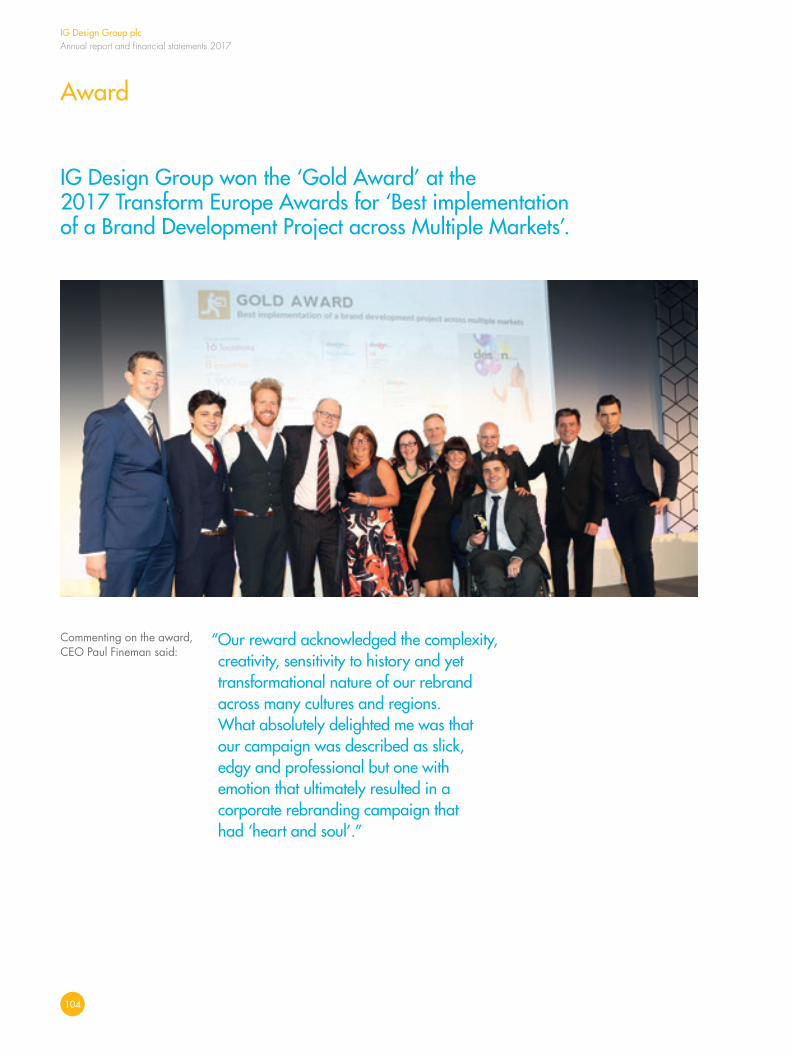
IG Design Group plcAnnual report and financial statements 2017
104
Award
Commenting on the award, CEO Paul Fineman said:
IG Design Group won the ‘Gold Award’ at the 2017 Transform Europe Awards for ‘Best implementation of a Brand Development Project across Multiple Markets’.
“ Our reward acknowledged the complexity, creativity, sensitivity to history and yet transformational nature of our rebrand across many cultures and regions. What absolutely delighted me was that our campaign was described as slick, edgy and professional but one with emotion that ultimately resulted in a corporate rebranding campaign that had ‘heart and soul’.”
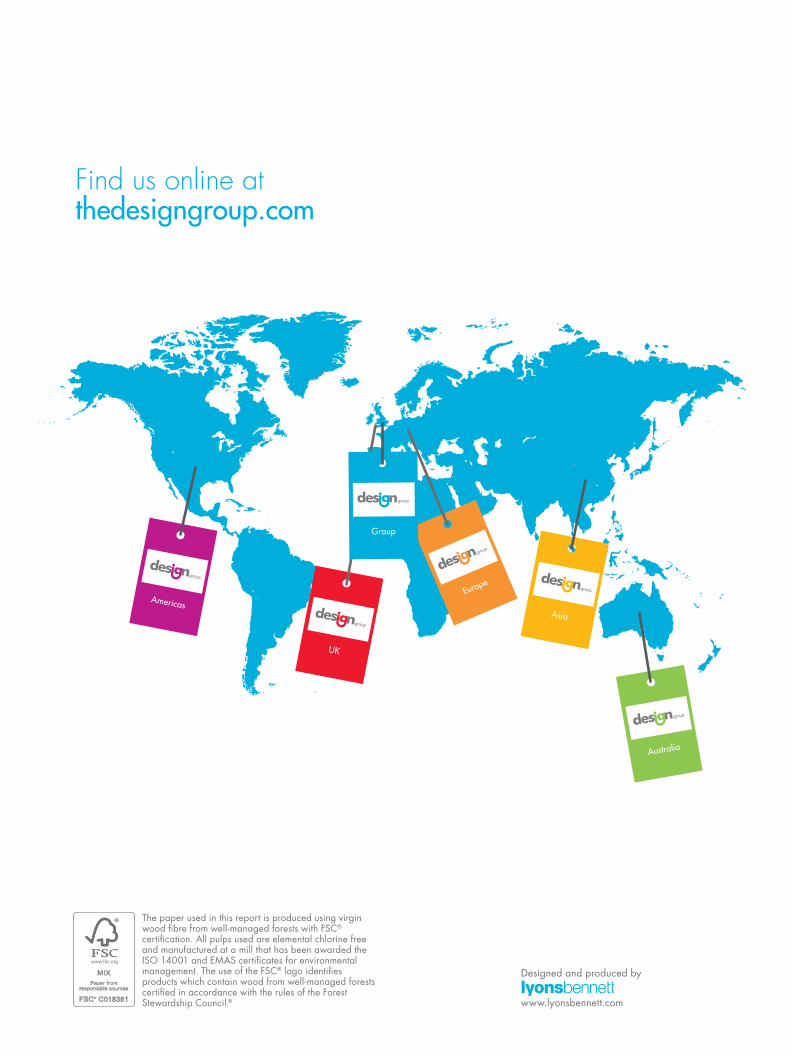
Find us online at thedesigngroup.com
UK
Australia
Asia
AmericasEurope
Group
Designed and produced by
www.lyonsbennett.com
The paper used in this report is produced using virgin wood fibre from well‑managed forests with FSC® certification. All pulps used are elemental chlorine free and manufactured at a mill that has been awarded the ISO 14001 and EMAS certificates for environmental management. The use of the FSC® logo identifies products which contain wood from well‑managed forests certified in accordance with the rules of the Forest Stewardship Council.®

IG D
ESIGN
GRO
UP PLC
AN
NUA
L REPORT A
ND
FINA
NCIA
L STATEM
ENTS 2017
IG Design Group plcNo 7 Water End Barns
Water EndEversholt MK17 9EA
T +44 (0)1525 887 310
thedesigngroup.com